Water Use Conflict and Coordination between Agricultural and Wetlands—A Case Study of Yanqi Basin

College of Earth and Environmental Sciences, Lanzhou University, 222 TianshuiNan Road, Lanzhou 730000, China
*
Author to whom correspondence should be addressed.
†
These authors contributed equally to this work and should be considered co-first authors.
Water 2020, 12(11), 3225; https://0-doi-org.brum.beds.ac.uk/10.3390/w12113225
Submission received: 26 October 2020
/
Revised: 13 November 2020
/
Accepted: 14 November 2020
/
Published: 18 November 2020
(This article belongs to the Special Issue Sustainable Development of Lakes and Reservoirs)
Abstract
:Increased groundwater extraction leads to the decrease of the extent of wetlands due to the implementation of a water-saving transformation project in an arid irrigation area. The application of integrated mitigation tools and strategies in China have increasing significance. In this study, an integrated approach (SWAT-MODFLOW) was followed; it is based on a soil and water assessment tool (SWAT) coupled with a modular three-dimensional finite difference groundwater model (MODFLOW). Recharge and evaporation values were estimated by SWAT and were then used to simulate groundwater in a MODFLOW model. Calibration (over the years 2000–2010) and validation (over the years 2010–2016) were performed, based on observed groundwater-level data; results showed that the combined SWAT-MODFLOW provides more accurate simulation and prediction of the dynamic changes of surface water and groundwater in irrigation areas than results from individual MODFLOW models. This method was applied to the Yanqi Basin, which is one of the most appropriate arid agricultural basins for modeling lake wetland and groundwater in China. The correlation coefficients (R2) between the simulated and real groundwater level are 0.96 and 0.91 in SWAT-MODFLOW and MODFLOW, respectively. With the gradual increase in the extraction to 248%, 0.62 × 10⁸ m3 of groundwater discharged into the lake became −2.25 × 10⁸ m3. The lake level drops 1.3 m compared with the current year, when the groundwater exploitation increases by 10 × 108 m3/year. Overall, the results of the coupling model offer scientific evidence for agricultural water management and lake recovery, so as to enhance the water use coordination.
1. Introduction
With a population increase and rapid social and economic growth, the excessive extraction of water from aquifers has exacerbated the lack of coordination between water supply and demand, especially in arid/semi-arid countries such as China [1]. The Yanqi Basin in the arid area of Northwest China has important socioeconomic significance, both in terms of agricultural production and as a drinking water source. Knowing the roles of groundwater systems improves one’s ability to manage wetland ecosystems, based on a conceptual hydrological framework [2]. However, so far research in China on the hydrologic component has focused on the independent groundwater system or surface water system.
Wetland ecosystems play an important and irreplaceable role in protecting water resources, and local and global water cycling is overwhelmingly dependent on wetlands. Since 1900, over half the world’s natural lake wetlands have been degraded due to human activities, which have caused significant negative impacts on the surrounding hydrology at multiple levels [3,4].
Due to the increase in demand for agricultural and industrial water, the changes in the management of a specific water use will affect the supply and use of another, especially in semi-arid areas where the groundwater that should have naturally entered the wetlands is greatly reduced [5]. What is the impact on the extension of wetlands in the basin as the groundwater level continues to decrease? Currently, water scarcity, driven by factors such as land cover change, anthropogenic activities and climate change, have become increasingly important limiting factors on groundwater growing and availability and wetland conservation, which will further increase the water resources competition between wetlands and groundwater. This competition has attracted the attention of society, government and experts. Therefore, more effective methods should be taken to protect water resources as soon as possible to keep the significant ecosystem functions of wetlands. However, the lack of understanding about groundwater behavior and availability of resources obstructs the enactment of suitable groundwater management plans. Simulation of groundwater-surface and surface water behavior using mathematical models can promote understanding of aquifer cases and resource availability [6,7,8].
Groundwater, as the main irrigation source, is becoming more and more prominent in irrigation agricultural activities, and the feedback effect of irrigation agricultural activities on groundwater level changes is becoming more and more significant. Therefore, studying the influence mechanism and degree of impact of irrigation agricultural activities on groundwater can provide decision support for making proper irrigation and water saving measures and alleviating water crises.
The hydrological model applied in previous studies (e.g., [9,10,11]) did not make sufficient connections between groundwater and surface water analysis. This is because these models usually consider surface water and groundwater as separate parts of the hydrological system, because of the complexity of the water cycle itself and the different modes of occurrence and states of motion. With the increasing exploitation of land and water resources, the development of these resources will clearly affect the availability and quality of these two systems. This inherent analysis defect was first recognized in the late 1960s. On the other hand, Reshmidevi and Nagesh [12] found that since SWAT has its own groundwater composition module, the ArcSWAT deep aquifer composition was insufficient to represent the groundwater over-depletion scenario when attempting to simulate the watershed groundwater scenario. Surficial processes including land–atmosphere interactions, infiltration, surface runoff, and the impact of management measures on agricultural systems etc. cannot be simulated by MODFLOW [13]. These considerations are not included in the estimation of groundwater recharge rates. Nevertheless, the accuracy of recharge rate data input is one of the most basic components of an effective groundwater model. Altogether, it is difficult to compute the distributed recharge of groundwater in the MODFLOW model, and the SWAT model does not represent distribution parameters such as distributed hydraulic conductivity [14].
In recent years, comprehensive modeling tools have been explored, such as SWATMOD [6], IGSM [15], MODHMS [16] and MIKE-SHE [17] etc., which have taken into consideration surface water (wetlands, lakes and streams) and groundwater (unsaturated and saturated groundwater). Although these coupling and integration models are fully functional in theory, they are not currently practical in reality. They are mainly affected by many problems, such as data conditions, simulation calculation, fusion of different hydrological scales, multi-parameter rate determination, model uncertainty and so on, which makes their reliability and simulation accuracy difficult to guarantee. More conflicts and puzzles will inevitably occur, unless robust modeling tools are employed and a comprehensive water-resources management strategy is implemented. Especially in arid plain areas where groundwater has a strong influence on watersheds, it is essential to use physics-based distributed hydrological models and groundwater numerical models to quantify water availability and to determine appropriate integrated water resources management policies.
In this study, the coupling between surface water and groundwater in the study area mainly required three steps: (1) A long time scale surface water runoff model in the study region was constructed based on SWAT2012 software. (2) A groundwater flow model was constructed based on the MODFLOW module of the GMS software. (3) The ARCGIS platform was used to transmit surface water and groundwater data. The integrated model not only considers the hydrological process and the interaction between surface water and groundwater, but also takes into account the management options for transferring water of various areas in a semi-arid and strictly managed agricultural urban basin [18].
2. Materials and Methods
2.1. Study Area and Wetland Characteristics
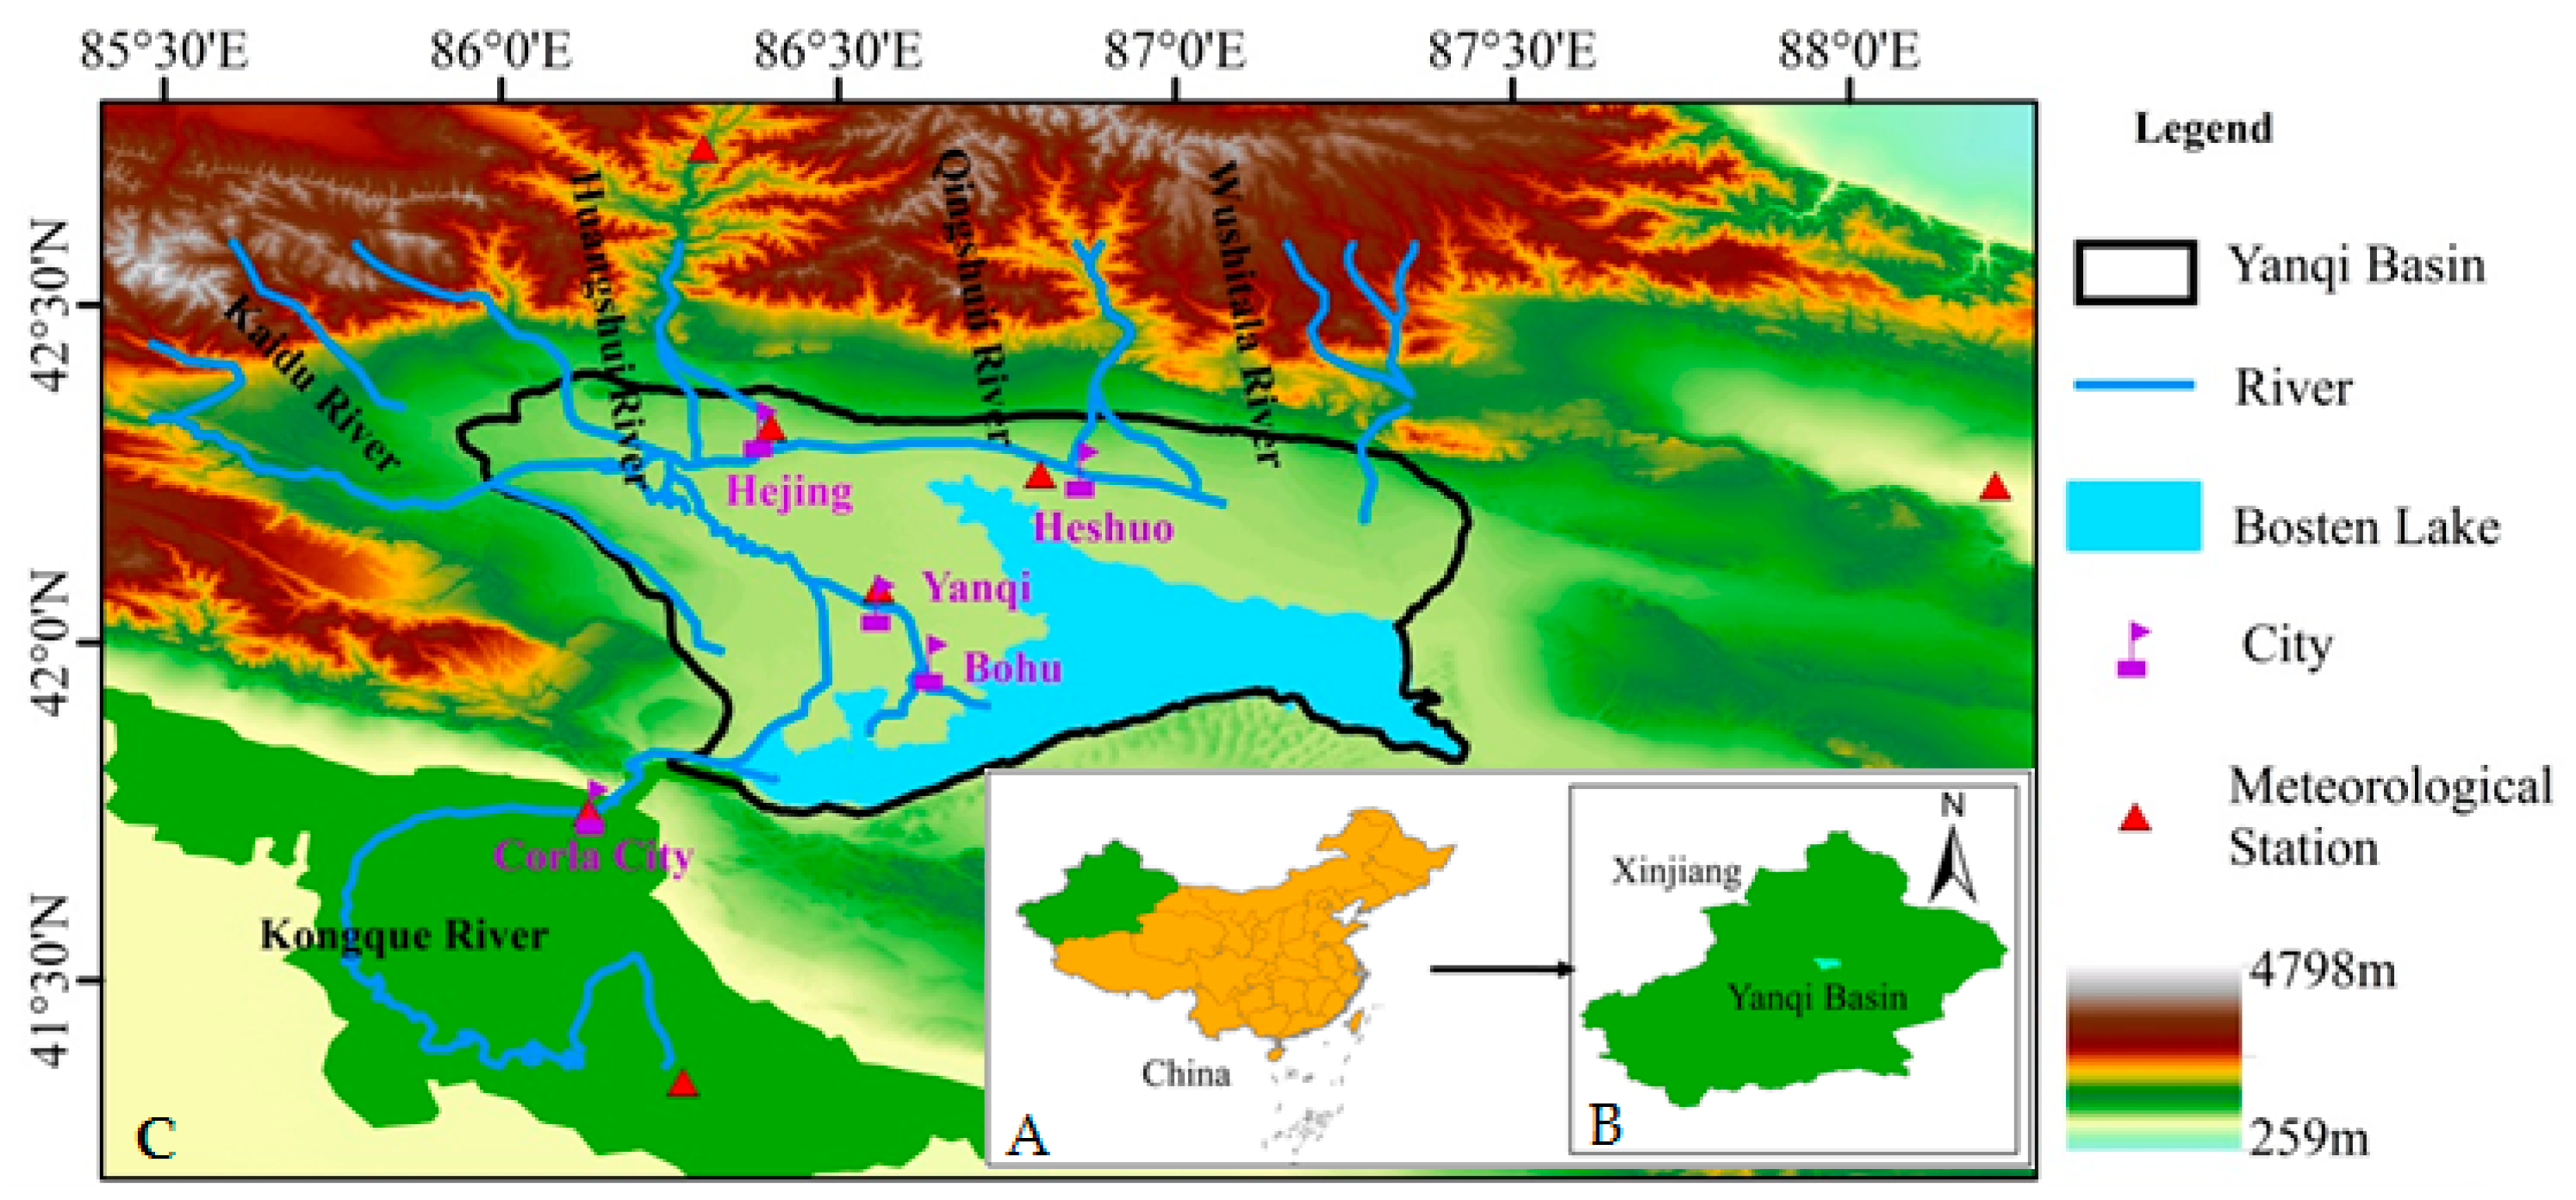
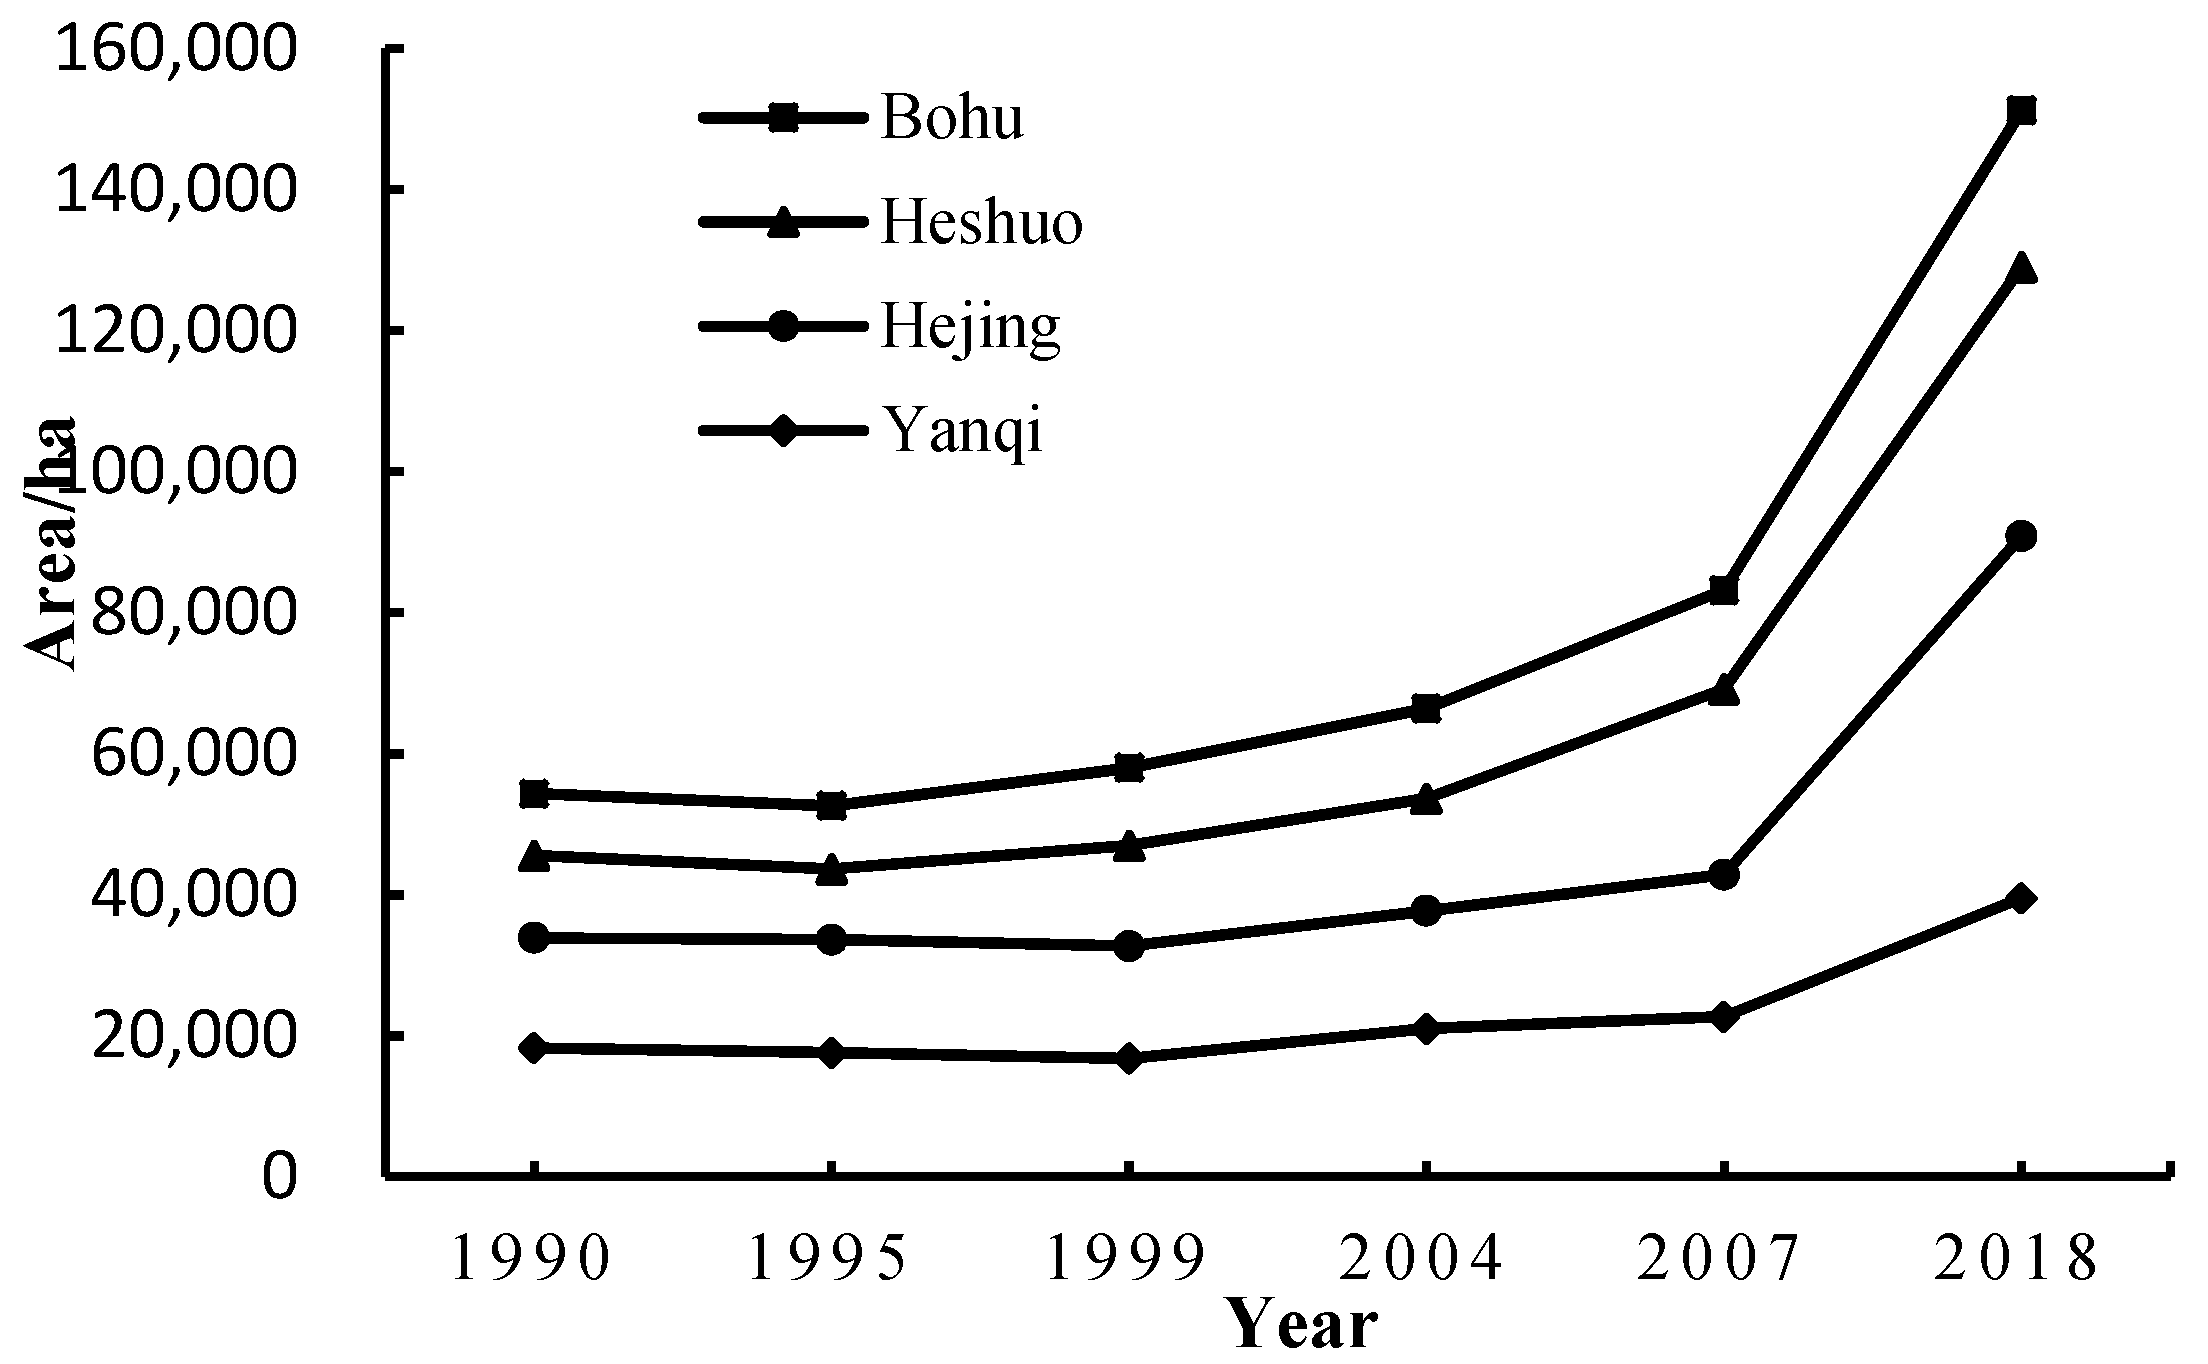
The Yanqi Basin (Figure 1), covers 1.32 × 10⁶ ha, is one of the main agricultural active areas of the Xinjiang, and agriculture is the main consumer of groundwater. The basin’s altitude ranges from 1050 to 1200 m, its mean annual precipitation is around 50.7–79.9 mm, relative humidity is 50%–60%, and potential evaporation is approximately 2000–2500 mm. Bosten Lake is the tail of the Kaidu River and the headstreams of the Kongque River [19]; it is China’s largest inland freshwater lake and is located in the southeast of the Yanqi Basin [20]. The Kaidu River is not only the largest river in the study area, but it is also the most important source of surface water recharge in the arid plain irrigation area. The Huangshuigou River is the second largest river flowing into the lake in the Yanqi Basin. Unfortunately, wetlands are increasingly threatened by the water consumption of the entire basin, driven by the Chinese government’s integrated development patterns of agricultural technicalization, urbanization and new industrialization [21]. Especially since the 1970s, water usage for irrigation and the cultivated land area in the basin have increased by more than 3.8-fold and 10 times, respectively [22] (Figure 2). This led to a serious increase in secondary salinization of the soil and a vicious circle of agricultural ecosystems within the basin. Bosten Lake waters and its surrounding reed wetlands have been gradually shrinking, due to the combined effects of climate change and anthropogenic activities. The utilization of surface water resources in the area has exceeded its limit due to the large amount of surface water irrigation. To relieve pressure from demand for surface water, the irrigated agriculture in the basin has shifted from conventional irrigation to high-efficiency water-saving irrigation since 2000. The groundwater level in the basin decreased by 0.15 m when the area of conventional irrigation area increased by 1 × 10⁴ ha, the groundwater level decreased by 0.25 m when the area of high efficiency water saving irrigation area increased by 1 × 10⁴ ha [19]. Groundwater, as the main irrigation water source in Yanqi Basin, is in a state of over- extraction with an extraction quantity of 5 × 10⁸ m3–6 × 10⁸ m3. 85.08% of its extraction quantity is used for agricultural irrigation, with low water use efficiency. The Bosten Lake level descended from its highest level of 1049.39 m in 2002 to 1045.06 m in 2013, approaching its lowest control water level of 1045 m. In addition, the area of the lakes shrank from 1.23 × 10⁵ ha to 0.91 × 10⁵ ha [23].
The Yanqi Basin is a complete groundwater system, generally presenting the topographic forms sloping around the basin. Under the influence of neotectonic differential fault block activity, the basement fault block of the basin has subsided, and the peripheral mountain fault block is rising continuously, especially in the northwest and northern regions, forming a high mountain area. Quaternary sediments cover the majority of the study region and river sediments are relatively developed, including sediments found at the Kaidu River, Qingshui River and the Huangshuigou River, etc. The basin accepts the leakage recharge of the mountain rivers and the underflow recharge of the river bed all year round. The discharges are phreatic water evaporation, artificial extractions, drains (irrigation canals) and rivers and wetlands.
2.2. Overview of Hydrologic Setting
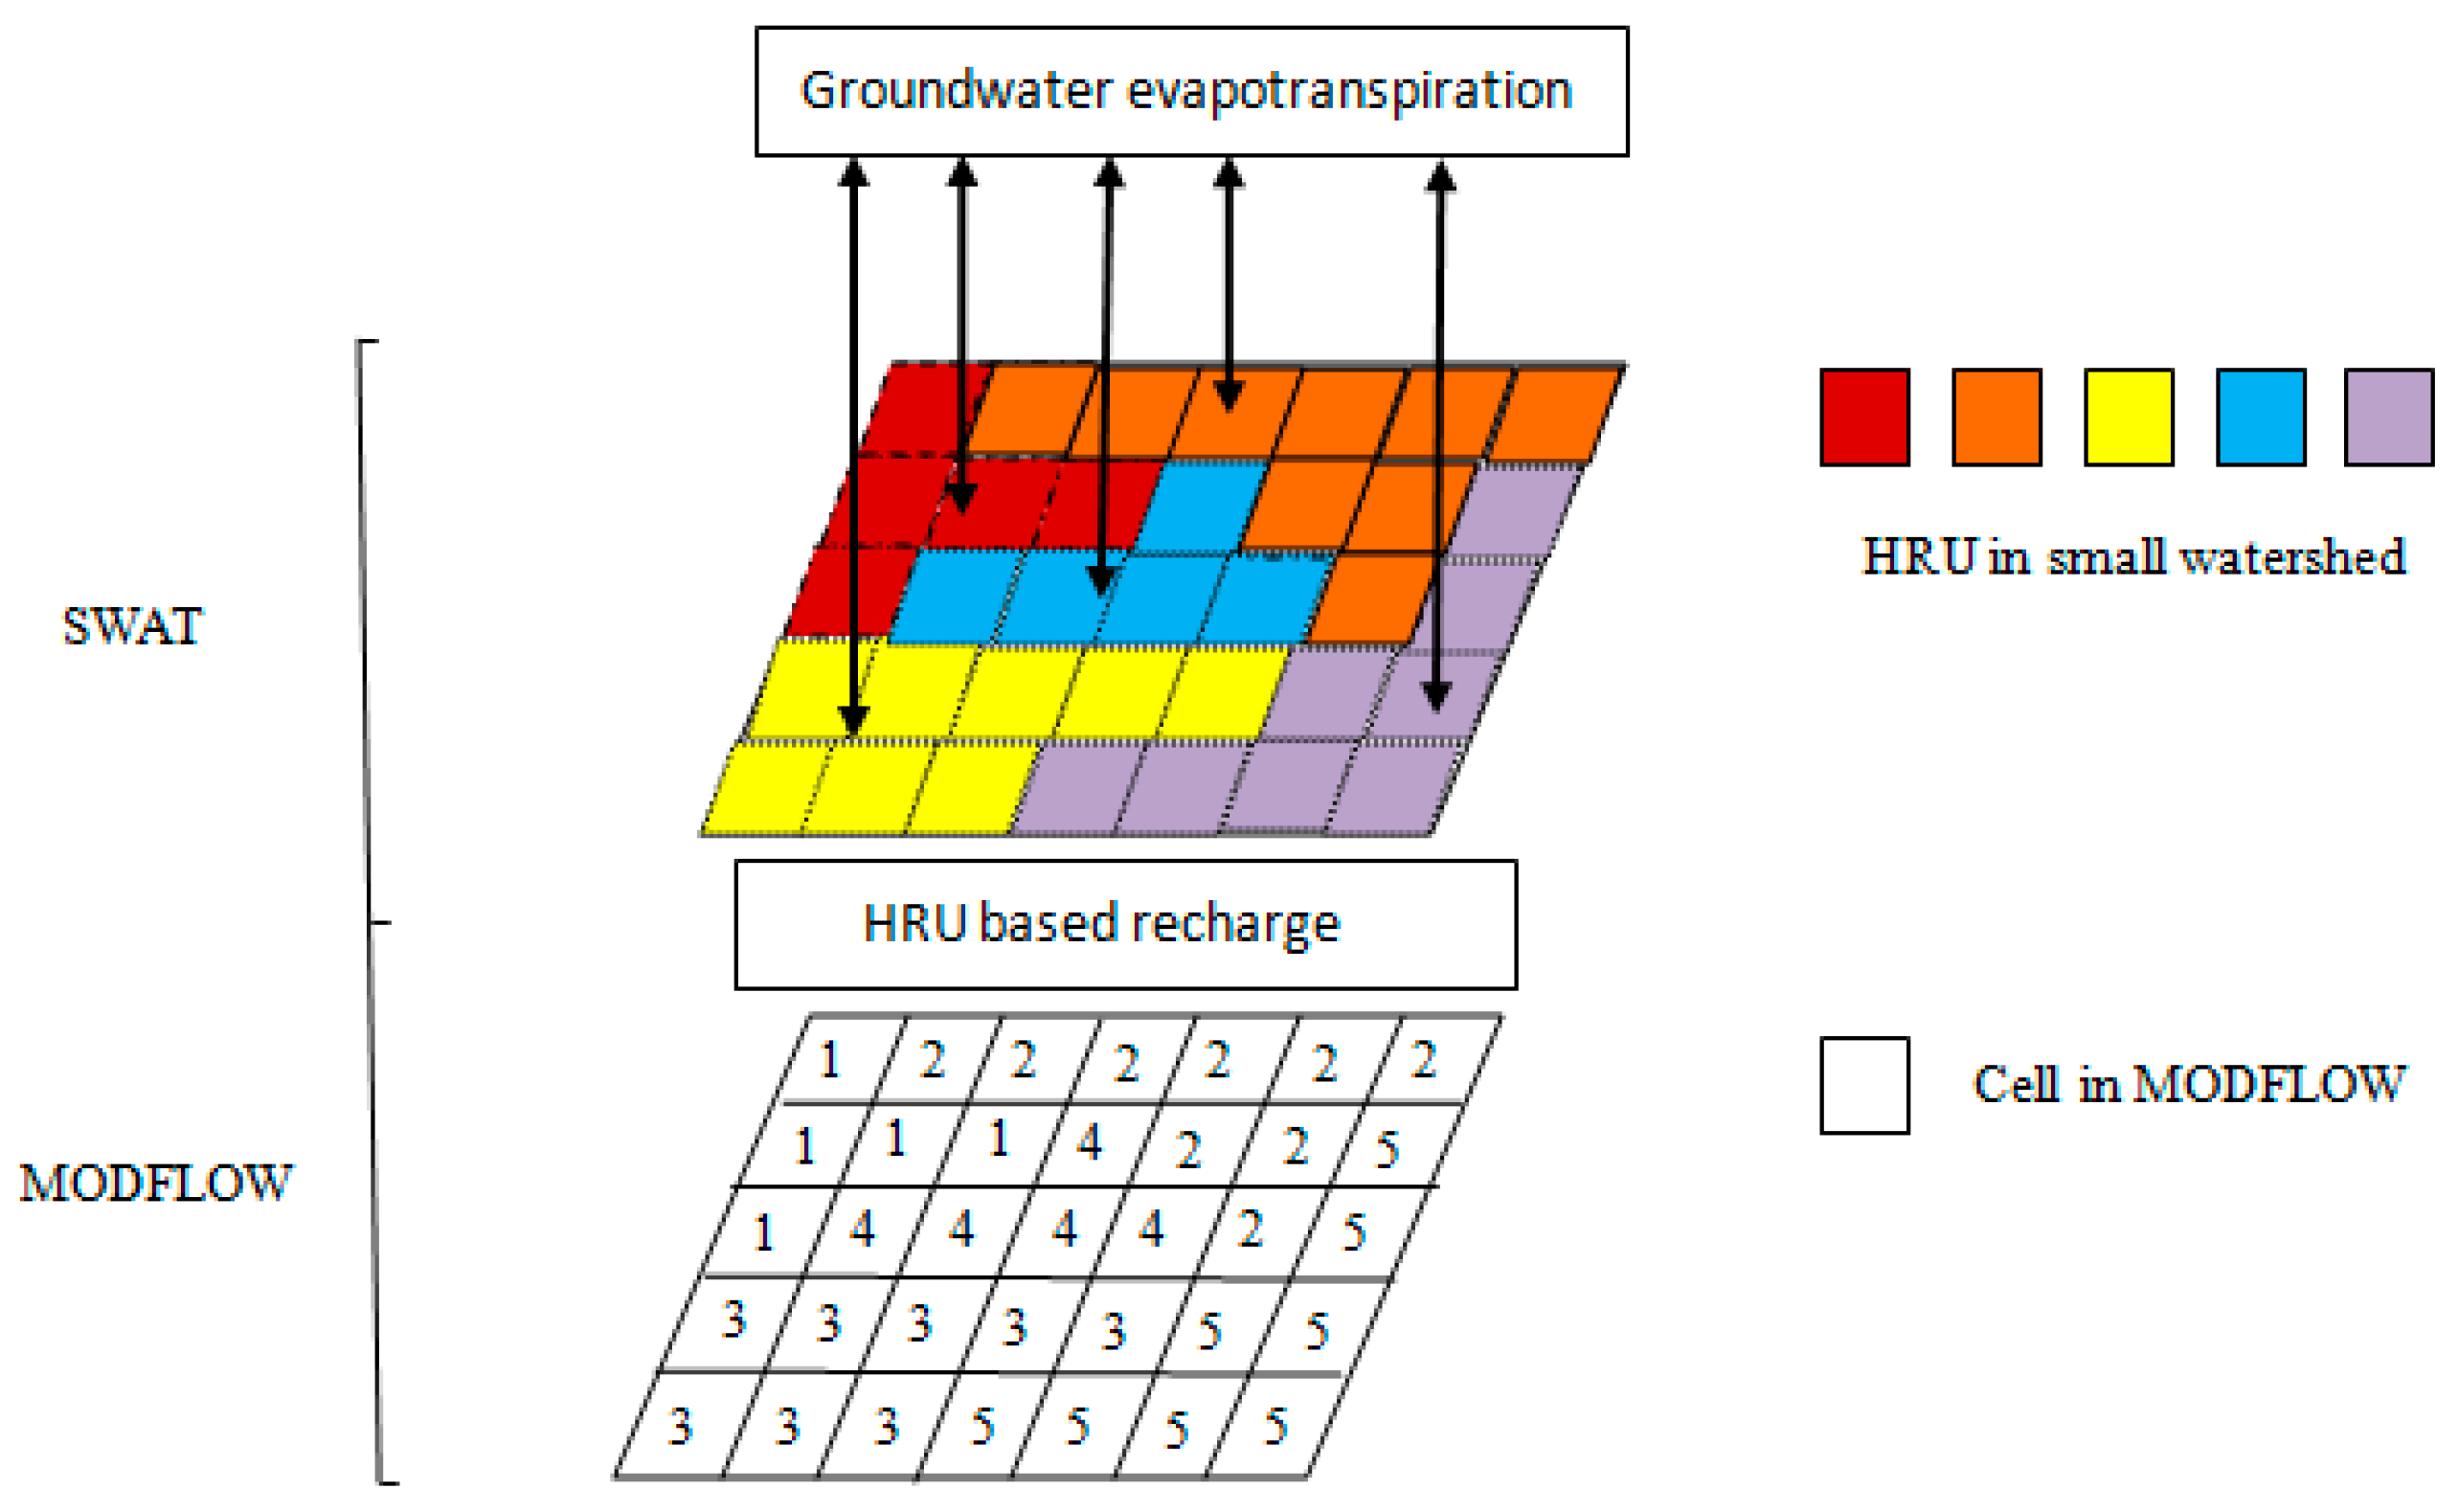
The most appropriate method to simulate surface water, groundwater and their interactions is through a simulation model. Especially in arid and semi-arid areas, recharge has a vital function in groundwater-surface water simulation, especially in arid and semi-arid areas [24,25,26,27]. The impact of groundwater extraction from aquifers cannot be properly assessed, nor can long-term behavior of aquifers under various management scenarios be reliably estimated unless accurate recharge rates are provided [28]. The impact of groundwater extraction from aquifers cannot be reliably evaluated, nor can long-term behavior of aquifers under every management scenarios be becomingly estimated unless accurate recharge rates are provided. However, Lerner et al. [29] believed that determination of groundwater recharge is neither simple nor easy in arid/semi-arid areas. Therefore, there is great uncertainty in the simulation results of groundwater flow [30]. To achieve integrated surface–subsurface hydrologic modeling, the SWAT-MODFLOW coupling model is used in this paper, to alleviate this defect. The fundamental process of connecting the SWAT and MODFLOW models is to transfer hydrological response unit (HRU)-calculated deep infiltration to the MODFLOW grid cells as recharge, and the groundwater evapotranspiration counted by SWAT were introduced into EVT modules of MODFLOW. This method was applied to one of China’s most appropriate agricultural basins for surface water and groundwater simulation—the Yanqi Basin.
2.3. SWAT-MODFLOW Model Structure and Development
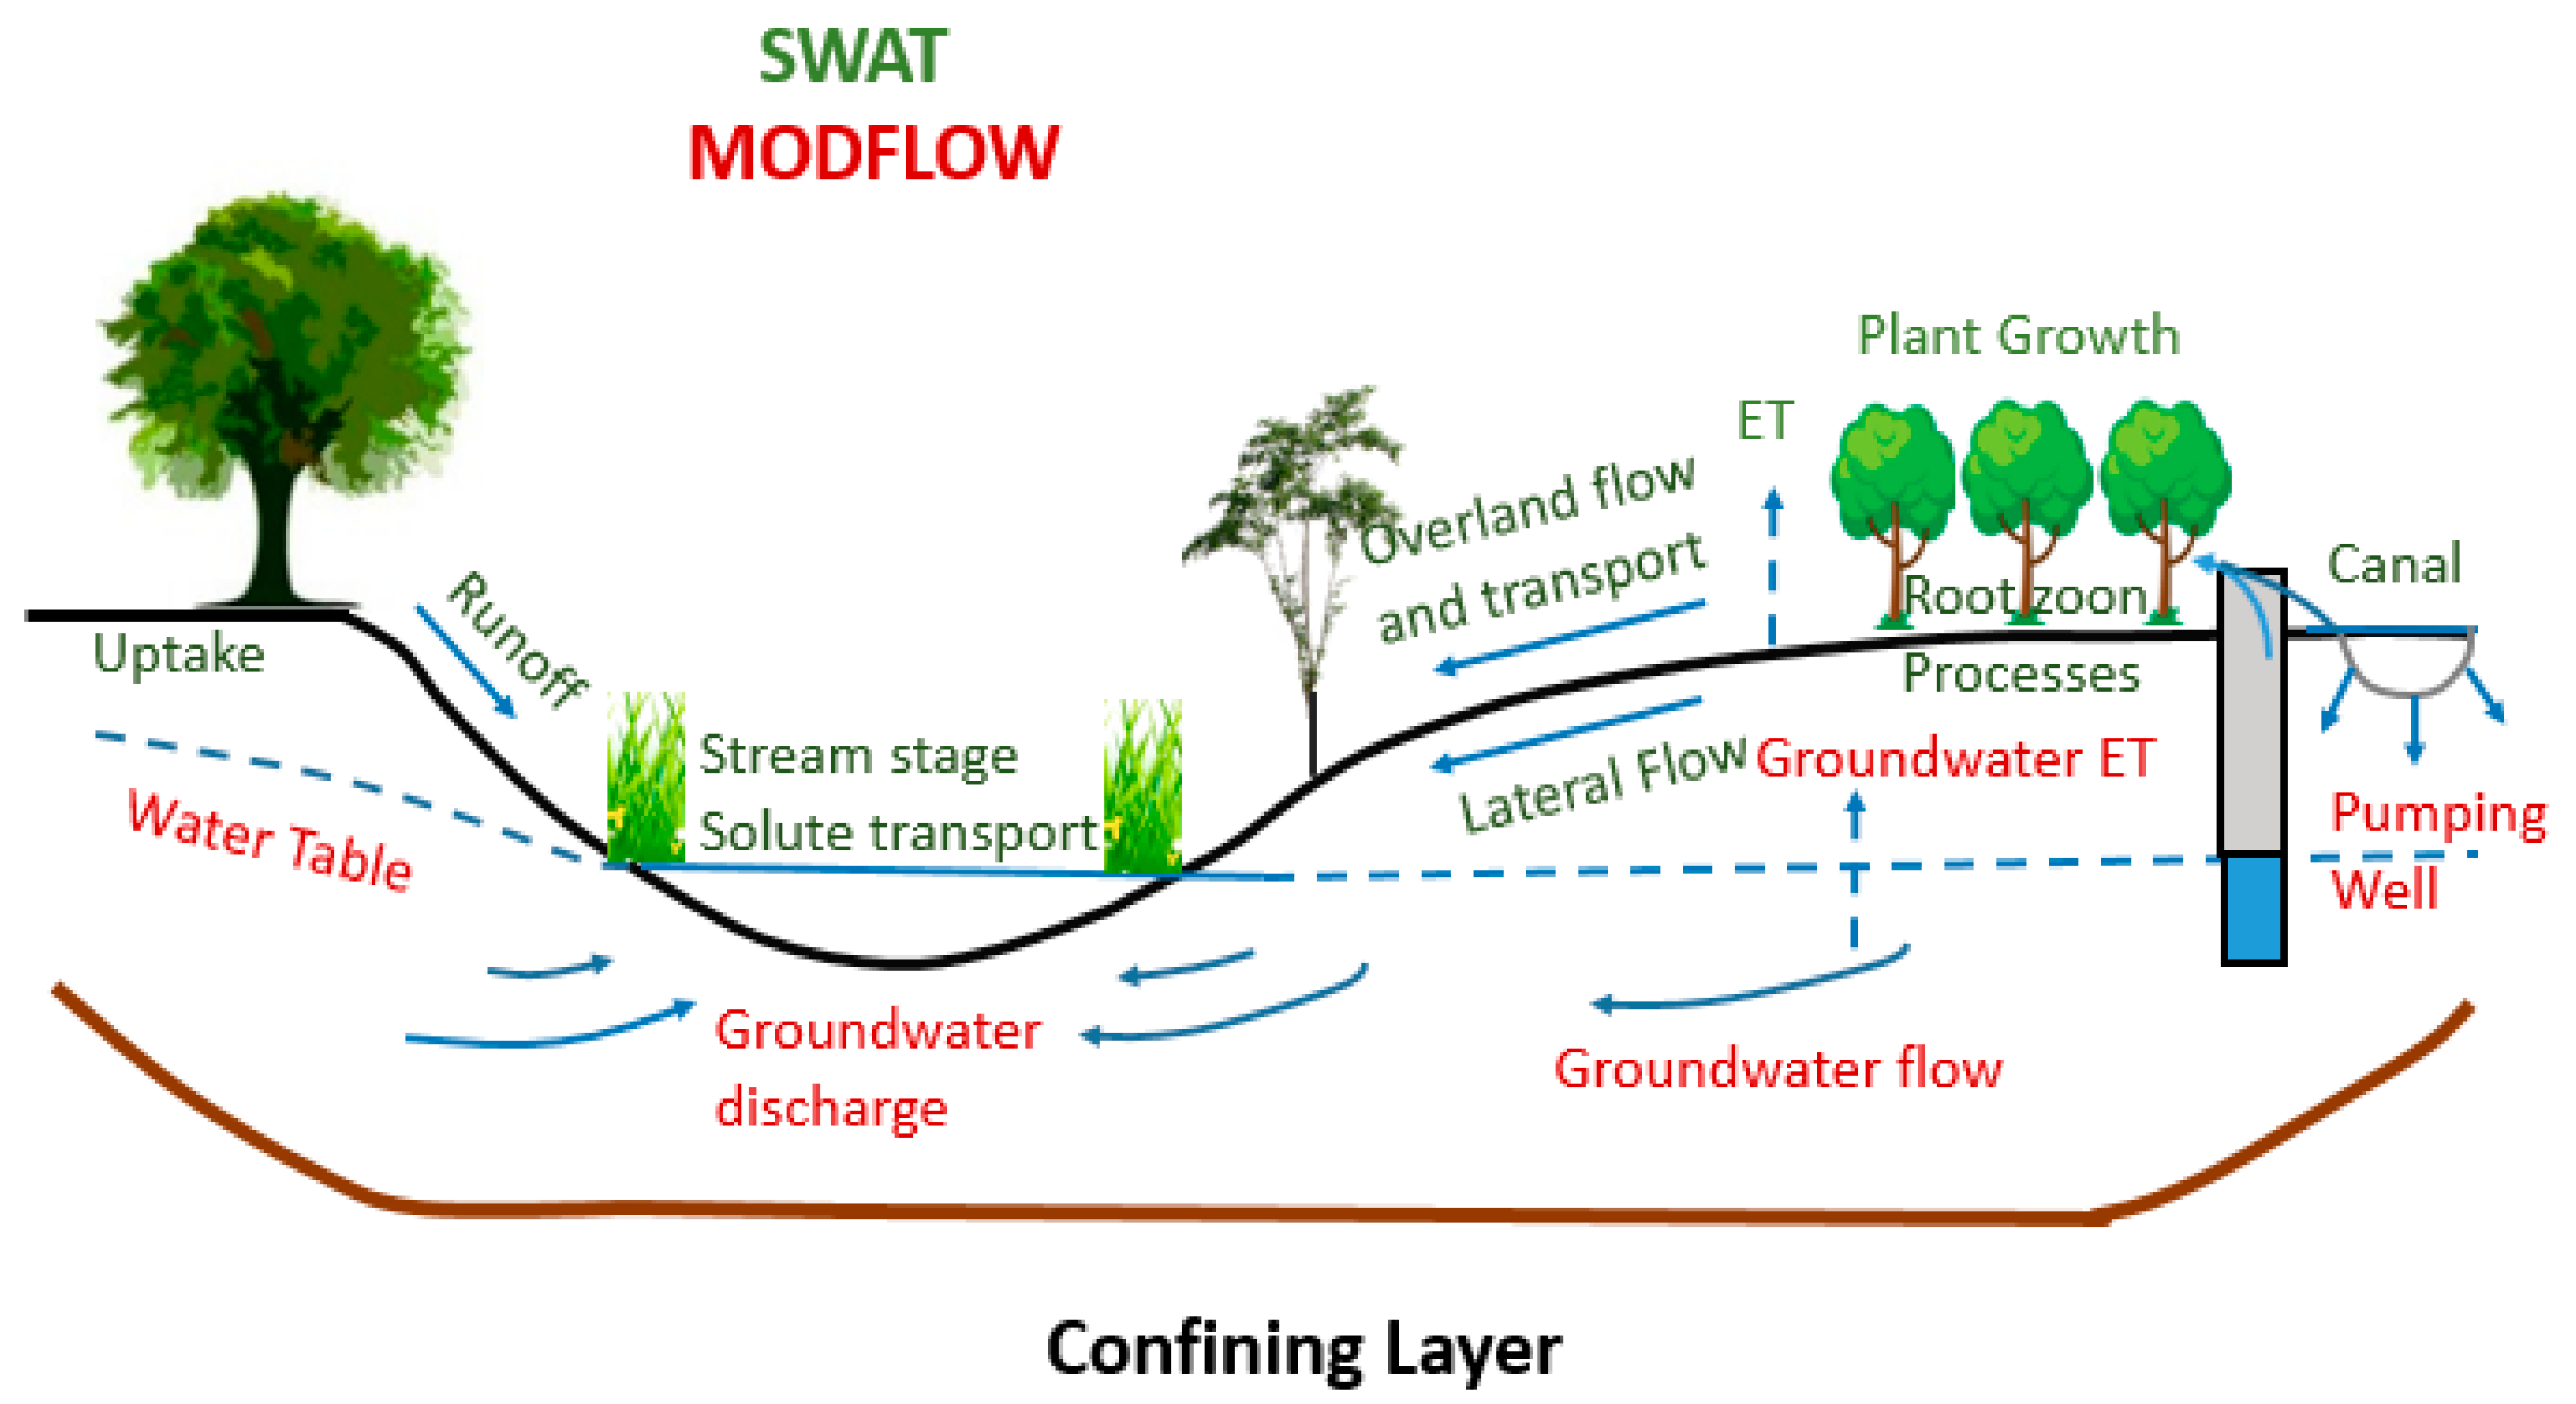
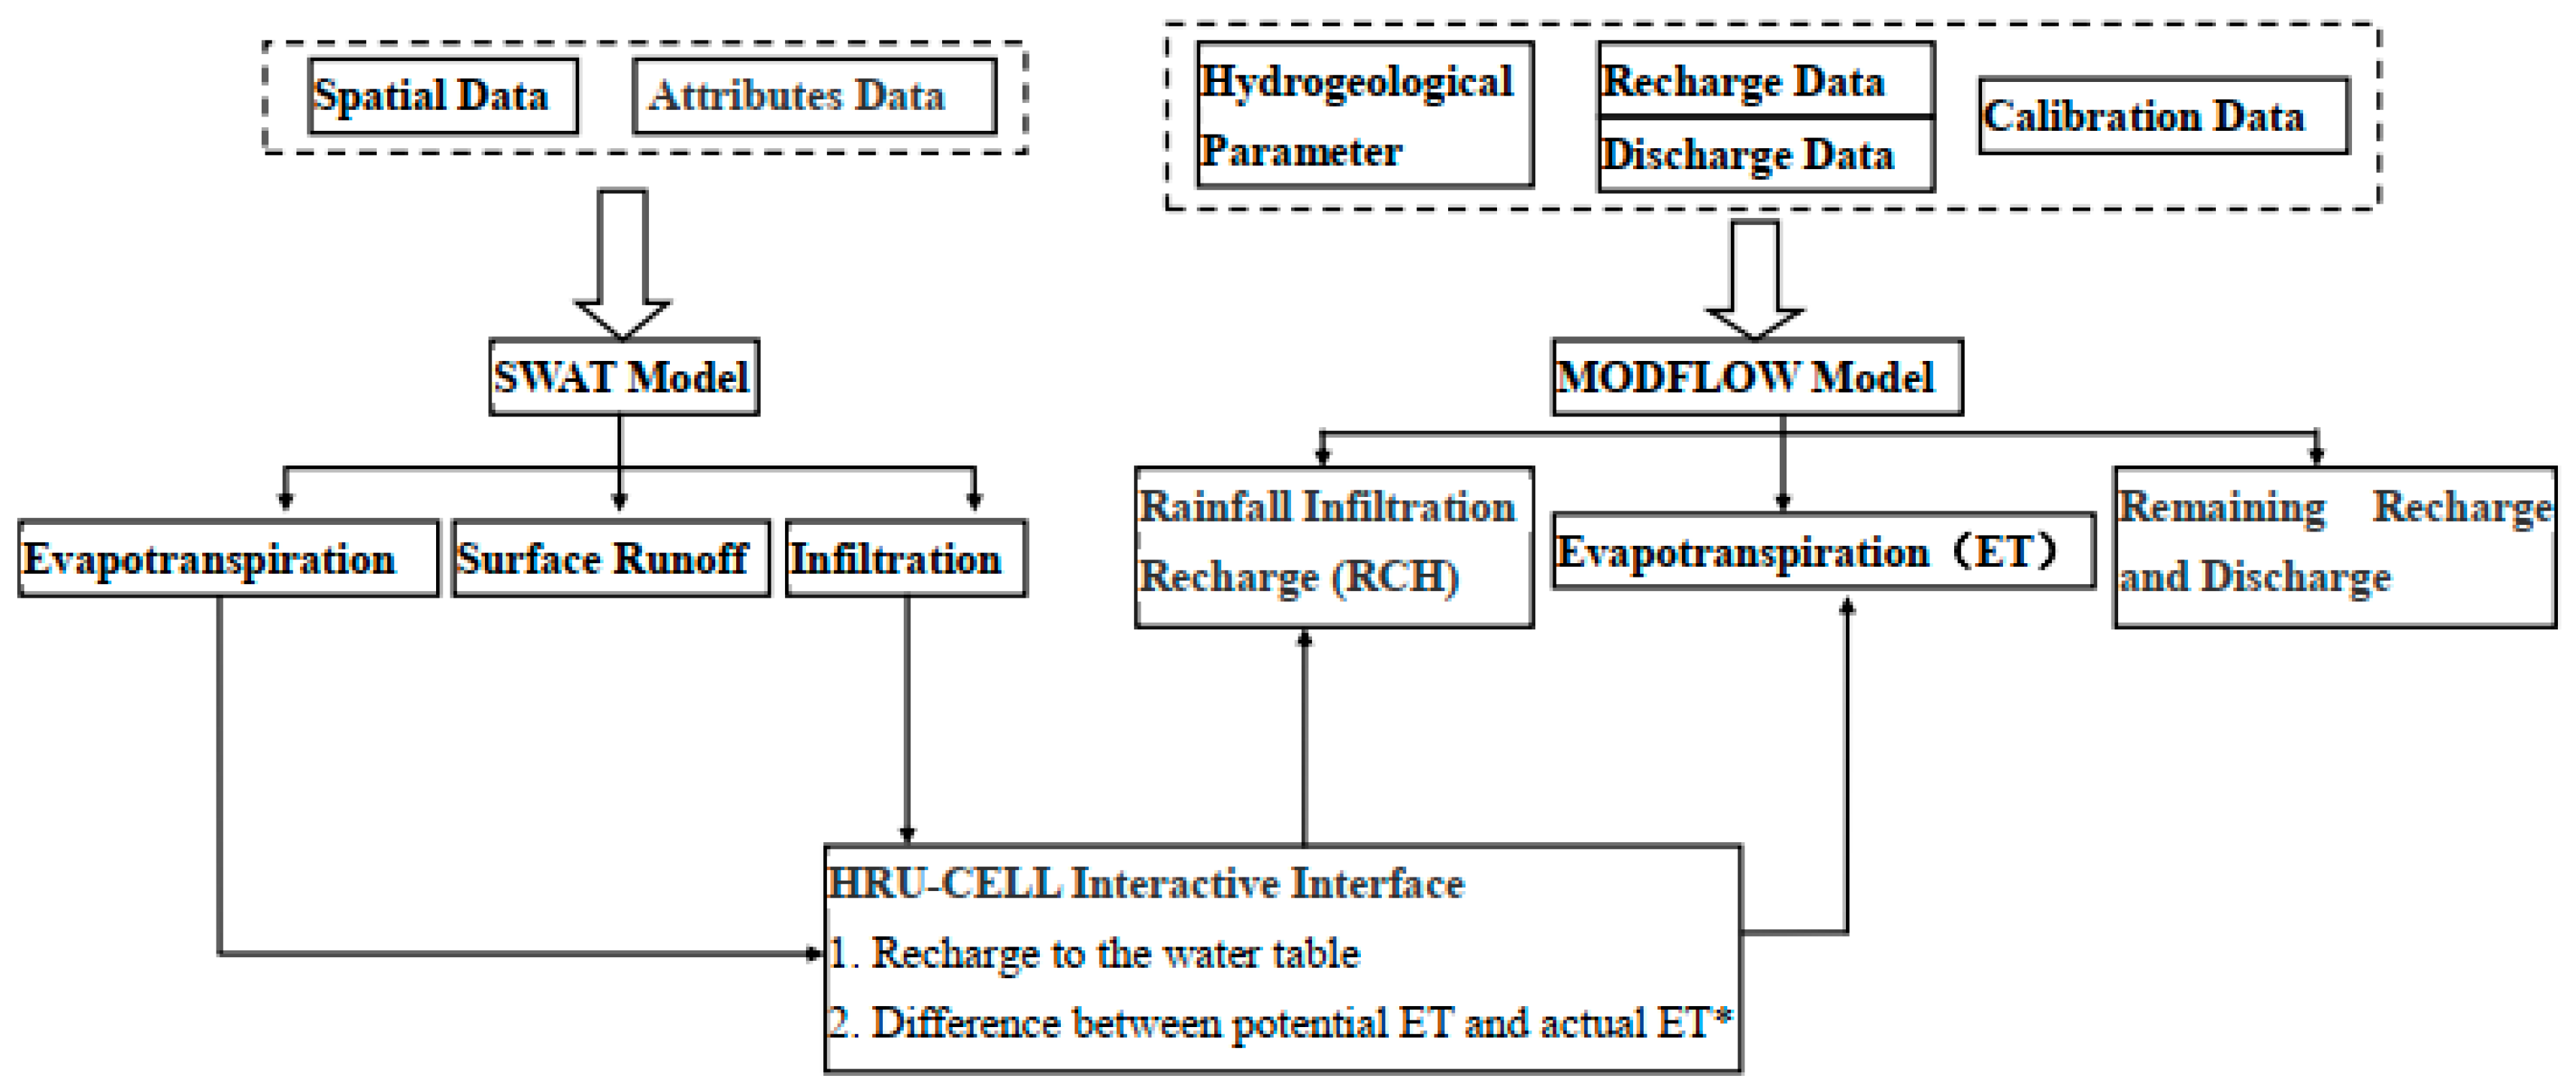
The SWAT–MODFLOW is a hydrological model that synthesizes the watershed and surface hydrology in this research. The SWAT process and the groundwater hydrological process of MODFLOW provide an integrated watershed-coupled hydrological model. Figure 3 shows the simulation process of each model, showing components simulated by SWAT (green) and MODFLOW (red). The distribution parameters such as hydraulic conductivity and the water storage coefficient are not considered by groundwater components, because the SWAT model has semi-distribution characteristics. Calculating the head distribution and the distributed pumping rates are quite hard when creating detailed representations of groundwater recharge. In addition, the MODFLOW model has great difficulty determining accurate recharge rates. Maintaining the advantages of the two models can reasonably quantify hydrological elements. Figure 4 shows the simulation and linking process of the SWAT–MODFLOW model. In this research, SWAT and MODFLOW models were established to run independently. They were then coupled together with evaporation values and recharge rates. In the coupling method, the evaporation values and the recharge rate form the HRU in SWAT, which should be exchanged with cells and used as input data in the MODFLOW. The spatial locations of each HRU in watersheds are unidentified due to the semi-distributed characteristics of SWAT. Hence, to reflect HRU locations, the HRUs of the sub-basins are determined by superpositioning the soil map and land cover map in pretreatment. As a result, the HRU numbers could be adversely matched because the soil and land cover numbers have their own space addresses [30]. Subsequently, the HRU data in SWAT2012 were read pretreatment output and these HRU data were assigned as space addresses in the related cells in MODFLOW, to pass recharge rates and remaining evapotranspiration (ET) rates from SWAT HRUs to MODFLOW grid cells.
3. Conceptual Model and Input Data Construction
3.1. Surface-Water Modeling
SWAT (soil and water assessment tool) simulates the quality and quantity of surface or groundwater and forecasts the circumstances resulting from the impact of climate change and land cover and management measures; SWAT was developed by the US department of agriculture [32]. The SWAT model is more suitable for long-term watershed hydrological simulation than for a single year. In SWAT, a watershed is divided into multiple sub-basins, which are further subdivided into hydrological response units (HRUs) that include homogeneous land cover, management and agrotype. This approach causes SWAT HRUs to have no specified geographic location, but it can quickly simulate the watershed for a long period of time, and it is a computationally efficient scheme. Meanwhile, indicators of groundwater reserve such as water level do not have a geographical position. Distributed hydrological models such as SWAT are basically developed for natural watersheds, and are not suitable for simulation of water transformation relationships in irrigation areas by reason of the simplistic representation of groundwater processes [33].
ArcSWAT is an extension of the ArcGIS graphical user interface [34]. Before accurately simulating the flow, it is imperative to prepare the spatial data. The spatial datasets contain land cover, soil type maps, a digital elevation model (DEM), DEM mask, user-defined watersheds data and user-defined data streams. ArcSWAT2012.10.2.19 was applied for this study. DEM data with 30 m precision was acquired from service center international scientific data. Data on soil maps and land data were obtained from the Harmonized World Soil Database and the Chinese Academy of Sciences, respectively. Runoff data were obtained from the Yanqi Hydrographic Station, China. Key procedures for SWAT simulation include delineating the watershed, defining the HRUs, defining the weather data, applying the default input files writer, and setting up and running SWAT.
The sub-basin automatically delineated by the DEM data is quite different from the actual situation because the Yanqi Basin is a plain area with considerable human influence. As a result, we defined 6 watersheds according to the division of agricultural irrigation areas in the study area (Figure 5). and 88 HRU were generated on the basis of land cover, soil type and slope characteristics. The average annual runoff of the Kaidu River and the Huangshuigou River is 3640 million m3 and 280 million m3, respectively. Therefore, long-term runoff data is entered into the point source edit field of the SWAT model. The three observation stations in Figure 5 are Hejing, Heshuo and Yanqi. They provided measured data between 1955 and 2017 to use as weather input for SWAT, including daily rainfall, the highest and lowest temperature, data on solar radiation, relative humidity, and data on wind speed.
Accurate calculation of evapotranspiration is the key to estimating water resources. The model provides three methods for calculating potential evaporation capacity: methods by Penman-Monteith [35], Priestley-Taylor [36], and Hargreaves [37]. In this paper, potential evapotranspiration was computed using the formula of Penman-Monteith. The catchment was reclassified into seven classes based on land use (Table 1) and 26 types of soils are included in the soil data. The reclassified soil and land use data of Yanqi Basin in China are then input into SWAT, to establish one or more types of HRU for each sub-basin.
The main crops planted in the Yanqi Basin are corn, wheat, potato and cotton, which are greatly influenced by human activities. Specifically, groundwater in irrigated areas plays an increasingly prominent role in irrigated agriculture, with the proportion of well irrigation rising from 15% in 2000 to 46.7% in 2017. The management modules of Bosten Lake and Little Lake are Water and Wetlands-Forested, respectively. The cultivated land (AGRL) in other sub-regions is generalized into Agricultural Land—Generic; other land use types use the default action model. According to the average irrigation quota under the 75% guarantee rate of Yanqi Basin, the net irrigation amount of spring irrigation, summer irrigation and winter irrigation was then set as 96, 180 and 98 mm, respectively. The spring irrigation time period was from 30 January to 10 May, the summer irrigation time period was from 20 May to 20 August, and the winter irrigation time period was from 20 October to 5 February. The management mode document (MGT) was edited according to the irrigation data (field irrigation amount and well irrigation amount) of the basin from 1955 to 2017, as shown in Table 2; the data were obtained from the Statistical Yearbook of Xinjiang, China. When all the above data has been edited, the SWAT model is run.
3.2. Numerical Model of Groundwater
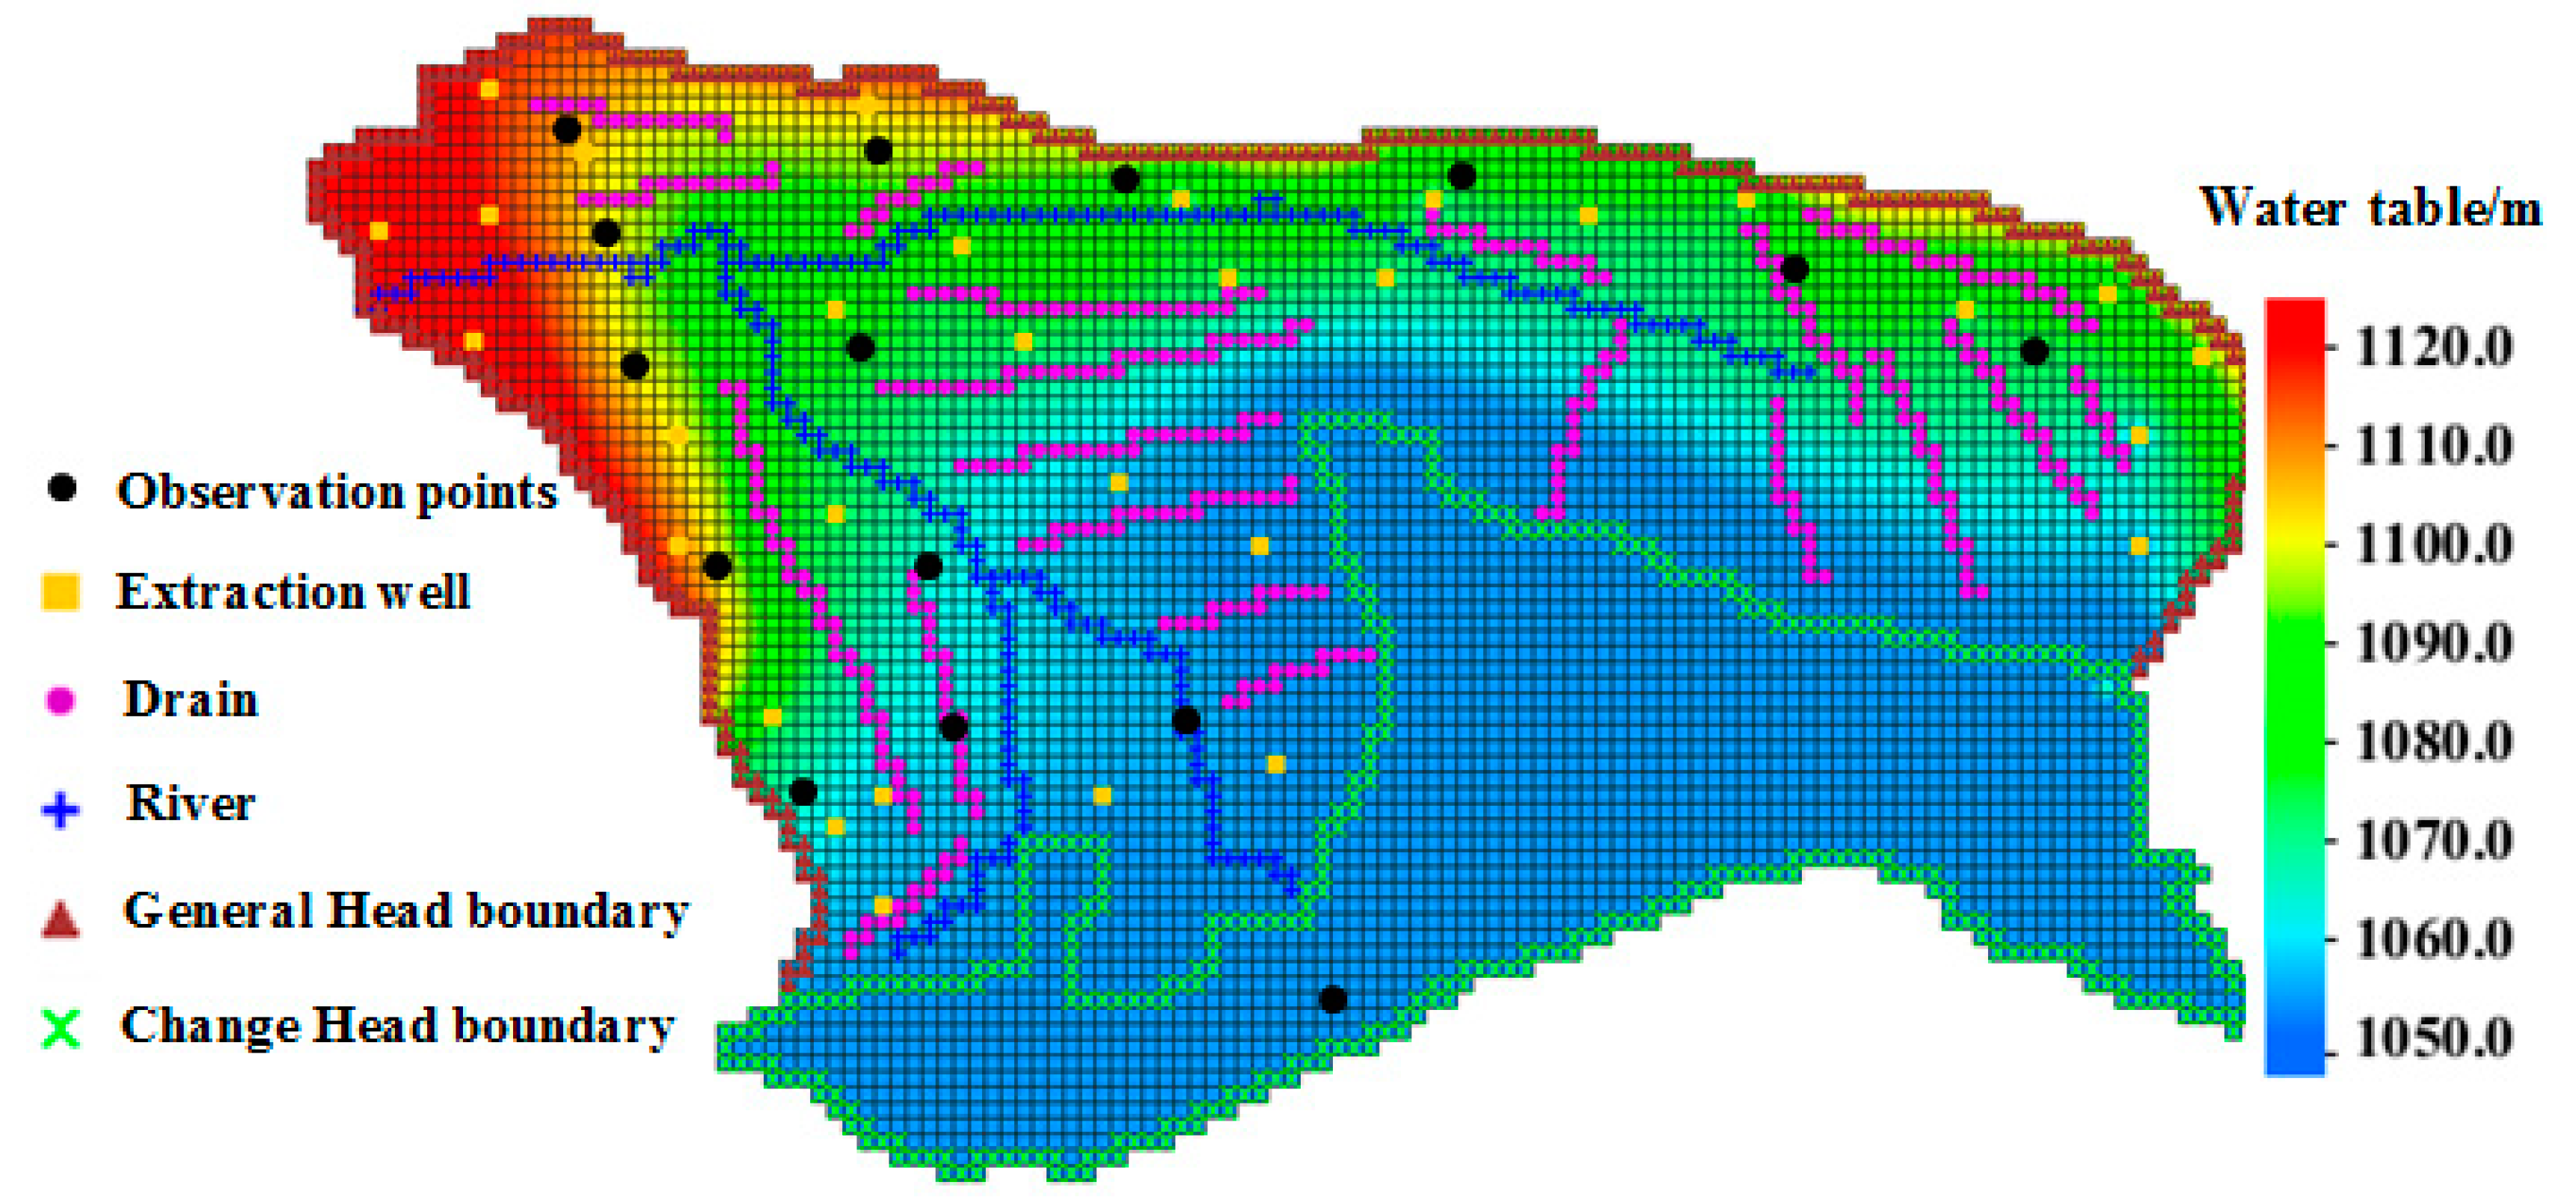
The analysis of water resources development and ecological environment protection related to groundwater in the Yanqi Basin must be observed and analyzed from a dynamic perspective. The method of establishing the Yanqi Basin conceptual model consists of five steps: (1) collection and arranging of total practicable data and information (the report of hydrogeological survey, satellite remote sensing interpretation data and the report of groundwater extraction and utilization survey of the Yanqi Basin in the Xinjiang province of China, etc.), (2) establishment and verification of the controlling observations, (3) evaluation of geometric and hydrodynamic characteristics of aquifers, (4) recognition of the recharge and discharge items of aquifers, and (5) integration of the results of all steps to form the complete conceptual model. Agricultural irrigation and wetlands degradation are mainly affected by the phreatic layer and permeable layer in the study area. The simulation object can be conceptualized into a one-layer heterogeneous anisotropic three-dimensional unsteady flow model. The lateral boundary condition is generalized into a variable flow boundary, and Bosten Lake is treated as an equipotential body, which is conceptualized as a change head boundary in the model.
MODFLOW is a modular three-dimensional finite difference groundwater model. The study area was discretized into finite difference grid cells with a size of 1000 by 1000 m, aligned in a grid consisting of 80 rows of east-west columns and 136 north-south columns.
The three-dimensional grid mode in GMS was used to mesh the area (13,000 km2); it is carried out by using the 3D-grid mode in GMS. On the basis of the spatial discretization of the model area the conceptual model is transformed into a numerical model by using the MODFLOW module. The grid was endowed with some parameters such as boundary conditions, hydraulic conductivity and source-sink conditions etc. In transient models, the starting heads were set equal to the solution generated from a steady-state model of January 2000.
3.3. SWAT-MODFLOW Coupled in Irrigation Area
As mentioned above, the SWAT-MODFLOW integration model needs to establish an HRU-CELL interactive interface through ARCGIS; that is, the features of the HRUs in the SWAT model are swapped with those in the MODFLOW model [24]. The principle of groundwater recharge and evaporation counting in SWAT–MODFLOW is shown in Figure 6.
4. Results and Discussion
4.1. SWAT Sensitivity Analysis and Calibration
The runoff data of the Yanqi hydrological station from 1961 to 2017 were used to analyze the sensitivity and calibration in this study. The sequence uncertainty fitting (SUFI-2) algorithm was used to perform sensitivity analysis and calibration through its interface with SWAT-CUP, which is a calibration and uncertainty program.
In each run, multiple simulation iterations were executed with a 500 simulations. In each iteration, the SUFI-2 algorithm performed Latin Hypercube sampling over the user-defined parameter range and created multiple parameter set samples. Each parameter set sample was input into the SWAT model, and used to simulate the possible output within a 95% confidence interval (95PPU) [38]. The SWAT model was run for the 62-year period of 1955–2017, and for the best operation, a three-year warm-up period was used, so that the calibration process was carried out between 1958 and 1990 and the verification process was carried out between 1991 and 2017. Table 3 lists the selected SWAT parameters and their sensitivity statistics during the calibration process. The calibration statistics of the Yanqi hydrometric station are shown in Table 4. There are two indicators for measuring the sensitivity of the model. The P-factor is closer to 0; the greater the absolute t-factor, the more sensitive it is. The iteration p-factor, evaluated in a ratio of 0 to 1, considers how well the optimal simulation remains within the 95% confidence interval due to the uncertainty range of the parameters. Abbaspour [39], who is the developer of SWAT-CUP, suggested that the p-factor be close to 1 (>0.7) and the r-factor be close 0 for runoff simulation, which could be considered as the conditions whereby the norm of model parameters is relatively suitable and the uncertainty meets the requirements. Consider the parameter set with the best performance in each iteration, and use that set to guide the user to reduce the parameter scope in subsequent iterations, until an ideal performance of the p-factor and r-factor appear [38]. This sensitivity analysis is that 30 global hydrological parameters (out of 66 parameters) are selected to calibration runoff.
According to the statistics in Table 3, the reach transmission loss (TRNSRCH) is the most sensitive parameter of the runoff. The Kaidu River is the largest river in the Yanqi Basin; it belongs to an arid area, but due to the Kaidu River’ seasonal hydrological characteristics, most of the loss is through riverbed infiltration, so the runoff in the Yanqi Basin is mainly controlled by the transmission loss. As shown in Table 3, the effective hydraulic conductivity (v__CH_K2.rte) and Manning’s n value (v__CH_N2.rte) that mediate infiltration from the streambed are also strongly sensitive. The delay time for aquifer recharge (v__GW_DELAY.gw) is of great significance for river runoff recharge during dry season, especially in an arid watershed.
Up to now, NS (Nash-Sutcliff) and R2 have not been given special standards and appropriate values, which is generally considered a standard between 0 and 1 is a receivable standard of performance. In general, model simulation can be determined as satisfactory if C and R2 values exceeding 0.5 are considered acceptable [40]. According to the evaluation results of Table 4, the distributed SWAT model established for the unique hydrometeorological factors and meteorological elements has good applicability in the oasis irrigation area represented by the Yanqi Basin.
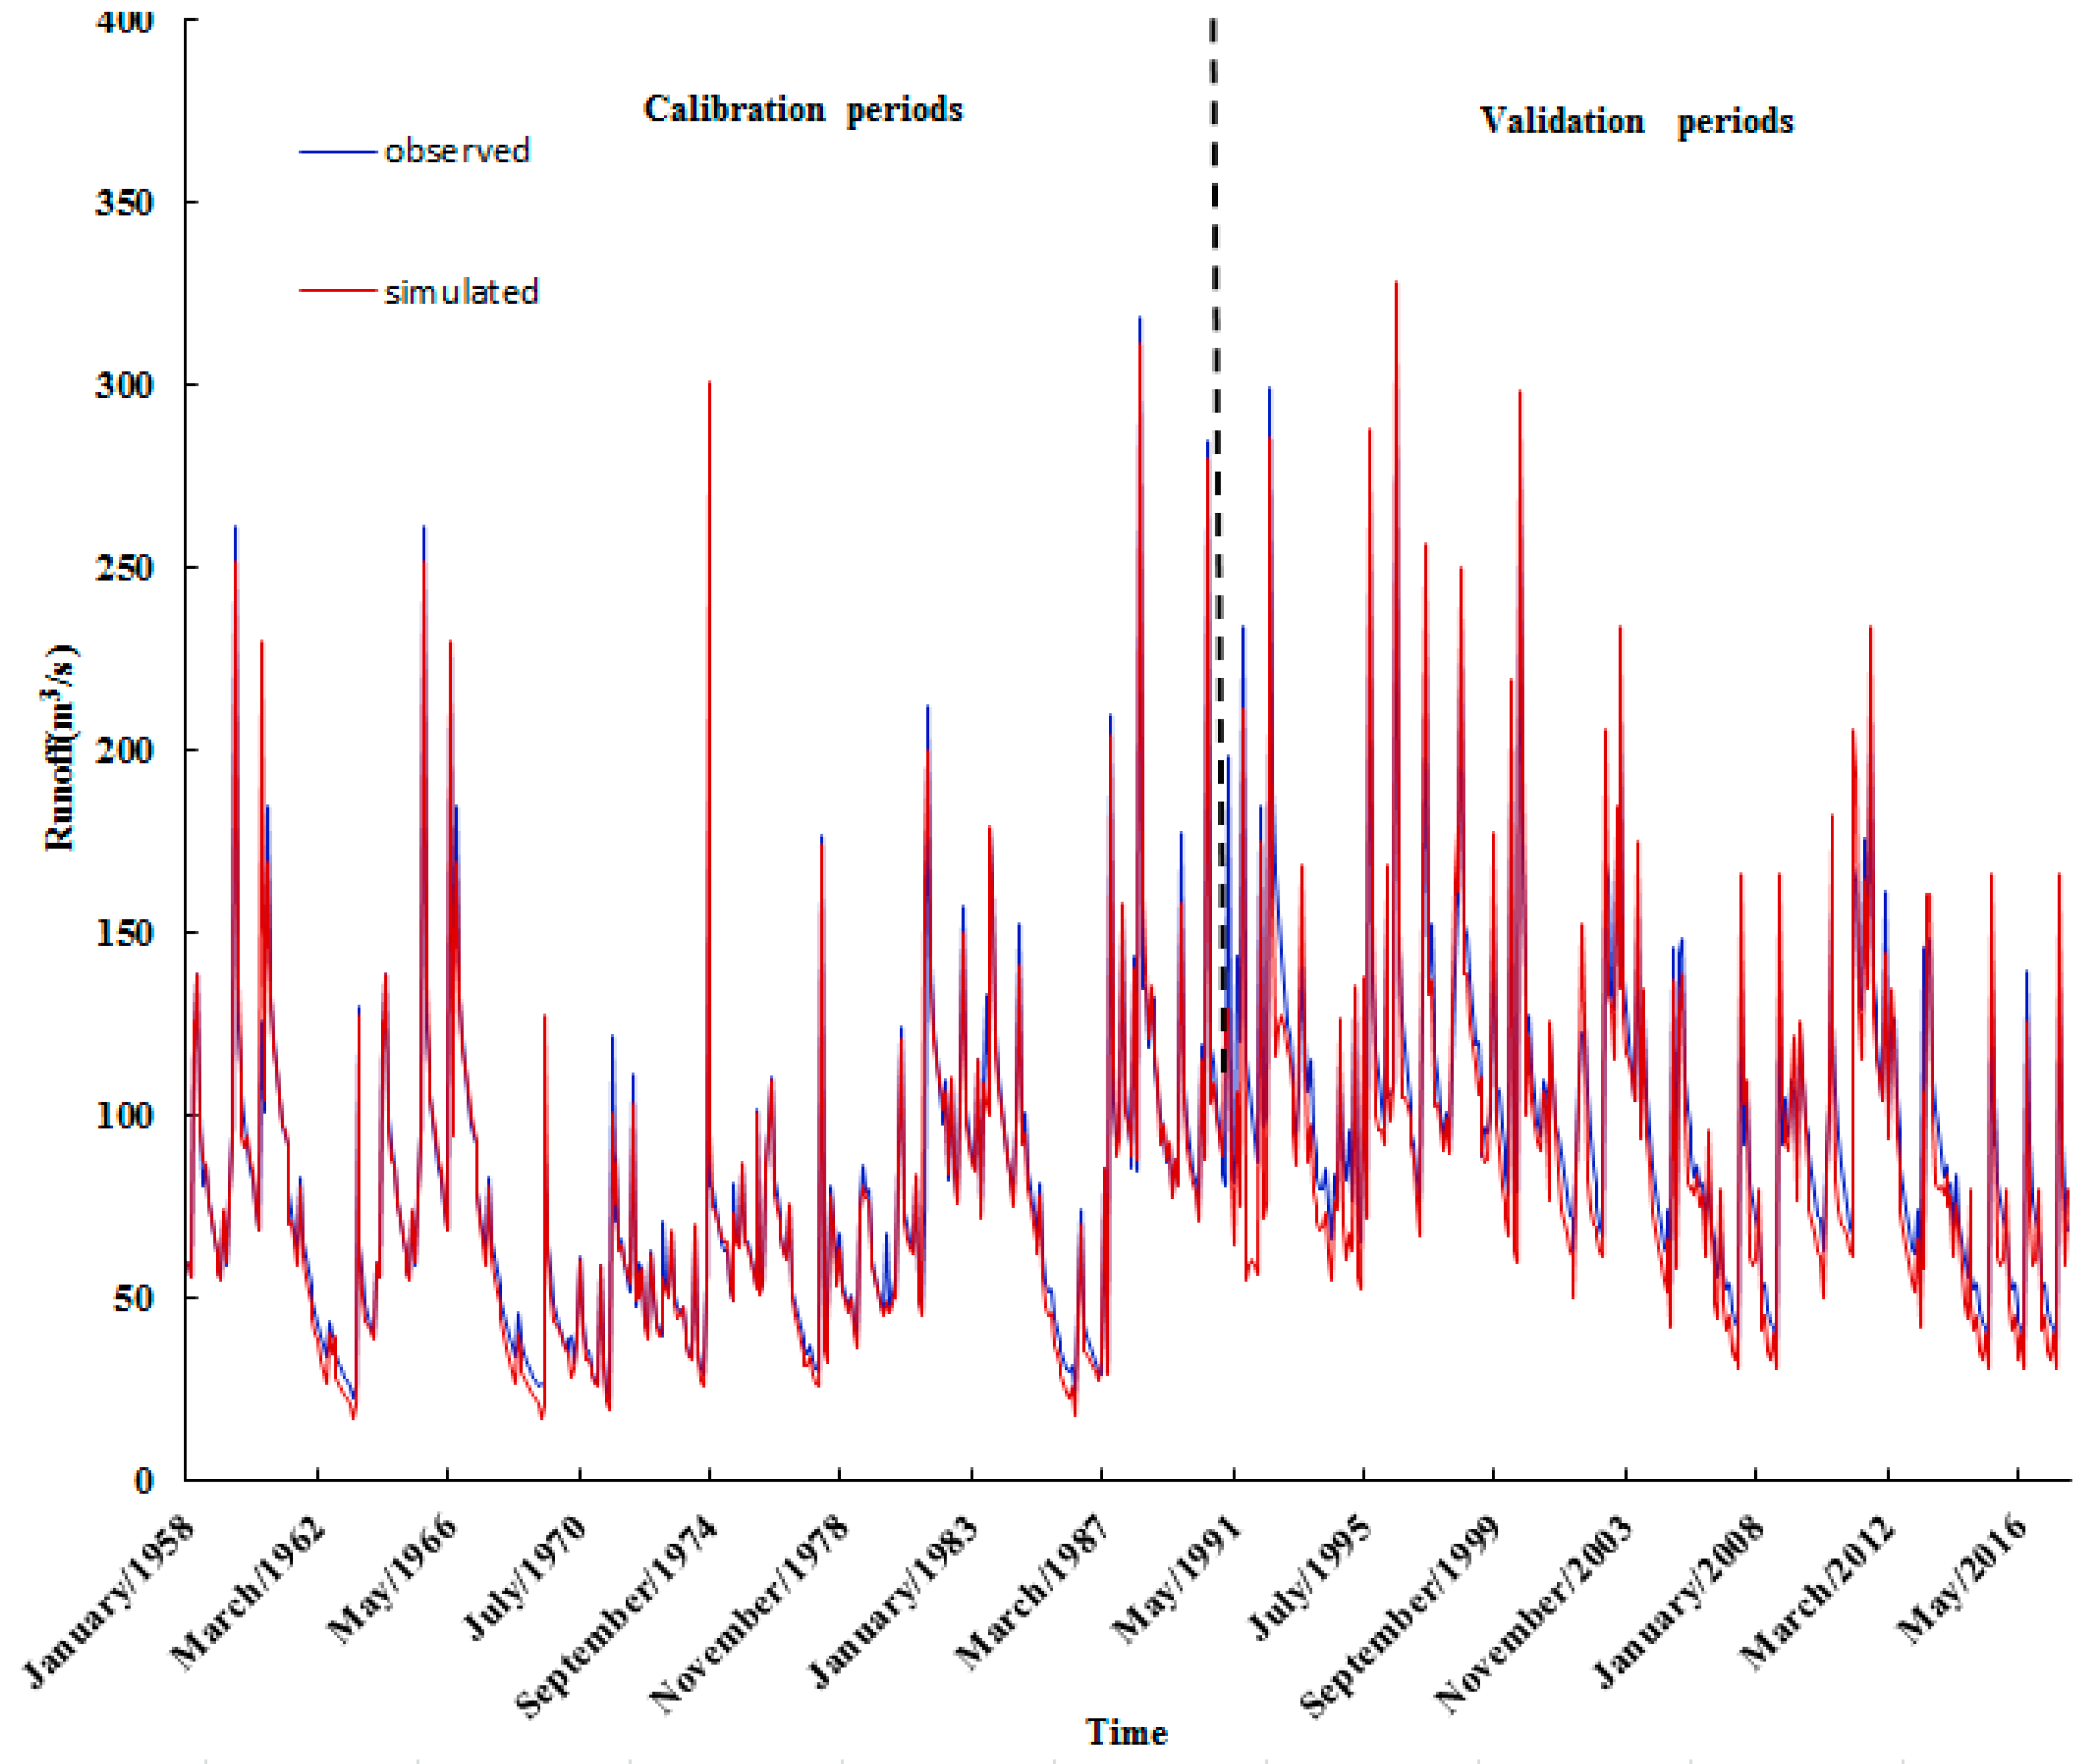
During the calibration and validation periods, the average monthly measured and simulated runoff are shown in Figure 7, indicating that the simulated flow dynamics in this study are ideal. The p-factor and r-factor are 0.62 and 1.49 respectively in the calibration time. Even though the p-factor showed unacceptable results, performance indices results obtained during the calibration (Figure 7 and Table 4) show that the simulation results are satisfactory, with an R2 of 0.95, and an NS index of 0.71. In the validation period, the model evaluation index NS is 0.83 and R2 is 0.88. The correlation statistic (R2) indicates that a reasonable linear relationship exists between the measured and the simulated runoff, and the NS is within acceptable limits (>0.5), as proposed by Mofiasi, et al. [41]. The runoff consequence of validation is shown in Table 3. The p-factor and r-factor are equivalent to the calibration results; this indicates the consistency of the simulation during the calibration and validation periods. This shows that the sufi-2 method can be applied to the SWAT model correction and uncertainty analysis in the Yanqi Basin according to the grading standard of Mofiasi.
4.2. Calibration and Verification of Numerical Simulation
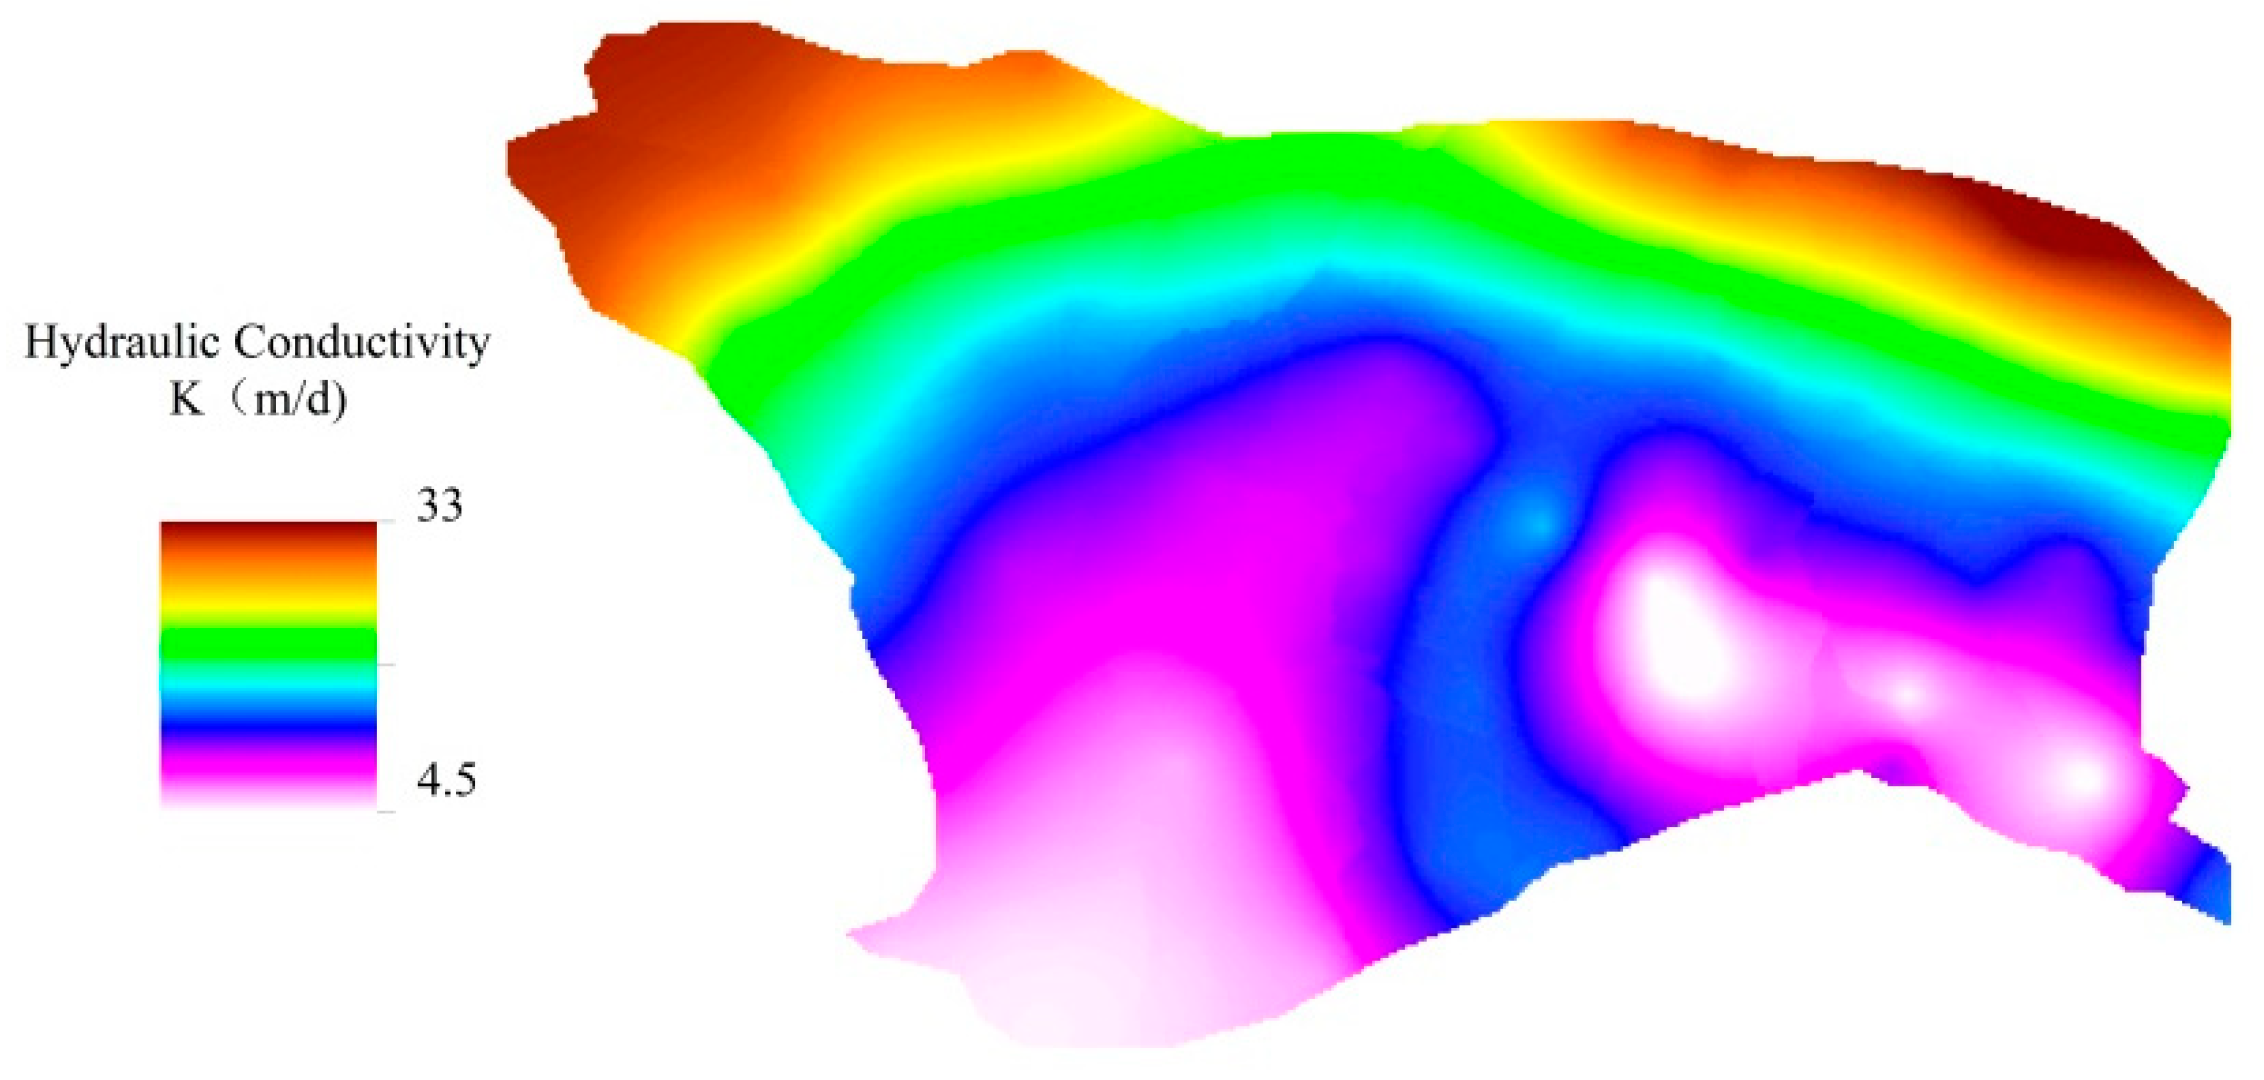
The model was calibrated by combining manual calibration and auto-calibration (PEST pilot points) because of the random nature of the parameter partition in the basin and plain. The final coefficient distribution is shown in Figure 8. “Pest pilot points” is a method of reverse seeking parameters. Pilot points can be regarded as a 2D scatter set. The parameter value in this area is obtained by interpolation from the pilot points. Then the value of the pilot points is calculated by the inverse model. The pilot points’ values are regulated and interpolated to the grid cells until the minimized value of the target function appears. The inversion process is more reliable thanks to the constraint [41].
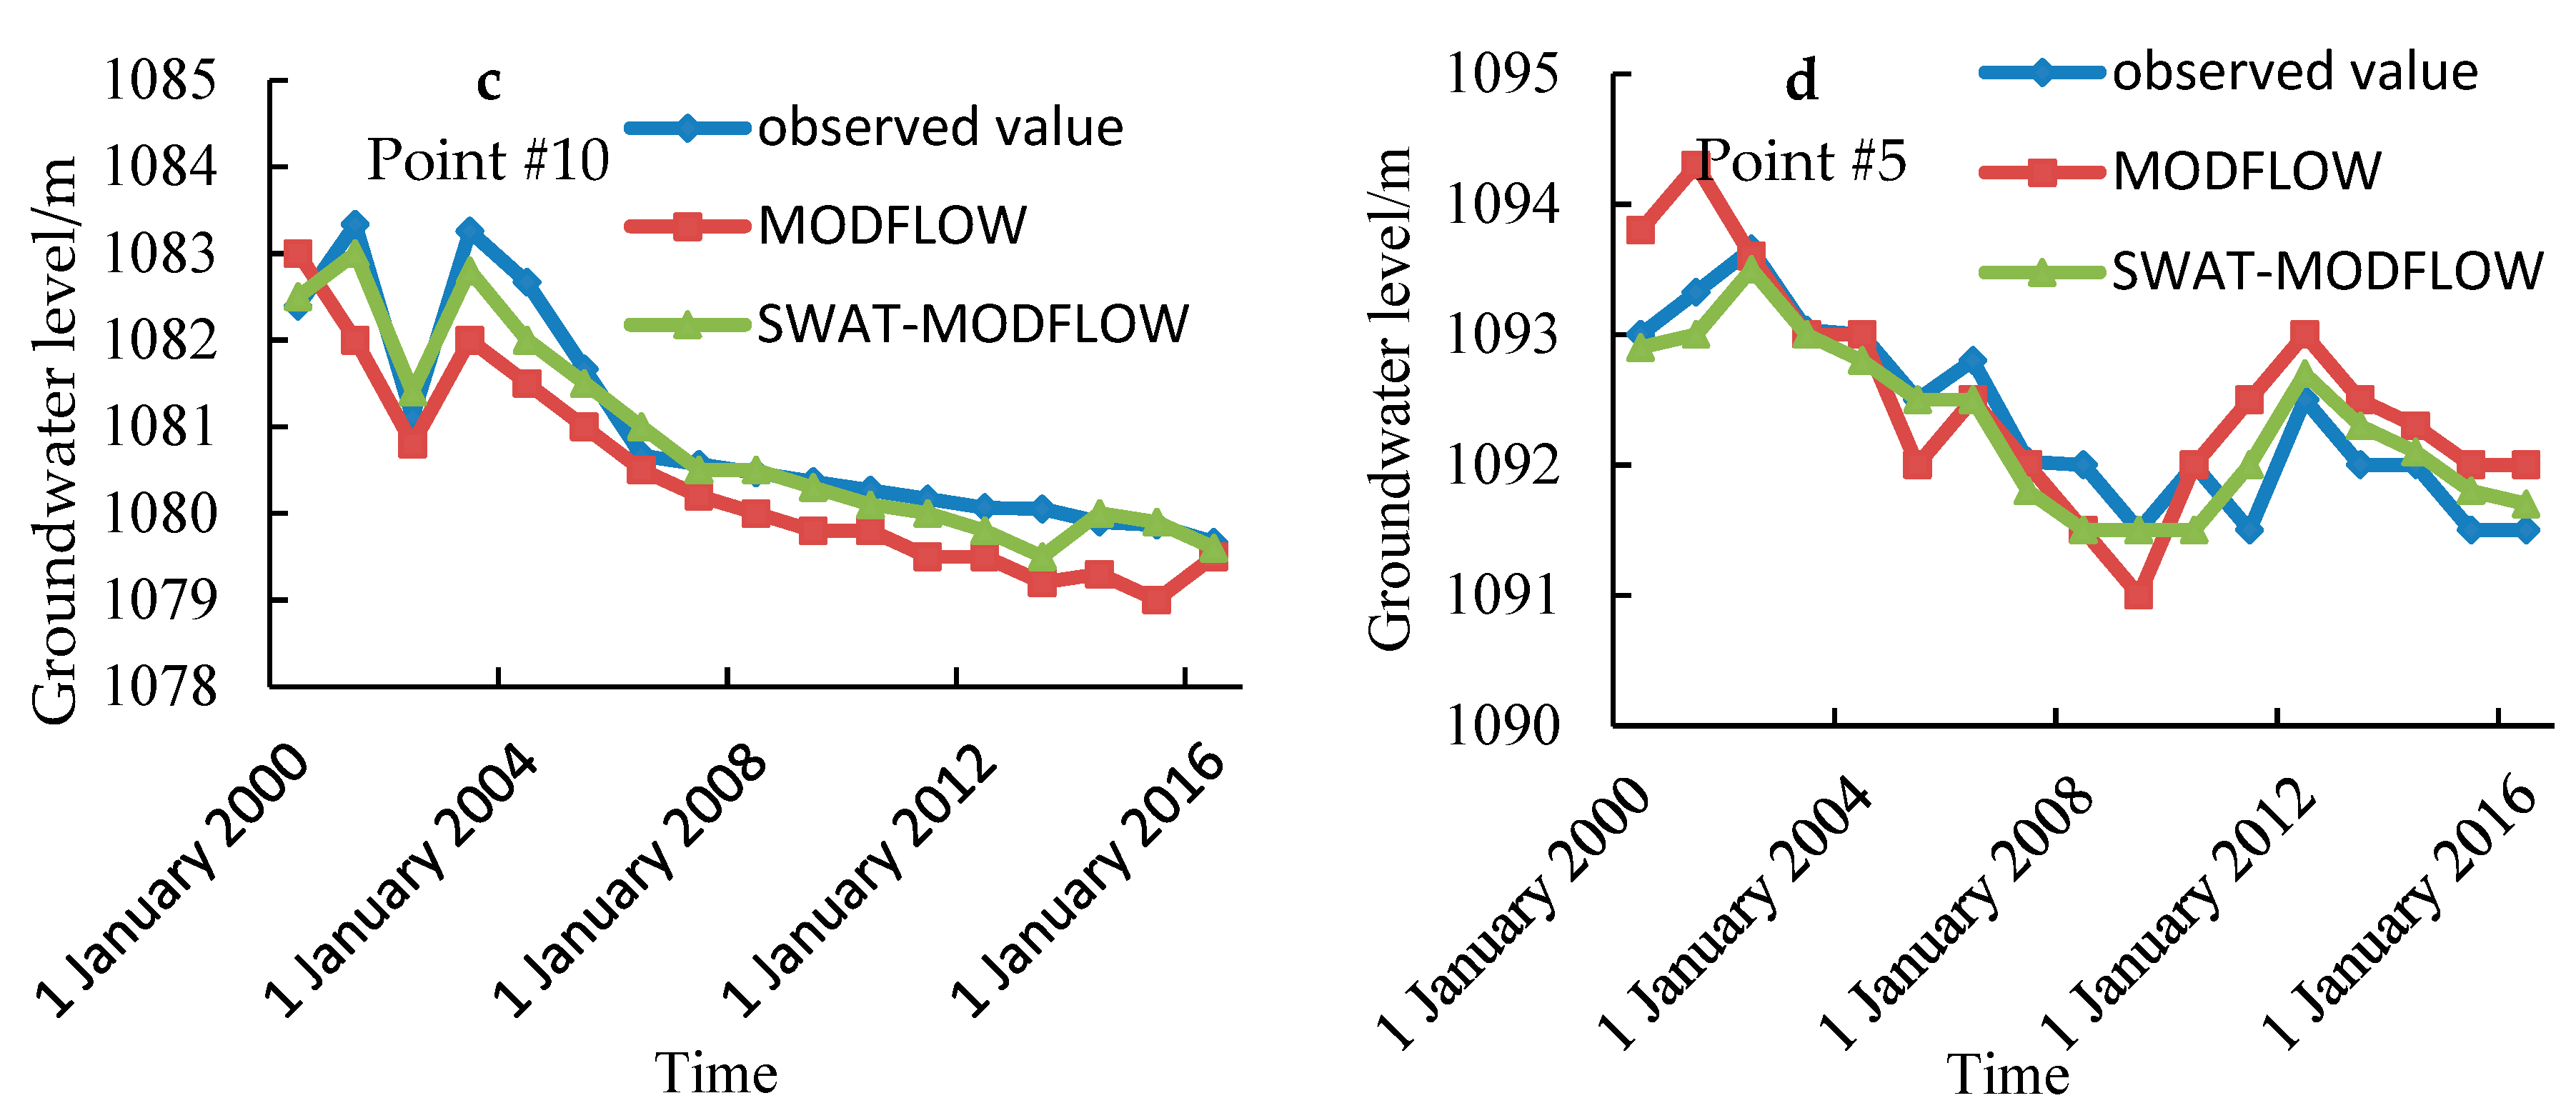
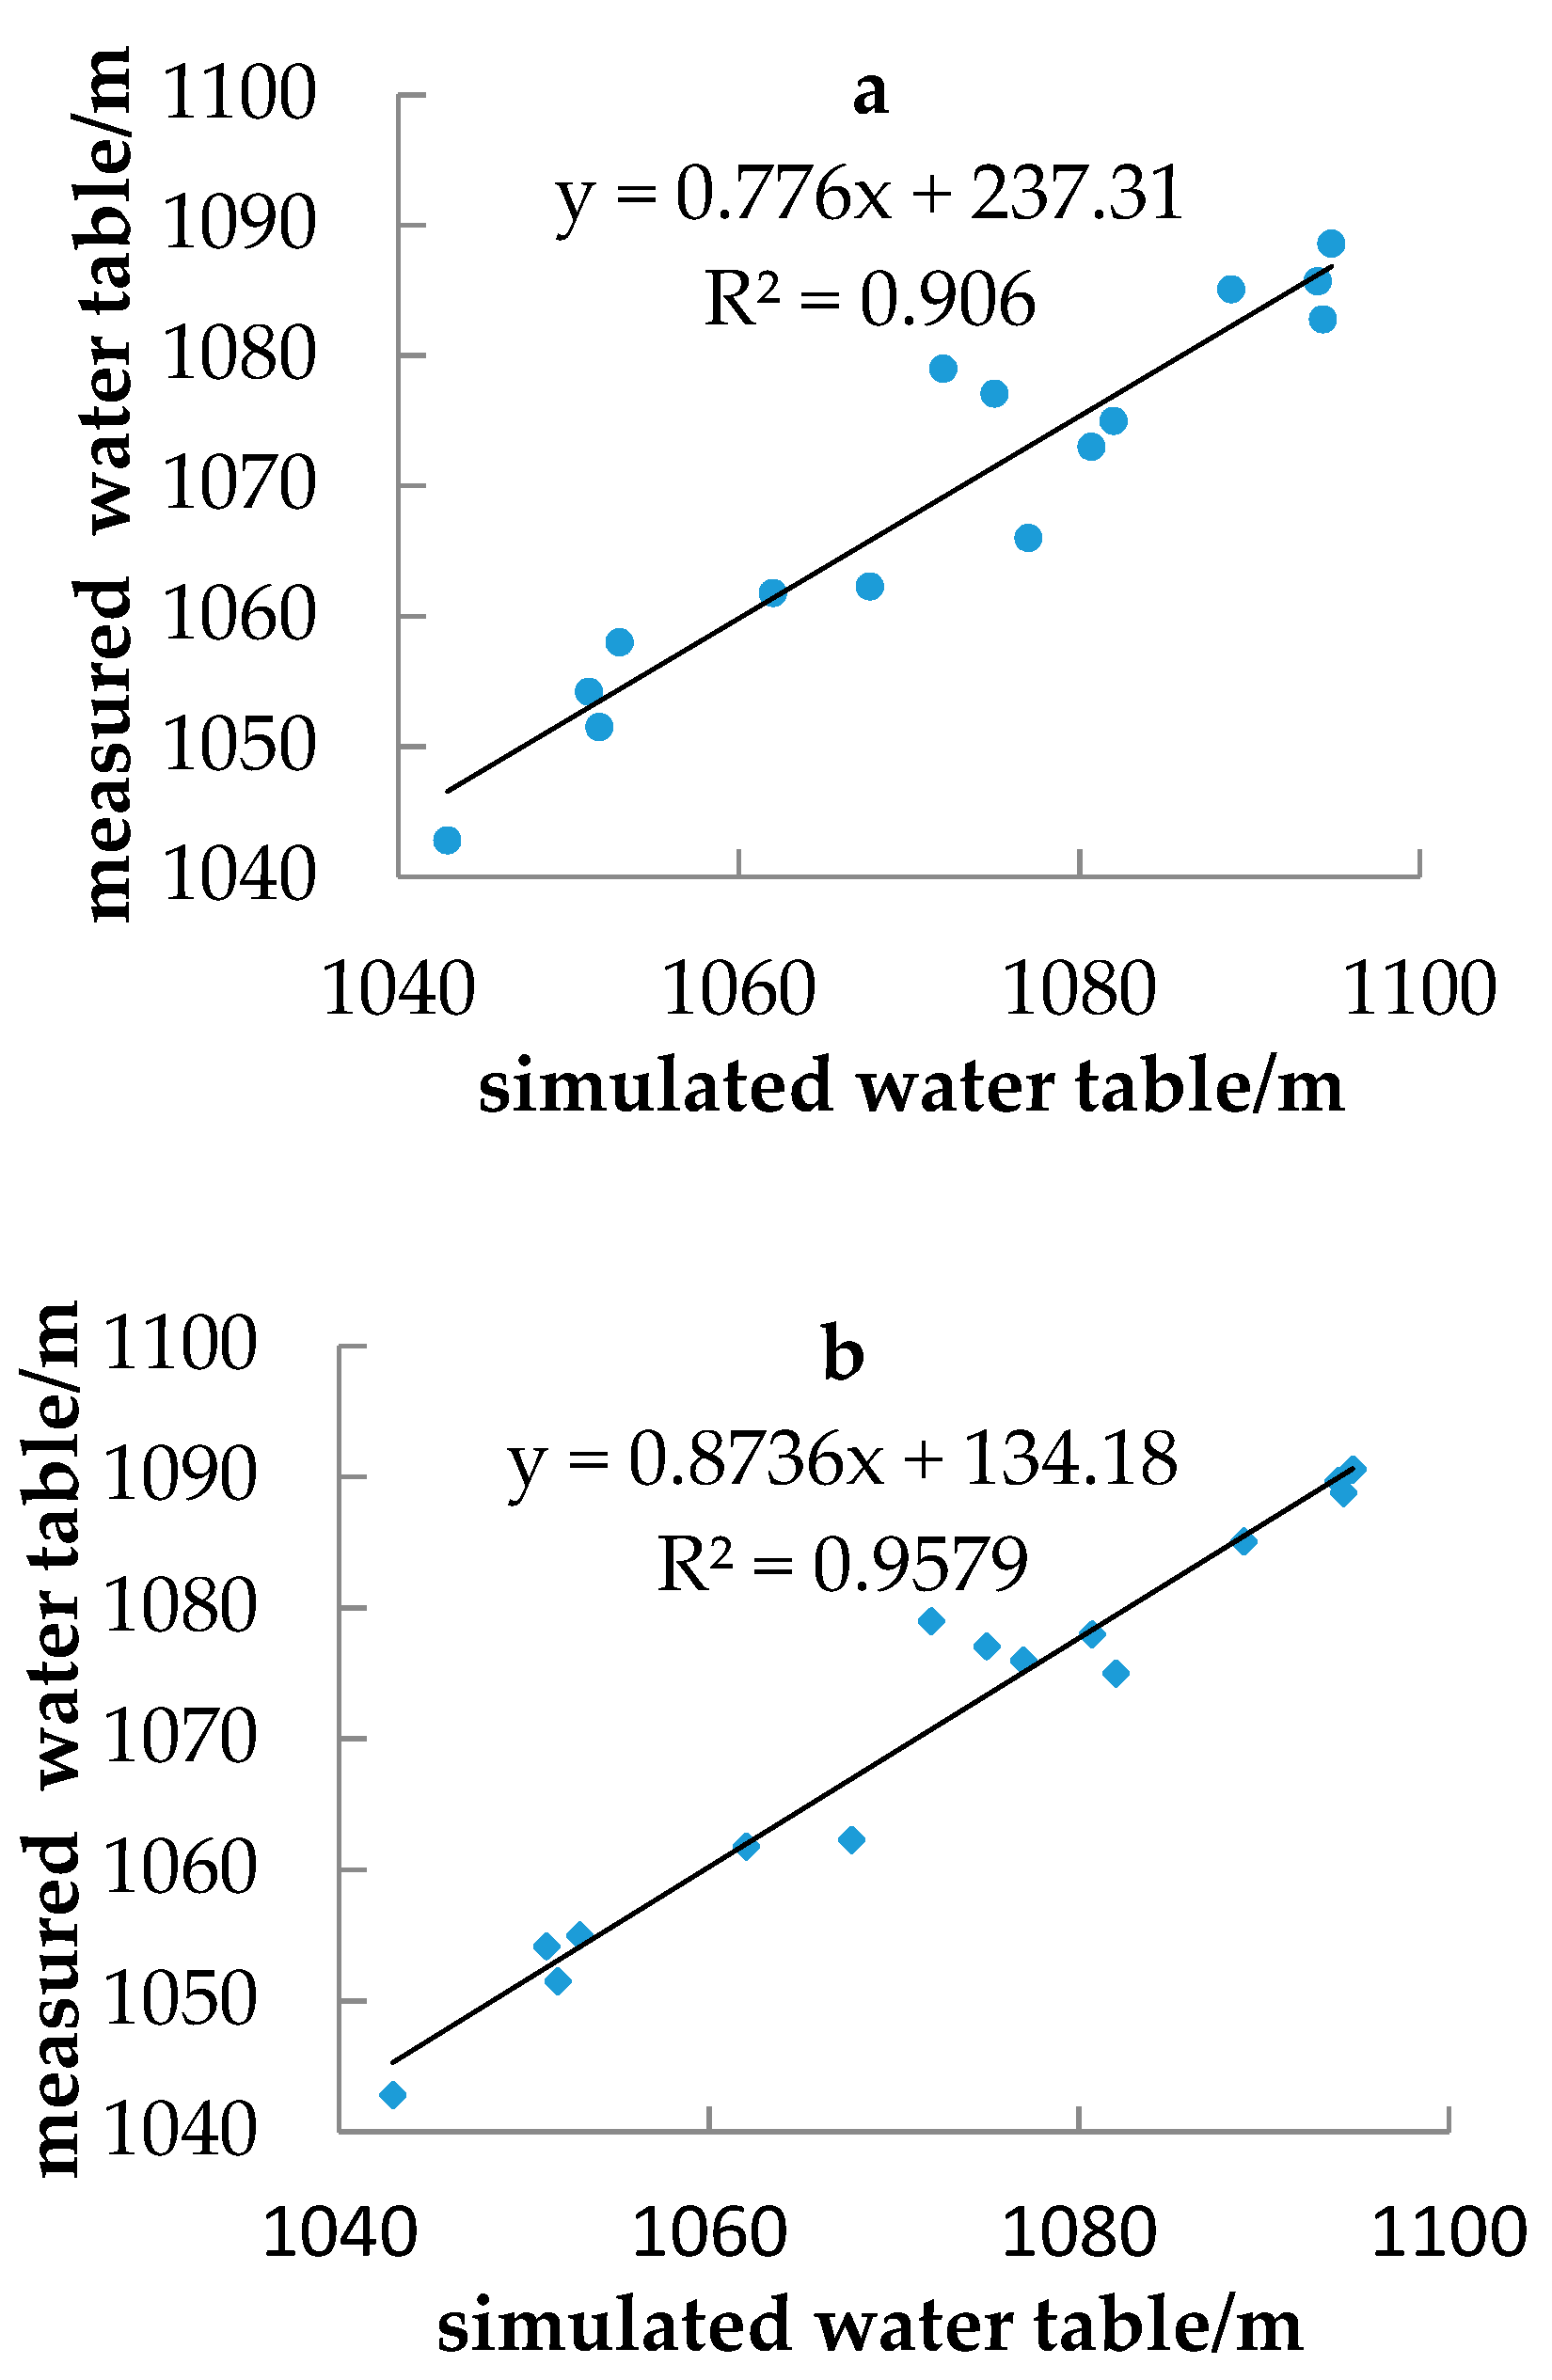
A groundwater model for a medium-sized basin is shown in Figure 9. The southeast region of the model is the Bosten Lake with a high level of phreatophytic plant life. The elevation data of all points, the pumping of the well and the water table of the monitoring well are obtained by field measurements. In the initial year of MODFLOW numerical simulation (2000), the mean groundwater level depth was 4.98 m, the cultivated land area was 16.56 × 10⁴ ha, and the efficient water-saving area (cultivated land that is mainly irrigated with groundwater using efficient water-saving irrigation technology) was 161 hm. The 15 observation wells in the basin and their calibration targets are shown in Figure 10. The distribution of observation wells in the whole basin is uneven, which cannot fully reflect the actual overall seepage field. Therefore, the simulation calibration is based on water level fitting, hydrologic budget fitting and the spatial distribution of the seepage field. The calibration and validation periods for this numerical model are 2000.1–2008.12 and 2009.1–2016.12, respectively, based on the existing actual observation data and the research results of Jiang, et al. [42]. The stress period is divided into 16 and the time step is days. The comparison between the SWAT-MODFLOW integrated model and the separate MODFLOW models of the four representative locations is shown in Figure 10. The simulated groundwater table of the integrated SWAT-MODFLOW model is closer to the measured value than the single MODFLOW model. As shown in Figure 11, good fit between simulated and actual values at 15 groundwater level observation wells, the correlation coefficient between measured and simulated values was greater than 0.95 in the SWAT-MODFLOW integrated model during the regular and verification periods.
4.3. Influence of Scale Groundwater Extraction on Lake
The grain pressure resulted from the apace growth of the population increases the cultivated land in China, so as the irrigation area extends, the groundwater is continuously exploited, especially in the arid plain irrigation area. The groundwater exploitation scenarios were simulated to assess the sensitivity of the lake wetland to the expanding area desired in the years to come. The pumping simulations reflect realistic scenarios of future exploitation. Five groundwater scenarios are simulated in the calibrated SWAT-MODFLOW model, that is, it is planned to increase the pumping in the lake wetlands by 1 × 10⁸ m3/year, 2 × 10⁸ m3/year, 4 × 10⁸ m3/year, 6 × 10⁸ m3/year, and 10 × 108 m3/year, respectively. The water balance tables for each groundwater extraction scenario are shown in Table 5. The model results definitely reveal and quantify the effects of water pressure and lake wetland water level. The table shows that evaporation is from 4.95 × 10⁸ m3 of water in the status quo year to 1.62 × 10⁸ m3 with the increase of extraction capacity; that is because the area where depth-to-groundwater exceeds 4.5 m slowly increases with the continuous extraction of groundwater, while the evaporation limit of the Yanqi Basin is 4.5 m deep. Meanwhile, in scenario 5, 0.62 ×10⁸ m3 of groundwater discharged into the lake wetland became −2.25 × 10⁸ m3, compared with the status quo year. The groundwater recharge from the rivers changed from 0.42 × 10⁸ m3 to 0.73 × 10⁸ m3; that means that the water circulation system is more vulnerable to damage as the effect of anthropogenic activities on water resources system increases. The water equilibrium of each scheme changes from −0.07 to −0.78 with the continuous increase of the extraction amount, and all of them are negative.
In the earlier period, Llamas [43] points out similar findings regarding groundwater exploitation impact on a wetland in Spanish national parks; that study analyzed the conflicts between wetland protection and groundwater abstraction in two Spanish national parks. In arid/semi-arid countries’ wetlands, the extractions of groundwater can generate intense variations in the wetlands associated with the aquifer from which it is pumped due to these countries commonly putting forward special requirements for groundwater used for agricultural purposes. A similar report was made by Zou et al. [21], who used the method of water balance to carry out a particular case research in the Qixing River National Nature Reserve wetland–farmland system in China. This work has shown that groundwater extraction for irrigation was approximately twice as high as the total infiltration recharge from wetlands and farmlands so as to aggravate the contradiction between water consumption of Qinling wetland and surrounding farmland. Finally, similar results were effectively highlighted by Schilling and Dinsmore, who contend that agricultural drainage systems have been the culprit in the transformation of wetlands into agriculture [44].
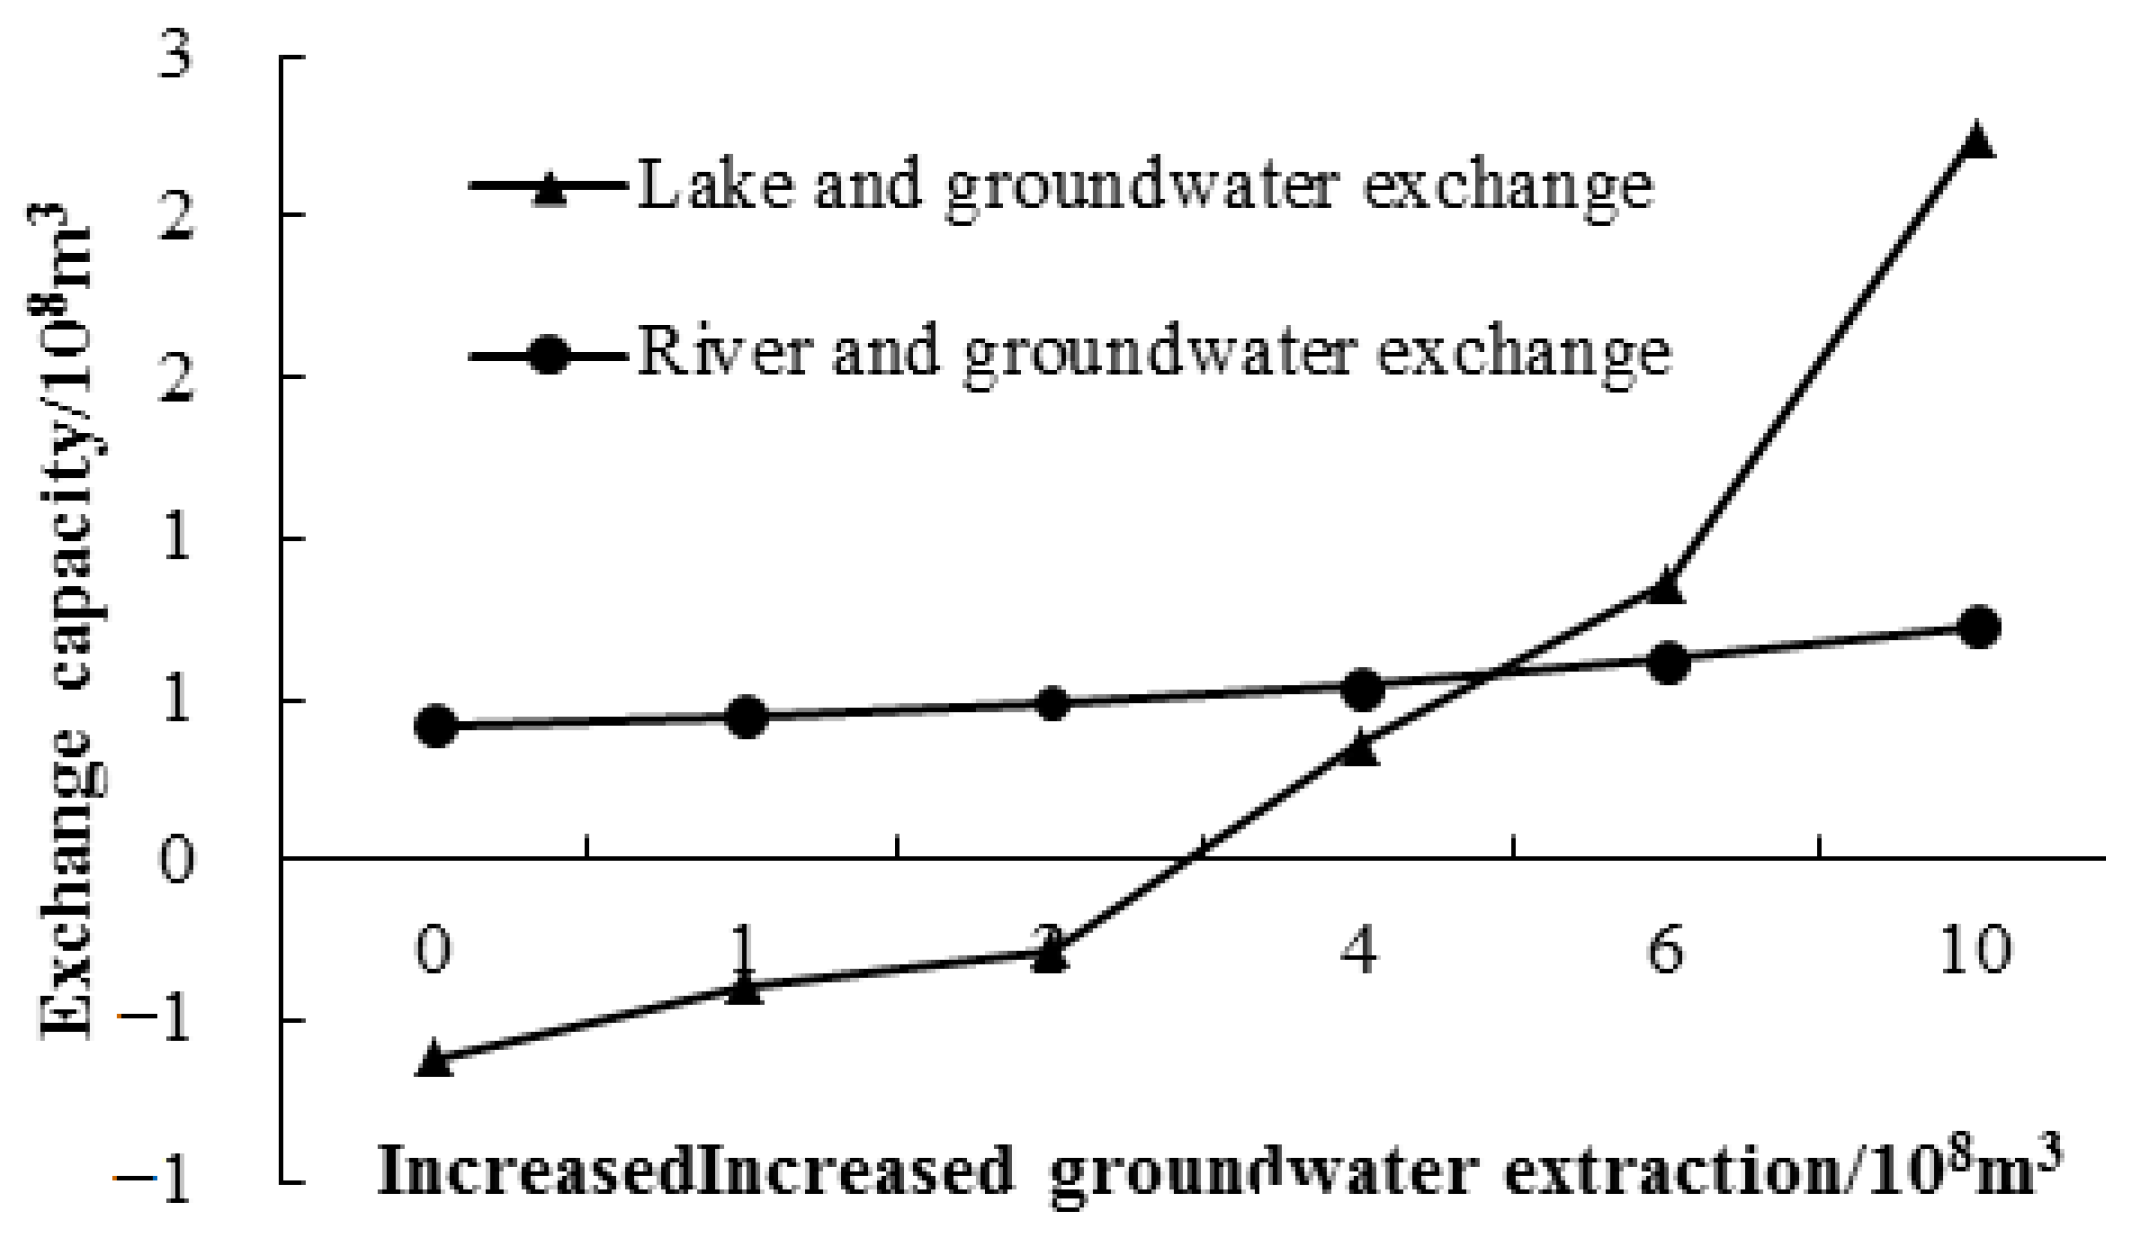
Due to the large amount of reclaimed land in the basin, the increase of irrigation area leads to a rise of the corresponding water diversion, resulting in the change of water level in Bosten Lake. The pressure on water resources may be deduced from the decreasing area and Bosten Lake level. The highest water table of Bosten Lake reached 1049.39 m in 2002 and dropped to 1045.06 m in 2013. Even though the Kaidu River has been in a rainy period in recent years, Bosten Lake still cannot return to its original water level. The main reasons are large-scale land development and diversion and uncontrolled agricultural irrigation. According to statistics, the irrigated area increased from 6700 ha in the 1950s to 19.09 × 10⁴ ha in 2013. The diversion of water in the agricultural irrigation area has reached more than 30% of the natural river inflow, which leads to the decrease of the runoff of the river, the decrease of the water level of the lake and a shrinking of the lake area. Subsequently, the water level of Lake Bosten has continued to rise since 2013, and it has gradually increased to 1047.24 m in 2016. This is mainly because on 12 December 2012, the State Council of China issued a strict water resources management system, which aimed to solve the problem of water shortage, serious water pollution and the worsening of the water ecological environment; it strictly controls the total amount of water used, comprehensively improves the efficiency of water use, and strictly controls the total amount of sewage discharged into rivers and lakes. The declining groundwater level trends observed at the observation-wells are also proof of heavy stress on the water resources within the basin, which also impacts interacting wetlands. The dynamics of the exchange of lakes and rivers with groundwater are shown in Figure 12. The slope of the lake groundwater exchange curve is steeper, which indicates that the lake groundwater exchange is more intense. Moreover, the amount of water entering the underground aquifer of the lake wetland gradually increases with the continuous increase of groundwater extraction. When the increased amount is 10 × 108 m3, the amount of water resupplying groundwater from the lake is 2.25 × 10⁸ m3, accounting for 13.43% of the total extraction amount. The water level of Bosten Lake decreased from 1047.2 m to 1045.9 m with the increase of extraction to 10 × 108 m3. This means that the lake area and water level will be greatly reduced as groundwater continues to be extracted in the future.
5. Conclusions
Lake wetlands extent is still undergoing rapid and continued decline worldwide, although wetlands provide a range of valuable ecosystem services, especially in arid/semi-arid areas. This study applies MODFLOW and SWAT-MODFLOW models to simulate groundwater levels in the Yanqi Basin, China, particularly taking into consideration the characteristics of a dry climate and a deep aquifer. We discovered that the latter’s performance was superior than the former’s performance. In the SWAT model, the sensitivity analysis and parameter calibration of several important parameters affecting runoff simulation results were implemented by using SWAT-CUP software, and the model was verified by using the measured runoff from 1991 to 2017. The results showed that: for the Yanqi Basin in Xinjiang, for long time scales of the simulation of runoff values, there was good agreement with the measured values. The model evaluation indexes NS and R2 were 0.71 and 0.95 in the calibrated period, and 0.83 and 0.88 during the validation period, respectively. Based on this, the groundwater recharge and evaporation calculated by the SWAT model are introduced into the MODFLOW model. The simulation results show that agricultural extraction activities will have a serious impact on the water quantity and level of the lake wetland. The amount of water discharged from lake wetland to underground aquifer increases by 37% to 463%, while groundwater extraction increases by 14.8% to 150%. Compared with the current year, the lake water level drops 1.3 m, and the groundwater exploitation increases by 10 × 108 m3/year. The quantifiable studies, such as this paper, are indispensable to incorporating groundwater-related wetlands and the groundwater systems on which they depend into the integrated water management decisions for the benefit of present and future generations. There are also concerns about the water quality deterioration of groundwater and surface water in the area. Therefore, we will focus on water quality and environment sustainability research in the future.
Author Contributions
M.J. and S.W. conceived this study. M.J. and S.X. undertook the establishment and calibration of model. M.J. wrote the manuscript. S.J. and M.J. discussed the data. S.J. improved the language. All authors have read and agreed to the published version of the manuscript.
Funding
The study was funded by special funds from basic scientific research operating fees of the central universities program (Grant No. lzujbky-2014-207) and special research projects in public welfare industries (agriculture) (Grant No. 201203006).
Acknowledgments
This work is supported by the Department of Hydrology and Water Resources, College of Resources and Environment, Lanzhou University, China. We thank anonymous reviewers for their constructive reviews of earlier drafts of our manuscript.
Conflicts of Interest
The authors declare no conflict of interest.
References
- Meng, B.; Liu, J.L.; Bao, K.; Sun, B. Water fluxes of Nenjiang river basin with ecological network analysis: Conflict and coordination between agricultural development and wetland restoration. J. Clean. Prod. 2019, 213, 933–943. [Google Scholar] [CrossRef]
- van der Kamp, G.; Hayashi, M. Groundwater-wetland ecosystem interaction in the semiarid glaciated plains of North America. Hydrogeol. J. 2009, 17, 203–214. [Google Scholar] [CrossRef]
- Stacke, T.; Hagemann, S. Development and evaluation of a global dynamical wetlands extent scheme. Hydrol. Earth Syst. Sci. 2012, 16, 2915–2933. [Google Scholar] [CrossRef] [Green Version]
- WWAP (United Nations World Water Assessment Programme)/UN-Water. The United Nations World Water Development Report; Nature-based Solutions for Water, UNESCO: Paris, France, 2018. [Google Scholar]
- Bailey, R.T.; Park, S.; Bieger, K.; Arnold, J.G.; Allen, P.M. Enhancing SWAT+ simulation of groundwater flow and groundwater-surface water interactions using MODFLOW routines. Environ. Model. Softw. 2020, 126, 1364–8152. [Google Scholar] [CrossRef]
- Sophocleous, M.A.; Koelliker, J.K.; Govindaraju, R.S.; Birdie, T.; Ramireddygari, S.R.; Perkins, S.P. Integrated numerical modeling for basin-wide water management: The case of the rattlesnake creek basin in south-central kansas. J. Hydrol. 1999, 214, 179–196. [Google Scholar] [CrossRef]
- Izady, A.; Davary, K.; Alizadeh, A.; Ziaei, A.N.; Brusseau, M.L. Groundwater conceptualization and modeling using distributed swat-based recharge for the semi-arid agricultural Neishaboor plain, Iran. Hydrogeol. J. 2014, 23, 47–68. [Google Scholar] [CrossRef]
- Ehtiat, M.; Jamshid Mousavi, S.; Srinivasan, R. Groundwater modeling under variable operating conditions using swat, modflow and mt3dms: A catchment scale approach to water resources management. Water Resour. Manag. 2018, 32, 1–19. [Google Scholar] [CrossRef]
- Beven, K. Topmodel: A critique. Hydrol. Process. 1997, 11, 1069–1085. [Google Scholar] [CrossRef]
- Mcdonald, M.G.; Harbaugh, A.W. A Modular Three-Dimensional Finite-Difference Ground-Water Flow Model; US Geological Survey Open-File Report; U.S. Geological Survey, National Center: Reston, VA, USA, 1984; p. 528. [Google Scholar]
- Dierrsch, H.J.G. Feflow Users Manual; Institute for Water Resources Planning and System Research Ltd.: Berlin, Germany, 1998. [Google Scholar]
- Reshmidevi, T.V.; Nagesh, K.D. Modelling the impact of extensive irrigation on the groundwater resources. Hydrol. Process. 2014, 28, 628–639. [Google Scholar] [CrossRef]
- Zhan, L.; Cui, Y.; Liang, G.; Liang, L.; Wang, X. Application of SWAT-MODFLOW coupling model in groundwater balance analysis. S-N Wat. Tra. Sci. Tech. 2020, 11, 1–15. (In Chinese) [Google Scholar]
- Dowlatabadi, S.; Ali Zomorodian, S.M. Conjunctive simulation of surface water and groundwater using SWAT and MODFLOW in Firoozabad watershed. KSCE J. Civ. Eng. 2016, 20, 485–496. [Google Scholar] [CrossRef]
- LABOLLE, E.M.; AHMED, A.A.; FOGG, G.E. Review of the integrated groundwater and surface-water model (IGSM). Groundwater 2003, 41, 238–246. [Google Scholar] [CrossRef] [PubMed]
- PANDAY, S.; HUYAKORN, P.S. A fully coupled physicallybased spatially-distributed model for evaluating surface flow. Adv. Water Resour. 2004, 27, 361–382. [Google Scholar] [CrossRef]
- Wang, Y.Y.; Chen, F.Z. Decomposition and phosphorus release from four different size fractions of Microcystis spp. taken from Lake Taihu, China. J. Environ. Sci. (China) 2008, 20, 891–896. [Google Scholar] [CrossRef]
- Aliyari, F.; Bailey, R.T.; Tasdighi, A.; André, D.; Arabi, M.; Zeiler, K. Coupled SWAT-MODFLOW model for large-scale mixed agro-urban river basins. Environ. Model. Softw. 2019, 115, 200–210. [Google Scholar] [CrossRef]
- Wang, S.; Wu, B.; Yang, P.; Li, X.; Dong, X. Reasonable definition of groundwater depth under Ecological Security in Oasis Irrigation District of Yanqi Basin. Resour. Sci. 2011, 33, 422–430. (In Chinese) [Google Scholar]
- Wang, S.; Wu, B.; Guo, Y. The land-use change and it ecosystem services value effects in Yanqi basin Oasis, Xinjiang. J. Arid Land Resour. Environ. 2012, 26, 138–143. (In Chinese) [Google Scholar]
- Zou, Y.; Duan, X.; Xue, Z.; Mingju, E.; Sun, M.; Lu, X.; Jiang, M.; Yu, X. Water use conflict between wetland and agriculture. J. Environ. Manag. 2018, 224, 140–146. [Google Scholar] [CrossRef]
- National Bureau of Statistics. National Data. 2019. Available online: http://data.stats.gov.cn/ (accessed on 28 May 2019).
- Qin, G.Q.; Dong, X.G.; Yang, P.N.; Wu, B.; Du, M.L. The Relationshp between the Decline of Groundwater Level sand Irrigated Agriculture on Yanqi. Chin. J. Rural Hydropower 2015, 4, 1–8. (In Chinese) [Google Scholar]
- Schot, P.P.; Wassen, M.J. Calcium concentrations in wetland groundwater in relation to water sources and soil conditions in the recharge area. J. Hydrol. 1993, 141, 197–217. [Google Scholar] [CrossRef] [Green Version]
- Harbor, J.M. A practical method for estimating the impact of land-use change on surface runoff, groundwater recharge and wetland hydrology. J. Am. Plan. Assoc. 1994, 62, 95–108. [Google Scholar] [CrossRef]
- Kamp, G.V.D.; Hayashi, M. The groundwater recharge function of small wetlands in the semi-arid northern prairies. Great Plains Res. 1998, 8, 39–56. [Google Scholar]
- Barbier, E.B.; Acharya, G. Valuing groundwater recharge through agricultural production in the hadejia-nguru wetlands in Northern Nigeria. Agric. Econ. 2015, 22, 247–259. [Google Scholar]
- Sophocleous, M. Two-way coupling of unsaturated-saturated flow by integrating the swat and modflow models with application in an irrigation district in arid region of west china. J. Arid Land 2011, 3, 164–173. [Google Scholar]
- Lerner, D.N.; Issar, A.S.; Simmers, I. Groundwater recharge: A guide to understanding and estimating natural recharge. J. Am. Plan. Assoc. 1994, 60, 95–108. [Google Scholar]
- Kim, N.W.; Chung, I.M.; Won, Y.S.; Arnold, J.G. Development and application of the integrated SWAT-MODFLOW model. J. Hydrol. 2008, 356, 1–16. [Google Scholar] [CrossRef]
- Bailey, R.; Rathjens, H.; Bieger, K.; Chaubey, I.; Jeffrey Arnold, J. SWATMOD-Prep: Graphical user interface for preparing coupled SWAT-MODFLOW Simulations. J. Am. Water Resour. Assoc. 2017, 53, 400–410. [Google Scholar] [CrossRef]
- Molina-Navarro, E.; Bailey, R.T.; Andersen, H.E.; Thodsen, H.; Nielsen, A.; Park, A.; Jensen, J.S.; Jensen, J.B.; Trolle, D. Comparison of abstraction scenarios simulated by SWAT and SWAT-MODFLOW. Hydrol. Sci. J. 2019, 64, 434–454. [Google Scholar] [CrossRef]
- Dai, J.F.; Cui, Y.L. Irrigation Hydrology and its Research Progress. Prog. Water Sci. 2008, 19, 294–299. (In Chinese) [Google Scholar]
- Arnold, J.G.; Srinivasan, R.; Muttiah, R.S.; Williams, J.R. Large area hydrologic modeling and assessment part I: Model development. J. Am. Water Resour. Assoc. 1998, 34, 73–89. [Google Scholar] [CrossRef]
- Monteith, J.L. The State and Movement of Water in Living Organisms, Cambridge University Press, Cambridge. Evaporation Environ. 1965, 19, 205–234. [Google Scholar]
- Priestley, C.H.B.; Taylor, R.J. On the assessment of surface heat flux and evaporation using large-scale parameters. Mon. Weather Rev. 1972, 100, 81. [Google Scholar] [CrossRef]
- Hargreaves, G.; Samani, Z.A. Reference crop evapotranspiration from temperature. Appl. Eng. Agric. 1985, 1, 96–99. [Google Scholar] [CrossRef]
- Chunn, D.; Faramarzi, M.; Smerdon, B.; Alessi, D.S. Application of an Integrated SWAT–MODFLOW Model to Evaluate Potential Impacts of Climate Change and Water Withdrawals on Groundwater–Surface Water Interactions in West-Central Alberta. Water 2019, 11, 110. [Google Scholar] [CrossRef] [Green Version]
- Abbaspour, K.C. User Manual for SWAT-CUP: SWAT Calibration and Uncertainty Analysis Programs; Swiss Fed. Inst. of Aquatic Science and Technology: Dübendorf, Switzerland, 2015; Volume 6, pp. 72–80. Available online: http://www.eawag.ch/organization/abteilungen/siam/software/swat/index_EN/ (accessed on 22 June 2019).
- Mofiasi, D.N.; Arnold, J.G.; VanLiew, M.W. Model evaluation guidelines for system aticquantification of accuracy in watershed simulations. Trans. ASABE 2007, 50, 885–900. [Google Scholar]
- Liu, L.; Xu, G.; Zhao, G.; Li, L.; Meng, H. Study on Inverse Evaluation of Parameters Based on Groundwater Numerical Modeling. Yellow River 2012, 34, 66–69. [Google Scholar]
- Jiang, H.; Yusufujjiang, R.; Rerilai, K.; Adilai, W. A Remote Seesing Method for Retrieving Groundwater Levelis using Soil Moitsure. Remote Sens. Inf. 2018, 33, 82–88. (In Chinese) [Google Scholar]
- Llamas, M.R. Conflicts between wetland conservation and groundwater exploitation: Two case histories in Spain. Environ. Geol. Water Sci. 1988, 11, 241–251. [Google Scholar] [CrossRef]
- Schilling, K.E.; Dinsmore, S. Monitoring the Wildlife, Hydrology and Water Quality of Drained Wetlands of the Des Moines Lobe, Northern Iowa: Introduction to Special Feature. Wetlands 2018, 38, 207. [Google Scholar] [CrossRef]
Figure 1.
Location map of the Yanqi Basin in China: (A) map of China, (B) map of the Xinjiang region, and (C) schematic of the modeled area. The altitude of the Yanqi Basin ranges from 1050 to 1200 m, and covers six major irrigation areas. The Yanqi Basin does not include upstream regions because there is no agricultural or other productive activity in the upstream areas.

Figure 2.
Change of cultivated land area in the study area (study area including the Yanqi County, Hejing County, Heshuo County, and Bohu County).
Figure 2.
Change of cultivated land area in the study area (study area including the Yanqi County, Hejing County, Heshuo County, and Bohu County).

Figure 3.
Schematic diagram of the integrated surface water and groundwater model, showing components of soil and water assessment tool (SWAT) (green) and modular three-dimensional finite difference groundwater model (MODFLOW) (red) simulations. Modified from Bailey, et al. [31].
Figure 3.
Schematic diagram of the integrated surface water and groundwater model, showing components of soil and water assessment tool (SWAT) (green) and modular three-dimensional finite difference groundwater model (MODFLOW) (red) simulations. Modified from Bailey, et al. [31].

Figure 4.
Diagram of the coupled SWAT/MODFLOW building process.

Figure 5.
Map of the sub-basin division based on irrigation unit; Bosten Lake is divided into two sub-basins.
Figure 5.
Map of the sub-basin division based on irrigation unit; Bosten Lake is divided into two sub-basins.

Figure 6.
Schematic diagram of the hydrological response unit (HRU)-cell coupling between SWAT and MODFLOW.
Figure 6.
Schematic diagram of the hydrological response unit (HRU)-cell coupling between SWAT and MODFLOW.

Figure 7.
Calibration and validation results for discharge at the Yanqi hydrometric station. The blue and red lines are the observation and the best simulation, respectively.
Figure 7.
Calibration and validation results for discharge at the Yanqi hydrometric station. The blue and red lines are the observation and the best simulation, respectively.

Figure 8.
Hydraulic conductivity distribution of numerical model.

Figure 9.
Diagram of model generalization and mesh generation. Drain is irrigation canals. The lateral boundary conditions are generalized as a general head boundary in the study area. The Bosten Lake is regarded as an equipotential body and treated as a change head boundary in the model.
Figure 9.
Diagram of model generalization and mesh generation. Drain is irrigation canals. The lateral boundary conditions are generalized as a general head boundary in the study area. The Bosten Lake is regarded as an equipotential body and treated as a change head boundary in the model.

Figure 10.
Water level dynamic fitting diagram (a,b,c and d represent the water level fitting diagrams of each representative observation wells respectively).
Figure 10.
Water level dynamic fitting diagram (a,b,c and d represent the water level fitting diagrams of each representative observation wells respectively).


Figure 11.
Regression analysis of simulated and measured annual mean groundwater level in MODFLOW (a) and SWAT-MODFLOW (b) models, respectively.
Figure 11.
Regression analysis of simulated and measured annual mean groundwater level in MODFLOW (a) and SWAT-MODFLOW (b) models, respectively.

Figure 12.
Dynamics of the exchange of lakes and rivers with groundwater.


Table 1.
Land use reclassification in the study area.
| Land Use Classes | Code in Model | Area (%) |
|---|---|---|
| Agricultural land | AGRL | 36.17 |
| Garden | ORCD | 3.46 |
| Forest-Semi dense | FRST | 15.25 |
| River bed | WATR | 18.41 |
| Urban or Built-up Land | UCOM | 2.00 |
| Barren Land | BARR | 20.57 |
| Wetland | WETL | 4.15 |
Table 2.
Irrigation data of the Yanqi Basin from 1955 to 2017.
| Irrigation Time (Day/Month) Spring Irrigation (30 January–10 May) Summer Irrigation (20 May–20 August) Winter Irrigation (20 October–5 February) | Irrigation Amount per Period Spring Irrigation: 96 mm Summer Irrigation: 180 mm Winter Irrigation: 98 mm | |
|---|---|---|
| Year | Well Irrigation% | Canal Irrigation% |
| 1955–1990 | 0 | 100 |
| 1991–2000 | 0.15 | 99.85 |
| 2001 | 2.91 | 97.09 |
| 2002 | 5.38 | 94.62 |
| 2003 | 7.61 | 92.39 |
| 2004 | 8.62 | 91.38 |
| 2005 | 8.45 | 91.55 |
| 2006 | 9.25 | 90.75 |
| 2007 | 9.29 | 90.71 |
| 2008 | 18.23 | 81.77 |
| 2009 | 27.31 | 72.69 |
| 2010 | 36.06 | 63.94 |
| 2011 | 42.44 | 57.56 |
| 2012–2017 | 46.7 | 53.3 |
Table 3.
Sensitivity ranking and statistics of SWAT parameters and initial and final calibrated values.
Table 3.
Sensitivity ranking and statistics of SWAT parameters and initial and final calibrated values.
| Parameter a | Physical Meaning | t-Value | p-Value | Initial Range | Final Range | Ranking |
|---|---|---|---|---|---|---|
| v__TRNSRCH.bsn | Reach transmission loss | −42.07 | 0.00 | [0, 1] | [0.24, 0.45] | 1 |
| v__CH_K2.rte | Channel effective hydraulic conductivity (mm/h) | −18.41 | 0.00 | [0, 70] | [18, 42] | 2 |
| v__CH_N2.rte | Main channel’s “n” value of Manning | −5.66 | 0.00 | [0, 1] | [0.12, 0.2] | 3 |
| v__GW_DELAY.gw | Delay time for aquifer recharge (days) | 4.62 | 0.00 | [0, 200] | [165, 180] | 4 |
| v__CO2.sub | Carbon dioxide concentration | 2.91 | 0.00 | [378, 800] | [450, 580] | 5 |
| v__GW_REVAP.gw | “Revap” coefficient | −2.74 | 0.01 | [0, 0.1] | [0.02, 0.07] | 6 |
| v__ESCO.hru | Soil evaporation compensation factor | 1.86 | 0.06 | [0, 1] | [0.3, 0.6] | 7 |
| v__ALPHA_BNK.rte | Baseflow alpha factor of bank storage | 1.82 | 0.07 | [0, 1.2] | [0.5, 0.8] | 8 |
| v__RCHRG_DP.gw | Aquifer percolation coefficient | 1.66 | 0.10 | [0, 0.6] | [0.2, 35] | 9 |
| v__GWQMN.gw | Threshold water level in shallow aquifer for baseflow (mm) | −1.58 | 0.11 | [0, 1800] | [1600, 1610] | 10 |
| r__SOL_BD().sol | Moist bulk density | 1.51 | 0.13 | [0.5, 2.3] | [0.6, 0.8] | 11 |
| r__CH_L1.sub | Longest tributary channel length in subbasin | −1.23 | 0.22 | [−0.2, 0.2] | [0, 0.1] | 12 |
| r__SOL_K().sol | Soil hydraulic conductivity (mm/h) | 1.17 | 0.24 | [1, 100] | [26, 38] | 13 |
| a__LAT_TTIME.hru | Lateral flow travel time | 1.10 | 0.27 | [0, 10.5] | [6, 7.5] | 14 |
| r__OV_N.hru | Overland flow’s “n” value of Manning flow | 0.91 | 0.36 | [0, 0.2] | [0.05, 0.15] | 15 |
| v__CNCOEF.bsn | Plant ET curve number coefficient | −0.75 | 0.46 | [0, 2] | [1.2, 1.7] | 16 |
| a__SLSOIL.hru | Slope length of lateral subsurface flow | 0.73 | 0.46 | [5, 10] | [6, 8.5] | 17 |
| v__DEP_IMP_BSN.bsn | Depth of aquifuge for modeling perched water levels | −0.73 | 0.46 | [−25, 0] | [−5.5, 0] | 18 |
| r__SOL_AWC().sol | Available water capacity | −0.52 | 0.60 | [0.03, 0.43] | [0.035, 0.3] | 19 |
| r__HRU_SLP.hru | Average slope steepness | −0.52 | 0.61 | [0, 0.2] | [0.1, 0.15] | 20 |
| r__SLSUBBSN.hru | Average slope length (m) | 0.36 | 0.72 | [0, 0.2] | [0.05, 0.1] | 21 |
| a__DEP_IMP.hru | Depth to aquifuge for modeling perched water levels | 0.32 | 0.75 | [0, 6000] | [0, 50] | 22 |
| v__ALPHA_BF.gw | Baseflow recession constant | −0.26 | 0.79 | [0, 1] | [0, 0.42] | 23 |
| v__SFTMP.bsn | Snow melt base temperature | 0.24 | 0.81 | [−1, 1] | [0, 0.55] | 24 |
| v__SURLAG.bsn | Surface runoff lag coefficient | −0.21 | 0.84 | [1, 10] | [2.6, 3.9] | 25 |
| r__CN2.mgt | Initial SCS CN II value | 0.19 | 0.20 | [15, 90] | [35.2, 53] | 26 |
| r__CH_S1.sub | Average slope of tributary channels | 0.19 | 0.85 | [−0.2, 0.2] | [−0.2, −0.1] | 27 |
| r__SOL_ZMX.sol | Maximum rooting depth for soil profile | −0.11 | 0.91 | [−0.5, 0.5] | [−0.15, 0.1] | 28 |
| v__CH_N1.sub | Tributary channels’ “n” value of Manning | −0.04 | 0.96 | [0.01, 30] | [1, 3.6] | 29 |
| a__SOL_Z().sol | Depth from soil surface to layer bottom | −0.03 | 0.98 | [−0.6, 0.5] | [0.26, 0.5] | 30 |
a v parameter value means substitute into realizing value or absolute change; a parameter value means added to some value; r parameter value means multiplied by a value (1 + a given value) or relative change [39].
Table 4.
Model performance statistics in periods of hydrologic calibration and validation.
| Observation Sites | Stage | Time | Monthly Runoff (m3/s) | p-Factor | r-Factor | R2 | NS |
|---|---|---|---|---|---|---|---|
| Yanqi | calibration periods | 1961–1990 | Observed 77.021 | 0.62 | 1.49 | 0.95 | 0.71 |
| Simulation 75.651 | |||||||
| validation periods | 1991–2007 | Observed 113.31 | 0.57 | 1.78 | 0.88 | 0.83 | |
| Simulation 105.28 |
Table 5.
Water balance and lake level for each scenario unit: 108 m3.
| Water Balance | Status Quo Year | Scenario 1 | Scenario 2 | Scenario 3 | Scenario 4 | Scenario 5 |
|---|---|---|---|---|---|---|
| Net flow from the lake to the aquifer | −0.62 | −0.39 | −0.28 | +0.36 | +0.86 | +2.25 |
| Groundwater extraction | −6.76 | −7.67 | −8.67 | −10.67 | −12.67 | −16.67 |
| Drains (irrigation canals) | −0.79 | −1.58 | −1.67 | −1.34 | −0.92 | −0.66 |
| Evaporation | −4.95 | −4.63 | −4.02 | −3.45 | −2.85 | −1.62 |
| Water exchange of River | +0.42 | +0.45 | +0.48 | +0.54 | +0.62 | +0.73 |
| Recharge | +8.13 | +8.25 | +8.31 | +8.35 | +8.43 | +8.51 |
| The recharge of lateral inflow | +4.64 | +5.53 | +5.72 | +5.86 | +6.08 | +6.68 |
| Water balance | +0.07 | −0.04 | −0.13 | −0.35 | −0.45 | −0.78 |
| Lake level (m) | 1047.2 | 1047 | 1046.8 | 1046.5 | 1046.2 | 1045.9 |
Note: “−” means water is discharged from an aquifer, and “+” means water enters an aquifer.
Publisher’s Note: MDPI stays neutral with regard to jurisdictional claims in published maps and institutional affiliations. |
© 2020 by the authors. Licensee MDPI, Basel, Switzerland. This article is an open access article distributed under the terms and conditions of the Creative Commons Attribution (CC BY) license (http://creativecommons.org/licenses/by/4.0/).
Share and Cite
MDPI and ACS Style
Jiang, M.; Xie, S.; Wang, S. Water Use Conflict and Coordination between Agricultural and Wetlands—A Case Study of Yanqi Basin. Water 2020, 12, 3225. https://0-doi-org.brum.beds.ac.uk/10.3390/w12113225
AMA Style
Jiang M, Xie S, Wang S. Water Use Conflict and Coordination between Agricultural and Wetlands—A Case Study of Yanqi Basin. Water. 2020; 12(11):3225. https://0-doi-org.brum.beds.ac.uk/10.3390/w12113225
Chicago/Turabian StyleJiang, Mengyao, Shuntao Xie, and Shuixian Wang. 2020. "Water Use Conflict and Coordination between Agricultural and Wetlands—A Case Study of Yanqi Basin" Water 12, no. 11: 3225. https://0-doi-org.brum.beds.ac.uk/10.3390/w12113225
Note that from the first issue of 2016, this journal uses article numbers instead of page numbers. See further details here.