Green Infrastructure as an Urban Heat Island Mitigation Strategy—A Review
by
 , , and
Fatma Balany
1, 
Anne WM Ng
1,2,* ,
,
Nitin Muttil
1,2,* ,
,
Shobha Muthukumaran
1,2 and
Man Sing Wong
3 1
College of Engineering and Science, Victoria University, P.O. Box 14428, Melbourne, VIC 8001, Australia
2
Institute for Sustainable Industries and Liveable Cities, Victoria University, P.O. Box 14428, Melbourne, VIC 8001, Australia
3
Department of Land Surveying and Geo-Informatics, The Hong Kong Polytechnic University, Hong Kong, China
*
Authors to whom correspondence should be addressed.
Water 2020, 12(12), 3577; https://0-doi-org.brum.beds.ac.uk/10.3390/w12123577
Submission received: 11 November 2020
/
Revised: 13 December 2020
/
Accepted: 16 December 2020
/
Published: 20 December 2020
(This article belongs to the Special Issue Urban Green and Blue Infrastructure: Current Issues, Challenges, and Opportunities)
Abstract
:Research on urban heat mitigation has been growing in recent years with many of the studies focusing on green infrastructure (GI) as a strategy to mitigate the adverse effects of an urban heat island (UHI). This paper aims at presenting a review of the range of findings from GI research for urban heat mitigation through a review of scientific articles published during the years 2009–2020. This research includes a review of the different types of GI and its contribution for urban heat mitigation and human thermal comfort. In addition to analysing different mitigation strategies, numerical simulation tools that are commonly used are also reviewed. It is seen that ENVI-met is one of the modelling tools that is considered as a reliable to simulate different mitigation strategies and hence has been widely used in the recent past. Considering its popularity in urban microclimate studies, this article also provides a review of ENVI-met simulation results that were reported in the reviewed papers. It was observed that the majority of the research was conducted on a limited spatial scale and focused on temperature and human thermal comfort.
1. Introduction
Urban heat island (UHI) has drawn considerable attention in recent years and is becoming a critical issue worldwide as cities rapidly develop. UHI itself is defined as a phenomenon where temperature in urban areas is higher than that in rural areas. The main cause of UHI is the modification of energy balance in urban areas. This is caused by several factors such as the substantial conversion of natural green areas to impervious surfaces as a consequence of rapid urban development as well as consequences of global climate change. The negative effect of UHI has been widely documented around the world. The UHI effect contributes to increasing energy consumption through cooling requirements [1,2,3,4], reducing air quality [5,6,7,8], morbidity and mortality effects due to heat stress [9,10,11], and increasing water demand [12]. Considering the potential harmful impacts of UHI on human lives, mitigation approaches are currently a major priority for researchers. Several studies have proposed, developed and implemented mitigation strategies such as: (1) the modification of a building and surface material [13,14], (2) the alteration of urban morphology [15,16], (3) the installation of irrigation systems [17] and (5) the inclusion of green infrastructure (GI) in the planning of cities [18,19,20]. In a broad term, GI is defined as an “interconnected network of green spaces that conserve natural systems and provides assorted benefits to human population” [21]. It includes both natural and designed greening—from parks and street trees to green roofs, gardens and green laneways. GI is recognized as a critical urban infrastructure which is equally important to transport networks. It is considered to include effective strategies in mitigating the adverse effects of UHI. GI regulates the microclimate (a local set of atmospheric conditions that differ from those in the surrounding areas) through shading and evapotranspiration. Shading reduces ambient air temperature by blocking solar radiation, thus restricting the increase in air temperature as well as ground surface temperature. Evapotranspiration refers to transpiration from plants and evaporation from water bodies and soils. The absorbed solar energy is converted into the latent heat of evaporation, thus the temperature of the surrounding area is cooled. Several studies have highlighted the role of vegetation in cooling air temperature in semiarid cities [22,23,24] and urban areas, such as inside and around buildings [25], urban parks [26,27,28], urban streets [29,30] and private landscapes [31]. The temperature reduction heavily depends on canopy covers [32,33] and the health status of vegetation [34,35]. The ability to reduce temperature is also emphasized by Muller [36] who found that vegetation reduces temperature rather than water surfaces. The benefit of GI to microclimate, however, varies by size, location and types of vegetation [37].
This paper presents a review of studies published during the years 2009–2020 that used GI as an UHI mitigation strategy. The review was carried out in two phases. The first phase involved identifying different GI strategies that have been used in the reviewed studies to mitigate the effect of UHI and to improve human thermal comfort (HTC). Various non-GI mitigation strategies such as the alteration of urban morphology (street orientation and aspect ratio) and the modification of surface and building materials are also common and included in many of the reviewed papers, hence this study will briefly discuss them as well. To analyse the performance of the mitigation strategies, modelling tools have been used in many of the reviewed studies. In the second phase of this review, commonly used modelling tools such as ENVI-met [38], TownScope [39], RayMan [40] and SOLWEIG [41] were reviewed. It was observed that the use of ENVI-met in microclimate studies has been increasing significantly during the last decade. Hence, ENVI-met was selected for a detailed review that analysed the current research trends in UHI mitigation studies that used ENVI-met.
The paper is organized as follows. Section 2 provides an overview of the reviewed papers. This is followed by a presentation of different GI-based UHI mitigation strategies in Section 3. Section 4 presents a review of the modelling software, with an emphasis on ENVI-met, its main characteristics and key results from the reviewed studies that used ENVI-met. Finally, conclusions and recommendations for future research are presented in Section 5.
2. Overview of Reviewed Papers
This study is based on a review of 75 scientific papers that were published during the years 2009–2020. All the reviewed papers have considered GI strategies to mitigate the effect of urban heat and several of them have also evaluated the effect of GI on improving HTC. The majority of the papers have been published in scientific, peer-reviewed international journals and few are also from international conference proceedings.
Reviewed papers were searched using a scientific bibliographic database, Google Scholar. The phrases “UHI mitigation, Green Infrastructure, urban greenery” were used as general key topics and the search was limited to the years 2009–2020. The phrases will enable us to retrieve the papers dealing with all mitigation measures to mitigate the effect of UHI. Only papers written in English were included and papers not written in English were removed. In addition, only peer-reviewed scientific journals and international conference proceedings were included and other official publication such as chapters of books, reports, thesis/dissertation were not included. The papers were classified according the types of mitigation measures. As indicated from the title, this paper focused on GI as mitigation measures. However, it was found that many of the papers were not merely dealing with GI as mitigation measures. Some of them also included a modification of urban structure such as material, aspect ratio, street orientation.
The main journals where the reviewed papers were published are presented in Figure 1.
As can be seen in Figure 1, the majority of the reviewed papers were published in the journals Sustainability (16% of reviewed papers), Building and Environment (13%), Sustainable Cities and Society (12%) and Landscape and Urban Planning (11%). Among academic scholars, the ranking of journals is considered important as it reflects the standing and repute of a journal within its field. In addition, journal rankings give information about the difficulty in publishing in a journal and the prestige associated with it. Several institutions have proposed databases that rank journals, such as the Scimago Journal Rankings (SJR), Journal Impact Factor rankings (Journal Citation Report) and Google Scholar Rankings. The SJR, for example, assigns different values to citations depending on the importance of the journal from where the citation comes from. This way, citations coming from important journals will be more valuable and hence will provide more prestige to the journals receiving them. Information regarding the ranking of journals of the reviewed studies based on SJR rankings are given in Table 1. It can be seen that the majority of reviewed papers come from highly ranked journals.
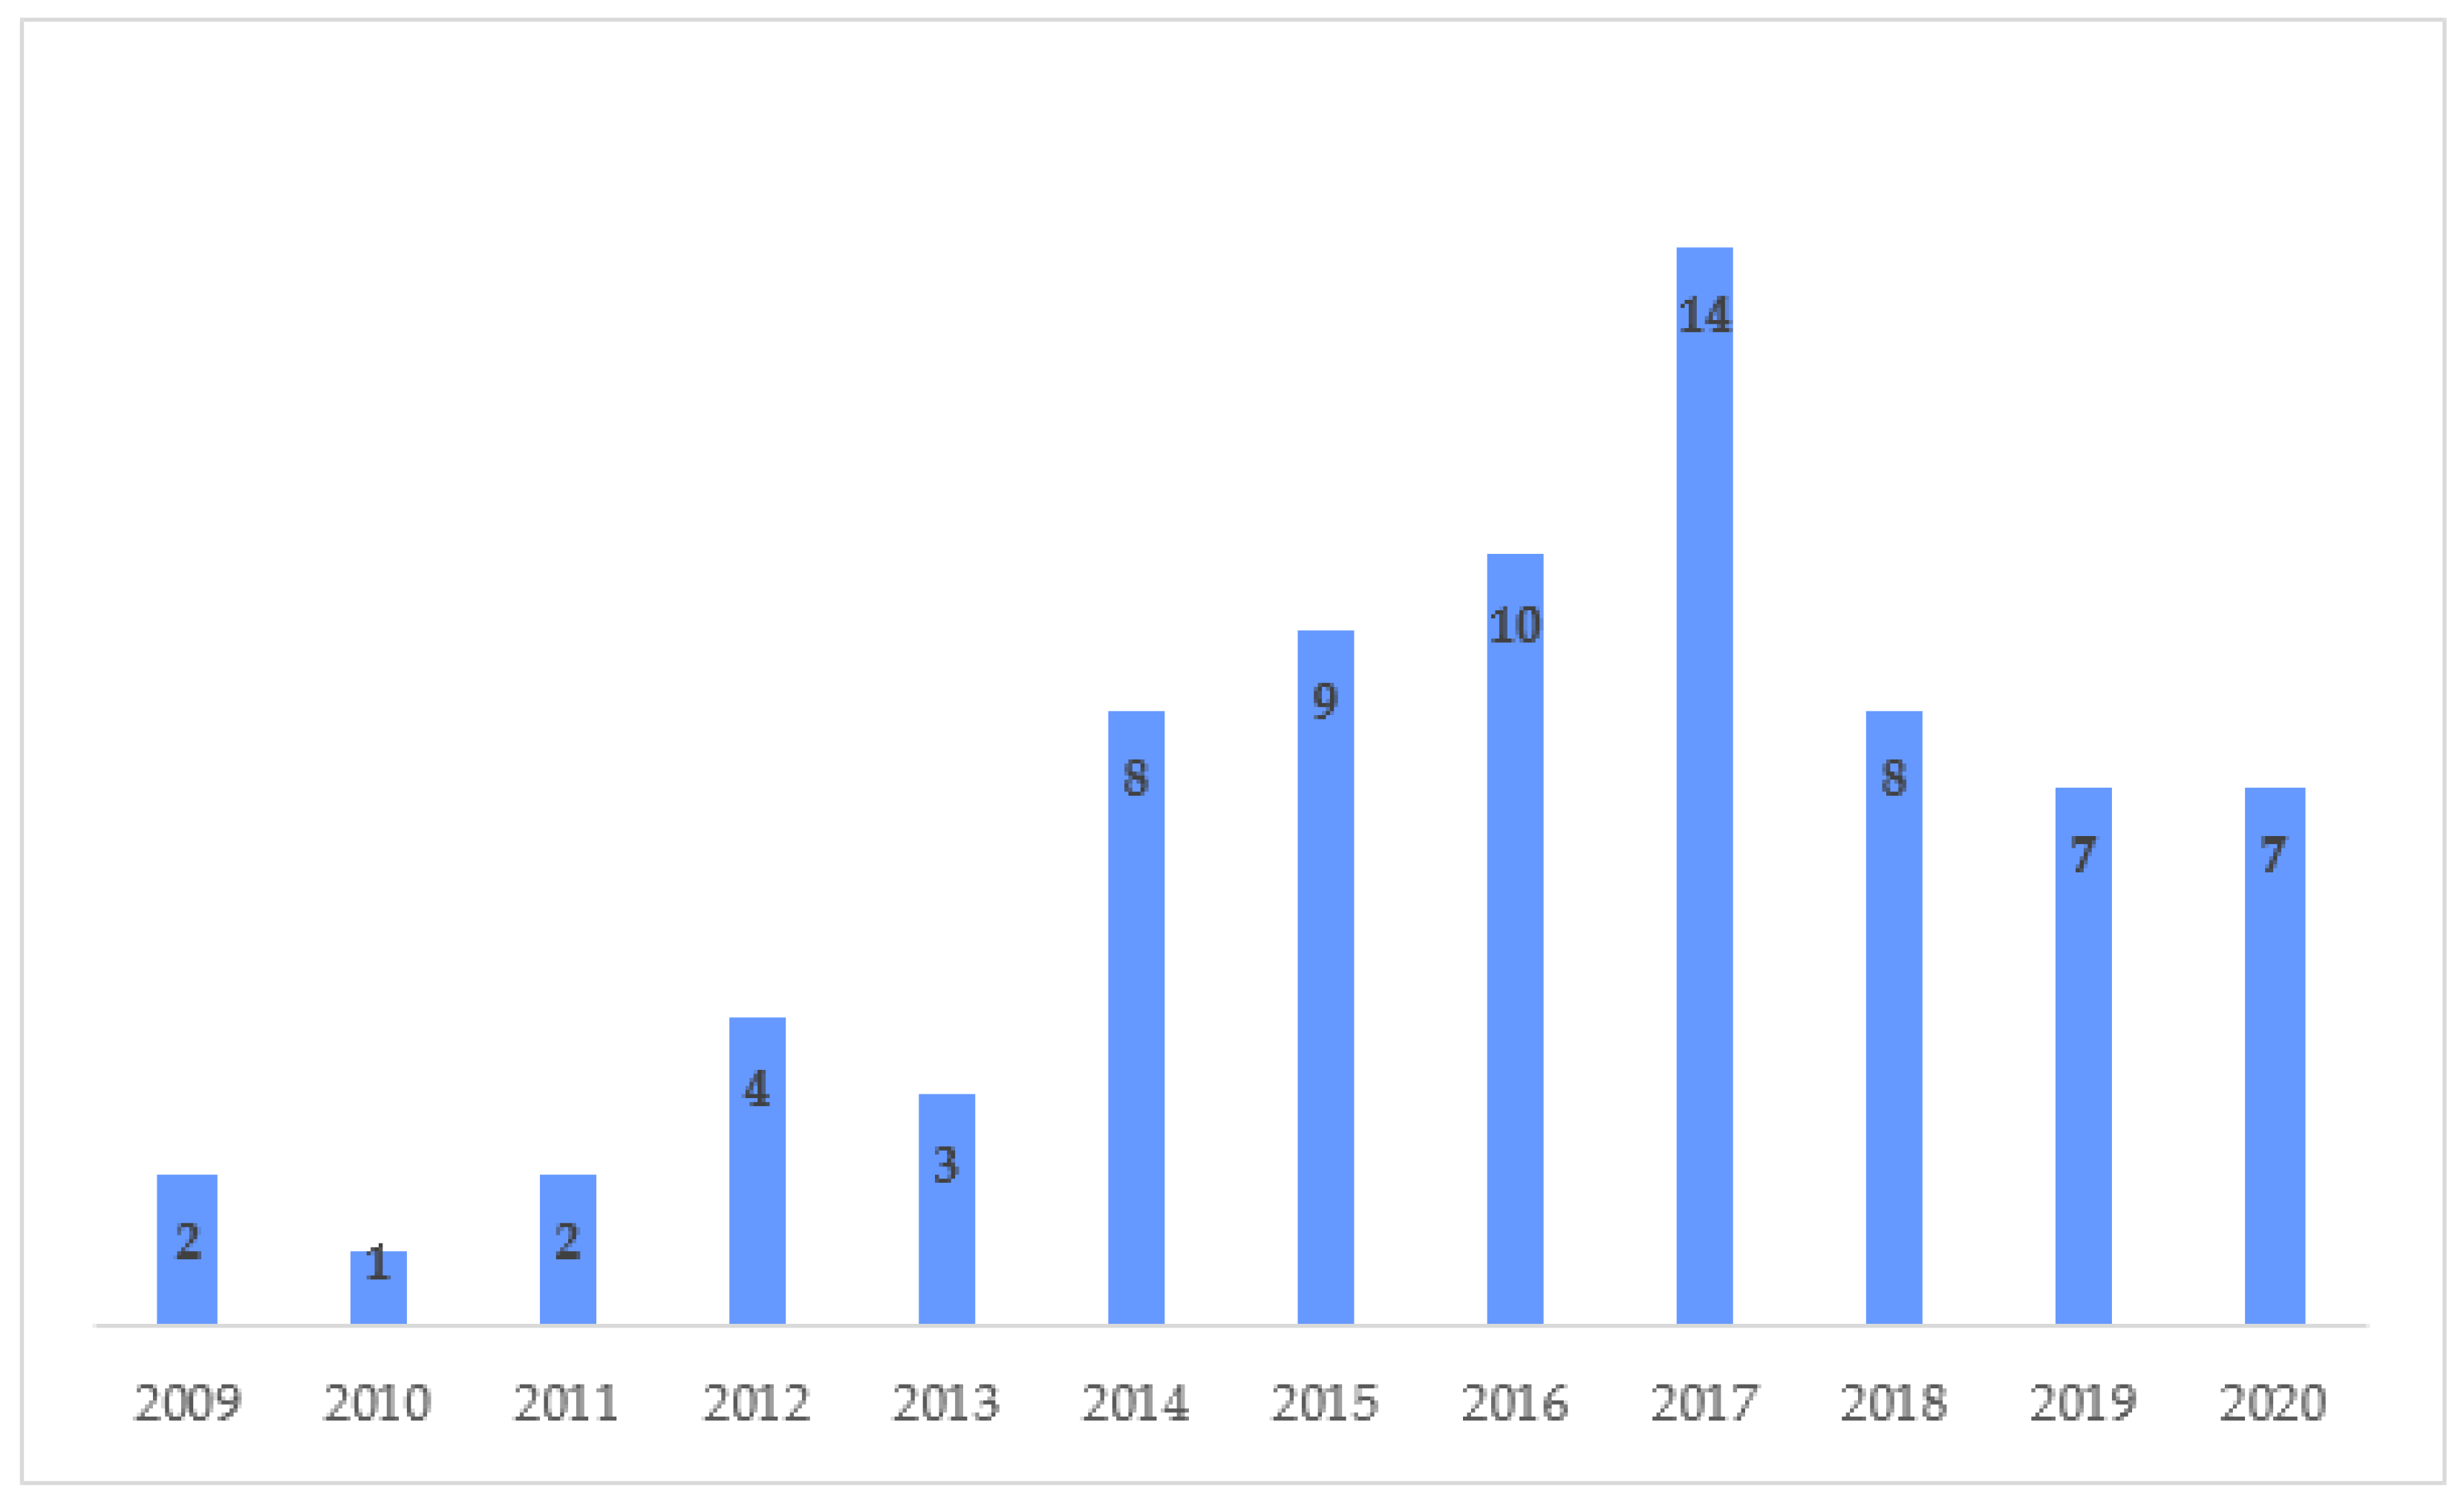
Figure 2 presents the distribution of reviewed papers by the year of publication. As can be seen, there has been a strongly increasing trend in the number of papers published since 2014, with the majority of studies being published during the last seven years.
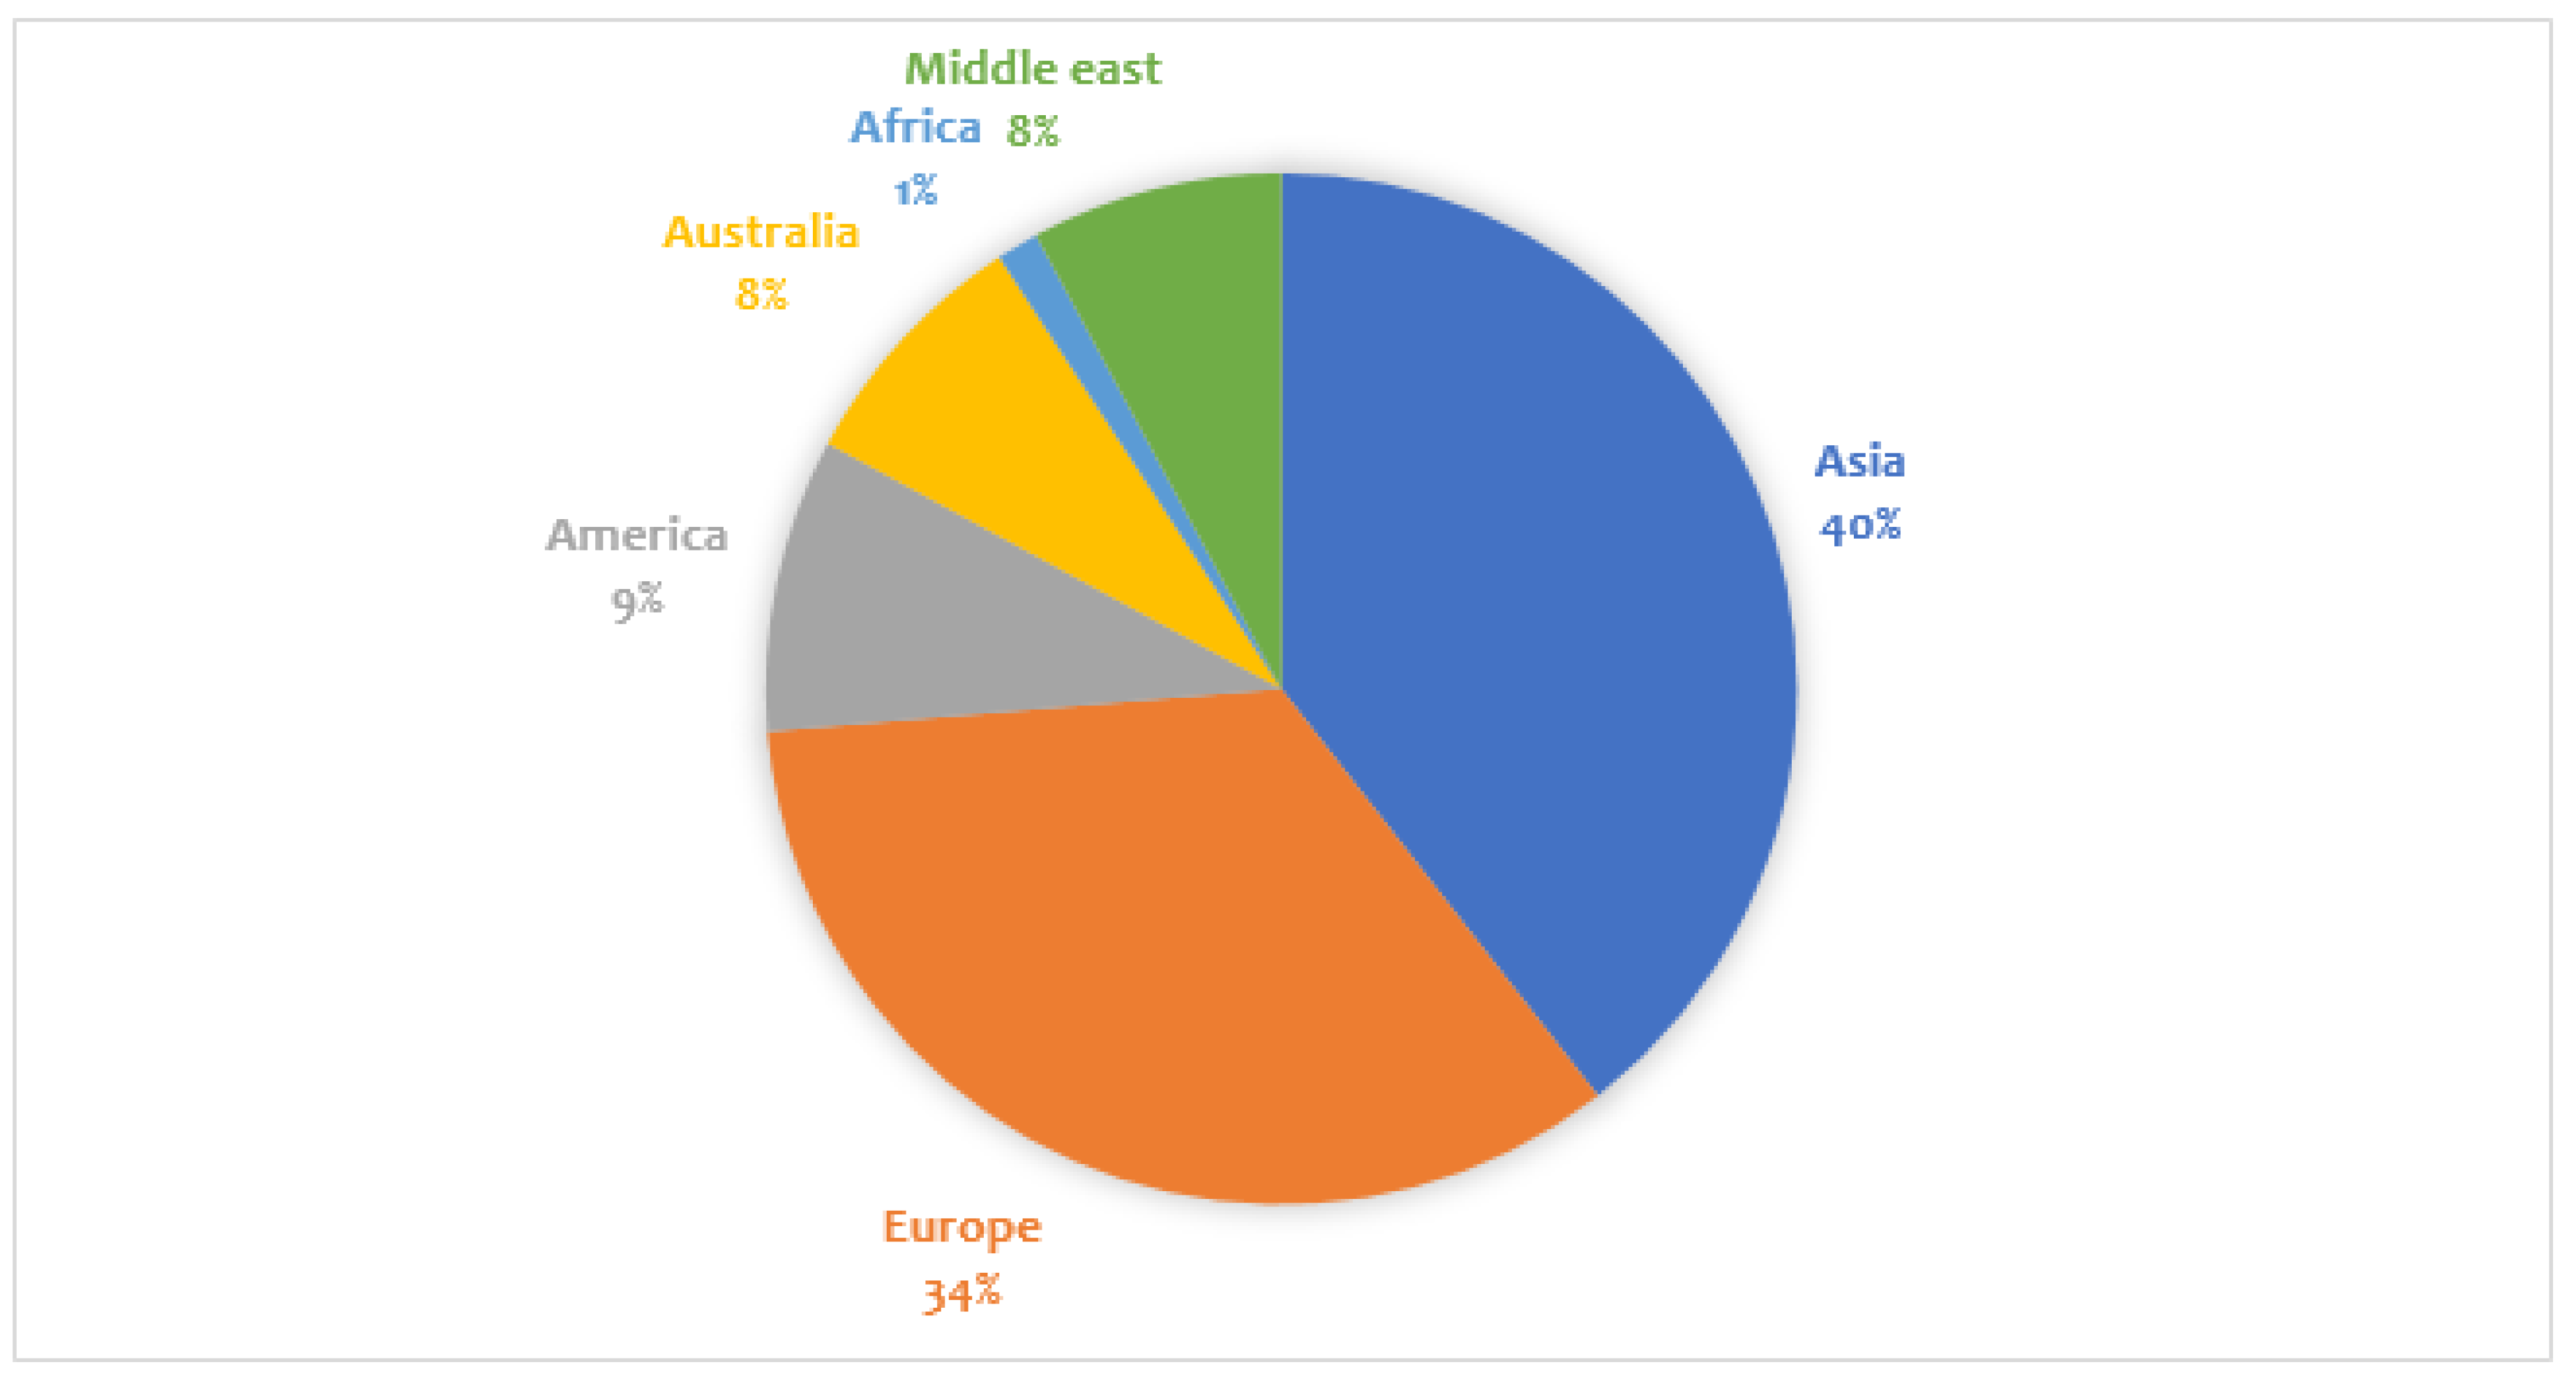
The reviewed papers are distributed across five continents and is presented in Figure 3. It can be seen from the figure that the majority of the studies have been conducted in Asia and Europe. In Asia, the majority of the studies were carried out in China, Hong Kong and South Korea. Some of the Asian studies, some also came from Sri Lanka and Southeast Asian countries such as Singapore, Malaysia and Indonesia. In Europe, Germany and Italy had the most papers and studies in Scandinavian countries were rarely encountered. A combination of UHI and heatwave has become a significant issue in Australia, especially in a semi-arid city like Melbourne [42]. Hence, papers reviewed in Australia were dominated by the city of Melbourne [42,43,44]. Among all continents, Africa had the fewest number of the reviewed papers [45]. The lack of UHI research in Africa may be caused by the notion that Africa is the least urbanized continent and hence such research may be given less importance. The existence of UHI seems to be a dominant factor in the choice of research location. It is widely known that the UHI phenomenon occurs in cities as a result of urbanization, which is most likely triggered by industrialization and people migrating to towns and cities. Most aforementioned urban areas have been showing an increasing trend of UHI phenomenon [46,47,48,49]. For example, Hong Kong has been identified as one of the intensely urbanized areas in the world that suffers from a strong UHI effect [50,51]. In addition, many cities in Europe experience UHI with the colder cities tending to be more affected by heatwaves than the warmer cities [52]. In addition, most UHI studies are conducted in cities due to the availability of research facilities.
3. UHI Mitigation Strategies
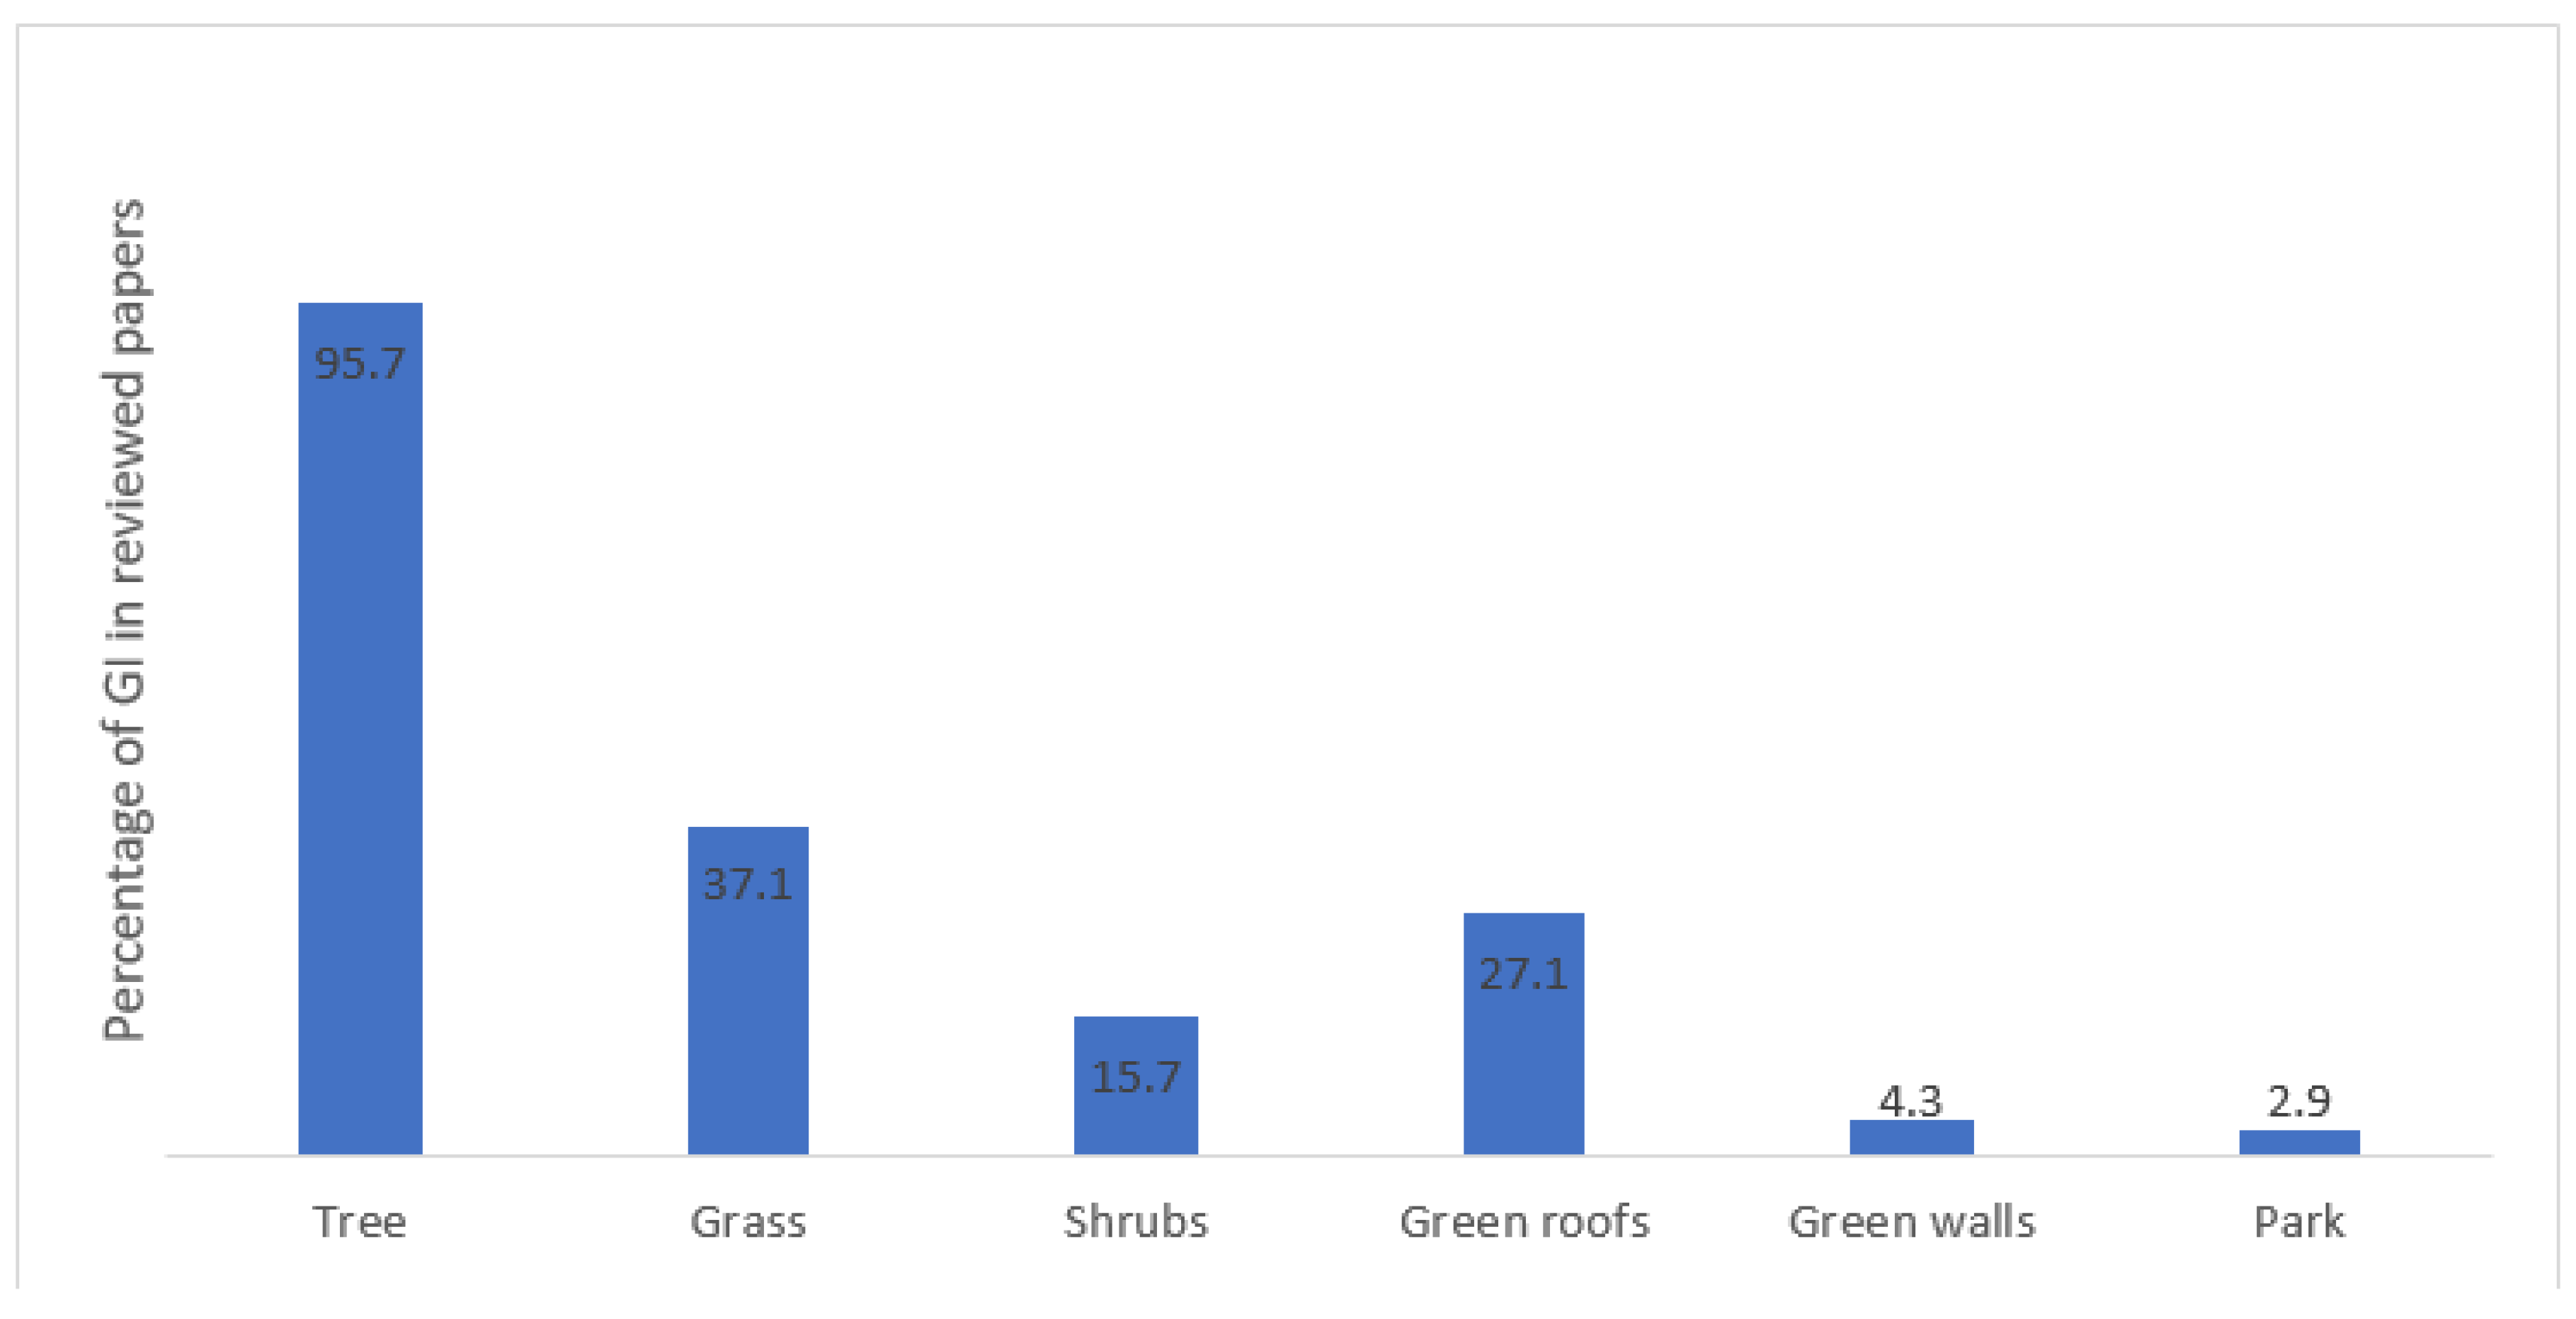
GI is increasingly considered as an essential strategy for UHI mitigation. Vegetation in GI regulates the microclimate through evapotranspiration from plant foliage and shading of the surfaces and it positively influences human thermal comfort. The majority of reviewed papers proposed a multiple GI strategy as a way to reduce temperature and only a few of them dealt with a single GI strategy. Several studies showed that the combination of multiple GI strategies gives the best result towards improving microclimate and thermal comfort [24,53,61], whereas ‘no greening’ at all was used as the worst strategy [19]. The different types of GI included trees, grass, shrubs, greening on buildings (green roof and green walls) and parks. Although urban forests exist in some countries, very few studies dealing with such forests were found in this review. The percentage of different types of GI considered in the reviewed papers are given in Figure 4. As can be seen, trees are the most used GI strategy in the research, following by grass and green roofs. Each of the reviewed GIs is discussed in detail in the following sub-sections. In addition, a summary of the reviewed papers is presented on Table 3.
3.1. Trees
Trees are the most common GI strategy in the reviewed papers, where 95.7% of the papers examined the cooling effect of trees. Most studies found that the ability of trees to reduce temperature as well as improve human thermal comfort is consistent. Trees canopies provide shade and thus reduce the direct solar radiation. Through evapotranspiration, trees release vapor to the atmosphere and thus increase relative humidity, decreasing temperature and eventually improve the thermal comfort condition. The quantity of trees planted influences the level of temperature reduction, although more trees does not necessary lead to a lower thermal comfort level. A study in Manchester [19] found that increasing 5% of mature deciduous trees can reduce the temperature by 1 °C. Ng et al. [42] suggested tree coverage for at least 1/3 of the total area, which is needed to reduce by 1 °C temperature. The addition of trees was also reported to reduce air temperature by around 0.35–0.6 °C [14], 1 °C [19], 0.2 °C [62], 0.30–1.5 °C [63], 2.27 °C [58], 1.87 °C [53], 1.49 °C [64]. These results are consistent with the conclusion from previous literature reviews [65,66] which showed that the addition of trees and hedges in an urban area may reduce the peak ambient temperature ranging between 0.2 and 5.0 °C, with the median reduction being close to 1 °C.
Human thermal comfort is also enhanced by increasing tree quantity [45,60,67,68]. A study in Dar es Salaam, Tanzania, showed that the physiological equivalent temperature (PET) can be reduced by up to 14 °C in the spots where the trees are added and it is reduced by an average of 4 °C in the overall area [45]. Similarly, providing trees in streets led to a decrease in PET by up to 10 °C in Guayaquil, Ecuador [69]. Greenery in high density areas can lead to a PET reduction of 2.2–3.4 °C, while in open setting areas it can reduce PET by 1.5 °C. Another study found that the thermal comfort index of the predicted mean vote (PMV) around buildings can reach over 3.5 (very hot) while for an area surrounded by trees, the PMV can decrease even to 0.0 (comfortable) [60].
Although the species of tree affects its cooling effect [70], only a few of the reviewed studies discussed the impact of tree species on microclimate and human thermal comfort. The ability of trees to improve thermal comfort is highly associated with their canopies. A study by Kong et al. [67] investigated the impact of 12 species of trees on thermal comfort condition in a high-density area. It was found that large crown and dense canopy trees can effectively reduce the mean radiant temperature (MRT) [71], which will eventually improve the thermal comfort condition. Moreover, sparse leaves have a better cooling ability compared to scattered leaves. In addition to the canopy, tree position also matters in decreasing temperature and improving the level of thermal comfort [72] as the arrangement of the trees leads to sensible heat reduction and temperature variation [20,73]. Trees planted in high density areas are more effective in improving the level of the comfort than those planted in open spaces as well as trees planted at windward side [72].
Even though trees bring positive impact to microclimate and thermal comfort, trees can also act as barriers and decrease wind speed which is common for trees with height between 5 and 15 m [74]. As the wind speed is decreasing, the level of heat stress will increase especially at a pedestrian level [37,45]. The increased wind speed is needed as it can offset the impact of elevated air temperature. Trees also have the potential to increase pollutant concentration [60] as their leaves and branches’ slow the air current and cause the pollutant to settle.
3.2. Grass
As much as 37.1% of the reviewed studies incorporated grass as their UHI mitigation strategy. Grass is capable of cooling surfaces and thus helping mitigate hot temperature. However, compared to trees, grass only has a little effect upon the decreasing air temperature and improving HTC. The studies showed that the application of the grass led to a varied result depending on the location. Ng et al. [75] found that grass on the ground is not as effective as grass on the roof top towards improving the microclimate. This result is emphasized by Lee et al. [76], who examined the effectiveness of grass on mitigating heat stress and concluded that trees are more effective in mitigating human heat stress than grass. In term of thermal comfort, some studies have found a maximum PET reduction of 4 °C [61], and 3.90 °C [36] by applying grass.
A combination of grass and other GI may yield a better result in improving microclimate as well as thermal comfort. Despite the limited number of corresponding studies, some preliminary conclusions can be drawn. The studies showed that the combination trees and grass reduced ambient temperature up to 2 °C [24], 2.29 °C [58]. In terms of thermal comfort, Lobaccaro et al. [61] found that the maximum improvement can be achieve up to 10 °C PET.
Another study indicated that the combination of trees, grass, and shrubs is more effective in reducing air temperature (Ta), MRT, PMV at the street level than the application of green roofs. The capability of grass in improving thermal comfort in winter is also shown by Afshar et al. [77]. Unlike many results that prove the ability of grass in reducing temperature, this study found that applying a larger percentage of deciduous trees and grass in a park design will increase temperature and eventually improve thermal comfort in winter time.
3.3. Shrubs
Shrubs can be distinguished from trees by their stem and height. Woody plants that are less than 6 m high are normally categorized as shrubs, while trees are over 6 m in height. Shrubs usually have multiple stems arising at or near the base without a main trunk. Several reviewed studies have examined the cooling effect of shrubs. Most of the studies indicated that applying shrubs results in moderate temperature reduction. In some cases, shrubs only bring a very small improvement in the microclimate. A study by Rui et al. [59] found that a reduction in the quantity of grass and shrubs, replaced by trees, had little impact on the improvement of the microclimate. However, shrubs are found to be capable of reducing soil surface temperature. Edmondson et al. [78] showed that a combination of trees and shrubs in the non-domestic greenspace reduced mean maximum daily soil surface temperatures in the summer by 5.7 °C compared to herbaceous vegetation. Skelhorn et al. [19] found that an additional 5% of green area cover by shrubs or new trees reduced the surface temperature by approximately 0.5 °C. Although the performance of shrubs in reducing temperature has been observed, trees seem more effective in doing it. This is because the shading effect of trees is greater than that of shrubs.
3.4. Green Roofs
Green roofs are often indicated as the most suitable GI implemented in urban areas where open spaces are limited [79]. There are two types of green roofs: intensive and extensive green roofs. Intensive green roofs have a deep soil layer which allows the roofs to accommodate large plants, although it has a large weight loading. This type of roof requires a significant amount of irrigation and maintenance. On the other hand, extensive green roofs or eco-roofs only have a shallow soil layer. Such roofs require little or no irrigation and low maintenance. As they have a thin soil layer, the plant choices are limited. As roofs constitute approximately 20–25% of the urban surface [80], the conversion from conventional roofs to green roofs has the potential to bring benefits on a large scale.
The cooling potential of green roofs was often considered inconsistent and was found to be much lower than that of trees. The cooling potential of extensive green roofs is considered higher than intensive ones [81]. Some studies have highlighted the benefits of green roofs, such as reducing temperature, which in turn reduces the cooling demand of buildings in the summer [82], contributing to air quality improvement [83,84], enhancing the energy performance of buildings [54] and reducing stormwater runoff [85,86]. Razzaghmanesh et al. reported a reduction of 0.06 °C surface temperature by covering 30% of the total area with green roof [82]. In addition, air temperature was also found to decrease by 1.76–1.79 °C due to the application of green roofs [53] and the reduction was higher by 1.90 °C if the green roof was combined with trees and green walls. Another study by Kim showed that the temperature reduction was only by 0.3 °C with the installation of an intensive green roof [87]. Tsoka et al. [66] concluded that the maximum air temperature reduction in a green roof was between 0.1 °C and 1.7 °C, with the median value of reduction being close to 0.3 °C.
Other studies, however, indicated that green roofs give a very low improvement or even no improve to the level of thermal comfort, especially at the pedestrian level. PET reduction has been reported as 0.13–1°C [61] while Imran et al. [42] reported a universal thermal comfort index (UTCI) reduction by a maximum of 1.5 °C for green roofs. This number is far lower than that for cool roofs, which reached an 8 °C reduction in the UTCI. A study [88] showed that increasing the building height and adding the tree canopy improved the PET, yet implementing the green rooftop did not give the same result. A similar study in Hong Kong [75], indicated that implementing green roof on high buildings is not effective for the improvement of human thermal comfort at a pedestrian level.
3.5. Green Walls
Green walls are often referred to as ‘living walls’, ‘bio-walls’ or ‘vertical gardens’. These types of walls are comprised of plants grown in supported vertical systems that are commonly attached to an internal or external wall. In some cases, green walls can be freestanding. Like many green roofs, green walls incorporate vegetation, growing medium, irrigation and drainage into a single system. Some benefits of green walls include providing an attractive design feature and adding to building insulation by providing the direct shading of the wall surface. They create a cooler microclimate and improve local air quality, and provide the possibility of growing plants in locations that would not normally support vegetation. A wide range of plants are used for green walls, which usually include herbaceous and some small shrubs. There are relatively few studies (among the reviewed papers) that incorporate green walls as part of their UHI mitigation strategies. Herath et al. [53] implemented green walls as an UHI mitigation strategy in Sri Lanka and found that the addition of 50% green walls in the target area will result in a temperature reduction of up to 1.86 °C. Meanwhile, the maximum temperature reduction of 8.4 °C in the humid climate of Hong Kong with the use of vertical greenery systems was reported in an urban canyon [89]. However, since the number of available studies is few, it is then not sufficient to draw a concrete conclusion regarding cooling ability of green walls.
3.6. Parks
Urban parks often have a cooler temperature than their surrounding area. Research by Yu and Hien [90] indicated that parks have a cooling impact not only in the vegetated areas, but also in the surrounding built environment (although the impact is limited by the distance). Similar research was conducted by Hwang et al. [91], who investigated the thermal performance of 10 urban parks in Singapore. They found that the air temperature in the parks was 7.7–12 °C cooler than that of the surrounding areas. Factors influencing the cooling effect of the parks included parameters such as tree canopy and the spatial arrangement of the parks. Lin and Lin [18] conducted computer simulations to investigate the influence of eight spatial arrangement of parks on temperature reduction. The result indicated that a larger total park area, an evenly distributed park and a greater park diversity showed significant temperature reduction.
3.7. Other Mitigation Strategies
Some mitigation measures other than GI that were commonly used included the modification of urban material, aspect ratio (AR) and street orientation. These are briefly discussed in the following sub-sections.
3.7.1. Urban Material
Urban materials commonly found in the literature are concrete, asphalt, tile, and glass. One of the important characteristics of urban materials is their albedo value, which is related to their colour. Albedo is the portion of sunlight that is reflected back without being absorbed. To describe albedo, one can use qualitative terms such as “high” and “low”, corresponding to “reflective/light colours” and “absorptive/dark colours”, respectively, or use quantitative terms, i.e., values between 0 and 1. High-albedo materials can save cooling energy use by directly reducing the heat gained through a building’s envelope (direct effect) and also by lowering the urban air temperature in the neighbourhood of the building (indirect effect). Concrete and asphalt, which are usually dark coloured, are known as materials with low albedo (absorptive or material that do not reflect considerable amount of direct solar radiation) hence, it can intensify the UHI. The replacement of conventional materials with cool materials has led to a reduction in the surface temperature by 6–9 °C and 8.5–10 °C for exposed asphalt and concrete, respectively [14,92,93].
3.7.2. Aspect Ratio
Aspect ratio (AR) or height-to-width ratio (H/W) is defined as the ratio of the canyon height to the canyon width. AR is an important parameter that is usually used to investigate the influence of urban geometry on an outdoor environment, especially on temperature and building energy demand. The effect of the aspect ratio on microclimate and thermal comfort has been widely investigated. Ali-Toudert [94] was among the first scholars who investigated thermal comfort in an urban street canyon. Using the ENVI-met modelling tool (discussed later in this paper), they investigated the effect of various AR values on thermal comfort in Ghardaia, Algeria. The finding showed that temperature decreases slightly with the increase in AR and concluded that increasing AR can improve thermal comfort in hot and dry climate. This finding was confirmed by the outcomes of other studies [15,61,95].
3.7.3. Street Orientation
Street orientation is considered as having an influential role in altering the microclimate in urban areas. Street orientation will influence the exposure of the canyon surfaces to direct solar radiation. North–south (N–S) street orientation will be fully exposed to solar radiation at midday but mostly shaded in early morning and late afternoon. This is contrary to East–West (E–W) street orientation, which is fully exposed in the early morning and the late afternoon. Some of the reviewed studies examined the effect on street orientation on microclimate and thermal comfort. Rodríguez-Algeciras et al. [16] used RayMan tool to investigate the effect of the asymmetrical street canyon on heat comfort. It was found that in asymmetrical streets, E–W street orientation is the most thermally stressed.
4. Modelling Software
Modelling has been widely used by researchers to study the microclimate and human thermal comfort at different scales and in various regions. Modelling is used to simulate the performance of different types of mitigation measures. It is needed to examine a wider range of scenarios, technologies, and climatic benefits at a variety of scales. The application of numerical simulation in microclimate studies is increasing these days due to the increasing capability of computational resources. Some software packages that are commonly employed in microclimate and thermal comfort studies include ENVI-met [38], SOLWEIG [41,96,97], TownScope [39] and RayMan [40,98]. In addition, remote sensing is frequently used to obtain information regarding land surface temperature (LST) [99,100]. Vegetation has become the most complicated element in the numerical analysis of microclimate due to its multi-faceted interaction with radiation, flow and evapotranspiration [48]. However, most of the software do not consider the complexity of vegetation, such as the types of vegetation on rooftops and wall vegetation, in simulating a microclimate. ENVI-met is considered as a holistic microclimate model which incorporates many urban complexities such as vegetation of different varieties, building materials and roads. As ENVI-met combines various climatic variables that influence thermal comfort, the software is considered as the most complete model in terms of the calculation of human thermal comfort [101]. The software only requires a limited number of inputs to run the model with a large number of outputs [95]. In addition, ENVI-met is the most accepted and validated software for simulating urban outdoor microclimate and for calculating thermal comfort values [102]. Therefore, ENVI-met was selected in this study for a detailed review, which is presented in the following sub-sections. In Table 2, a comparison of the four most commonly used microclimate modelling tools is presented.
4.1. RayMan
RayMan stands for “radiation on human body”. The software was developed based on Guideline 3783 of the German Association of Engineers by University Freiburg Germany to calculate the radiation flux in simple and complex environments. Applications of RayMan are mainly in the field of urban meteorology and climatology, landscaping and ecological planning.
RayMan estimates the radiation fluxes and the effect of clouds and solid obstacles on short radiation fluxes. The model requires input variable data such as geographic, climate (air temperature, relative humidity, wind velocity and global radiation), personal (height, weight, and sex), clothing and activity. In addition to these parameters, information about the surface structures of the study area are required. RayMan cannot entirely represent a complex urban setting as this software can only take into account buildings and trees as land cover. This limitation has the potential to prevent wider use especially in various land cover studies. In the model, grid cell resolution vegetation are represented by sphere or cone form while buildings are represented by cuboids form. Other limitations have been reported in several studies; for example, wind data input must be corrected manually and the model needs a large database input as this model uses a real meteorological parameter [103]. Apart from its limitations, in RayMan, there is almost no limitation for the size of the area. However, as the duration of simulation depends on the resolution of the area, it is recommended to limit the size of the area to avoid longer simulation duration. The user-friendly interface enables users to learn the model quickly and use it efficiently. The output of the model is MRT which is required for the assessment of human thermal comfort. In addition, RayMan also calculates various thermal indices namely the predicted mean vote (PMV), physiological equivalent temperature (PET), standarded effective temperature (SET), universal thermal comfort index (UTCI), perceived temperature (PT) and modified physiological equivalent temperature (mPET). While first five indices are widely known, the latest one is an index that is modified from the PET to adapt to hot and humid climatic conditions [104]. RayMan is available freely at https://www.urbanclimate.net/rayman/. Recently, the model has been under continuous development, resulting the latest version RayMan 1.2.
Several studies have employed RayMan to quantify the level of thermal comfort in some areas [105,106,107,108,109]. A study in Germany found that the model was considered accurate to simulate MRT under relatively homogenous areas [108]. This accuracy will decrease as the growing heterogeneity of the areas and with lower sun elevation [109]. Another study conducted in Hungary showed that RayMan performed better in the resulting PET under shaded area [103]. However, when it comes to sun-exposed area, the model underestimated PET with the maximum of gap 8.8 °C between the simulated and recorded PET in the evening time.
4.2. SOLWEIG
Solar and Longwave Environmental Irradiance Geometry model (SOLWEIG), is a software to simulate spatial variations of 3D radiation fluxes in six directions (upward, downward and from four point cardinal points and angular factors) as well as the mean radiant temperature in a complex urban setting. It is a raster-based, non-stationary model that is capable of computing the spatial and temporal variation of radiation fluxes and MRT on a large domain. The model was developed by the Urban Climate Group of the Department of Earth Sciences, University of Gothenburg, Sweden, and mainly be applied in the field of climatology, thermal environment and thermal comfort in urban setting.
SOLWEIG requires geographic information, on the terrain of study area, and meteorological data as inputs. Terrain data are in the form of a digital surface model (DSM) which includes topography and building elevation within the study area. The meteorological input include global shortwave radiation, air temperature, and relative humidity. In addition, vegetation and ground cover information can be added to improve the accuracy of the MRT estimation. Vegetation in SOLWEIG is described in two different grids; canopy, which represents the top and bottom part of the tree. The output of the model MRT, which is derived from modelling shortwave and longwave radiation fluxes. MRT is one important variable governing human energy balance and thermal comfort. However, other important parameters influencing thermal comfort are not calculated by the model. The thermal comfort level is presented in the form of the PET index and universal thermal climate index (UTCI). SOLWEIG can also generate the shadow pattern and sky view factor (SVF) of the research area. The software can be downloaded from the Urban Climate Group webpage (http://www/gvc.gu.se/english/research/climate/urban-climate/). The current version is SOLWEIG 2019a, which was released in 2019.
Some studies employed SOLWEIG [96,110,111,112] to quantify MRT and the radiation fluxes in a specific urban environment. The model was found to work very well in simulating MRT and six-directional shortwave and longwave radiation fluxes in the high-density sub-tropical urban environment of Hong Kong [111]. Meanwhile, SOLWEIG was also considered good at simulating MRT in an urban area of Rotterdam with R2 = 0.84 [110]. In a low-rise building and vegetation area in Germany, SOLWEIG can predict MRT with the difference of only 2 °C from the measured value [112].
4.3. Townscope
Townscope is a simulation tool for the estimation of solar access and thermal comfort. The software provides a different function assessment of direct, diffused and reflected radiation, the evaluation of outdoor thermal comfort and qualitative analysis of urban open spaces which covers sky opening, view lengths and visibility analysis. Townscope was developed by the Local Environment Management and Analysis (LEMA), University of Liege, Belgium. It is dedicated to analysing the sun and solar where it is possible to evaluate and compare the different design solution of a project. Since its launch, the software has undergone several improvements, resulting in the current version of Townscope 3.2. However, even though urban information systems are displayed in three-dimensional form, Townscope does not have the capability to create objects and models. To create objects, the software needs to import geometry shapes from other sources such as computer-aided design (CAD) into the software. Some meteorological data are required to perform an analysis such as the mean average air temperature, wind speed, relative humidity and surface temperature. Weather data editing provides a tool to import the data in xlm (excel) format. This software is considered simple yet is not easy to use. The users need to have adequate knowledge about energy, physics and building science in order to be familiar with the software [113]. Unlike other microclimate software, human thermal comfort in Townscope is presented in four values, namely: sweat rate, sweat evaporation, skin wetness and sensation temperature. This, however, needs further interpretation to determine the extent of warm or cool sensation experienced by people.
Since there are not many types of simulations provided in the software, the outcome of the software is limited to information about solar access, sky opening and thermal comfort. The outcome of simulations are displayed in two forms: coloured maps and tabular data. The maps are generated in different visualization styles (gradient, levels, and ratio) which provide more effective representations. The software trial version can be downloaded at https://www.townscope.com along with the user guide. This trial version, however, is only available for Windows operating systems. Several studies have applied Townscope to simulate solar analysis in 3D [114]. However, as the number of available studies in various regions are very limited, it is then difficult to generate concrete conclusions regarding Townscope performance in various climates and environments.
4.4. ENVI-met
ENVI-met is a three-dimensional non-hydrostatic model based on the computational fluid dynamic (CFD) solving of the Navier–Stokes equations using finite difference numeric methods. This model has a graphical user interface (GUI) to generate modelling domains and graph results. There are two levels of domain, namely 2D surface points and 3D atmospheric points. It is characterized by spatial resolution from 0.5 to 10 m and temporal resolution from 1 to 10 s. ENVI-met provides the calculations of short- and longwave radiation fluxes with respect to shading, reflection and re-radiation from buildings systems and vegetation. This also includes transpiration, evaporation and sensible heat flux from vegetation into the air, pollutant dispersion at different levels of the domain, and bio-meteorological parameter values (www.envi-met.com). A variety of features including buildings of different materials, different types of vegetation (species and geometry), pervious and impervious surfaces, and configurable layers of soil moisture are taken into account. The model is computationally intensive, runs in nearly real-time, which means 24 h of simulation will require approximately 24 h of computation depending on the size of the simulation area and the computer’s specification. Jamei et al. [62] reported in one of their studies that ENVI-met took approximately 7 to 8 days to simulate a case.
ENVI-met is commonly used in the fields of urban climatology, urban planning and building design. The model is considered the most proper and validated tool for simulating the outdoor environment and evaluating the thermal comfort which relates to the surface greenery, air temperature and outdoor environment [94]. Three-D vegetation models enables the users to simulate their complex vegetation geometries. It is also considered as the most complete model in human thermal comfort calculation [101].
A considerable number of studies employing ENVI-met have been conducted in various climate conditions. Using a research location in a temperate and humid subtropical climate area was quite quite significant (such as China and Hong Kong). Some of the studies come from tropical areas such as Singapore, Malaysia, Indonesia and Brazil. A considerable number of studies were also carried out in the Mediterranean climate, such as in Italy, Greece and Spain. Studies from the tropical arid climate were few, as not many studies were undertaken in such climatic conditions (Africa being an example). In addition, several studies examining the performance of ENVI-met have been carried out. Hien [115] compared the performance of ENVI-met and Screening Tool for Estate Environment Evaluation (STEVE), a microclimate model that was developed in Singapore, in predicting temperature in tropical regions. They concluded that STEVE could be suitable for predicting temperature in an urban tropical environment. Another study [68] was conducted to identify a method that accurately estimated the mean radiant temperature (MRT). The result indicated that by combining ENVI-met and TRNSYS, a more reliable result of MRT was achieved which led to increasing the accuracy of outdoor thermal comfort prediction, especially during the night. Apart from for microclimate and thermal comfort, some studies also used ENVI-met to investigate air quality, which focused on pollutant deposition and dispersion [59,60].
Calibration and Validation of ENVI-met
Calibration and validation are the processes undertaken to develop a reliable model that can represent the real environment of the research area. The accuracy of a model result is heavily dependent on the quality of the input data and the initial or boundary conditions. Therefore, it is important that sufficient and good quality data be prepared for the simulation. In general, two types of data are used in ENVI-met, namely the weather data and geometry data of the study area. Most of the reviewed studies performed mobile measurement [14,50,57,73,93,116] and some retrieved the data from meteorological stations [18,36,68,82]. In terms of validated variables, some studies had only a single validated variable, such as Ta or MRT [14,62,75,116,117], whereas other studies had multiple validated variables [53,57,93,118]. In addition to Ta, relative humidity (RH), and MRT as the most common validated variables, PMV [56] and solar irradiance [58] were also used as validated variables in several papers. To ensure the model reliability, an evaluation procedure was conducted by comparing the model result and measured values. Suitable statistical metrics were used to reflect the level of agreement between the predicted and observed values, which included the root mean square error (RMSE), mean absolute error (MAE), mean bias error (MBE) and coefficient of determination (R2). In validating the multiple variables, while some variables show good relationships, others may not. Many reviewed studies showed good validation results for air temperature. The coefficient of determination in the studies were 0.88 [117], 0.83–0.94 [118], 0.78–0.96 [53], 0.93 [20], 0.69 and 0.82 [18], 0.85 [76]. Acceptable RMSE values were also shown by some studies such as 0.73 °C [57], 1.05 °C [20], 1.46 °C and 0.97 °C [73], 1,61 °C [63].
MRT is considered as the most important meteorological variable to evaluate human thermal condition [45,68,119], yet it is often predicted less accurately by ENVI-met. Paramita [120] found that during 14 h of MRT simulation by ENVI-met, only simulations at 12 p.m. and 1 p.m. yielded moderately accurate prognostics of MRT with RMSE values of 3.23 and 2.52, respectively. Other studies showed that the overestimation of MRT also occurred during simulation by approximately 25 °C [57], 30 °C and 60 °C [76]. Similarly, a study by Zhao [55] found that the MRT was overestimated with an RMSE of 5.7 °C. In addition, physiological equivalent temperature (PET) is considered sensitive to MRT, therefore, the deviation of MRT will highly influence the deviation of PET [45,119].
During the calibration process, some studies conducted a number of trials to determine the optimal settings for the initial/boundary conditions. Teleghani [101] checked the accuracy of ENVI-met with modelling a courtyard model in two differently grid sizes (180 × 180 m2 and 90 × 90 m2) Table 3. The outcome showed the same result; hence, the smaller grid size was chosen to reduce the simulation time. Another study by Forouzandeh [57] analysed several grid sizes and time-steps to investigate how these arrangements would affect the accuracy of the model. It was found that the model size did not create significant difference between the measured and simulated temperature and humidity. However, bias in the wind velocity existed for a high-resolution grid and small lateral domain extension. In some studies, however, some boundary configurations were left as the default values of the model. The simulation time is one major challenge in ENVI-met, hence, it is strongly recommended to build a model on a small or moderate grid size to avoid a long simulation time.
5. Conclusions
With increasing urbanization and the challenge of global warming, urban heat island (UHI) mitigation strategies have attracted a lot of interest from researchers and scientists worldwide. Green infrastructure (GI) is currently receiving growing attention from urban planners and policy makers as an important strategy to overcome the rising temperatures in urban areas. Therefore, research in this area is important in order to implement the strategies effectively.
This study firstly aims to provide an overview of GI as a strategy to mitigate the effect of urban heat. A review of results from numerous studies that applied different GI strategies to reduce temperature and improve human thermal comfort is presented. It is observed that certain GIs (like trees and grass) are studied much more than the others. The impact of tree in mitigating air temperature has been well documented. In general, trees showed promising capability to reduce temperature and improve human thermal comfort as compared to other types of GIs. In this paper, trees were found to be able to reduce air temperature by a value ranging from 0.2 to 2.27 °C. Meanwhile, the physiological equivalent temperature (PET) can be reduced by up to 14 °C in the spots where trees are added. Grass and green roofs showed a lower capability to reduce temperature, with a limited thermal comfort improvement.
It has also been observed that certain regions (mainly in Asia and Europe) have undertaken more research than other regions. Africa was observed to be the continent with the least UHI studies. The regions which are prone to negative effects of UHI tend to have a greater number of mitigation studies.
This study also identifies ENVI-met modelling software as a reliable tool to simulate surface–plant–air interaction, which is widely used to evaluate the different scenarios of urban planning. In this paper, studies that have used ENVI-met in the last decade are reviewed and a summary of the simulation results are presented. It is revealed that even though ENVI-met is regarded as a reliable tool to simulate urban planning scenarios, some microclimate parameters such as mean radiant temperature and wind speed tend to be over or underestimated. Therefore, some adjustments in the configuration need to be undertaken to ensure accurate results. ENVI-met is also computationally intensive and could take days to simulate a case. This time-consuming computational requirement is a major challenge in the implementation of ENVI-met.
Author Contributions
Conceptualization, F.B., A.W.N., N.M., S.M. and M.S.W.; methodology, F.B., A.W.N., N.M., S.M. and M.S.W.; writing—original draft preparation, F.B.; writing—review and editing, F.B., A.W.N., N.M., S.M. and M.S.W.; supervision, A.W.N., N.M., S.M. and M.S.W.; project administration, F.B.; funding acquisition, A.W.N., N.M., S.M. and M.S.W. All authors have read and agreed to the published version of the manuscript.
Funding
The first author received an Australia Awards Scholarship for undertaking this research. The project also received a ‘Green our Rooftop Demonstration Green Roof Collaborative Research Grant’ from the City of Melbourne, Melbourne, Australia.
Acknowledgments
The authors would like to acknowledge and thank the Australia Awards, which provided the research scholarship to the first author. The authors would also like to acknowledge the funding support provided by the City of Melbourne through ‘Green our Rooftop Demonstration Green Roof Collaborative Research Grant’. Man Sing Wong would like to thank the funding support by grant (Grant no. 15602619) from the Research Grants Council of Hong Kong SAR.
Conflicts of Interest
The authors declare no conflict of interest.
Abbreviations
| AR = Aspect Ratio | SA = Surface Albedo SET = Standard Effective Temperature |
| LAD = Leaf Angle Distribution LAI = Leaf Area Index | SOLWEIG = The Solar and Longwave Environmental Irradiance Geometry |
| MAE = Mean Absolute Error | SVF = Sky View Factor |
| MOCI = Mediterranean Outdoor Comfort Index mPET = modified Physiological Equivalent Temperature | Ta = Air Temperature |
| MRT = Mean Radiant Temperature | TCA = Tree-Planting Covered Area |
| PET = Physiological Equivalent Temperature | TRNSYS = Transient System Simulation Tool |
| PMV = Predicted Mean Vote PT = Perceived Temperature | Ts = Surface Temperature |
| RH = Relative Humidity | UTCI = Universal Thermal Comfort Index |
| RMSE = Root Mean Square Error | WS = Wind Speed |
References
- Akbari, H.; Pomerantz, M.; Taha, H. Cool surfaces and shade trees to reduce energy use and improve air quality in urban areas. Sol. Energy 2001, 70, 295–310. [Google Scholar] [CrossRef]
- Donovan, G.H.; Butry, D.T. The value of shade: Estimating the effect of urban trees on summertime electricity use. Energy Build. 2009, 41, 662–668. [Google Scholar] [CrossRef]
- Hirano, Y.; Fujita, T. Evaluation of the impact of the urban heat island on residential and commercial energy consumption in Tokyo. Energy 2012, 37, 371–383. [Google Scholar] [CrossRef]
- Santamouris, M.; Cartalis, C.; Synnefa, A.; Kolokotsa, D. On the impact of urban heat island and global warming on the power demand and electricity consumption of buildings—A review. Energy Build. 2015, 98, 119–124. [Google Scholar] [CrossRef]
- Czarnecka, M.; Nidzgorska-Lencewicz, J. Intensity of Urban Heat Island and Air Quality in Gdańsk during 2010 Heat Wave. Pol. J. Environ. Stud. 2014, 23, 329–340. [Google Scholar]
- Lai, L.-W.; Cheng, W.-L. Air quality influenced by urban heat island coupled with synoptic weather patterns. Sci. Total Environ. 2009, 407, 2724–2733. [Google Scholar] [CrossRef] [PubMed]
- Plocoste, T.; Jacoby-Koaly, S.; Molinié, J.; Petit, R.H. Evidence of the effect of an urban heat island on air quality near a landfill. Urban Clim. 2014, 10, 745–757. [Google Scholar] [CrossRef]
- Sarrat, C.; Lemonsu, A.; Masson, V.; Guédalia, D. Impact of urban heat island on regional atmospheric pollution. Atmos. Environ. 2006, 40, 1743–1758. [Google Scholar] [CrossRef]
- Harlan, S.L.; Brazel, A.J.; Prashad, L.; Stefanov, W.L.; Larsen, L. Neighborhood microclimates and vulnerability to heat stress. Soc. Sci. Med. 2006, 63, 2847–2863. [Google Scholar] [CrossRef]
- Kovats, S.; Hajat, S. Heat Stress and Public Health: A Critical Review. Annu. Rev. Public Health 2008, 29, 41–55. [Google Scholar] [CrossRef]
- Tan, J.; Zheng, Y.; Tang, X.; Guo, C.; Li, L.; Song, G.; Zhen, X.; Yuan, D.; Kalkstein, A.J.; Li, F.; et al. The urban heat island and its impact on heat waves and human health in Shanghai. Int. J. Biometeorol. 2010, 54, 75–84. [Google Scholar] [CrossRef] [PubMed]
- Guhathakurta, S.; Gober, P. The Impact of the Phoenix Urban Heat Island on Residential Water Use. J. Am. Plan. Assoc. 2007, 73, 317–329. [Google Scholar] [CrossRef]
- Sodoudi, S.; Shahmohamadi, P.; Vollack, K.; Cubasch, U.; Che-Ani, A.I. Mitigating the Urban Heat Island Effect in Megacity Tehran. Adv. Meteorol. 2014, 2014, 1–19. [Google Scholar] [CrossRef]
- Tsoka, S. Investigating the Relationship Between Urban Spaces Morphology and Local Microclimate: A Study for Thessaloniki. Procedia Environ. Sci. 2017, 38, 674–681. [Google Scholar] [CrossRef]
- Chatzidimitriou, A.; Yannas, S. Microclimate design for open spaces: Ranking urban design effects on pedestrian thermal comfort in summer. Sustain. Cities Soc. 2016, 26, 27–47. [Google Scholar] [CrossRef]
- Algeciras, J.A.R.; Tablada, A.; Matzarakis, A. Effect of asymmetrical street canyons on pedestrian thermal comfort in warm-humid climate of Cuba. Theor. Appl. Climatol. 2018, 133, 663–679. [Google Scholar] [CrossRef]
- Broadbent, A.M.; Coutts, A.; Tapper, N.J.; Demuzere, M. The cooling effect of irrigation on urban microclimate during heatwave conditions. Urban Clim. 2018, 23, 309–329. [Google Scholar] [CrossRef]
- Lin, B.-S.; Lin, C.-T. Preliminary study of the influence of the spatial arrangement of urban parks on local temperature reduction. Urban For. Urban Green. 2016, 20, 348–357. [Google Scholar] [CrossRef]
- Skelhorn, C.; Lindley, S.; Levermore, G. The impact of vegetation types on air and surface temperatures in a temperate city: A fine scale assessment in Manchester, UK. Landsc. Urban Plan. 2014, 121, 129–140. [Google Scholar] [CrossRef]
- Wu, Z.; Chen, L. Optimizing the spatial arrangement of trees in residential neighborhoods for better cooling effects: Integrating modeling with in-situ measurements. Landsc. Urban Plan. 2017, 167, 463–472. [Google Scholar] [CrossRef]
- Benedict, M.A.; McMahon, E.T. Green Infrastructure: Linking Landscapes and Communities; Island Press: Washington, DC, USA, 2012; ISBN 978-1-59726-764-9. [Google Scholar]
- Feyisa, G.L.; Dons, K.; Meilby, H. Efficiency of parks in mitigating urban heat island effect: An example from Addis Ababa. Landsc. Urban Plan. 2014, 123, 87–95. [Google Scholar] [CrossRef]
- Oliveira, S.; Andrade, H.; Vaz, T. The cooling effect of green spaces as a contribution to the mitigation of urban heat: A case study in Lisbon. Build. Environ. 2011, 46, 2186–2194. [Google Scholar] [CrossRef]
- Shashua-Bar, L.; Pearlmutter, D.; Erell, E. The influence of trees and grass on outdoor thermal comfort in a hot-arid environment. Int. J. Clim. 2011, 31, 1498–1506. [Google Scholar] [CrossRef]
- Meier, A.K. Strategic landscaping and air-conditioning savings: A literature review. Energy Build. 1990, 15, 479–486. [Google Scholar] [CrossRef]
- Georgi, N.J.; Zafiriadis, K. The impact of park trees on microclimate in urban areas. Urban Ecosyst. 2006, 9, 195–209. [Google Scholar] [CrossRef]
- Ren, Z.; Xingyuan, H.; Zheng, H.; Dan, Z.; Xingyang, Y.; Shen, G.; Guo, R. Estimation of the Relationship between Urban Park Characteristics and Park Cool Island Intensity by Remote Sensing Data and Field Measurement. Forests 2013, 4, 868–886. [Google Scholar] [CrossRef] [Green Version]
- Shashua-Bar, L.; Pearlmutter, D.; Erell, E. The cooling efficiency of urban landscape strategies in a hot dry climate. Landsc. Urban Plan. 2009, 92, 179–186. [Google Scholar] [CrossRef]
- Klemm, W.; Heusinkveld, B.G.; Lenzholzer, S.; Van Hove, B. Street greenery and its physical and psychological impact on thermal comfort. Landsc. Urban Plan. 2015, 138, 87–98. [Google Scholar] [CrossRef]
- Park, M.; Hagishima, A.; Tanimoto, J.; Narita, K.-I. Effect of urban vegetation on outdoor thermal environment: Field measurement at a scale model site. Build. Environ. 2012, 56, 38–46. [Google Scholar] [CrossRef]
- Guhathakurta, S.; Gober, P. Residential Land Use, the Urban Heat Island, and Water Use in Phoenix: A Path Analysis. J. Plan. Educ. Res. 2010, 30, 40–51. [Google Scholar] [CrossRef]
- Armson, D.; Rahman, M.A.; Ennos, A.R. A comparison of the shading effectiveness of five different street tree species in Manchester, UK. Arbocult. Urban For. 2013, 39, 157–164. [Google Scholar]
- Streiling, S.; Matzarakis, A. Influence of single and small clusters of trees on the bioclimate of a city: A case study. J. Arbocult. 2003, 29, 309–316. [Google Scholar]
- Chellamani, P.; Singh, C.P.; Panigrahy, S. Assessment of the health status of Indian mangrove ecosystems using multi temporal remote sensing data. Trop. Ecol. 2014, 55, 245–253. [Google Scholar]
- Symes, P.; Connellan, G. Water management strategies for urban trees in dry environments: Lessons for the future. Arbocult. Urban For. 2013, 39, 116–124. [Google Scholar]
- Müller, N.; Kuttler, W.; Barlag, A.-B. Counteracting urban climate change: Adaptation measures and their effect on thermal comfort. Theor. Appl. Climatol. 2013, 115, 243–257. [Google Scholar] [CrossRef] [Green Version]
- Long, X.; Bei, N.; Wu, J.; Li, X.; Tian, F.; Li, X.; Zhao, S.; Cao, J.; Tie, X.; An, Z.; et al. Does afforestation deteriorate haze pollution in Beijing–Tianjin–Hebei (BTH), China? Atmos. Chem. Phys. 2018, 18, 10869. [Google Scholar] [CrossRef] [Green Version]
- Bruse, M.; Fleer, H. Simulating surface–plant–air interactions inside urban environments with a three dimensional numerical model. Environ. Model. Softw. 1998, 13, 373–384. [Google Scholar] [CrossRef]
- Teller, J.; Azar, S. Townscope II—A computer system to support solar access decision-making. Sol. Energy 2001, 70, 187–200. [Google Scholar] [CrossRef] [Green Version]
- Matzarakis, A.; Rutz, F.; Mayer, H. Modelling radiation fluxes in simple and complex environments—application of the RayMan model. Int. J. Biometeorol. 2007, 51, 323–334. [Google Scholar] [CrossRef]
- Lindberg, F.; Holmer, B.; Thorsson, S. SOLWEIG 1.0 – Modelling spatial variations of 3D radiant fluxes and mean radiant temperature in complex urban settings. Int. J. Biometeorol. 2008, 52, 697–713. [Google Scholar] [CrossRef]
- Imran, H.; Kala, J.; Ng, A.; Muthukumaran, S. Effectiveness of green and cool roofs in mitigating urban heat island effects during a heatwave event in the city of Melbourne in southeast Australia. J. Clean. Prod. 2018, 197, 393–405. [Google Scholar] [CrossRef]
- Imran, H.; Kala, J.; Ng, A.; Muthukumaran, S. Effectiveness of vegetated patches as Green Infrastructure in mitigating Urban Heat Island effects during a heatwave event in the city of Melbourne. Weather Clim. Extremes 2019, 25, 100217. [Google Scholar] [CrossRef]
- Imran, H.; Kala, J.; Ng, A.W.M.; Muthukumaran, S. Impacts of future urban expansion on urban heat island effects during heatwave events in the city of Melbourne in southeast Australia. Q. J. R. Meteorol. Soc. 2019, 145, 2586–2602. [Google Scholar] [CrossRef] [Green Version]
- Yahia, M.W.; Johansson, E.; Thorsson, S.; Lindberg, F.; Rasmussen, M.I. Effect of urban design on microclimate and thermal comfort outdoors in warm-humid Dar es Salaam, Tanzania. Int. J. Biometeorol. 2018, 62, 373–385. [Google Scholar] [CrossRef] [Green Version]
- Hua, L.J.; Ma, Z.G.; Guo, W.D. The impact of urbanization on air temperature across China. Theor. Appl. Climatol. 2007, 93, 179–194. [Google Scholar] [CrossRef]
- Morris, C.; Simmonds, I.; Plummer, N. Quantification of the influences of wind and cloud on the nocturnal urban heat island of a large city. J. Appl. Meteorol. 2001, 40, 169–182. [Google Scholar] [CrossRef]
- Wang, W.; Zhou, W.; Ng, E.Y.Y.; Xu, Y. Urban heat islands in Hong Kong: Statistical modeling and trend detection. Nat. Hazards 2016, 83, 885–907. [Google Scholar] [CrossRef]
- Edward, N. Wind and heat environment in densely built urban areas in Hong Kong. Glob. Environ. Res. 2009, 13, 169–178. [Google Scholar]
- Tan, Z.; Lau, K.K.-L.; Ng, E. Urban tree design approaches for mitigating daytime urban heat island effects in a high-density urban environment. Energy Build. 2016, 114, 265–274. [Google Scholar] [CrossRef]
- Wong, J.K.W.; Lau, L.S.-K. From the ‘urban heat island’to the ‘green island’? A preliminary investigation into the potential of retrofitting green roofs in Mongkok district of Hong Kong. Habitat Inter. 2013, 39, 25–35. [Google Scholar]
- Ward, K.; Lauf, S.; Kleinschmit, B.; Endlicher, W. Heat waves and urban heat islands in Europe: A review of relevant drivers. Sci. Total Environ. 2016, 569–570, 527–539. [Google Scholar] [CrossRef] [PubMed]
- Herath, H.; Halwatura, R.; Jayasinghe, G. Evaluation of green infrastructure effects on tropical Sri Lankan urban context as an urban heat island adaptation strategy. Urban For. Urban Green. 2018, 29, 212–222. [Google Scholar] [CrossRef]
- Perini, K.; Magliocco, A. Effects of vegetation, urban density, building height, and atmospheric conditions on local temperatures and thermal comfort. Urban For. Urban Green. 2014, 13, 495–506. [Google Scholar] [CrossRef]
- Zhao, T.; Fong, K.F. Characterization of different heat mitigation strategies in landscape to fight against heat island and improve thermal comfort in hot–humid climate (Part I): Measurement and modelling. Sustain. Cities Soc. 2017, 32, 523–531. [Google Scholar] [CrossRef]
- Dain, J.; Park, K.; Song, B.; Kim, G.; Choi, C.; Moon, B. Validation of ENVI-met PMV values by in-situ measurements. In Proceedings of the 9th International Conference on Urban Climate jointly with 12th Symposium on the Urban Environment, Toulouse, France, 20–24 July 2015. [Google Scholar]
- Forouzandeh, A. Numerical modeling validation for the microclimate thermal condition of semi-closed courtyard spaces between buildings. Sustain. Cities Soc. 2018, 36, 327–345. [Google Scholar] [CrossRef]
- Srivanit, M.; Hokao, K. Evaluating the cooling effects of greening for improving the outdoor thermal environment at an institutional campus in the summer. Build. Environ. 2013, 66, 158–172. [Google Scholar] [CrossRef]
- Rui, L.; Buccolieri, R.; Gao, Z.; Ding, W.; Shen, J. The Impact of Green Space Layouts on Microclimate and Air Quality in Residential Districts of Nanjing, China. Forests 2018, 9, 224. [Google Scholar] [CrossRef] [Green Version]
- Rui, L.; Buccolieri, R.; Gao, Z.; Gatto, E.; Ding, W. Study of the effect of green quantity and structure on thermal comfort and air quality in an urban-like residential district by ENVI-met modelling. Build. Simul. 2019, 12, 183–194. [Google Scholar] [CrossRef]
- Lobaccaro, G.; Acero, J.A. Comparative analysis of green actions to improve outdoor thermal comfort inside typical urban street canyons. Urban Clim. 2015, 14, 251–267. [Google Scholar] [CrossRef]
- Jamei, E.; Sachdeva, H.; Rajagopalan, P. CBD greening and air temperature variation in Melbourne. In PLEA 2014, Proceedings of the 30th International PLEA Conference: Sustainable Habitat for Developing Societies, Choosing the Way Forward, 16–18 December 2014; CEPT University Press: Ahmedabad, India, 2014. [Google Scholar]
- Duarte, D.H.; Shinzato, P.; Gusson, C.D.S.; Alves, C.A. The impact of vegetation on urban microclimate to counterbalance built density in a subtropical changing climate. Urban Clim. 2015, 14, 224–239. [Google Scholar] [CrossRef]
- Salata, F.; Golasi, I.; Petitti, D.; Vollaro, E.D.L.; Coppi, M.; Vollaro, A.D.L. Relating microclimate, human thermal comfort and health during heat waves: An analysis of heat island mitigation strategies through a case study in an urban outdoor environment. Sustain. Cities Soc. 2017, 30, 79–96. [Google Scholar] [CrossRef]
- Santamouris, M.; Ding, L.; Fiorito, F.; Oldfield, P.; Osmond, P.; Paolini, R.; Prasad, D.; Synnefa, A. Passive and active cooling for the outdoor built environment – Analysis and assessment of the cooling potential of mitigation technologies using performance data from 220 large scale projects. Sol. Energy 2017, 154, 14–33. [Google Scholar] [CrossRef]
- Tsoka, S.; Tsikaloudaki, A.; Theodosiou, T. Analyzing the ENVI-met microclimate model’s performance and assessing cool materials and urban vegetation applications–A review. Sustain. Cities Soc. 2018, 43, 55–76. [Google Scholar] [CrossRef]
- Kong, L.; Lau, K.K.-L.; Yuan, C.; Chen, Y.; Xu, Y.; Ren, C.; Ng, E. Regulation of outdoor thermal comfort by trees in Hong Kong. Sustain. Cities Soc. 2017, 31, 12–25. [Google Scholar] [CrossRef]
- Perini, K.; Chokhachian, A.; Dong, S.; Auer, T. Modeling and simulating urban outdoor comfort: Coupling ENVI-Met and TRNSYS by grasshopper. Energy Build. 2017, 152, 373–384. [Google Scholar] [CrossRef]
- Johansson, E.; Yahia, M. Improving outdoor thermal comfort in warm-humid Guayaquil, Ecuador through urban design. In Proceedings of the ICUC8-8th International Conference on Urban Climates, Dublin, Ireland, 6–10 August 2012. [Google Scholar]
- Kukal, M.S.; Irmak, S. Climate-Driven Crop Yield and Yield Variability and Climate Change Impacts on the U.S. Great Plains Agricultural Production. Sci. Rep. 2018, 8, 1–18. [Google Scholar] [CrossRef] [Green Version]
- Park, C.Y.; Lee, D.K.; Krayenhoff, E.S.; Heo, H.K.; Hyun, J.H.; Oh, K.; Park, T.Y. Variations in pedestrian mean radiant temperature based on the spacing and size of street trees. Sustain. Cities Soc. 2019, 48, 101521. [Google Scholar] [CrossRef]
- Kleerekoper, L.; Taleghani, M.; Dobbelsteen, A.V.D.; Hordijk, T. Urban measures for hot weather conditions in a temperate climate condition: A review study. Renew. Sustain. Energy Rev. 2017, 75, 515–533. [Google Scholar] [CrossRef]
- Zhang, L.; Zhan, Q.; Lan, Y. Effects of the tree distribution and species on outdoor environment conditions in a hot summer and cold winter zone: A case study in Wuhan residential quarters. Build. Environ. 2018, 130, 27–39. [Google Scholar] [CrossRef]
- Battista, G.; Evangelisti, L.; Guattari, C.; Vollaro, E.D.L.; Vollaro, R.D.L.; Asdrubali, F. Urban Heat Island Mitigation Strategies: Experimental and Numerical Analysis of a University Campus in Rome (Italy). Sustainability 2020, 12, 7971. [Google Scholar] [CrossRef]
- Ng, E.; Chen, L.; Wang, Y.; Yuan, C. A study on the cooling effects of greening in a high-density city: An experience from Hong Kong. Build. Environ. 2012, 47, 256–271. [Google Scholar] [CrossRef]
- Lee, H.; Mayer, H.; Chen, L. Contribution of trees and grasslands to the mitigation of human heat stress in a residential district of Freiburg, Southwest Germany. Landsc. Urban Plan. 2016, 148, 37–50. [Google Scholar] [CrossRef]
- Afshar, N.K.; Karimian, Z.; Doostan, R.; Nokhandan, M.H. Influence of Planting Designs on Winter Thermal Comfort in an Urban Park. J. Environ. Eng. Landsc. Manag. 2018, 26, 232–240. [Google Scholar] [CrossRef]
- Edmondson, J.L.; Stott, I.; Davies, Z.G.; Gaston, K.J.; Leake, J.R. Soil surface temperatures reveal moderation of the urban heat island effect by trees and shrubs. Sci. Rep. 2016, 6, 1–8. [Google Scholar] [CrossRef] [PubMed] [Green Version]
- Berardi, U.; GhaffarianHoseini, A.; GhaffarianHoseini, A. State-of-the-art analysis of the environmental benefits of green roofs. Appl. Energy 2014, 115, 411–428. [Google Scholar] [CrossRef]
- Akbari, H.; Rose, L.S.; Taha, H. Analyzing the land cover of an urban environment using high-resolution orthophotos. Landsc. Urban Plan. 2003, 63, 1–14. [Google Scholar] [CrossRef]
- Morakinyo, T.E.; Lam, Y.F. Simulation study on the impact of tree-configuration, planting pattern and wind condition on street-canyon’s micro-climate and thermal comfort. Build. Environ. 2016, 103, 262–275. [Google Scholar] [CrossRef]
- Razzaghmanesh, M.; Beecham, S.; Salemi, T. The role of green roofs in mitigating Urban Heat Island effects in the metropolitan area of Adelaide, South Australia. Urban For. Urban Green. 2016, 15, 89–102. [Google Scholar] [CrossRef]
- Baik, J.; Kwak, K.-H.; Park, S.-B.; Ryu, Y.-H. Effects of building roof greening on air quality in street canyons. Atmospheric Environ. 2012, 61, 48–55. [Google Scholar] [CrossRef]
- Nowak, D.J.; McHale, P.J.; Ibarra, M.; Crane, D.; Stevens, J.C.; Luley, C.J. Modeling the effects of urban vegetation on air pollution. In Air Pollution Modeling and Its Application XII; Springer: Berlin, Germany, 1998; pp. 399–407. [Google Scholar]
- Jim, C. Assessing climate-adaptation effect of extensive tropical green roofs in cities. Landsc. Urban Plan. 2015, 138, 54–70. [Google Scholar] [CrossRef]
- Rowe, D.B. Green roofs as a means of pollution abatement. Environ. Pollut. 2011, 159, 2100–2110. [Google Scholar] [CrossRef] [PubMed] [Green Version]
- Kim, J.; Lee, S.Y.; Kang, J. Temperature Reduction Effects of Rooftop Garden Arrangements: A Case Study of Seoul National University. Sustainability 2020, 12, 6032. [Google Scholar] [CrossRef]
- Jamei, E.; Rajagopalan, P. Urban development and pedestrian thermal comfort in Melbourne. Sol. Energy 2017, 144, 681–698. [Google Scholar] [CrossRef]
- Alexandri, E.; Jones, P. Temperature decreases in an urban canyon due to green walls and green roofs in diverse climates. Build. Environ. 2008, 43, 480–493. [Google Scholar] [CrossRef]
- Yu, C.; Hien, W.N. Thermal benefits of city parks. Energy Build. 2006, 38, 105–120. [Google Scholar] [CrossRef]
- Hwang, Y.H.; Lum, Q.J.G.; Chan, Y.K.D. Micro-scale thermal performance of tropical urban parks in Singapore. Build. Environ. 2015, 94, 467–476. [Google Scholar] [CrossRef]
- O’Malley, C.; Piroozfar, P.; Farr, E.R.P.; Pomponi, F. Urban Heat Island (UHI) mitigating strategies: A case-based comparative analysis. Sustain. Cities Soc. 2015, 19, 222–235. [Google Scholar] [CrossRef] [Green Version]
- Yang, X.; Zhao, L.; Bruse, M.; Meng, Q. Evaluation of a microclimate model for predicting the thermal behavior of different ground surfaces. Build. Environ. 2013, 60, 93–104. [Google Scholar] [CrossRef]
- Ali-Toudert, F.; Mayer, H. Numerical study on the effects of aspect ratio and orientation of an urban street canyon on outdoor thermal comfort in hot and dry climate. Build. Environ. 2006, 41, 94–108. [Google Scholar] [CrossRef]
- Jamei, E.; Rajagopalan, P. Effect of street design on pedestrian thermal comfort. Arch. Sci. Rev. 2018, 62, 92–111. [Google Scholar] [CrossRef]
- Lindberg, F.; Grimmond, S. The influence of vegetation and building morphology on shadow patterns and mean radiant temperatures in urban areas: Model development and evaluation. Theor. Appl. Climatol. 2011, 105, 311–323. [Google Scholar] [CrossRef]
- Thorsson, S.; Lindberg, F.; Björklund, J.; Holmer, B.; Rayner, D. Potential changes in outdoor thermal comfort conditions in Gothenburg, Sweden due to climate change: The influence of urban geometry. Int. J. Climatol. 2011, 31, 324–335. [Google Scholar] [CrossRef]
- Matzarakis, A.; Rutz, F.; Mayer, H. Modelling radiation fluxes in simple and complex environments: Basics of the RayMan model. Int. J. Biometeorol. 2010, 54, 131–139. [Google Scholar] [CrossRef] [PubMed] [Green Version]
- Radhi, H.; Sharples, S.; Assem, E. Impact of urban heat islands on the thermal comfort and cooling energy demand of artificial islands—A case study of AMWAJ Islands in Bahrain. Sustain. Cities Soc. 2015, 19, 310–318. [Google Scholar] [CrossRef]
- Zhang, Y.; Murray, A.T.; Turner, B. Optimizing green space locations to reduce daytime and nighttime urban heat island effects in Phoenix, Arizona. Landsc. Urban Plan. 2017, 165, 162–171. [Google Scholar] [CrossRef]
- Taleghani, M.; Kleerekoper, L.; Tenpierik, M.J.; Dobbelsteen, A.V.D. Outdoor thermal comfort within five different urban forms in the Netherlands. Build. Environ. 2015, 83, 65–78. [Google Scholar] [CrossRef]
- Lu, J.; Li, Q.; Zeng, L.; Chen, J.; Liu, G.; Li, Y.; Li, W.; Huang, K. A micro-climatic study on cooling effect of an urban park in a hot and humid climate. Sustain. Cities Soc. 2017, 32, 513–522. [Google Scholar] [CrossRef]
- Égerházi, L.A.; Kovács, A.; Takács, Á.; Égerházi, L. Comparison of the results of two microclimatological models and measurements. Acta Climatol. Chorol. 2014, 47, 33–42. [Google Scholar]
- Chen, Y.-C.; Matzarakis, A. Modified physiologically equivalent temperature—Basics and applications for western European climate. Theor. Appl. Clim. 2018, 132, 1275–1289. [Google Scholar] [CrossRef]
- Libanda, E.; Nkolola, N.B.; Chilekana, N. Human thermal comfort and urban climate of Zambia’s economic and political hub: A RayMan model study. Model. Earth Syst. Environ. 2020, 6, 1671–1682. [Google Scholar] [CrossRef]
- Lin, T.-P.; Matzarakis, A.; Hwang, R.-L.; Huang, Y.-C. Effect of pavements albedo on long-term outdoor thermal comfort. In Berichte des Meteorologischen Instituts der Albert-Ludwigs-Universität Freiburg; Universität Freiburg: Freiburg, Germany, 2010; p. 497. [Google Scholar]
- Daneshvar, M.R.M.; Bagherzadeh, A.; Tavousi, T. Assessment of bioclimatic comfort conditions based on Physiologically Equivalent Temperature (PET) using the RayMan Model in Iran. Cent. Eur. J. Geosci. 2013, 5, 53–60. [Google Scholar] [CrossRef]
- Lee, H.; Mayer, H. Validation of the mean radiant temperature simulated by the RayMan software in urban environments. Int. J. Biometeorol. 2016, 60, 1775–1785. [Google Scholar] [CrossRef] [PubMed]
- Thorsson, S.; Lindberg, F.; Eliasson, I.; Holmer, B. Different methods for estimating the mean radiant temperature in an outdoor urban setting. Int. J. Climatol. 2007, 27, 1983–1993. [Google Scholar] [CrossRef]
- Dai, Q.; Schnabel, M.A.; Heusinkveld, B. (Eds.) Influence of height-to-width ratio: Case study on mean radiant temperature for Netherlands buildings. In Proceedings of the 46th Annual Conference of the Architectural Science Association (ASA 2012), Queensland, Australia, 14–16 November 2012. [Google Scholar]
- Lau, K.K.L.; Ren, C.; Ho, J.; Ng, E. Numerical modelling of mean radiant temperature in high-density sub-tropical urban environment. Energy Build. 2016, 114, 80–86. [Google Scholar] [CrossRef]
- Katzschner, L.; Thorsson, S. Microclimatic investigations as tool for urban design. In Proceedings of the 7th International Conference on Urban Climate (ICUC7), Yokohama, Japan, 29 June–3 July 2009. [Google Scholar]
- Iommi, M.; Losco, G. Evaluation of Easy-to-Use Energy Building Design Tools for Solar Access Analysis in Urban Contexts: Comparison of Friendly Simulation Design Tools for Architectural Practice in the Early Design Stage. Int. J. Arch. Environ. Eng. 2016, 10, 521–530. [Google Scholar]
- Azar, S.; Teller, J. Thermal characterisation of urban fabrics using GIS and Townscope modelling tool. In Proceedings of the 4th European Conference on Energy Performance & Indoor Climate in Buildings (EPIC), Lyon, France, 20–22 November 2006. [Google Scholar]
- Hien, W.N.; Ignatius, M.; Eliza, A.; Jusuf, S.K.; Samsudin, R. Comparison of STEVE and ENVI-met as temperature prediction models for Singapore context. Int. J. Sustain. Build. Technol. Urban Dev. 2012, 3, 197–209. [Google Scholar] [CrossRef]
- Jamei, E.; Ossen, D.R.; Rajagopalan, P. Investigating the effect of urban configurations on the variation of air temperature. Int. J. Sustain. Built Environ. 2017, 6, 389–399. [Google Scholar] [CrossRef]
- Salata, F.; Golasi, I.; Vollaro, R.D.L.; Vollaro, A.D.L. Urban microclimate and outdoor thermal comfort. A proper procedure to fit ENVI-met simulation outputs to experimental data. Sustain. Cities Soc. 2016, 26, 318–343. [Google Scholar] [CrossRef]
- Acero, J.A.; Arrizabalaga, J. Evaluating the performance of ENVI-met model in diurnal cycles for different meteorological conditions. Theor. Appl. Clim. 2018, 131, 455–469. [Google Scholar] [CrossRef]
- Acero, J.A.; Herranz-Pascual, K. A comparison of thermal comfort conditions in four urban spaces by means of measurements and modelling techniques. Build. Environ. 2015, 93, 245–257. [Google Scholar] [CrossRef]
- Paramita, B.; Fukuda, H. Urban Microclimate Prognostic Model in a Hot-Humid Climate Region. J. Adv. Res. Dyn. Control Syst. 2018, 10, 211–216. [Google Scholar]
- Ambrosini, D.; Galli, G.; Mancini, B.; Nardi, I.; Sfarra, S. Evaluating Mitigation Effects of Urban Heat Islands in a Historical Small Center with the ENVI-Met® Climate Model. Sustainability 2014, 6, 7013–7029. [Google Scholar] [CrossRef] [Green Version]
- Shashua-Bar, L.; Potchter, O.; Bitan, A.; Boltansky, D.; Yaakov, Y. Microclimate modelling of street tree species effects within the varied urban morphology in the Mediterranean city of Tel Aviv, Israel. Int. J. Clim. 2010, 30, 44–57. [Google Scholar] [CrossRef]
- Susca, T.; Gaffin, S.R.; Dell’Osso, G.R. Positive effects of vegetation: Urban heat island and green roofs. Environ. Pollut. 2011, 159, 2119–2126. [Google Scholar] [CrossRef]
- Yahia, M.W.; Johansson, E. Influence of urban planning regulations on the microclimate in a hot dry climate: The example of Damascus, Syria. J. Hous. Built Environ. 2012, 28, 51–65. [Google Scholar] [CrossRef]
- D’Sousa, U. Measuring green roof performance, a solution to sustainable urban development in the UEA. Int. J. Sustain. Dev. Plan. 2014, 9, 376–388. [Google Scholar] [CrossRef] [Green Version]
- Emmanuel, R.; Loconsole, A. Green infrastructure as an adaptation approach to tackling urban overheating in the Glasgow Clyde Valley Region, UK. Landsc. Urban Plan. 2015, 138, 71–86. [Google Scholar] [CrossRef] [Green Version]
- Roth, M.; Lim, V.H. Evaluation of canopy-layer air and mean radiant temperature simulations by a microclimate model over a tropical residential neighbourhood. Build. Environ. 2017, 112, 177–189. [Google Scholar] [CrossRef]
- Karakounos, I.; Dimoudi, A.; Zoras, S. The influence of bioclimatic urban redevelopment on outdoor thermal comfort. Energy Build. 2018, 158, 1266–1274. [Google Scholar] [CrossRef]
- Manandhar, P.; Bande, L.; Tsoupos, A.; Marpu, P.R.; Armstrong, P.R. A Study of Local Climate Zones in Abu Dhabi with Urban Weather Stations and Numerical Simulations. Sustainability 2019, 12, 156. [Google Scholar] [CrossRef] [Green Version]
- Shinzato, P.; Simon, H.; Duarte, D.H.; Bruse, M. Calibration process and parametrization of tropical plants using ENVI-met V4 – Sao Paulo case study. Arch. Sci. Rev. 2019, 62, 112–125. [Google Scholar] [CrossRef]
Figure 1.
The main journals where the reviewed papers were published.

Figure 2.
Distribution of the reviewed papers by year of publication.

Figure 3.
Distribution of the reviewed papers by region.

Figure 4.
Types of green infrastructure (GI) in the reviewed papers.


Table 1.
Ranking of the main reviewed journals based on their Scimago Journal Rankings (SJR) (as per 2019 rankings) (scimagojr.com).
Table 1.
Ranking of the main reviewed journals based on their Scimago Journal Rankings (SJR) (as per 2019 rankings) (scimagojr.com).
| Journal Name | Country | SJR | Best Quartile | Number of Reviewed Papers |
|---|---|---|---|---|
| Sustainability | Switzerland | 0.58 | Q2 | 12 |
| Building and Environment | UK | 1.87 | Q1 | 10 |
| Sustainable Cities and Society | The Netherlands | 1.36 | Q1 | 9 |
| Landscape and Urban Planning | The Netherlands | 1.74 | Q1 | 8 |
| Urban Forestry and Urban Greening | Germany | 1.18 | Q1 | 4 |
| Theoretical and Applied Climatology | Austria | 0.97 | Q2 | 3 |
| Energy and Buildings | The Netherlands | 2.06 | Q1 | 3 |
| Urban Climate | The Netherlands | 1.04 | Q1 | 2 |
| Architectural Science Review | UK | 0.39 | Q1 | 2 |
Table 2.
Comparison of the common microclimate modelling tools.
| Criteria | RayMan | SOLWEIG | Townscope | ENVI-met4.4 |
|---|---|---|---|---|
| High spec. computer requirement | No | No | No | Yes |
| Vegetation | Simple | Simple | Simple | Complex |
| Forcing meteorological parameters | No | No | No | Yes |
| Thermal indices | PMV, PET, SET, UTCI, PT, mPET | PET | Sweat rate, sweat evaporation, skin wetness, sensation temperature | PMV, PET, UTCI, SET |
| Long simulation time | No | No | No | Yes |
| Cost | Free | Free | License | License |
| Advantages | Various thermal indices; simulation only requires short time. | Simulates MRT accurately. | Simple; output in form of map (visual). | Various thermal indices; can simulate complex vegetation schemes. |
| Disadvantages | Limited design strategies. | Limited thermal indices. | Cannot create objects; meteorological parameters kept constant during simulation. | Long simulation times; instability issues. |
| Website link | www.urbanclimate.net/rayman | gvc.gu.se | www.townscope.com | www.envi-met.com |
Full form of all abbreviations can be found in the list of abbreviations at the end of the paper.
Table 3.
A summary of the reviewed studies.
| No | Author | Country | GI Type | Parameters Measured | Main Findings |
|---|---|---|---|---|---|
| 1 | Tsoka [66] | Greece | Tree, grass, shrubs | Ta | A reduction in Ta up to 0.6 °C and Ts of asphalt up to 15 °C with additional trees. |
| 2 | Sodoudi [13] | Iran | Tree, grass, green roofs | Ta, RH | High albedo material and vegetation combination showed higher cooling effect during the daytime. |
| 3 | Chatzidimitriou [15] | Greece | Tree, grass | Ts, MRT, PET | Aspect ratio has strong effect on PET and is significant for courtyard. Water, wet soil and grass have a similar effect for square and courtyard. |
| 4 | Skelhorn [19] | UK | Tree, grass, shrubs, green roofs | Ta, Ts | Increasing 5% of mature deciduous trees can reduce 1 °C temperature. The worst scenario is having no green space. |
| 5 | Wu [20] | China | Tree, grass | Ta, solar irradiance, sensible heat | A different tree spatial arrangement had different effects on intercepting shortwave radiation and led to Ta variation. |
| 6 | Lin [18] | Taiwan | Parks | Ta | A larger total park area, a greater area of the largest park, evenly distributed park spaces and more park diversity led to a significant outdoor cooling effect. |
| 7 | Muller [36] | Germany | Tree, grass, green roofs | Ta, RH, PET | Increasing WS reduced PET significantly during day and night. Vegetation achieved a higher PET reduction compared to water. |
| 8 | Herath [53] | Sri Lanka | Tree, green roofs, green walls | Ta, RH | Combination of trees at curbsides, 50% green roofs and green walls led to a maximum temperature reduction of 1.9 °C |
| 9 | Lobaccaro [61] | Spain | Tree, grass, green roofs | Ta, Ts, MRT, RH, WS | The highest PET reduction by combining trees and grass (reduced two PET classes). Aspect ratio and materials of urban canyon affect the intensity and duration of discomfort. |
| 10 | Ng [75] | Hong Kong | Tree, grass | Ta | At least 33% tree coverage of the total area is needed to reduce 1 °C of Ta. |
| 11 | Perini [68] | Germany | Tree | MRT, UTCI | Shrub or vertical greening may prevent the reduction in air flow which influences the thermal comfort condition. Combination of ENVI-met and TRNSYS results in a more reliable value of MRT. |
| 12 | Rui [60] | China | Tree, grass, shrubs | Ta, RH, MRT, WS, PMV | Increasing tree quantity will improve PMV slightly, although it increases pollutant concentration slightly. |
| 13 | Yahia [45] | Tanzania | Tree | Ta, RH, MRT, WS, PET | Dense trees enhance the thermal comfort condition. PET is more sensitive to MRT than wind speed. The area with low-rise buildings leads to more heat stress than in high-rise buildings. |
| 14 | Zhang [73] | China | Tree | Ta, MRT, WS, PET | The impact of vegetation on thermal comfort depends on tree arrangement, LAI, crown width and height. Trees with aspect ratio <2 improve PET significantly. |
| 15 | Lee [76] | Germany | Tree, grass | Ta, MRT, PET | Trees are more effective in mitigating human heat stress than just grass land. |
| 16 | Afshar [77] | Iran | Tree, grass | Ta, RH, WS | More percentage of deciduous trees and grass will increase temperature and improve thermal comfort in winter. |
| 17 | Razzaghmanesh [82] | Australia | Green roofs | Ta, heat flux, | Green roofs are able to increase albedo and reduce temperature. An additional 30% of green roofs would reduce electricity consumption by 2.57 W/m2/day in the area. |
| 18 | Perini [54] | Italy | Tree, grass, shrubs, green roofs | Ta, MRT, PMV | Greening on the ground (tree, grass, shrubs) is more effective for reducing Ta, MRT, PMV at the street level (1.6 m high) than the application of green roofs. |
| 19 | Jamei [88] | Australia | Tree, green roofs | MRT, PET | Increasing building height and tree canopy improve PET yet implementing green roofs does not improve PET at the pedestrian level. |
| 20 | Rui [59] | China | Tree, grass, shrubs | Ta, RH, MRT, WS, PMV | Reduction in grass and shrubs replaced by trees (under the same green coverage ratio) impact thermal comfort, wind speed, air pollution. |
| 21 | O’Malley [92] | UK | Tree, grass, shrubs | Ta | Vegetation is the most effective strategy while water bodies are the most resilient in mitigating the effect of UHI. |
| 22 | Yang [93] | China | Tree, grass | Ta, RH, Ts, WS | Grass temperature decreases rapidly after sunset and was lower than the ambient temperature. |
| 23 | Taleghani [101] | The Netherlands | Tree | Ta, MRT | Deciduous trees can protect spaces from direct sun and improve thermal comfort condition. Courtyard shape provides the most comfortable hours in summer. |
| 24 | Jamei [62] | Australia | Tree | Ta | Increasing 4% of green cover led to reduction of 0.2 °C in temperature. Maximum cooling effect occurs at mid-afternoon. |
| 25 | Ambrosini [121] | Italy | Tree, grass, shrubs, green roofs | Ta, RH, WS | Mitigation scenarios by using green or cool roofs showed a reduction in temperature. |
| 26 | Shasua-Bar [28] | Israel | Tree, grass | Ta, RH, WS | Combination of shade trees + grass reduced ambient temperature by up to 2°. The only-grass scenario slightly reduced the temperature. |
| 27 | Shasua-Bar 2010 [122] | Israel | Tree | Ta | Cooling effect of trees can reach a 50% temperature rise during the day. The capability of cooling of trees mostly depends on its canopy and planting density, little on species. |
| 28 | Park [30] | Japan | Tree | Ta, WS, solar radiation | Sidewalk trees reduce wind speed and globe temperature due to the reduction radiation flux from the trees shade. Trees on median do not have a remarkable effect. |
| 29 | Zhang [100] | USA | Tree, grass | Ta | With optimal placement, significant cooling will be achieved. Clustered green space enhanced local cooling, dispersed pattern leads to greater regional cooling. |
| 30 | Susca [123] | USA | Green roofs | Ta | An average 2 °C temperature difference between the vegetated and non-vegetated area. Green roofs have more thermal resistance than black roofs. |
| 31 | Tan [50] | Hong Kong | Tree | Ta, Ts, sensible heat flux, longwave radiation | Cooling effect of urban trees is highly associated with SVF. |
| 32 | Zhao [55] | Hong Kong | Tree, grass | Ta, RH, MRT | Green and blue areas demonstrate potential for heat mitigation. The grey areas have the highest possibility in uncomfortable thermal environment generation. |
| 33 | Dain [56] | Korea | Tree, grass | PMV | The shade provided by buildings resulted in more thermal comfort than the shade provided by trees. |
| 34 | Jamei [116] | Malaysia | Tree | Ta | Daytime air temperature decreased with an increasing aspect ratio (AR). Tree canopy influence pedestrian PET. |
| 35 | Acero [119] | Spain | Tree | Ta, RH, MRT, WS | Urban greenery reduces temperature and increases air humidity during daytime due to evapotranspiration. |
| 36 | Batista [74] | Italy | Tree | Ta | During the hottest hours of the day, trees with a height of 5 or 15 m can increase air temperature due to their capability to hinder the wind. |
| 37 | Johansson [69] | Ecuador | Tree | PET | Scenarios of trees along the street, increased building height and horizontal shading make lower PET values (only in noon). Increased albedo will make higher PET values. |
| 38 | Srivanit [58] | Japan | Tree, green roofs | Ta, RH, WS, solar irradiance | The maximum average temperature decreased by 2.2 °C when the quantity of trees was increased by 20%. |
| 39 | Yahia [124] | Syria | Tree | Ts, PET | There is a strong influence of vegetation on surface temperature and outdoor thermal comfort for the street with detached buildings. |
| 40 | D’Souza [125] | UAE | Green roofs | SA, RH, MRT, WS, PMV | Implementing green roof increases surface albedo and decreases T and MRT, which can improve thermal comfort. |
| 41 | Duarte [63] | Brazil | Tree | Ta, MRT, Ts, PET | In summer, the scenario of trees along sidewalk results in the lowest temperature. The central park scenario decreased MRT. |
| 42 | Emmanuel [126] | UK | Tree | Ta, PMV | The increasing green cover area by 20% led to a reduction in the surface temperature by up to 2 °C. |
| 43 | Kim [87] | South Korea | Green roofs | Ta, RH | Intensive green roofs are the most effective type of green roof to reduce temperature. The roofs can reduce temperature across a wider area in the morning than in the afternoon. |
| 44 | Morakinyo [81] | Hong Kong | Tree | Ta, MRT, solar attenuation, PET | TCA improved thermal comfort, and magnitude varies depending on the pattern. In TCA = 0.6, PET with double-rows planting is higher than the centre tree planting. |
| 45 | Kleerekoper [72] | The Netherlands | Tree, grass | Ta, WS | Vegetation has the most effective cooling, while the maximum cooling effect with trees is 20 °C and grass 8 °C. Building form and height are less significant compared to vegetation, WS and the amount of buildings. |
| 46 | Roth [127] | Singapore | Tree, green roofs | Ta, MRT | Green roofs have the potential to provide cooling not just during the day but also at night time. Removing trees significantly increases air temperature during the daytime. |
| 47 | Salata [64] | Italy | Tree, grass, shrubs | Ta, MRT, MOCI | Significant decrease in MOCI with a combination scenario (vegetation, cool roof, cool pavement).The worst scenario is using asphalt and without vegetation. |
| 48 | Karakounos [128] | Greece | Tree | Ta, MRT, PMV | Vegetation has a positive impact on thermal comfort under hot summer conditions. |
| 49 | Manandhar [129] | Abu Dhabi | Tree | Ta, Ts | The zones with high vegetation do not show a large average UHI effect, whereas the effect is significant in densely built zones. |
| 50 | Shinzato [130] | Brazil | Tree | Ta | The parameters of trees such as the albedo of leaves, LAD, geometry of the crown show a significant influence on temperature. |
Publisher’s Note: MDPI stays neutral with regard to jurisdictional claims in published maps and institutional affiliations. |
© 2020 by the authors. Licensee MDPI, Basel, Switzerland. This article is an open access article distributed under the terms and conditions of the Creative Commons Attribution (CC BY) license (http://creativecommons.org/licenses/by/4.0/).
Share and Cite
MDPI and ACS Style
Balany, F.; Ng, A.W.; Muttil, N.; Muthukumaran, S.; Wong, M.S. Green Infrastructure as an Urban Heat Island Mitigation Strategy—A Review. Water 2020, 12, 3577. https://0-doi-org.brum.beds.ac.uk/10.3390/w12123577
AMA Style
Balany F, Ng AW, Muttil N, Muthukumaran S, Wong MS. Green Infrastructure as an Urban Heat Island Mitigation Strategy—A Review. Water. 2020; 12(12):3577. https://0-doi-org.brum.beds.ac.uk/10.3390/w12123577
Chicago/Turabian StyleBalany, Fatma, Anne WM Ng, Nitin Muttil, Shobha Muthukumaran, and Man Sing Wong. 2020. "Green Infrastructure as an Urban Heat Island Mitigation Strategy—A Review" Water 12, no. 12: 3577. https://0-doi-org.brum.beds.ac.uk/10.3390/w12123577
Note that from the first issue of 2016, this journal uses article numbers instead of page numbers. See further details here.