Effect of Hydraulic Retention Time on the Treatment of Real Cattle Slaughterhouse Wastewater and Biogas Production from HUASB Reactor


1
Department of Civil Engineering, Faculty of Engineering, Universiti Putra Malaysia, Serdang, Selangor 43400, Malaysia
2
Department of Civil and Water Resources Engineering, University of Maiduguri, P.M.B., Maiduguri 1069, Borno State, Nigeria
*
Author to whom correspondence should be addressed.
Water 2020, 12(2), 490; https://0-doi-org.brum.beds.ac.uk/10.3390/w12020490
Submission received: 3 October 2019
/
Revised: 11 November 2019
/
Accepted: 18 November 2019
/
Published: 11 February 2020
(This article belongs to the Section Wastewater Treatment and Reuse)
Abstract
:Anaerobic digestion technology provides an alternative route for sustainable management of organic waste. In this study, the performance of the hybrid upflow anaerobic sludge blanket (HUASB) reactor consisting of synthetic grass media as attached growth surface was investigated for the treatment of cattle slaughterhouse wastewater under mesophilic (35 ± 1 °C) condition. After acclimatization with synthetic wastewater, the reactor was loaded up to OLR 10 g L−1d−1, corresponding to 20 g COD/L at a varying hydraulic retention time (HRT) of 24, 30, 36, 42, and 48 h. The system attained a maximum COD removal efficiency of 97% total suspended solids (TSS), volatile suspended solids (VSS), fats, oil, and grease (FOG), color removal, and turbidity were found as 97%, 284 mg/L, 79%, 78%, and 91% respectively. The biogas production after 48 h was found as 38 L/d, with about 85% methane and specific methane production of 0.24 LCH4/gCODadded. The ratio of alkalinity was 0.22, while ammonia nitrogen concentration reached a maximum of 839 mg/L at a steady state. Scanning electron microscopic (SEM) analysis revealed a predominance of Methanosarcina bacteria with the coccoidal shape at the end of the performance study. Therefore, the results of the experiment showed that increasing HRT significantly affects the performance of the system.
1. Introduction
Commercial cattle slaughterhouse wastewater is considered to be high-strength industrial wastewater due to high chemical oxygen demand (COD), biological oxygen demand (BOD), fats, oil, and grease (FOG), and total suspended solids (TSS). Discharge of untreated and improperly treated slaughterhouse wastewater into a receiving water body affects the quality of water mainly by introducing macronutrients (nitrogen and phosphorus), thus resulting in excessive growth of algae in the receiving water surface and reduction of dissolved oxygen supply to the aquatic environment. Consequently, the absence of dissolved oxygen supply to the aquatic environment could result in the death of the aquatic animals as a result of eutrophication. Eutrophication effect subjects the aquatic environment to anaerobic condition, leading to the release of a large amount of methane (CH4) and carbon dioxide (CO2) freely into the atmosphere. The release of these gases forms a large portion of greenhouse gases. A reasonable proportion of these greenhouse gas emissions are related to the uncontrolled degradation of organic matter contained in the increasing amount of human-produced waste [1,2,3]. Moreover, the high concentration of color in the slaughterhouse wastewater (SWW) could also impede light penetration to the aquatic environment.
The general public health related to the discharge of untreated SWW into water bodies is the transmission of pathogenic microorganisms to humans through direct contact with people working within the slaughterhouses or indirect interaction by the community that is using the water for cleaning, swimming, or irrigation purposes. Moreover, developing countries like those in Africa and Asia have experienced bloody diarrhea, gastrointestinal diseases, and, in some cases, death associated with the presence of viruses, protozoa, helminthic eggs, and bacteria in SWW. Metcalf [4] and US EPA [5] showed that effluent from slaughterhouse wastewater might contain COD concentration between 3000 and 30,000 mg/L. However, Rajab et al. [6], reported a low SWW contamination concentration with COD = 3102 ± 688 mg L−1, FOG = 375 ± 151 mg L−1, suspended solids of 872 ± 178 mg L−1, total Kjeldahl nitrogen 186 ± 27 mg L−1, and total phosphate (PO4−3-P) of 76 ± 36 mg L−1. However, the work of Johns and Harrison [7] revealed COD concentrations of two different slaughterhouses varying from the medium of 1000–3000 mg L−1 to a high strength of 5000–10,000 mg L−1. Organic constituents such as the high nitrogen concentration and color in slaughterhouse wastewater may cause serious environmental impact like eutrophication, and this might result in dissolved oxygen depletion, which can have a severe impact on the ecosystem [8]. Komplex abattoir shah Alam located in Selangor, Malaysia, is discharging high-strength cattle slaughter wastewater with an average COD of 32,000 ± 112 mg/L, BOD = 17,158 ± 95 mg/L, and TSS concentration of 22,300 ± 212 mg/L.
The wastewater is discharged into a receiving water body without adequate treatment. The most commonly applied treatment technology for SWW, especially from the economic point of view, is the upflow anaerobic sludge bed UASB reactor. Wastewater such as starch wastewater [9], cheese whey [10], potato-juice [11], and palm oil mill effluent [12] were successfully treated by using UASB reactors. This could be due to the UASB reactors’ high flexibility, high efficiency, biogas production, and overall lower cost of maintenance. For instance, the study of response of morphology and microbial community structure of influent COD/SO42− ratio in UASB reactor by Lu et al. [13] revealed a biogas production of 1.15 ± 0.21 L L−1d−1, 1.16 ± 0.22 L L−1 d−1, and 1.17 ± 0.33 L L−1d−1 at COD loading rates of 10, 5, and 3 g/L, whereas the corresponding methane yields were 67.3 ± 3.1%, 64.0 ± 1.7%, and 61.3 ± 1.6%, respectively. In their previous study, a biogas production of 1.15 ± 1.17 L L−1d−1 was recorded [14].
Claudia et al. [15] evaluated a three-phase separation system UASB reactor treating slaughterhouse wastewater and found a biogas production of 11 L−d (STP). The COD removal efficiency varies between 77% and 91% at an average OLR of 3.5 and 6.5 kg COD m−3d−1. However, application of UASB reactor in the treatment of wastewaters from abattoir industries is still incipient, owing to the shortcomings of insoluble organic material which results in biomass loss and, consequently, a decline in the biogas yield, sludge washout at low hydraulic retention time (HRT), the slow-growing microorganisms, and high scum accumulation that hinders the free flow of biogas out the reactor. Therefore, modification of the UASB reactor is required to overcome the existing deficiencies, especially during the treatment of high-strength wastewater like the cattle slaughterhouse wastewater (CSWW). In this work, the UASB reactor was modified by coupling a round synthetic grass (SG) in the sludge zone to serve as an attached growth surface. Also, a flat round plastic mesh attached with SG was introduced at the center to counteract the effect of sludge washout and suspended solids due to upflow velocity. The modified system is believed to provide a UASB reactor capable of overcoming the problems of the conventional UASB reactor.
2. Materials and Methods
2.1. Cattle Slaughterhouse Wastewater
The cattle slaughterhouse wastewater (CSWW) was collected from the discharge outlet of Komplex abattoir Shah Alam, located in Section 15, Selangor, Malaysia. The industry discharges wastewater in two separate foams. The units consist of the blood containing wastewater generated during slaughtering and cleaning processes, while the other unit is the wastewater from the offal and internal organs washing, coupled with some dung. The wastewater used for this unit was the one collected from the first unit discharge point, and the pH was measured. It was then transported to the public health and environmental engineering laboratory, faculty of engineering, Universiti Putra Malaysia.
2.2. Characterization of the Wastewater
Upon arrival to the laboratory, the pH of the sample wastewater was again measured to confirm if there was a changing pH due to transport time difference. The CSWW sample was screened to remove large particles and subsequently analyzed for physicochemical parameters, using standard methods of water and wastewater examination [16]—the details of which are given Table 1. However, after the analysis, the feed wastewater was maintained in a refrigerator at 4 °C.
2.3. Experimental Setup
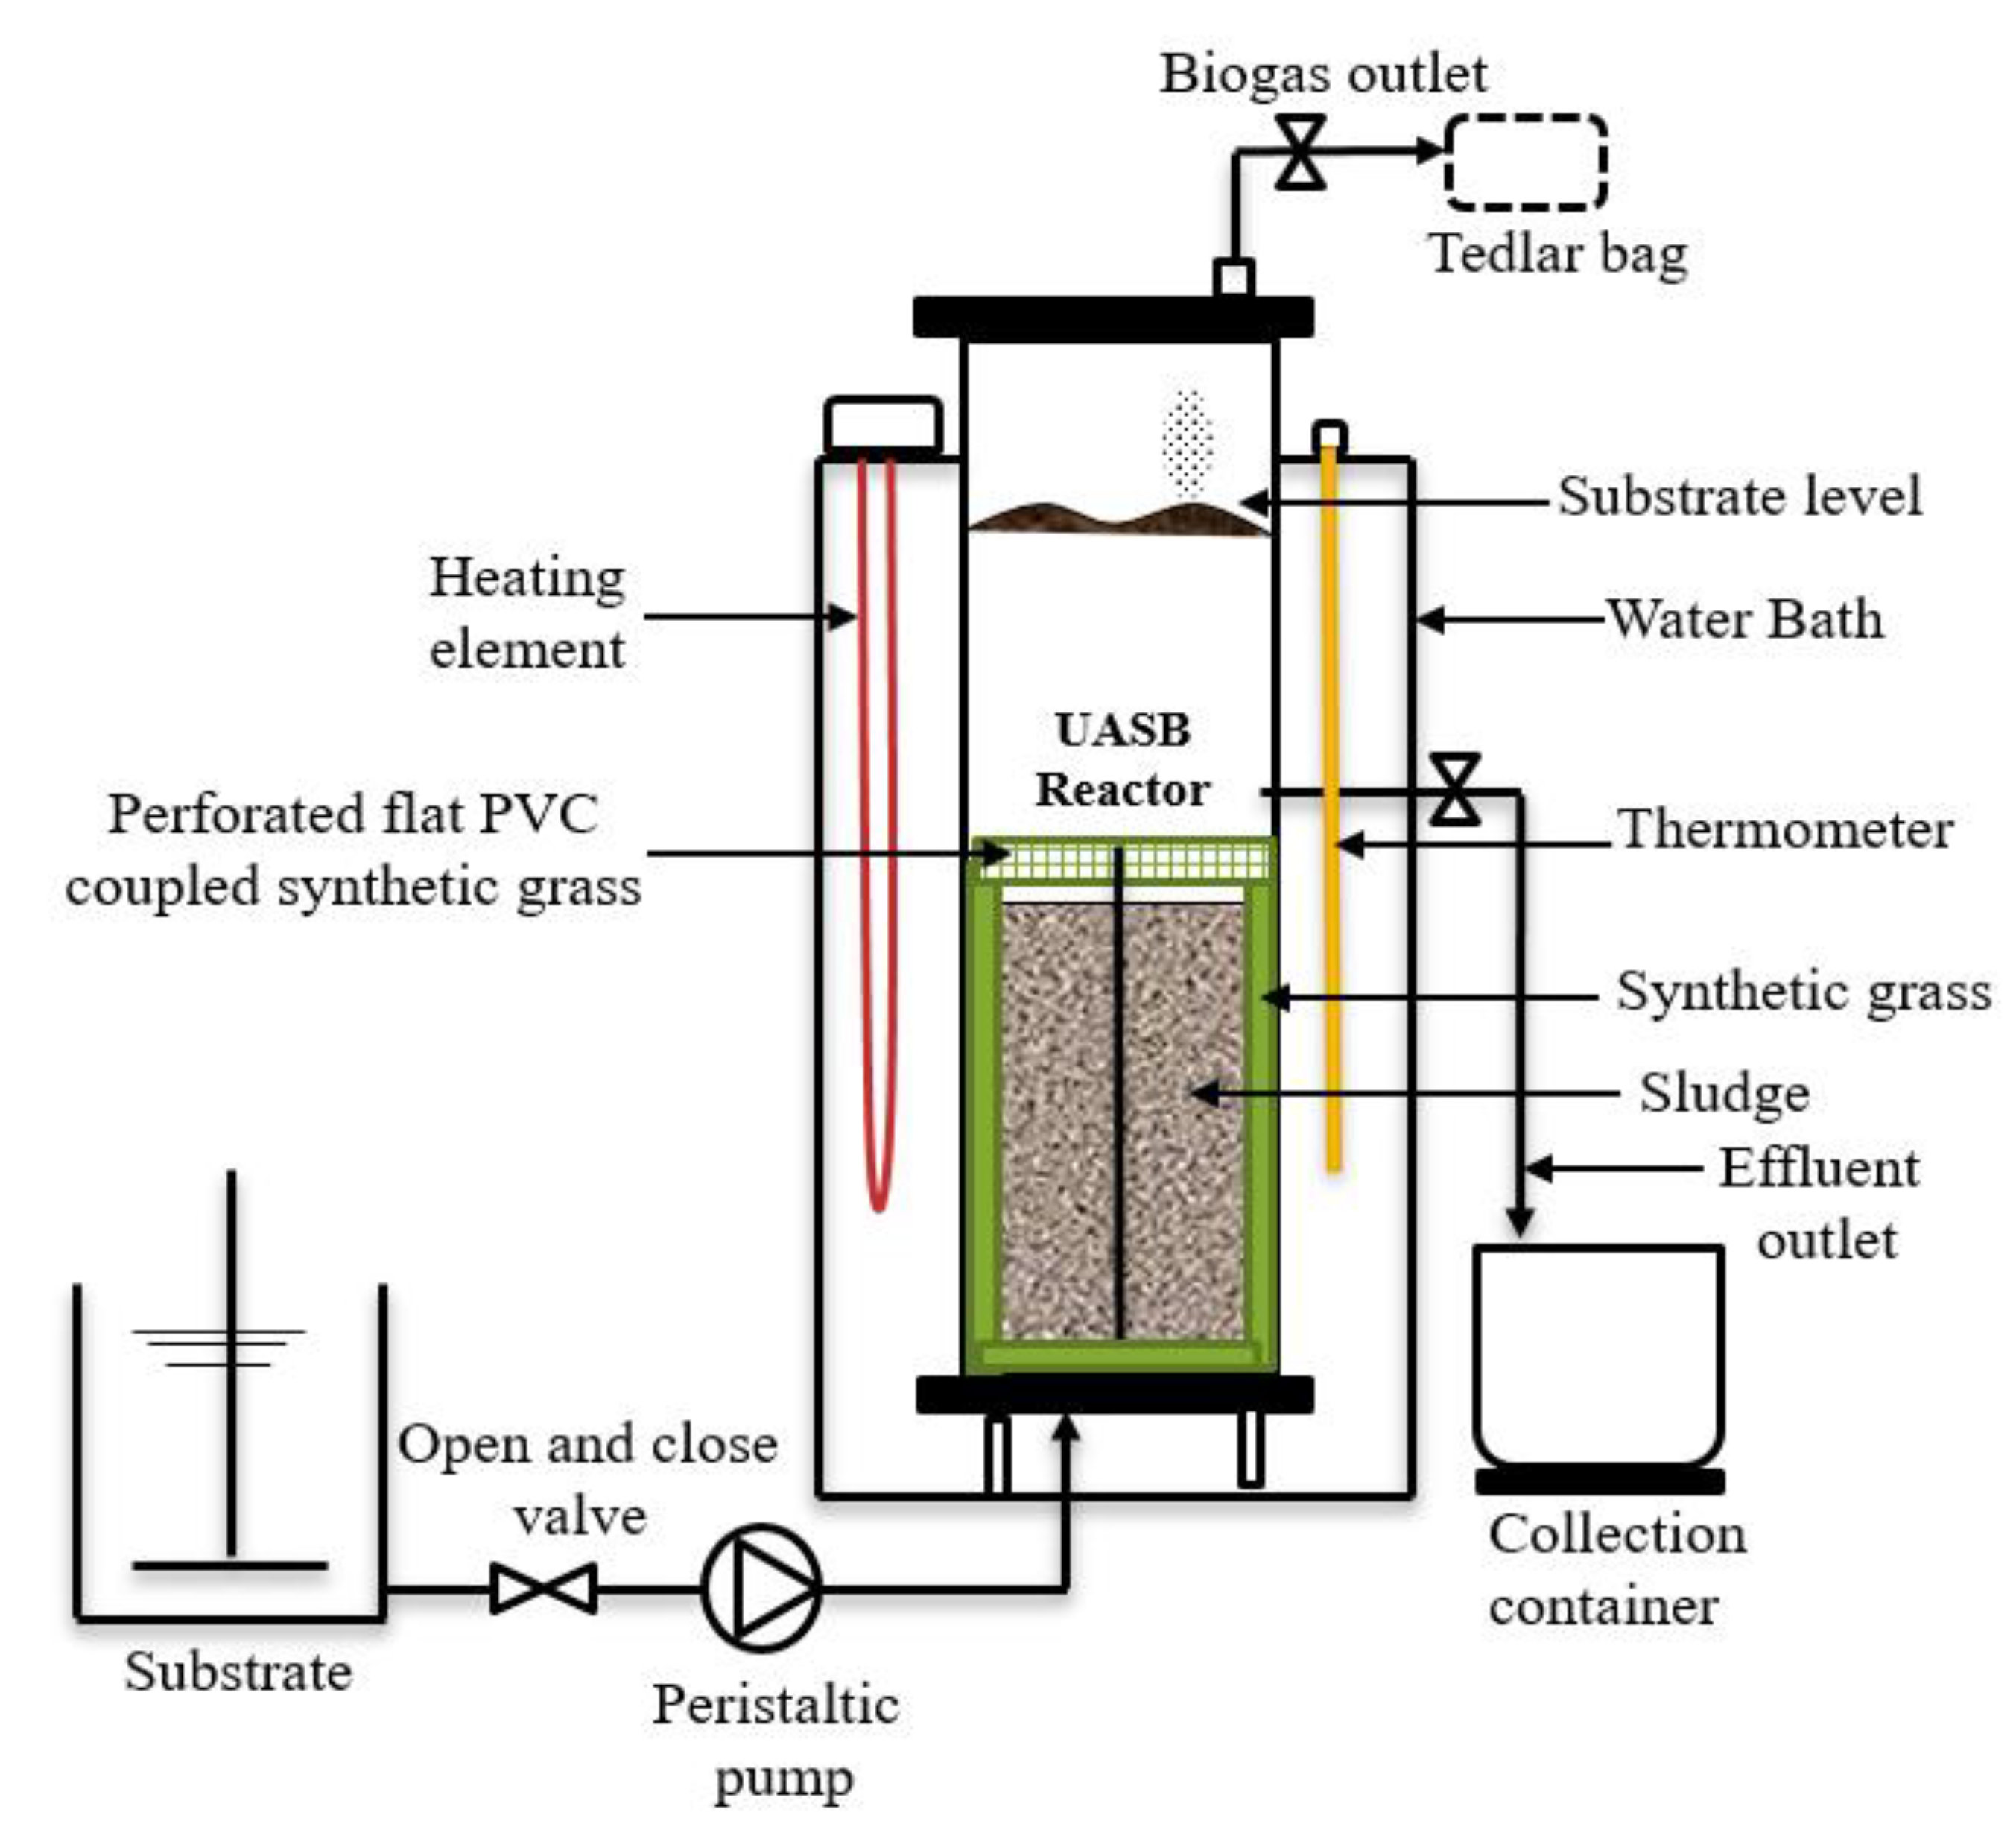
A laboratory-scale hybrid HUASB (HUASB) reactor was made from polyvinyl chloride (PVC), with a total effective volume of 12 L, a diameter of 180 mm, and a total height of 700 mm. The system was maintained at mesophilic temperature (37 ± 1 °C) range, using a temperature-controlling device that was placed above the water bath, with the heating element deep down the water. A constant organic loading rate (OLR) was maintained by pumping the influent waste upward with the use of a dosing pump. Apart from the influent inlet at the bottom and gas outlet flows out from the top, the reactor had an effluent outlet along 210 cm height and a thermometer place and immersed by the side of the water bath for temperature measurement. A 25 mm synthetic grass (SG) (BLS HOME DECO 25MM 1M X 1M) was placed inside the reactor for the attached growth surface. Also, a flat-round perforated PVC coupled with SG as filter media was inserted slightly above the sludge, to improve the total suspended solids (TSS) removal or sludge washout. The schematic diagram of the HUASB, along with the media used in this study, is illustrated in Figure 1.
2.4. Acclimatization of the Seed Sludge
The seed sludge used in this study was collected from the wastewater treatment plant located behind the faculty of engineering, Universiti Putra Malaysia. The TSS, pH, and COD of the seed sludge were 12,410 ± 125 mg/L, 7.8 ± 0.3, and 15 g/L. The reactor HUASB was loaded with 6 L of the seed sludge, occupying about 40% of the total reactor volume from the bottom, while continuous feeding with an equal volume of low-concentration synthetic wastewater was fed on daily basis. The procedure for preparing the synthetic wastewater was adopted from Rosli et al. [17]. The COD concentration of the synthetic wastewater was 203,000 mg/L, and the detailed composition of synthetic wastewater is shown in Table 2.
2.5. Continuous Study Operation Condition
The performance of the HUASB reactor treating raw cattle slaughterhouse wastewater was monitored at constant OLR and varied HRT. Table 3 represents the strategy employed during continuous study. However, the overall system performance was evaluated by parameters such as the rate of biogas production and its methane composition, COD removal efficiency, TSS, volatile suspended solids (VSS), pH, NH3-N, FOG, color, turbidity, and SEM.
2.6. Analytical Methods
Effluent parameters such as COD, TSS, VSS, pH, FOG, and alkalinity ratio were determined according to standard methods for the examination of water and wastewater [16]. The pH of the effluent was measured by using a pH meter (Mettler-Toledo AG, 8603 Schwarzenbach, Switzerland). A spectrophotometer (HATCH DR 900, Loveland, USA) (salicylate powder pillow method 8155) was used for the determination of ammonia nitrogen (NH3–N) concentration. The titrimetric method was employed for evaluating partial alkalinity (PA), by titrating 0.02N H2SO4 to produce an effluent with pH 5.75, and total alkalinity (TA) by titrating 0.02N H2SO4 to pH 4.3, using 50 mL burette (DIN AS, Lauda-Königshofen, Germany). The color was reported as true color measured based on APHA Platinum-Cobalt Standard Method (method 8025), using a DR 900 portable colorimeter (HACH, Loveland, USA), while turbidity was determined by Absorptometric Method (8237), using the same instrument, and the values was revealed in Formazin Attenuation Units (FAU). Biogas production was measured by water displacement method, and the composition analyses was carried out by using a gas chromatograph (HP 6890 N) (Agilent, Santa Clara, CA 95051, USA) equipped with a thermal conductivity detector (TCD) (Agilent, Santa Clara, CA 95051, USA). The column was HP Molesieve (Agilent Technologies, Santa Clara, CA, USA) of 30 m length × 0.5 mm ID × 40 μm film thickness capillary column. The splitless inlet, oven, and TCD detector temperatures were all kept at 60, 70, and 200 °C, respectively. Argon functioned as the carrier gas, while nitrogen was used as the makeup gas.
3. Results and Discussion
3.1. Performance of HUASB Reactor during the Acclimatization Period
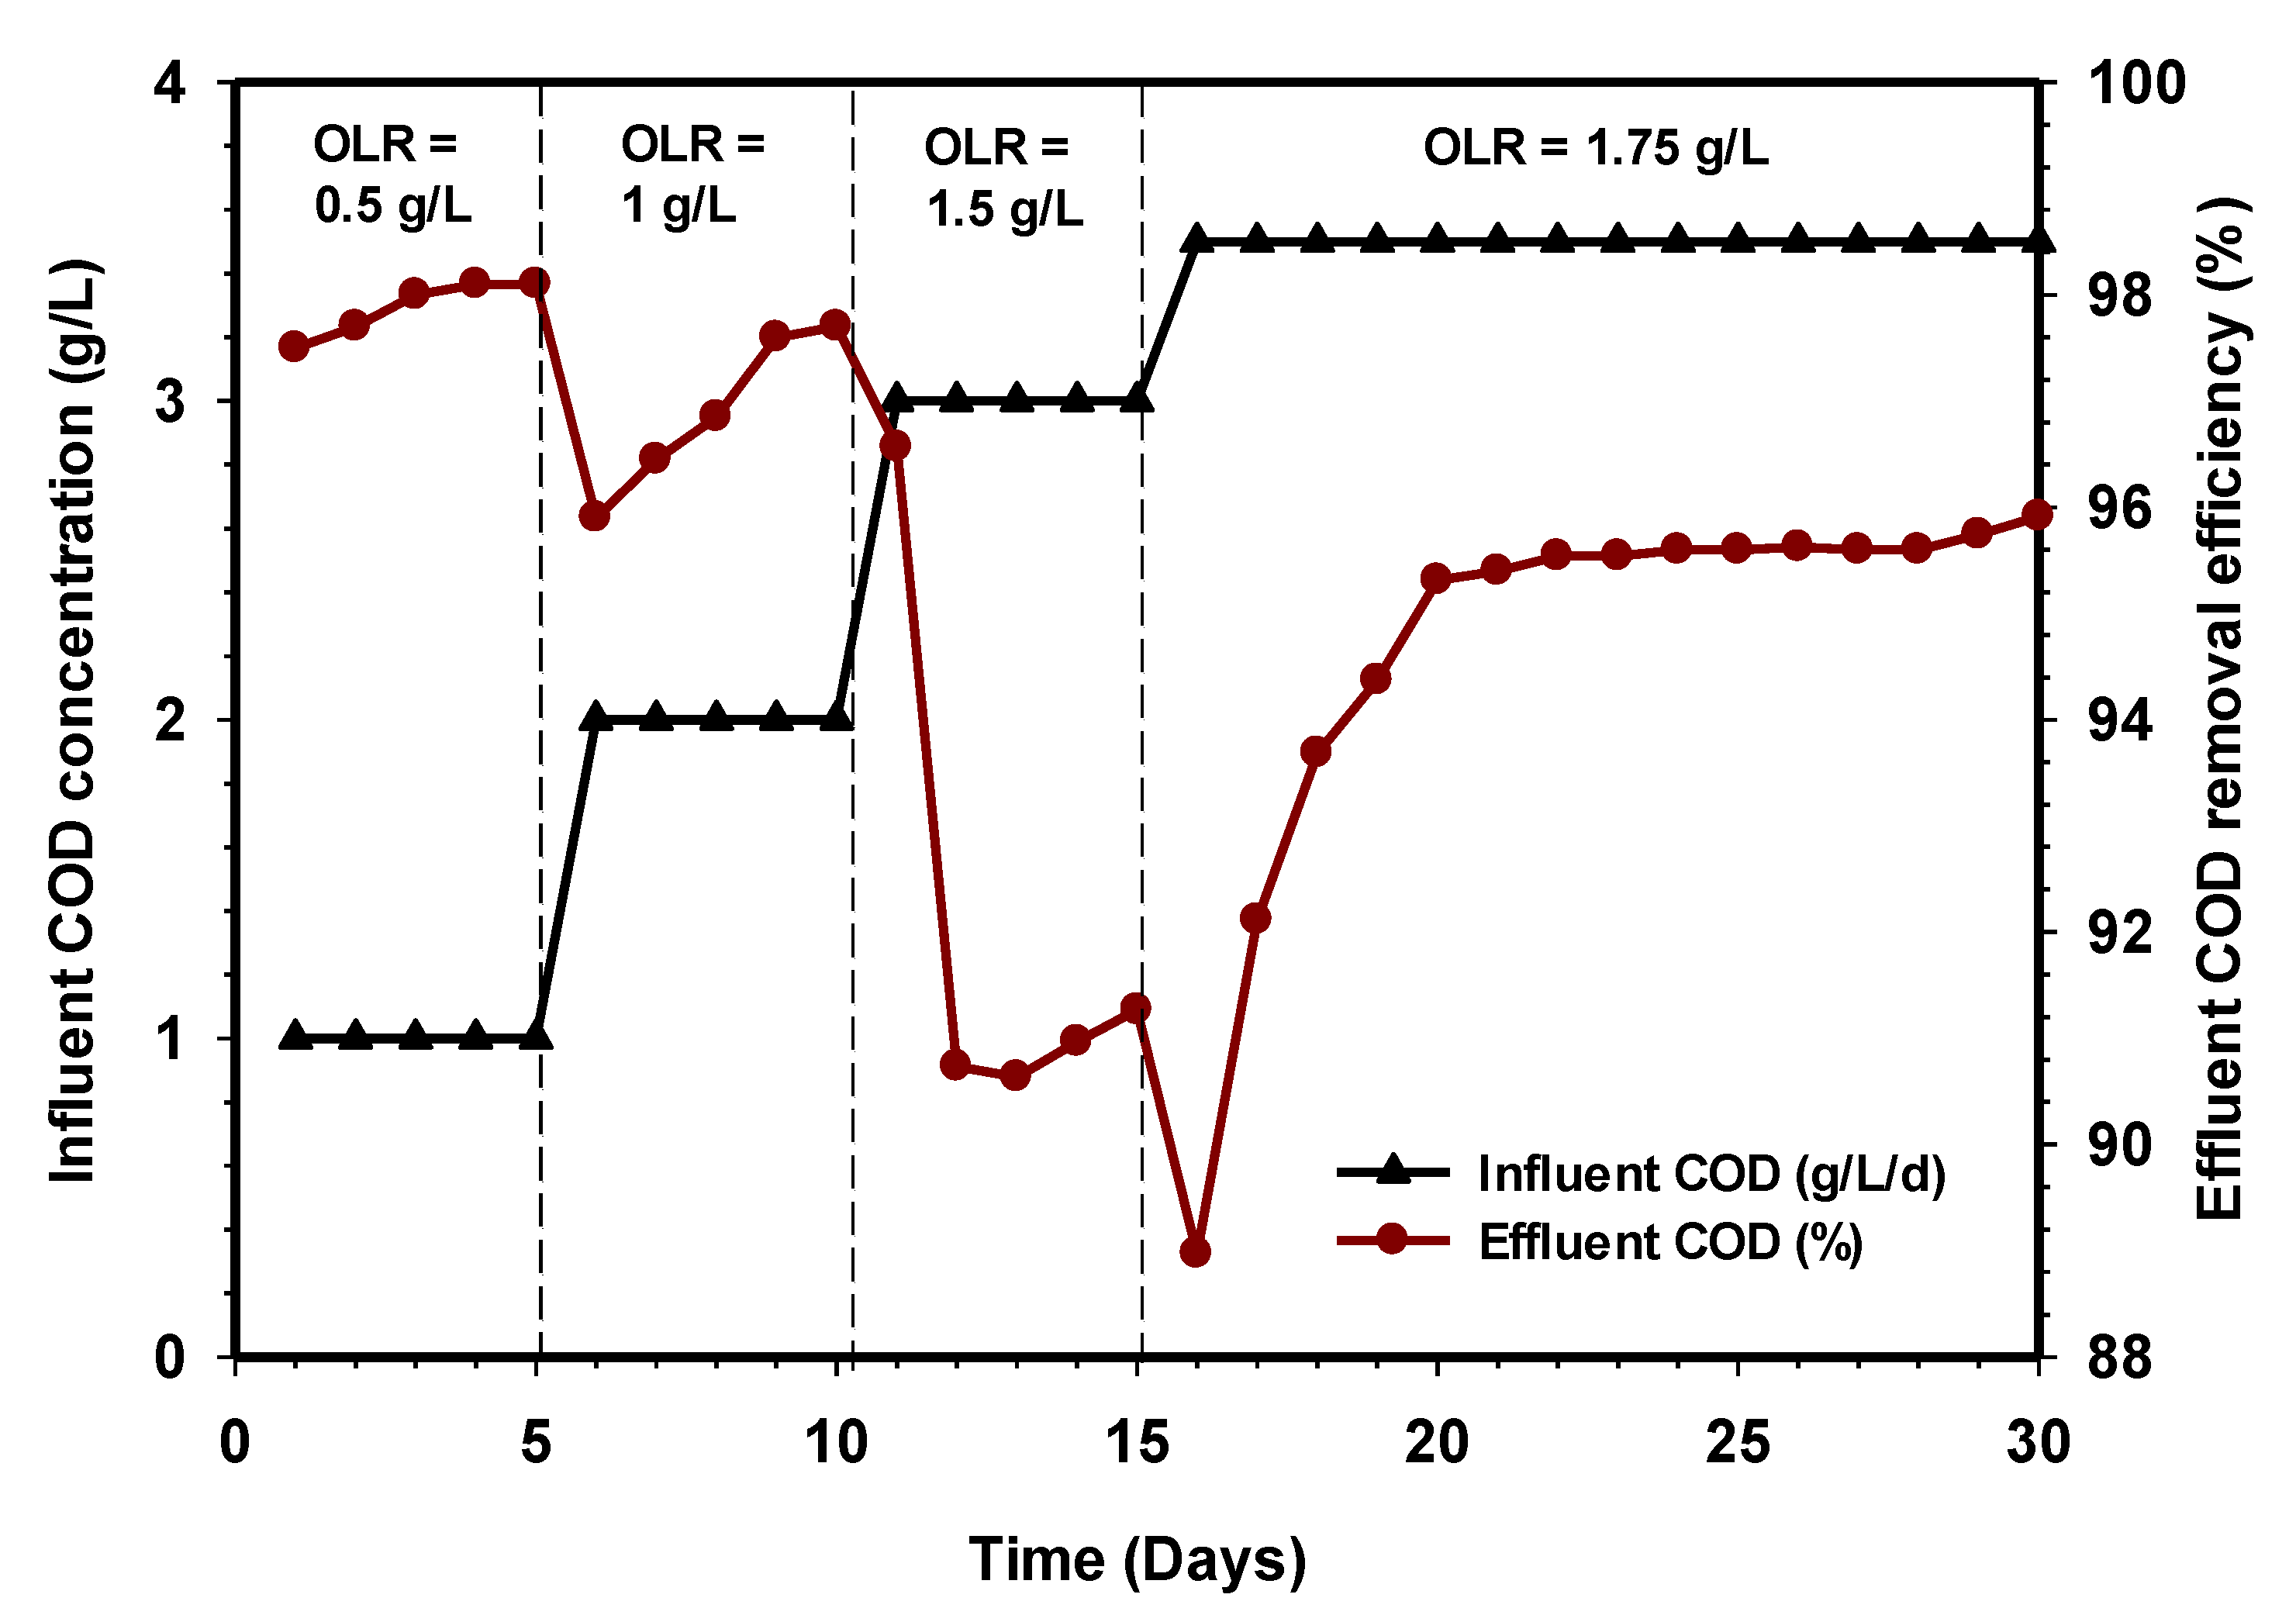
Prior to feeding raw CSWW, the influent COD concentration of the synthetic wastewater was varied from 0.5 to 1.75 g/L. The COD removal efficiency during the acclimatization period gradually increased at a slow rate before reaching a stable state, and this was reflected in all the stages of the different OLR, as seen in Figure 2. The amount of COD removal efficiency was >94% between OLR 0.5 and 1.5 g/L, reaching 96% at a steady-state OLR of 1.75 g/L. These results indicate that the acclimatization period of the seed sludge was over, and the reactor was ready to receive raw slaughterhouse wastewater exclusively. Other parameters such as TSS, VSS, and NH3-N were found as 29, 24, and 81 mg/L, respectively. However, these are average parameters measured at the end of the acclimation period.
3.2. Effect of Increasing HRT on Biogas Production from the HUASB Reactor
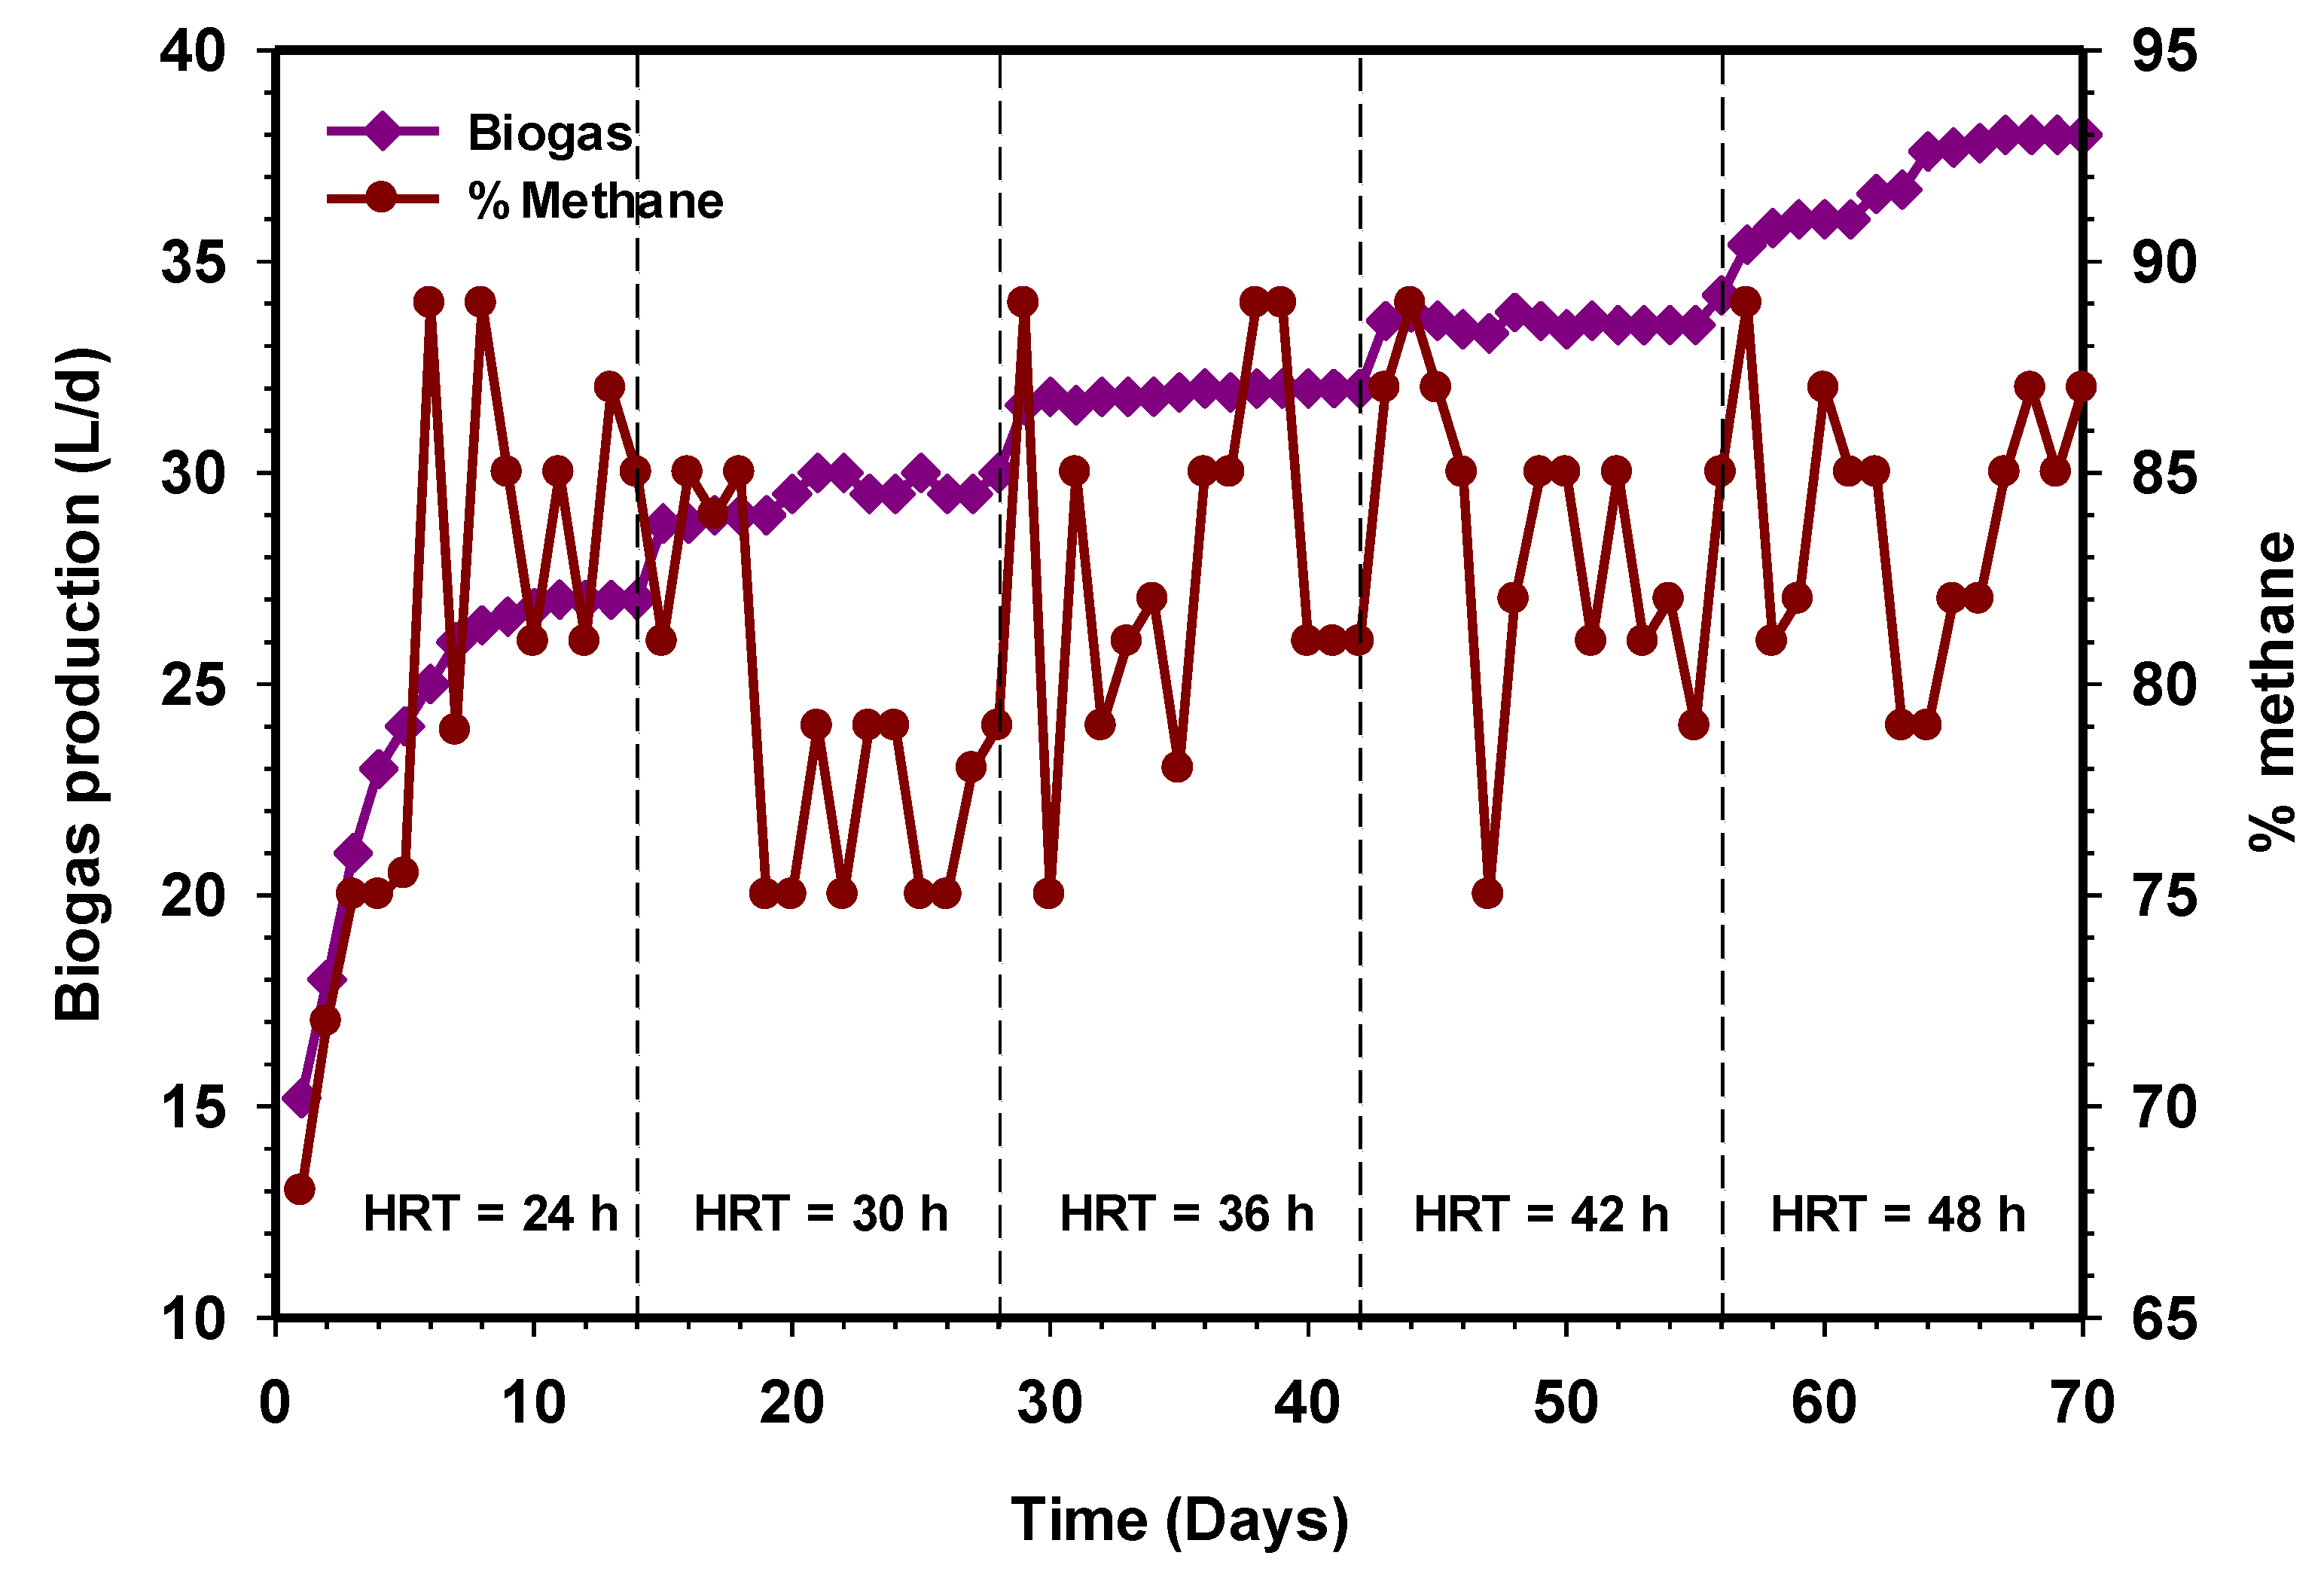
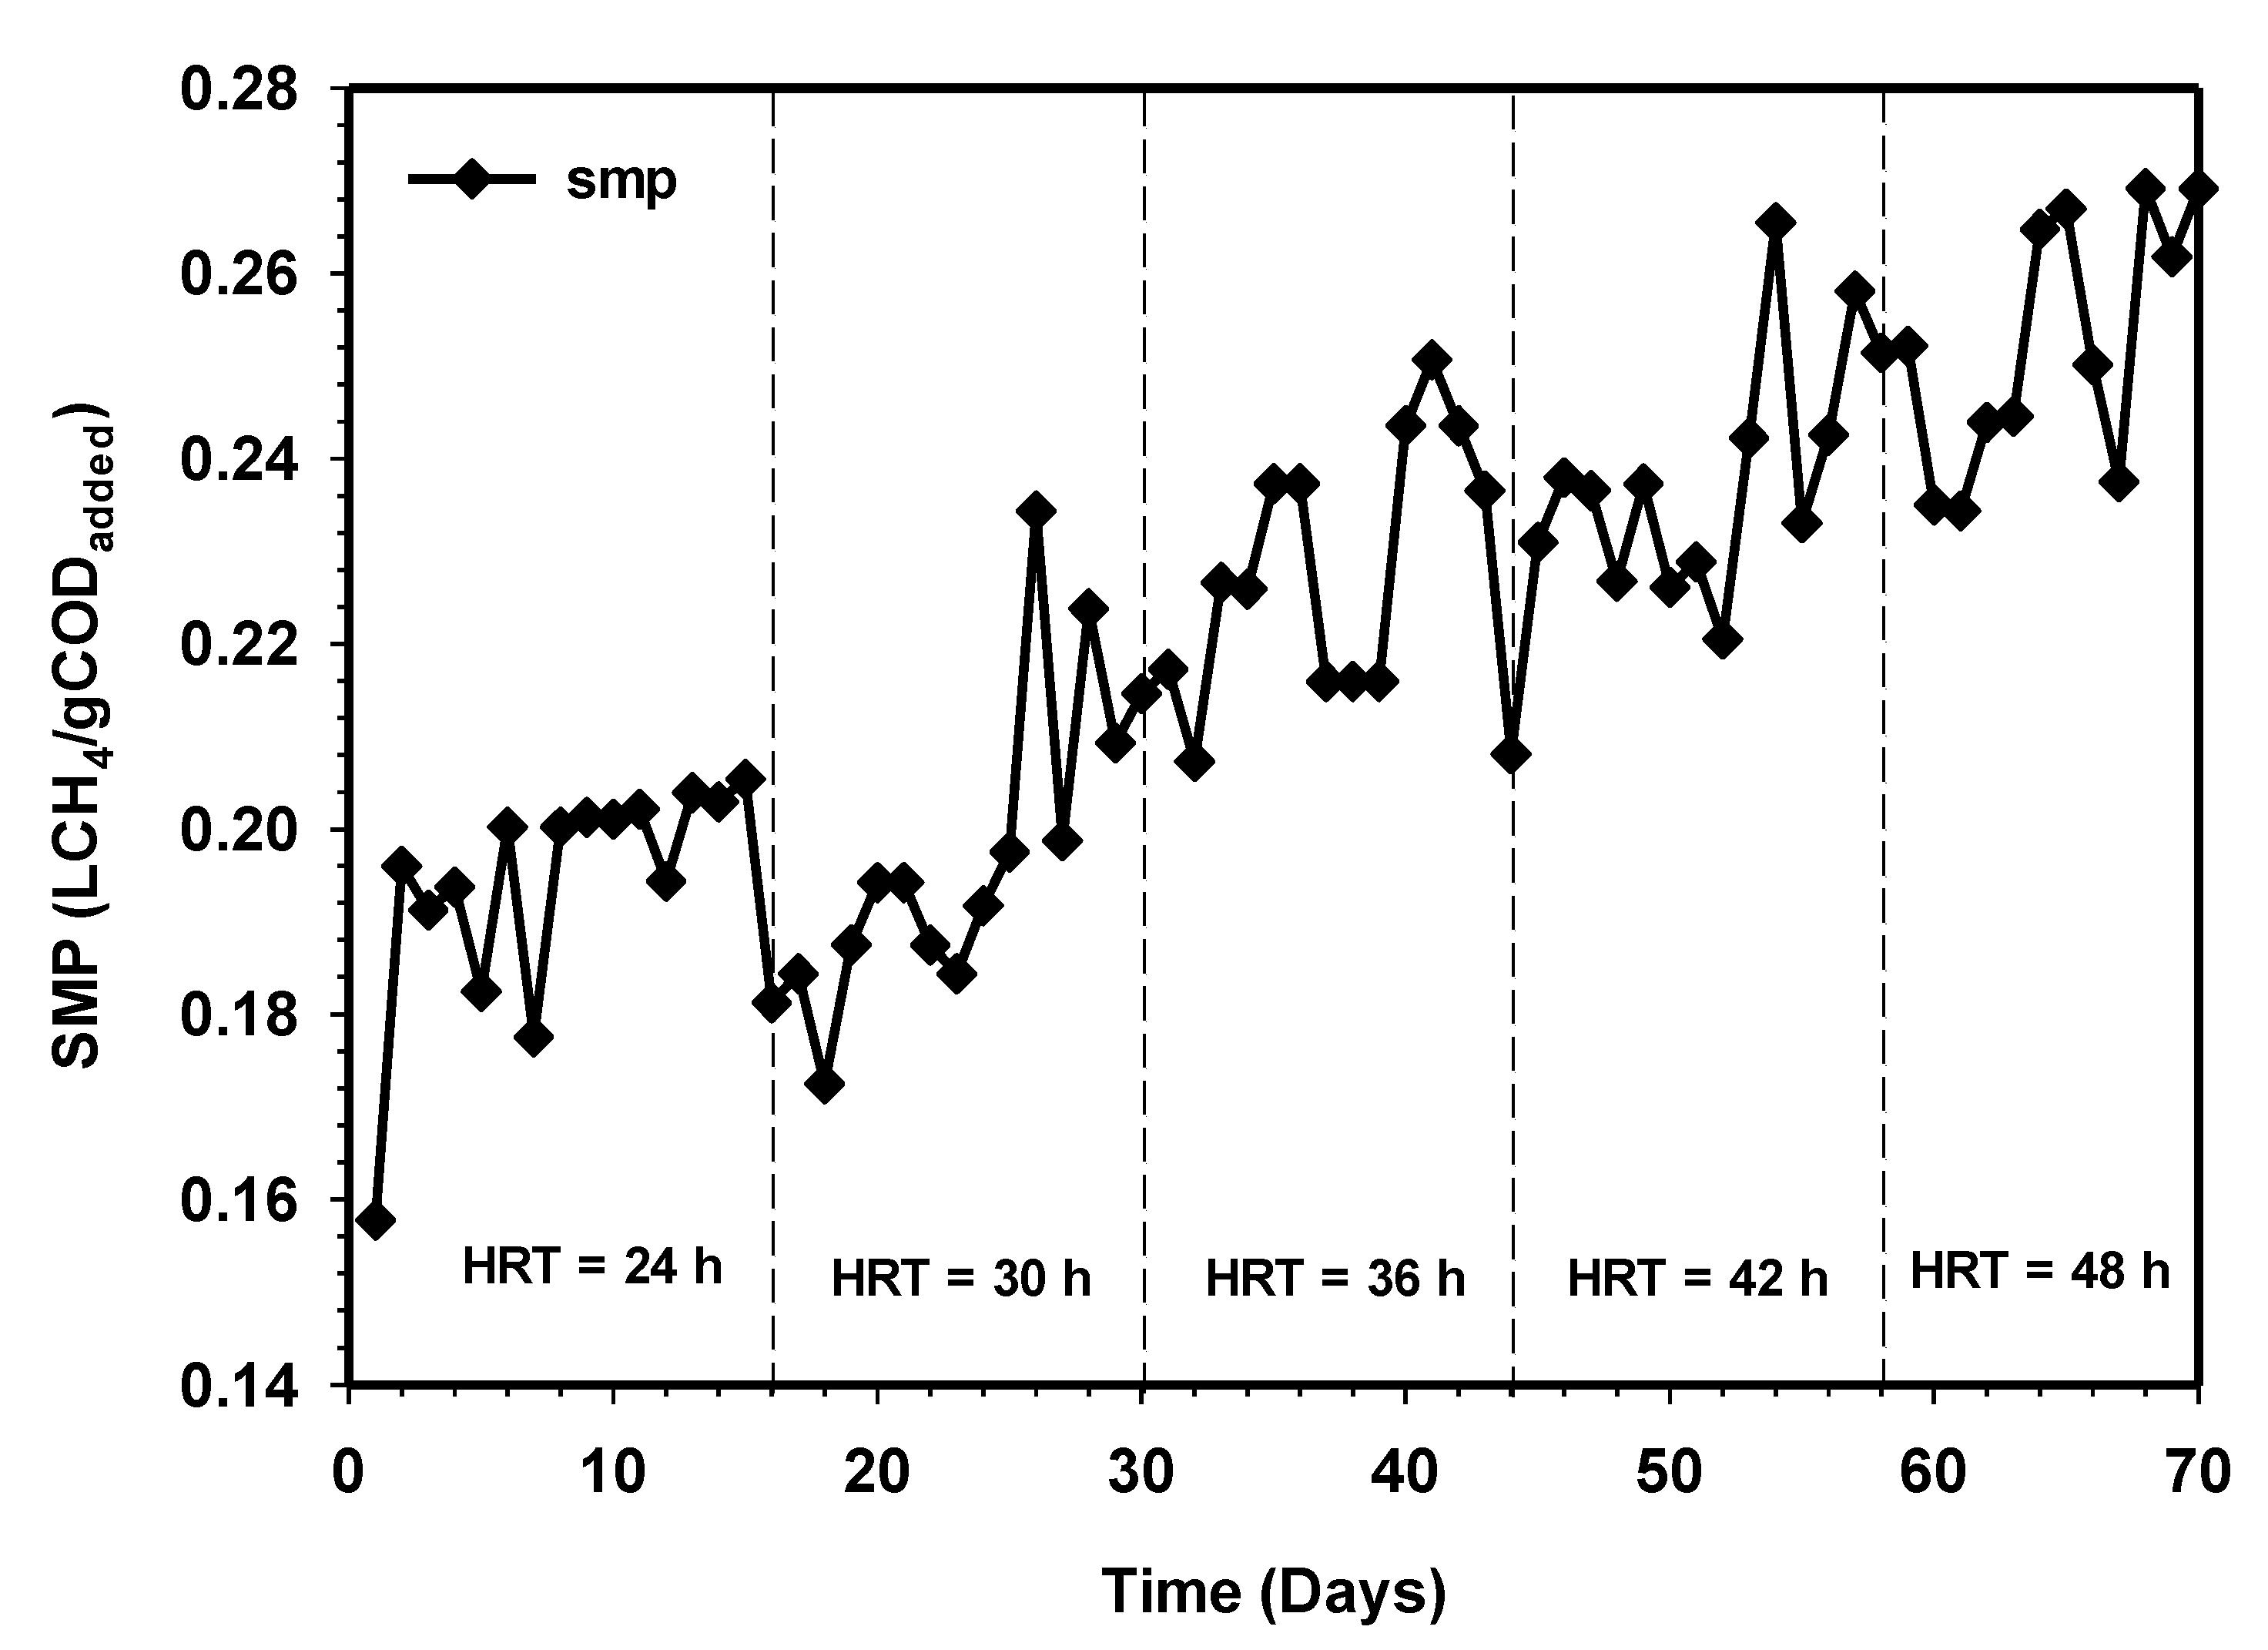
The performance of the HUASB treating CSWW was further studied in terms of HRT and constant OLR. To evaluate the performance and optimized the mesophilic treatment process, the HRT of the reactor was varied, while a constant feed value (COD and VSS) was maintained. The process performance of the mesophilic HUASB reactor relative to biogas production is presented in Figure 3. The reactor was operated for 70 days, fed only with CSWW. The biogas production during this phase day 1–15 kept on increasing from 15 L on the initial day, to 27 L d−1 on day 14. Similarly, the percentage of methane production was found to be 81% on the 14 days (Figure 3), corresponding to a specific methane yield of 0.2 LCH4/g CODadded (Figure 4). During the next period, day 14–28, the daily biogas production was approximately 29 L d−1 at a stable state with daily variations lower than 0.2 L d−1 biogas.
The literature reported a reactor with biofilm normally operates at 10 g COD/L [18], while the investigations of Cao et al. [19] have found that influent concentrations lower than 17 g COD/L were required for the successful operation of UASB reactors. However, the present study proves that the HUASB reactor was able to treat wastewater successfully at OLR 10 g L−1d−1, corresponding to 20 g/L of COD, achieving a biogas production of 38 L on the average after HRT of 48 h (Figure 3). The study further revealed that an increase in HRT increases the amount of biogas production, and this could be due to the sufficient contact time to allow for the degradation of the substrate by the microbial population. Stable methane production was observed at HRT 30, 36, 42, and 48 h, respectively. The percentage of methane were 89%, 81%, 85%, and 87%, while the corresponding specific methane production were found as 0.22, 0.24, 0.24, and 0.26 LCH4/g CODadded (Figure 4). Previously, the studies of Cuetos et al. [20] on the treatment of slaughterhouse waste and its co-digestion with OFMSW at the same HRT and OLR support our findings. In their report, the reactor showed that the absence of volatile intermediaries during the digestion treatment and traces of long-chain fatty acids (LCFA) concentrations was responsible for the high methane content. From this experiment, it was concluded that HRT is a very significant variable that should be considered in order to achieve a high concentration of methane in the biogas without compromising the effluent quality.
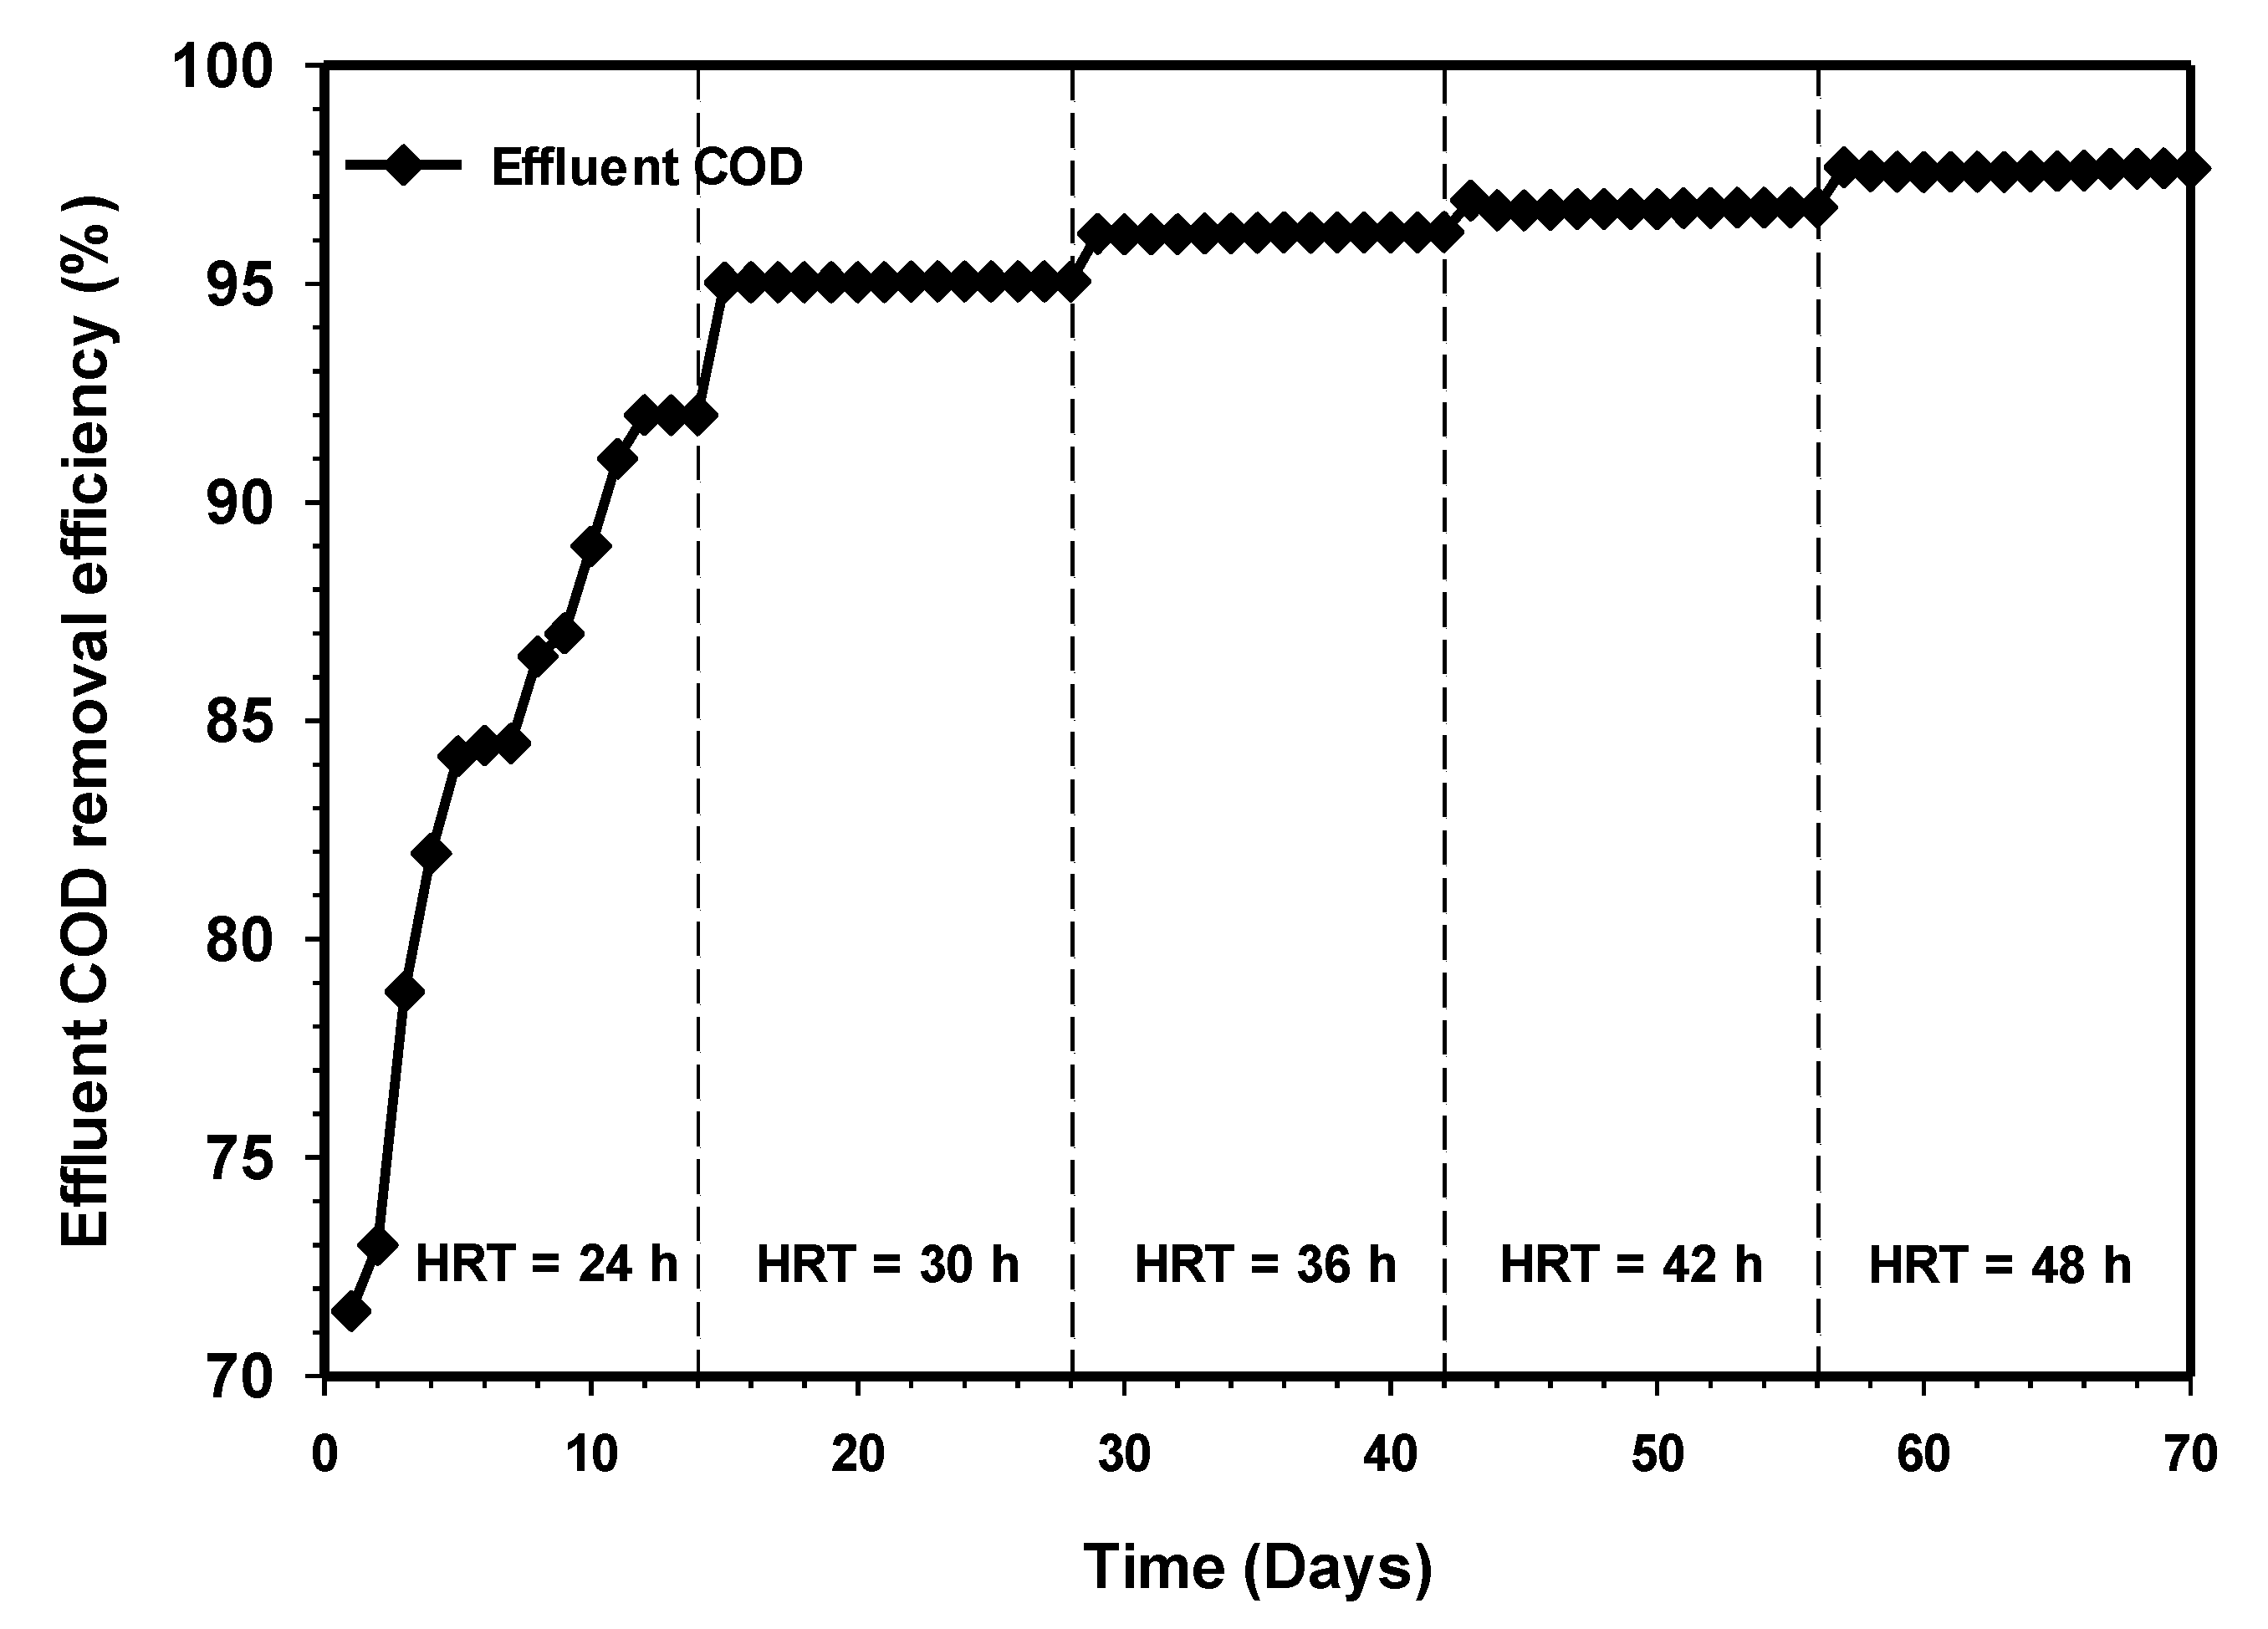
3.3. Effect of Increasing HRT on the COD Removal Efficiency
Figure 5 demonstrates the effect of increasing HRT on the COD removal efficiency of the system. Initially, it was observed that the COD removal efficiency increased gradually from 71% to 92% at steady state HRT of 24 h. The COD removal efficiency improved considerably, and this could be due to the higher amount of biomass retained within the synthetic grass zone. A steady COD removal efficiency of 95% was obtained when the HRT was increased to 30 h. The increase in the HRT corresponding to increasing the COD removal efficiency is an indication of the presence of a high population of microbes that is sufficient enough to convert the complex organic matter to useful by-products quickly. The study of Halalsheh et al. [21] reported that longer solid retention, particularly in high lipid wastewater, promotes the reduction of scum, forming the potential of a system and better COD removal. At HRT 36 h, the percentage of COD removal increased to 96% at the stable state and gradually increased for the remaining phase of the study HRT.
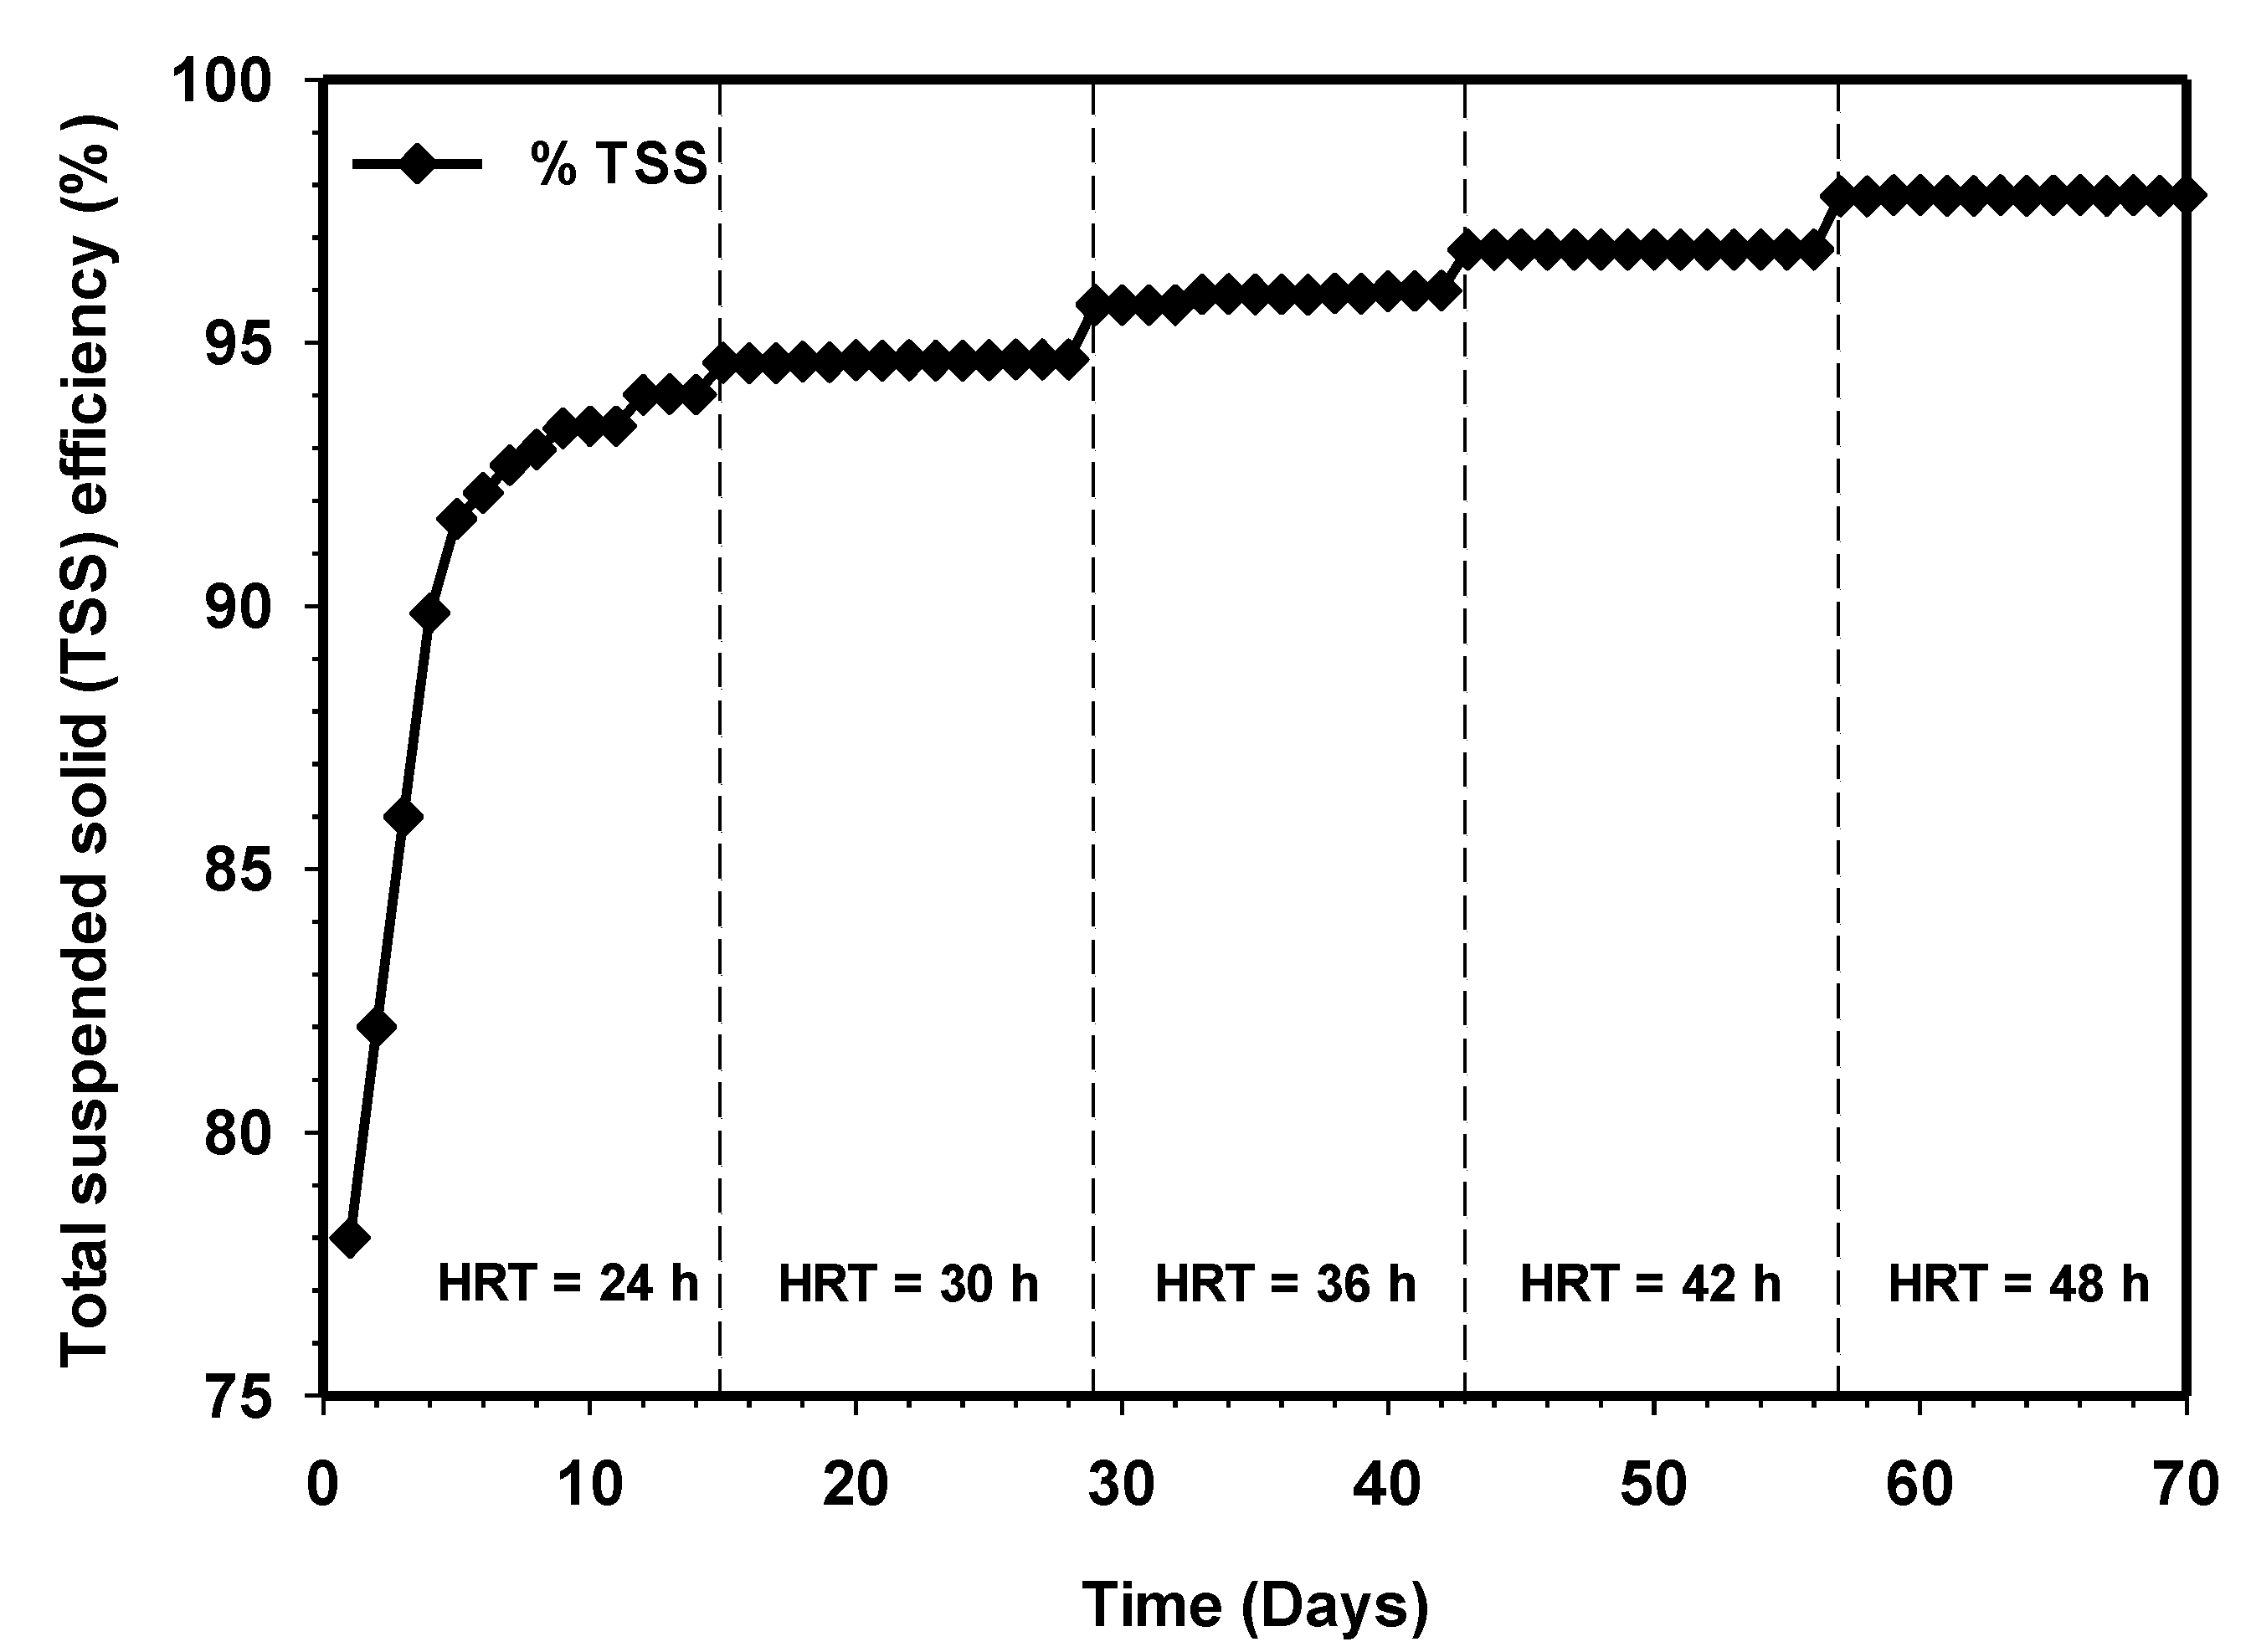
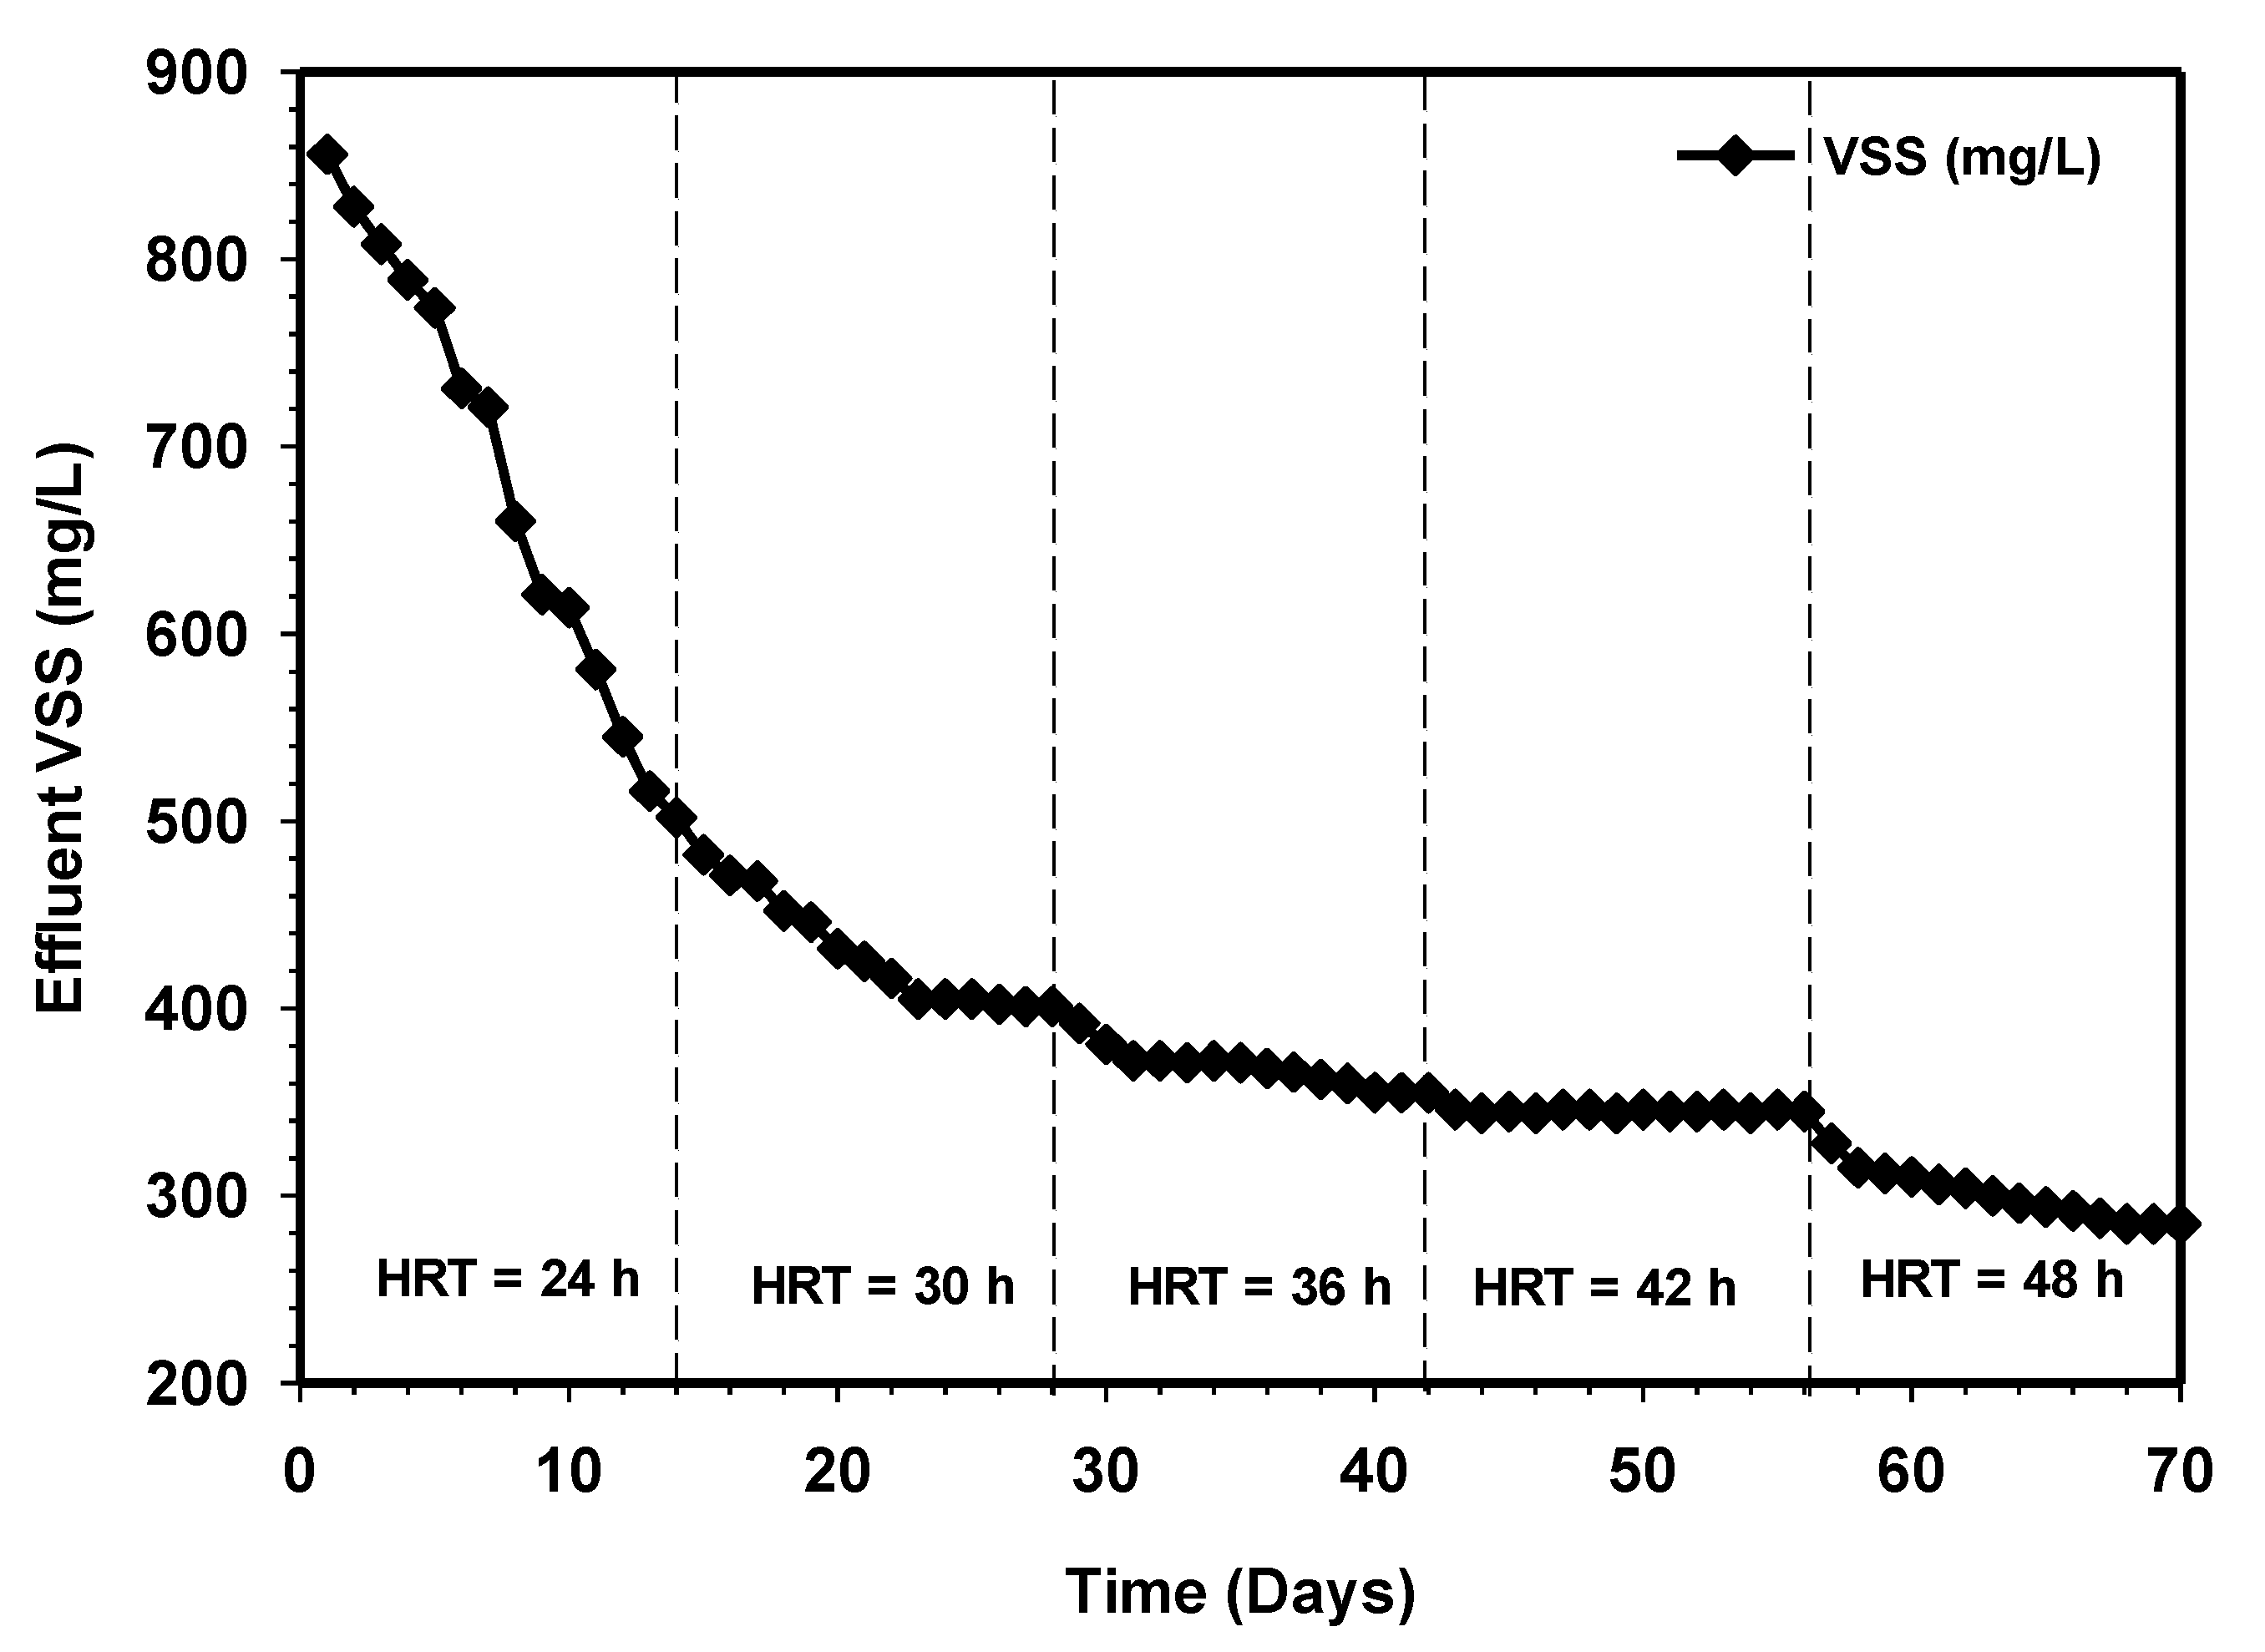
3.4. Effect of Increasing HRT on TSS and VSS Removals
Figure 6 and Figure 7 demonstrate the effluent TSS and VSS removal concentrations of the HUASB relative to increasing contact time. The gradual increase in the percentage of TSS concentration from 78% to 94%, and 856 to 502 mg/L at HRT 24 h, clearly shows a good condition of the anaerobic digestion process. It also indicates that the decomposition of biodegradable organic matter was fast proceeding. However, the TSS removal efficiency of the system not only depends on the anaerobic digestion process but also on the physicochemical reactions within the effluent. The retention time was further increased to 30 h, and this lead to improved TSS and VSS effluent quality. After that, the effluent TSS started to rise exponentially, while the effluent VSS kept on decreasing with respect to time. The increase in the percentage of TSS removal efficiency in the overall experiment and the corresponding decrease in the effluent VSS indicates an exponential growth of bacteria, which in turn yielded favorable results. The effluent parameters at retention times of 36 and 42 h were very similar, and this similarity was also reflected in the COD removal concentrations, as shown in Figure 5, and the biogas production, as shown in Figure 3. Therefore, the performance of the present system was found to be very much efficient at retaining biomass. In any case, the effluent TSS and VSS concentrations were relatively low for all the HRTs applied.
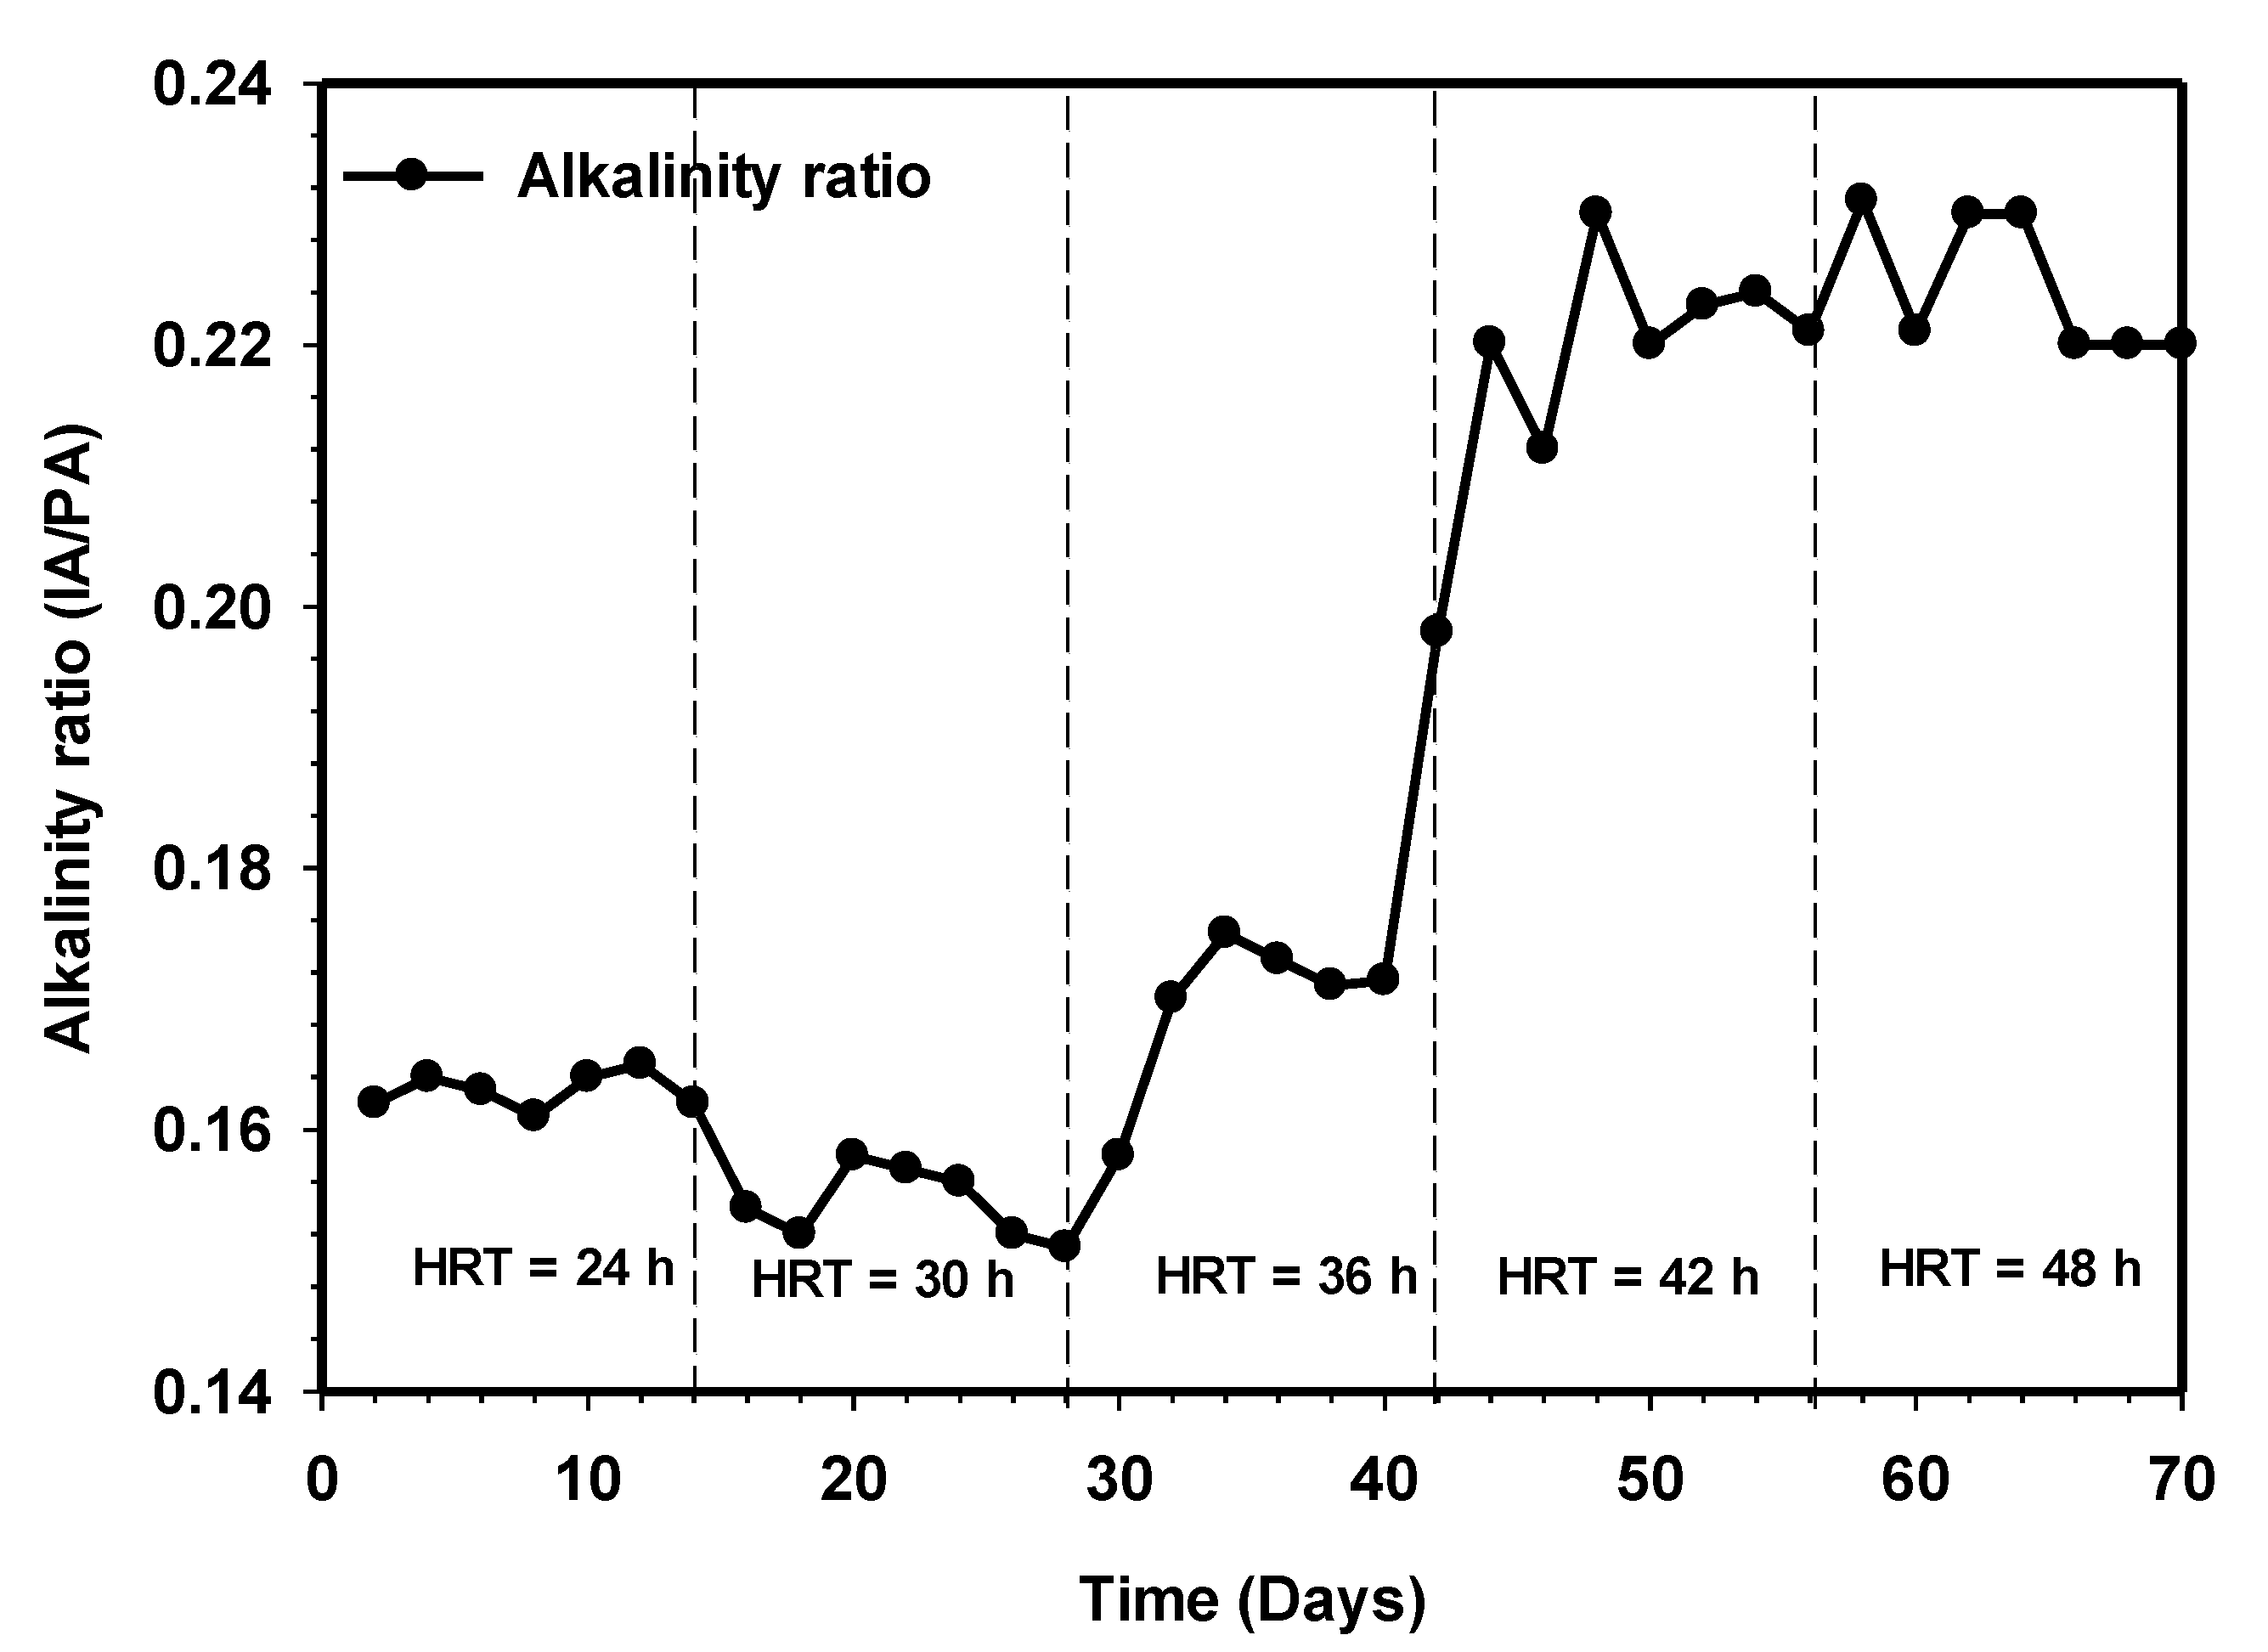
3.5. Effect of Increasing HRT on the Effluent pH and Alkalinity Ratio of HUASB Reactor
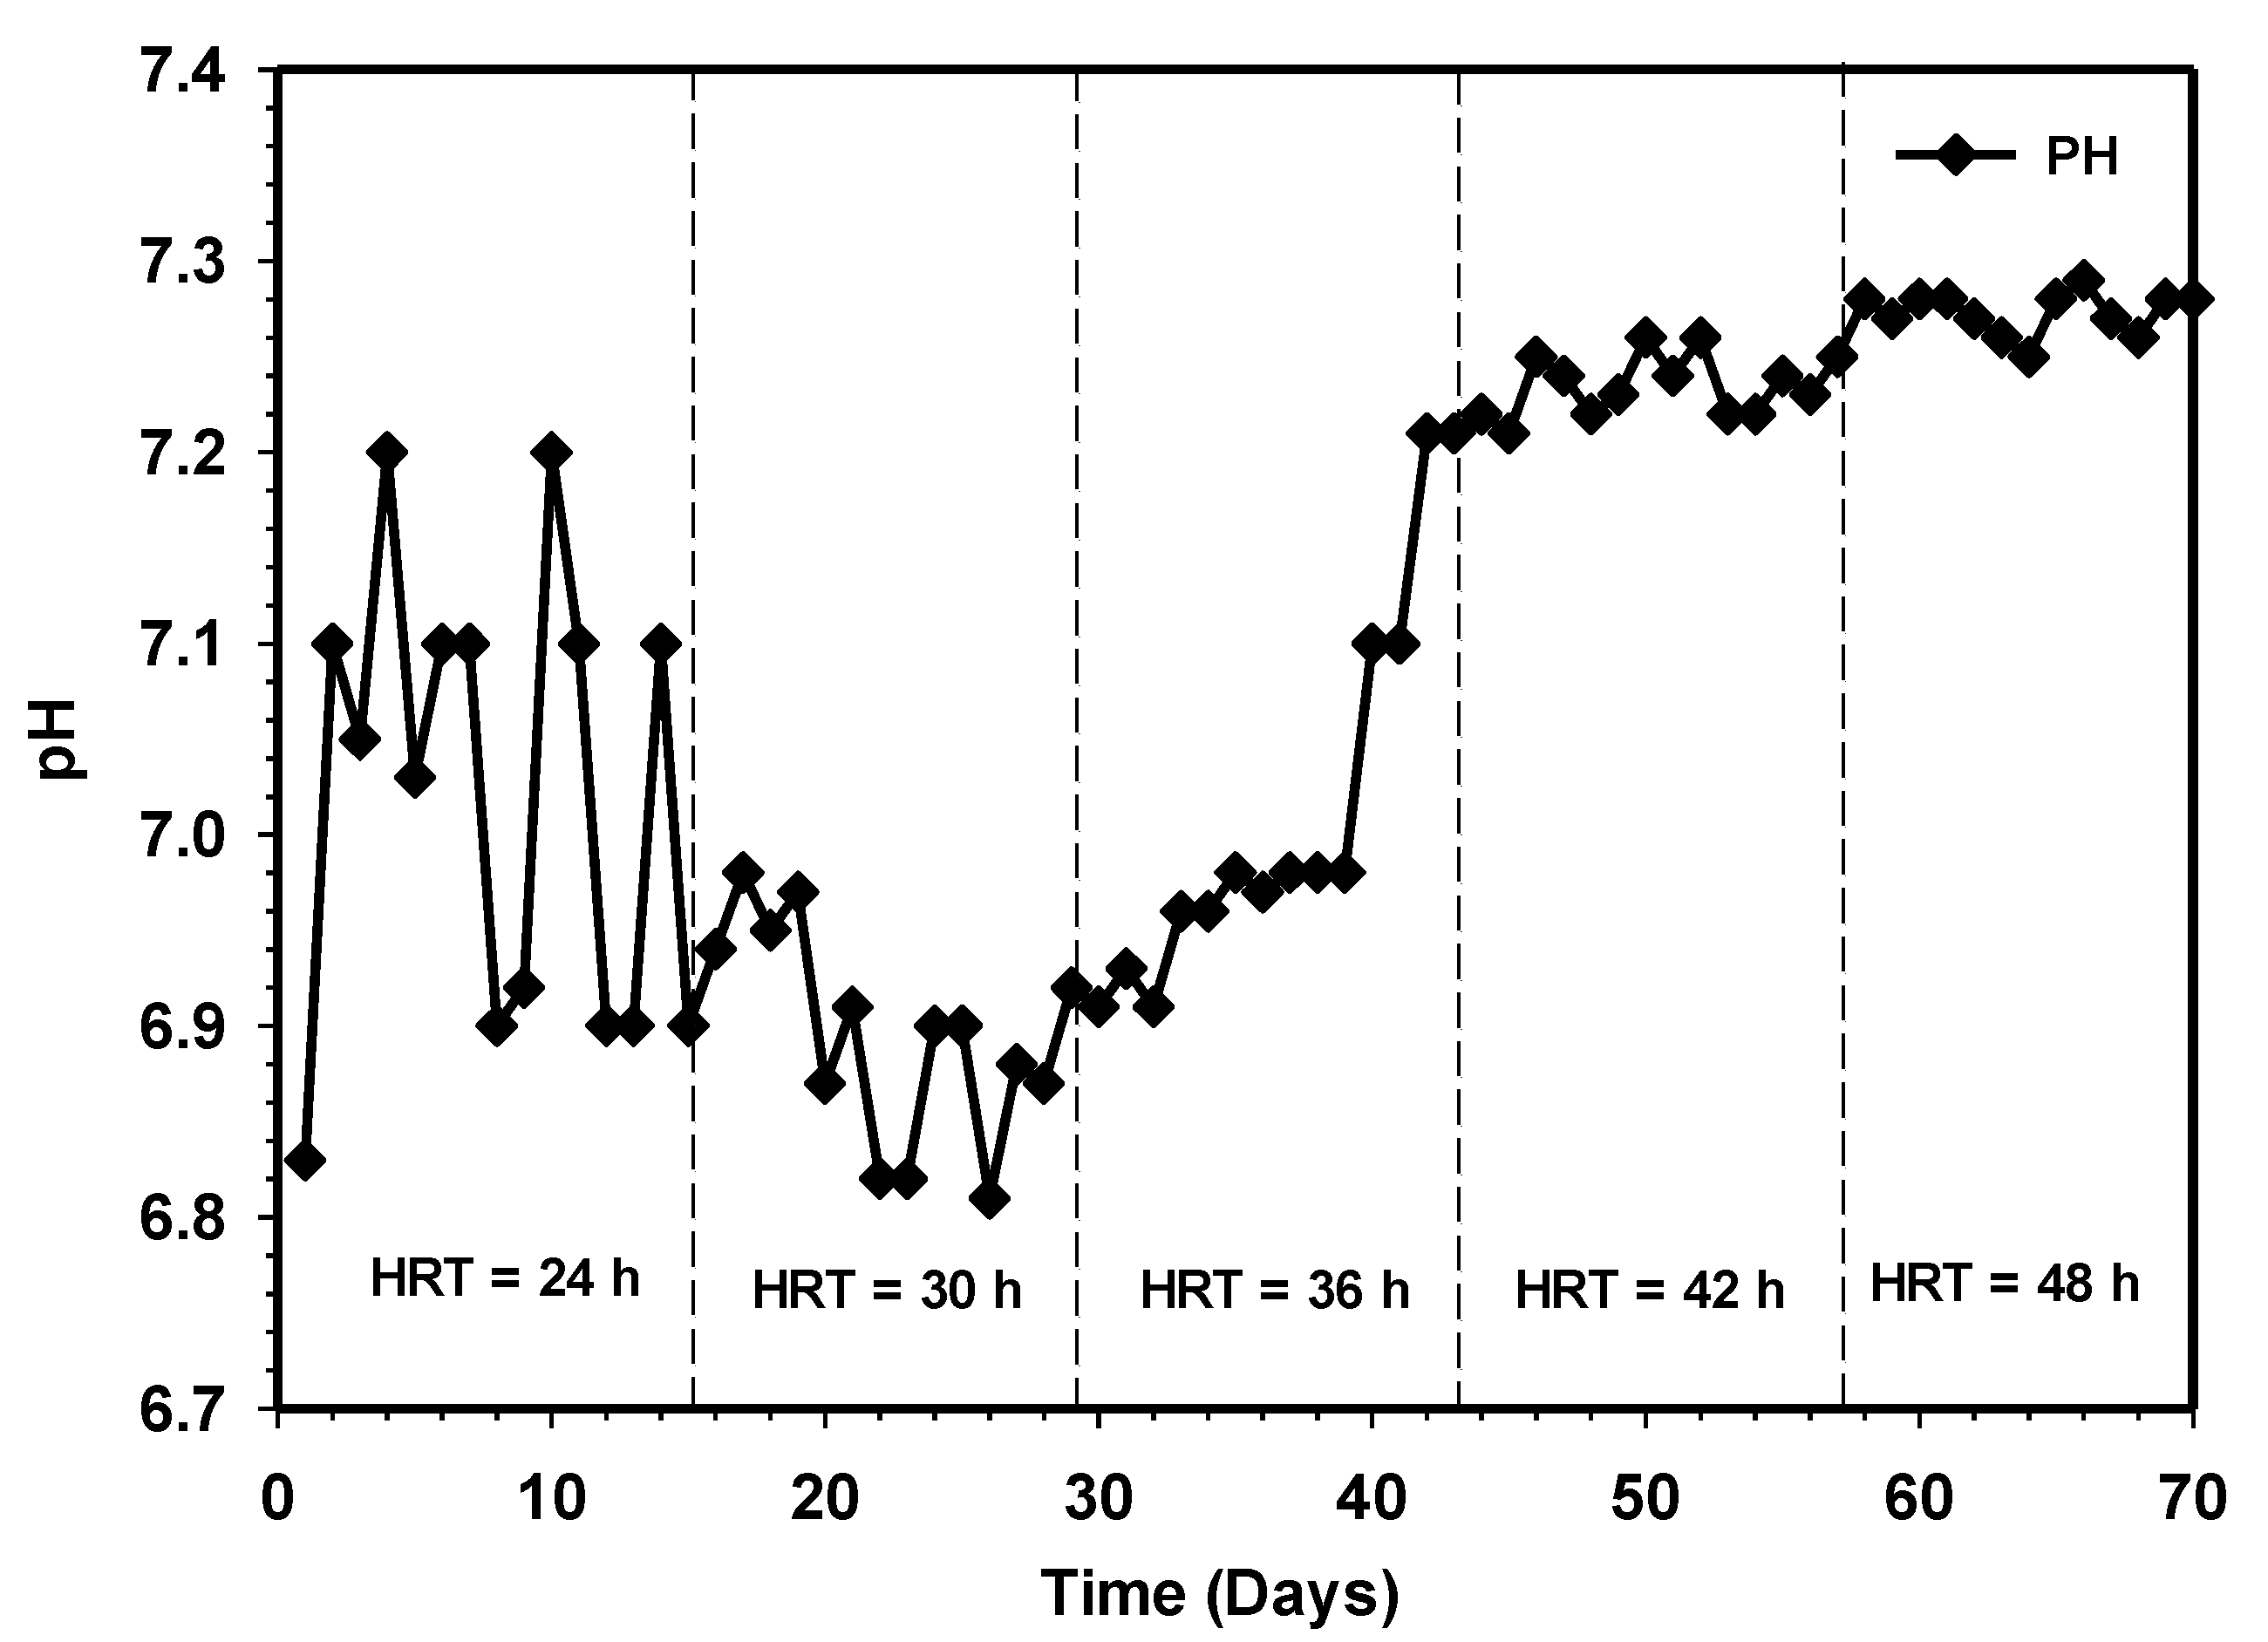
Proper anaerobic digestion operation requires a range of pH for microbial growth. For instance, a pH range of 4.0–8.5 usually favored the growth of fermentative bacteria, while methanogens strive well between 6.5 and 7.5 [22,23]. Likewise, in either mesophilic or thermophilic conditions of anaerobic digestion operation, it has been reported that the buffering capacity is considered sufficient when the volatile fatty acids (VFA) to alkalinity ratio is well below 0.4 [24]. Figure 8 and Figure 9 demonstrate a stable pH alkalinity condition of the HUASB reactor. Previous research has established variability in the optimal pH value, with the range depending on the substrate and digestion technique used. The system maintained a stable pH range with an average of 6.9 at HRT of 24 h to 7.3 at 48 h. The increment in pH and value of alkalinity ratio from day 42 to day 56 depicted the presence of low VFAs, and such methanogenic activity strives well during this period. The results of the effect of increasing contact time show a higher stable system, with a good buffer capacity, indicating that allowing sufficient contact time to break down the waste could stabilize the anaerobic digestion system. Based on the high performance of the reactor, it can be deduced that the addition of the attached growth system used in this work significantly retains a large population of active microbes capable of keeping the VFA concentration at the lowest point, especially at longer HRT. Moreover, this has also given room for higher conversion of the particulate organic matter to a high volume of the essential end product (methane).
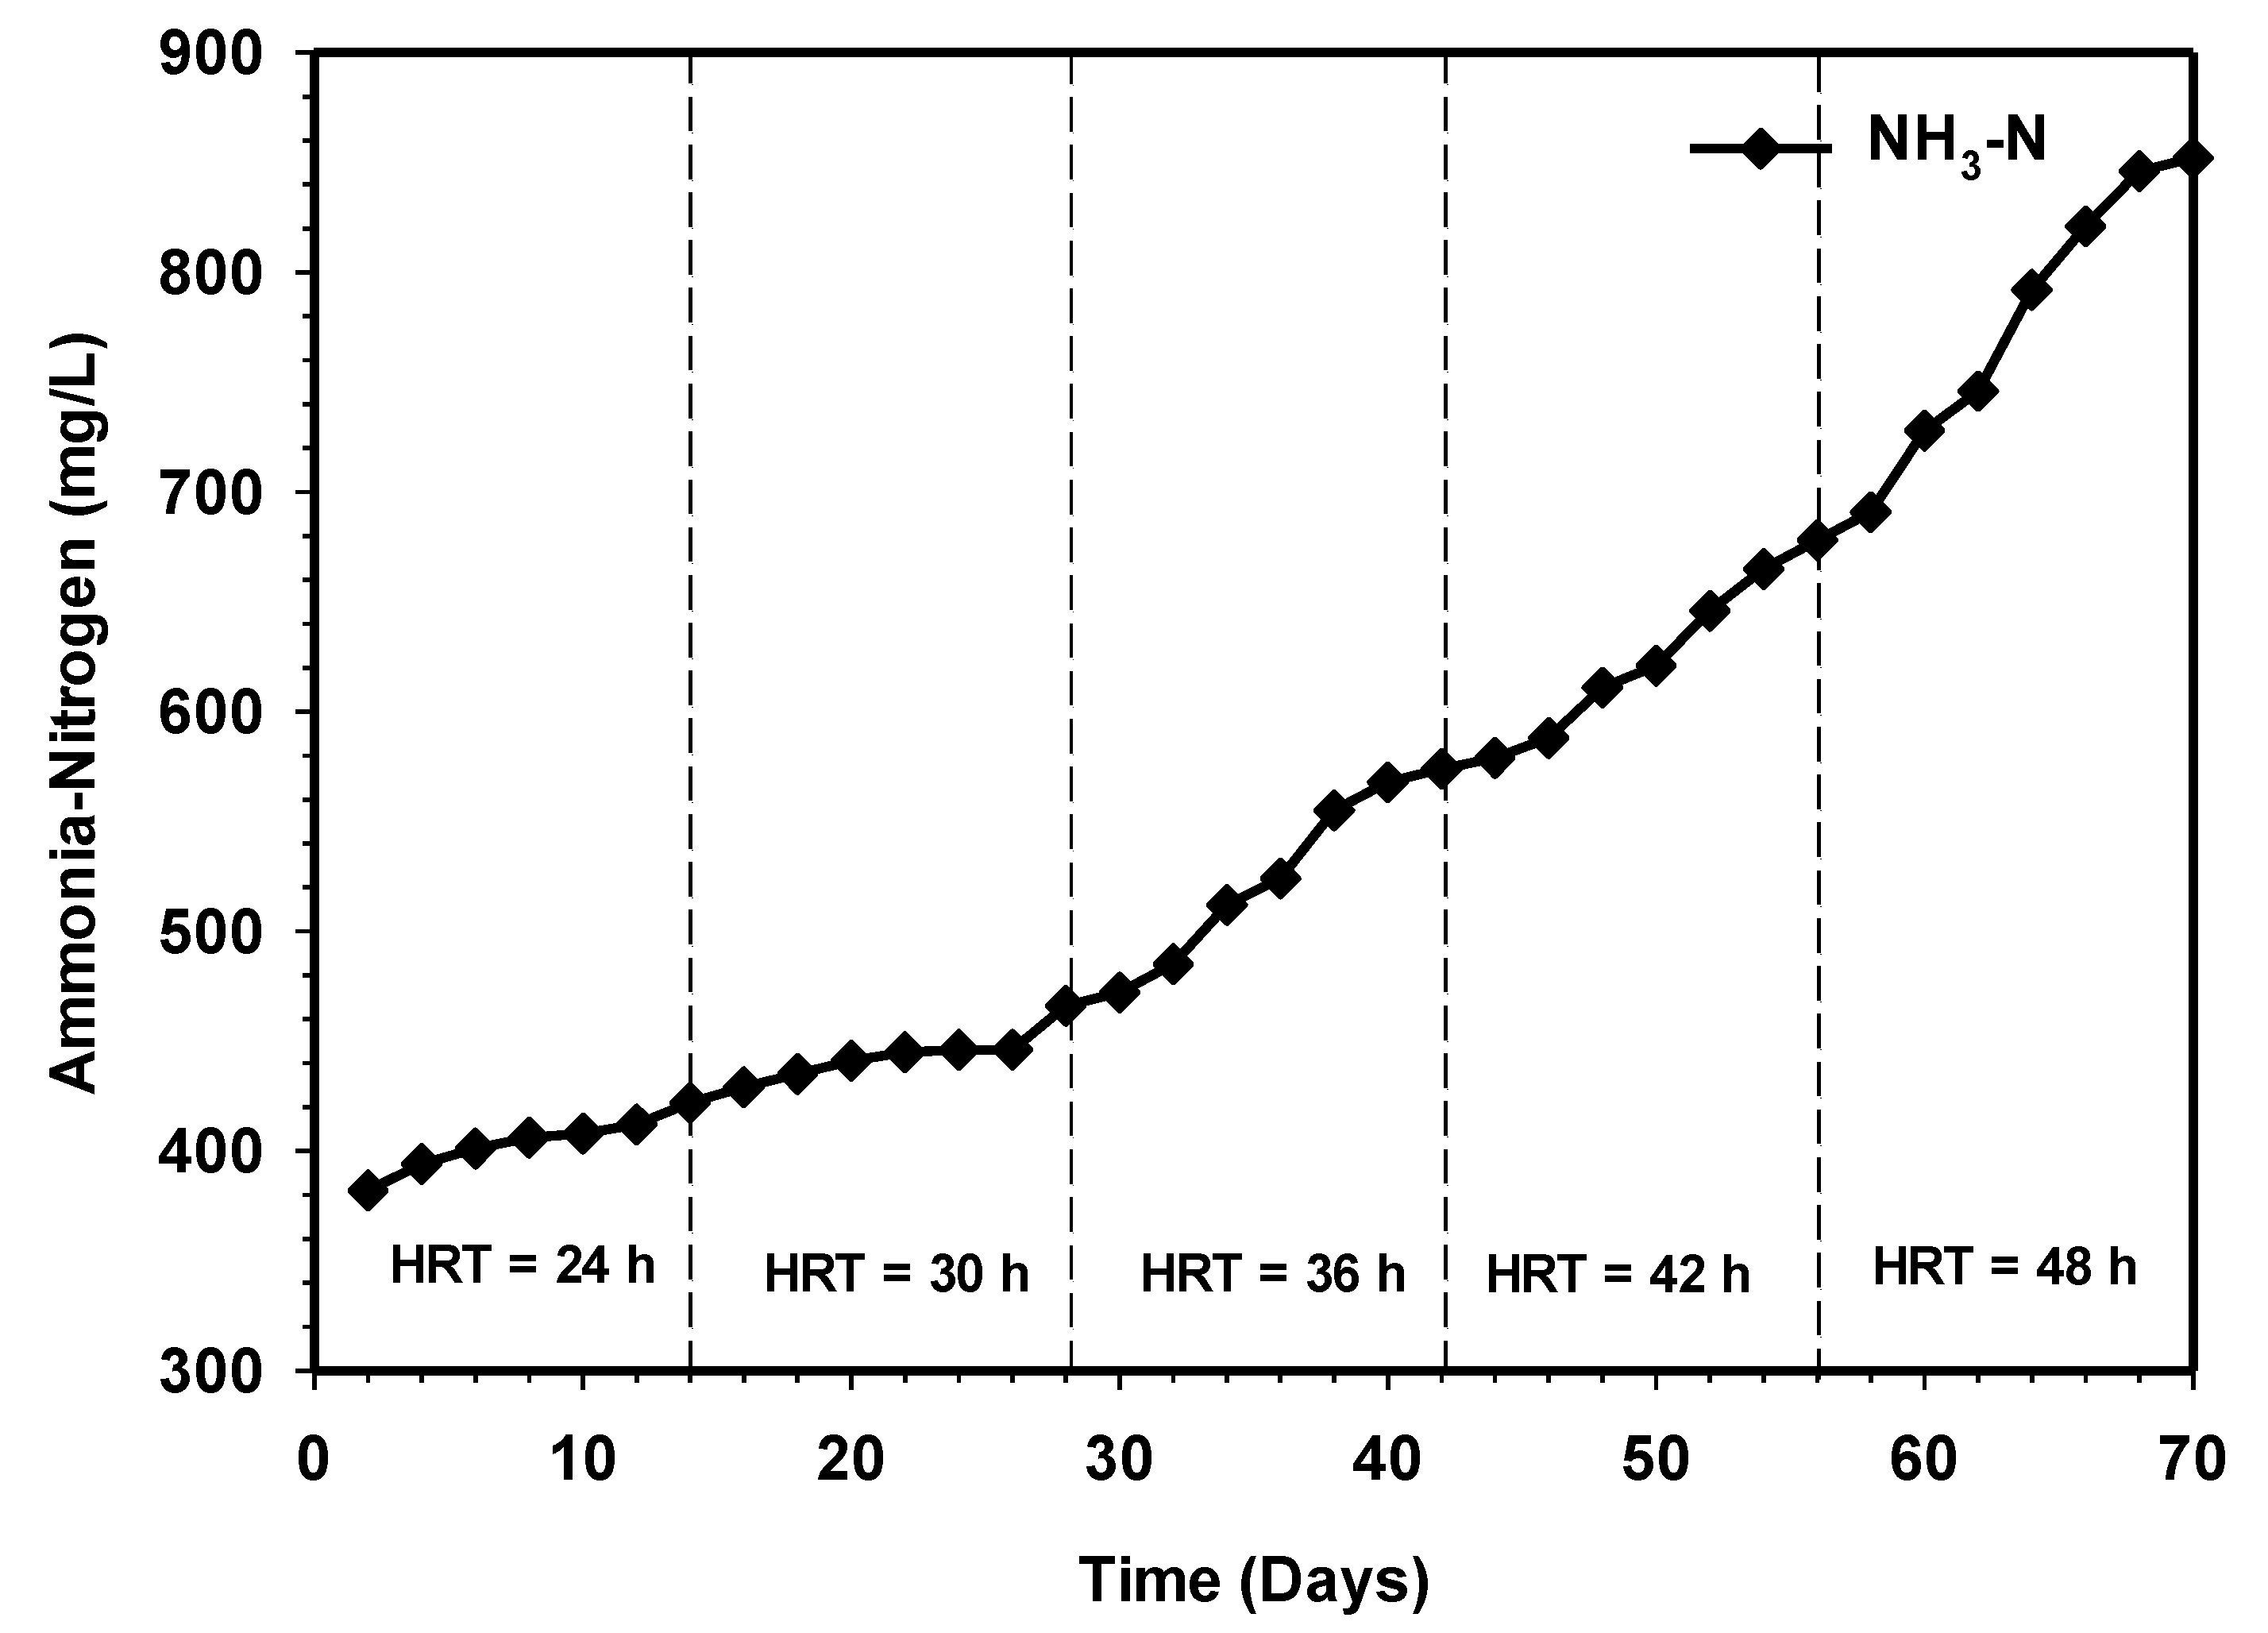
3.6. Effect of Increasing HRT on the Ammonia Nitrogen Production
Ammonia is produced as a by-product of the biodegradation process, principally from the mineralization of nitrogen during deamination of protein, and mainly exists in the form of ammonium (NH4+) and free ammonia (NH3) [23,24,25,26]. The presence of ammonia nitrogen in bioreactor serves as an essential nutrient for bacteria growth. However, it could be toxic to the microbes and impairs their normal function at higher concentrations [27,28]. Also, ammonia plays a vital role in balancing the C/N ratio, which could significantly affect the performance of the reactor [29]. Figure 10 reveals the results of the effect of increasing contact time on the concentration of ammonia nitrogen over the 70 days of the operational period. During this period, all performance and stability indicators settled within an acceptable range, with pH around 6.8 to 7.3 (Figure 8). The concentration of ammonia was increasing with increasing contact time.
In the first 14 days, the level increased steadily from 382 to 466 mg/L at 24 h HRT during the semi-continuous process. The release of ammonia due to protein synthesis caused an increase in alkalinity, which led to a steady increase in pH values to 7.1 (Figure 8). At high pH, the ammonia nitrogen released during protein degradation largely exists as unionized free ammonia (NH3), which is more toxic to the formation of methane than the ionized ammonium (NH4+). This is because (NH3) diffuses more rapidly through the cell membrane and further hinders cell functioning through disrupting the potassium-and-proton balance inside the cell. The research of Gerardi [30] showed that inhibition of anaerobic reactor due to ammonia nitrogen that normally occurs when the concentration reaches 1500 to 3000 mg/L. However, the investigation revealed that ammonia toxicity only occurred at pH values >7.6 [31]. Furthermore, the experiment of Karlsson and Ejlertsson, [32] have shown that the addition of HCL to anaerobic digester favorably decreases the pH from 8 to 7.6, and this strategy significantly improved the methane yield of the reactor treating slaughterhouse waste. However, the ammonia concentration in the present was far below the level inhibition throughout the study period of HRT.
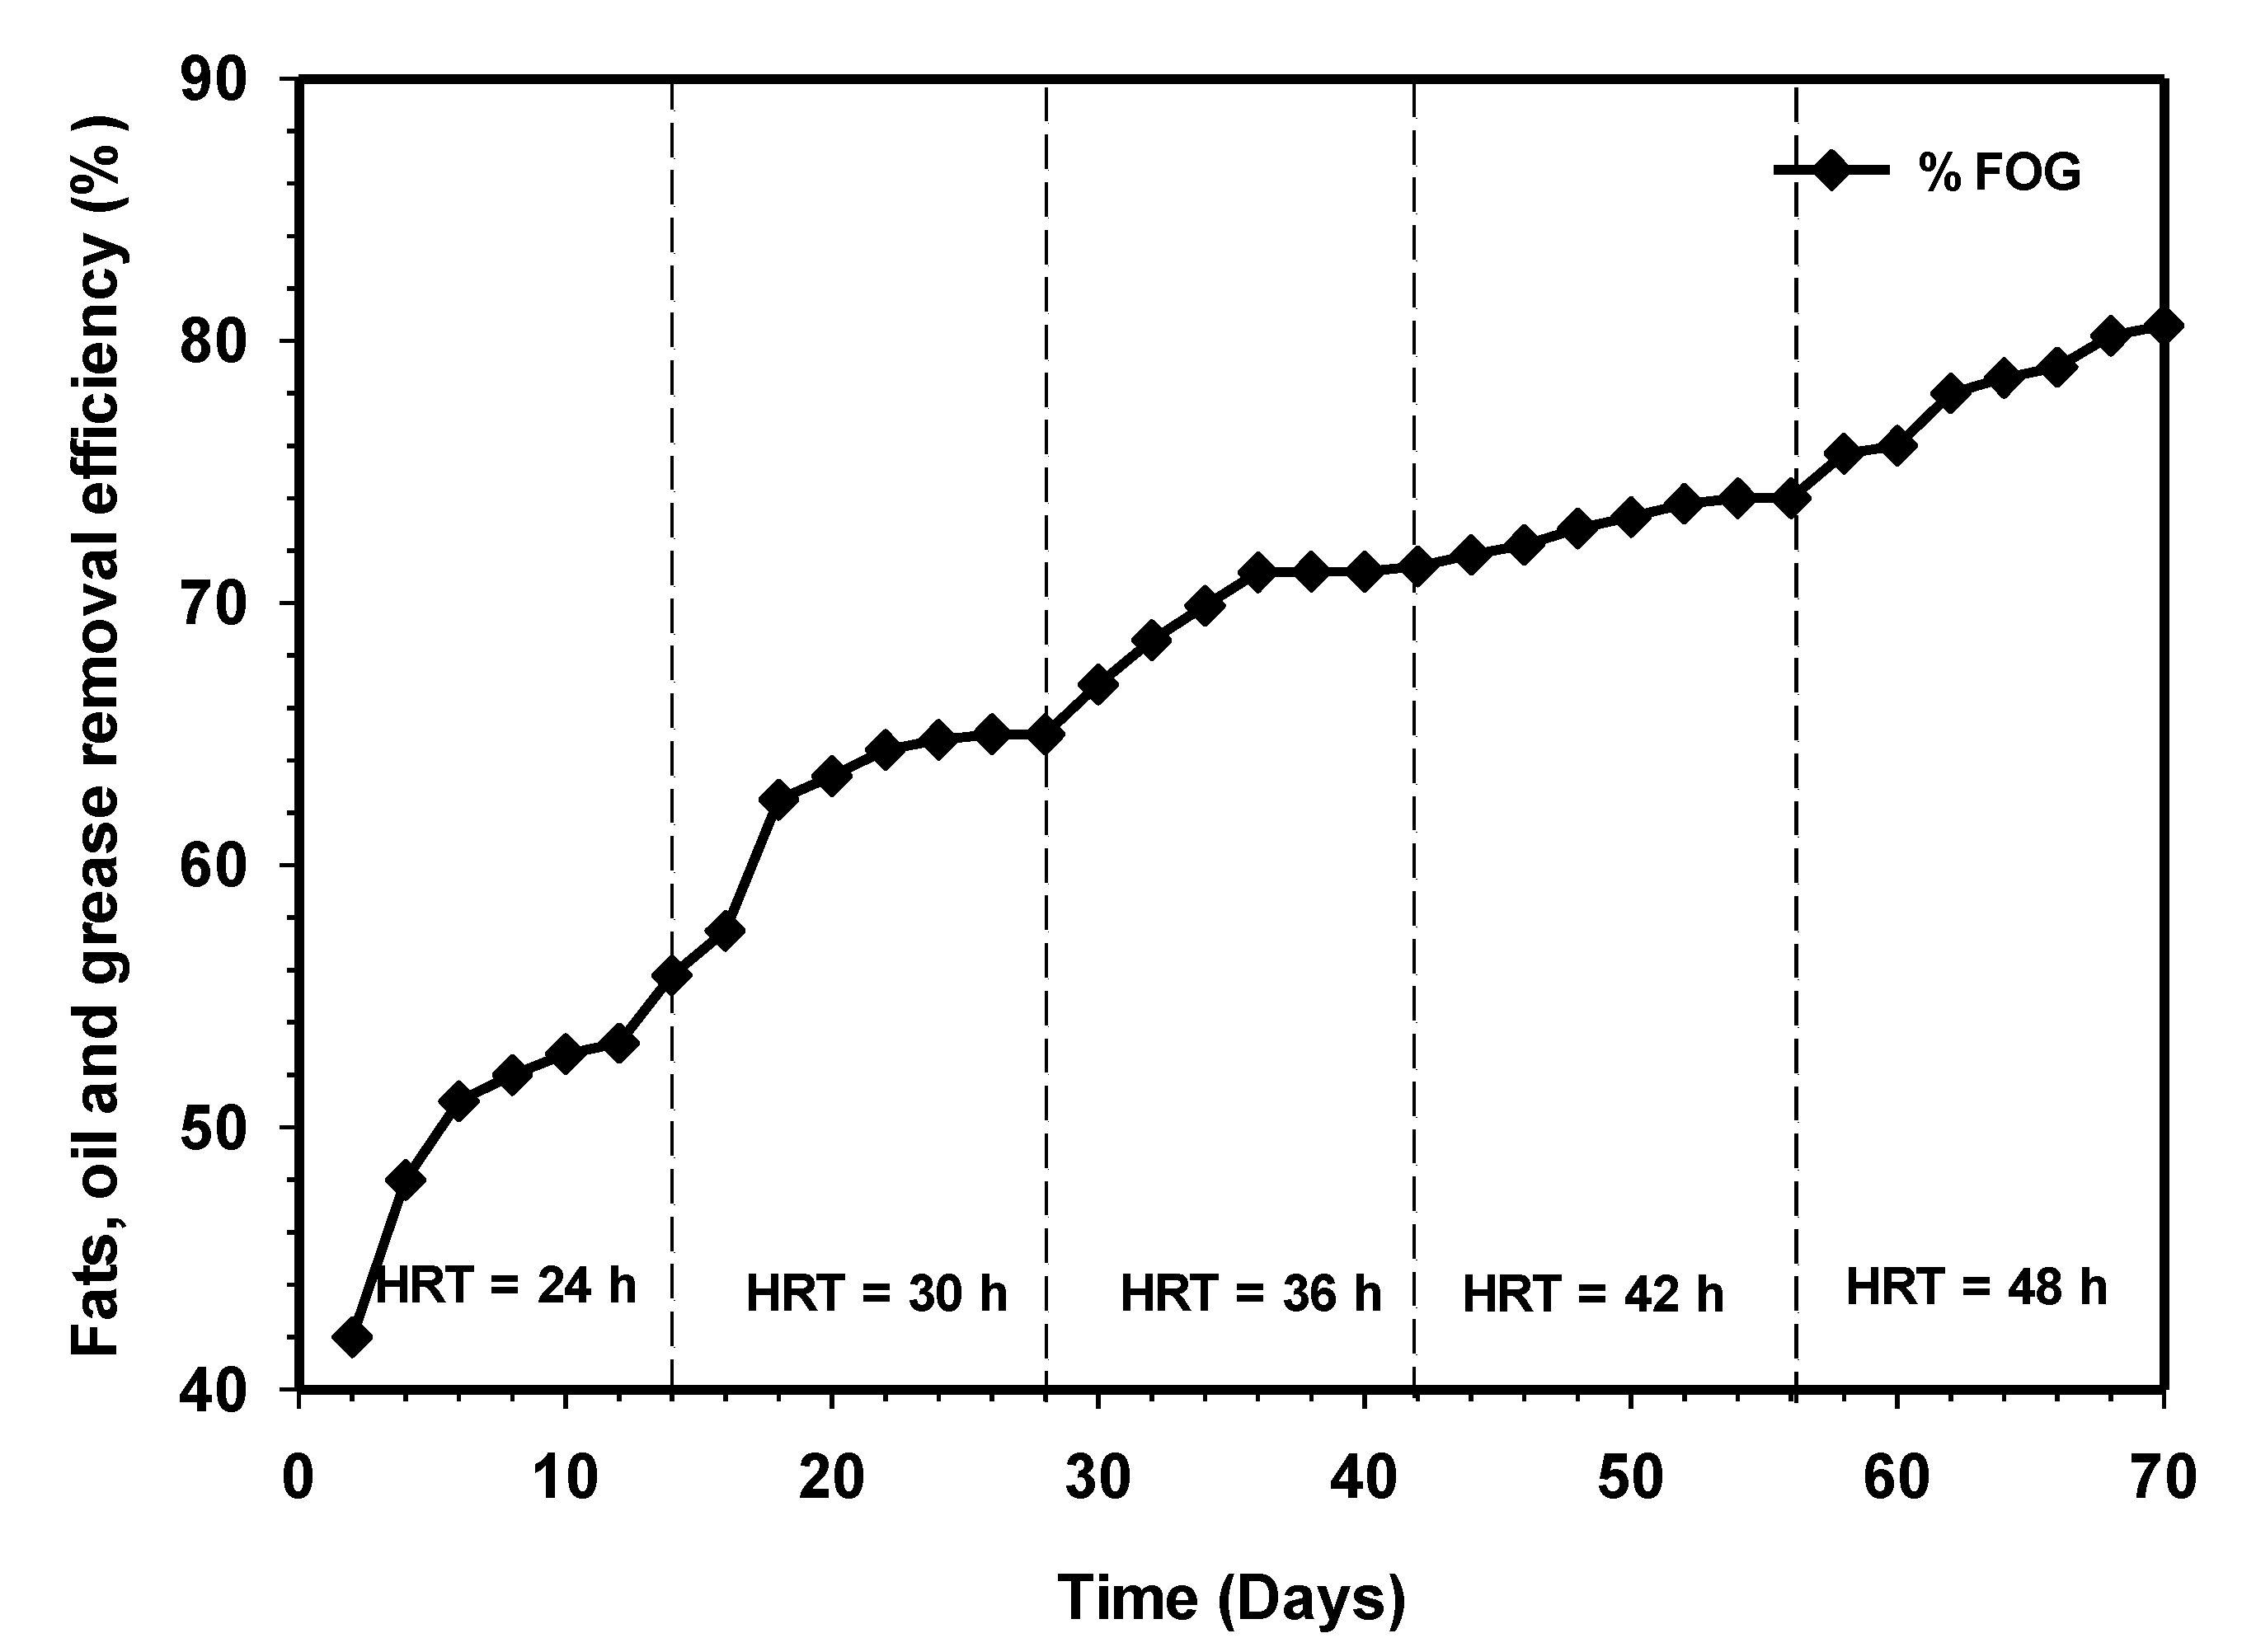
3.7. Effect of Increasing HRT on the Fats, Oil, and Grease Removal
High-strength wastewater, such as slaughterhouse wastes, contain high fats, oil, and grease (FOG) content capable of causing severe problems, such as the clogging of pipes and adhesion to sludge in anaerobic reactors. The high presence of FOG was reported to have caused inhibition and mass transfer of nutrients and sludge floatation, coupled with washout [33,34,35]. Figure 11 represents the FOG removal profile of the reactor relative to increasing substrate contact time. The behavior of the system in terms of FOG removals is similar to TSS removal efficiency (Figure 6). It can be seen that the FOG removal increases steadily from day 1 to 14, reaching 65% at steady state. This indicates that biological hydrolysis was fast proceeding. Likewise, the removal efficient continued to increase relative to time until it reached 80% efficiency at 48 h HRT. The results were similar to those obtained by Cuetos et al. [20]. Thus, it can be concluded that the reactor achieved high stability in treating the high-strength wastewater despite its recalcitrant nature.
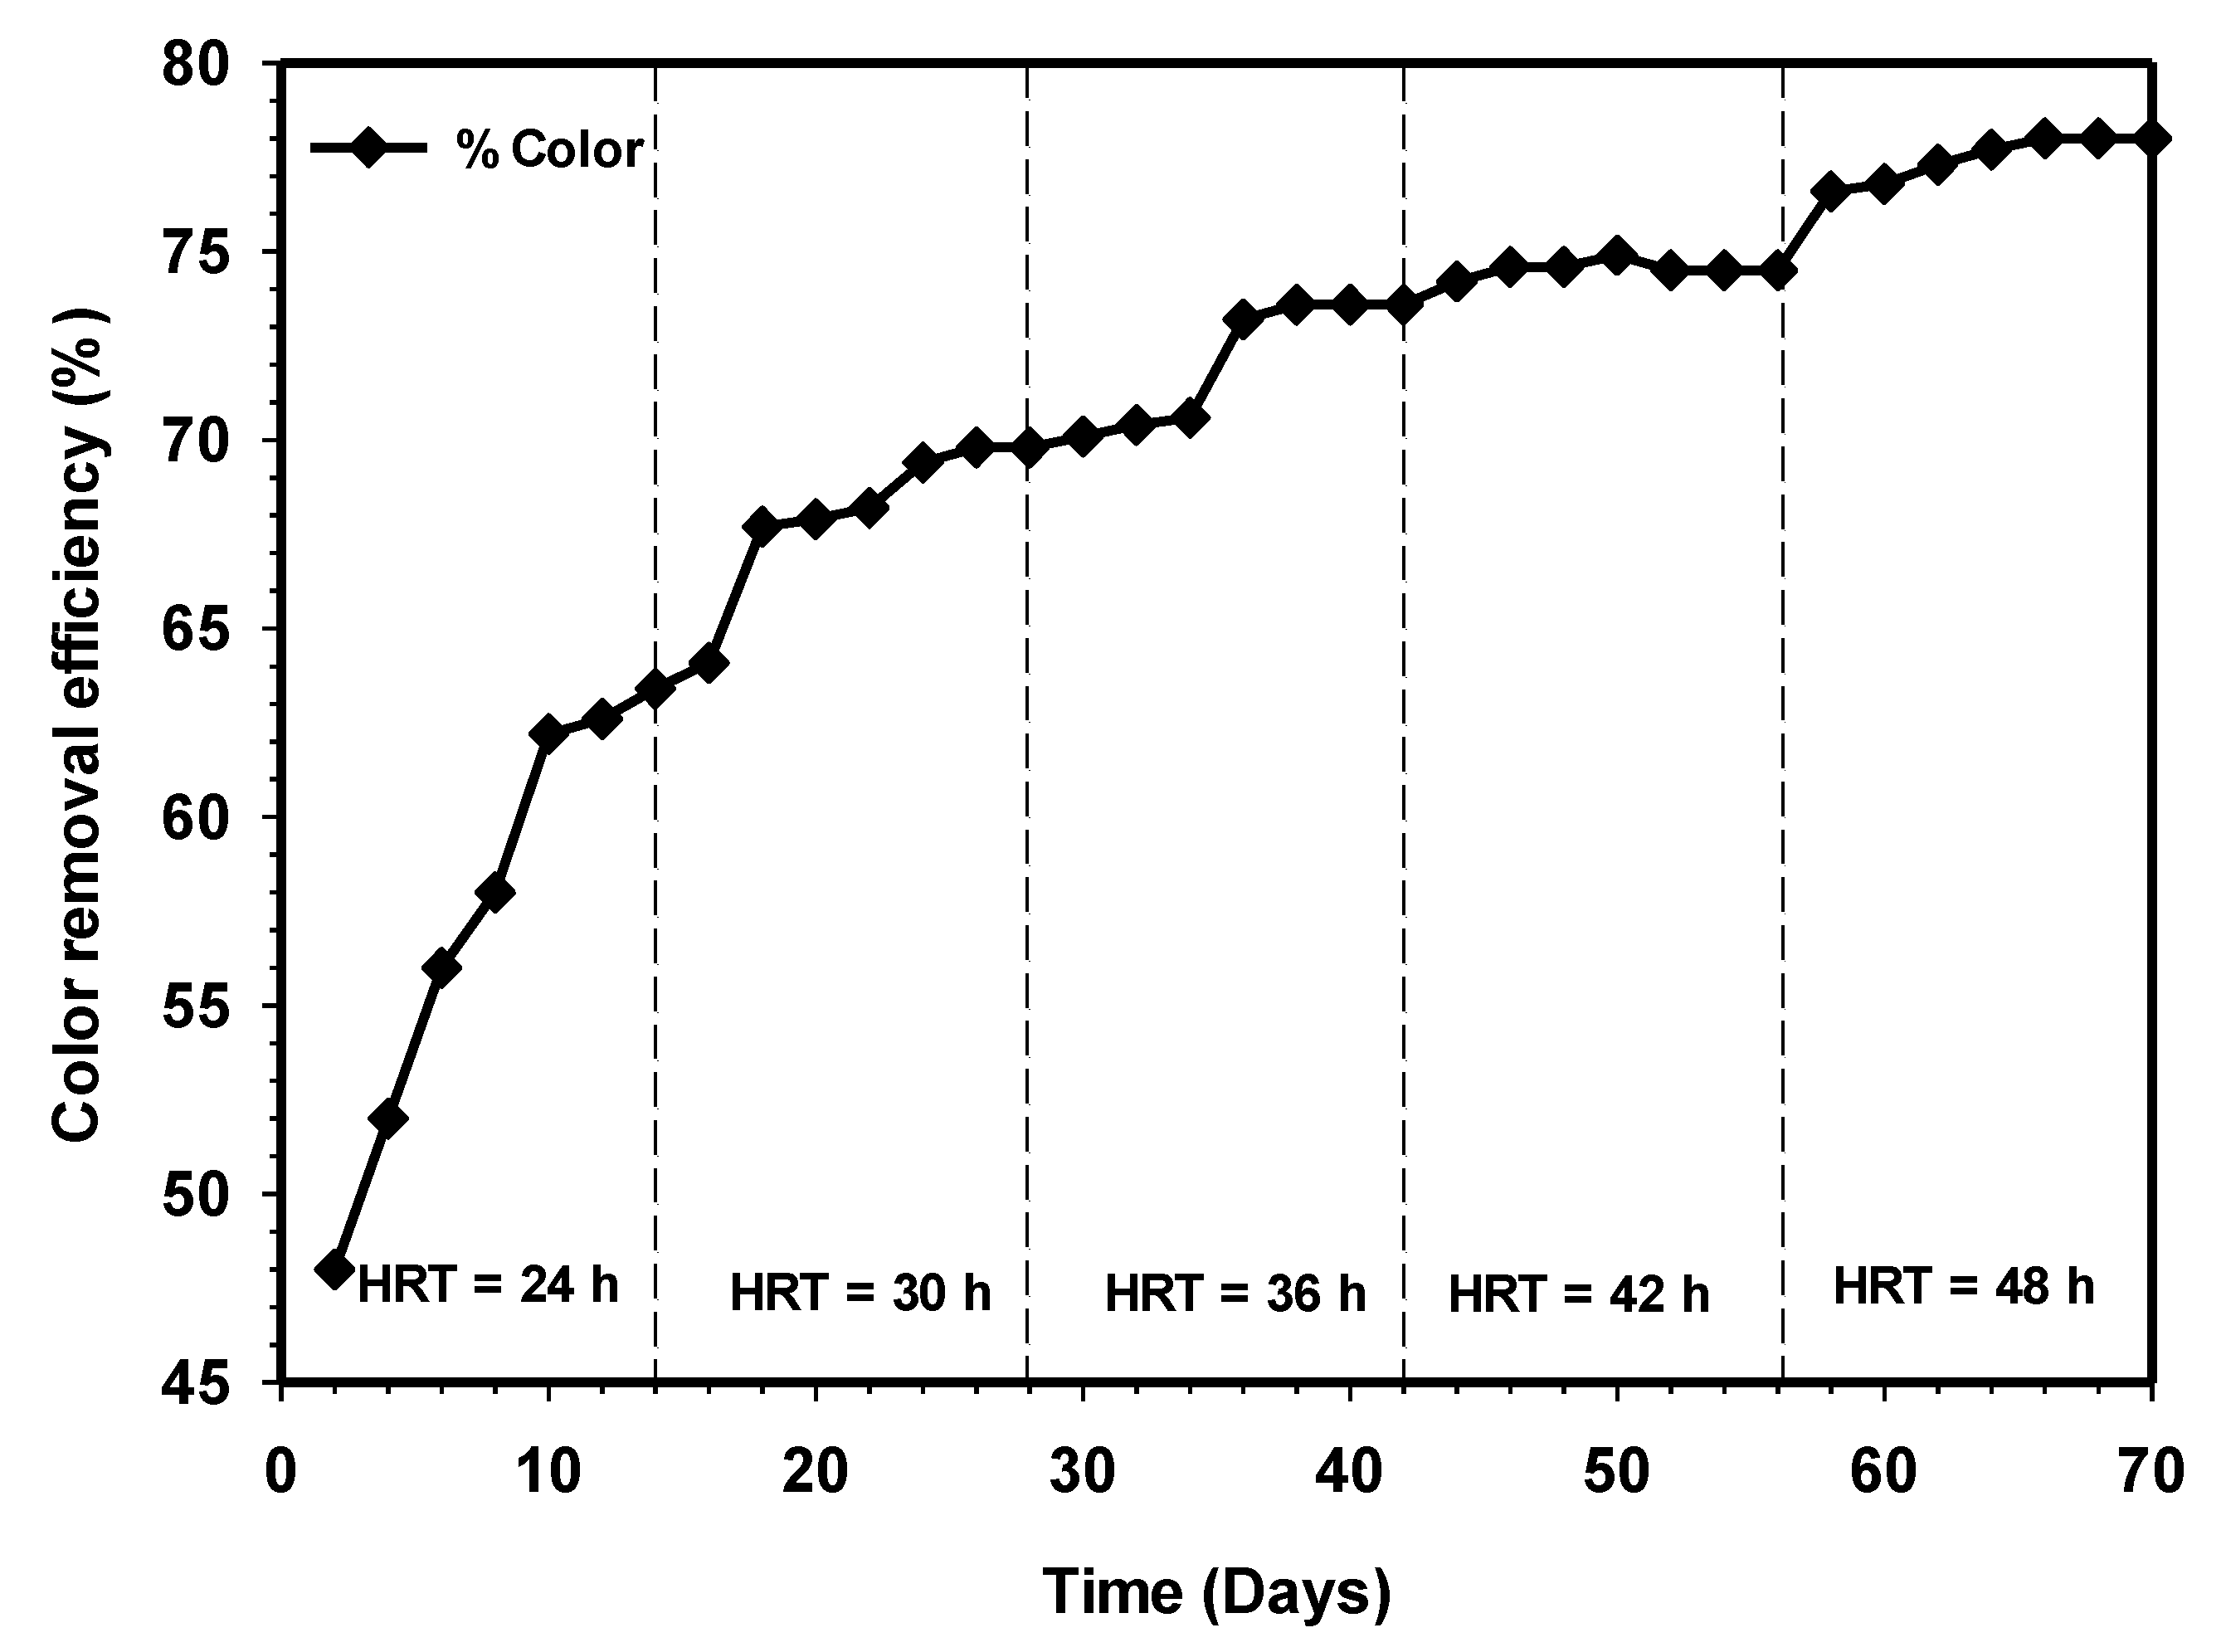
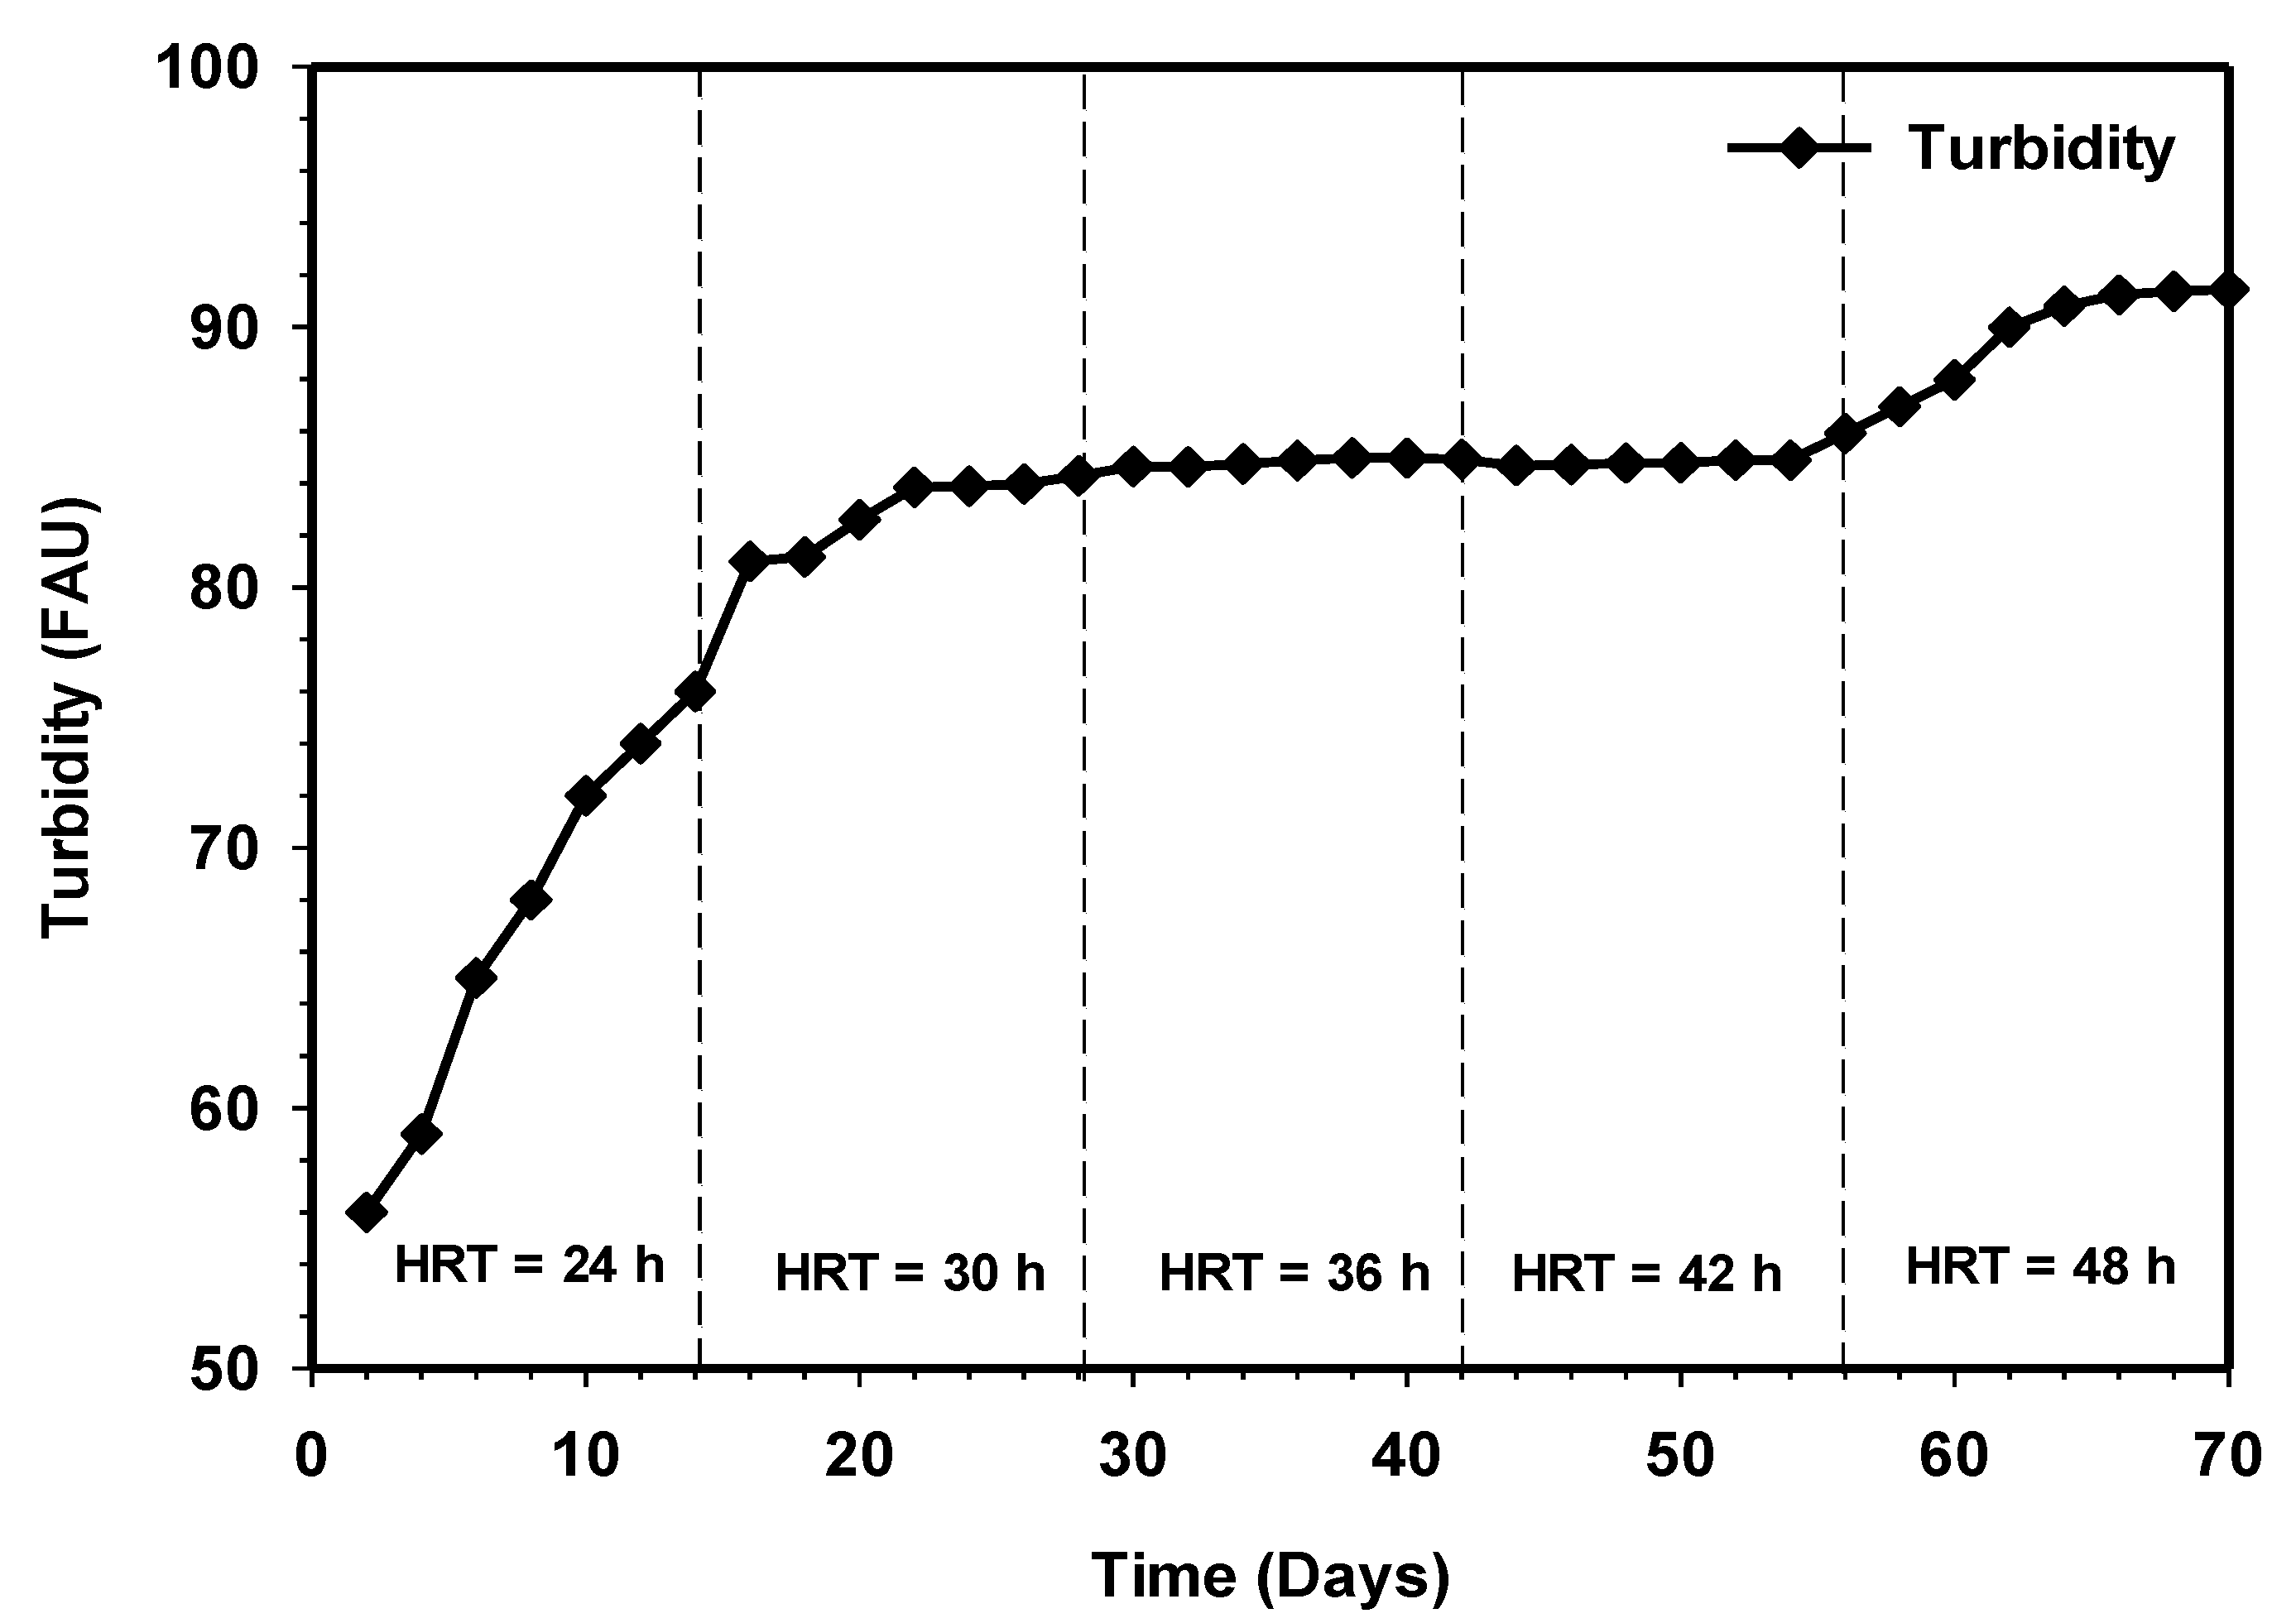
3.8. Effect of Increasing HRT on the Color Removal and Turbidly from the Effluent
Wastewater from cattle slaughterhouse is usually strong, with an intense color and highly turbidity due to suspended solid materials [36]. Inadequately treated or untreated discharge of slaughterhouse wastewater could result in the reduction of light penetration to the waterbody and hindered photosynthesis; however, this depends on the number of animals slaughtered and the method used for the slaughtering and processing and cleaning processes. The color removal and effluent turbidity as a function of time are demonstrated in Figure 12 and Figure 13. Both results showed increasing color removal and turbidity with increasing contact time. Initially, from day 1 to 14, the effluent color and turbidity were 69% and 84%. Steady-state turbidity was observed between HRT 36 and 42 h. However, with the increasing contact to 48 h, the color removal stood at 78%, while turbidity reached 91%. From an aesthetic point of view, the highest removal efficiencies, particularly for color removals, have not reached an acceptable final discharge limit, as stated by the Department of Environment Ministry of Natural Resources and Environment [37]. Therefore, the post-treatment of the effluent by partially adjusting the pH to the acidity level might be required to achieve high efficiency [38].
3.9. Scanning Electron Microscopy (SEM) Analysis of R2 after Increasing Contact Time
The performance of the anaerobic reactor to produce useful byproducts such as methane and high-quality effluent or nutrient-rich digestate depends mainly on the ability to retain the large population of microbes and the operation condition. More specific is the methanogenic archaea, which are slow-growing bacteria; except for the Methanosarcina sp., the majority of the bacterial community has a growth rate 2–20 times higher [39,40]. Figure 14 depicts the image of the sludge-coupled synthetic grass as attached growth in the HUASB reactor.
The images demonstrate the abundance of mainly Methanosarcina-like acetoclastic methanogens, and such bacteria species sufficiently handle increased loads and, therefore, would be less prone to upsets by feeding increases. Furthermore, Methanosarcina sp. can achieve stable growth at high organic loading rates (OLR) and high levels of ammonium and acetate concentrations. In contrast, high ammonium concentrations and elevated acetate levels were reported to suppress the growth of Methanosaeta sp. [41,42]. Several studies have shown that biomass is forced to grow in granules in upflow anaerobic sludge blanket (UASB) reactors, in order to avoid sludge washout. Acharya et al. [43], Wijekoon et al. [44], and Sasaki et al. [45] developed a system whereby active biomass was sufficiently retained by growing the microbial community in a biofilm, and this strongly supports the findings of the present work. Table 4 summarizes the steady-state performance of the R2 UASB reactors treating CSWW relative to increasing HRT.
4. Conclusions
To ascertain the rate of organic-matter degradation, the reactor HUASB was studied by increasing HRT at a constant OLR of 10 g L−1d−1. The results revealed that HRT of 48 h was sufficient enough to produce high biogas with high methane content. Other parameters such as TSS, VSS, FOG, color, and turbidity were highly removed to the lowest level in the effluent after 48 h. Methanosarcina bacterial species appeared predominantly in the system. Compared to other methanogens, like Methanosaeta sp., the methanosarcina is quite robust toward different impairments. The alkalinity ratio in all the varied HRT was below 0.3, and this is considered a stable state of anaerobic digestion. The efficiency of the reactor in the treatment of high-strength wastewater like the slaughterhouse waste portrays the reactor as a strong system for energy recovery, particularly in the slaughterhouse environment. It was noted that increasing HRT was responsible for increasing COD removal efficiency and more volume of biogas production. However, increasing HRT beyond 48 h might not be economical to the industrial players. Likewise, decreasing the HRT below 48 h could result in incomplete substrate degradation and underutilization of the reactor’s potential. Therefore, HRT of 48 h is considered as the optimum period to which cattle slaughterhouse wastewater could be allowed to sufficiently degrade in this reactor. Additionally, the reactor could also be scaled up to a commercial scale. However, further investigation should be conducted on the same reactor at the thermophilic temperature on the same wastewater and with wastewater with similar characteristics, such as palm oil mill effluent.
Author Contributions
Conceptualization, M.A.M. and S.I.; methodology, M.A.M.; validation, S.I.; formal analysis, M.A.M.; investigation, M.A.M.; resources, S.I.; data curation, S.I.; writing—original draft preparation, M.A.M.; writing—review and editing, S.I.; visualization, S.I.; supervision, S.I.; project administration, UPM.; funding acquisition, UPM. All authors have read and approved this article. All authors have read and agreed to the published version of the manuscript.
Funding
This research was financially supported by Universiti Putra Malaysia (UPM) on baseline grant No. GP-IPS/9633400.
Acknowledgments
The authors acknowledged the support received from Universiti Putra Malaysia for the preparation, execution, and writing of this research article.
Conflicts of Interest
The authors declare no conflicts of interest.
References
- Flores-Juarez, C.R.; Rodríguez-García, A.; Cárdenas-Mijangos, J.; Montoya-Herrera, L.; Arturo Godinez Tovar, L.; Bustos Bustos, E.; Rodríguez-Valadez, F.; Manríquez-Rocha, J. Chemically pretreating slaughterhouse solid waste to increase the efficiency of anaerobic digestion. J. Biosci. Bioeng. 2014, 118, 415–419. [Google Scholar] [CrossRef] [PubMed]
- Aryal, N.; Kvist, T. Alternative of Biogas Injection into the Danish Gas Grid System-A Study from Demand Perspective. Chem. Eng. 2018, 2, 43. [Google Scholar] [CrossRef] [Green Version]
- Delre, A.; Mønster, J.; Scheutz, C. Greenhouse gas emission quantification from wastewater treatment plants, using a tracer gas dispersion method. Sci. Total Environ. 2017, 605–606, 258–268. [Google Scholar] [CrossRef] [PubMed] [Green Version]
- Eeddy, M.; Tchobanoglous, G. Wastewater Engineering—Treatment and Reuse; McGraw-Hill: New York, NY, USA, 2004. [Google Scholar]
- US EPA. Technical Development Document for the Final Effluent Limitations Guidelines and Standards for the Meat and Poultry Products Point Source Category (40 CFR 432); US EPA: Washington, DC, USA, 2004; p. 61.
- Rajab, A.R.; Salim, M.R.; Sohaili, J.; Anuar, A.N.; Salmiati; Lakkaboyana, S.K. Performance of integrated anaerobic/aerobic sequencing batch reactor treating poultry slaughterhouse wastewater. Chem. Eng. J. 2017, 313, 967–974. [Google Scholar] [CrossRef]
- Johns, M.R.; Harrison, M.L.; Hutchinson, P.H.; Beswick, P. Sources of nutrients in wastewater from integrated cattle slaughterhouses. Water Sci. Technol. 1995, 32, 53–58. [Google Scholar] [CrossRef]
- Kraus, G.A. Alternatives to Conventional Food Processing; Royal Society of Chemistry: London, UK, 2017. [Google Scholar]
- Jing, Z.; Hu, Y.; Niu, Q.; Liu, Y.; Li, Y.Y.; Wang, X.C. UASB performance and electron competition between methane-producing archaea and sulfate-reducing bacteria in treating sulfate-rich wastewater containing ethanol and acetate. Bioresour. Technol. 2013, 137, 349–357. [Google Scholar] [CrossRef]
- Carrillo-Reyes, J.; Celis, L.B.; Alatriste-Mondragón, F.; Razo-Flores, E. Decreasing methane production in hydrogenogenic UASB reactors fed with cheese whey. Biomass Bioenergy 2014, 63, 101–108. [Google Scholar] [CrossRef]
- Fang, C.; Boe, K.; Angelidaki, I. Biogas production from potato-juice, a by-product from potato-starch processing, in upflow anaerobic sludge blanket (UASB) and expanded granular sludge bed (EGSB) reactors. Bioresour. Technol. 2011, 102, 5734–5741. [Google Scholar] [CrossRef]
- Ahmad, A.; Ghufran, R.; Wahid, Z.A. Role of calcium oxide in sludge granulation and methanogenesis for the treatment of palm oil mill effluent using UASB reactor. J. Hazard. Mater. 2011, 198, 40–48. [Google Scholar] [CrossRef]
- Lu, X.; Ni, J.; Zhen, G.; Kubota, K.; Li, Y.Y. Response of morphology and microbial community structure of granules to influent COD/SO42− ratios in an upflow anaerobic sludge blanket (UASB) reactor treating starch wastewater. Bioresour. Technol. 2018, 256, 456–465. [Google Scholar] [CrossRef]
- Lu, X.; Zhen, G.; Ni, J.; Hojo, T.; Kubota, K.; Li, Y.Y. Effect of influent COD/SO42- ratios on biodegradation behaviors of starch wastewater in an upflow anaerobic sludge blanket (UASB) reactor. Bioresour. Technol. 2016, 214, 175–183. [Google Scholar] [CrossRef]
- Claudia, E.T.; Cammarota, M.C.; Alcina, M.F.X. Slaughterhouse wastewater treatment: Evaluation of a new three-phase separation system in a UASB reactor. Bioresour. Technol. 2002, 81, 61–69. [Google Scholar] [CrossRef]
- APHA. Standard Methods for the Examination of Water and Wastewater; American Public Health Association/American Water Works Association/Water Environment Federation: Washington, DC, USA, 2005. [Google Scholar]
- Rosli, N.S.; Idrus, S.; Nick, D.N.; Ahsan, A. Assessment of potential biogas production from rice straw leachate in upflow anaerobic sludge blanket reactor. Int. J. Smart Grid Clean Energy 2016, 5, 135–143. [Google Scholar] [CrossRef] [Green Version]
- Nicolella, C.; Van Loosdrecht, M.C.M.; Heijnen, J.J. Wastewater treatment with particulate biofilm reactors. J. Biotechnol. 2000, 80, 1–33. [Google Scholar] [CrossRef]
- Cao, Y.S.; Zhang, H.; Li, Y.Z. USAB treatment of monosodium glutamate wastewater; Dynamic and kinetic behaviour of the start-up of the reactor. Water Sci. Technol. 1992, 26, 2441–2444. [Google Scholar] [CrossRef]
- Cuetos, M.J.; Gómez, X.; Otero, M.; Morán, A. Anaerobic digestion of solid slaughterhouse waste (SHW) at laboratory scale: Influence of co-digestion with the organic fraction of municipal solid waste (OFMSW). Biochem. Eng. J. 2008, 40, 99–106. [Google Scholar] [CrossRef]
- Halalsheh, M.; Koppes, J.; Den Elzen, J.; Zeeman, G.; Fayyad, M.; Lettinga, G. Effect of SRT and temperature on biological conversions and the related scum-forming potential. Water Res. 2005, 39, 2475–2482. [Google Scholar] [CrossRef]
- Appels, L.; Van Assche, A.; Willems, K.; Degrève, J.; Van Impe, J.; Dewil, R. Peracetic acid oxidation as an alternative pre-treatment for the anaerobic digestion of waste activated sludge. Bioresour. Technol. 2011, 102, 4124–4130. [Google Scholar] [CrossRef]
- Ramírez-Sáenz, D.; Zarate-Segura, P.B.; Guerrero-Barajas, C.; García-Peña, E.I. H2S and volatile fatty acids elimination by biofiltration: Clean-up process for biogas potential use. J. Hazard. Mater. 2009, 163, 1272–1281. [Google Scholar] [CrossRef]
- Song, Y.C.; Kwon, S.J.; Woo, J.H. Mesophilic and thermophilic temperature co-phase anaerobic digestion compared with single-stage mesophilic- and thermophilic digestion of sewage sludge. Water Res. 2004, 38, 1653–1662. [Google Scholar] [CrossRef]
- Yenigün, O.; Demirel, B. Ammonia inhibition in anaerobic digestion: A review. Process Biochem. 2013, 48, 901–911. [Google Scholar] [CrossRef]
- Whelan, M.J.; Everitt, T.; Villa, R. A mass transfer model of ammonia volatilisation from anaerobic digestate. Waste Manag. 2010, 30, 1808–1812. [Google Scholar] [CrossRef] [PubMed]
- Kim, D.H.; Oh, S.E. Continuous high-solids anaerobic co-digestion of organic solid wastes under mesophilic conditions. Waste Manag. 2011, 31, 1943–1948. [Google Scholar] [CrossRef] [PubMed]
- Walker, M.; Iyer, K.; Heaven, S.; Banks, C.J. Ammonia removal in anaerobic digestion by biogas stripping: An evaluation of process alternatives using a first order rate model based on experimental findings. Chem. Eng. J. 2011, 178, 138–145. [Google Scholar] [CrossRef] [Green Version]
- Wang, X.; Yang, G.; Feng, Y.; Ren, G.; Han, X. Optimizing feeding composition and carbon-nitrogen ratios for improved methane yield during anaerobic co-digestion of dairy, chicken manure and wheat straw. Bioresour. Technol. 2012, 120, 78–83. [Google Scholar] [CrossRef] [PubMed]
- Gerardi, M.H. The Microbiology of Anaerobic Digester; John Wiley & Sons, Inc.: Hoboken, NJ, USA, 2003; Volume 111, p. 479. [Google Scholar] [CrossRef]
- Shanmugam, P.; Horan, N.J. Optimising the biogas production from leather fleshing waste by co-digestion with MSW. Bioresour. Technol. 2009, 100, 4117–4120. [Google Scholar] [CrossRef] [PubMed]
- Karlsson, A.; Ejlertsson, J. Addition of HCl as a means to improve biogas production from protein-rich food industry waste. Biochem. Eng. J. 2012, 61, 43–48. [Google Scholar] [CrossRef]
- Girault, R.; Bridoux, G.; Nauleau, F.; Poullain, C.; Buffet, J.; Peu, P.; Sadowski, A.G.; Béline, F. Anaerobic co-digestion of waste activated sludge and greasy sludge from flotation process: Batch versus CSTR experiments to investigate optimal design. Bioresour. Technol. 2012, 105, 1–8. [Google Scholar] [CrossRef] [Green Version]
- Long, J.H.; Aziz, T.N.; Reyes, F.L.d.L.; Ducoste, J.J. Anaerobic co-digestion of fat, oil, and grease (FOG): A review of gas production and process limitations. Process Saf. Environ. Prot. 2012, 90, 231–245. [Google Scholar] [CrossRef]
- Abass, O.A.; Jameel, A.T.; Muyubi, S.A.; Abdul Karim, M.I.; Alam, A.Z.M. Removal of Oil and Grease as Emerging Pollutants of Concern (EPC) in Wastewater Stream. IIUM Eng. J. 2011, 12, 161–169. [Google Scholar] [CrossRef]
- León-Becerril, E.; García-Camacho, J.E.; Del Real-Olvera, J.; López-López, A. Performance of an upflow anaerobic filter in the treatment of cold meat industry wastewater. Process Saf. Environ. Prot. 2016, 102, 385–391. [Google Scholar] [CrossRef]
- Department of Environment Ministry of Natural Resources and Environment Wisma Sumber Asli. Environmental Requirements: A Guide For. Investors, 11th ed.; Federal Government Administrative Centre: Putrajaya, Malaysia, 2010.
- Yetilmezsoy, K.; Ilhan, F.; Sapci-Zengin, Z.; Sakar, S.; Gonullu, M.T. Decolorization and COD reduction of UASB pretreated poultry manure wastewater by electrocoagulation process: A post-treatment study. J. Hazard. Mater. 2009, 162, 120–132. [Google Scholar] [CrossRef] [PubMed]
- Conklin, A.; Stensel, H.D.; Ferguson, J. Growth kinetics and competition between Methanosarcina and Methanosaeta in mesophilic anaerobic digestion. Water Environ. Res. 2006, 78, 486–496. [Google Scholar] [CrossRef]
- Qu, X.; Vavilin, V.A.; Mazéas, L.; Lemunier, M.; Duquennoi, C.; He, P.J.; Bouchezb, T. Anaerobic biodegradation of cellulosic material: Batch experiments and modelling based on isotopic data and focusing on aceticlastic and non-aceticlastic methanogenesis. Waste Manag. 2009, 29, 1828–1837. [Google Scholar] [CrossRef] [PubMed]
- De Vrieze, J.; Hennebel, T.; Boon, N.; Verstraete, W. Methanosarcina: The rediscovered methanogen for heavy duty biomethanation. Bioresour. Technol. 2012, 112, 1–9. [Google Scholar] [CrossRef] [PubMed]
- Ziganshin, A.M.; Schmidt, T.; Scholwin, F.; Il’Inskaya, O.N.; Harms, H.; Kleinsteuber, S. Bacteria and archaea involved in anaerobic digestion of distillers grains with solubles. Appl. Microbiol. Biotechnol. 2011, 89, 2039–2052. [Google Scholar] [CrossRef]
- Acharya, B.K.; Pathak, H.; Mohana, S.; Shouche, Y.; Singh, V.; Madamwar, D. Kinetic modelling and microbial community assessment of anaerobic biphasic fixed film bioreactor treating distillery spent wash. Water Res. 2011, 45, 4248–4259. [Google Scholar] [CrossRef]
- Wijekoon, K.C.; Visvanathan, C.; Abeynayaka, A. Effect of organic loading rate on VFA production, organic matter removal and microbial activity of a two-stage thermophilic anaerobic membrane bioreactor. Bioresour. Technol. 2011, 102, 5353–5360. [Google Scholar] [CrossRef]
- Sasaki, K.; Haruta, S.; Ueno, Y.; Ishii, M.; Igarashi, Y. Microbial population in the biomass adhering to supporting material in a packed-bed reactor degrading organic solid waste. Appl. Microbiol. Biotechnol. 2007, 75, 941–952. [Google Scholar] [CrossRef]
Figure 1.
Schematic representation of the modified hybrid upflow anaerobic sludge blanket (HUASB) reactor.
Figure 1.
Schematic representation of the modified hybrid upflow anaerobic sludge blanket (HUASB) reactor.

Figure 2.
Acclimation period relative to COD removal efficiency.

Figure 3.
Variation of biogas production relative to increasing contact time.

Figure 4.
Variation of specific methane production relative to increasing contact time.

Figure 5.
Variation of COD removals relative to increasing contact time.

Figure 6.
Variation of TSS removals efficiency relative to increasing contact time.

Figure 7.
Variation of VSS removals relative to increasing contact time.

Figure 8.
Variation of pH relative to increasing contact time.

Figure 9.
Variation of alkalinity ratio relative to increasing contact time.

Figure 10.
Variation of ammonia nitrogen relative to increasing contact time.

Figure 11.
Variation of fats, oil, and grease (FOG) removal relative to increasing contact time.

Figure 12.
Variation of color removal relative to increasing contact time.

Figure 13.
Variation in turbidity relative to increasing contact time.

Figure 14.
Image of granules from the sludge bed in the HUASB section: (a) aggregates of coccus which form the granule before pre-treatment and (b) attachment of microbes on synthetic grass after pre-treatment.
Figure 14.
Image of granules from the sludge bed in the HUASB section: (a) aggregates of coccus which form the granule before pre-treatment and (b) attachment of microbes on synthetic grass after pre-treatment.


Table 1.
Characteristics of the cattle slaughterhouse wastewater (CSWW). COD = chemical oxygen demand; TSS = total suspended solids; VSS = volatile suspended solids; FOG = fats, oil, and grease.
Table 1.
Characteristics of the cattle slaughterhouse wastewater (CSWW). COD = chemical oxygen demand; TSS = total suspended solids; VSS = volatile suspended solids; FOG = fats, oil, and grease.
| Parameters | Unit | Average Value |
|---|---|---|
| COD | mg/L | 32,000 ± 112 |
| BOD5 | mg/L | 17,158 ± 95 |
| TSS | mg/L | 22,300 ± 212 |
| VSS | mg/L | 18,924 ± 318 |
| TN | mg/L | 1865 ± 18 |
| PO43- | mg/L | 49 ± 2 |
| Protein | mg/L | 11,637.6 ± 18 |
| NH3-N | mg/L | 38 ± 1 |
| FOG | mg/L | 1024 ± 34 |
| Alkalinity | mg/L as CaCO3 | 582 ± 14 |
| pH | - | 6.9 ± 0.8 |
| Temperature | °C | 27.6± 0.5 |
| Color | Pt-Co | 16,426.8 ± 334 |
| Turbidity | FAU | 12,500 ± 76 |
Table 2.
Synthetic wastewater composition.
| Materials | Quantity | Unit |
|---|---|---|
| Yeast (granular form) | 23 | g |
| Urea | 2 | g |
| Sugar | 11.5 | g |
| Ammonium phosphate (NH4)2HPO4 | 3.4 | g |
| Full cream | 144 | mL |
| Raw blood from cattle slaughterhouse | 5.75 | mL |
| Tap water | Full to 1 L |
Table 3.
Operational condition for monitoring HUASB reactor under continuous mode. HRT = hydraulic retention time.
Table 3.
Operational condition for monitoring HUASB reactor under continuous mode. HRT = hydraulic retention time.
| Run | Duration (Days) | Influent COD (g L−1) | HRT (h) | pH |
|---|---|---|---|---|
| I. | 14 | 20 | 24 | 7.2 |
| II. | 14 | 20 | 30 | 7.4 |
| III. | 14 | 20 | 30 | 7.2 |
| IV. | 14 | 20 | 42 | 7.1 |
| V. | 14 | 20 | 48 | 7.3 |
Table 4.
Summary of the steady-state performance of the R2 UASB reactor treating CSWW relative increasing HRT.
Table 4.
Summary of the steady-state performance of the R2 UASB reactor treating CSWW relative increasing HRT.
| Run | Duration (Days) | Influent COD (g L−1) | HRT (h) | Biogas (L/d) | (%) Methane | COD (%) | SMP (LCH4/gCODadded) | pH | Alkalinity Ratio (IA/PA) | NH3-N (mg/L) | TSS (%) | VSS (mg/L) | FOG (%) | Color (Pt/Co) | Turbidity (FAU) |
|---|---|---|---|---|---|---|---|---|---|---|---|---|---|---|---|
| I. | 14 | 20 | 24 | 27 | 84 | 92 | 0.2 | 6.9 | 0.16 | 414 | 94 | 521 | 53.9 | 62 | 74 |
| II. | 14 | 20 | 30 | 29 | 77 | 95 | 0.21 | 6.8 | 0.15 | 452 | 94 | 401 | 64 | 69 | 84 |
| III. | 14 | 20 | 36 | 32 | 81 | 96 | 0.24 | 7.1 | 0.18 | 565 | 95 | 355 | 71 | 73 | 84.9 |
| IV. | 14 | 20 | 42 | 33 | 82 | 96.7 | 0.24 | 7.2 | 0.22 | 663 | 96 | 345 | 73 | 74 | 85 |
| V. | 14 | 20 | 48 | 38 | 86 | 97.6 | 0.26 | 7.2 | 0.22 | 839 | 97 | 285 | 79 | 78 | 91 |
HRT: hydraulic retention time; COD: chemical oxygen demand; SMP: specific methane production; TSS: total suspended solids; VSS: volatile suspended solids; FOG: fats, oil, and grease.
© 2020 by the authors. Licensee MDPI, Basel, Switzerland. This article is an open access article distributed under the terms and conditions of the Creative Commons Attribution (CC BY) license (http://creativecommons.org/licenses/by/4.0/).
Share and Cite
MDPI and ACS Style
Musa, M.A.; Idrus, S. Effect of Hydraulic Retention Time on the Treatment of Real Cattle Slaughterhouse Wastewater and Biogas Production from HUASB Reactor. Water 2020, 12, 490. https://0-doi-org.brum.beds.ac.uk/10.3390/w12020490
AMA Style
Musa MA, Idrus S. Effect of Hydraulic Retention Time on the Treatment of Real Cattle Slaughterhouse Wastewater and Biogas Production from HUASB Reactor. Water. 2020; 12(2):490. https://0-doi-org.brum.beds.ac.uk/10.3390/w12020490
Chicago/Turabian StyleMusa, Mohammed Ali, and Syazwani Idrus. 2020. "Effect of Hydraulic Retention Time on the Treatment of Real Cattle Slaughterhouse Wastewater and Biogas Production from HUASB Reactor" Water 12, no. 2: 490. https://0-doi-org.brum.beds.ac.uk/10.3390/w12020490
Note that from the first issue of 2016, this journal uses article numbers instead of page numbers. See further details here.