Article

Nitrogen and Phosphorus Loads in Greek Rivers: Implications for Management in Compliance with the Water Framework Directive

by
Konstantinos Stefanidis
1,
Aikaterini Christopoulou
2,
Serafeim Poulos
3,
Emmanouil Dassenakis
2 and
Elias Dimitriou
1,*
1
Hellenic Centre for Marine Research, Institute of Marine Biological Resources and Inland Waters, 46.7 km of Athens—Sounio Ave., 19013 Anavyssos, Attiki, Greece
2
Laboratory of Environmental Chemistry, Department of Chemistry, National and Kapodistrian University of Athens, University Campus Zografou, 15784 Athens, Greece
3
Department of Geology & Geoenvironment, National & Kapodistrian University of Athens, University Campus Zografou, 15784 Athens, Greece
*
Author to whom correspondence should be addressed.
Submission received: 8 April 2020 / Revised: 14 May 2020 / Accepted: 25 May 2020 / Published: 27 May 2020
(This article belongs to the Special Issue Assessing Surface and Ground- Water Vulnerability and Pollution Risk)

Abstract

:
Reduction of nutrient loadings is often prioritized among other management measures for improving the water quality of freshwaters within the catchment. However, urban point sources and agriculture still thrive as the main drivers of nitrogen and phosphorus pollution in European rivers. With this article we present a nationwide assessment of nitrogen and phosphorus loads that 18 large rivers in Greece receive with the purpose to assess variability among seasons, catchments, and river types and distinguish relationships between loads and land uses of the catchment. We employed an extensive dataset of 636 field measurements of nutrient concentrations and river discharges to calculate nitrogen and phosphorus loads. Descriptive statistics and a cluster analysis were conducted to identify commonalties and differences among catchments and seasons. In addition a network analysis was conducted and its modularity feature was used to detect commonalities among rivers and sampling sites with regard to their nutrient loads. A correlation analysis was used to identify major possible connections between types of land uses and nutrient loads. The results indicated that the rivers Alfeios, Strymonas, and Aliakmonas receive the highest inorganic nitrogen loads while the highest inorganic phosphorus loads were calculated for the rivers Strymonas, Aliakmonas, and Axios. Concerning the temporal variation of loads, inorganic nitrogen presented a peak on March and gradually declined until October when the dry period typically ends for most regions of Greece. Inorganic phosphorus loads had the highest average value in August and the lowest in October. Thus, our findings confirmed the presence of a typical seasonal variation in nitrogen loads that follows the seasonality in hydrology where high surface runoff during the wet months contribute to higher river discharges and higher nitrogen loads from the catchment. On the contrary, high phosphorus loads persisted during dry months that could be attributed to a dilution effect. Furthermore, the results imply a clear connection between agriculture and both nitrogen and phosphorus. Overall, this work presents extensive information on the nitrogen and phosphorus loads that major rivers in Greece receive that can largely aid water managers to adapt and revise basin management plans in accordance with agricultural management (e.g., which months farmers should reduce the use of fertilizers) with the purpose of meeting the environmental targets defined by the Water Framework Directive (WFD).

1. Introduction

Riverine nitrogen (N) and phosphorus (P) are in various dissolved, particulate, organic and inorganic forms. From a global perspective particulate organic nitrogen (PON) is the dominant nitrogen form, even if dissolved inorganic nitrogen (DIN) becomes increasingly important due to a growing anthropogenic contribution [1]. Moreover, particulate inorganic phosphorus (PIP) is the dominant transport form for phosphorus while DIP can be bound to suspended or settled material, making it difficult to distinguish between dissolved and particulate forms. The P content of rivers may thus be governed by a “spiral pattern” [2,3] involving the absorption and release of dissolved phosphorus from dynamic sediment transport and settling.
Excessive nutrient loading is inarguably the primary cause of anthropogenic eutrophication nowadays. Particularly urban point sources and agriculture are the main drivers of nitrogen and phosphorus pollution that consequently trigger eutrophication processes in many freshwater lakes and streams worldwide [4,5]. The consequences of eutrophication on aquatic ecosystems are well known and documented in numerous scientific articles, with water quality degradation and biodiversity loss acknowledged as the most prominent [6]. On the other hand, rivers are important sources of freshwater and nutrients for coastal waters as in the case of the oligotrophic Mediterranean and the mesotrophic Black Sea [7,8]. Moreover, for nitrogen (N) and phosphorus (P) additional inputs from human activities often dominate the natural sources and it has been postulated that between 1970 and 1990, humans increased the global delivery of dissolved inorganic N and P to the oceans by a factor of three [9,10].
Yet, future changes in socioeconomic drivers (e.g., population growth and increased food demand) are expected to exacerbate nutrient pollution, mainly through an increase in agricultural production that will inevitably lead to intensification of agriculture and extensive use of fertilizers [7,8,9]. In addition, climate change may affect the underlying processes of nutrient kinetics and transportation from land to water [8]. For example, changes in precipitation patterns by affecting the hydrologic regime would influence the nutrient dynamics in the catchment. For Greece particular, modelling studies have predicted an increase of nutrient pollution by 2060 either due to socio-economical changes, or future changes in the hydrology or both depending on the prevailed future world scenario [11].
Concerning the estimation of nutrient loads, there are two broad approaches to load apportionment modelling. First, load-orientated approaches which apportion origin based on measured in-stream loads [12,13], and second, source-orientated approaches where amounts of diffuse emissions are calculated using models typically based on export coefficients from catchments with similar characteristics [14,15].
In order to avert deterioration of all European inland waters (rivers, lakes, coastal waters, and groundwaters), the Directive 2000/60/EC established a framework for Community action in the field of water policy and defined the objectives and the guidelines for all European member states to achieve and maintain good ecological status by year 2015. However, since the second WFD implementation cycle ended in 2015, several problems concerning the implementation of the Directive were reported. Most of these problems concern the failure to comply with certain WFD Articles that consequently led to the inability to meet the environmental targets. According to the reports from Europe’s first River Basin Management Plans (RBMPs), 56% of European rivers have failed to achieve the good status targets of the Water Framework Directive (WFD) [16,17,18], with diffuse pollution to be considered a major factor of water quality degradation. At the same time, the development of new activities, the need to increase the productivity of existing ones, and the needs arising from population growth and the raising of living standards create an increasing demand for water of appropriate quality for each use [19]. Therefore, the continuous quality degradation, coupled with the need to maintain ecological balance and sustainable management of natural resources, requires a careful and effective planning of catchment management. The latter often is associated with detailed information on the spatial distribution of pollution sources and the seasonal variation of nutrient effluents, which can be achieved with a systematic monitoring of water quality. The Institute of Marine Biological Resources and Inland Waters (IMBRIW) of Hellenic Centre for Marine Research (HCMR) has been assigned to implement the WFD monitoring in the surface water bodies of Greece [20].
In Greece, management of river waters is a challenge, because a systematic water quality monitoring of all river and catchments is implemented only the last few years compared to other countries [20,21,22]. An additional difficulty is the presence of little information on periods with low discharges. In addition discharge measurements are often prone to extreme conditions such as droughts, flash floods, desertification, and forest fires [23] making them, in particular, vulnerable to hydrological pressures [24]. Moreover, very little is known concerning future changes in river flow regime due to climate change [25,26,27], and their environmental consequences, which are of great importance for the society and the national economy.
In this work, we present a nationwide assessment of nitrogen and phosphorus loads in 18 Greek rivers aiming to identify patterns of spatial and temporal variability that could have significant implications for catchment management schemes, according to the WFD’s requirements. More specifically, we take advantage of the extensive monitored data, collected during the National River Monitoring Program, to: (i) Estimate nutrient N and P loads; (ii) assess variability among seasons, catchments and river types; and (iii) distinguish relationships between loads and land uses. In addition, the results of this work consist a first important step for future studies that aim to employ catchment modelling at national scale for simulating nutrient transport processes from the catchment to surface and coastal waters.

2. Materials and Methods

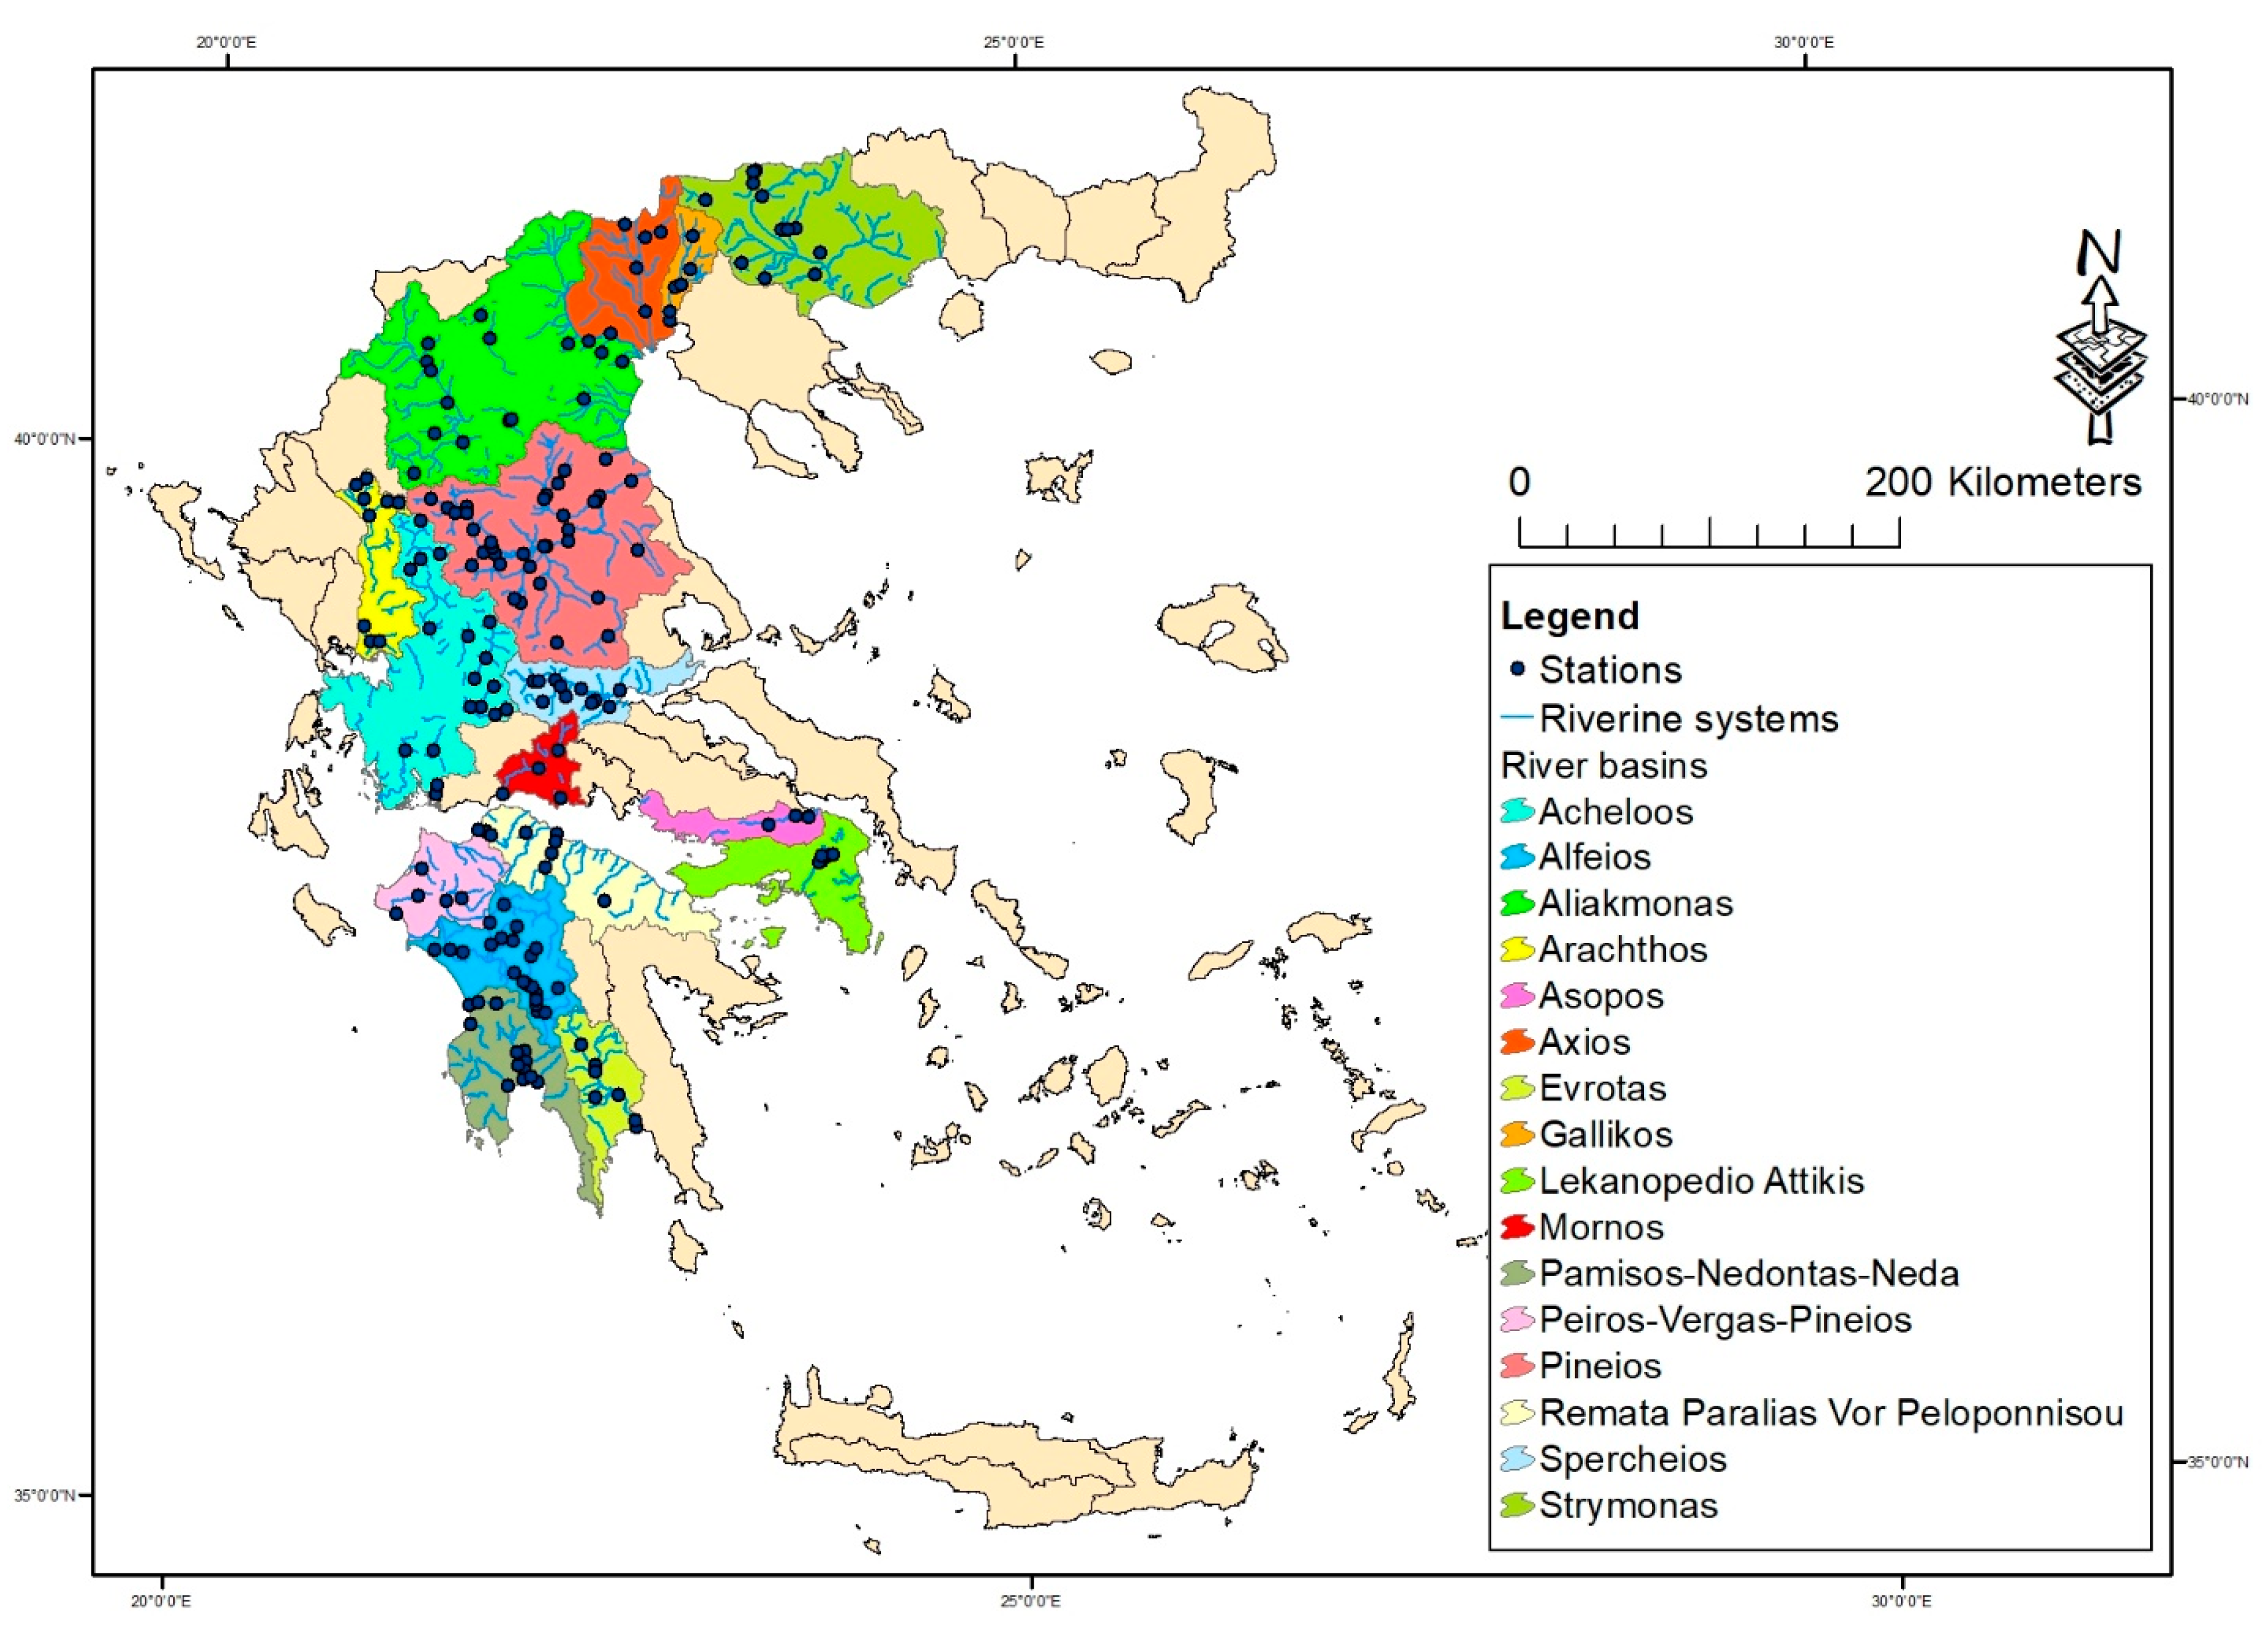
2.1. Description of Data

Physicochemical and hydromorphological data for 18 rivers belonging to 16 basins in Greece (Table 1, Figure 1) were obtained from the results of the National River Monitoring Program for the period 2012–2015. Greek rivers flow along the southern part of the Balkan peninsula and they are characterized as mountainous (high relief) with variable catchment lithology and a high seasonality in terms of water discharge [28]. The present investigation presents the analysis of data sets from 18 rivers with catchment areas of varying sizes and flow regime (Table 1) [29].
Multi-annual seasonal (winter, spring, and summer) field samplings were carried out in the operational sites of the network. Surveillance sites were sampled seasonal but for one year only during the monitoring period (2012–2015). Thus, our dataset consisted of 636 records containing information on concentrations of nitrate, nitrite, ammonium and phosphate in water. Total inorganic nitrogen was calculated as the sum of the three nitrogen species (nitrate, nitrite, and ammonium). Discharge estimations were made according to Rantz et al. [30] based on multiple measurements of flow velocity and water depth at intervals of channel width.
Then, nitrogen and phosphorus loads were calculated using the nutrient concentrations and the discharge according to the following equation:
L o a d   ( kg day ) = D i s c h a r g e ( m 3 s ) × 3600 × 24 × N u t r i e n t   c o n c e n t r a t i o n   ( mg L ) 1000

2.2. Data Treatment and Analysis

Descriptive statistics were calculated for each river and intercalibration river type (ICTs) and boxplots were produced to visually assess the spatial variation of physicochemical parameters and loads among the studied river basins. ICTs refer to the river typology that is used by each geographic intercalibration group in order to identify river systems with common characteristics. Here, ICTs were defined according to [31]. Seasonal variability was examined with the use of statistics on a monthly basis.
A cluster analysis was conducted with the method of furthest neighbor and Euclidian distance based on the averages of N-NO2, N-NO3, N-NH4, TIN, and P-PO4 loads for each basin in order to distinguish groups of basins that share similar features in terms of loads. In addition Spearman correlation analysis was conducted to check for significant relationships among nutrient loads, discharge, and land uses. All statistics were conducted with the IBM SPSS v 25. Boxplots were created in R environment [32]. Hierarchical cluster analysis followed after grouping all pollution loads by river catchment and applying the squared Euclidean distance algorithm in the SPSS. The output diagram clustered the examined rivers in different groups depending on their pollution load levels.
Finally, a network analysis was conducted with the Gephi software v.0.9.2 (https://gephi.org/users/download/) [33] and its modularity feature was used to detect commonalities among rivers and sampling sites with regard to their nutrient loads. The network analysis was complementary to the cluster analysis and occurred by again grouping all available nutrient load data by river catchment. The relevant algorithm placed each river in the network space depending on the number of samples that they had in each quality class. The resulted network diagram was very useful for comparative purposes since the it assigned different positions in the studied rivers according to their overall quality.

2.3. Spatial Data—Land Uses at Catchment Scale

Spatial data that were used for mapping were downloaded from the Geoportal of the Special Secretariat for Water (http://wfdgis.ypeka.gr/, access on 5 November 2018) as shapefiles. The spatial data concerned the national water monitoring network, the hydrographic network, the extent of the river basins of Greece, the extent of the RBDs and the ecological status of the Greek riverine systems.
Land use data for each basin were obtained from the CORINE (Coordination of Information on the Environment) 2012 maps (https://land.copernicus.eu/pan-european/corine-land-cover, access on 5 November 2018). For the purposes of this work, the shares of land uses were calculated at the 1st level of CORINE classification and thus the following land uses were considered in further analyses, Artificial Areas, Cultivated Areas, Forest and Semi-natural Areas, Wetlands, and Water Bodies. The shares of each land use type in the total basin area were also calculated.

3. Results and Discussion

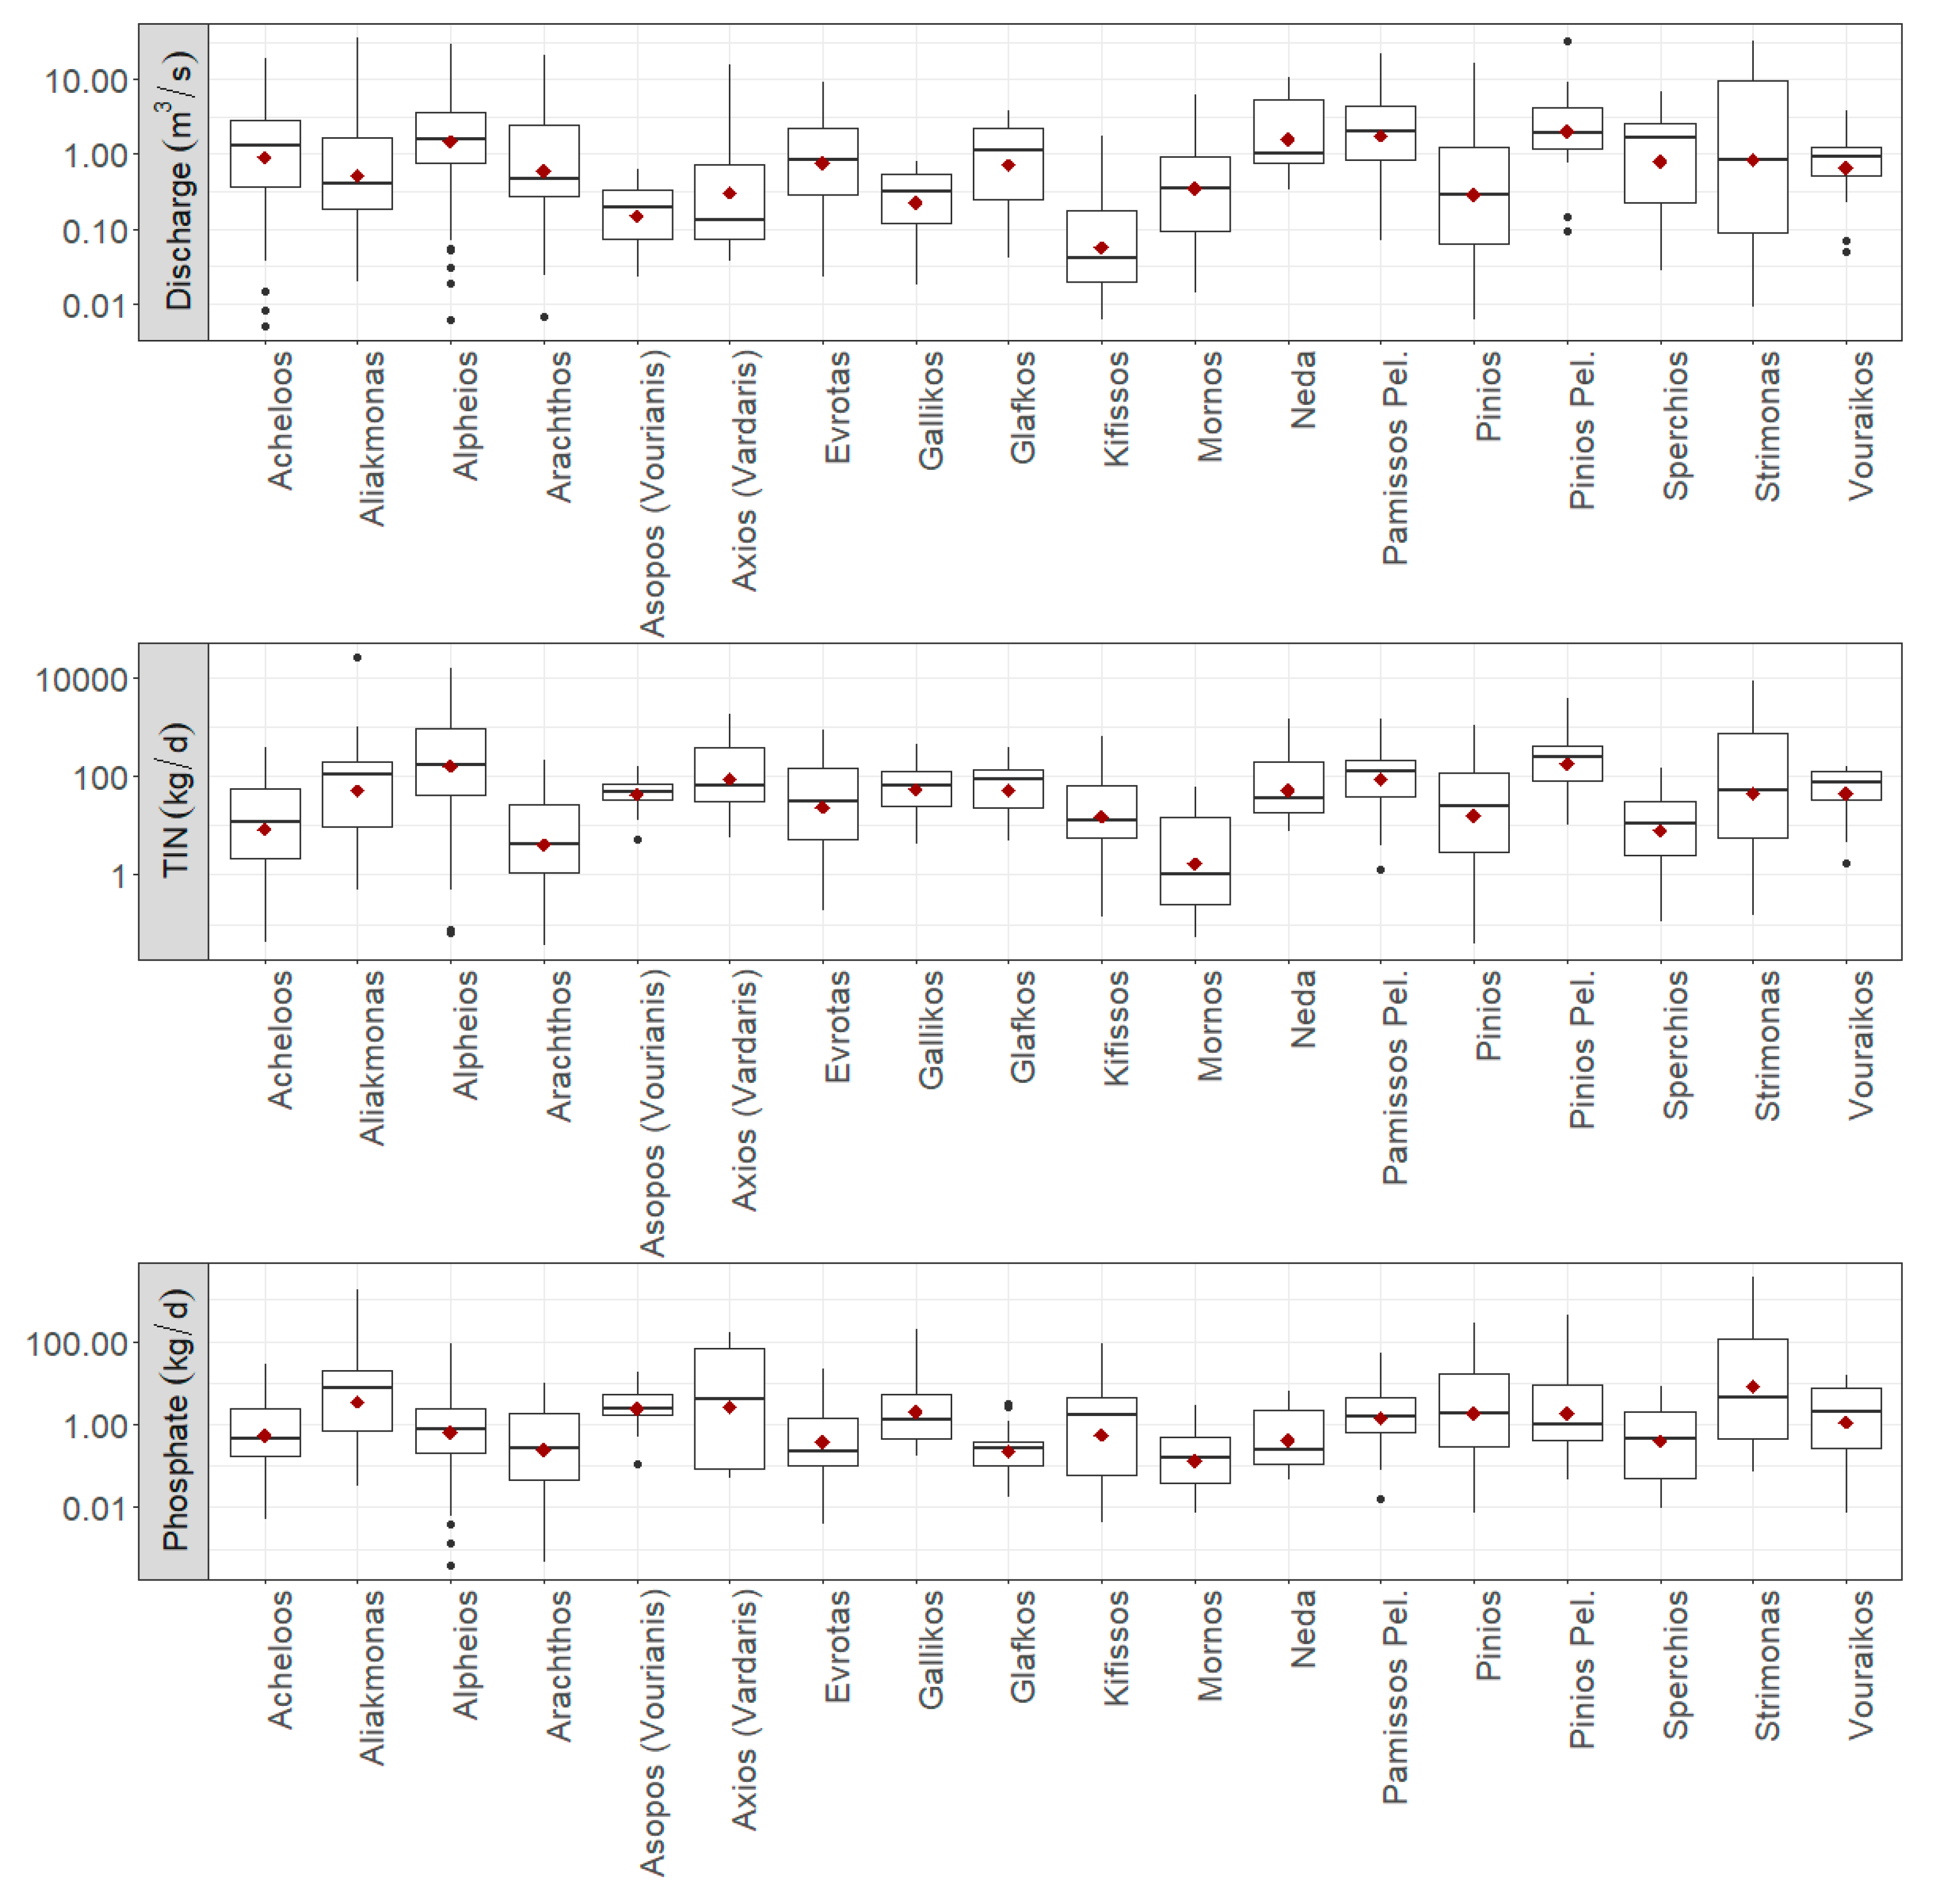
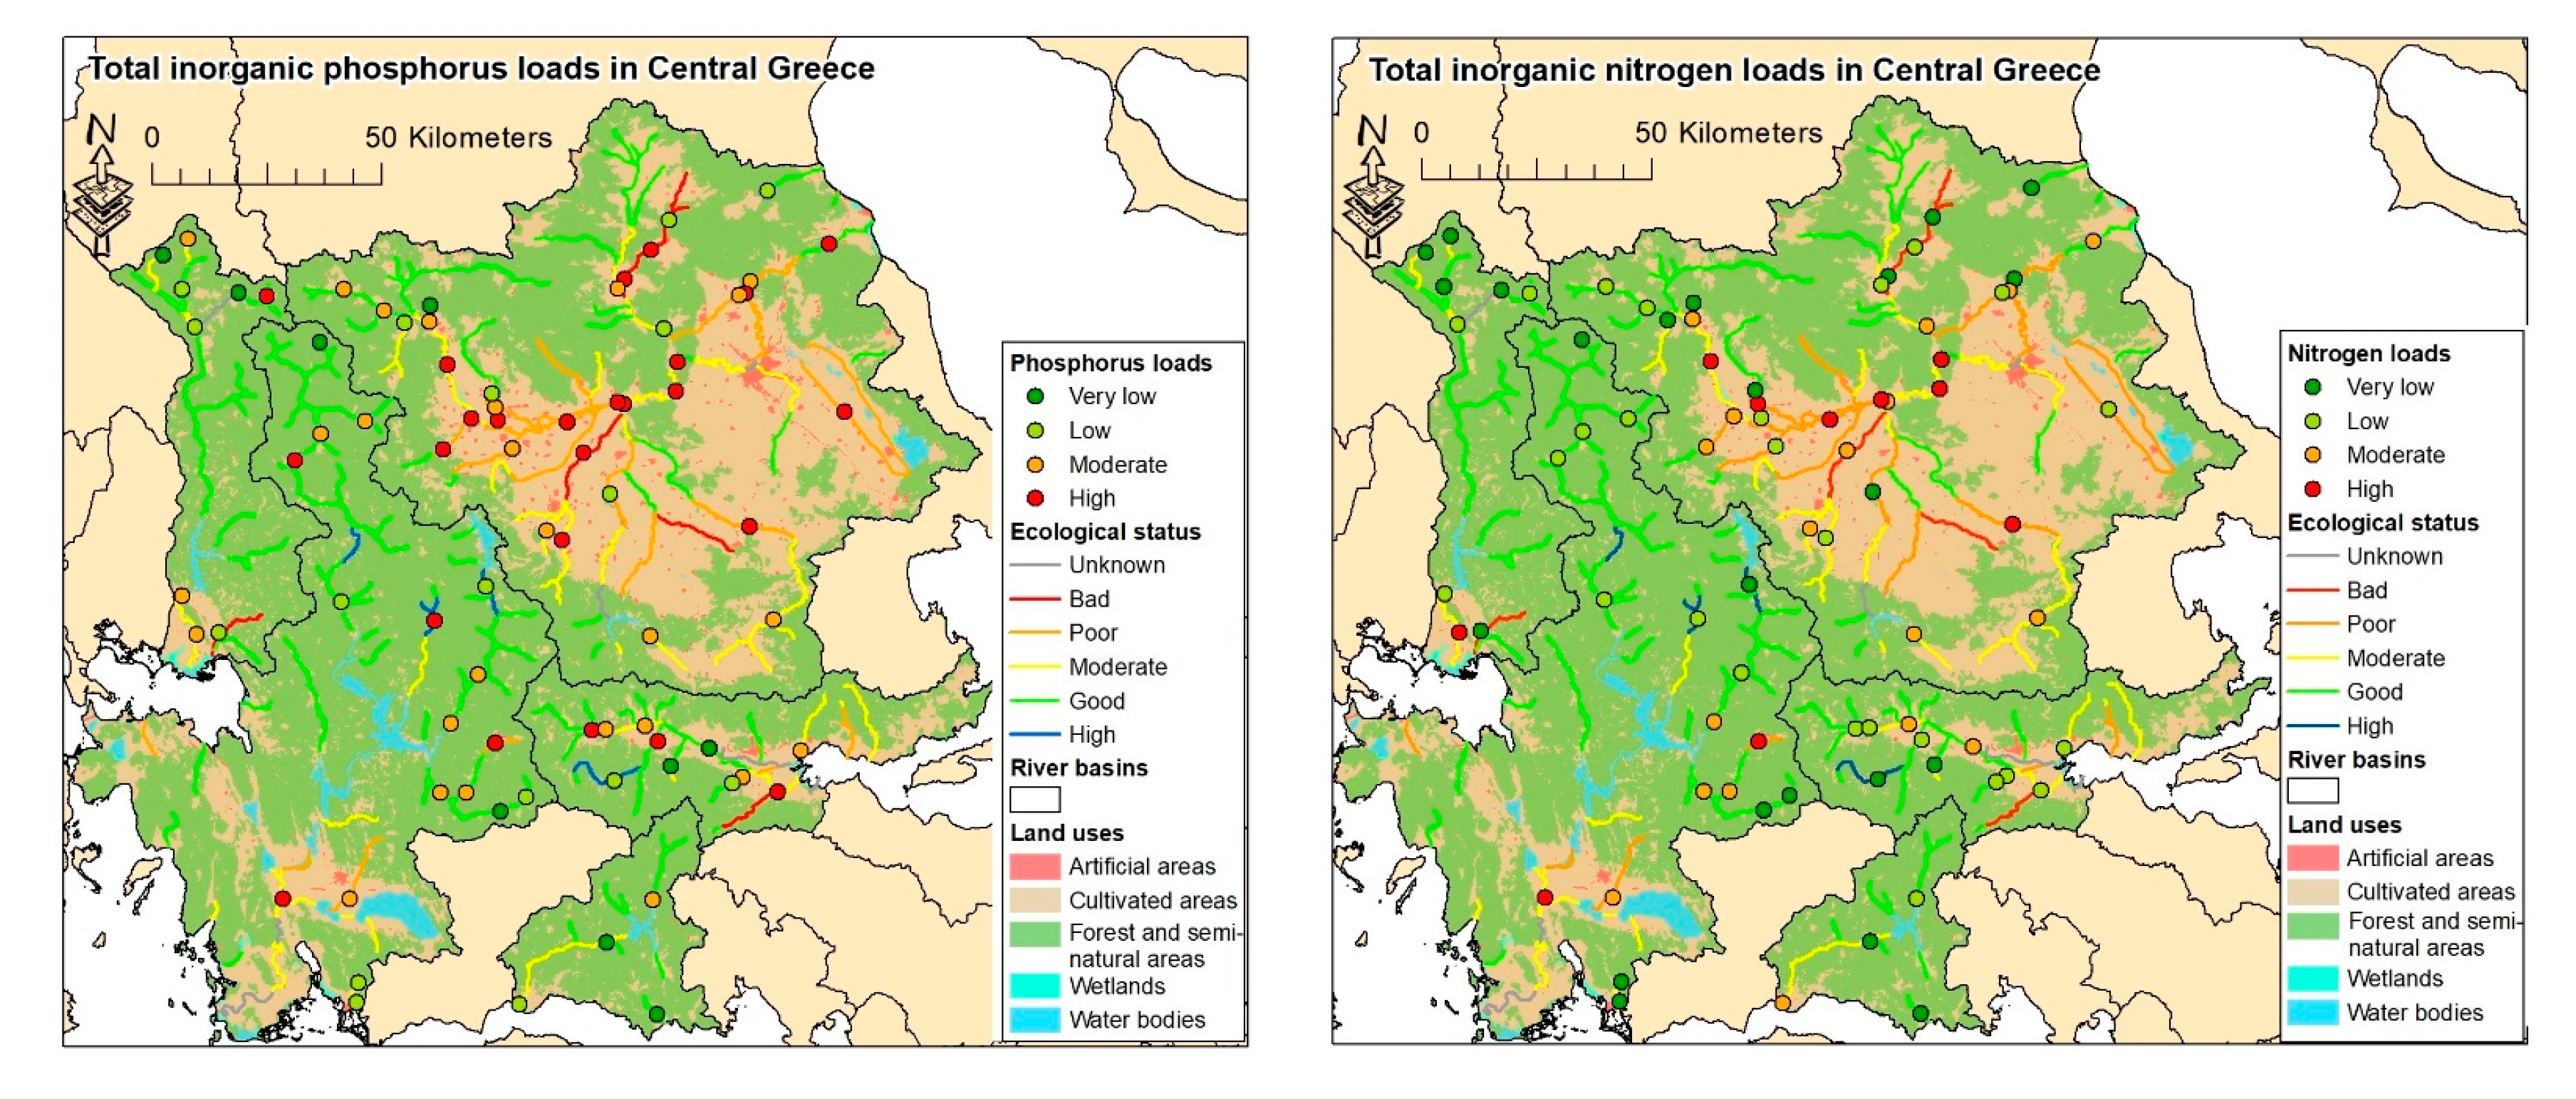
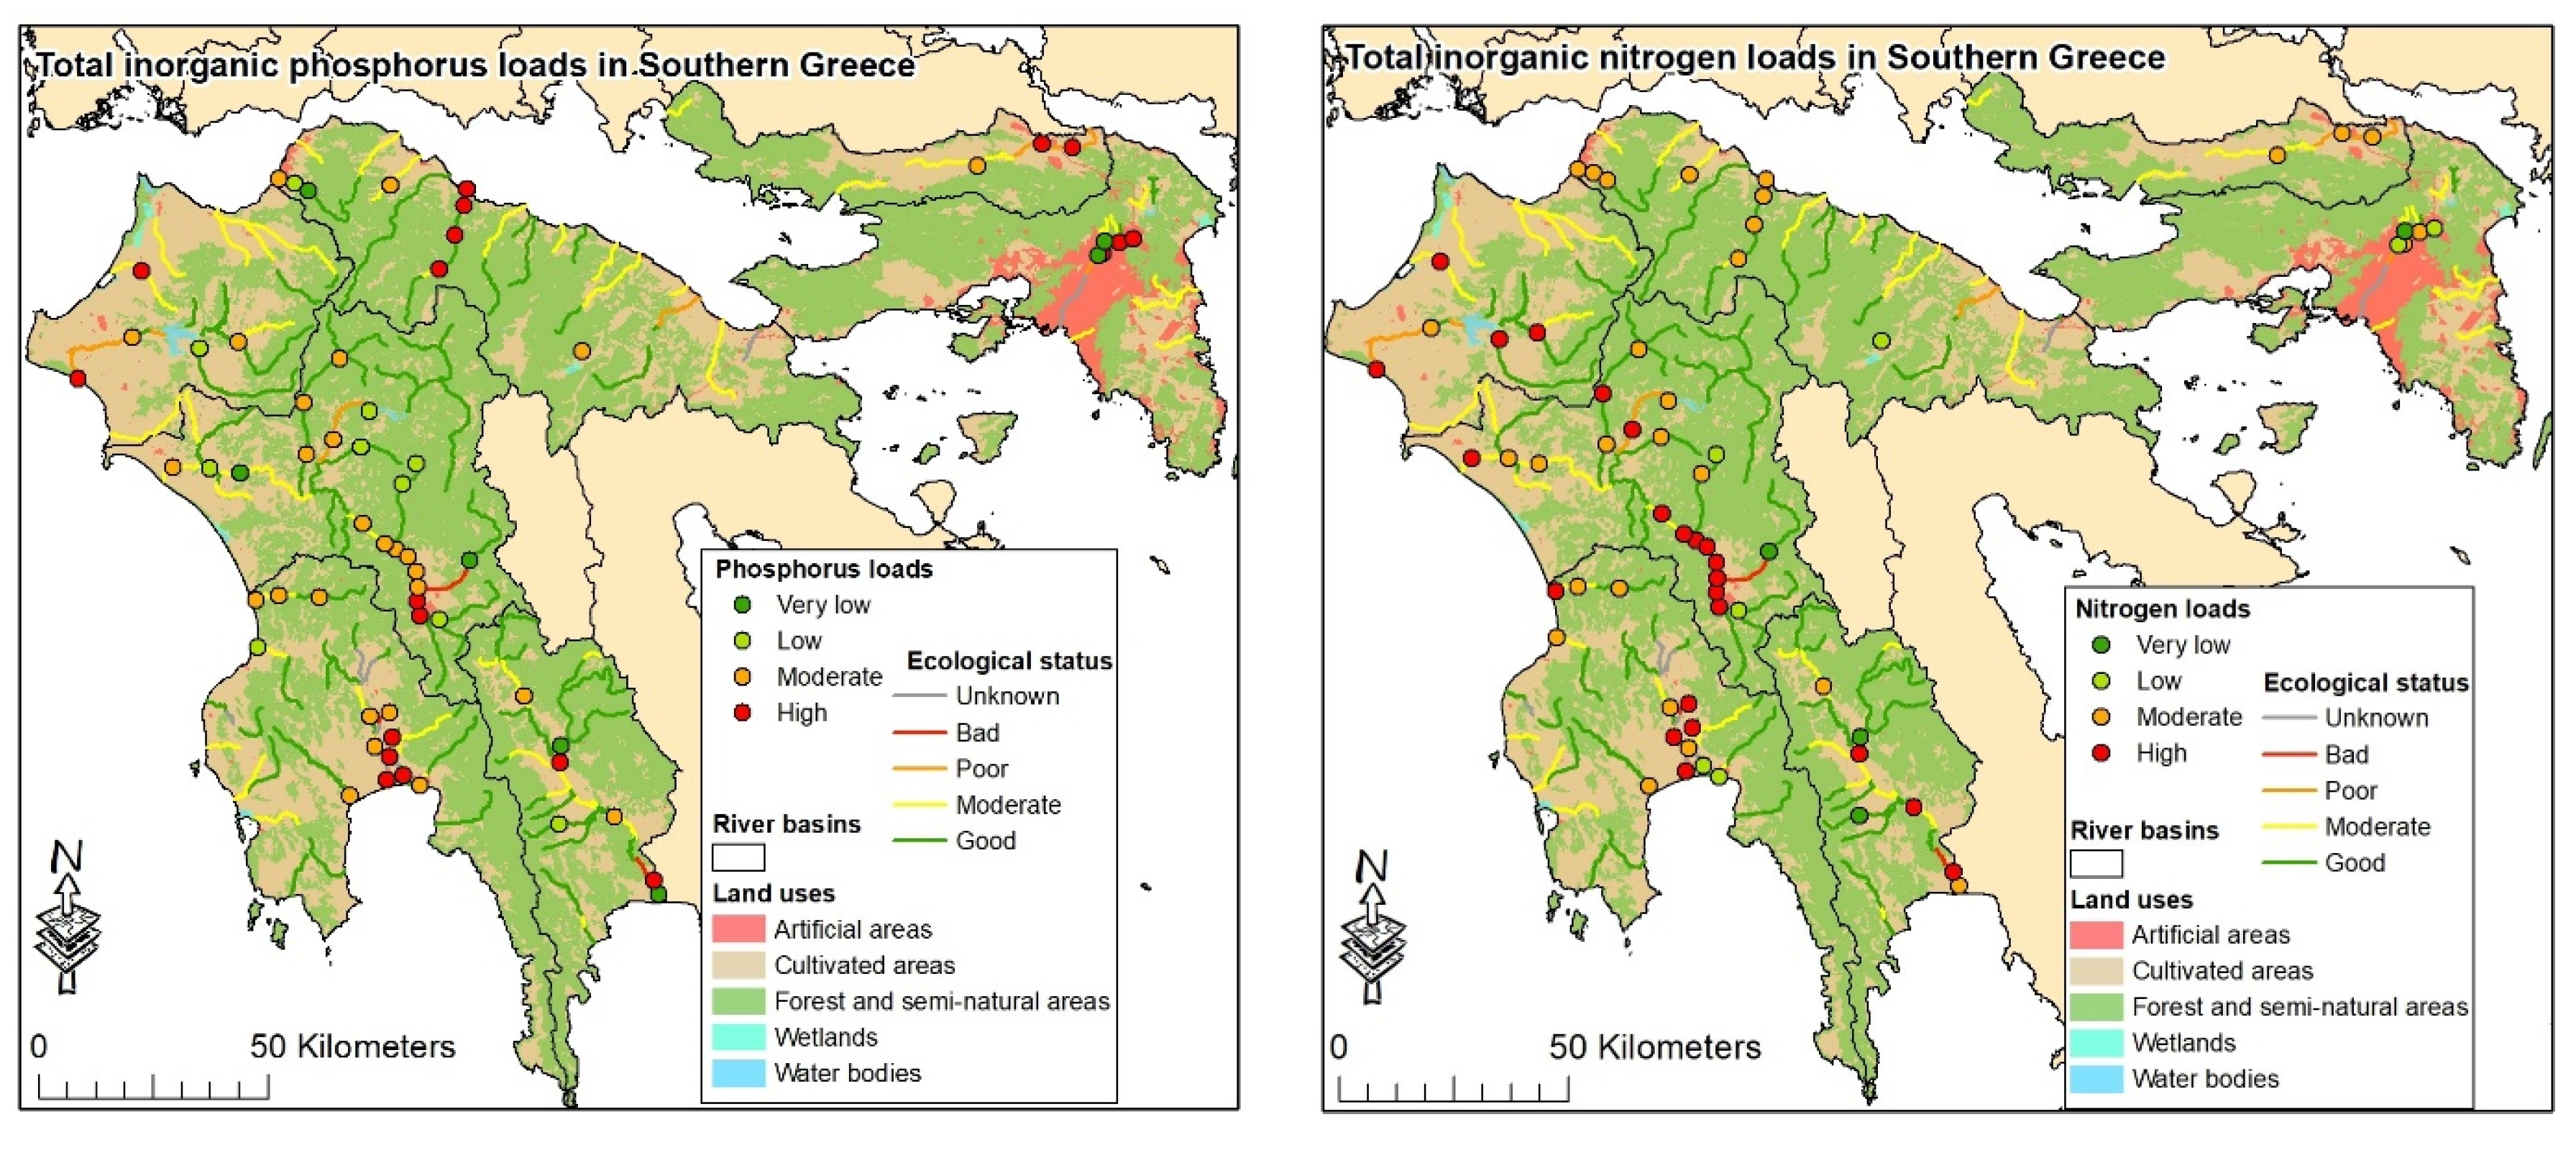
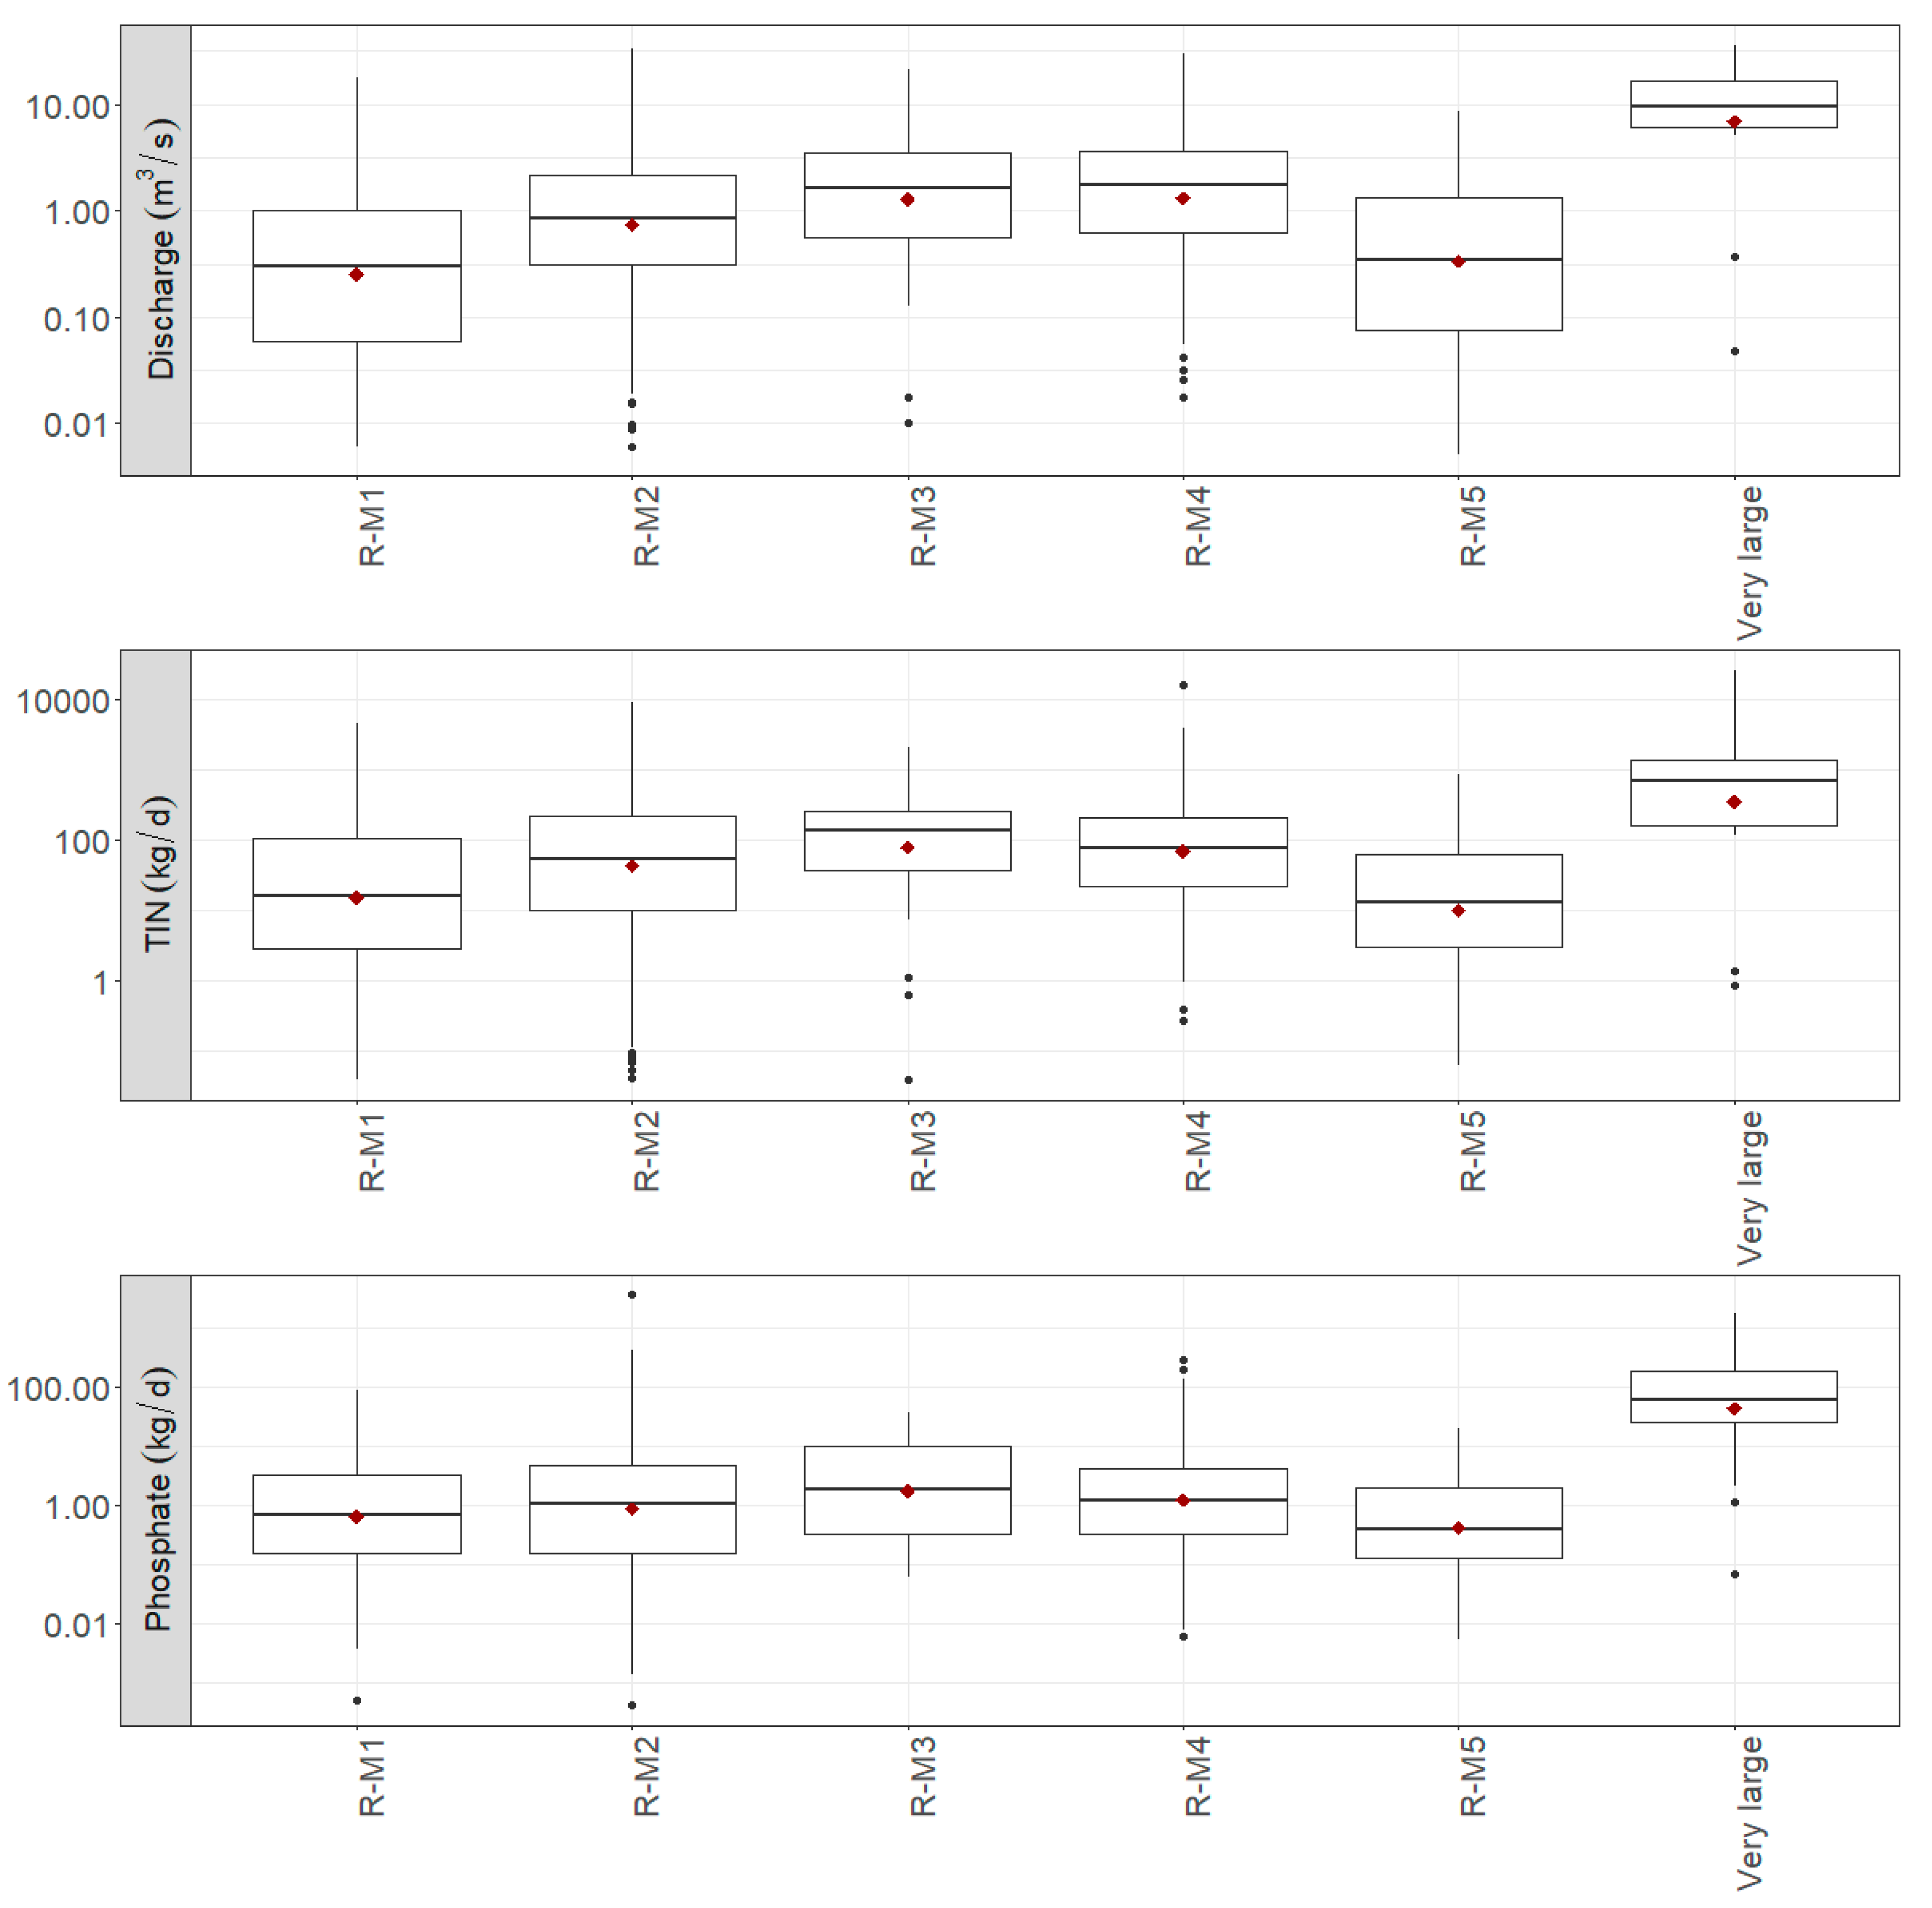
3.1. Spatial Variation of Nutrient Loads

Boxplots in Figure 2 show the spatial variation of discharge, total inorganic nitrogen and phosphate loads among the 18 studied rivers. The boxplots offer a first quick assessment of the differences in the estimated nutrient loads that the rivers receive. Alpheios and Pineios P. (Western Peloponnese RBD), as well as Aliakmonas (Western Macedonia RBD), are the rivers with the highest TIN median loads in the particular study period while Mornos, Aracthos (West. Sterea Ellada), and Spercheios (East. Sterea Ellada) are the ones with the lowest median values (Figure 2). Regarding Inorganic Phosphorus loads, Aliakmonas, Axios (Central Macedonia RBD), and Strymonas (Easter Macedonia RBD) are the rivers with the highest median values while Aracthos, Mornos, and Glafkos (Northern Peloponnese RBD) are the rivers with the lowest values. In addition, Figure 3, Figure 4 and Figure 5 show maps that classify the phosphorus and nitrogen loads into four classes, ranging from very low to high loads.
The classification of nitrogen and phosphorus loads into four quality classes was based on the 25th percentile, 50th percentile, and 75th percentile values (Table 2). Quality classes for the studied basins were mapped with the ArcMap 10.3. The produced maps also included the main land uses and the ecological status for the river water bodies in each basin according to the results of the WFD National River Monitoring Program.
For example we can identify areas in Central Greece where a high share of agriculture coincide with moderate and high inorganic phosphorus loads and moderate to bad ecological status. Furthermore, the maps can show areas with high total inorganic nitrogen loads and agriculture. In contrast, catchments that forests and semi-natural areas prevail are mostly characterized by low and very low loads and water bodies with good ecological status.
Riverine systems in rural areas appear to have either poor or bad ecological status. Phosphorus loads in sampling sites belonging to these systems have a moderate or high load class. The catchments of Pineios in Central Greece (Figure 3), Axios and Aliakmonas in Northern Greece (Figure 4) and Kifissos, Asopos, and Pamissos in Southern Greece (Figure 5) are all good examples of the linkages between urban and agricultural environments and increased nutrient loads. On the contrary, water bodies in catchments with high proportion of forest and semi-natural areas (e.g., Acheloos and Mornos) present good and even high ecological status with low or very low loads.
The produced maps clearly show a spatial variation of nutrient loads that depends on the dominant land uses in the catchment. There is an obvious pattern where catchments with natural land uses have more water bodies with good and high ecological status and lower nutrient loads compared to the urban and agriculture dominated catchments where bad, poor, and moderate ecological status coincides with moderate and high nutrient loads. These results agree with several other studies that have showed that agriculture are the main source of nitrogen loads that end in water bodies [34,35]. For phosphorus, high loads may be related not only with agriculture but also with other sources such as urban and industrial wastes [34,36].
The maps also aid us to identify areas that deviate from the expected pattern of high loads in agricultural and/or urban catchments. For example, sites located in the transboundary catchments of Axios and Strymonas and very close to the borders exhibit high loads of nitrogen and phosphorus although the main land uses are forests and the ecological status is classified as good (Figure 4). This possibly implies that water bodies in transboundary catchments are affected by upstream sources of pollution which raises the need for an effective cooperative management framework. At the same time it proves that transboundary freshwater treaties must include provisions for securing the good water quality status along the countries’ boundaries [37]. Another striking exception is the case of Vouraikos where although there is a high share of forested areas within the catchment, all sites along the river are characterized by high phosphorus loads. Yet, the nitrogen loads are moderate and the ecological status classification of these water bodies falls within the Good class which could mean that in these systems nitrogen is the limiting factor of eutrophication processes which is a rather interesting finding. Nevertheless, the visualization of our results offers a rapid assessment of catchments that deviate from the normal patterns and draws the attention on these systems for more elaborate analyses.
By further examining the spatial variation of nutrient loads among catchments we observe that the three highest mean values of total inorganic nitrogen loads (kg/day) were calculated for Alfeios, Strymonas, and Aliakmonas (Figure 2, Table 3). Concerning the total inorganic phosphorus loads (kg/day) the highest values were estimated for the basins of Strymonas, Aliakmonas, and Axios (Table 2). Conversely the three lowest mean values of total inorganic nitrogen were calculated for Spercheios, Arachthos, and Mornos and the lowest total inorganic phosphorus loads were measured in Neda, Glafkos, and Mornos.
The rivers Strymonas and Axios presented also the highest fluctuations in total phosphorus loads, followed by Aliakmonas and Pineios (Figure 2). Large fluctuations in total inorganic nitrogen are observed for rivers Pineios of Peloponnese, followed by Alpheios, Pamissos, and Strymonas.
Concerning the variation of nutrient loads and discharge among the intercalibration river types (ICTs), we can see from boxplots in Figure 6 that measurements from sites that belong to the type of “Very large rivers” are notably higher than the other types. Conversely, there are not large variations among the other 5 types, although average loads for sites belonging to the R-M5 (temporary rivers) are lowest than all the other types. These observations imply two things. First, very large water bodies that have larger drainage basins than other types are more likely to receive highest loads of nutrients from diffuse and point sources. Conversely, temporary rivers that are characterized by intermittent flow dynamics and usually drain semi-arid areas with an extensive dry period [38] are less susceptible to nutrient pollution from surface runoff. Thus, water management of intermittent rivers should prioritize measures that mitigate water abstraction (e.g., irrigation) in order to ensure a flow regime that meets the environmental requirements.

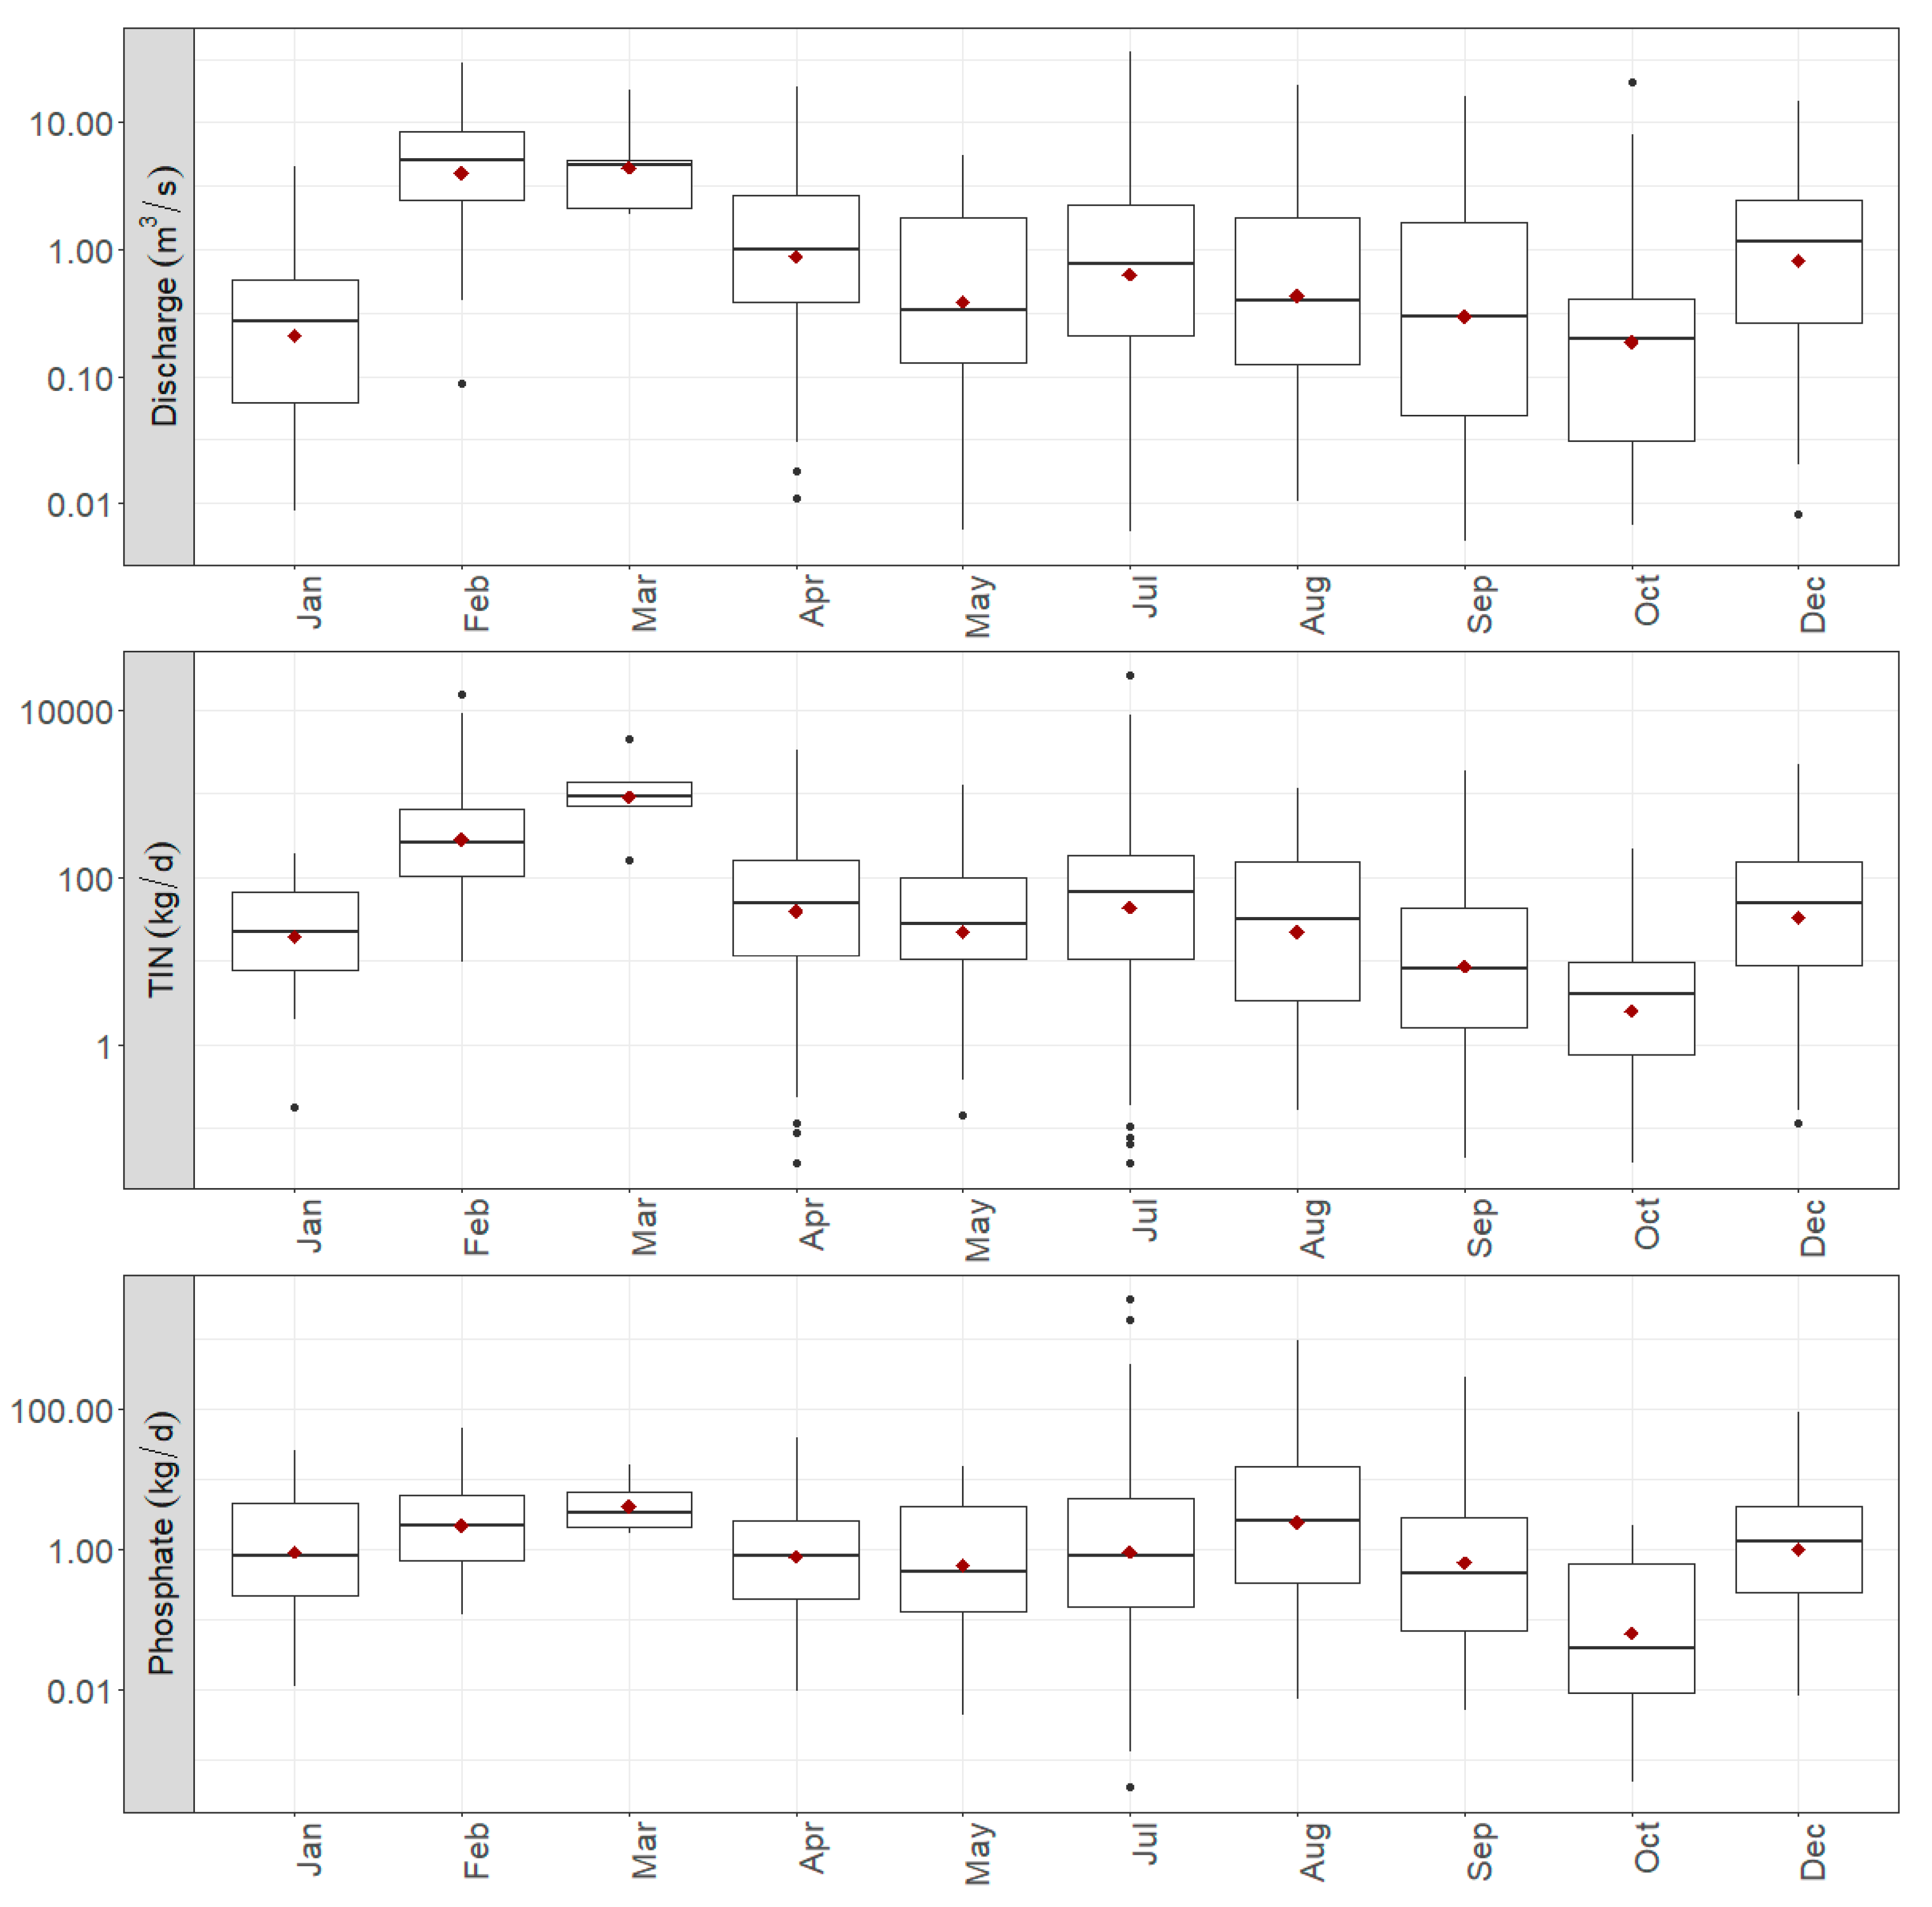
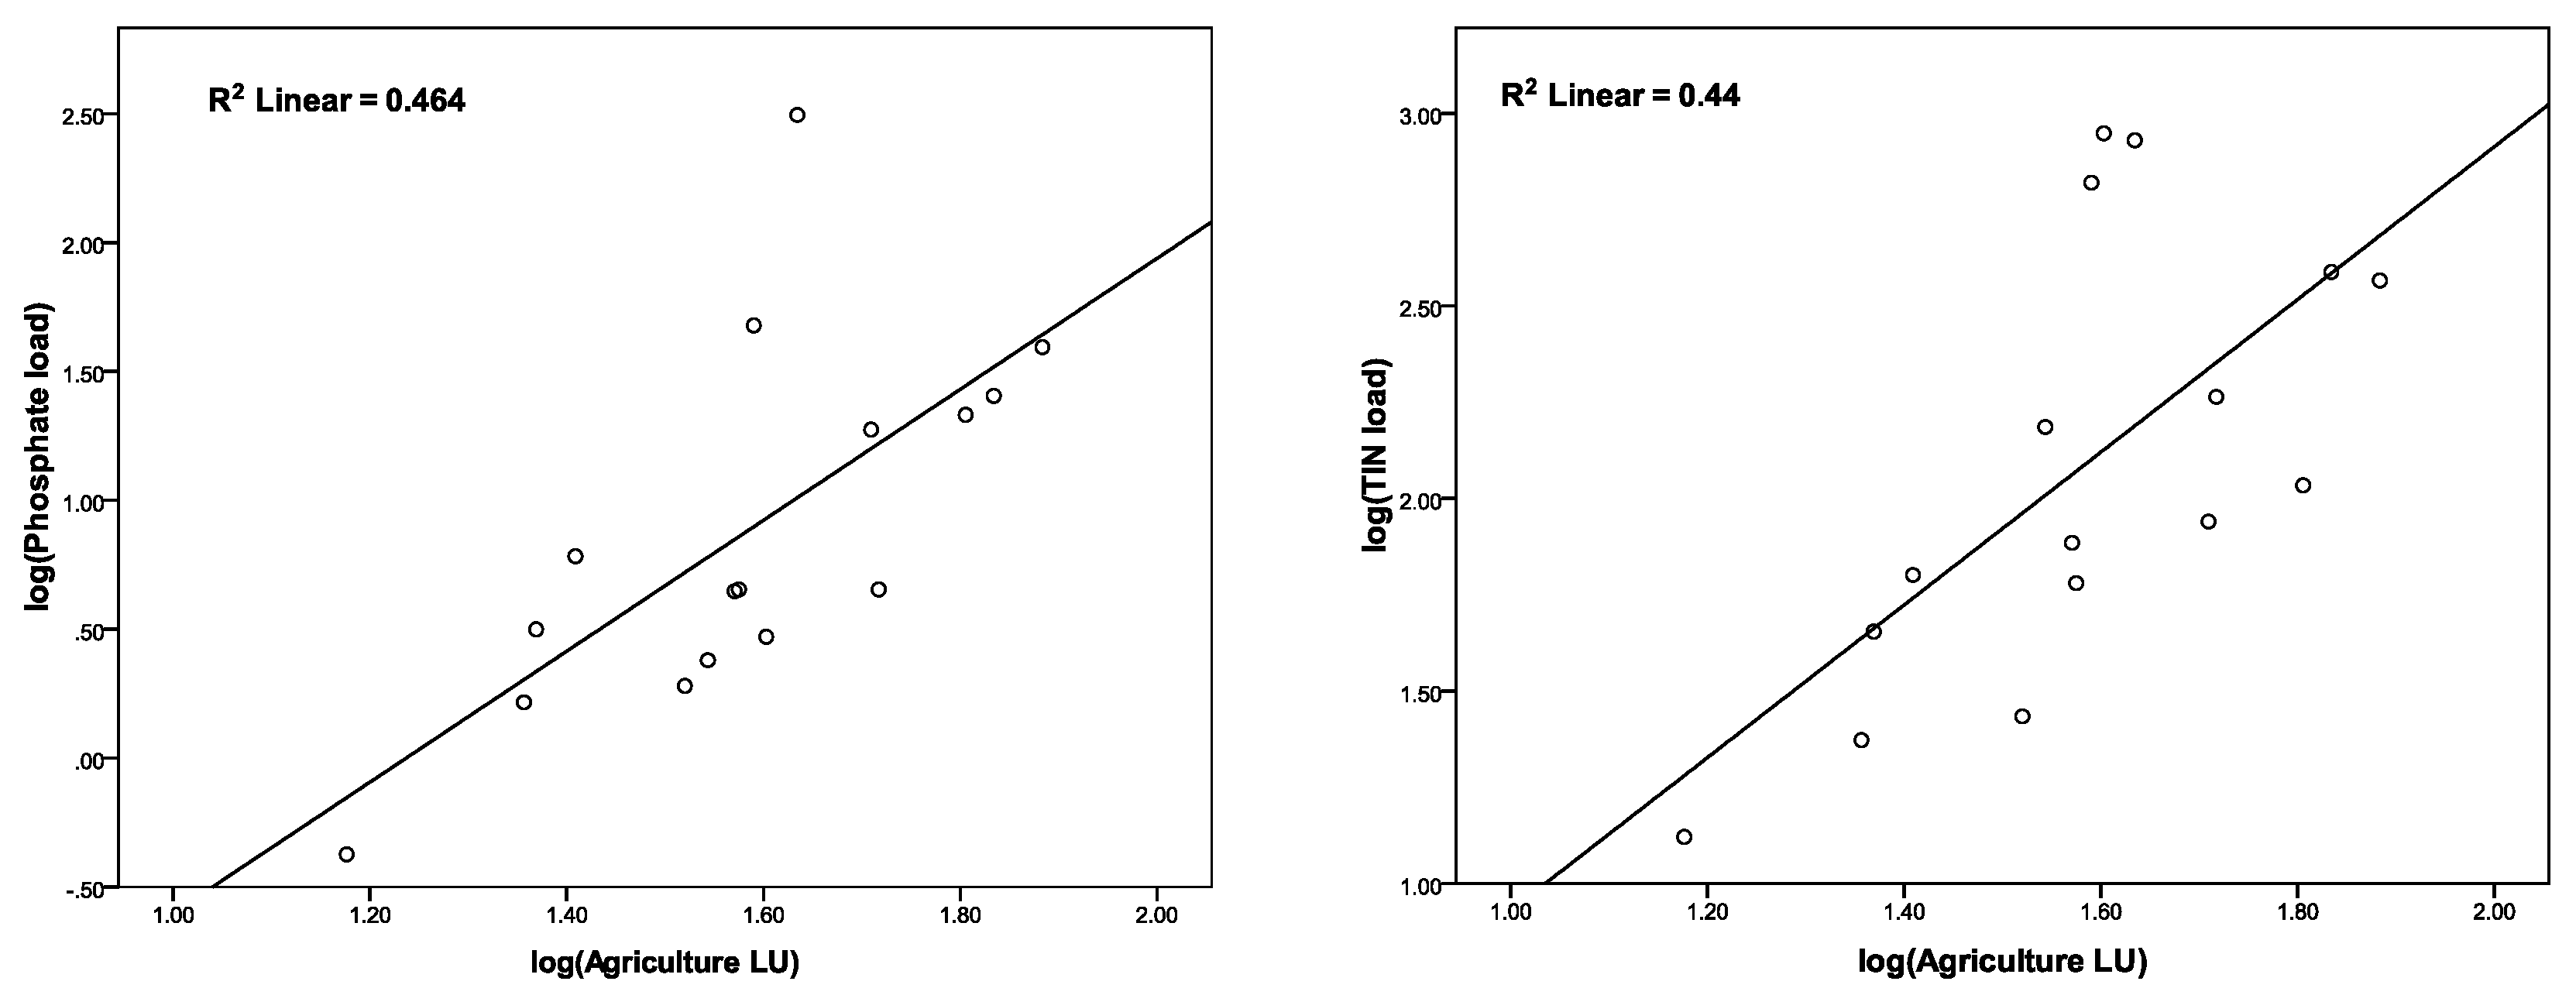
3.2. Hydrology and Land Uses as Main Factors Controlling Temporal and Spatial Variation of Nutrient Loads

Figure 7 show the monthly variation of phosphorus and nitrogen loads in all studied rivers. Total inorganic nitrogen loads are highest in March and then they gradually decline until October which is practically marked by the end of the dry period. Then by December and January we can note a rise in nitrogen loads probably attributed to soil leaching caused by the increased surface runoff [22]. Thus, we can distinguish a clear seasonal pattern in nitrogen loads following the hydrologic change caused by the transition from dry to wet period and vice versa. Nitrogen loads are higher in wet months than the dry months.
Concerning phosphorus, the medians showed a similar seasonal variation with highest values noted for March and August and the lowest in October. Yet this seasonal pattern is not as clear as the one for nitrogen loads as phosphorus loads showed very similar ranges each month with the exception for August and October. This could be because of the prevalence of urban sources of phosphorous loads in some catchments that release effluents throughout the year. In addition, urban wastes in Greece, and in other Mediterranean countries, that increase in summer as a result of the higher tourist traffic, could possible explain the higher phosphorus loads observed in August [39,40]. Overall, by examining the temporal variation of the nitrogen and phosphorus loads we can conclude that nitrogen follows a clear seasonal pattern as it depends on the soil leaching caused by precipitation. Conversely, phosphorus loads are influenced by other factors, apart from the hydrological seasonality, such as peaks in wastewater production that can be catchment specific (e.g., more wastes in large urban catchments and in catchments that attract more tourists).
We showed that inorganic nitrogen and phosphorus loads, and nitrogen in particular, follow a seasonal variation which may be related with the seasonality in hydrology. Indeed, when examining the monthly variation of average discharge we can note that river discharges follow the same temporal pattern with nitrogen loads where their values are higher in February and March and then decline until October (Figure 7). This is confirmed by the results of the correlation analysis where discharge correlated significantly with total inorganic nitrogen load (Table 4) but not with phosphate load.
Thus inorganic nitrogen load presented higher correlation with discharge than phosphorus as phosphorus loads were notably raised during summer and particularly August. This contrasting pattern with lower loads of nitrogen and higher loads of phosphorus in the dry than the wet period is noted by several other studies. There is a general consensus that higher loads of nitrogen during the wet season usually reflects the effect of autumn and winter runoff of nitrate from agricultural land [41,42,43]. Concerning phosphorus, higher concentrations during the summer than the winter is often attributed to a dilution effect of the overall catchment phosphorus load [41]. Thus phosphate load is affected more by in stream processes and base flow and less by surface runoff explaining the observed pattern [36]. Nevertheless, we should not exclude the possibility of increased urban waste production in summer caused by higher tourist activity. With regard to this, several authors have highlighted the impact of tourism on water quality as an emerging threat for freshwater systems and environment all over the world [44,45]. The average daily loads of N and P that enter the coastal area from 17 of the studied rivers (Strymonas river is excluded) reach 5500 and 370 kg/day, respectively, for the given period. This is a coarse estimate that is derived by averaging the load results from sampling sites, located close to the coastal area.
Simple linear regression analysis combined with mapping of nutrient loads and land uses in catchments showed that inorganic nitrogen loads are largely driven by the presence of agriculture (Figure 8). These results corroborate the findings of other studies from around the world [22,43,46,47] highlighting once again the role of agriculture as main source of diffuse pollution. However, local specific factors such as urban land uses in some catchments may also shape the spatial and temporal variability of phosphorus loads. For instance, from Figure 8 and Figure 9 we can distinguish outliers that represent catchments with high nitrogen and phosphorus loads but relatively lower share of agriculture. This implies that the high nutrient loads are driven not only by the agriculture but possibly by other sources, e.g., industrial point sources or other local factors. Furthermore, a large portion of natural land uses (e.g., forests and other semi-natural areas) in the catchment is more likely to indicate low nutrient loads as human activity and human-induced pressures are practically absent in these areas. For instance, the rivers Mornos and Arachthos were characterized by low nutrient loads and both have over 80% of forest and semi-natural areas in their catchment area. On the contrary, rivers with a high share of cultivations in their catchments, such as Axios, Gallikos, and Pineios exhibited higher nitrogen loads. This is important for catchment management as it shows that nitrogen mitigation strategies need to consider measures that aim to nutrient retention by improving natural land uses in the catchment [48]. Agri-environment schemes that are based solely on increasing the efficiency of fertilizers and thus reducing their application are likely insufficient to achieve the environmental targets [49]. On the other hand, the restoration of natural wetlands and riparian forests is proven to improve nutrient retention while at the same time has additional benefits (e.g., increase of biodiversity, recreation activities). Considering the multiple benefits of these solutions they can be considered more cost-effective than the current management schemes that usually deal with one aspect of the environmental problem [50,51]. However, given the rising need for sustaining global food security within the next few decades, it becomes obvious that integrating socio-economic aspects to environmental management is inevitable. Water managers and river scientists will have to set trade-off priorities between provision of agricultural services and improvement of water quality. With this regard, certain future socio-economic scenarios predict a decline in agricultural yield as a result of reduced water availability [11] which further complicates the decision making process for a sustainable management. Undoubtedly, sustainable management of agro-ecological systems requires transdisciplinary approaches that integrate natural and social sciences in developing novel management schemes [52].

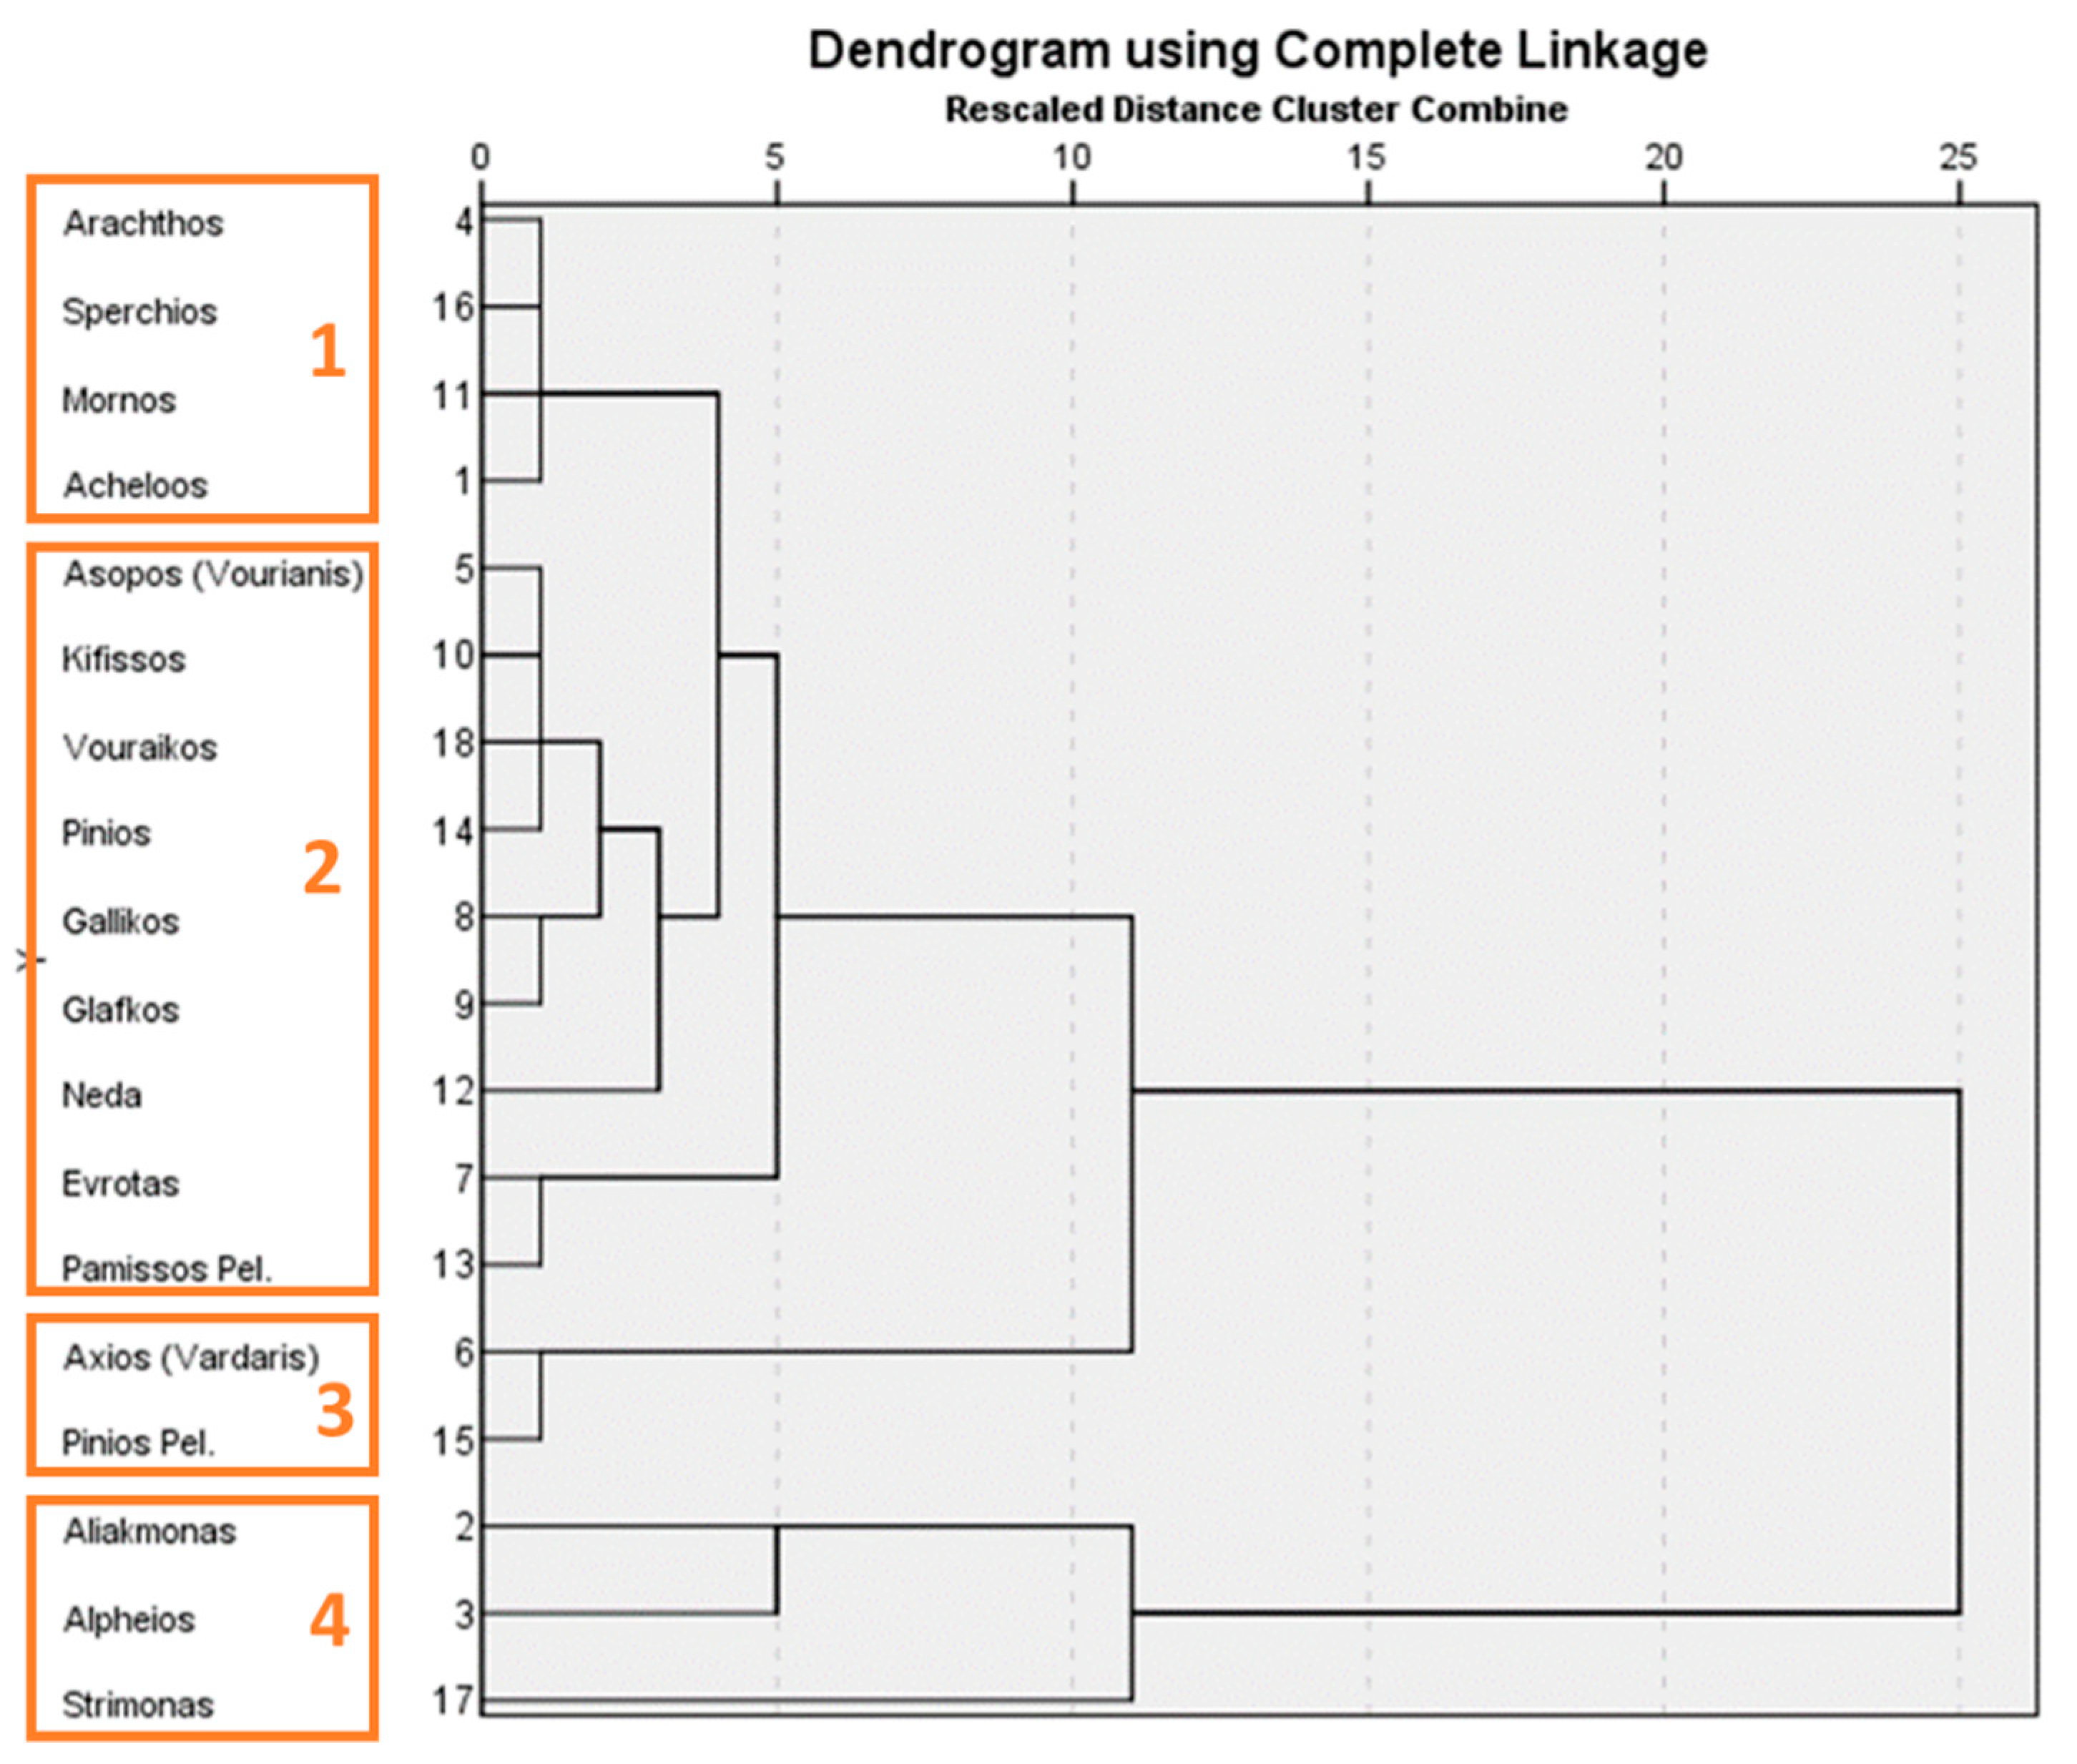
3.3. Cluster and Network Analysis

A cluster analysis and a network analysis were conducted to identify groups of river catchments based on common patterns of land uses and nutrient loads. The results revealed four groups (Figure 9) where Group 1 includes rivers (Arachthos, Spercheios, Mornos, and Acheloos) with the lowest average nutrient load rates but also the highest percentage of forest land in their catchment area (about 80%), Group 2 includes rivers (Asopos, Kifisos, Vouraikos, Pinios, Gallikos, Glafkos, Neda, Evrotas, and Pamisos) with medium to low nutrient loads but also a relatively small area of forest areas in their catchment area, in the 3rd Group 3 belong two rivers (Axios and Pineios Peloponnese) with catchment basins that are occupied mostly (70%–80%) of cultivated land and have fairly high nutrient loads. Catchments of Group 4 have the highest average values and fluctuations in nutrient loads and 40%–45% of their catchment areas consist of cultivated land (Aliakmonas, Alpheios, and Strymonas). Concerning the network analysis, the creation of networks resulted to the placement of rivers in classes according to the class in which each sampling belongs for each river. The results in general confirm the findings of the cluster analysis (Figure 10). The grouping is similar with the cluster analysis as rivers Alpheios and Strymonas were grouped together in both analyses as rivers with high nitrogen loads while rivers Arachthos, Mornos, and Acheloos were grouped together as rivers with low nitrogen loads. However, there are rivers such as Evrotas and Neda that although classified as of low Nitrogen loads they are close to the group of rivers with high N-loads because there were some sampling efforts in these rivers with higher than usual N-load values (Figure 10). Similarly, Spercheios and Kifissos rivers are classified as of very low Phosphorus loads but they are placed close to the group of rivers with high P-loads because there was a number of samplings in which high P-loads were detected in these rivers. On the contrary, Aracthos, Glafkos, and Neda belong to the same group (Very low P-loads) as the aforementioned rivers. Yet they are located far away from them and from other rivers, belonging to high load groups, since the vast majority of their samples indicated less than moderate P-load classes. This grouping offers valuable insight for policy makers for decision support regarding the development of catchment management strategies and prioritization of mitigation needs, at national scale.

4. Conclusions

Here, with this work, we used an extensive set of monitoring data collected by the National Monitoring Program for rivers in Greece, to calculate nitrogen and phosphorus loads and thus practically quantify the pressure of nutrient pollution in major catchments. We explored the relations between land uses and nutrient loads as exemplified by thematic maps and we classified rivers into groups that require similar attention in terms of management. We showed that seasonality and land uses within the catchment play a key role in the spatio-temporal variability of nutrients. In most cases N-loads were higher in wet periods and in river catchments with high proportion of agricultural land while P-loads did not present a district seasonality pattern and were rather correlated with urban waste than agriculture. Tourism seem to be also an important factor for P-loads, since in many rivers reaches a peak in August, the month with the highest touristic activity in the country. High flows are a mitigating factor for P-loads due to the dilution effect while for N-loads the contrary occurs. High surface runoff during the wet periods drain the Nitrogen rich agricultural catchments’ soils and transfer high N-loads in the rivers. The impacts from the relatively high N- and P- loads for the aquatic ecosystems both in the riverine and coastal environments can be significant, are well documented and require mitigation measures to be undertaken timely [20]. Analyzing nutrient loads instead of concentrations in rivers provides the important advantage of having a clear connection with the pollution pressures and identifying/prioritizing the potential problems. Nevertheless, combining information about both nutrient loads and concentration can offer a more complete picture about the pollution pressures and potential impacts on the environment. In this study, a large national database has been used to analyze the nutrient loads in rivers which offers a certain degree of credibility for the main findings but as further improvements, a larger number of autumn and winter sampling efforts could be suggested, to account for the spatiotemporal distribution of loads in a higher variety of hydrological conditions.
Therefore, since agriculture is the top driver of nutrient pollution in the country a series of measures could be proposed such as the promotion of organic and/or smart farming, as well as agri-environmental practices that would reduce the amount of water and fertilizers used in the sector. Moreover, restoration of coastal wetlands and riparian vegetation would be an effective measure to increase the resilience of the natural water bodies and reduce the pollution loads through natural attenuation mechanisms. A real-time monitoring system for the key, problematic sites and rivers to provide alerts when certain pollution thresholds are exceeded would be a valuable tool for the local and regional authorities in supervising and enforcing the environmental legislation.
Thus, it should be emphasized that as increased nutrient loads persist in European catchments, it becomes clear that management efforts need to be stepped up. Abatement of diffuse and source point pollution is prioritized among other mitigation measures but eutrophication and water quality degradation are still considered a major problem in many catchments.

Author Contributions

Conceptualization, E.D. (Elias Dimitriou) and A.C.; methodology, E.D. (Elias Dimitriou), S.P., E.D. (Emmanouil Dassenakis); software, K.S., A.C.; formal analysis, A.C., K.S.; investigation, A.C., K.S.; writing—original draft preparation, K.S., A.C., E.D. (Elias Dimitriou); writing—review and editing, K.S., A.C., E.D. (Elias Dimitriou), S.P., E.D. (Emmanouil Dassenakis); supervision, E.D. (Elias Dimitriou), E.D. (Emmanouil Dassenakis), S.P. All authors have read and agreed to the published version of the manuscript.

Funding

The collection of data used in this research has been funded by the National Structural Funds 2007–2013, Operational Program for the Environment and Sustainable Development, Ministry of the Environment, Energy and Climate Change, National Monitoring of the Surface Waters according to the provisions of the Water Framework Directive.

Conflicts of Interest

The authors declare no conflict of interest.

References

  1. Seitzinger, S.P.; Harrison, J.A.; Dumont, E.; Beusen, A.H.; Bouwman, A.F. Sources and delivery of carbon, nitrogen, and phosphorus to the coastal zone: An overview of Global Nutrient Export from Watersheds (NEWS) models and their application. Glob. Biogeochem. Cycles 2005, 19. [Google Scholar] [CrossRef]
  2. Newbold, J.D.; Elwood, J.W.; O’Neill, R.V.; Winkle, W.V. Measuring nutrient spiralling in streams. Can. J. Aquat. Fish. Sci. 1981, 38, 860–863. [Google Scholar] [CrossRef]
  3. Amoros, C.; Pelts, G.E. Hydrosystemes Fluviaux; Masson: Paris, French, 1993; p. 300. [Google Scholar]
  4. Carpenter, S.R.; Caraco, N.F.; Correll, D.L.; Howarth, R.W.; Sharpley, A.N.; Smith, V.H. Nonpoint pollution of surface waters with phosphorus and nitrogen. Ecol. Appl. 1998, 8, 559–568. [Google Scholar] [CrossRef]
  5. Correll, D.L. The role of phosphorus in the eutrophication of receiving waters: A review. J. Environ. Qual. 1998, 27, 261–266. [Google Scholar] [CrossRef] [Green Version]
  6. Smith, V.H.; Tilman, G.D.; Nekola, J.C. Eutrophication: Impacts of excess nutrient inputs on freshwater, marine, and terrestrial ecosystems. Environ. Pollut. 1999, 100, 179–196. [Google Scholar] [CrossRef]
  7. Ludwig, W.; Dumont, E.; Meybeck, M.; Heussner, S. River discharges of water and nutrients to the Mediterranean and Black Sea: Major drivers for ecosystem changes during past and future decades? Prog. Oceanogr. 2009, 80, 199–217. [Google Scholar] [CrossRef]
  8. Ludwig, W.; Bouwman, A.F.; Dumont, E.; Lespinas, F. Water and nutrient fluxes from major Mediterranean and Black Sea rivers: Past and future trends and their implications for the basin-scale budgets. Glob. Biogeochem. Cycles 2010, 24. [Google Scholar] [CrossRef]
  9. Smith, V.H. Eutrophication of freshwater and marine ecosystems: A global problem. Environ. Sci. Pollut. Res. Int. 2003, 10, 126–139. [Google Scholar] [CrossRef]
  10. Smith, V.H. Responses of estuarine and coastal marine phytoplankton to nitrogen and phosphorus enrichment. Limnol. Oceanogr. 2006, 51, 377–384. [Google Scholar] [CrossRef] [Green Version]
  11. Stefanidis, K.; Panagopoulos, Y.; Mimikou, M. Response of a multi-stressed Mediterranean river to future climate and socio-economic scenarios. Sci. Total Environ. 2018, 627, 756–769. [Google Scholar] [CrossRef]
  12. Greene, S.; Taylor, D.; McElarney, Y.R.; Foy, R.H.; Jordan, P. An evaluation of catchment-scale phosphorus mitigation using load apportionment modelling. Sci. Total Environ. 2011, 409, 2211–2221. [Google Scholar] [CrossRef] [PubMed]
  13. Grizzetti, B.; Bouraoui, F.; Aloe, A. Changes of nitrogen and phosphorus loads to European seas. Glob. Chang. Biol. 2012, 18, 769–782. [Google Scholar] [CrossRef]
  14. Campbell, J.M.; Jordan, P.; Arnscheidt, J. Using high-resolution phosphorus data to investigate mitigation measures in headwater river catchments. Hydrol. Earth Syst. Sci. 2015, 19, 453. [Google Scholar] [CrossRef] [Green Version]
  15. Longphuirt, S.N.; O’Boyle, S.; Stengel, D.B. Environmental response of an Irish estuary to changing land management practices. Sci. Total Environ. 2015, 521, 388–399. [Google Scholar] [CrossRef] [Green Version]
  16. Solheim, A.L.; Austnes, K.; Kristensen, P.; Peterlin, M.; Kodeš, V.; Collins, R.; Semerádová, S.; Künitzer, A.; Filippi, R.; Prchalová, H.; et al. Ecological and Chemical Status and Pressures in European Waters, Thematic Assessment for EEA Water 2012 Report; ETC/ICM: Prague, Czech Republic, 2012. [Google Scholar]
  17. Spänhoff, B.; Dimmer, R.; Friese, H.; Harnapp, S.; Herbst, F.; Jenemann, K.; Mickel, A.; Rohde, S.; Schönherr, M.; Ziegler, K.; et al. Ecological status of rivers and streams in Saxony (Germany) according to the water framework directive and prospects of improvement. Water 2012, 4, 887–904. [Google Scholar] [CrossRef]
  18. Grizzetti, B.; Pistocchi, A.; Liquete, C.; Udias, A.; Bouraoui, F.; van de Bund, W. Erratum: Human pressures and ecological status of European rivers. Sci. Rep. 2017, 7, 6941. [Google Scholar] [CrossRef] [Green Version]
  19. Cosgrove, W.J.; Loucks, D.P. Water management: Current and future challenges and research directions. Water Resour. Res. 2015, 51, 4823–4839. [Google Scholar] [CrossRef] [Green Version]
  20. Stefanidis, K.; Papaioannou, G.; Markogianni, V.; Dimitriou, E. Water Quality and Hydromorphological Variability in Greek Rivers: A Nationwide Assessment with Implications for Management. Water 2019, 11, 1680. [Google Scholar] [CrossRef] [Green Version]
  21. Skoulikidis, N.T.; Amaxidis, Y.; Bertahas, I.; Laschou, S.; Gritzalis, K. Analysis of factors driving stream water composition and synthesis of management tools—A case study on small/medium Greek catchments. Sci. Total Environ. 2006, 362, 205–241. [Google Scholar] [CrossRef]
  22. Panagopoulos, Y.; Makropoulos, C.; Mimikou, M. Diffuse Surface Water Pollution: Driving Factors for Different Geoclimatic Regions. Water Resour. Manag. 2011, 25, 3635–3660. [Google Scholar] [CrossRef]
  23. Andreadakis, E.; Fountoulis, I.; Mariolakos, I.; Kapourani, E. Hydrometeorological natural disasters and water resources management in Evrotas river basin (Peloponnesus, Greece). In Proceedings of the International Conference ‘AQUA 2008’ on Water Science and Technology, Athens, Athens, 16–19 October 2008. [Google Scholar]
  24. Vardakas, L.; Skoulikidis, N.; Karaouzas, I.; Gritzalis, K.; Tachos, V.; Zogaris, S.; Kommatas, D.; Economou, A. Assessing the ecological status of the “artificially intermittent” Evrotas River (Greece) according to the Water Framework Directive 2000/60/EC. In Proceedings of the BALWOIS 2010, Ohrid, North Macedonia, 25–29 May 2010. [Google Scholar]
  25. Mimikou, M.A.; Baltas, E.; Varanou, E.; Pantazis, K. Regional impacts of climate change on water resources quantity and quality indicators. J. Hydrol. 2000, 234, 95–109. [Google Scholar] [CrossRef]
  26. Varanou, E.; Gkouvatsou, E.; Baltas, E.; Mimikou, M. Quantity and quality integrated catchment modeling under climate change with use of soil and water assessment tool model. J. Hydrol. Eng. 2002, 7, 228–244. [Google Scholar] [CrossRef]
  27. Karaouzas, I.; Dimitriou, E.; Skoulikidis, N.; Gritzalis, K.; Colombari, E. Linking hydrogeological and ecological tools for an integrated river catchment assessment. Environ. Model. Assess. 2009, 14, 677. [Google Scholar] [CrossRef]
  28. Skoulikidis, N. The state and origin of river water composition in Greece. In The Rivers of Greece. Evolution, Current Status and Perspectives; Skoulikidis, N., Dimitriou, E., Karaouzas, I., Eds.; Springer: Berlin/Heidelberg, Germany, 2016; pp. 97–127. ISBN 978-3-662-55369-5. [Google Scholar]
  29. Poulos, S.E. An insight to the fluvial characteristics of the Mediterranean and Black Sea watersheds. In Proceedings of the 9th International Hydrogeological Congress of Greece, 4th MEM Workshop on the Hydrology of Fissured Rocks, Kalavrita, Greece, 5–8 October 2011; Lambrakis, N., Stournaras, G., Katsanou, K., Eds.; Advances in the Research of Aquatic Environment, Environmental Earth Sciences. Springer: Berlin/Heidelberg, Germany, 2011; Volume 1, pp. 191–198. [Google Scholar]
  30. Rantz, S.E. Measurement and computation of streamflow: Vol. 1, Measurement of stage and discharge. U.S. Geol. Surv. Water-Supply 1982, 2175, 284. [Google Scholar]
  31. Lazaridou, M.; Ntislidou, C.; Karaouzas, I.; Skoulikidis, N. Harmonisation of a new assessment method for estimating the ecological quality status of Greek running waters. Ecol. Ind. 2017, 84, 683–694. [Google Scholar] [CrossRef]
  32. R Core Team. R: A Language and Environment for Statistical Computing. Available online: https://www.r-project.org/ (accessed on 1 March 2020).
  33. Bastian, M.; Heymann, S. Gephi: An open source software for exploring and manipulating networks. In Proceedings of the Third International AAAI Conference on Weblogs and Social Media, San Jose, CA, USA, 17–20 May 2009. [Google Scholar]
  34. Mockler, E.M.; Deakin, J.; Archbold, M.; Gill, L.; Daly, D.; Bruen, M. Sources of nitrogen and phosphorus emissions to Irish rivers and coastal waters: Estimates from a nutrient load apportionment framework. Sci. Total Environ. 2017, 601–602, 326–339. [Google Scholar] [CrossRef]
  35. Bøgestrand, J.; Kristensen, P.; Kronvang, B. Source Apportionment of Nitrogen and Phosphorus Inputs Into the Aquatic Environment; European Environment Agency: Copenhagen, Denmark, 2005; p. 48. ISBN 9291677779. [Google Scholar]
  36. Bowes, M.J.; Smith, J.T.; Neal, C.; Leach, D.V.; Scarlett, P.M.; Wickham, H.D.; Harman, S.A.; Armstrong, L.K.; Davy-Bowker, J.; Haft, M.; et al. Changes in water quality of the River Frome (UK) from 1965 to 2009: Is phosphorus mitigation finally working? Sci. Total Environ. 2011, 409, 3418–3430. [Google Scholar] [CrossRef]
  37. Giordano, M.; Drieschova, A.; Duncan, J.; Sayama, Y.; De Stefano, L.; Wolf, A. A review of the evolution and state of transboundary freshwater treaties. Int. Environ. Agreem-P 2014, 14, 245–264. [Google Scholar] [CrossRef]
  38. Tzoraki, O.; Nikolaidis, N.P.; Trancoso, A.R.; Braunschweig, F.; Neves, R. A reach-scale biogeochemical model for temporary rivers. Hydrol. Process. 2009, 23, 272–283. [Google Scholar] [CrossRef]
  39. European Environment Agency. State and Pressures of the Marine and Coastal Mediterranean Environment; European Environment Agency: Copenhagen, Denmark, 1999; Available online: http://europa.eu.int (accessed on 1 March 2020).
  40. European Environment Agency. Priority Issues in the Mediterranean Environment; European Environment Agency: Copenhagen, Denmark, 2006; Available online: https://www.eea.europa.eu/publications/eea_report_2006_4 (accessed on 1 March 2020).
  41. Arazuzo, M.; Valladolid, M.; Mariznez-Bastida, J.J. Spatio-temporal dynamics of ni- trogen in river-alluvial aquifer systems affected by diffuse pollution from agricultural sources: Implications for the implementation of the Nitrates Directive. J. Hydrol. 2011, 411, 155–168. [Google Scholar] [CrossRef] [Green Version]
  42. Miller, C.; Magdalina, A.; Willows, R.I.; Bowman, A.W.; Scott, E.M.; Lee, D.; Burgess, S.; Pope, L.; Pannullo, F.; Haggarty, R. Spatiotemporal statistical modelling of long-term change in river nutrient concentrations in England & Wales. Sci. Total Environ. 2014, 466–467, 914–923. [Google Scholar]
  43. Stefanidis, K.; Panagopoulos, Y.; Mimikou, M. Impact assessment of agricultural driven stressors on benthic macroinvertebrates using simulated data. Sci. Total Environ. 2016, 540, 32–42. [Google Scholar] [CrossRef] [PubMed]
  44. Ning, B.; He, Y. Tourism development and water pollution: Case study in Lijiang ancient town. Zhongguo Renkou Ziyuan Yu Huan Jing/ China Popul. Resour. Environ. 2007, 17, 123–127. [Google Scholar] [CrossRef]
  45. Gao, J.; Zhang, L. Exploring the dynamic linkages between tourism growth and environmental pollution: New evidence from the Mediterranean countries. Curr. Issues Tour. 2019. [Google Scholar] [CrossRef]
  46. Donohue, I.; McGarrigle, M.L.; Mills, P. Linking catchment characteristics and water chemistry with the ecological status of Irish rivers. Water Res. 2006, 40, 91–98. [Google Scholar] [CrossRef]
  47. Roberts, W.M.; Fealy, R.M.; Doody, D.G.; Jordan, P.; Daly, K. Estimating the effects of land use at different scales on high ecological status in Irish rivers. Sci. Total Environ. 2016, 572, 618–625. [Google Scholar] [CrossRef]
  48. Bouraoui, F.; Grizzetti, B. Modelling mitigation options to reduce diffuse nitrogen water pollution from agriculture. Sci. Total Environ. 2014, 468–469, 1267–1277. [Google Scholar] [CrossRef]
  49. Trepel, M. Towards ecohydrological nutrient management for river basin districts. Ecohydrol. Hydrobiol. 2016, 16, 92–98. [Google Scholar] [CrossRef]
  50. Trepel, M. Assessing the cost-effectiveness of the water purification function of wetlands for environmental planning. Ecol. Complex. 2010, 7, 320–326. [Google Scholar] [CrossRef]
  51. Weigelhofer, G.; Fuchsberger, J.; Teufl, B.; Welti, N.; Hein, T. Effects of Riparian Forest Buffers on In-Stream Nutrient Retention in Agricultural Catchments. J. Environ. Qual. 2012, 41, 373–379. [Google Scholar] [CrossRef] [Green Version]
  52. Ollivier, G.; Magda, D.; Mazé, A.; Plumecocq, G.; Lamine, C. Agroecological transitions: What can sustainability transition frameworks teach us? an ontological and empirical analysis. Ecol. Soc. 2018, 23. [Google Scholar] [CrossRef]
Figure 1. Location of monitoring sites per river basin.
Water 12 01531 g001
Figure 2. Boxplots of discharge (log. scaled), total inorganic nitrogen load (log. scaled) and inorganic phosphorus load (log. scaled) per river. The red dot indicates the mean value.
Water 12 01531 g002
Figure 3. Maps are showing ecological classification of water bodies and classes of phosphorus loads (left) and total inorganic loads (right) in catchments of Central Greece.
Water 12 01531 g003
Figure 4. Maps are showing ecological classification of water bodies and classes of phosphorus loads (left) and total inorganic loads (right) in catchments of Northern Greece.
Water 12 01531 g004
Figure 5. Maps are showing ecological classification of water bodies and classes of phosphorus loads (left) and total inorganic loads (right) in catchments of Southern Greece.
Water 12 01531 g005
Figure 6. Boxplots of discharge (log. scaled), total inorganic nitrogen load (log. scaled) and inorganic phosphorus load (log. scaled) per river ICT. The red dot indicates the mean value. R-M1 refer to “small Mediterranean streams”, R-M2 to “medium Mediterranean streams”, R-M3 to “large Mediterranean streams, R-M4 to “Mediterranean mountain streams”, R-M5 to “temporary streams” and Very large to “Large rivers” according to the typology for the Mediterranean Intercalibration Group.
Water 12 01531 g006
Figure 7. Boxplots of discharge (log. scaled) total inorganic nitrogen load (log. scaled) and inorganic phosphorus load (log. scaled) showing the monthly variation. The red dot indicates the mean value.
Water 12 01531 g007
Figure 8. Scatter plots showing the linear relationship between phosphate loads and agriculture land use in the catchment (left plot) and total inorganic nitrogen load with agriculture in the catchment (right plot).
Water 12 01531 g008
Figure 9. Groups of rivers derived by the cluster analysis based on the average nutrient loads that they receive.
Water 12 01531 g009
Figure 10. Network analysis of the examined Greek rivers based on the classification according to their total inorganic nitrogen loads (left) and inorganic phosphorus loads (right).
Water 12 01531 g010
Table 1. List of studied rivers per River Basin District and the number of measurements obtained from the National River Monitoring Program, as well as their catchment area and annual discharge [20].
RiverRiver Basin District (RBD)No of RecordsCatchment Area (km2)
01AlfeiosGR01 (Western Peloponnese)1313610
02Neda16278
03Pamisos57781
04GlafkosGR02 (Northern Peloponnese)19165
05Pineios Pelop.22913
06Vouraikos12233
07EvrotasGR03 (Eastern Peloponnese)152410
08AcheloosGR04 (West. Sterea Ellada)795688
09Mornos181010
10ArachthosGR05 (Epirus)232209
11KifissosGR06 (Attica)25430
12AsoposGR07 (East. Sterea Ellada)121100
13Spercheios211662
14PineiosGR08 (Thessaly)9410,845
15AliakmonasGR09 (Western Macedonia)499455
16AxiosGR10 (Central Macedonia)1324,938
17Gallikos12930
18StrymonasGR11 (Eastern Macedonia)1816,816
TOTAL 636
Table 2. Quality classes and thresholds for total inorganic phosphorus and nitrogen loads.
ClassTotal Inorganic Phosphorus Load
(kg/day)
Total Inorganic Nitrogen Load
(kg/day)
High>4.25>171
Moderate0.95–4.2546–171
Low0.2–0.958–46
Very low<0.2<8
Table 3. Estimated average rates of loads of phosphate and total inorganic nitrogen that the rivers receive. Average discharge measured at site is also given.
CatchmentΝSitesP-PO4 Load (kg/day)TIN Load (kg/day)Discharge (m3/s)
Aliakmonas491747.71660.631.98
Alfeios131232.95887.493.31
Axios13539.28368.172.63
Arachthos2391.6523.582.53
Asopos1234.5160.290.22
Acheloos79183.1645.072.49
Vouraikos1244.4476.701.11
Gallikos12621.45108.100.35
Glafkos1930.5489.321.34
Evrotas1592.40153.292.10
Kifissos2556.0763.270.17
Mornos1840.4213.211.29
Neda1631.20176.713.12
Pamisos5794.51183.593.44
Pinios943618.8187.101.37
Pinios Pel.22525.43387.244.21
Sperchios21111.9027.181.89
Strymonas1812312.56851.056.37
Table 4. Spearman’s rho correlation coefficients between nitrate, ammonium, total inorganic nitrogen, phosphate loads and shares of main land uses (LU) in the catchment. * indicate significant correlations with p ≤ 0.05 and ** with p ≤ 0.001.
Artificial LU (%)Agricultural LU (%)Forest and Semi-Natural LU (%)N-NO3 (kg/day)N-NH4 (kg/day)P-PO4 (kg/day)TIN (kg/day)
Agricultural LU (%)0.3821
Forest and semi-natural LU (%)−0.579 *−0.909 **1
N-NO3 (kg/day)0.1710.744 **−0.629 **1
N-NH4 (kg/day)−0.1150.535 *−0.4000.797 **1
P-PO4 (kg/day)0.559 *0.753 **−0.821 **0.2820.538 *1
TIN (kg/day)0.1620.741 **−0.624 **0.997 **0.803 **0.685 **1
Discharge (m3/s)−0.4590.379−0.1820.579 *0.621 *0.2180.571 *

