Monitoring Approaches for Faecal Indicator Bacteria in Water: Visioning a Remote Real-Time Sensor for E. coli and Enterococci


Abstract
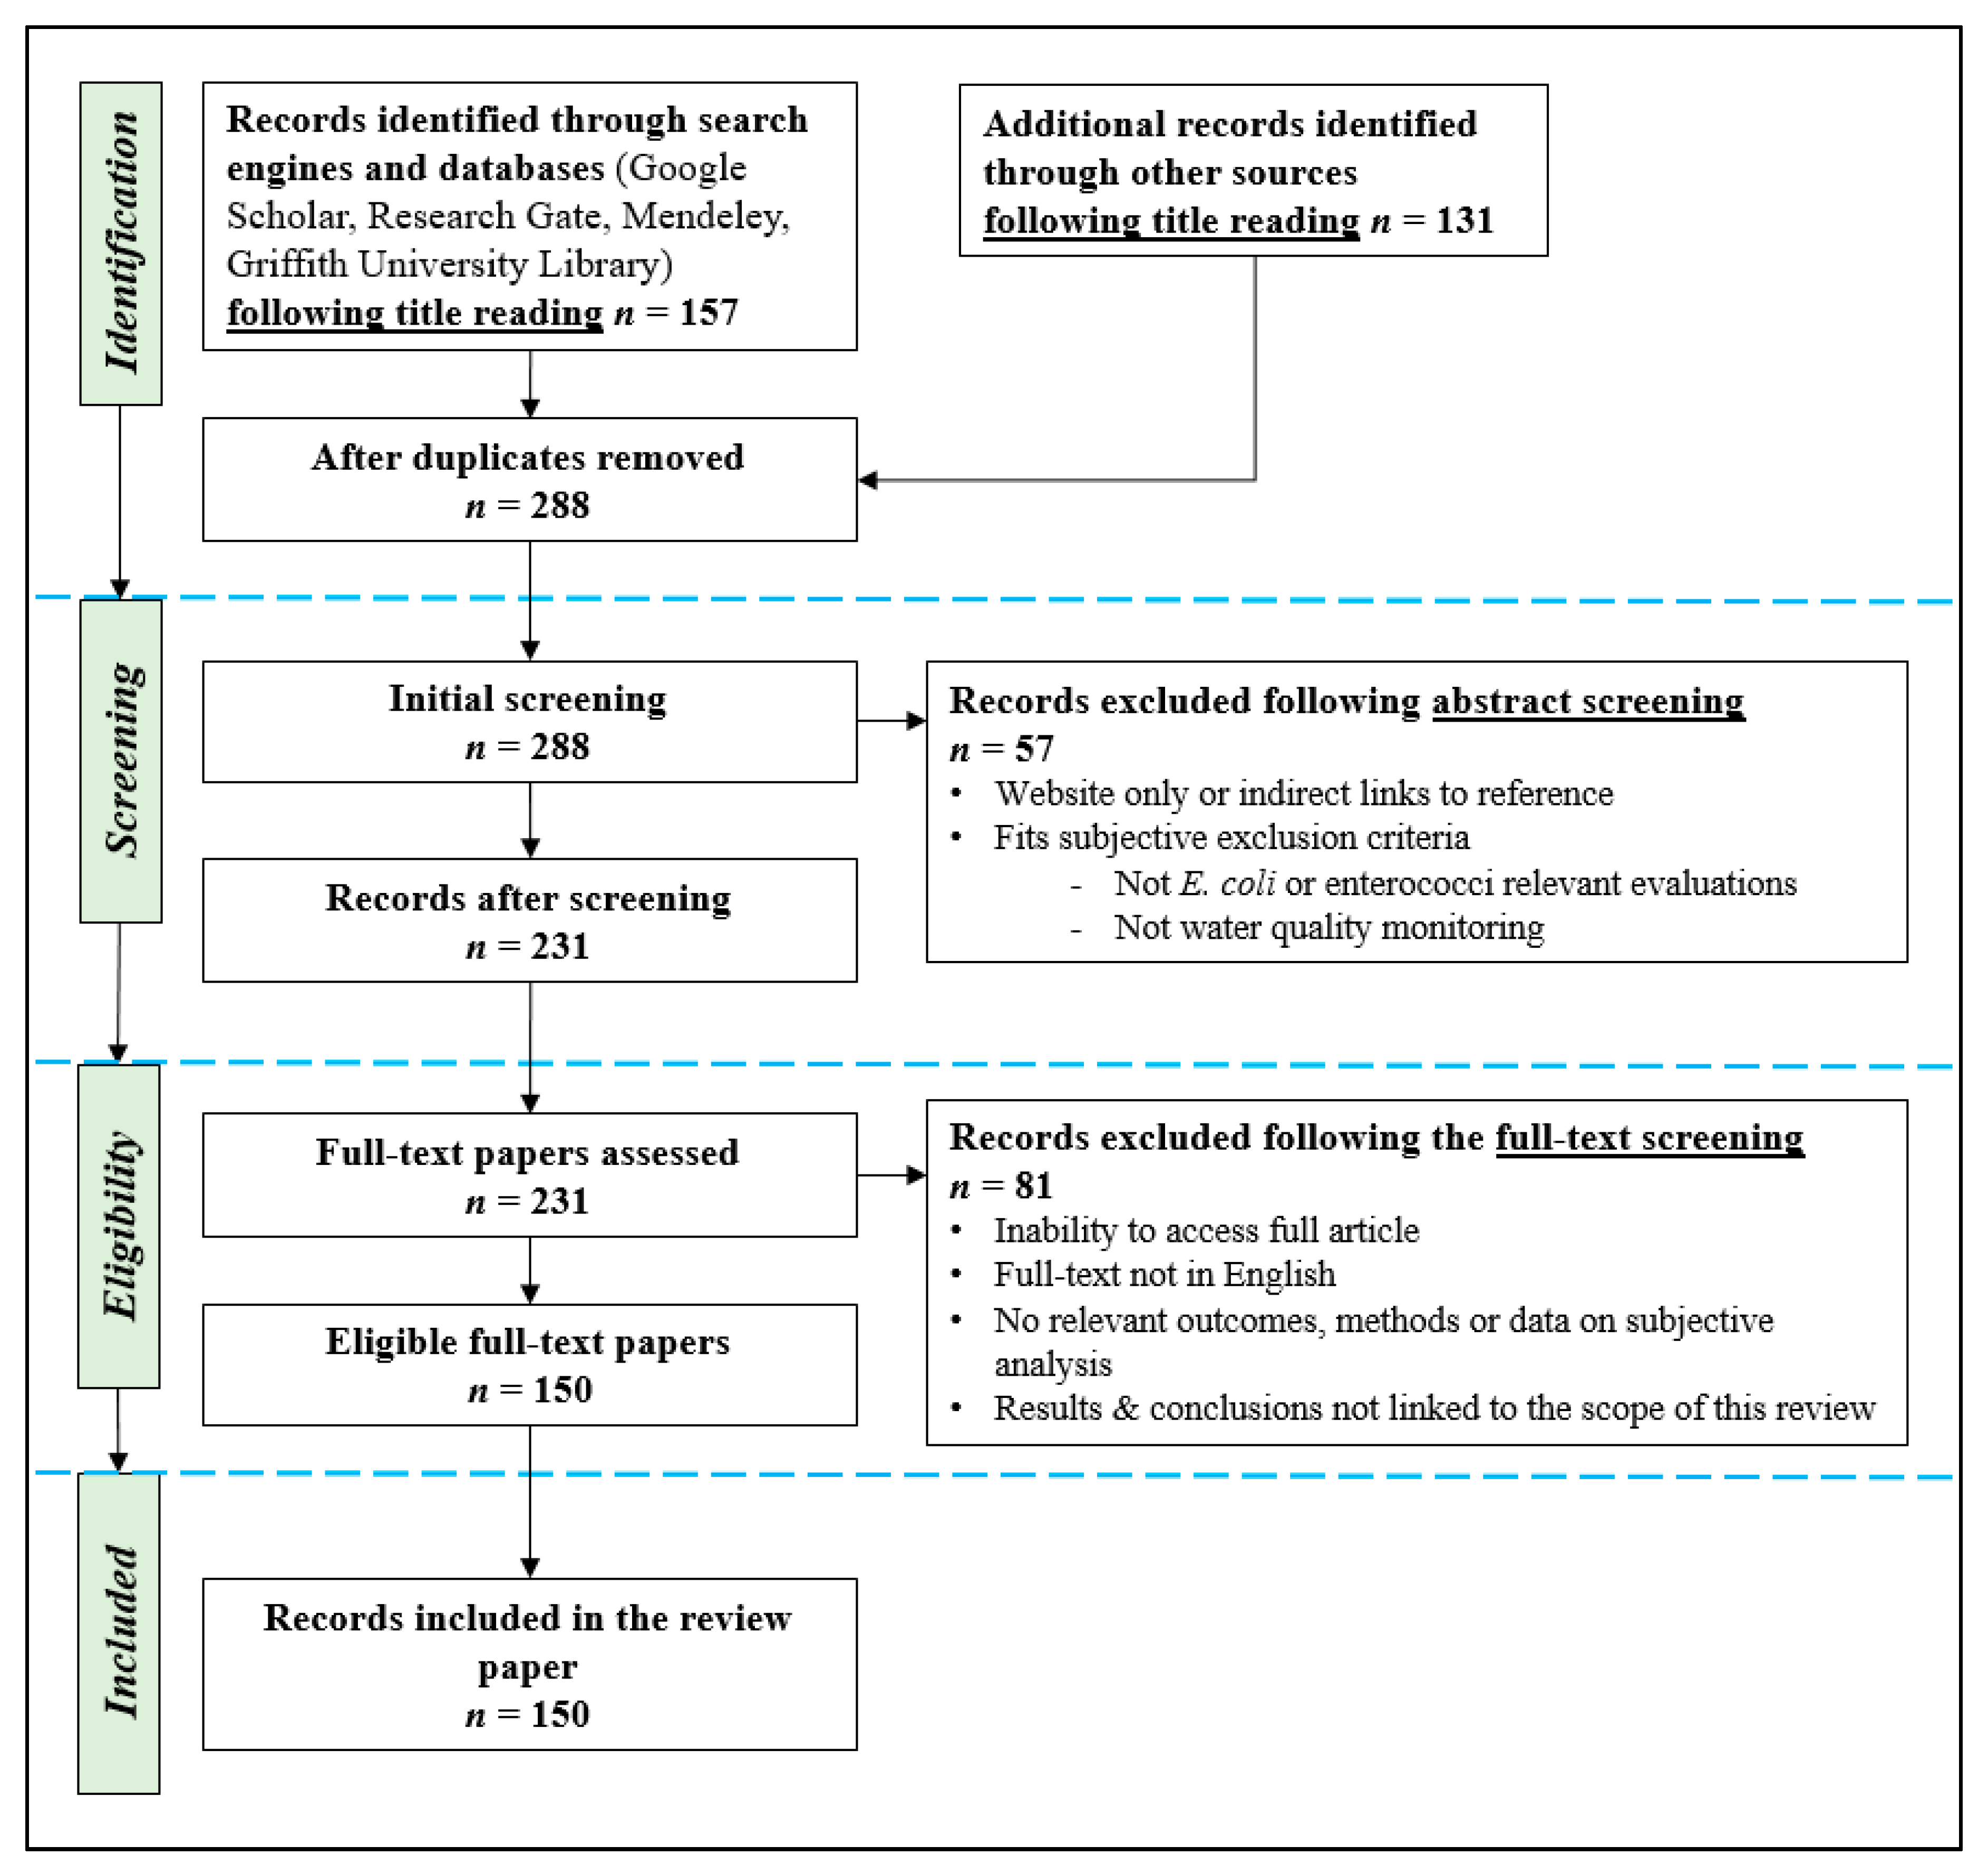
:1. Introduction
2. Research Methods
3. Methodologies and Tools for Monitoring E. coli and Enterococci
3.1. Preparation-Type Methods
3.1.1. Membrane-Filtration Assays
3.1.2. Culture-Based Assays
3.1.3. Non-Real-Time and Real-Time Polymerase Chain Reaction Assays
3.1.4. DNA-Probe Assays
3.2. Measurement-Type Methods
3.2.1. Absorption Spectroscopy Measurements
3.2.2. Fluorescence Measurements
Fluorescence Spectroscopy
Flow Cytometry
3.2.3. Biosensors
Electrochemical Biosensors
Paper-Based Biosensors
Lateral Flow Assay Biosensors
Micro-Raman Spectroscopy Biosensors
3.2.4. Adenosine Triphosphate Bioluminescence Assays and Biosensors
3.2.5. Enzyme Activity Assays and Biosensors
3.2.6. Automated In Situ Biosensors Using a Laboratory Fluorescence Measurement
3.2.7. Portable Field Kit Biosensors Using the Laboratory Fluorescence Measurement
3.3. Reagentless and Portable Fluorescence Spectroscopy Measurements
3.3.1. Sensitivity
3.3.2. Specificity
Spectral Signature of E. coli and Enterococci
Catchment Specific Factors
Engine Oil or Diesel
Tryptophan-Like Fluorescence
3.3.3. Interferences
The Inner Filtering Effect
Turbidity
Temperature
pH
Salinity
4. Discussion
4.1. Identification of Gap in E. coli and Enterococci Monitoring
4.2. A Research Framework towards Reliable and Remote Fluorescence-Based Monitoring of E. coli and Enterococci
4.3. Characterisation of a Hybrid Sensor
- Is Sensor #1 triggered? (Yes/No/Check Again);
- If Yes, then the detection is verified by Sensor #2;
- If No, then no process occurs, and Sensor #1 continues its monitoring processes.
4.4. Fluorescence Sensor (Sensor #1)
4.4.1. Correction Methods for Specificity
Robust Identification of E. coli and/or Enterococci Spectral Signatures
Distinguish/Remove Overlapping Fluorescence Spectra
4.4.2. Correction Methods for Interferences
Correction Methods for the Inner Filtering Effect
Correction Methods for Turbidity Interference
Correction Methods for Temperature Interference
Correction Methods for pH Interference
Correction Methods for Salinity Interference
4.5. Verification Sensor (Sensor #2)
- The smartphone detection of E. coli from field water samples on paper microfluidics was presented by Park and Yoon [91]; their three-channel paper chip provides low- and high-concentration detection of field samples. E. coli antigens promote travel through the paper fibres (aided by capillary action), while other items in the water (dust, soil, and algae particles) are filtered out. The total assay time is about 90 s, and the sample size is 7 µL; the smartphone camera (requiring a gyro-sensor software application to be installed) detects E. coli from an angle onto the paper chip, which contains preloaded antibody-conjugated beads (the shelf-life of the beads is 8 weeks at room temperature). The paper chip is not described as reusable [91]. (1) This method is not automated, and because it uses a smartphone camera, including a battery, in the water, it is not convenient and probably not possible to be used in situ unless adjustments are made, including another method of chip visualisation. However, the processes are not complicated (sample placement and phone app detection). (2) The detection surface chip is miniaturised. (3) This method is accurate, but it was not described as reusable; therefore, it would require several individual chips to be preloaded in the device, with automated processing.
- Fast and accurate detection of E. coli from a water droplet by electric field effects and micro-Raman spectroscopy was presented by Liao et al. [96]; their surface-based detection method uses alternating-current electrokinetic effects to capture E. coli (K12) species (at concentrations as low as 102 bacteria/mL from 50 µL samples). This method is label free without the need for signal amplification, and results are obtained within several minutes. (1) This method is not automated, but its processes are not complicated (sample placement and online detection), and the authors worked on a flow-through microfluidic system for online sample monitoring. (2) It is miniaturised. (3) It is efficient and accurate, but testing currently requires collection personnel and the authors did not identify whether it was reusable. The authors identified that it could be improved with a water-immersion lens to eliminate the washing and drying steps; also, by using monoclonal antibodies to improve selectivity and using an immobilisation method to increase the antibody surface density [96].
- The rapid detection of single E. coli bacteria using a graphene-based field-effect transistor device by Thakur et al. [89] proposes to return single-cell E. coli detection within 50 s for 1 µL samples (it potentially detects single E. coli cells in a large sample volume only when coupled with a suitable filtration setup). This thermally reduced graphene-oxide-based field-effect transistor, passivated with an ultrathin layer of Al2O3, provides label-free results at a low cost; however, it is currently only for one-time use, although it has the possibility of being regenerated using a suitable regeneration buffer [89]. (1) This method is not automated, and the process requires a filtration system and then detection; however, this is a significant limitation because an in situ remote filtration system will eventually become clogged, depending on how many checks Sensor #2 must perform. It would also require regular maintenance. (2) It is miniaturised. (3) It is not very efficient because it is not reusable, but it is low cost and accurate.
- A portable handheld fluorimeter developed by Ferrero et al. [79] for drinking water detects chimeric proteins after specifically recognising and binding to E. coli cells; results are obtained in eight minutes (five minutes for incubation at room temperature and three minutes for filtering 2 L of water and measurement). Filters are inverted to recover E. coli cells (with PBS from the filter membrane). The fluorimeter measures the E. coli cells with a detection range of 20–1000 E. coli CFU/mL [79]. The preparation of the assay with filtering and incubation is external to the fluorimeter, and the manual placement of the sample is required for measurement. (1) This method is not automated, but the process is not complicated (filtering, incubation at room temperature, and sample placement). Similar to Suggestion III, this method requires an in situ remote filtration system and then detection, which is a significant limitation, as it may become clogged quickly depending on the checks performed by Sensor #2. (2) It can be miniaturised; a final recovery had 2 mL in the cuvette after filtering 2 L of rural spring water (0.2 µm pore size). (3) It is efficient and accurate, but it tested 2 L filtered to a 2 mL sample.
- A preparation method assay protocol developed by Briciu-Burghina et al. [44] has a result time of 75 min for the detection of E. coli using GUS activity. The two main steps are (i) sample preparation using syringe filters with a dual purpose (the recovery and preconcentration of E. coli) and (ii) measuring of GUS activity. Syringe filtration and recovery are conducted onsite. The incubation of the lysing syringe filter requires a portable incubator, and detection requires a handheld portable fluorimeter [44]. (1) This method is not automated, but it is also not complex (filtering, incubation, and sample placement). (2) It is not miniaturised, but the Briciu-Burghina et al. [44] group used a portable miniaturised fluorimeter (ColiSense) with incubation capabilities, designed for the protocol presented, and successfully delivered results onsite within a 75 min period; and it has the potential to be automated into a flow-through system. (3) The method offers high accuracy and short time to result but requires six steps, with filtration, incubation, and measurement, so it is not very efficient.
- The reporter bacteriophage T7NLC identified by Hinkley et al. [134] utilises NanoLuc::CBM fusion for ultrasensitive detection of E. coli in drinking water. E. coli is infected with T7NLC and cellulose. The bacteriophage triggers Nluc luciferase production and light, for a limit of detection of <10 CFU/mL in 3 h. However, it requires several critical steps, including a pre-enrichment step. The phage requires an actively growing host for successful infection. The 60 min (37 °C, 225 rpm) pre-enrichment step resuscitates bacterial cells; following this, another incubation of phage stock and cellulose (37 °C, 225 rpm) allows phage infection and reporter enzyme production. Currently, (1) this method is a preparation assay and is not currently automated, but the steps are not complicated. (2) It is not miniaturised; however, there are other methods that undertake similar processing, and this method could be miniaturised in a newly developed system. (3) It is efficient and offers high accuracy [134], but it is a proposal sensor that requires development.
5. Conclusions
Author Contributions
Funding
Conflicts of Interest
Appendix A

| Method | Features | Strengths | Barriers |
|---|---|---|---|
| Preparation-Type Methods | |||
| Membrane-filtration assays [7,8,22,26,27,28,29,30,31,32,33,34,101] | Widely used standard reference methods to identify bacteria, virus, and organisms. Membrane filtration verifies, compares, and references water tests by isolating and eliminating discrete microbiological colonies for multiple samples and volumes. |
|
|
| Culture-based assays [22,32,35,36,37,38,39,40,41,42,43,44,45,46,47,48,51,99] | Culture-based assays methods follow culturing, incubation, and then measurement. These are simple and inexpensive processes that are widely used quantification tools to enumerate viral, bacterial, and protozoan pathogens. These verify legally accepted limits of water contamination, track specific markers, and compare results from other monitoring results; and are useful in automated lab-in-vial tools. |
|
|
| Polymerase chain reaction assays [7,22,29,30,36,37,45,46,47,49,50,51,52,53,54,55,56,82,135] | Polymerase chain reaction assays amplify microorganisms grown in culture for identification and involve three typical steps of production, which requires high temperatures under laboratory conditions. Polymerase chain reaction assays are used with filtration and culture-based methods; the production is typically analysed by sequencing, gel electrophoresis, or cloned into a plasmid. |
|
|
| DNA-probe assays [29,36,46,57,58,59,60,61,136] | Typically used in conjunction with labelling techniques and act in suspensions as reagents. DNA probe assays directly detect targeted organisms through the stretches of single-stranded DNA opposing complementary structures and or hybridisation between targeted sequences. |
|
|
| Measurement-Type Methods | |||
| Absorption spectroscopy measurements [8,29,62,63,64,65,66,67,68,72,130,137,138] | Absorption spectroscopy measures the absorption of light by an unknown substance or sample generally performed on molecules dissolved in transparent solvents or aqueous buffers. Samples are illuminated with electromagnetic rays of determinant wavelength depending on the choice; these can include visible, ultraviolet, or the lower infrared spectrum and then the absorbance of the sample is used to calculate the concentration. |
|
|
| Fluorescence [8,23,29,34,36,38,60,62,67,68,69,70,71,72,73,74,75,76,77,78,79,82,111,113,121,130,139,140,141,142] | Fluorescence results from released energy in the form of light, when fluorophores are excited by a high-energy light source. |
|
|
| Flow cytometry [32,36,68,80,81,82,83,84,86] | Flow cytometry determines individual cells, microorganism’s (bacteria) within complex matrices, following cell staining (or constituents) with fluorescent tags. Typically, test samples are injected into a liquid, placed into the flow cytometry device then injected into flow streams, which subsequently pass through the flow-sensing area of the instrument for fluorescence-based detection systems to measure the size, shape, number, and concentration of the individual particles. |
|
|
| Biosensors [3,22,29,30,59,82,85,86,87,88,89,90,91,96,143,144,145] | Biosensors exploit biological reactions of proteins, cells, antibodies, enzymes, receptors, nucleic acid, or components, and detections are usually through a physiochemical transducer integrated into electrical interfaces, which converts a substance concentration into an electrical signal. Some biosensors do not require sample preconcentration or pre-enrichment procedures, and results are comparable to conventional FIB detection methods. |
|
|
| Lateral flow assays [79,87,88,92,93,94,95] | Lateral flow assays detect genetic markers of organisms; in a typical layout, samples are placed in the chamber and moved horizontally along the strip passing different zones slowly. The analyte is typically an amplified double-stranded nucleic acid sequence specific for the organism with two different tags and recognition is made through binding to its tag-specific antibody; or, reliant on the hybridisation of target DNA. |
|
|
| Adenosine triphosphate bioluminescence assays [20,31,36,41,85,87,97,98] | The ATP bioluminescence typically uses luciferase enzymes and luciferin substrates to produce bioluminescence determined and quantified through particular sensors. Results are detected in the micromolar range through multiple device platforms, but typically chromatography, fluorescence, or immobilised luciferase sensors. |
|
|
| Enzyme activity assays [7,22,26,28,42,43,44,77,82,99,100,101,102,103,144,145,146,147,148,149,150] | The assays use enzyme chemistry and are used within biosensors and find results through fluorescence. Additionally, used in portable field kits, automated instruments, and traditional laboratory techniques. |
|
|
| Automated in situ biosensors using laboratory fluorescence measurement [19,59,104,105,106] | It applies specific bioreagents to samples and following incubation, measurements are made through fluorescence or absorbance. |
|
|
| Reagentless and portable fluorescence spectroscopy measurements [8,23,34,73,75,76,111,112,130] | Portable fluorescence spectroscopy devices can be incorporated into floating buoys or mobile sensors; these use fluorescence intensities of substances or organisms, producing a fluorescence signal at specific excitation and emission wavelengths to monitor water quality. |
|
|
References
- Soller, J.A.; Schoen, M.E.; Bartrand, T.; Ravenscroft, J.E.; Ashbolt, N.J. Estimated human health risks from exposure to recreational waters impacted by human and non-human sources of faecal contamination. Water Res. 2010, 44, 4674–4691. [Google Scholar] [CrossRef] [PubMed]
- Bourke, K. Gold Coast City Recreational Waters: Methods to promote healthy swimming. In Proceedings of the Acting Senior Environmental Health Officer; Gold Coast City Council: Gold Coast, Australia, 2012; pp. 1–24. [Google Scholar]
- Kumar, N.; Hu, Y.; Singh, S.; Mizaikoff, B. Emerging biosensor platforms for the assessment of water-borne pathogens. Analyst 2018, 143, 359–373. [Google Scholar] [CrossRef] [PubMed]
- Bertone, E.; Purandare, J.; Durand, B. Spatiotemporal prediction of Escherichia coli and Enterococci for the Commonwealth Games triathlon event using Bayesian Networks. Mar. Pollut. Bull. 2019, 146, 11–21. [Google Scholar] [CrossRef] [PubMed]
- Bulycheva, E.V.; Korotkova, E.I.; Voronova, O.A.; Kustova, A.A.; Petrova, E.V. Fluorescence Analysis of E. coli Bacteria in Water. Procedia Chem. 2014, 10, 179–183. [Google Scholar] [CrossRef] [Green Version]
- Makvana, S.; Krilov, L.R. Escherichia coli infections. Pediatr. Rev. 2015, 36, 167–171. [Google Scholar] [CrossRef] [Green Version]
- Chapman, J.; Anastasi, A.; Power, A.; Chandra, S.; Voss, L.; Rajapaksha, P.; Cosford, S. Detection Methods for Faecal Contamination Events: The Gap for Australia. Water e-J. Online J. Aust. Water Assoc. 2016, 1, 1–6. [Google Scholar] [CrossRef]
- Sharpe, T.J. Assessing a Fluorescence Spectroscopy Method for In-Situ Microbial Drinking Water Quality. Master’s Thesis, Portland State University, Portland, OR, USA, 2017. [Google Scholar]
- Weiskerger, C.J.; Whitman, R.L. Monitoring E. coli in a changing beachscape. Sci. Total Environ. 2018, 619–620, 1236–1246. [Google Scholar] [CrossRef]
- Lee, D.S.; Lee, S.J.; Choe, H.S.; Giacobbe, D.R. Community-Acquired Urinary Tract Infection by Escherichia coli in the Era of Antibiotic Resistance. Biomed. Res. Int. 2018, 2018, 1–14. [Google Scholar] [CrossRef] [Green Version]
- Bertone, E.; Kozak, S.; Roiko, A. Understanding and Modeling the Occurrence of E. coli Blooms in Drinking Water Reservoirs. Water Resour. Res. 2019, 55, 10518–10526. [Google Scholar] [CrossRef]
- Byappanahalli, M.N.; Nevers, M.B.; Korajkic, A.; Staley, Z.R.; Harwood, V.J. Enterococci in the Environment. Microbiol. Mol. Biol. Rev. 2012, 76, 685–706. [Google Scholar] [CrossRef] [Green Version]
- Gilmore, M.S.; Clewell, D.B.; Ike, Y.; Shankar, N. Enterococci from Commensals to Leading Causes of Drug Resistant Infection; Gilmore, M.S., Clewell, D.B., Ike, Y., Shankar, N., Eds.; Massachusetts Eye and Ear Infirmary Boston: Boston, MA, USA, 2014. [Google Scholar]
- Australian Commission on Safety and Quality in Health Care (ACSQHC). AURA 2016: First Australian Report on Antimicrobial Use and Resistance in Human Health—Summary Report; ACSQHC: Sydney, Australia, 2016.
- Scott, T.M.; Rose, J.B.; Jenkins, T.M.; Farrah, S.R.; Lukasik, J. Microbial source tracking: Current methodology and future directions. Appl. Environ. Microbiol. 2002, 68, 5796–5803. [Google Scholar] [CrossRef] [PubMed] [Green Version]
- Yuan, J. Evaluation of Different Indicator Microorganism Enumeration Protocols for Water Quality Monitoring. Master’s Thesis, Auburn University, Auburn, AL, USA, 2016. [Google Scholar]
- Healthy Waterways. Healthy Waterplay: Monitoring Recreational Water Waterways in South East Queensland; Healthy Waterways: Brisbane, Australia, 2013. [Google Scholar]
- City of Gold Coast. Recreational Water Quality. Available online: https://www.goldcoast.qld.gov.au/environment/recreational-water-quality-20260.html (accessed on 4 August 2020).
- Angelescu, D.E.; Huynh, V.; Hausot, A.; Yalkin, G.; Plet, V.; Mouchel, J.-M.; Guérin-Rechdaoui, S.; Azimi, S.; Rocher, V. Autonomous system for rapid field quantification of Escherichia coli in surface waters. J. Appl. Microbiol. 2018. [Google Scholar] [CrossRef]
- Chollet, R.; Ribault, S. Use of ATP Bioluminescence for Rapid Detection and Enumeration of Contaminants: The Milliflex Rapid Microbiology Detection and Enumeration System. In Bioluminescence—Recent Advances in Oceanic Measurements and Laboratory Applications; Lapota, D., Ed.; IntechOpen: London, UK, 2012; pp. 99–118. ISBN 978-953-307-940-0. [Google Scholar]
- City of Gold Coast. Waterways Monitoring. Available online: https://www.goldcoast.qld.gov.au/environment/waterways-monitoring-3963.html (accessed on 4 August 2020).
- Price, R.G.; Wildeboer, D. Chapter 7: E. coli as an Indicator of Contamination and Health Risk in Environmental Waters. In Escherichia coli—Recent Advances on Physiology, Pathogenesis and Biotechnological Applications; Samie, A., Ed.; IntechOpen: London, UK, 2017; pp. 125–139. ISBN 978-953-51-3330-8. [Google Scholar]
- Sorensen, J.P.R.; Baker, A.; Cumberland, S.A.; Lapworth, D.J.; MacDonald, A.M.; Pedley, S.; Taylor, R.G.; Ward, J.S.T. Real-time detection of faecally contaminated drinking water with tryptophan-like fluorescence: Defining threshold values. Sci. Total Environ. 2018, 622–623, 1250–1257. [Google Scholar] [CrossRef] [PubMed]
- Moher, D.; Liberati, A.; Tetzlaff, J.; Altman, D.G.; Altman, D.; Antes, G.; Atkins, D.; Barbour, V.; Barrowman, N.; Berlin, J.A.; et al. Preferred reporting items for systematic reviews and meta-analyses: The PRISMA statement. PLoS Med. 2009, 6, e1000097. [Google Scholar] [CrossRef] [PubMed] [Green Version]
- Polanin, J.R.; Pigott, T.D.; Espelage, D.L.; Grotpeter, J.K. Best practice guidelines for abstract screening large-evidence systematic reviews and meta-analyses. Res. Synth. Methods 2019, 10, 330–342. [Google Scholar] [CrossRef] [Green Version]
- United States Environmental Protection Agency (EPA). Method 1604: Total Coliforms and Escherichia coli in Water by Membrane Filtration Using a Simultaneous Detection Technique (MI Medium); United States Environmental Protection Agency Office: Washington, DC, USA, 2002.
- United States Environmental Protection Agency (EPA). Method 1603: Escherichia coli (E. coli) in Water by Membrane Filtration Using Modified Membrane-Thermotolerant Escherichia coli Agar (Modified mTEC); United States Environmental Protection Agency Office: Washington, DC, USA, 2014.
- United States Environmental Protection Agency (EPA). Method 1600: Enterococci in Water by Membrane Filtration Using Membrane-Enterococcus Indoxyl- Beta-d-Glucoside Agar (mEI); United States Environmental Protection Agency (EPA): Washington, DC, USA, 2009.
- Zulkifli, S.N.; Rahim, H.A.; Lau, W.-J. Detection of contaminants in water supply: A review on state-of-the-art monitoring technologies and their applications. Sens. Actuators B Chem. 2018, 255, 2657–2689. [Google Scholar] [CrossRef] [PubMed]
- Nurliyana, M.R.; Sahdan, M.Z.; Wibowo, K.M.; Muslihati, A.; Saim, H.; Ahmad, S.A.; Sari, Y.; Mansor, Z. The Detection Method of Escherichia coli in Water Resources: A Review. J. Phys. Conf. Ser. 2018, 995, 1–11. [Google Scholar] [CrossRef] [Green Version]
- Ngamsom, B.; Fourie, L.; Tarn, M.D.; Kumar, S.; Moodley, K.; Land, K.; Pamme, N. Rapid detection of E. coli O157:H7 by IFAST and ATP bioluminescence assay for water analysis. In Proceedings of the The 20th International Conference of Miniaturized Systems for Chemistry and Life Sciences (MicroTAS 2016), Dublin, Ireland, 9–13 October 2016; ResearchGate: Dublin, Ireland, 2016; pp. 63–64. [Google Scholar]
- Guo, T.; Wei, Y.; Xu, C.; Watts, B.R.; Zhang, Z.; Fang, Q.; Zhang, H.; Selvaganapathy, P.R.; Deen, M.J. Counting of escherichia coli by a microflow cytometer based on a photonic-microfluidic integrated device. Electrophoresis 2015, 36, 298–304. [Google Scholar] [CrossRef]
- Guo, T. Optical System towards In-line Monitoring of Bacteria in Drinking Water. Ph.D. Thesis, Mcmaster University, Hamilton, ON, Canada, 2016. [Google Scholar]
- Cumberland, S.; Bridgeman, J.; Baker, A.; Sterling, M.; Ward, D. Fluorescence spectroscopy as a tool for determining microbial quality in potable water applications. Environ. Technol. 2012, 33, 687–693. [Google Scholar] [CrossRef]
- Tan, B.; Ng, C.; Nshimyimana, J.P.; Loh, L.L.; Gin, K.Y.H.; Thompson, J.R. Next-generation sequencing (NGS) for assessment of microbial water quality: Current progress, challenges, and future opportunities. Front. Microbiol. 2015, 6, 1–20. [Google Scholar] [CrossRef]
- Rajapaksha, P.; Elbourne, A.; Gangadoo, S.; Brown, R.; Cozzolino, D.; Chapman, J. A review of methods for the detection of pathogenic microorganisms. Analyst 2019, 144, 396–411. [Google Scholar] [CrossRef]
- Girones, R.; Ferrús, M.A.; Alonso, J.L.; Rodriguez-Manzano, J.; Calgua, B.; de Abreu Corrêa, A.; Hundesa, A.; Carratala, A.; Bofill-Mas, S. Molecular detection of pathogens in water—The pros and cons of molecular techniques. Water Res. 2010, 44, 4325–4339. [Google Scholar] [CrossRef] [PubMed]
- Veolia Water Solutions & Technologies TECTA: Solutions for Automated Microbiology. Available online: http://technomaps.veoliawatertechnologies.com/processes/lib/2548,TECTA-Brochure-EN.pdf (accessed on 19 June 2019).
- McLain, J.E.; Cytryn, E.; Durso, L.M.; Young, S. Culture-based Methods for Detection of Antibiotic Resistance in Agroecosystems: Advantages, Challenges, and Gaps in Knowledge. J. Environ. Qual. 2016, 45, 432–440. [Google Scholar] [CrossRef] [PubMed]
- Napier, M.D.; Poole, C.; Stewart, J.R.; Weber, D.J.; Glassmeyer, S.T.; Kolpin, D.W.; Furlong, E.T.; Dufour, A.P.; Wade, T.J. Exposure to Human-Associated Chemical Markers of Fecal Contamination and Self-Reported Illness among Swimmers at Recreational Beaches. Environ. Sci. Technol. 2018, 52, 7513–7523. [Google Scholar] [CrossRef]
- Vang, Ó.K. ATP Measurements for Monitoring Microbial Drinking Water Quality. Ph.D. Thesis, Technical University of Denmark, Lyngby, Denmark, 2013. [Google Scholar]
- Burnet, J.B.; Dinh, Q.T.; Imbeault, S.; Servais, P.; Dorner, S.; Prévost, M. Autonomous online measurement of β-d-glucuronidase activity in surface water: Is it suitable for rapid E. coli monitoring? Water Res. 2019, 152, 241–250. [Google Scholar] [CrossRef] [PubMed]
- Lebaron, P.; Henry, A.; Lepeuple, A.S.; Pena, G.; Servais, P. An operational method for the real-time monitoring of E. coli numbers in bathing waters. Mar. Pollut. Bull. 2005, 50, 652–659. [Google Scholar] [CrossRef]
- Briciu-Burghina, C.; Heery, B.; Regan, F. Protocol for the recovery and detection of Escherichia coli in environmental water samples. Anal. Chim. Acta 2017, 964, 178–186. [Google Scholar] [CrossRef]
- Saxena, T.; Kaushik, P.; Krishna Mohan, M. Prevalence of E. coli O157: H7 in water sources: An overview on associated diseases, outbreaks and detection methods. Diagn. Microbiol. Infect. Dis. 2015, 82, 249–264. [Google Scholar] [CrossRef]
- Khan, A.S. Rapid Advances in Nucleic Acid Technologies for Detection and Diagnostics of Pathogens. J. Microbiol. Exp. 2014, 1, 56–61. [Google Scholar] [CrossRef] [Green Version]
- Jiang, Y.S.; Riedel, T.E.; Popoola, J.A.; Morrow, B.R.; Cai, S.; Ellington, A.D.; Bhadra, S. Portable platform for rapid in-field identification of human fecal pollution in water. Water Res. 2018, 131, 186–195. [Google Scholar] [CrossRef]
- Schang, C.; Henry, R.; Kolotelo, P.A.; Prosser, T.; Crosbie, N.; Grant, T.; Cottam, D.; O’Brien, P.; Coutts, S.; Deletic, A.; et al. Evaluation of techniques for measuring microbial hazards in bathing waters: A comparative study. PLoS ONE 2016, 11, e0155848. [Google Scholar] [CrossRef]
- Ochman, H.; Gerber, A.S.; Hart, D.L. Genetic Applications of an Inverse Polymerase Chain Reaction. Genetics 1988, 120, 621–623. [Google Scholar]
- Garibyan, L.; Avashia, N. Research Techniques Made Simple: Polymerase Chain Reaction (PCR). J. Investig. Dermatol. 2013, 133, e6. [Google Scholar] [CrossRef] [Green Version]
- Mendes Silva, D.; Domingues, L. On the track for an efficient detection of Escherichia coli in water: A review on PCR-based methods. Ecotoxicol. Environ. Saf. 2015, 113, 400–411. [Google Scholar] [CrossRef] [PubMed] [Green Version]
- Lam, J.T.; Lui, E.; Chau, S.; Kueh, C.S.W.; Yung, Y.K.; Yam, W.C. Evaluation of real-time PCR for quantitative detection of Escherichia coli in beach water. J. Water Health 2014, 12, 51–56. [Google Scholar] [CrossRef] [PubMed] [Green Version]
- Frahm, E.; Obst, U. Application of the fluorogenic probe technique (TaqMan PCR) to the detection of Enterococcus spp. and Escherichia coli in water samples. J. Microbiol. Methods 2003, 52, 123–131. [Google Scholar] [CrossRef]
- Walker, D.I.; McQuillan, J.; Taiwo, M.; Parks, R.; Stenton, C.A.; Morgan, H.; Mowlem, M.C.; Lees, D.N. A highly specific Escherichia coli qPCR and its comparison with existing methods for environmental waters. Water Res. 2017, 126, 101–110. [Google Scholar] [CrossRef] [Green Version]
- Noble, R.T.; Weisberg, S.B. A review of technologies for rapid detection of bacteria in recreational waters. J. Water Health 2005, 3, 381–392. [Google Scholar] [CrossRef] [Green Version]
- Xue, Y.; Wilkes, J.G.; Moskal, T.J.; Williams, A.J.; Cooper, W.M.; Nayak, R.; Rafii, F.; Buzatu, D.A. Development of a flow cytometry-based method for rapid detection of Escherichia coli and Shigella spp. using an oligonucleotide probe. PLoS ONE 2016, 11, e0150038. [Google Scholar] [CrossRef]
- Monsur Ali, M.; Aguirre, S.D.; Lazim, H.; Li, Y. Fluorogenic DNAzyme probes as bacterial indicators. Angew. Chem. Int. Ed. 2011, 50, 3751–3754. [Google Scholar] [CrossRef]
- Hashemi, E.; Forouzandeh, M. Designing a new biosensor “DNA ELISA” to detect Escherichia coli using genomic DNA and comparison of this method to PCR-ELISA. J. Enzyme Inhib. Med. Chem. 2018, 33, 722–725. [Google Scholar] [CrossRef] [PubMed] [Green Version]
- Srivastava, K.R.; Awasthi, S.; Mishra, P.K.; Srivastava, P.K. Chapter 13. Biosensors/molecular tools for detection of waterborne pathogens. In Waterborne Pathogens; Elsevier: Amsterdam, The Netherlands, 2020; pp. 237–277. ISBN 9780128187838. [Google Scholar]
- Juhna, T.; Birzniece, D.; Larsson, S.; Zulenkovs, D.; Sharipo, A.; Azevedo, N.F.; Ménard-Szczebara, F.; Castagnet, S.; Féliers, C.; Keevil, C.W. Detection of Escherichia coli in biofilms from pipe samples and coupons in drinking water distribution networks. Appl. Environ. Microbiol. 2007, 73, 7456–7464. [Google Scholar] [CrossRef] [PubMed] [Green Version]
- Stender, H.; Broomer, A.J.; Oliveira, K.; Perry-O’keefe, H.; Hyldig-nielsen, J.J.; Sage, A.; Coull, J. Rapid Detection, Identification, and Enumeration of Escherichia coli Cells in Municipal Water by Chemiluminescent In Situ Hybridization. Appl. Environ. Microbiol. 2001, 67, 142–147. [Google Scholar] [CrossRef] [PubMed] [Green Version]
- Blaen, P.J.; Khamis, K.; Lloyd, C.E.M.; Bradley, C.; Hannah, D.; Krause, S. Real-time monitoring of nutrients and dissolved organic matter in rivers: Capturing event dynamics, technological opportunities and future directions. Sci. Total Environ. 2016, 569–570, 647–660. [Google Scholar] [CrossRef] [PubMed] [Green Version]
- Schmid, F.-X. (University of B.G. Biological Macromolecules: UV-visible Spectrophotometry. Encycl. Life Sci. 2001, 1–4. [Google Scholar] [CrossRef]
- Kiefer, J.; Ebel, N.; Schlücker, E.; Leipertz, A. Characterization of Escherichia coli suspensions using UV/Vis/NIR absorption spectroscopy. Anal. Methods 2010, 2, 123–128. [Google Scholar] [CrossRef]
- De Caro, C.; Haller, C. UV/VIS Spectrophotometry—Fundamentals and Applications; Mettler-Toledo Publication No. ME-30256131: Greifensee, Switzerland, 2015. [Google Scholar]
- Park, C.W.; Yoon, K.Y.; Byeon, J.H.; Kim, K.; Hwang, J. Development of rapid assessment method to determine bacterial viability based on ultraviolet and visible (UV-Vis) spectroscopy analysis including application to bioaerosols. Aerosol Air Qual. Res. 2012, 12, 395–404. [Google Scholar] [CrossRef]
- Fan, C.; Hsiang, J.C.; Jablonski, A.E.; Dickson, R.M. All-optical fluorescence image recovery using modulated stimulated emission depletion. Chem. Sci. 2011, 2, 1080–1085. [Google Scholar] [CrossRef]
- Bridgeman, J.; Baker, A.; Brown, D.; Boxall, J.B. Portable LED fluorescence instrumentation for the rapid assessment of potable water quality. Sci. Total Environ. 2015, 524–525, 338–346. [Google Scholar] [CrossRef] [Green Version]
- The Molecular Probes Handbook: A Guide to Fluorescent Probes and Labeling Technologies. Introduction to Fluorescence Techniques; Invitrogen by ThermoFisher Scientific; ThermoFisher Scientific: Waltham, MA, USA, 2010.
- PerkinElmer Ltd. An. Introduction to Fluorescence Spectroscopy; PerkinElmer Ltd.: Buckinghamshire, UK, 2011; ISBN 0080923348. [Google Scholar]
- Simões, J.; Dong, T. Continuous and real-time detection of drinking-water pathogens with a low-cost fluorescent optofluidic sensor. Sensors 2018, 18, 2210. [Google Scholar] [CrossRef] [Green Version]
- Carstea, E.M.; Bridgeman, J.; Baker, A.; Reynolds, D.M. Fluorescence spectroscopy for wastewater monitoring: A review. Water Res. 2016, 95, 205–219. [Google Scholar] [CrossRef] [PubMed]
- Carstea, E.M.; Popa, C.L.; Baker, A.; Bridgeman, J. In situ fluorescence measurements of dissolved organic matter: A review. Sci. Total Environ. 2020, 699, 134361. [Google Scholar] [CrossRef]
- Shields, R.C.; Kaspar, J.R.; Lee, K.; Underhill, S.A.M.; Burne, R.A. Fluorescence tools adapted for real-time monitoring of the behaviors of Streptococcus species. Appl. Environ. Microbiol. 2019, 1–41. [Google Scholar] [CrossRef] [PubMed] [Green Version]
- Okache, J.; Haggett, B.; Maytum, R.; Mead, A.; Rawson, D.; Ajmal, T. Sensing fresh water contamination using fluorescence methods. In Proceedings of the 2015 IEEE SENSORS, Busan, Korea, 1–4 November 2015; IEEE: Busan, Korea, 2015; pp. 1–4. [Google Scholar]
- Baker, A.; Cumberland, S.A.; Bradley, C.; Buckley, C.; Bridgeman, J. To what extent can portable fluorescence spectroscopy be used in the real-time assessment of microbial water quality? Sci. Total Environ. 2015, 532, 14–19. [Google Scholar] [CrossRef] [PubMed] [Green Version]
- Bramburger, A.J.; Stephen Brown, R.; Haley, J.; Ridal, J.J. A new, automated rapid fluorometric method for the detection of Escherichia coli in recreational waters. J. Great Lakes Res. 2015, 41, 298–302. [Google Scholar] [CrossRef]
- Oda, M.; Morita, M.; Unno, H.; Tanji, Y. Rapid detection of Escherichia coli O157: H7 by using green fluorescent protein-labeled PP01 bacteriophage. Appl. Environ. Microbiol. 2004, 70, 527–534. [Google Scholar] [CrossRef] [Green Version]
- Ferrero, F.J.; Valledor, M.; Campo, J.C.; Marin, L.; Gutierrez-Del-Rio, I.; Fernandez, J.; Lombo, F.; Cobian, N.; Olmos, F.; Mendez, I. A Novel Handheld Fluorimeter for Rapid Detection of Escherichia coli in Drinking Water. IEEE Sens. J. 2016, 16, 5136–5144. [Google Scholar] [CrossRef]
- Bio-Rad Laboratories Inc. Flow Cytometry Basics Guide; Bio-Rad Laboratories Inc.: Hercules, CA, USA, 2015; ISBN 9781107671812. [Google Scholar]
- Helmi, K.; Barthod, F.; Méheut, G.; Henry, A.; Poty, F.; Laurent, F.; Charni-Ben-Tabassi, N. Methods for microbiological quality assessment in drinking water: A comparative study. J. Water Health 2015, 13.1, 34–41. [Google Scholar] [CrossRef]
- Tatari, K.; Corfitzen, C.B.; Albrechtsen, H.; Christensen, S.C.B. Sensors for Microbial Drinking Water Quality; Technical University of Denmark: Lyngby, Denmark, 2016. [Google Scholar]
- Watts, B.R.; Zhang, Z.; Xu, C.Q.; Cao, X.; Lin, M. A photonic-microfluidic integrated device for reliable fluorescence detection and counting. Electrophoresis 2012, 33, 3236–3244. [Google Scholar] [CrossRef]
- Cyto-Water Rapid, Flexible Water Analysis Creates Industry Stir; ICFO: Barcelona, Spain, 2018.
- Woutersen, M.; Belkin, S.; Brouwer, B.; Van Wezel, A.P.; Heringa, M.B. Are luminescent bacteria suitable for online detection and monitoring of toxic compounds in drinking water and its sources? Anal. Bioanal. Chem. 2011, 400, 915–929. [Google Scholar] [CrossRef] [Green Version]
- Sherchan, S.P. Monitoring Microbial Water Quality via Online Sensors. Ph.D. Thesis, The University of Arizona, Tucson, AZ, USA, 2013. [Google Scholar]
- Samendra, P.; Masaaki, K.; Charles, P.; Ian, L. Rapid Detection Technologies for Monitoring Microorganisms in Water. Biosens. J. 2014, 3, 1–8. [Google Scholar] [CrossRef]
- Kumar, S.; Nehra, M.; Mehta, J.; Dilbaghi, N.; Marrazza, G.; Kaushik, A. Point-of-Care Strategies for Detection of Waterborne Pathogens. Sensors 2019, 19, 4476. [Google Scholar] [CrossRef] [PubMed] [Green Version]
- Thakur, B.; Zhou, G.; Chang, J.; Pu, H.; Jin, B.; Sui, X.; Yuan, X.; Yang, C.H.; Magruder, M.; Chen, J. Rapid detection of single E. coli bacteria using a graphene-based field-effect transistor device. Biosens. Bioelectron. 2018, 110, 16–22. [Google Scholar] [CrossRef] [Green Version]
- Gunda, N.S.K.; Dasgupta, S.; Mitra, S.K. DipTest: A litmus test for E. coli detection in water. PLoS ONE 2017, 12, 1–13. [Google Scholar] [CrossRef] [Green Version]
- Park, T.S.; Yoon, J.Y. Smartphone detection of Escherichia coli from field water samples on paper microfluidics. IEEE Sens. J. 2015, 15, 1902–1907. [Google Scholar] [CrossRef]
- Zhao, S.; Wang, S.; Zhang, S.; Liu, J.; Dong, Y. State of the art: Lateral flow assay (LFA) biosensor for on-site rapid detection. Chinese Chem. Lett. 2018, 29, 1567–1577. [Google Scholar] [CrossRef]
- Posthuma-Trumpie, G.A.; Korf, J.; Van Amerongen, A. Lateral flow (immuno)assay: Its strengths, weaknesses, opportunities and threats. A literature survey. Anal. Bioanal. Chem. 2009, 393, 569–582. [Google Scholar] [CrossRef] [Green Version]
- BlažkoVá, M.; Koets, M.; Wichers, J.H.; Van Amerongen, A.; Fukal, L.; Rauch, P. Nucleic acid lateral flow immunoassay for the detection of pathogenic bacteria from food. Czech. J. Food Sci. 2009, 27. [Google Scholar] [CrossRef]
- Bubert, A.; Paiva, G.; Smith, T.; Bülte, M. Rapid and Simple Detection of E. coli 0157:H7 in Water Samples after Enrichment with Readycult®; AWAA Poster; University of Giessen: Giessen, Gemany, 2003. [Google Scholar]
- Liao, D.S.; Raveendran, J.; Golchi, S.; Docoslis, A. Fast and sensitive detection of bacteria from a water droplet by means of electric field effects and micro-Raman spectroscopy. Sens. Bio-Sens. Res. 2015, 6, 59–66. [Google Scholar] [CrossRef] [Green Version]
- Lee, J.Y.; Deininger, R.A. Detection of E. coli in beach water within 1 hour using immunomagnetic separation and ATP bioluminescence. Luminescence 2004, 19, 31–36. [Google Scholar] [CrossRef] [Green Version]
- Zimmer-Faust, A.G.; Thulsiraj, V.; Ferguson, D.; Jay, J.A. Performance and specificity of the covalently linked immunomagnetic separation-ATP method for rapid detection and enumeration of enterococci in coastal environments. Appl. Environ. Microbiol. 2014, 1–39. [Google Scholar] [CrossRef] [PubMed] [Green Version]
- Heery, B.; Briciu-Burghina, C.; Zhang, D.; Duffy, G.; Brabazon, D.; O’Connor, N.; Regan, F. ColiSense, today’s sample today: A rapid on-site detection of β-d-Glucuronidase activity in surface water as a surrogate for E. coli. Talanta 2016, 148, 75–83. [Google Scholar] [CrossRef] [PubMed] [Green Version]
- Tryland, I.; Braathen, H.; Wennberg, A.C.; Eregno, F.; Beschorner, A.-L. Monitoring of β-D-galactosidase activity as a surrogate parameter for rapid detection of sewage contamination in urban recreational water. Water 2016, 8, 65. [Google Scholar] [CrossRef] [Green Version]
- Bushon, R.N.; Brady, A.M.G.; Lindsey, B.D. Holding-time and method comparisons for the analysis of fecal-indicator bacteria in groundwater. Environ. Monit. Assess. 2015, 187, 1–11. [Google Scholar] [CrossRef] [PubMed]
- Baudart, J.; Servais, P.; De Paoli, H.; Henry, A.; Lebaron, P. Rapid enumeration of Escherichia coli in marine bathing waters: Potential interference of nontarget bacteria. J. Appl. Microbiol. 2009, 107, 2054–2062. [Google Scholar] [CrossRef] [PubMed] [Green Version]
- Rochelet, M.; Solanas, S.; Betelli, L.; Chantemesse, B.; Vienney, F.; Hartmann, A. Rapid amperometric detection of Escherichia coli in wastewater by measuring β-d glucuronidase activity with disposable carbon sensors. Anal. Chim. Acta 2015, 892, 160–166. [Google Scholar] [CrossRef]
- Huynh, V.; Hausot, A.; Angelescu, D.E. An autonomous field sensor for Total Coliform and E. coli monitoring at remote sites. In Proceedings of the OCEANS 2016 MTS/IEEE Monterey, Monterey, CA, USA, 19–23 September 2016; Huynh, V., Hausot, A., Angelescu, D.E., Eds.; IEEE: Monterey, CA, USA, 2016; pp. 1–5. [Google Scholar]
- Fluidion ALERT LAB (Portable Analyzer): The Autonomous Microbiology Mobile Analysis Lab. Available online: http://fluidion.com/images/Documents/FLUIDION_ALERT_LAB_20180307_EN.pdf (accessed on 6 November 2018).
- Fluidion ALERT System (In-Situ Analyzer): The Industry’s First Fully-Automated In-Situ Microbiology Lab. Available online: http://fluidion.com/images/Documents/FLUIDION_ALERT_20180307_EN.pdf (accessed on 6 November 2018).
- Colifast AS Colifast Field Kit: Rapid Detection of Indicator Bacteria in Water. Available online: https://colifast.no/wp-content/uploads/pdf/cmd_brochure.pdf (accessed on 19 July 2019).
- Wildeboer, D.; Amirat, L.; Price, R.G.; Abuknesha, R.A. Rapid detection of Escherichia coli in water using a hand-held fluorescence detector. Water Res. 2010, 44, 2621–2628. [Google Scholar] [CrossRef]
- Stojanović, M.; Apostolović, M.; Stojanović, D.; Milošević, Z.; Toplaović, A.; Lakušić, V.M.; Golubović, M. Understanding sensitivity, Specificity and predictive values. Vojnosanit. Pregl. 2014, 71, 1062–1065. [Google Scholar] [CrossRef] [Green Version]
- Harwood, V.J.; Staley, C.; Badgley, B.D.; Borges, K.; Korajkic, A. Microbial source tracking markers for detection of fecal contamination in environmental waters: Relationships between pathogens and human health outcomes. FEMS Microbiol. Rev. 2014, 38, 1–40. [Google Scholar] [CrossRef] [Green Version]
- Gaulier, G.; Staedler, D.; Sousa, G.; Bonacina, L.; Wolf, J.P. Real-time monitoring of bacterial and organic pollution in a water stream by fluorescence depletion spectroscopy. Appl. Phys. B Lasers Opt. 2017, 123, 2–6. [Google Scholar] [CrossRef]
- Walck, M. Prompt and In Situ Diagnosis of Live/Dead Bacteria. Bachelor’s Thesis, Texas A&M University, College Station, TX, USA, 2016. [Google Scholar]
- Carstea, E.M.; Baker, A.; Bieroza, M.; Reynolds, D. Continuous fluorescence excitation-emission matrix monitoring of river organic matter. Water Res. 2010, 44, 5356–5366. [Google Scholar] [CrossRef]
- Wasswa, J.; Mladenov, N. Improved Temperature Compensation for In Situ Humic-Like and Tryptophan-Like Fluorescence Acquisition in Diverse Water Types. Environ. Eng. Sci. 2018, 35, 1–7. [Google Scholar] [CrossRef]
- Sorensen, J.P.R.; Lapworth, D.J.; Marchant, B.P.; Nkhuwa, D.C.W.; Pedley, S.; Stuart, M.E.; Bell, R.A.; Chirwa, M.; Kabika, J.; Liemisa, M.; et al. In-situ tryptophan-like fluorescence: A real-time indicator of faecal contamination in drinking water supplies. Water Res. 2015, 81, 38–46. [Google Scholar] [CrossRef] [PubMed] [Green Version]
- Sorensen, J.P.R.; Vivanco, A.; Ascott, M.J.; Gooddy, D.C.; Lapworth, D.J.; Read, D.S.; Rushworth, C.M.; Bucknall, J.; Herbert, K.; Karapanos, I.; et al. Online fluorescence spectroscopy for the real-time evaluation of the microbial quality of drinking water. Water Res. 2018, 137, 301–309. [Google Scholar] [CrossRef] [PubMed]
- Henderson, R.K.; Baker, A.; Murphy, K.R.; Hambly, A.; Stuetz, R.M.; Khan, S.J. Fluorescence as a potential monitoring tool for recycled water systems: A review. Water Res. 2009, 43, 863–881. [Google Scholar] [CrossRef]
- Chen, S.; Yu, Y.L.; Wang, J.H. Inner filter effect-based fluorescent sensing systems: A review. Anal. Chim. Acta 2018, 999, 13–26. [Google Scholar] [CrossRef]
- De Oliveira, G.F.; Bertone, E.; Stewart, R.A.; Awad, J.; Holland, A.; O’Halloran, K.; Bird, S. Multi-parameter compensation method for accurate in situ fluorescent dissolved organic matter monitoring and properties characterization. Water 2018, 10, 1146. [Google Scholar] [CrossRef] [Green Version]
- Government of Western Australia Department of Water. Surface Water Sampling Methods and Analysis—Technical Appendices: Standard Operating Procedures for Water Sampling-Methods and Analysis; Heald, D., Water Science Branch, Eds.; Government of Western Australia: Perth, Australia, 2009.
- Khamis, K.; Sorensen, J.P.R.; Bradley, C.; Hannah, D.M.; Lapworth, D.J.; Stevens, R. In situ tryptophan-like fluorometers: Assessing turbidity and temperature effects for freshwater applications. Environ. Sci. Process. Impacts 2015, 17, 740–752. [Google Scholar] [CrossRef] [Green Version]
- Bertone, E.; Burford, M.A.; Hamilton, D.P. Fluorescence probes for real-time remote cyanobacteria monitoring: A review of challenges and opportunities. Water Res. 2018, 141, 152–162. [Google Scholar] [CrossRef]
- Baker, A.; Elliott, S.; Lead, J.R. Effects of filtration and pH perturbation on freshwater organic matter fluorescence. Chemosphere 2007, 67, 2035–2043. [Google Scholar] [CrossRef] [PubMed]
- Bertone, E.; De Oliveira, G.F.; Stewart, R.; Halloran, K.O. Using compensated fluorescence probes data for proactive water treatment management. In Proceedings of the 13th International Conference on Hydroinformatics, Palermo, Italy, 1–6 July 2018; ResearchGate: London, UK, 2018; pp. 1–8. [Google Scholar]
- Bharadwaj, R.; Sai, V.V.R.; Thakare, K.; Dhawangale, A.; Kundu, T.; Titus, S.; Verma, P.K.; Mukherji, S. Evanescent wave absorbance based fiber optic biosensor for label-free detection of E. coli at 280 nm wavelength. Biosens. Bioelectron. 2011, 26, 3367–3370. [Google Scholar] [CrossRef] [PubMed]
- Mahmud, M.; Ejeian, F.; Azadi, S.; Myers, M.; Pejcic, B.; Abbasi, R.; Razmjou, A.; Asadnia, M. Recent progress in sensing nitrate, nitrite, phosphate, and ammonium in aquatic environment. ECSN 2020, 127492. [Google Scholar] [CrossRef]
- ResearchGate. Available online: https://www.researchgate.net/post/Can_you_recommend_popular_programs_for_deconvolution_which_are_used_by_analysts (accessed on 6 August 2020).
- PeakFIT Automated Peak Seperation Analysis. Available online: http://www.sigmaplot.co.uk/products/peakfit/peakfit.php (accessed on 6 August 2020).
- Sgroi, M.; Roccaro, P.; Korshin, G.V.; Greco, V.; Sciuto, S.; Anumol, T.; Snyder, S.A.; Vagliasindi, F.G.A. Use of fluorescence EEM to monitor the removal of emerging contaminants in full scale wastewater treatment plants. J. Hazard. Mater. 2017, 323, 367–376. [Google Scholar] [CrossRef]
- Heibati, M.; Stedmon, C.A.; Stenroth, K.; Rauch, S.; Toljander, J.; Säve-Söderbergh, M.; Murphy, K.R. Assessment of drinking water quality at the tap using fluorescence spectroscopy. Water Res. 2017, 125, 1–10. [Google Scholar] [CrossRef] [Green Version]
- Khamis, K.; Bradley, C.; Stevens, R.; Hannah, D.M. Continuous field estimation of dissolved organic carbon concentration and biochemical oxygen demand using dual-wavelength fluorescence, turbidity and temperature. Hydrol. Process. 2017, 31, 540–555. [Google Scholar] [CrossRef]
- Watras, C.J.; Hanson, P.C.; Stacy, T.L.; Morrison, K.M.; Mather, J.; Hu, Y.H.; Milewski, P. A temperature compensation method for CDOM fluorescence sensors in freshwater. Limnol. Oceanogr. Methods 2011, 9, 296–301. [Google Scholar] [CrossRef] [Green Version]
- De Oliveira, G.F.; Bertone, E.; Stewart, R.A.; O’Halloran, K. Understanding and modelling fluorescent dissolved organic matter probe readings for improved coagulation performance in water treatment plants. In Proceedings of the 22nd International Congress on Modelling and Simulation, Hobart, Tasmania, Australia, 3–8 December 2017. [Google Scholar]
- Hinkley, T.C.; Garing, S.; Singh, S.; Le Ny, A.L.M.; Nichols, K.P.; Peters, J.E.; Talbert, J.N.; Nugen, S.R. Reporter bacteriophage T7NLC utilizes a novel NanoLuc::CBM fusion for the ultrasensitive detection of Escherichia coli in water. Analyst 2018, 143, 4074–4082. [Google Scholar] [CrossRef] [Green Version]
- Kapoor, V.; Gupta, I.; Pasha, A.B.M.T.; Phan, D. Real-Time Quantitative PCR Measurements of Fecal Indicator Bacteria and Human-Associated Source Tracking Markers in a Texas River following Hurricane Harvey. Environ. Sci. Technol. Lett. 2018, 5, 322–328. [Google Scholar] [CrossRef]
- Bej, A.K.; Steffan, R.J.; DiCesare, J.; Haff, L.; Atlas, R.M. Detection of coliform bacteria in water by polymerase chain reaction and gene probes. Appl. Environ. Microbiol. 1990, 56, 307–314. [Google Scholar] [CrossRef] [Green Version]
- Maraccini, P.A.; Mattioli, M.C.M.; Sassoubre, L.M.; Cao, Y.; Griffith, J.F.; Ervin, J.S.; Van De Werfhorst, L.C.; Boehm, A.B. Solar Inactivation of Enterococci and Escherichia coli in Natural Waters: Effects of Water Absorbance and Depth. Environ. Sci. Technol. 2016, 50, 5068–5076. [Google Scholar] [CrossRef]
- Thayagan, S. Rapid Detection of Escherichia coli in Field Based Potable Water Applications. Master’s Thesis, Virginia Polytechnic Institute and State University, Blacksburg, VA, USA, 2018. [Google Scholar]
- Khamis, K.; Bradley, C.; Hannah, D.M. Understanding dissolved organic matter dynamics in urban catchments: Insights from in situ fluorescence sensor technology. Wiley Interdiscip. Rev. Water 2018, 5, e1259. [Google Scholar] [CrossRef] [Green Version]
- Kissinger, J.; Wilson, D. Portable fluorescence lifetime detection for chlorophyll analysis in marine environments. IEEE Sens. J. 2011, 11, 288–295. [Google Scholar] [CrossRef]
- Knapik, H.G.; Fernandes, C.V.S.; de Azevedo, J.C.R.; do Amaral Porto, M.F. Applicability of Fluorescence and Absorbance Spectroscopy to Estimate Organic Pollution in Rivers. Environ. Eng. Sci. 2014, 31, 653–663. [Google Scholar] [CrossRef]
- Zhu, G.; Yin, J.; Zhang, P.; Wang, X.; Fan, G.; Hua, B.; Ren, B.; Zheng, H.; Deng, B. DOM removal by flocculation process: Fluorescence excitation-emission matrix spectroscopy (EEMs) characterization. Desalination 2014, 346, 38–45. [Google Scholar] [CrossRef]
- Homola, J. Surface plasmon resonance sensors for detection of chemical and biological species. Chem. Rev. 2008, 108, 462–493. [Google Scholar] [CrossRef]
- Hesari, N.; Alum, A.; Elzein, M.; Abbaszadegan, M. A biosensor platform for rapid detection of E. coli in drinking water. Enzyme Microb. Technol. 2016, 83, 22–28. [Google Scholar] [CrossRef] [Green Version]
- Hesari, N.; Yilmazçoban, N.K.; Elzein, M.; Alum, A.; Abbaszadegan, M. A strategy to establish a quality assurance/quality control plan for the application of biosensors for the detection of E. coli in water. Biosensors 2017, 7, 3. [Google Scholar] [CrossRef] [Green Version]
- Wutor, V.C.; Togo, C.A.; Pletschke, B.I. Comparison of the direct enzyme assay method with the membrane filtration technique in the quantification and monitoring of microbial indicator organisms—Seasonal variations in the activities of coliforms and E. coli, temperature and pH. Water SA 2007, 33, 107–110. [Google Scholar] [CrossRef] [Green Version]
- Baudart, J.; Lebaron, P. Rapid detection of Escherichia coli in waters using fluorescent in situ hybridization, direct viable counting and solid phase cytometry. J. Appl. Microbiol. 2010, 109, 1253–1264. [Google Scholar] [CrossRef] [PubMed]
- Wutor, V.C.; Togo, C.A.; Pletschke, B.I. Suitability of total coliform β-d-galactosidase activity and CFU counts in monitoring faecal contamination of environmental water samples. Water SA 2009, 35, 85–88. [Google Scholar] [CrossRef] [Green Version]
- Kim, T.; Han, J.-I. Fast detection and quantification of Escherichia coli using the base principle of the microbial fuel cell. J. Environ. Manag. 2013, 130, 267–275. [Google Scholar] [CrossRef] [PubMed]
- Briciu-Burghina, C.; Heery, B.; Regan, F. Continuous fluorometric method for measuring β-glucuronidase activity: Comparative analysis of three fluorogenic substrates. Analyst 2015, 140, 5953–5964. [Google Scholar] [CrossRef] [PubMed]


© 2020 by the authors. Licensee MDPI, Basel, Switzerland. This article is an open access article distributed under the terms and conditions of the Creative Commons Attribution (CC BY) license (http://creativecommons.org/licenses/by/4.0/).
Share and Cite
Offenbaume, K.L.; Bertone, E.; Stewart, R.A. Monitoring Approaches for Faecal Indicator Bacteria in Water: Visioning a Remote Real-Time Sensor for E. coli and Enterococci. Water 2020, 12, 2591. https://0-doi-org.brum.beds.ac.uk/10.3390/w12092591
Offenbaume KL, Bertone E, Stewart RA. Monitoring Approaches for Faecal Indicator Bacteria in Water: Visioning a Remote Real-Time Sensor for E. coli and Enterococci. Water. 2020; 12(9):2591. https://0-doi-org.brum.beds.ac.uk/10.3390/w12092591
Chicago/Turabian StyleOffenbaume, Kane L., Edoardo Bertone, and Rodney A. Stewart. 2020. "Monitoring Approaches for Faecal Indicator Bacteria in Water: Visioning a Remote Real-Time Sensor for E. coli and Enterococci" Water 12, no. 9: 2591. https://0-doi-org.brum.beds.ac.uk/10.3390/w12092591