
PATs Behavior in Pressurized Irrigation Hydrants towards Sustainability
by
 , , , and
Modesto Pérez-Sánchez
1,* ,
,
João F. P. Fernandes
2 ,
,
P. J. Costa Branco
2 ,
,
P. Amparo López-Jiménez
1 and
and
Helena M. Ramos
3
1
Hydraulic and Environmental Engineering Department, Universitat Politècnica de València, 46022 Valencia, Spain
2
IDMEC, Instituto Superior Técnico, Universidade de Lisboa, 1049-001 Lisboa, Portugal
3
Civil Engineering, Architecture and Georesources Department, CERIS, Instituto Superior Técnico, Universidade de Lisboa, 1049-001 Lisboa, Portugal
*
Author to whom correspondence should be addressed.
Water 2021, 13(10), 1359; https://0-doi-org.brum.beds.ac.uk/10.3390/w13101359
Submission received: 6 April 2021
/
Revised: 7 May 2021
/
Accepted: 10 May 2021
/
Published: 13 May 2021
(This article belongs to the Special Issue Energy Recovery and Hybrid Solutions in the Water Sector)
Abstract
:Sustainability and efficiency in irrigation are essential in the management of the water–energy–food nexus to reach the Sustainable Development Goals in 2030. In irrigation systems, the reduction of energy consumption is required to improve the system efficiency and consequently the sustainability indicators of the water network. The use of pumps working as turbines (PATs) has been a feasible solution to recover the excess of energy where pressure reduction valves are installed. This research demonstrates the use of PATs under steady and unsteady conditions by analyzing the application in a real irrigation networks located in Vallada (Valencia, Spain). The study shows the possibility of recovering 44 MWh/year using PATs installed upstream of the irrigation hydrants. The real behavior of the PAT operation in a stand-alone recovery energy solution allowed analysis of the flow, head and efficiency variation as a function of the rotational speed, as well as the minimum capacitance to self-excite the generator and the resistive load of the electrical circuit. The PAT limit is examined in terms of the overpressure induced by a fast closure manoeuvre of hydrants, and the runaway conditions due to the disconnection from the electrical load.
1. Introduction
Sustainability has become more than an ideal. In reecent years, for the modern world, it has become more than a necessity. Consumed energy, in the global society, has reached unprecedented levels, reaching 1.62 × 10⁵ TWh [1]. This escalation is due mostly to population growth and over excessive fossil fuel exploitation [2]. Considering this high consumption, the use of sustainable decisions is crucial to improve the management of infrastructures to reach sustainable development goals (SDGs).
Moreover, a deeper understanding of the water–energy nexus has been considered essential towards quantifying the amount of energy that one can recover from a water system [3]. Studies through in the past have been deliberating new solutions and techniques to harness the dissipated energy in hydraulic systems, and even creating it through means of hydropower technology [4,5,6,7]. These strategies are the key to future agricultural growth, economic growth, and social wealth [8]. Not only do these solutions appeal to the imperative environmental standards, but also have economic advantages, which are displayed in these new scientific approaches [9]. The development of these energy recovery techniques will decisively allow managers to contribute to the improvment of the efficiency of water-energy management [10].
Hydropower generation, as a response to the stated issues, has been analyzed over the past few years [11]. There are several conditions in which hydropower can be applied. Large, small, micro and pico hydropower solutions are used according to the different settings they are inserted into [12]. Focusing on the latter-mentioned cases, pumps operating as turbines (PATs) are micro and pico hydropower solutions that have been used in pressurized water networks as a sustainable and efficient energy recovery technology in water distribution networks [9,13,14,15].
When water-energy management is focused on remote areas, the possibility of using micro-hydropower to replace diesel generators occurs. Pumps working as turbines normally engage in using the induction machine in the motor regime of a pump, operating as the generator regime to convert the hydraulic power into electrical power [16]. Consequently, it is of the utmost importance to know about hydraulic-electric installation, as it can be a grid-connected or a stand-alone operation. In the first case, working “On-Grid”, the electrical grid supplies a magnetizing current that establishes a rotating magnetic field. When the induction machine is driven above the synchronous speed, the slip becomes negative (rotor speed > speed of the rotating field), torque is provided to the rotor, and the machine operates as a generator, powering back the grid. In the latter case and in the “Off-Grid” solution, the system will require a capacitor bank to provide the magnetizing current. The capacitors will act as the only external source that can feed the reactive power, enabling the induction generator to operate [17].
This technology cannot be omitted in irrigation water management, since the use of the water resource in irrigation networks is above 70% of the worldwide consumed water each year [18]. Therefore, energy improvement is a new challenge in water systems, which should be reached by considering the reduction of the energy footprint in water systems [19]. In pressurized systems with an excess of hydraulic energy, the installation of energy recovery solutions can be a valuable key to avoid energy dissipation in pressure reduction valves.
This paper presents a case study on the hydrant behaviour developed in the irrigation network of Vallada (Valencia, Spain). The study is based on developing a model simulated using EPANET v2.0 software and considers the irrigation need patterns. This model was calibrated according to real flow measures in the mainline and the consumed volume in the irrigation points. This model was considered due to its high recovery potential according to network topology. This head variability enables us to choose a real hydrant, in which the flow range and the recoverable heads are inside of the operation range of the PAT available. This allowed us to implement, test and, most importantly, to verify in real conditions the advantages and possible drawbacks of micro-hydropower implementation based on PATs in pressurized irrigation, with the flow control in hydrants. On this line, an experimental campaign was proposed to evaluate the PAT systems in hydraulic hydrant conditions both with steady and unsteady flow. The irrigation system was evaluated considering a PAT for different flow regimes and operating conditions. PAT’s steady-state and transient analyses were focused on deeply experimental research and modelling simulations. The PAT analyzed was tested both on a stand-alone regime and a grid-connected regime.
2. Methodology
Hydropower is an environmentally friendly and sustainable source of electricity/power that converts the gravitational potential energy of water into electrical energy. It produces electrical energy and simultaneously the water is available for irrigation. The present research shows the developed methodology using an irrigation facility, which was replicated in the hydraulic lab of Instituto Superior Técnico, at the University of Lisbon. This research was focused on three different models: analytical concept, modelling simulation and an experimental model.
2.1. Analytical Concept for Irrigation Hydrant
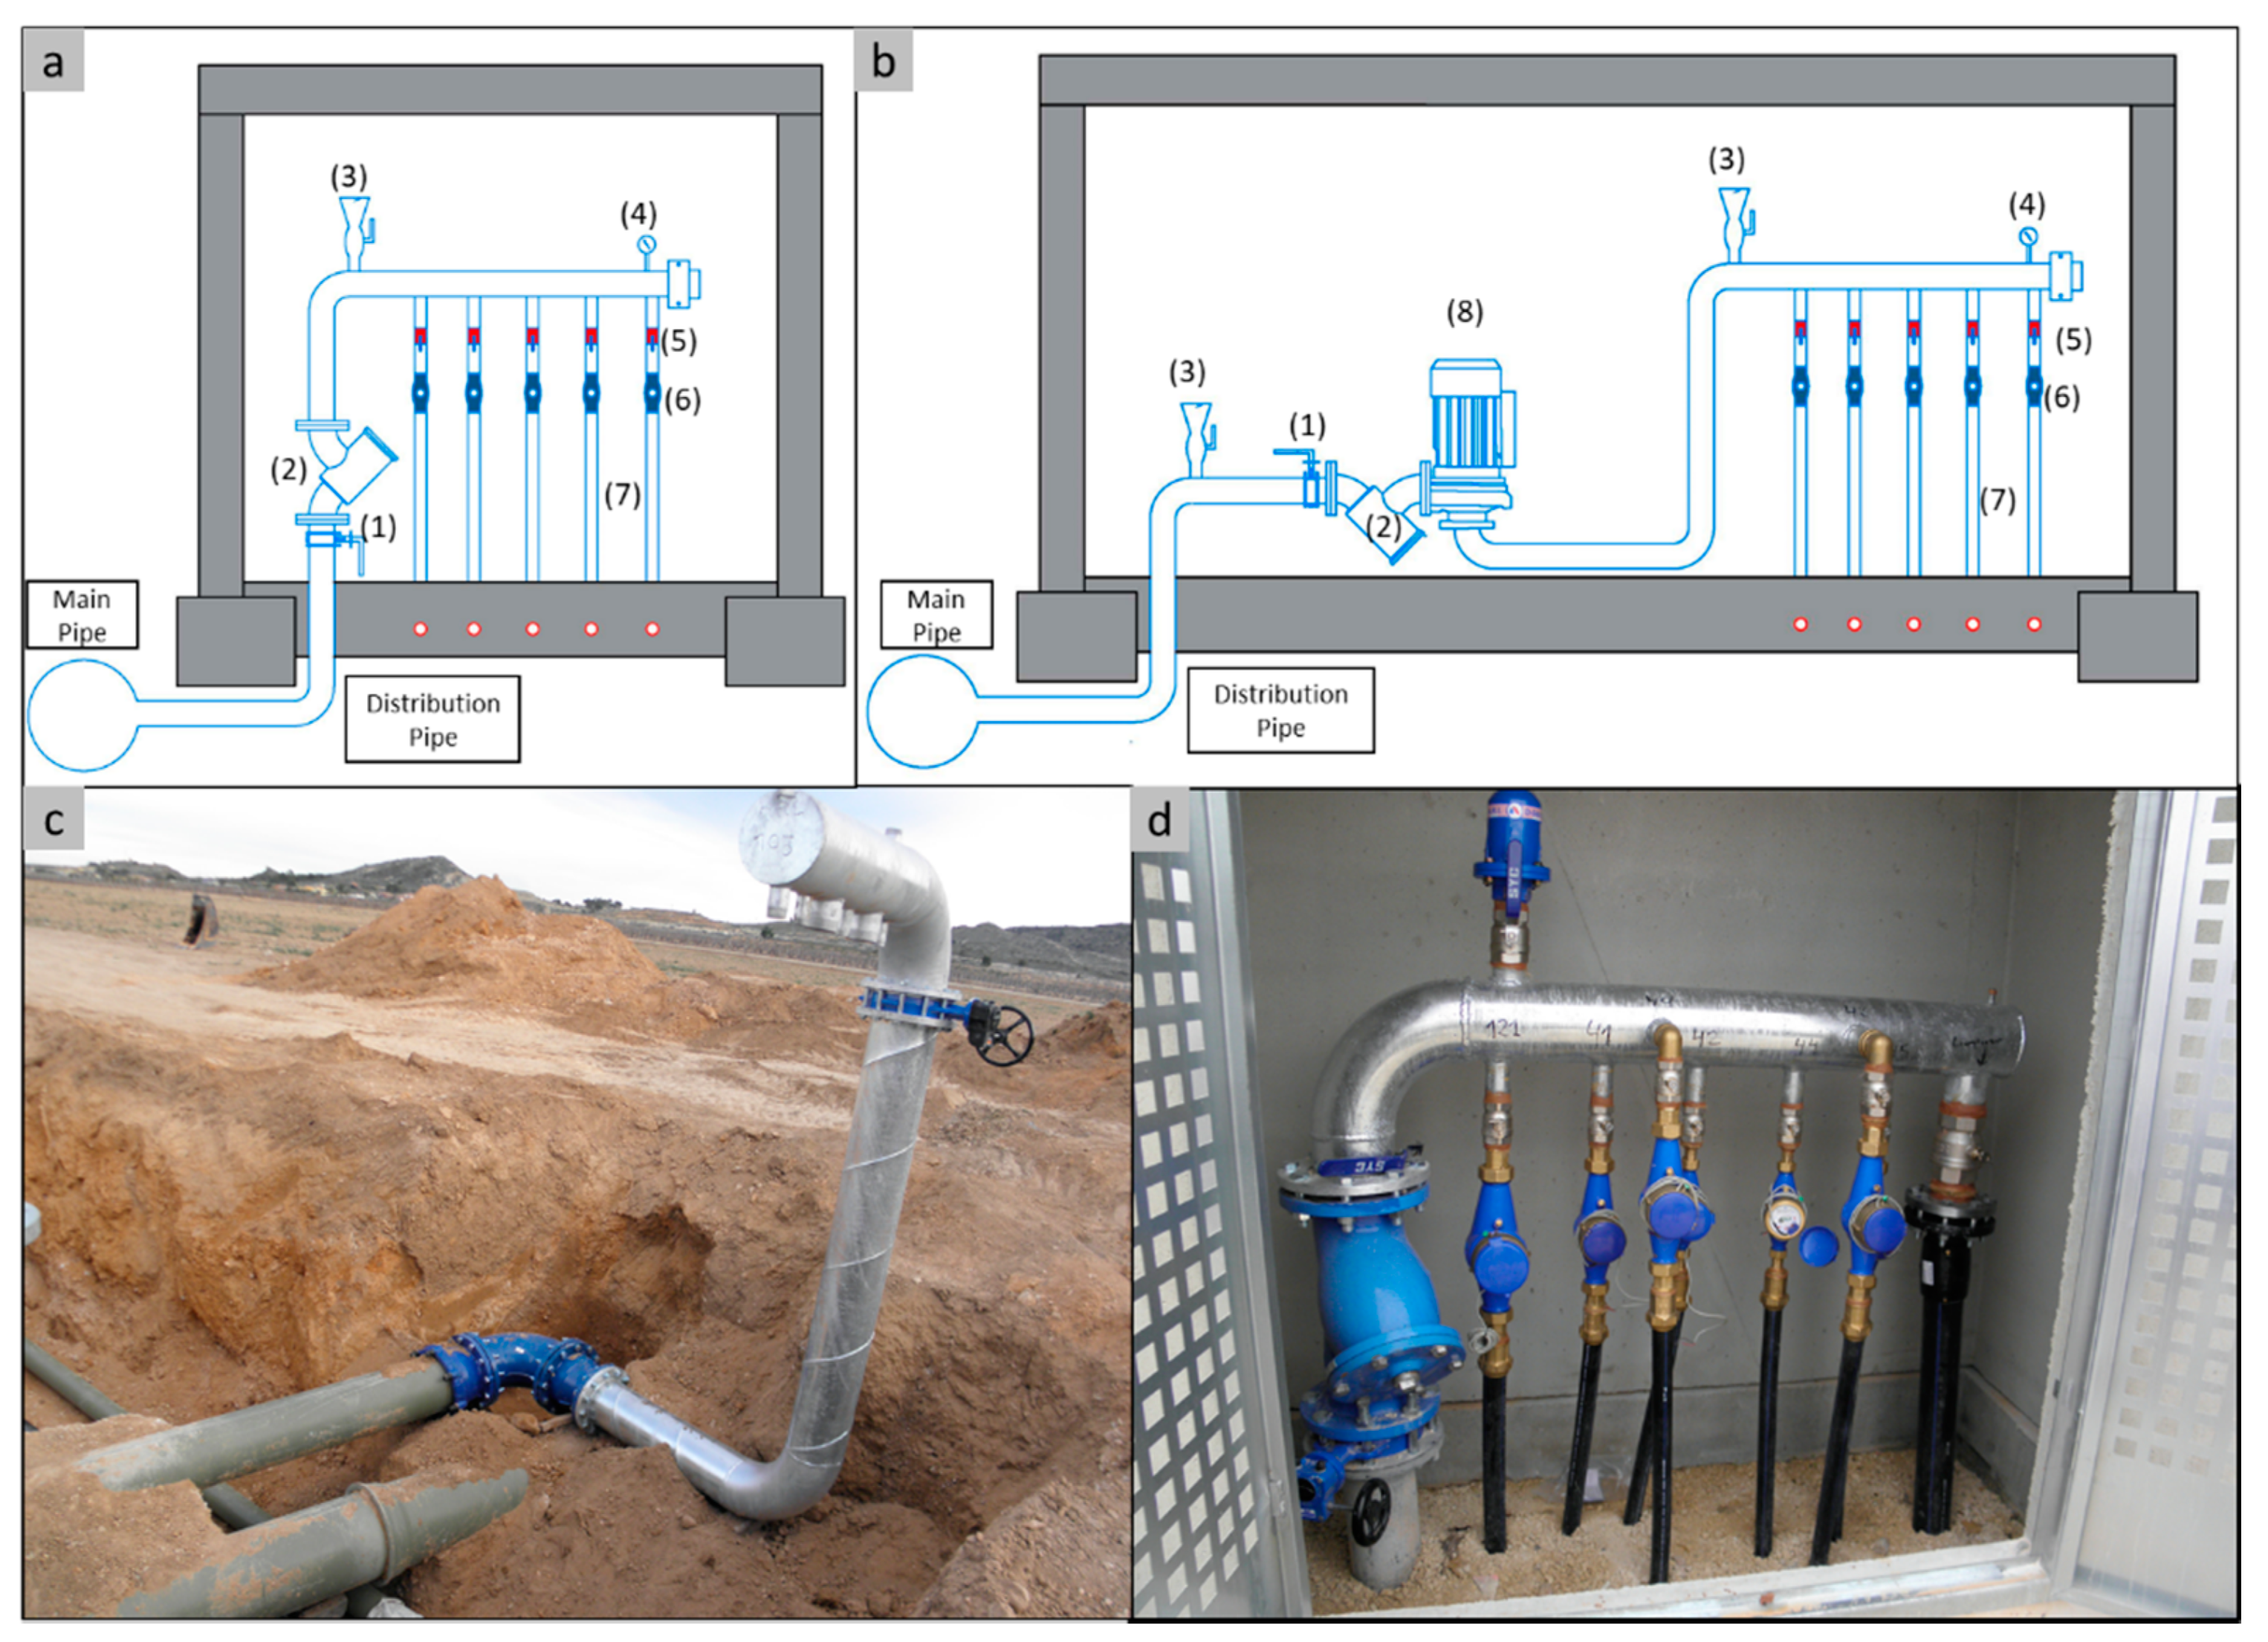
Irrigation hydrants are used as a farmers’ outlet by connecting the closed pressurized pipeline networks to drip or sprinkler irrigation systems. As shown in Figure 1, they gather in one compact body both a valve and a meter which is able to calculate and indicate the volumes of water consumed. Currently, the irrigation distribution networks supply different multi-user hydrants to concentrate the control and maneuver elements (e.g., water counter and cut valves) to ease the management of the water system. Figure 1a shows the scheme of a typical irrigation hydrant composed of one pipe that is connected to the branch line of the network. The feeding pipe connects the water network system with the hydrant. The following elements are installed as indicated: isolation valve (1); strainer (2); air valve (3); manometer (4); and a set of pipes to connect to irrigation points (7). Each tap is composed of an isolation ball valve (5) and a water counter (6) to measure the irrigated volume. Two photos of the hydrant located in our case-study irrigation network located in Vallada (Valencia, Spain) can be observed in Figure 1c,d.
Generally, the pressure in irrigation hydrants is higher than the minimum required to guarantee the service to the users at the furthest point of the irrigation network. This minimum pressure is between 25 and 30 m w.c., usually in drop irrigation systems. When the irrigation uses sprinklers, the minimum pressure in the sprinkler is 40 m w.c. Therefore, except in the hydrant supplied to the most unfavorable irrigation point in the network, all hydrants allow recovery of energy since, if this pressure excess is not recovered, the users have to dissipate it in pressure reduction valves in their consumption points. In this context, Figure 1b shows the proposed modification in the hydrant where a hydropower PAT-based system is now installed (8), modifying the disposition of the pipe collector to improve the sustainability and the efficiency of these water systems.
2.2. Mathematical Modeling
The mathematical model is divided into two different steps: (i) it develops the energy balance according to the estimation of the recoverable head as a function of flow in each irrigation line or point of the water network; (ii) it considers the analysis of the recovery system under steady and transient flow conditions. The following equations show the estimation of the energy balance defined by from (1) to (7):
where is the total energy provided to the water network (kWh/year); is the total friction energy (kWh/year); is the total required energy to irrigate all consumption points (kWh/year); is the total theoretical recovered energy (kWh/year); is the total unrecoverable energy (kWh/year); is the potential energy in each irrigation point when the consumption in the network is null (kWh); is the friction energy dissipated until the irrigation point (kWh); is the required energy at the consumption point to ensure the irrigation (kWh); is the available energy for recovery in a hydrant or line (kWh); is the maximum theoretical recoverable energy in an irrigation point, hydrant or line of the network, ensuring at downstream the minimum pressure of irrigation (kWh); is the energy in a hydrant or line on the network that cannot be recovered (kWh); is the flow by a line (m3/s); is the geometry level above the datum level (m); is the the free water surface of the reservoir (m); is the service pressure in any point of the network when consumption exists (m w.c.); is the minimum pressure of service of an irrigation point required to ensure the irrigation water evenly; is the value of head at the irrigation point, hydrant or line (m w.c.). This head is obtained as ; and is the time interval (s).
When the pair of data (Q, H) over time is known in the irrigation network, the definition of the recovery point should be defined. In a normal situation, the maximization of energy recovery should be developed according to the maximization strategies [2,3,20]. However, the difficulty in the analysis of energy recovery, as well as its feasibility inside the irrigation network, resides in the need to adapt the operation of the machine to variable flow in the network. This flow variation demands the application of a variable operational system (VOS) [11], in which the machine has to operate isolated from the grid, resulting in the need to install a Self-Excited Inductor Generator (SEIG) system based on capacitor banks [16].
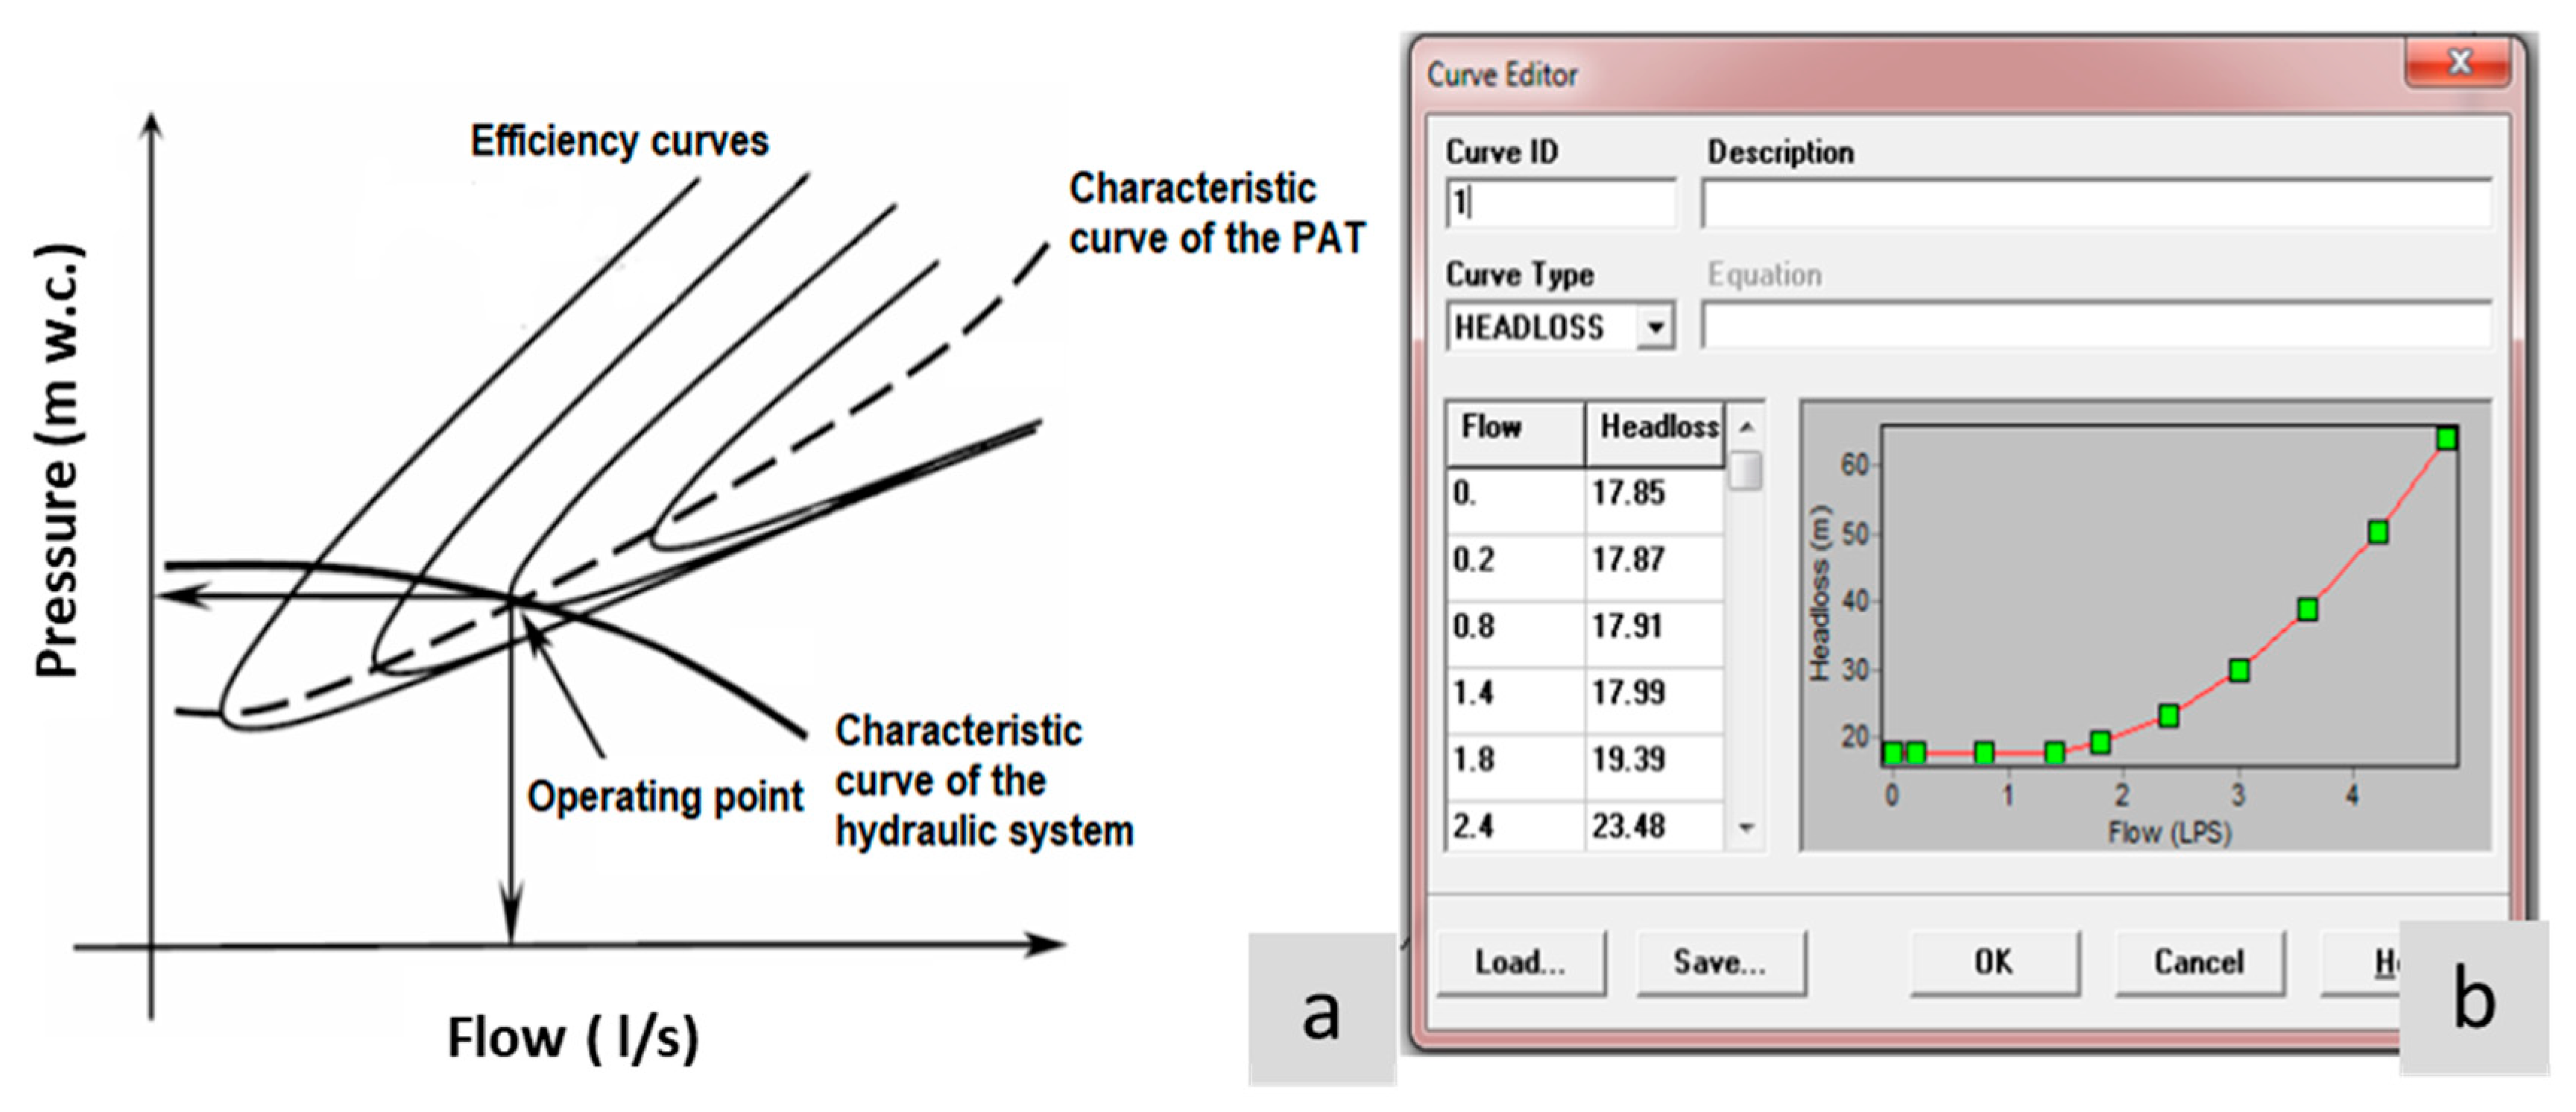
In the present research, the objective is to show the system behaviour and not the energy maximization already studied in [21]. The working point for this case is obtained by intersecting the PAT hill diagram with the installation curve based on the EPANET model simulation (Figure 2a). Therefore, in this case, the selected recovery point was designed in the hydraulic system of the lab. In the EPANET model, the Pressure Reduction Valves (PRV) was replaced by Generic Valves (VG), and it was defined as the head loss curve, which corresponds to the characteristic curve of the turbine (Figure 2b).
Once the hydrant selected according to the PAT characteristics, mathematical models were developed to simulate the flow regimes in steady and unsteady conditions. To develop the simulations, EPANET v2.0 and Allievi® v1.04 software [21] were used. The models were previously calibrated and validated [22].
2.3. Experimental Model
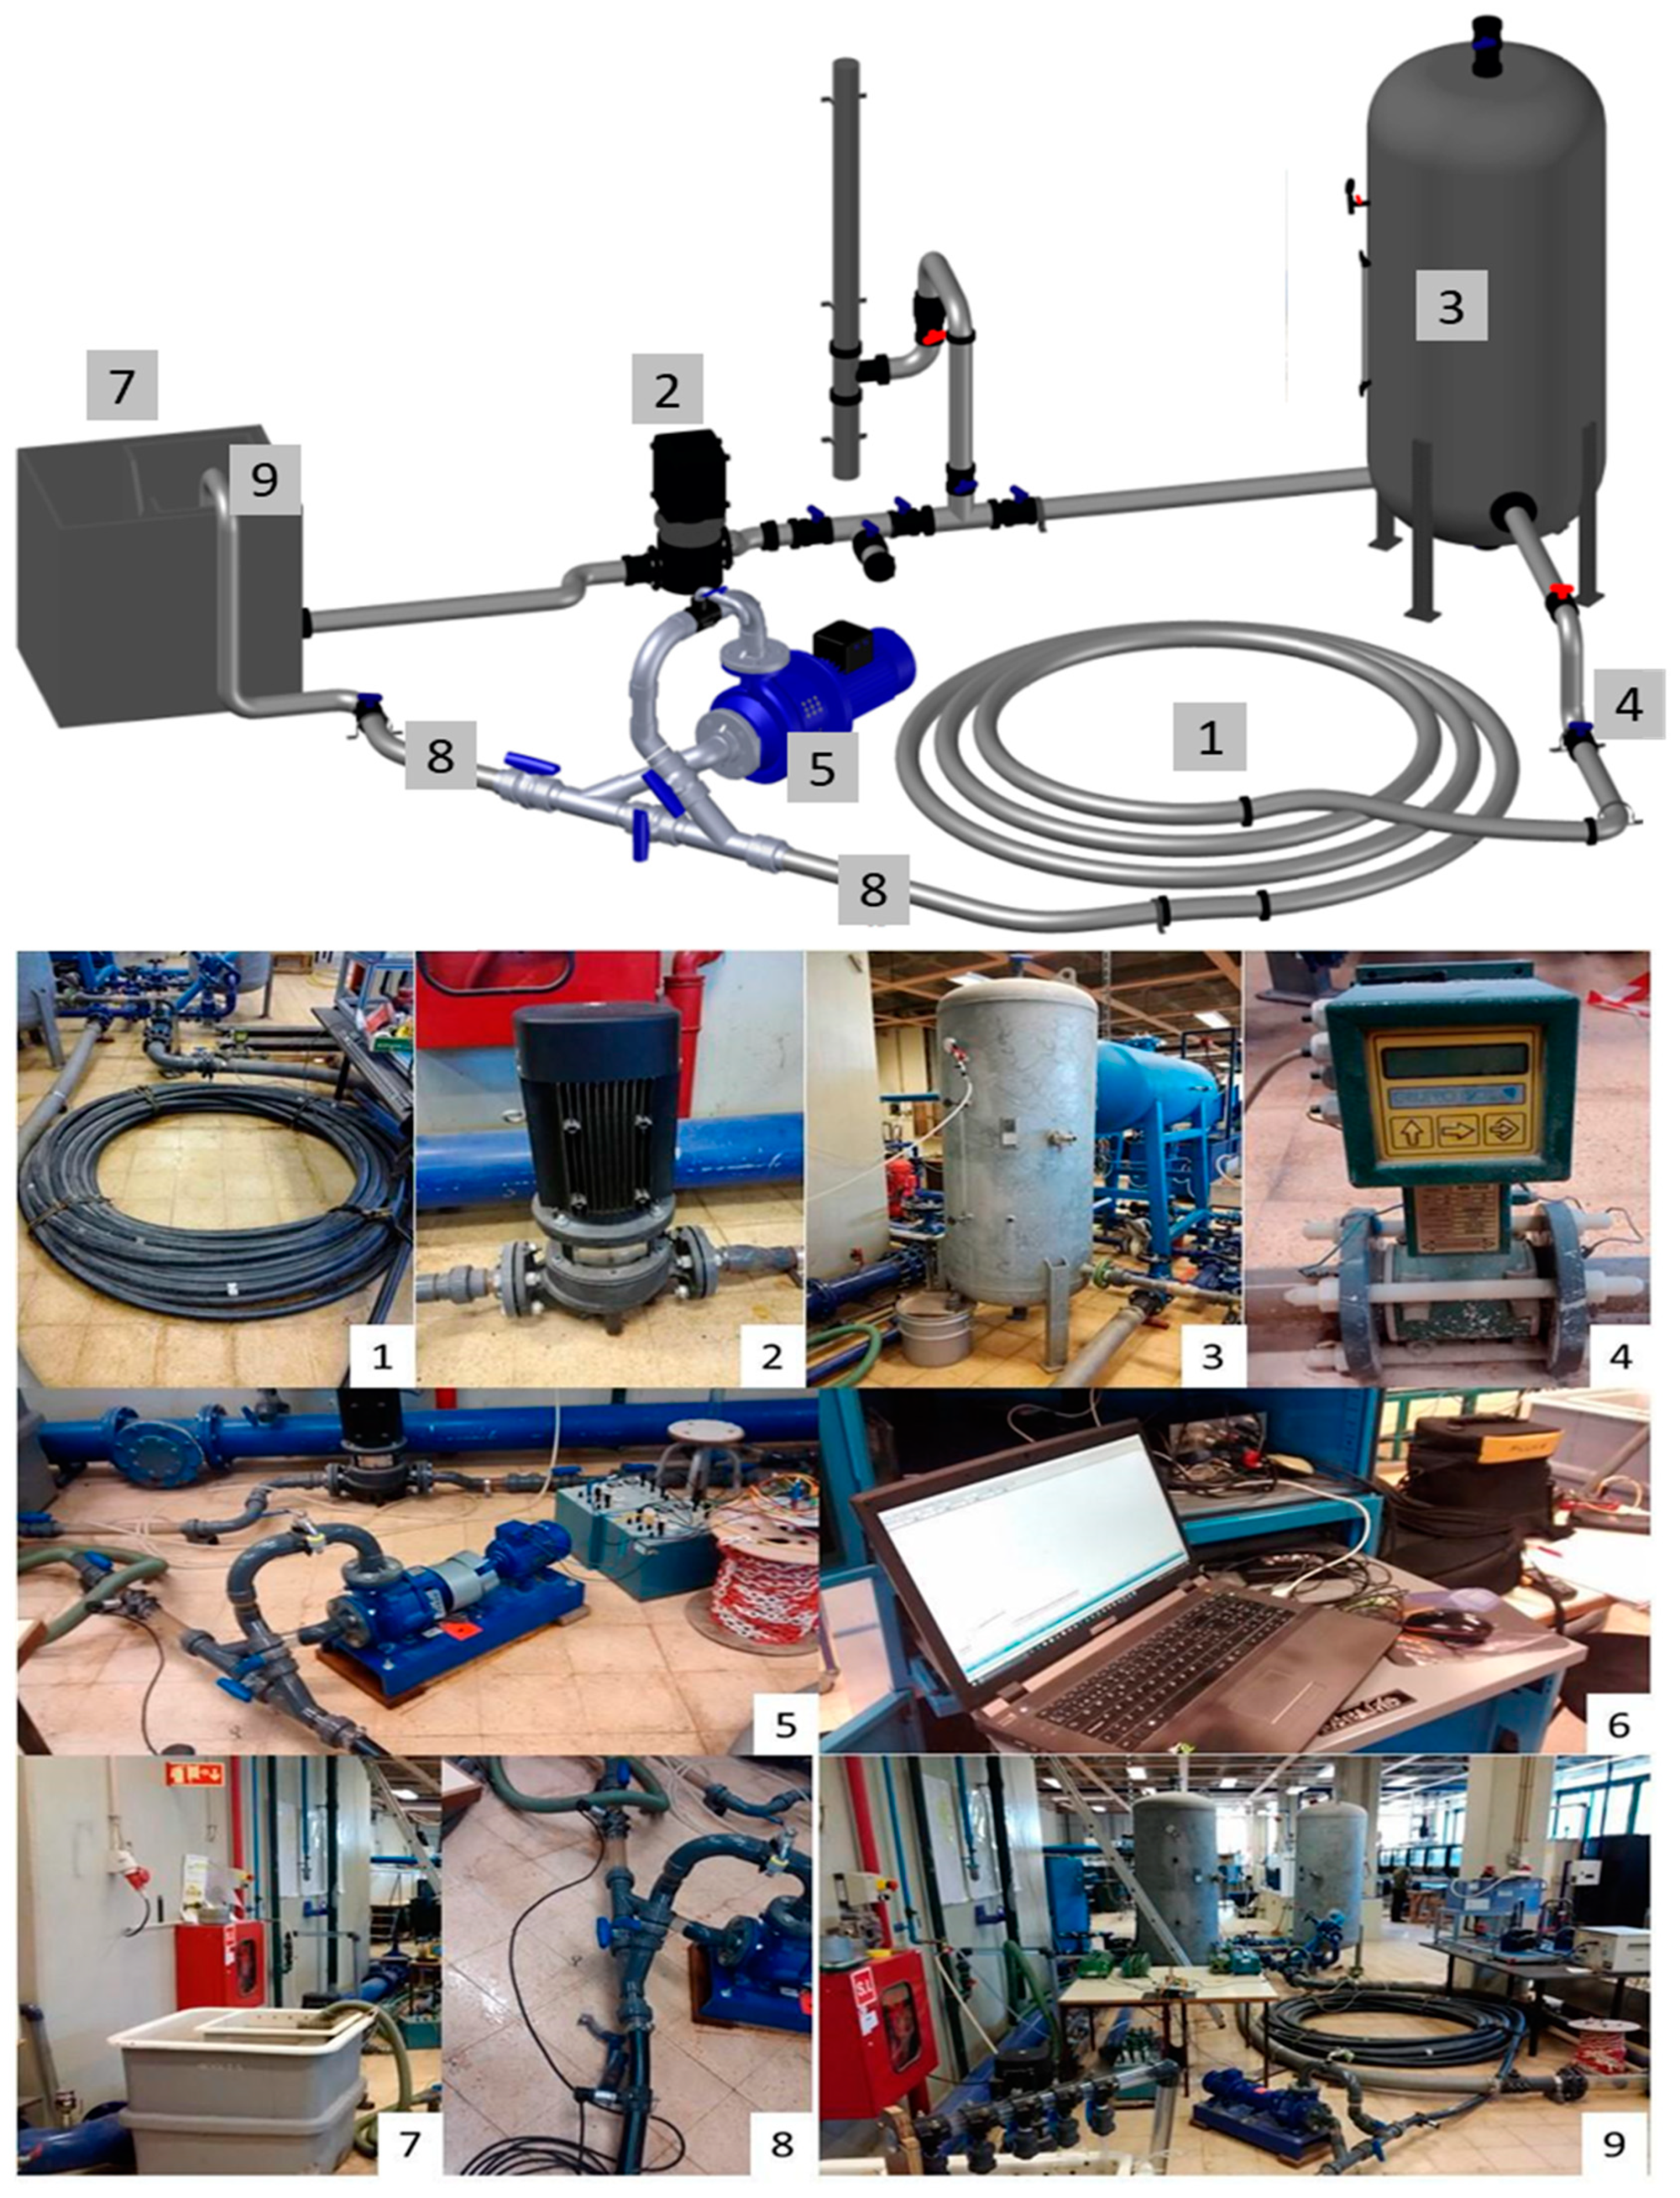
To analyze the behaviour of the hydropower system, an experimental PAT pilot station was assembled in the hydraulic lab of Civil Engineering Research and Innovation for Sustainability (CERIS), Instituto Superior Técnico, at the University of Lisbon. The hydraulic scheme of the lab is shown in Figure 3, in which a hydrant with five outlets corresponding to five farmer consumption points was established.
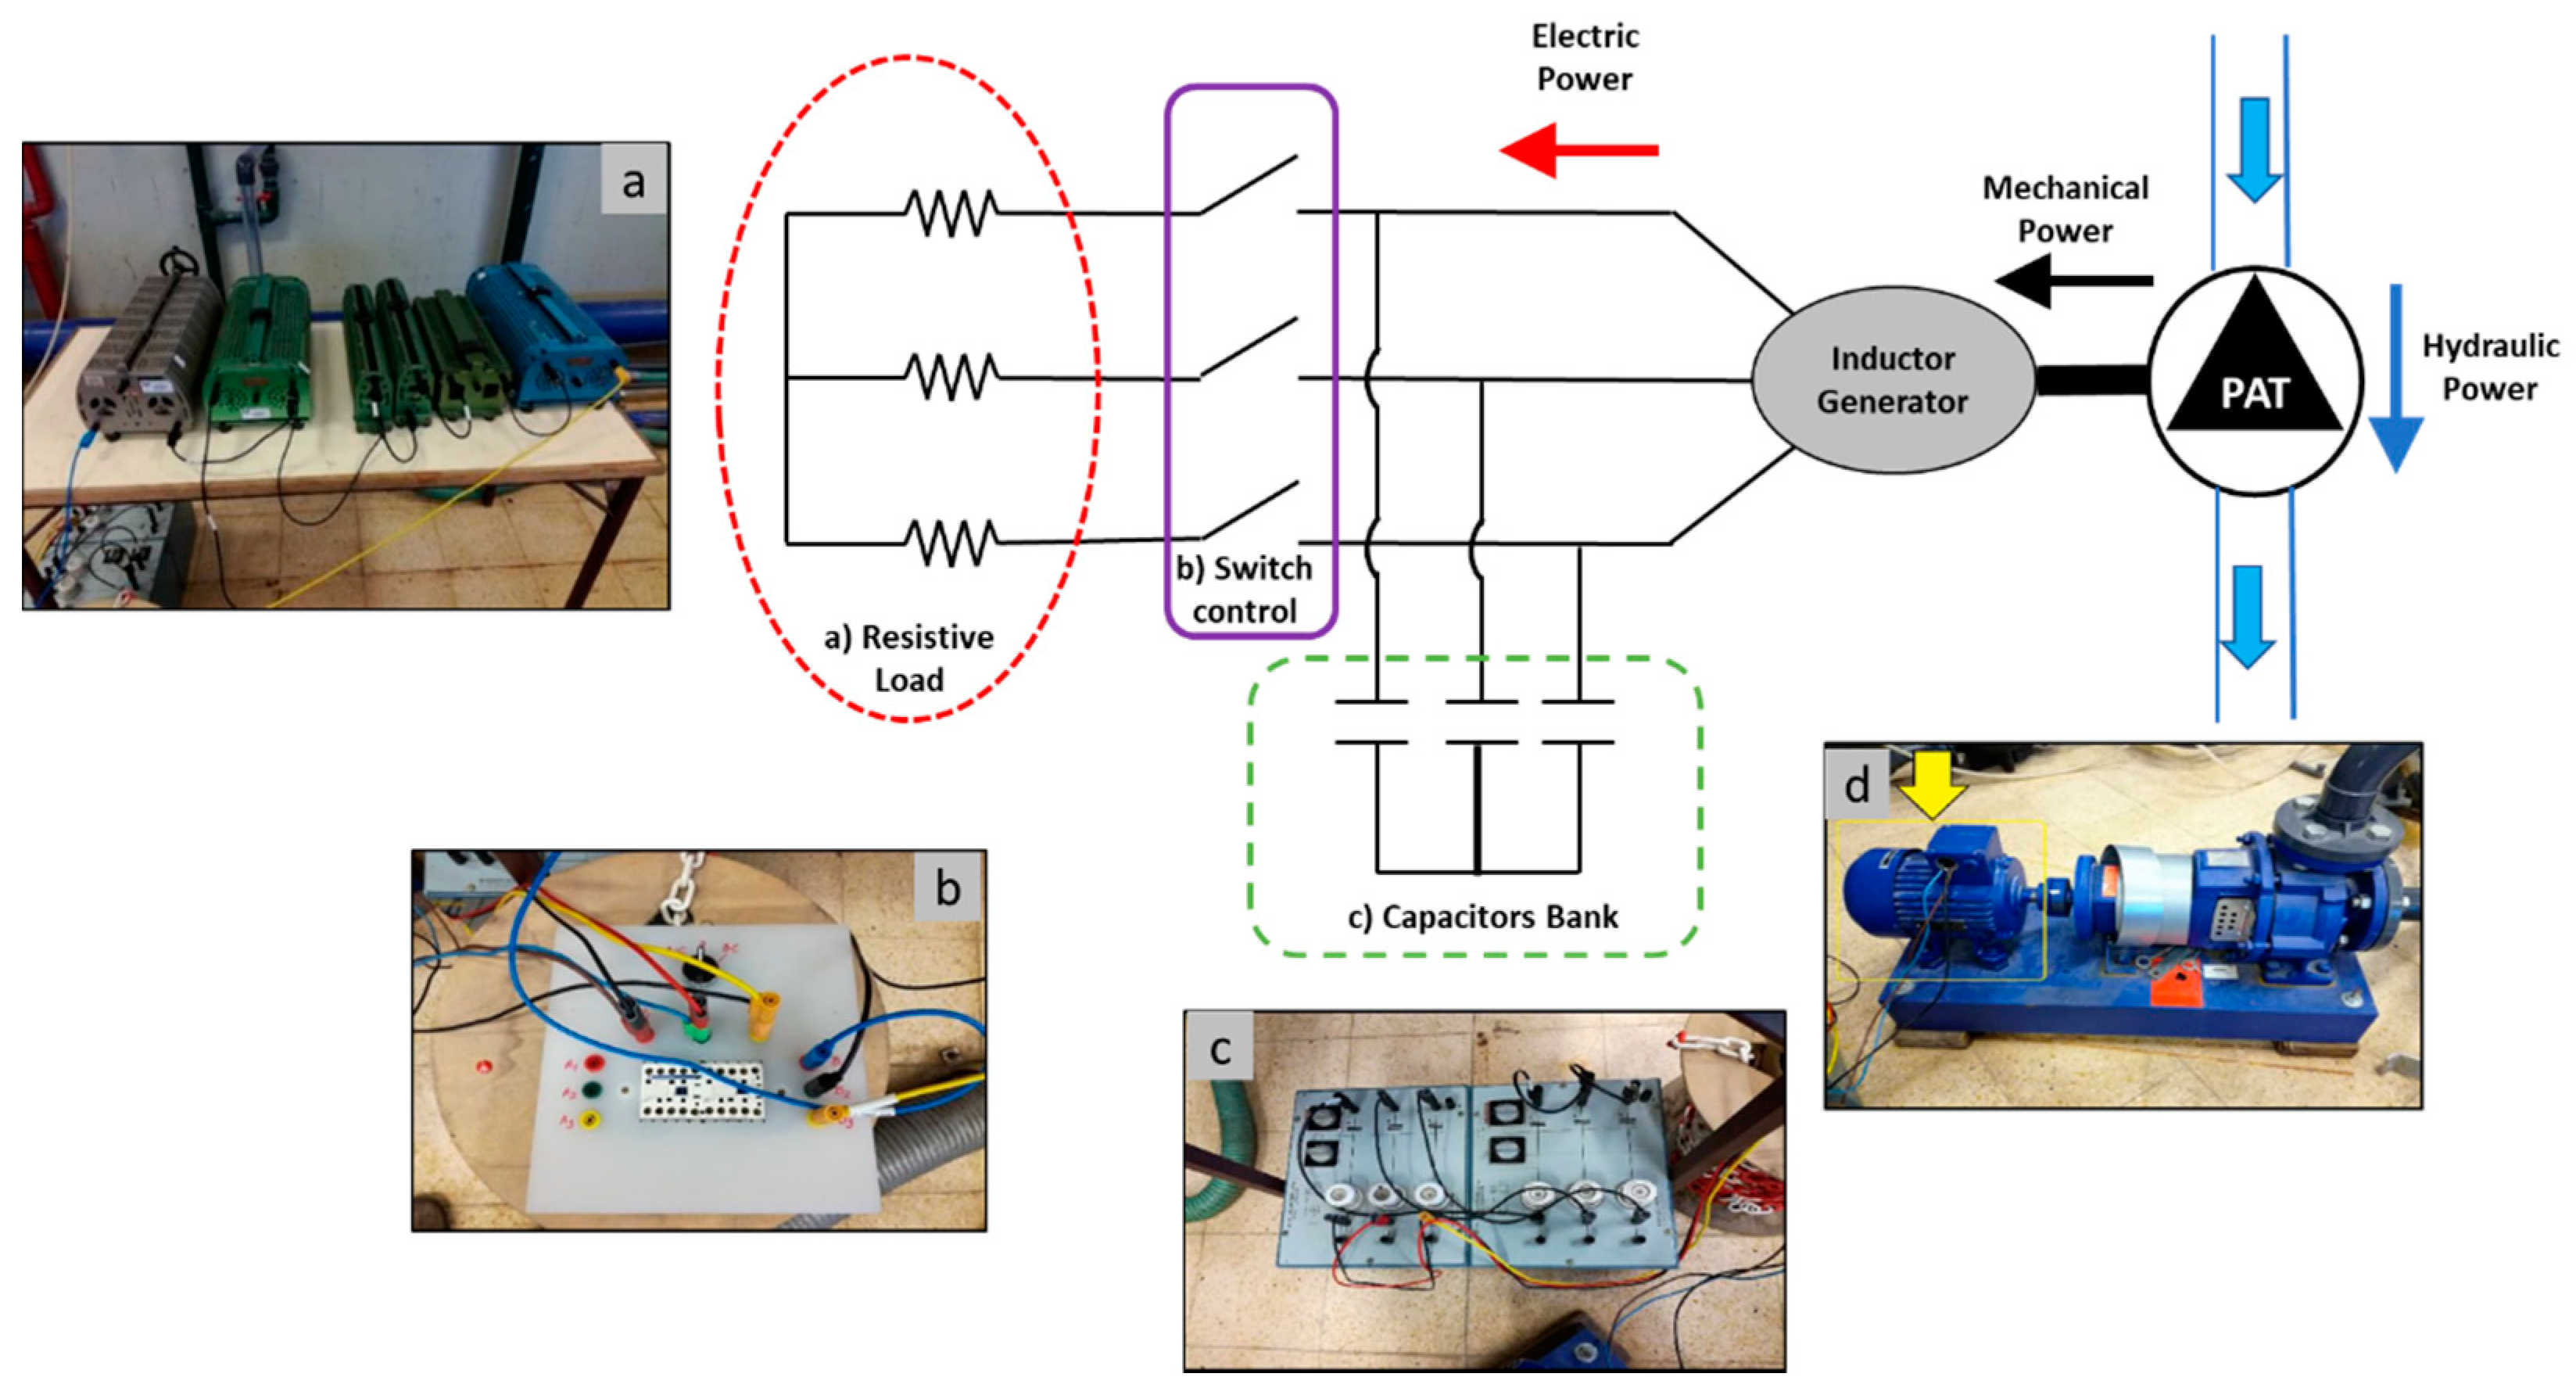
Hydropower is a stand-alone solution in irrigation networks, and it is usually used when there is no grid near the hydrants. However, the irregularity in the electrical production (i.e., the electrical power is only generated when the flow circulates) needs to be analysed and a SEIG needs to be established, as described in Figure 4. Hence, the off-grid connection aims to simulate a stand-alone power generation system that could fulfil a certain energy load or feed an energy storage device. For this type of self-behaviour, the use of a bank of variable capacitors is necessary to provide the reactive power required by the generator to start in operation. The resistance load is composed of adjustable resistors, which, in this case, assumed a constant value of 175 Ohm in each phase. The capacitors’ function is to excite the generator with reactive power to allow the SEIG energy conversion, as shown in Figure 4.
Several tests were performed to obtain the global efficiency of the system, for different hydraulic and electrical conditions. The system operation measurements should be referred to as hydraulic and electrical parameters. The hydraulic ones are the flow (Q) measured by the electromagnetic flowmeter and the pressure (p that was checked upstream and downstream of the PAT measured by pressure transducers that were connected to a data acquisition system, using the picoscope software (Figure 3)). The measured electrical-mechanical parameters were: the rotational speed of the shaft that connects the PAT to the generator, measured by a tachometer; the current; the voltage; the active power; and the power factor. All terms corresponded to the generator were measured using a Fluke wattmeter (Lisabon, Portugal).
The development of experimental tests allowed a comparison of the available hydraulic power with the output power of the machine. Therefore, it was possible to evaluate the global efficiency of the system and find the optimal operation point of this system. The trials for off-grid were performed using the following procedures: (i) all hydrants open (maximum flow); (ii) using the switch, the generator was connected to the capacitors bank to start its excitation process; (iii) when the generator was excited, the electric load was added, and the electrical output parameters were registered; (iv) considering the same hydrant opening degree, the efficiency was checked for different capacitor’s values; (v) after testing all the excitation values, partial closure of the hydrant was done, and all procedures were repeated.
2.4. Unsteady Flow Characterization
The unsteady flow in pressurized systems can be defined by the following differential Equations (8) and (9) [23]:
The developed research by [24,25,26] developed the first approach to analyze the unsteady flow, when PAT systems were operated. This analysis was based on a mathematical transformation of the available data for the pumps into characteristic curves using the adimensional numbers h (H/HBEP), q (Q/QBEP), and n (N/NBEP).
The variables are defined according to the following equations:
where Q is the flow in L/s; is the flow for the best efficiency point (BEP) in L/s; H is the recovered head in m w.c.; is the recovered head for the best efficiency point (BEP) in m w.c.; N is the rotational speed of the machine in rpm; and is the nominal rotational speed of the machine (rpm) in which the BEP is reached. The BEP values for the tested machine are 3.36 L/s and 4.40 m w.c. considering a nominal rotational speed equal to 1020 rpm.
This mathematical transformation facilitated the understanding of the behaviour of the dynamic pump as a turbine under unsteady conditions [26]. This research analyzes the behaviour of the PAT systems, analyzing the overpressures and underpressures when there are flow changes in the hydrant.
3. Results and Discussion of the Case Study
3.1. Irrigation Network and Selected Hydrant
To show the possibility of installing hydropower systems in irrigation hydrants, an irrigation network was used (Figure 5a). This irrigation network was located in Vallada (Valencia, Spain). This water distribution network supplies 290 ha in which the main crop is citrus. The water system was fed by an upstream reservoir that ensured a minimum pressure of 30 m w.c. The diameters of pipes were between 125 and 500 mm. The material of pipes was iron ductile. When the diameters were between 300 and 500 mm, the material was asbestos cement. The network supplied 74 different irrigation hydrants, which were connected to 350 irrigation points. Each hydrant was connected between one and ten consumption points. This hourly model was simulated in EPANET v2.0 software. The model has been run each day for one year, assigning different consumption patterns according to irrigation needs [21]. The model was calibrated based on the flowmeter in the mainline, achieving good accuracy indexes [22].
3.2. Model Simulation
This manuscript describes the hydrant chosen to develop an energy balance. The characteristics of the selected irrigation hydrant were compared with the available PAT tested since the main objective of the research was to show the behaviour of the hydraulic machine under real irrigation conditions. The selected hydrant was H126, which presents the flow values between 0.35 and 4.98 L/s and the recoverable head between 5 and 7 m w.c. (Figure 5b,c) These values are according to available PAT in the lab because to ease the experimental campaign, there must be the stimulation of an irrigation hydrant (H126) in the farm. The ERT of the hydrant is 0.13 MWh/year (Table 1), the consumed volume is 10,270 m3 and the operation time is 951 h, with average values of flow and head around 2.94 L/s and 5.15 m w.c., respectively. Table 1 shows the value for the irrigation hydrants, which present higher recovery values, showing the implication of installing recovery energy devices in these points. These results were obtained by developing the simulation of the network using the calibrated hydraulic simulator in Epanet, considering the variation of the demand every five minutes (Table 1). If all hydrants were considered to install recovery systems, the recoverable energy will be 44 MWh/year.
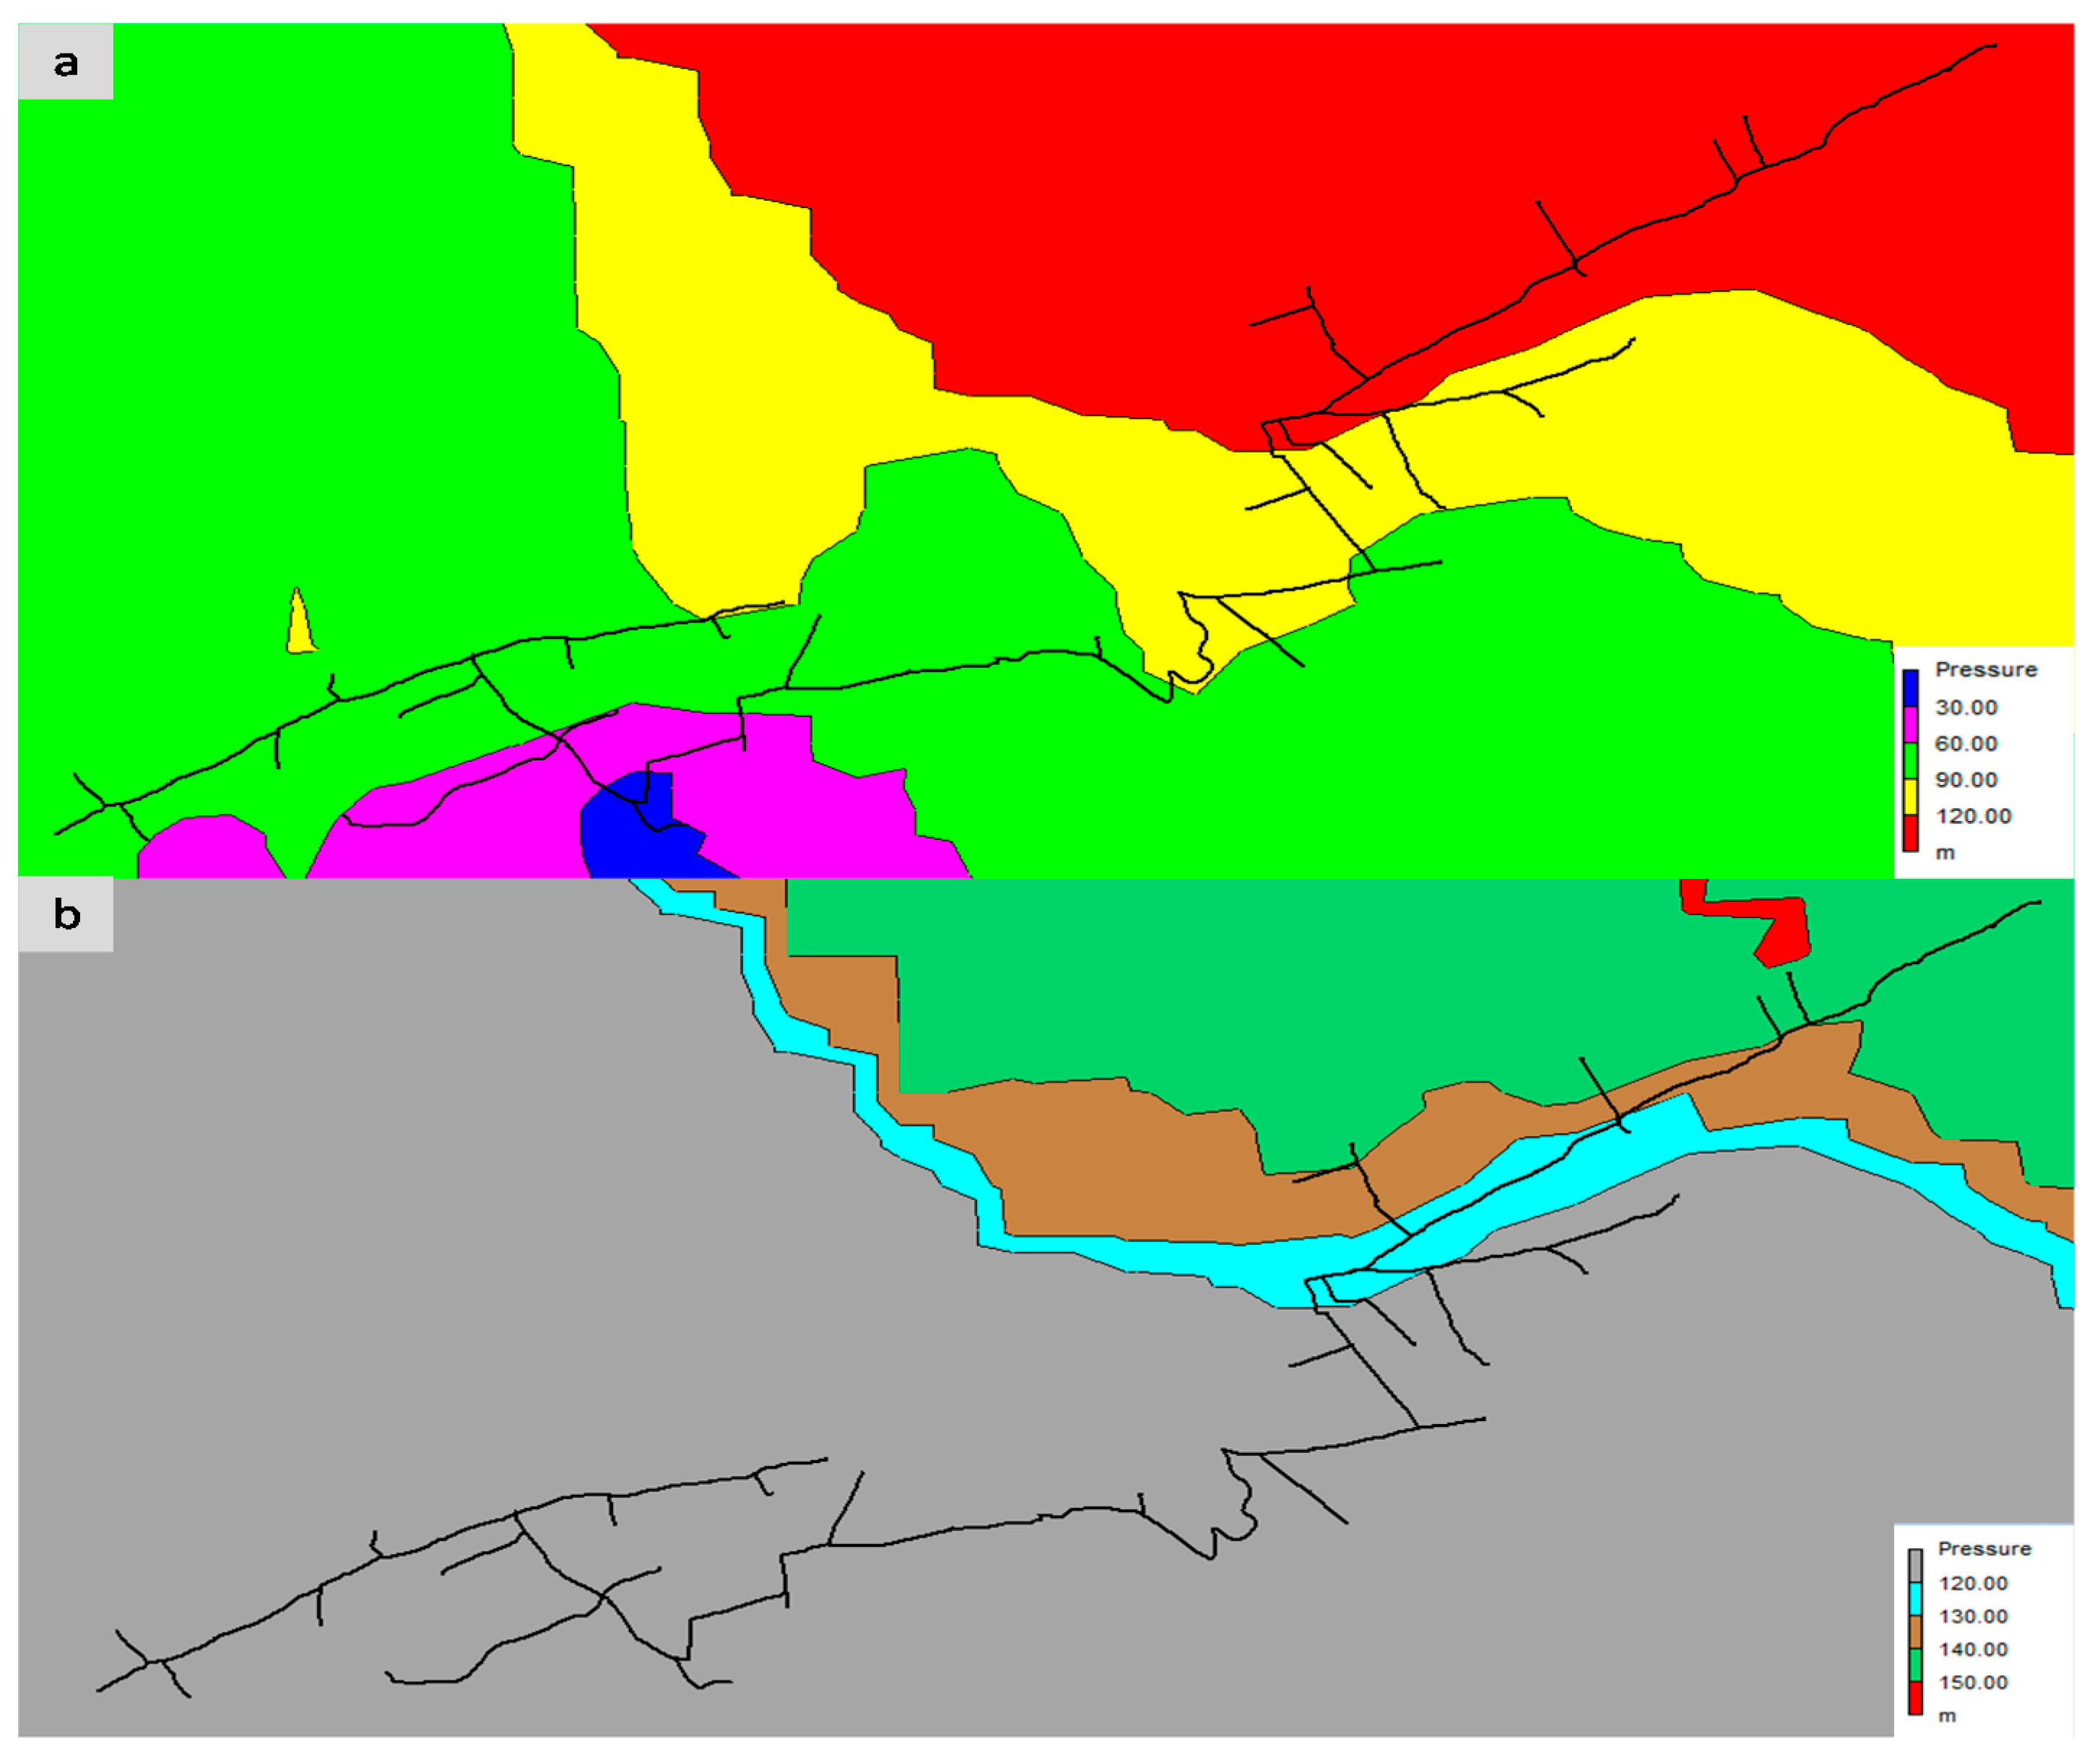
To show the high potential to install PATs in this irrigation network, a color pressure contor was drawn, as shown in Figure 6. The blue area shows the region where there is no possibility to install recovery systems because the pressure is the minimum to guarantee the correct service pressure, which was 30 m w.c. in this system. Out of this blue area, hydropower systems can be installed in all hydrants. Different colors were shown in Figure 6a,b, reaching pressures above 120 m w.c. These high-pressure points can be taken advantage of for energy recovery, resulting in energy values above 1 MWh/year.
Figure 6 shows the availability for energy recovery, this being an opportunity to increase the system efficiency. The next subsection shows the experimental tests developed using the selected hydrant (H126) characteristics.
3.3. PAT Pilot Station: Experimental Tests
The used PAT machine (KSB, Lisbon, Portugal) is Etanorm 32-125 KSB working in turbine mode with a specific speed of 51 rpm (m, kW). The specific speed is defined by the following Equation:
where is the specific speed of the machine in (m, kW); N is the rotational speed of the machine in rpm; P is the power in the shaft, which is measured in (kW); and H is the recovered head in (m w.c.).
Figure 7 shows the experimental tests developed for different operational conditions. In each test, the ratio of the head (h), flow (q), and the rotational speed (n) are obtained.
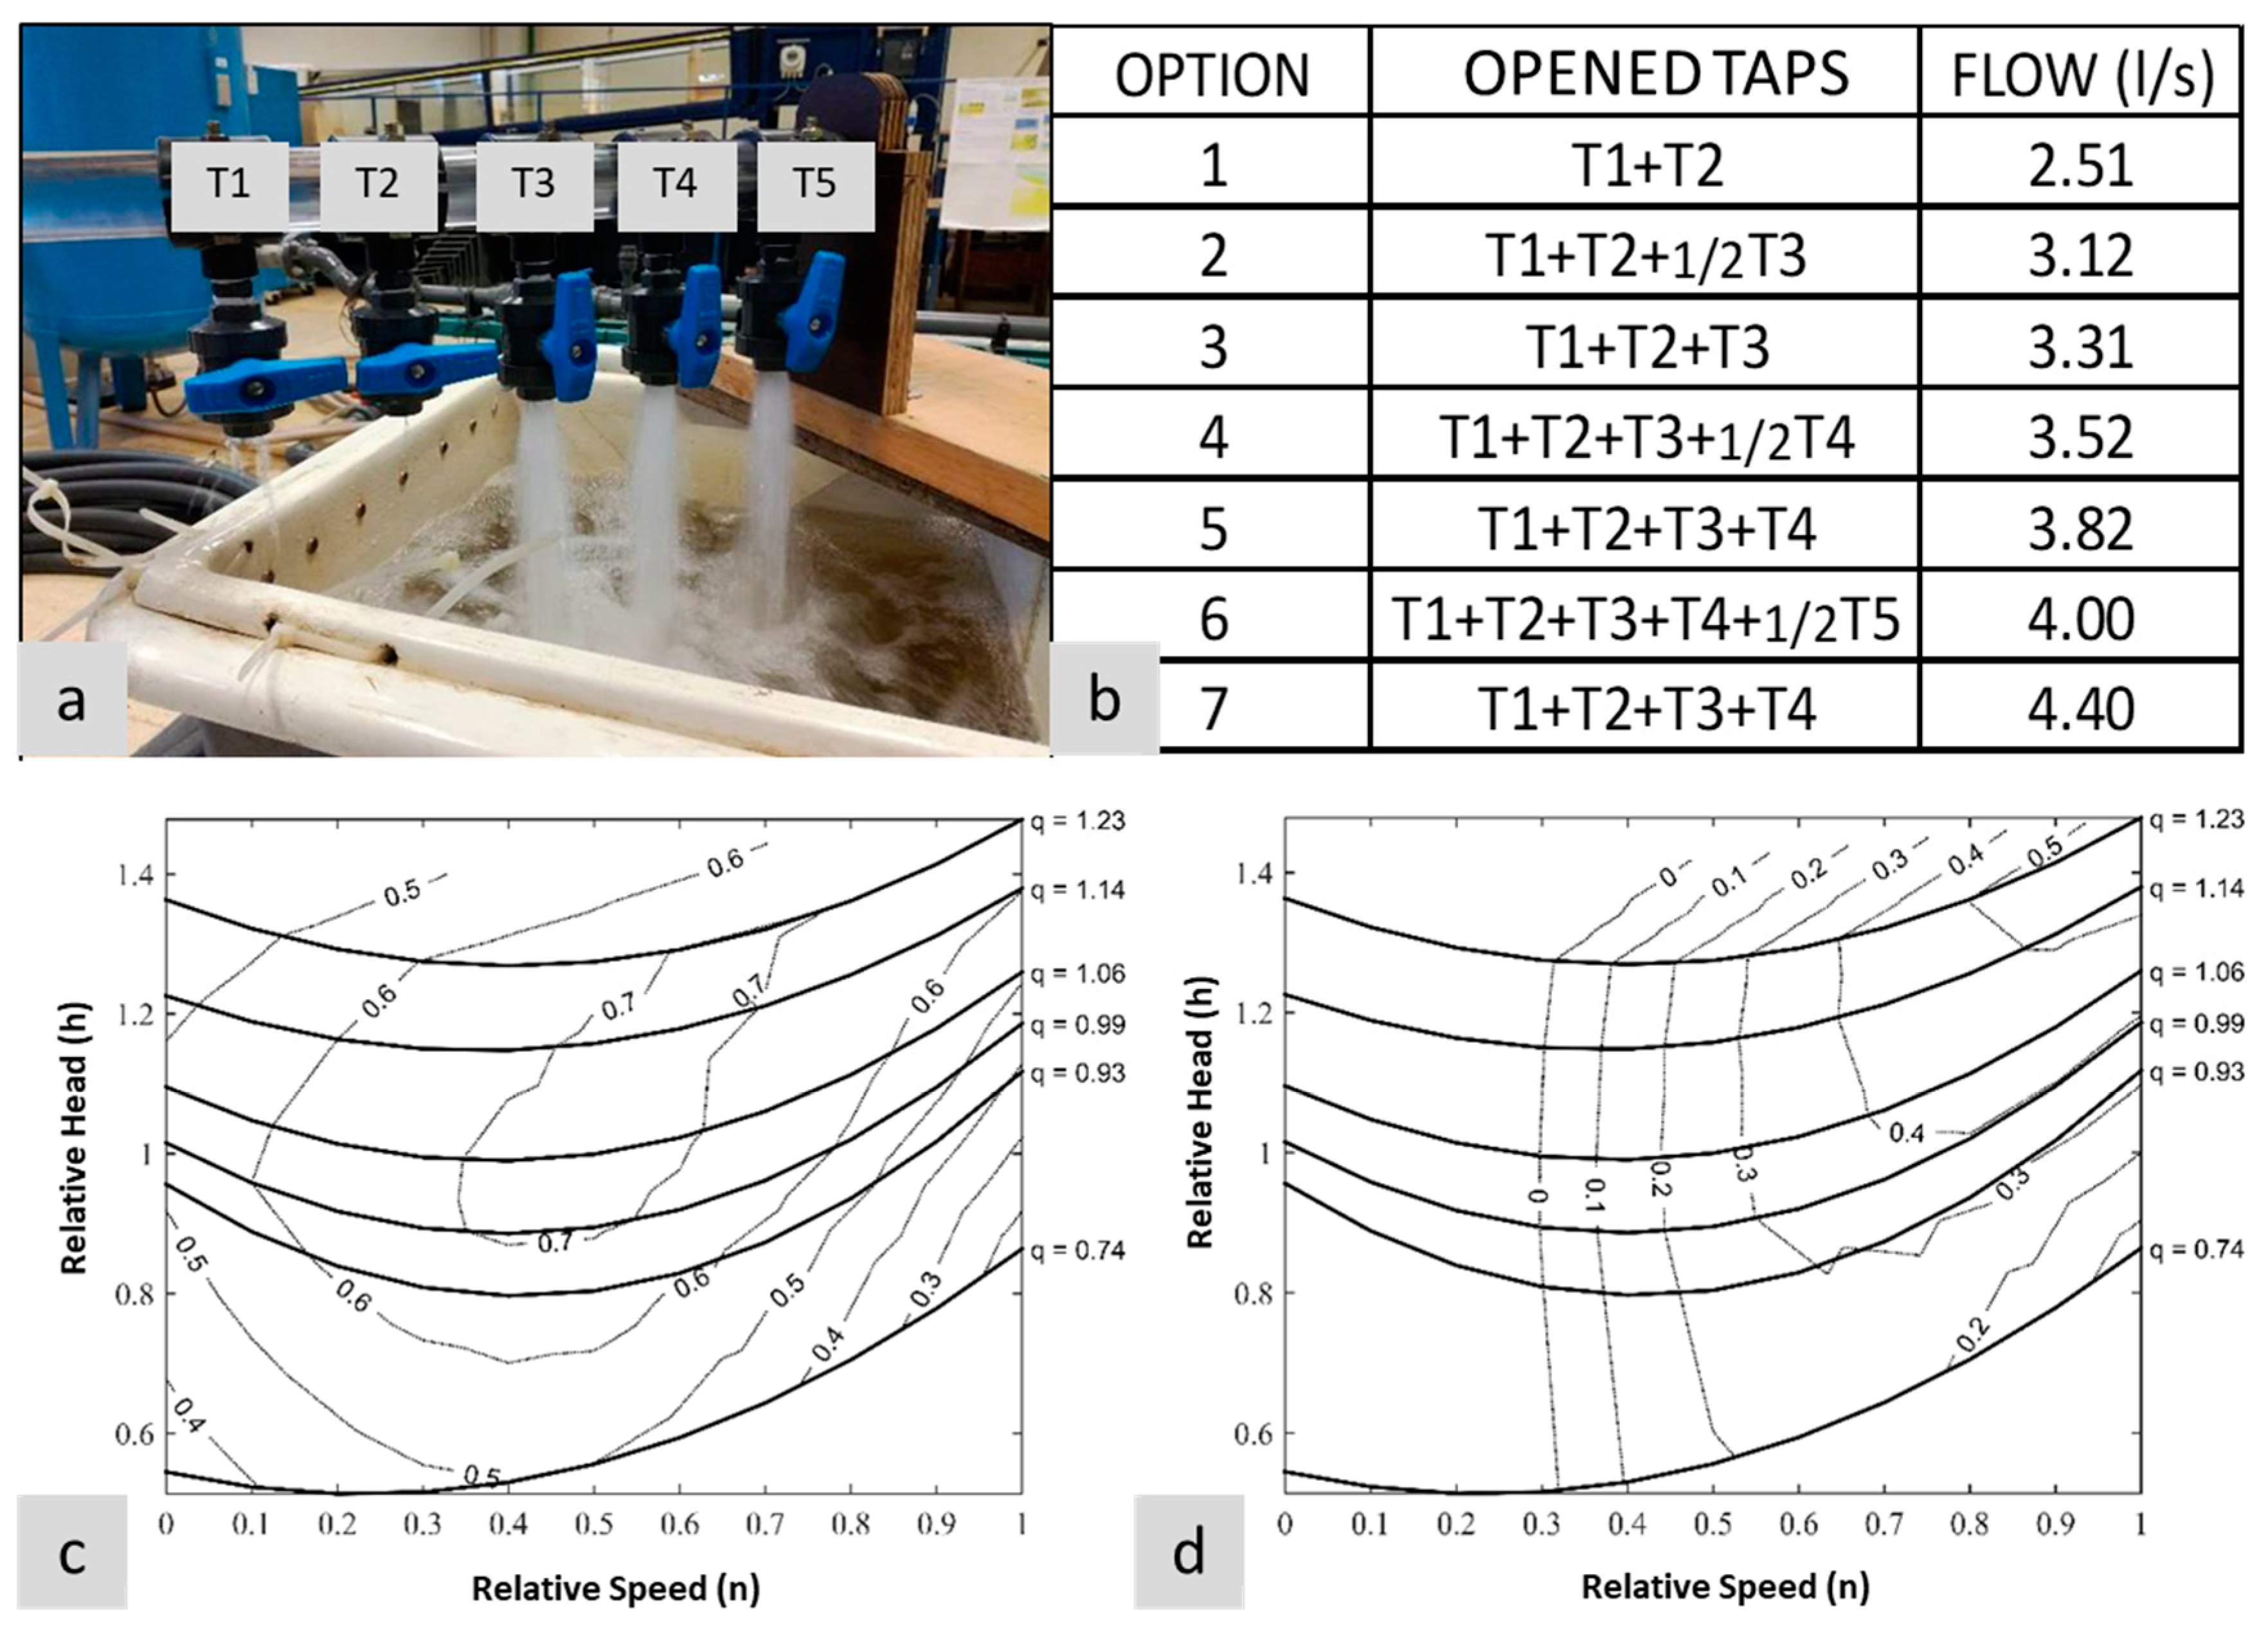
To simulate the irrigation hydrant, the relationship between the flow and the number of open hydrants is established (Figure 7a,b). The simulation of the operational irrigation hydrant in the lab, measuring the hydraulic and electrical parameters as a function of the flow, is then achieved. These measurements enabled us to develop the head variation as a function of the flow, which is defined considering different combinations, as presented in Figure 7b. This analysis assisted in developing an operation graph of the PAT both ‘on-grid’ and ‘off-grid’ (Figure 7c,d).
The highest PAT efficiencies, in the on-grid mode, are obtained between 0.4 and 0.7 of the PAT nominal relative speed and for values between 0.9 and 1.3 of the relative nominal head (Figure 7c). Considering q values, the best efficiencies are reached between 0.82 and 1.23. When the PAT is analyzed in off-grid mode, the influence of the capacitors causes the efficiency hill chart to change, according to [16]. It can be observed in Figure 7d, that there is a significant area where the efficiency is zero at a relative rotational speed, n, range between 0 and 0.3. The highest efficiencies are attained for n values between 0.8 and 1.0. These values are similar to the other researches, which showed the BEP prediction to be near 0.9 [27,28]. When the q values are checked, the best efficiencies are reached between 1.1 and 1.23. The h values for this region varies from around 1.3 and 1.5. When a PAT + SEIG system was considered, the maximum efficiency was near 0.5 (reduced from 0.7 of the on-grid case) [16,28], although these ranges changed according to capacitors, resistance load and the rotational speed of the PAT. These values are common when PATs are used; they are shown in previously published research and the efficiency values can be used to develop energy estimations [16,29,30].
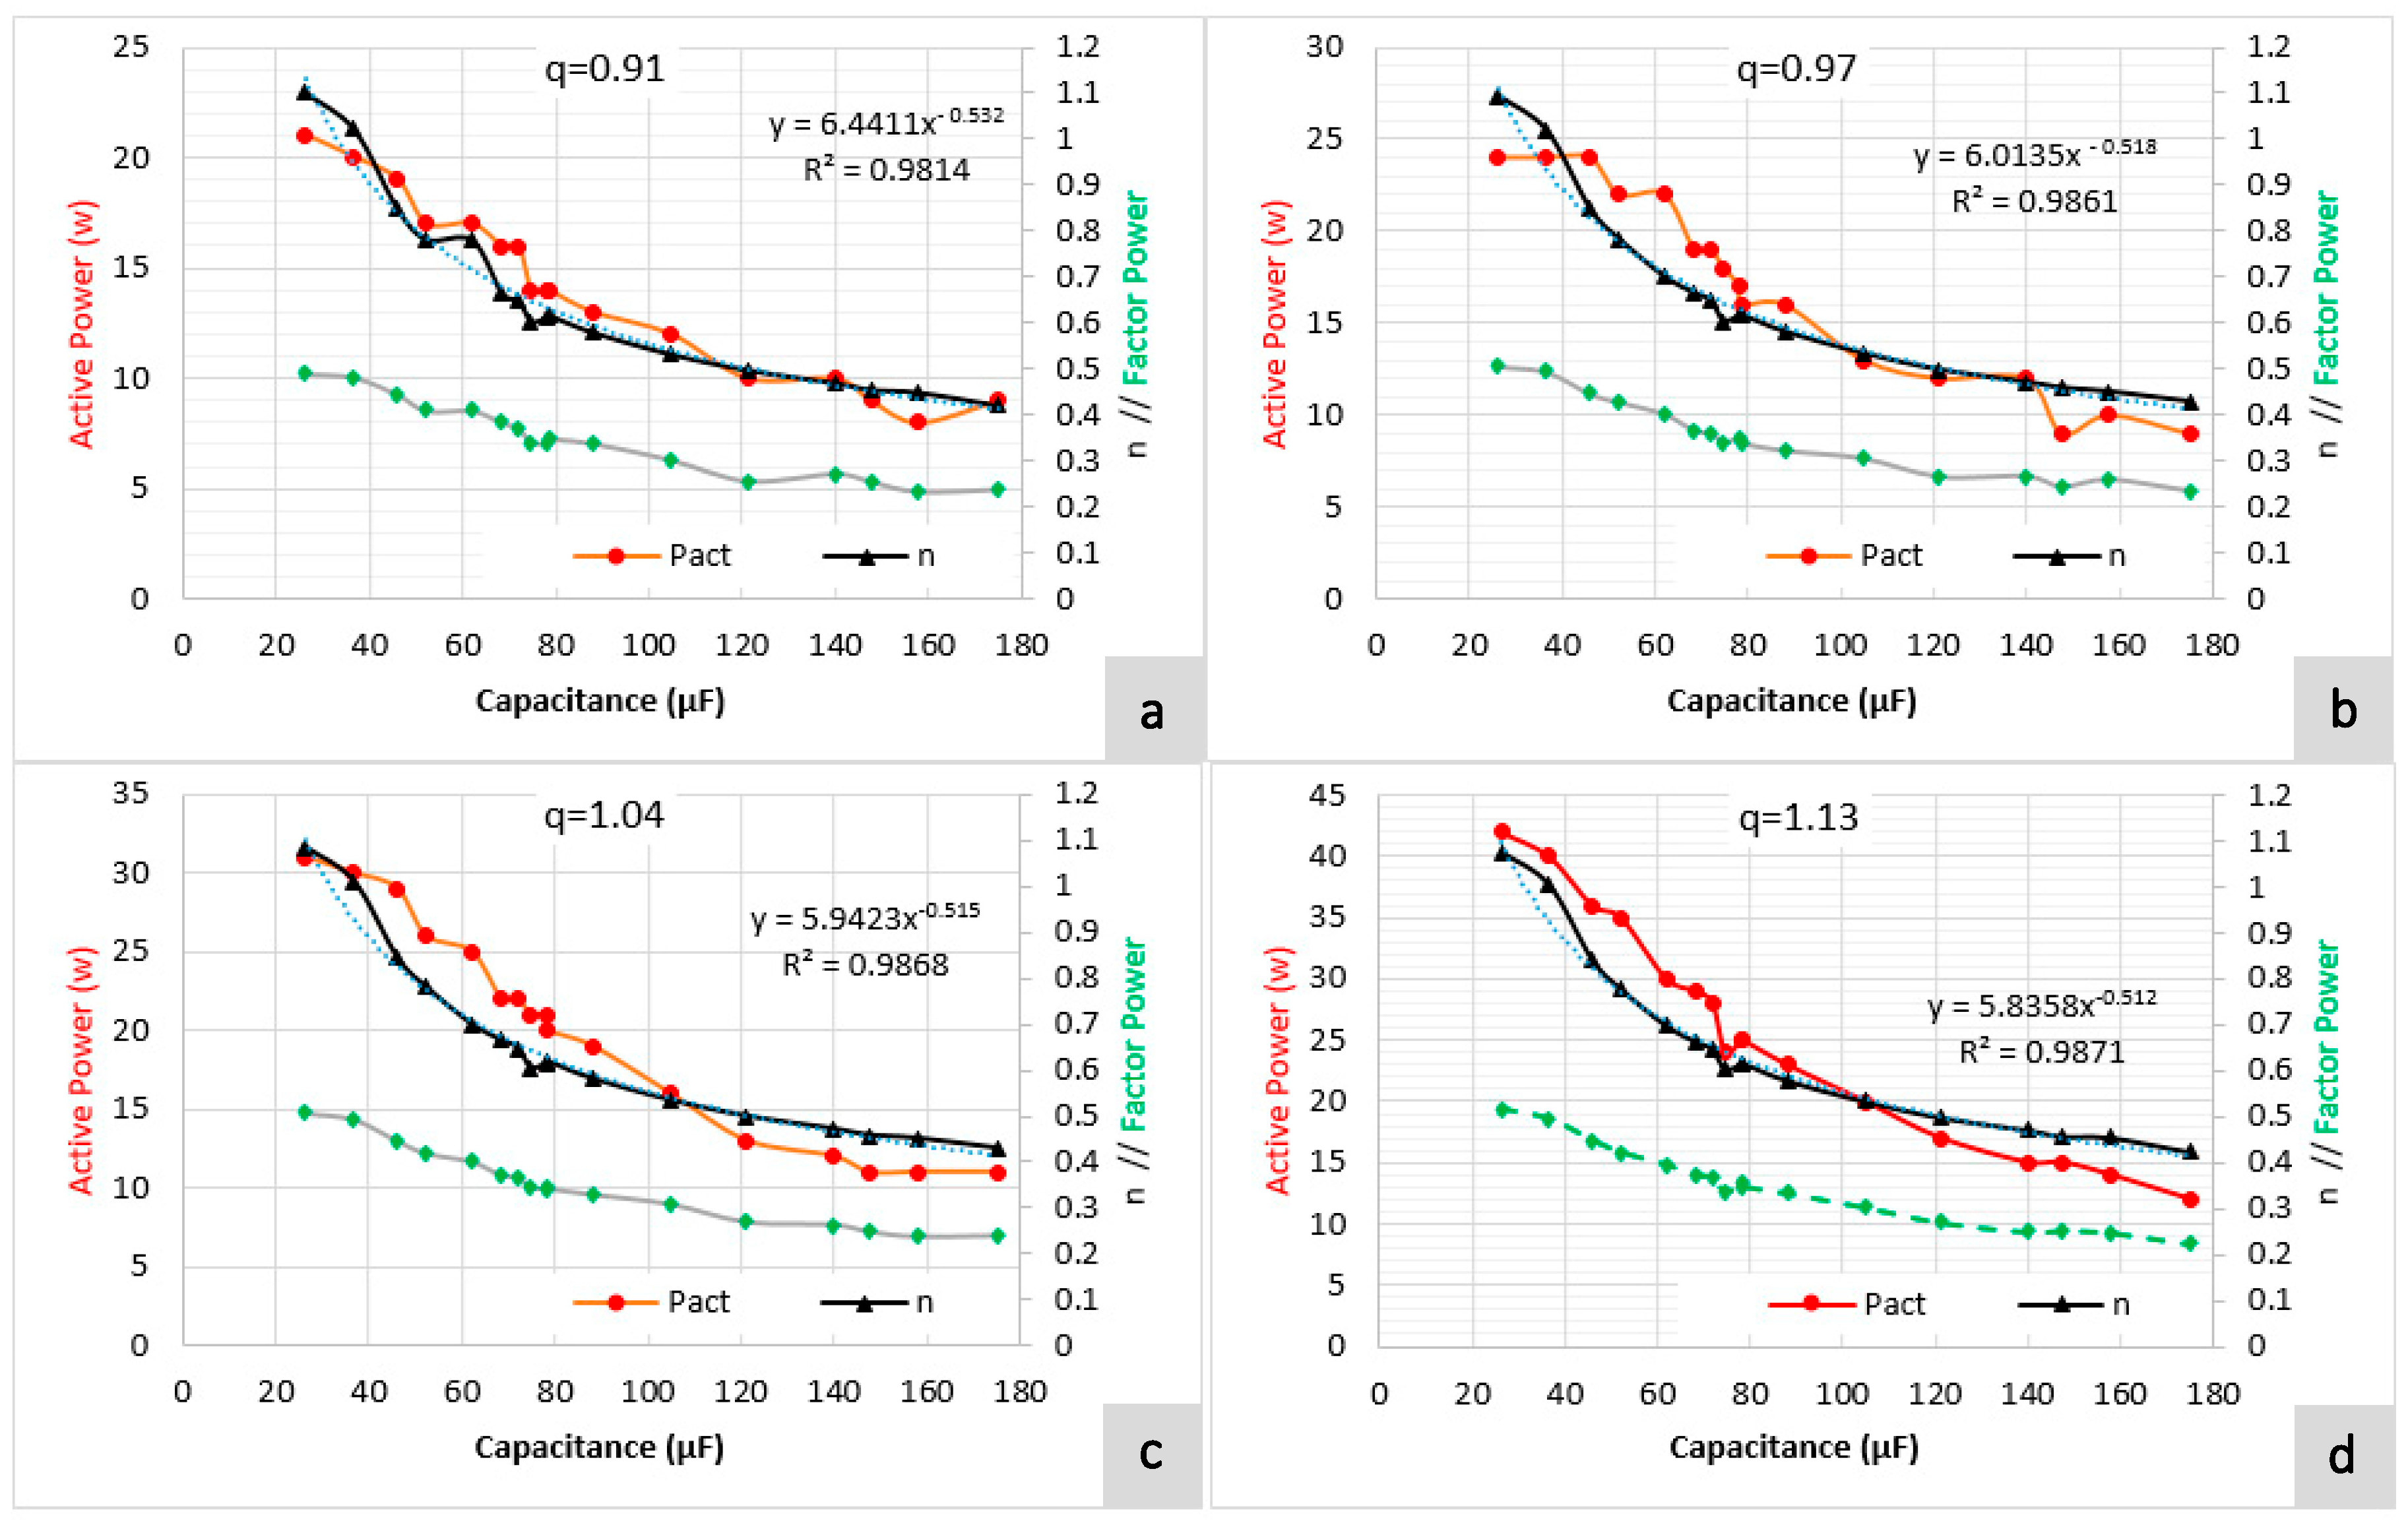
The analysis of the off-grid mode, simulating the recovery system in a farm or remote rural area (where the grid connection is usually difficult or impossible), is shown in Figure 8. This figure presents the trend of active power, factor power and relative rotational speed, n, for different values of relative flow, q, when the capacitance changes in the electrical system. The trend is similar for each q value, reducing the rotational speed when the capacitance value increases, C (μF), for a constant value in the resistance of the electrical load [31,32]. The analysis of the rotational speed in the experimental campaign enabled us to define the rotational speed with the capacitance variation. This Equation (14) is independent of the circulating flow when there is a resistive load equal to 120 ohms.
where n is the relative rotational speed and C is the capacitance value in μF.
This Equation (14) is truly interesting for the maximization of the system’s efficiency for a circulating flow and an available head. The use of coupled equations (electrical and hydraulic) is remarkable in showing the recovered head according to the capacitance value. In this case, the nominal operation curve of the PAT is defined by the following equation:
where H is the recovered head in m w.c.; Q is the flow in L/s.
To operate using relative values, the characteristic curve of the PAT is then defined as
If the similarity laws are considered [23], as well as the relationship between n and C (Equation (14)), Equation (16) can be rewritten as:
The knowledge of h as a function of capacitance and relative flow is very important to maximize the recovered head according to the circulating flow. This expression allows water managers to know the minimum value of the capacitance to the self-induction of the generator and know the resistive load of the electrical circuit. This value is crucial to generate energy, and therefore, it is compulsory to define it. The minimum capacitance values as a function of the resistive load to get the self-induction of the generator for this tested PAT are shown in Table 2.
In this approach, a comparison was developed considering these tests and models. The hydrant ‘H126’ was selected as hydrant to compare the analytical and experimental results because the flow and the available head of this point were similar to the characteristics of the PAT, which was installed in the lab. The energy estimation was developed considering different operating conditions of the PAT, assuming it was installed in the hydrant H126. The analytical model showed that the recoverable energy was 0.13 MWh/year. However, when the real approach was considered, considering the regulation as well as the efficiency, the annual recovery energy is 0.064 MWh/year if the PAT is connected to the electric grid and 0.0364 MWh/year when the PAT was in “off-grid” mode. These values were below 51% and 72% when they are compared with the theoretically available energy and they were inside of the range of [33].
3.4. PAT Pilot Station: Unsteady Experimental Tests
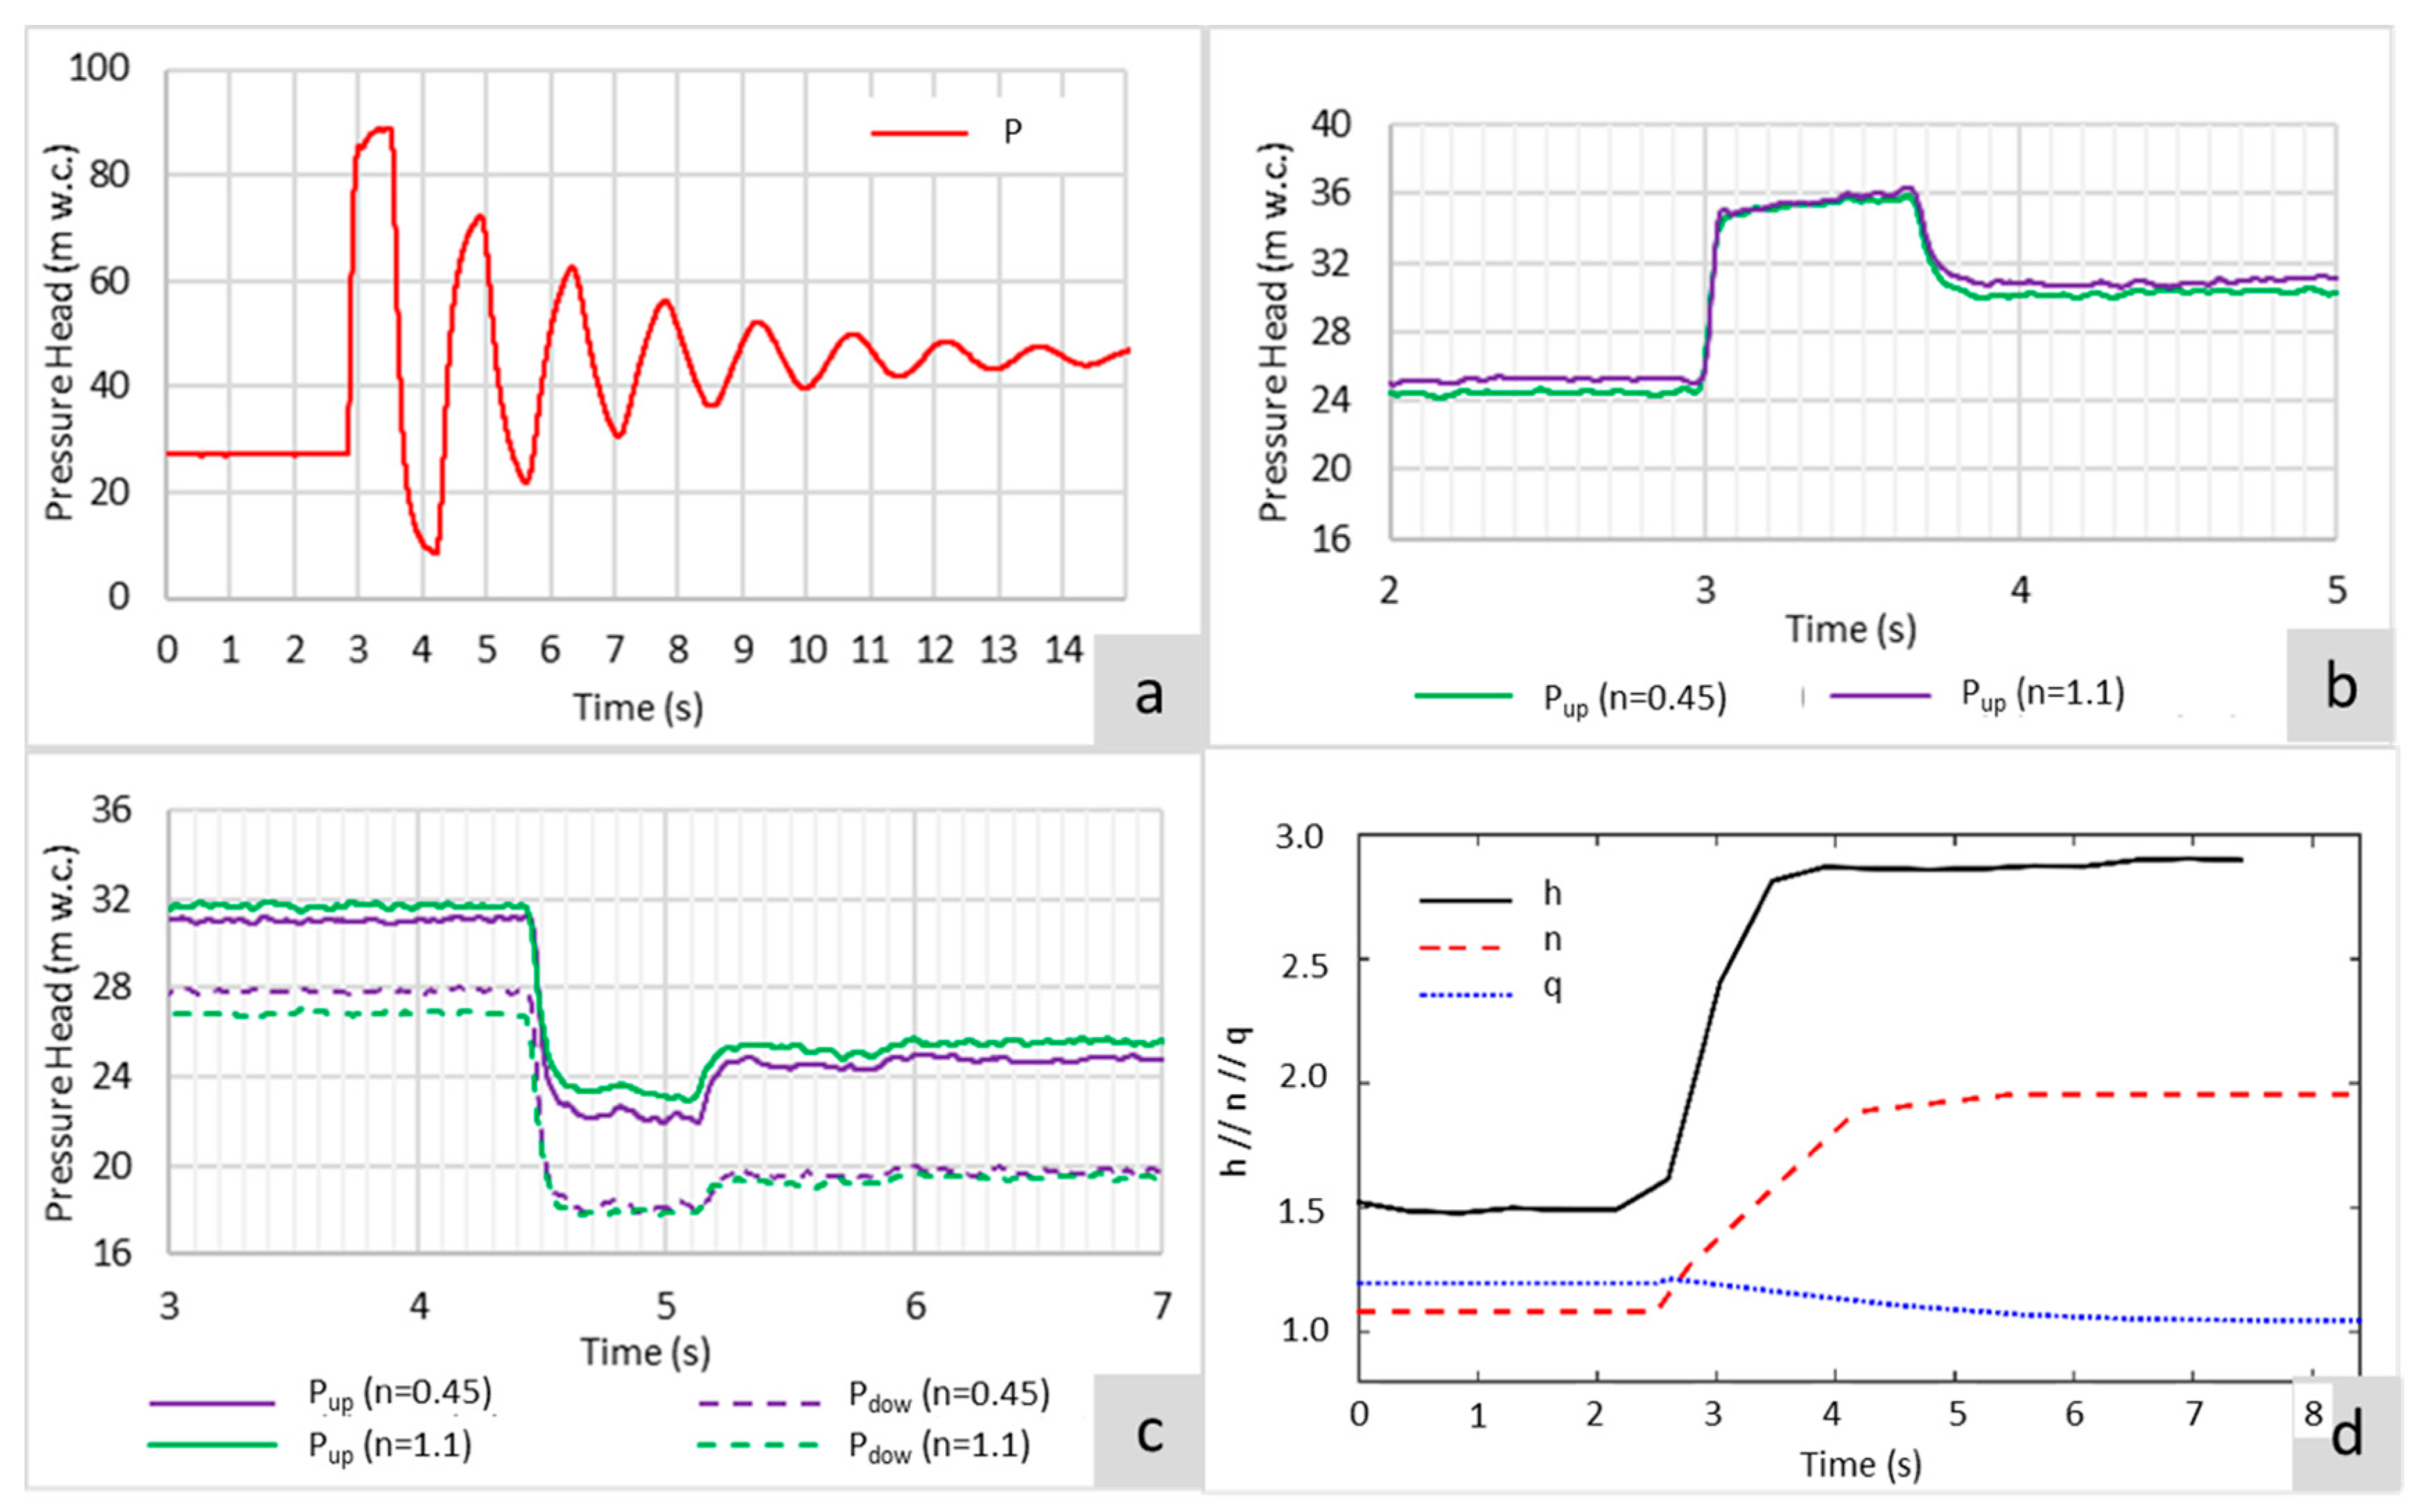
Using this lab station, a transient flow regime is also developed to measure the pressure oscillations when different hydrants operate. This analysis shows the PAT behaviour in water systems, which for several test conditions did not show extreme dangerous transient upsurges. Based on the tested conditions, it was possible to simulate water intake and general valve opening and closure, applying slow and fast manoeuvres. With this type of manoeuvre, the characterization of the decrease in pressure upstream and downstream of the PAT was determined and verified that the overpressure values were not dangerous in the irrigation water networks. Figure 9a shows the upstream pressure when all hydrants close with a fast manoeuvre (for a test of q = 1.1 or Option 7 of Figure 7b). For this manoeuvre in the hydrant, the maximum upstream overpressure is around 90 m w.c. This pressure was equal to the Allievi–Joukowsky value [34]. Figure 9b shows the upstream overpressure when three outlets are closed (Option 3 of Figure 7b).
The fast closure is induced considering n = 0.45 and n = 1.1 and in both cases, the upstream overpressure is similar and around 36 m w.c. This reduction was lower than the recorded pressure when there is no PAT installed in the hydrant (Figure 9a). Figure 9c shows a fast opening of the outlet valves. In this case, the curves show the upstream and the downstream pressure of the PAT. The minimum downstream pressure is 18 m w.c., while the minimum upstream pressure is around 22 m w.c. Both values are similar to open valves without PATs. The relative rotational speed, n, is 0.45 and 1.1, respectively (Figure 9c).
Figure 9d shows the behaviour of the PAT off-grid mode, and therefore, the runaway conditions for a shutdown. It was tested for different q values, showing a similar trend line. The relative rotational speed increased from 1.05 to 1.95 (86%) for a shutdown. The relative flow, q, reduced from 1.1 to 1.02 (−7.2%) and h increased from 1.5 to 2.9 (93%). The PAT behaviour is as expected for a radial or mixed reaction machine when it operates in runaway conditions, increasing the rotational speed and decreasing the flow. In this line, the variation of h, q and n is aligned to the reaction machine, analyzed by [24,25]. Therefore, if the PAT reaches the runaway conditions, the irrigation system can continue operating since the flow reduction is not so significant to put the system under risk. Although the relative pressure duplicated its value compared to the steady-state conditions, this increase is minor compared to Figure 9a, which represents the overpressure induced by a fast closure without a PAT installed. For this situation (fast closure without installed PAT), the pressure increased from 26 m w.c. to 87 m w.c.
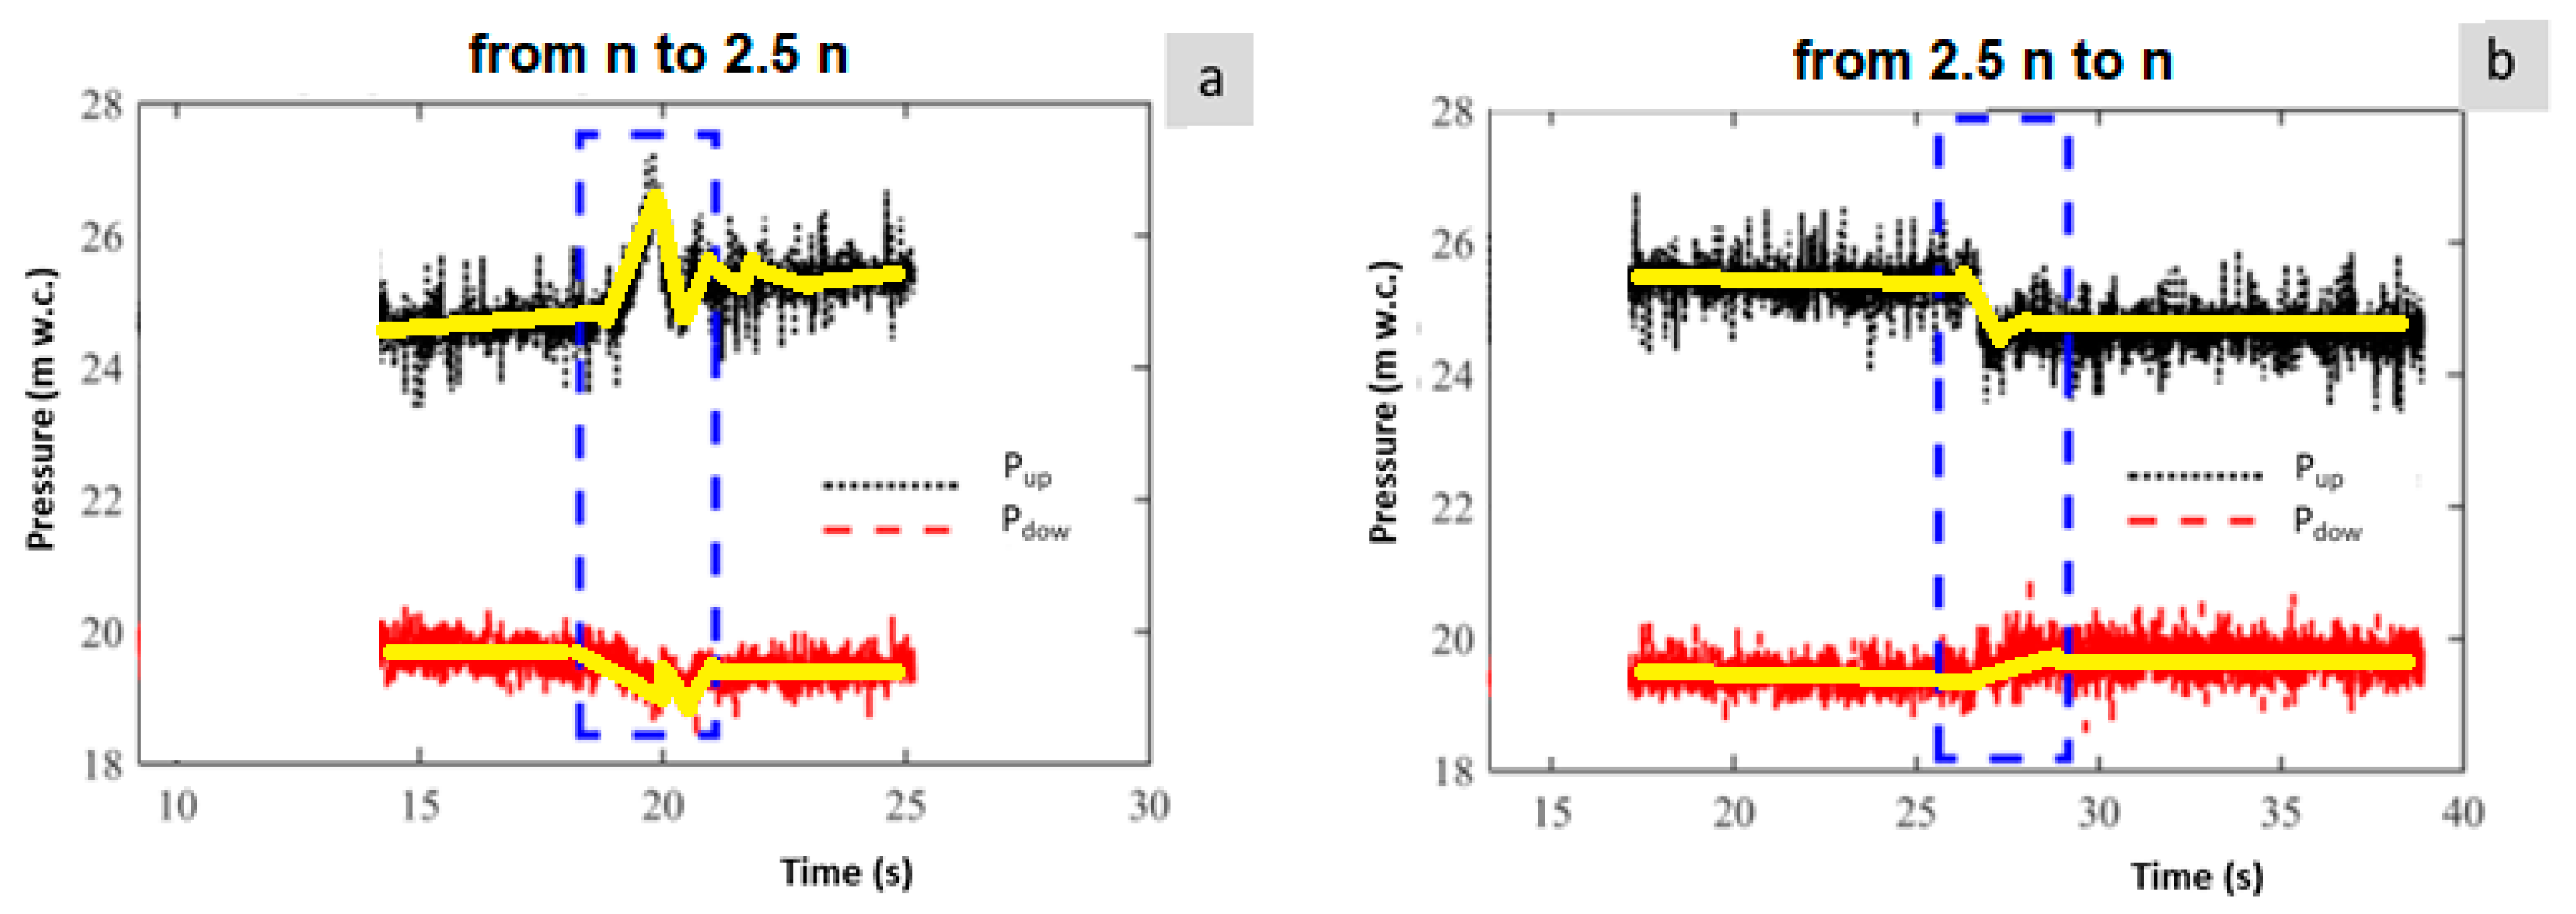
Figure 9d shows the h variation when the machine operated under runaway conditions. Figure 10 presents the pressure variation for changes in the rotational speed induced by the opening outlets of the hydrant for the recovery system (PAT–SEIG) in the off-grid mode. Figure 10a shows that the pressure variation is low when the machine increases its rotational speed from 440 rpm (minimum rotational speed) to 1100 rpm (maximum rotational speed). The blue mark shows that the upstream pressure changed from 24.2 m w.c. to 27.4 m w.c. When there is a reduction in the rotational speed (from 1100 rpm to 440 rpm), the upstream pressure head changes from 25.8 to 24.2 m w.c. (blue area in Figure 10b). Both variations showed similar trends in the reduction of h and q, if they are compared with reaction turbines [26].
4. Conclusions
Sustainable development must be part of water management concerns in irrigation systems. The implementation of energy recovery solutions, which use the excess of available hydraulic pressure in pressurized water networks, should be tackled. In this line, the irrigation systems have been progressing to increase energy efficiency since the high energy consumption incurs high operating costs and degrades the environment.
This research establishes the possibility of installing a pump working as a turbine in an irrigation hydrant when there is available excess pressure, higher than the minimum service pressure that needs to be guaranteed. A real network is analyzed, using a former study where the simulation model was previously calibrated. The theoretical recoverable energy was 178 MWh/year, considering the minor efficiency of the PAT (around 25%). However, when the machine operates in off-grid mode, the recoverable energy can reach only 44 MWh/year. To demonstrate this concern, research was developed based on a hydrant behaviour, the replication of a real one from the Vallada irrigation system network. The hydrant was selected and simulated using EPANET v2.0, a hydraulic simulator, and in the hydraulic lab, according to parametrized flow conditions for different simulating hydrant outlets.
The PAT behaviour was analyzed and characterized for different rotational speeds according to non-dimensional values of relative flow (q), relative head (h) and relative rotational speed (n). The change between an on-grid and an off-grid connection was detected. These relative characteristic parameters were associated with the capacitance values, as a function of the resistive load, supposing that the machine operates in off-grid mode. This state is the most real premise when a PAT station is installed in an irrigation network. The analysis showed that the efficiency decreased, and it is strongly linked to the capacitance values. The recovered energy is around 25% of the available theoretical recovery energy of the system due to the influence of the capacitors in the changing of the characteristic curves from an on-grid to an off-grid operation mode.
To understand the behaviour of the energy recovery system when the flow changes, a transient analysis was carried out, simulating the opening and closure of different hydrant outlets. The analysis showed that the pressure variation is dampening due to the PAT installation when compared with the No PAT installed in the irrigation network. Therefore, the installation of the PAT system does not put at risk the system operation.
This research justifies the great interest in installing renewable energy solutions, such as micro-hydropower devices in irrigation networks, to increase sustainability and system efficiency contributing to reach the sustainable development goals by 2030. Many of these goals are strongly linked to the water and energy nexus, in particular, the energy generation in remote areas in which there are no electric grids or connections.
Author Contributions
Conceptualization, methodology and software: H.M.R., M.P.-S. and J.F.P.F.; validation and formal analysis: H.M.R., J.F.P.F., M.P.-S., P.J.C.B.; writing—original draft preparation, writing—review and editing: J.F.P.F., M.P.-S., P.J.C.B., H.M.R.; supervision and lab concept, J.F.P.F., M.P.-S., P.J.C.B., H.M.R.; final review H.M.R., P.J.C.B., P.A.L.-J. All authors have read and agreed to the published version of the manuscript.
Funding
This research received a support from the project REDAWN (Reducing Energy Dependency in Atlantic Area Water Networks) EAPA_198/2016 from INTERREG ATLANTIC AREA.
Institutional Review Board Statement
Not applicable.
Informed Consent Statement
Not applicable.
Data Availability Statement
Not applicable.
Acknowledgments
This work was supported by FCT—Foundation for Science and Technology, through CERIS, IP, and IDMEC, under LAETA, project UIDB/50022/2020. This research is also supported by the “Program to support the academic career of the faculty of the Universitat Politècnica de València 2019/2020 in the project ‘A STEP AHEAD IN SUSTAINABILITY OF WATER SYSTEMS FOR THE ENERGY TRANSITION IN COMMUNITIES’ of the Modesto Pérez-Sánchez. The authors wish to thank the project REDAWN (Reducing Energy Dependency in Atlantic Area Water Networks) EAPA_198/2016 from INTERREG ATLANTIC AREA Fluids PROGRAMME 2014–2020 and CERIS, the Hydraulic Laboratory, for the support in the conceptual developments and the experiments on PATs.
Conflicts of Interest
The authors declare no conflict of interest.
References
- Bernard, L. 2020 Statistical Review of World Energy, 69th ed.; BP: London, UK, 2020. [Google Scholar]
- Corcoran, L.; Mcnabola, A.; Coughlan, P. Optimization of Water Distribution Networks for Combined Hydropower Energy Recovery and Leakage Reduction. J. Water Resour. Plan. Manag. 2015, 142, 1–8. [Google Scholar] [CrossRef]
- Pérez-Sánchez, M.; Sánchez-Romero, F.; López-Jiménez, P.; Ramos, H. PATs selection towards sustainability in irrigation networks: Simulated annealing as a water management tool. Renew. Energy 2017. [Google Scholar] [CrossRef]
- Paish, O. Micro-hydropower: Status and prospects. Proc. Inst. Mech. Eng. Part A J. Power Energy 2005, 216, 31–40. [Google Scholar] [CrossRef]
- Mishra, S.; Singal, S.K.; Khatod, D.K. Optimal installation of small hydropower plant—A review. Renew. Sustain. Energy Rev. 2011, 15, 3862–3869. [Google Scholar] [CrossRef]
- Arriaga, M. Pump as turbine—A pico-hydro alternative in Lao People’s Democratic Republic. Renew. Energy 2010, 35, 1109–1115. [Google Scholar] [CrossRef]
- Ahlborg, H.; Sjöstedt, M. Small-scale hydropower in Africa: Socio-technical designs for renewable energy in Tanzanian villages. Energy Res. Soc. Sci. 2015, 5, 20–33. [Google Scholar] [CrossRef] [Green Version]
- Qadir, M.; Boers, T.M.; Schubert, S.; Ghafoor, A.; Murtaza, G. Agricultural water management in water-starved countries: Challenges and opportunities. Agric. Water Manag. 2003, 62, 165–185. [Google Scholar] [CrossRef]
- García Morillo, J.; McNabola, A.; Camacho, E.; Montesinos, P.; Rodríguez Díaz, J.A. Hydro-power energy recovery in pressurized irrigation networks: A case study of an Irrigation District in the South of Spain. Agric. Water Manag. 2018, 204, 17–27. [Google Scholar] [CrossRef]
- García-López, J.; García-Ruiz, R.; Domínguez, J.; Lorite, I.J. Improving the sustainability of farming systems under semi-arid conditions by enhancing crop management. Agric. Water Manag. 2019, 223, 105718. [Google Scholar] [CrossRef]
- Carravetta, A.; Del Giudice, G.; Fecarotta, O.; Ramos, H. PAT Design Strategy for Energy Recovery in Water Distribution Networks by Electrical Regulation. Energies 2013, 6, 411–424. [Google Scholar] [CrossRef] [Green Version]
- Postacchini, M.; Darvini, G.; Finizio, F.; Pelagalli, L.; Soldini, L.; Di Giuseppe, E. Hydropower Generation Through Pump as Turbine: Experimental Study and Potential Application to Small-Scale WDN. Water 2020, 12, 958. [Google Scholar] [CrossRef] [Green Version]
- Giudicianni, C.; Herrera, M.; di Nardo, A.; Carravetta, A.; Ramos, H.M.; Adeyeye, K. Zero-net energy management for the monitoring and control of dynamically-partitioned smart water systems. J. Clean. Prod. 2020, 252, 119745. [Google Scholar] [CrossRef]
- Pugliese, F.; De Paola, F.; Fontana, N.; Giugni, M.; Marini, G. Experimental characterization of two Pumps As Turbines for hydropower generation. Renew. Energy 2016, 99, 180–187. [Google Scholar] [CrossRef]
- McNabola, A.; Coughlan, P.; Corcoran, L.; Power, C.; Williams, A.P.; Harris, L.; Gallagher, J.; Styles, D. Energy recovery in the water industry using micro-hydropower: An opportunity to improve sustainability. Water Policy 2014, 16, 168–183. [Google Scholar] [CrossRef]
- Capelo, B.; Pérez-Sánchez, M.; Fernandes, J.F.P.; Ramos, H.M.; López-Jiménez, P.A.; Branco, P.J.C. Electrical behaviour of the pump working as turbine in off grid operation. Appl. Energy 2017, 208, 302–311. [Google Scholar] [CrossRef]
- Mirafzal, B.; Skibinski, G.L.; Tallam, R.M. Determination of parameters in the universal induction motor model. IEEE Trans. Ind. Appl. 2009, 45, 142–151. [Google Scholar] [CrossRef]
- Fu, H.Z.; Wang, M.H.; Ho, Y.S. Mapping of drinking water research: A bibliometric analysis of research output during 1992–2011. Sci. Total Environ. 2013, 443, 757–765. [Google Scholar] [CrossRef]
- Gu, Y.; Wang, H.; Robinson, Z.P.; Wang, X.; Wu, J.; Li, X.; Xu, J.; Li, F. Environmental footprint assessment of green campus from a food-water-energy nexus perspective. In Energy Procedia; Elsevier: Amsterdam, The Netherlands, 2018; Volume 152, pp. 240–246. [Google Scholar] [CrossRef]
- Samora, I.; Franca, M.; Schleiss, A.; Ramos, H. Simulated Annealing in Optimization of Energy Production in a Water Supply Network. Water Resour. Manag. 2016, 30, 1533–1547. [Google Scholar] [CrossRef]
- Pérez-Sánchez, M.; Sánchez-Romero, F.; Ramos, H.; López-Jiménez, P. Modeling Irrigation Networks for the Quantification of Potential Energy Recovering: A Case Study. Water 2016, 8, 234. [Google Scholar] [CrossRef] [Green Version]
- Pérez-Sánchez, M. Methodology for energy efficiency analysis in pressurized irrigation networks: Practical application. Water 2017, 9, 799. [Google Scholar] [CrossRef] [Green Version]
- White, F.M. Fluid Mechanics, 6th ed.; McGrau-Hill: New York, NY, USA, 2008. [Google Scholar]
- Ramos, H. Simulation and Control of Hydrotransients at Small Hydroelectric Power Plants. Ph.D. Thesis, IST Portugal, Lisboa, Portugal, 1995. [Google Scholar]
- Ramos, H.M.; Borga, A.; Simão, M. Surge damping analysis in pipe systems: Modelling and experiments. J. Hydraul. Res. 2004, 42, 413–425. [Google Scholar] [CrossRef]
- Pérez-Sánchez, M.; López-Jiménez, P.A.; Ramos, H.M. PATs operating in water networks under unsteady flow conditions: Control valve manoeuvre and overspeed effect. Water 2018, 10, 529. [Google Scholar] [CrossRef] [Green Version]
- Lin, T.; Zhu, Z.; Li, X.; Li, J.; Lin, Y. Theoretical, experimental, and numerical methods to predict the best efficiency point of centrifugal pump as turbine. Renew. Energy 2021, 168, 31–44. [Google Scholar] [CrossRef]
- Ebrahimi, S.; Riasi, A.; Kandi, A. Selection optimization of variable speed pump as turbine (PAT) for energy recovery and pressure management. Energy Convers. Manag. 2021, 227, 113586. [Google Scholar] [CrossRef]
- Gallagher, J.; Harris, I.M.; Packwood, A.J.; McNabola, A.; Williams, A.P. A strategic assessment of micro-hydropower in the UK and Irish water industry: Identifying technical and economic constraints. Renew. Energy 2015, 81, 808–815. [Google Scholar] [CrossRef]
- Bousquet, C.; Samora, I.; Manso, P.; Rossi, L.; Heller, P.; Schleiss, A.J. Assessment of hydropower potential in wastewater systems and application to Switzerland. Renew. Energy 2017, 113, 64–73. [Google Scholar] [CrossRef]
- Obaid, W.; Hamid, A.K.; Ghenai, C. Solar/wind pumping system with forecasting in Sharjah, United Arab Emirates. Int. J. Electr. Comput. Eng. 2021, 11, 2088–8708. [Google Scholar]
- Nikolić, M.; Mršević, D.; Ristić, L.; Čantrak, Đ.; Janković, N. Induction Machine Driven Pump Applied as Turbine in Micro-hydro Power Plants. In Proceedings of the 2021 6th International Symposium on Environment-Friendly Energies and Applications (EFEA), Sofia, Bulgaria, 24–26 March 2021; IEEE: Piscataway Township, NJ, USA, 2021; pp. 1–6. [Google Scholar]
- Mitrovic, D.; Chacón, M.C.; García, A.M.; Morillo, J.G.; Diaz, J.A.R.; Ramos, H.M.; McNabola, A. Multi-Country Scale Assessment of Available Energy Recovery Potential Using Micro-Hydropower in Drinking, Pressurised Irrigation and Wastewater Networks, Covering Part of the EU. Water 2021, 13, 899. [Google Scholar] [CrossRef]
- Duan, H.-F.; Ghidaoui, M.; Pedro, J.; Lee, Y.-K.T. Unsteady friction and visco-elasticity in pipe fluid transients. J. Hydraul. Res. 2010, 48, 354–362. [Google Scholar] [CrossRef]
Figure 1.
Example of an irrigation hydrant. (a) Scheme without hydropower system; (b) Scheme with hydropower system; (c) Example of connection; (d) General view of irrigation hydrant.
Figure 1.
Example of an irrigation hydrant. (a) Scheme without hydropower system; (b) Scheme with hydropower system; (c) Example of connection; (d) General view of irrigation hydrant.

Figure 2.
PAT system: (a) Characteristic curves and operating point; (b) PAT curve in the hydrant section.
Figure 2.
PAT system: (a) Characteristic curves and operating point; (b) PAT curve in the hydrant section.

Figure 3.
Experimental set-up of the PAT pilot station: (1) HDPE conduction; (2) recirculation pump; (3) air vessel; (4) flowmeter; (5) PAT; (6) picoscope and acquisition system; (7) regulation; (8) pressure transducers; and (9) hydrant.
Figure 3.
Experimental set-up of the PAT pilot station: (1) HDPE conduction; (2) recirculation pump; (3) air vessel; (4) flowmeter; (5) PAT; (6) picoscope and acquisition system; (7) regulation; (8) pressure transducers; and (9) hydrant.

Figure 4.
Scheme of the developed SEIG. (a) Variable resistors; (b) switch control to carry out the excitation of the machine; (c) bank of capacitors; (d) Tested PAT-SEIG.
Figure 4.
Scheme of the developed SEIG. (a) Variable resistors; (b) switch control to carry out the excitation of the machine; (c) bank of capacitors; (d) Tested PAT-SEIG.

Figure 5.
Case study of Vallada: (a) the selected irrigation network; (b) available head and flow in the selected hydrant; (c) flows over time.
Figure 5.
Case study of Vallada: (a) the selected irrigation network; (b) available head and flow in the selected hydrant; (c) flows over time.

Figure 6.
Vallada irrigation system: (a) pressure map in irrigation system; (b) detail of the area with higher pressures.
Figure 6.
Vallada irrigation system: (a) pressure map in irrigation system; (b) detail of the area with higher pressures.

Figure 7.
Experimental set-up of the selected hydrant: (a) view of the outlets from the hydrant prototype in the lab; (b) flow according to the selected option of the opened outlets; (c) PAT Operation graph (on-grid); (d) PAT Operation graph (PAT+SEIG).
Figure 7.
Experimental set-up of the selected hydrant: (a) view of the outlets from the hydrant prototype in the lab; (b) flow according to the selected option of the opened outlets; (c) PAT Operation graph (on-grid); (d) PAT Operation graph (PAT+SEIG).

Figure 8.
Active power, factor power and relative rotational speed as a function of capacitance for different relative flows, q. (a) q = 0.91; (b) 0.97; (c) 1.04; (d) 1.13.
Figure 8.
Active power, factor power and relative rotational speed as a function of capacitance for different relative flows, q. (a) q = 0.91; (b) 0.97; (c) 1.04; (d) 1.13.

Figure 9.
Experimental transient regimes: (a) upstream pressure when all hydrant outlets have a fast closure manoeuvre; (b) upstream pressure when three outlets are closed very fast, and the PAT for different ‘n’ values; (c) upstream and downstream pressure when three outlets are opened rapidly, and the PAT for different ‘n’ values; (d) runaway conditions for q = 1.1 at instant 2.3 s.

Figure 10.
Experimental transient regimes: (a) upstream and downstream pressure variation for an increase in the rotational speed; (b) and a decrease in the rotational speed.
Figure 10.
Experimental transient regimes: (a) upstream and downstream pressure variation for an increase in the rotational speed; (b) and a decrease in the rotational speed.


Table 1.
Simulated recovery energy in irrigation hydrants.
| HYDRANT | ERT | HYDRANT | ERT | HYDRANT | ERT | HYDRANT | ERT |
|---|---|---|---|---|---|---|---|
| MWh/year | MWh/year | MWh/year | MWh/year | ||||
| H024 | 1.99 | H044 | 5.6 | H066 | 0.13 | H086 | 0.48 |
| H025 | 1.56 | H045 | 16.12 | H067 | 0.22 | H087 | 0.27 |
| H026 | 0.48 | H046 | 5.14 | H070 | 1.4 | H088 | 0.51 |
| H027 | 1.92 | H047 | 5.03 | H071 | 0.4 | H089 | 0.73 |
| H028 | 0.12 | H048 | 13.37 | H072 | 0.28 | H090 | 0.59 |
| H029 | 2.27 | H049 | 0.26 | H073 | 0.22 | H100 | 0.89 |
| H030 | 0.77 | H050 | 1.93 | H074 | 0.64 | H101 | 1.05 |
| H031 | 1.36 | H051 | 2.67 | H075 | 0.31 | H123 | 1.78 |
| H032 | 3.94 | H052 | 0.86 | H076 | 1.34 | H126 * | 0.13 |
| H033 | 4.19 | H053 | 11.05 | H077 | 0.52 | H140 | 0.73 |
| H035 | 3.57 | H055 | 0.04 | H078 | 3.68 | H148 | 0.32 |
| H036 | 2.5 | H056 | 0.01 | H079 | 0.76 | H152 | 2.47 |
| H037 | 1.12 | H057 | 0.55 | H080 | 1.41 | H188 | 2.81 |
| H038 | 3.54 | H058 | 0.99 | H081 | 0.4 | H200 | 1.35 |
| H039 | 0.64 | H059 | 0.46 | H082 | 1.28 | H201 | 1.58 |
| H040 | 3.57 | H062 | 2.32 | H083 | 0.87 | H202 | 2.08 |
| H042 | 33.73 | H064 | 0.22 | H084 | 0.8 | - | - |
| H043 | 9.13 | H065 | 0.8 | H085 | 1.5 | - | - |
* and background: chosen hydrant.
Table 2.
Minimum capacitance values to self-induction of the generator.
| n | Resistive Load (Ω) | |||
|---|---|---|---|---|
| 120 | 150 | 200 | 600 | |
| 0.5 | 241.06 | 190.90 | 149.44 | 127.02 |
| 0.6 | 167.40 | 130.01 | 103.08 | 86.55 |
| 0.7 | 122.99 | 93.95 | 75.30 | 62.58 |
| 0.8 | 94.16 | 70.91 | 57.37 | 47.25 |
| 0.9 | 74.40 | 55.33 | 45.13 | 36.88 |
| 1.0 | 60.27 | 44.31 | 36.41 | 29.55 |
| 1.1 | 49.81 | 36.25 | 29.99 | 24.18 |
Publisher’s Note: MDPI stays neutral with regard to jurisdictional claims in published maps and institutional affiliations. |
© 2021 by the authors. Licensee MDPI, Basel, Switzerland. This article is an open access article distributed under the terms and conditions of the Creative Commons Attribution (CC BY) license (https://creativecommons.org/licenses/by/4.0/).
Share and Cite
MDPI and ACS Style
Pérez-Sánchez, M.; Fernandes, J.F.P.; Branco, P.J.C.; López-Jiménez, P.A.; Ramos, H.M. PATs Behavior in Pressurized Irrigation Hydrants towards Sustainability. Water 2021, 13, 1359. https://0-doi-org.brum.beds.ac.uk/10.3390/w13101359
AMA Style
Pérez-Sánchez M, Fernandes JFP, Branco PJC, López-Jiménez PA, Ramos HM. PATs Behavior in Pressurized Irrigation Hydrants towards Sustainability. Water. 2021; 13(10):1359. https://0-doi-org.brum.beds.ac.uk/10.3390/w13101359
Chicago/Turabian StylePérez-Sánchez, Modesto, João F. P. Fernandes, P. J. Costa Branco, P. Amparo López-Jiménez, and Helena M. Ramos. 2021. "PATs Behavior in Pressurized Irrigation Hydrants towards Sustainability" Water 13, no. 10: 1359. https://0-doi-org.brum.beds.ac.uk/10.3390/w13101359
Note that from the first issue of 2016, this journal uses article numbers instead of page numbers. See further details here.