
Perceptions of Drinking Water Service of the ‘Off-Grid’ Community in Cimahi, Indonesia

 ,
,
Abstract
:
1. Introduction
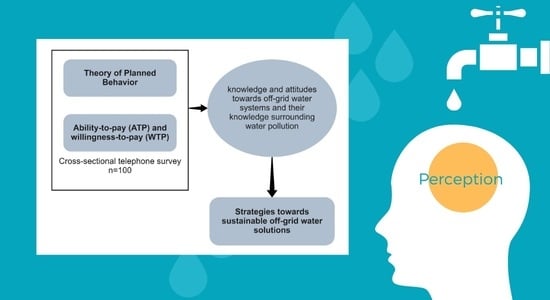
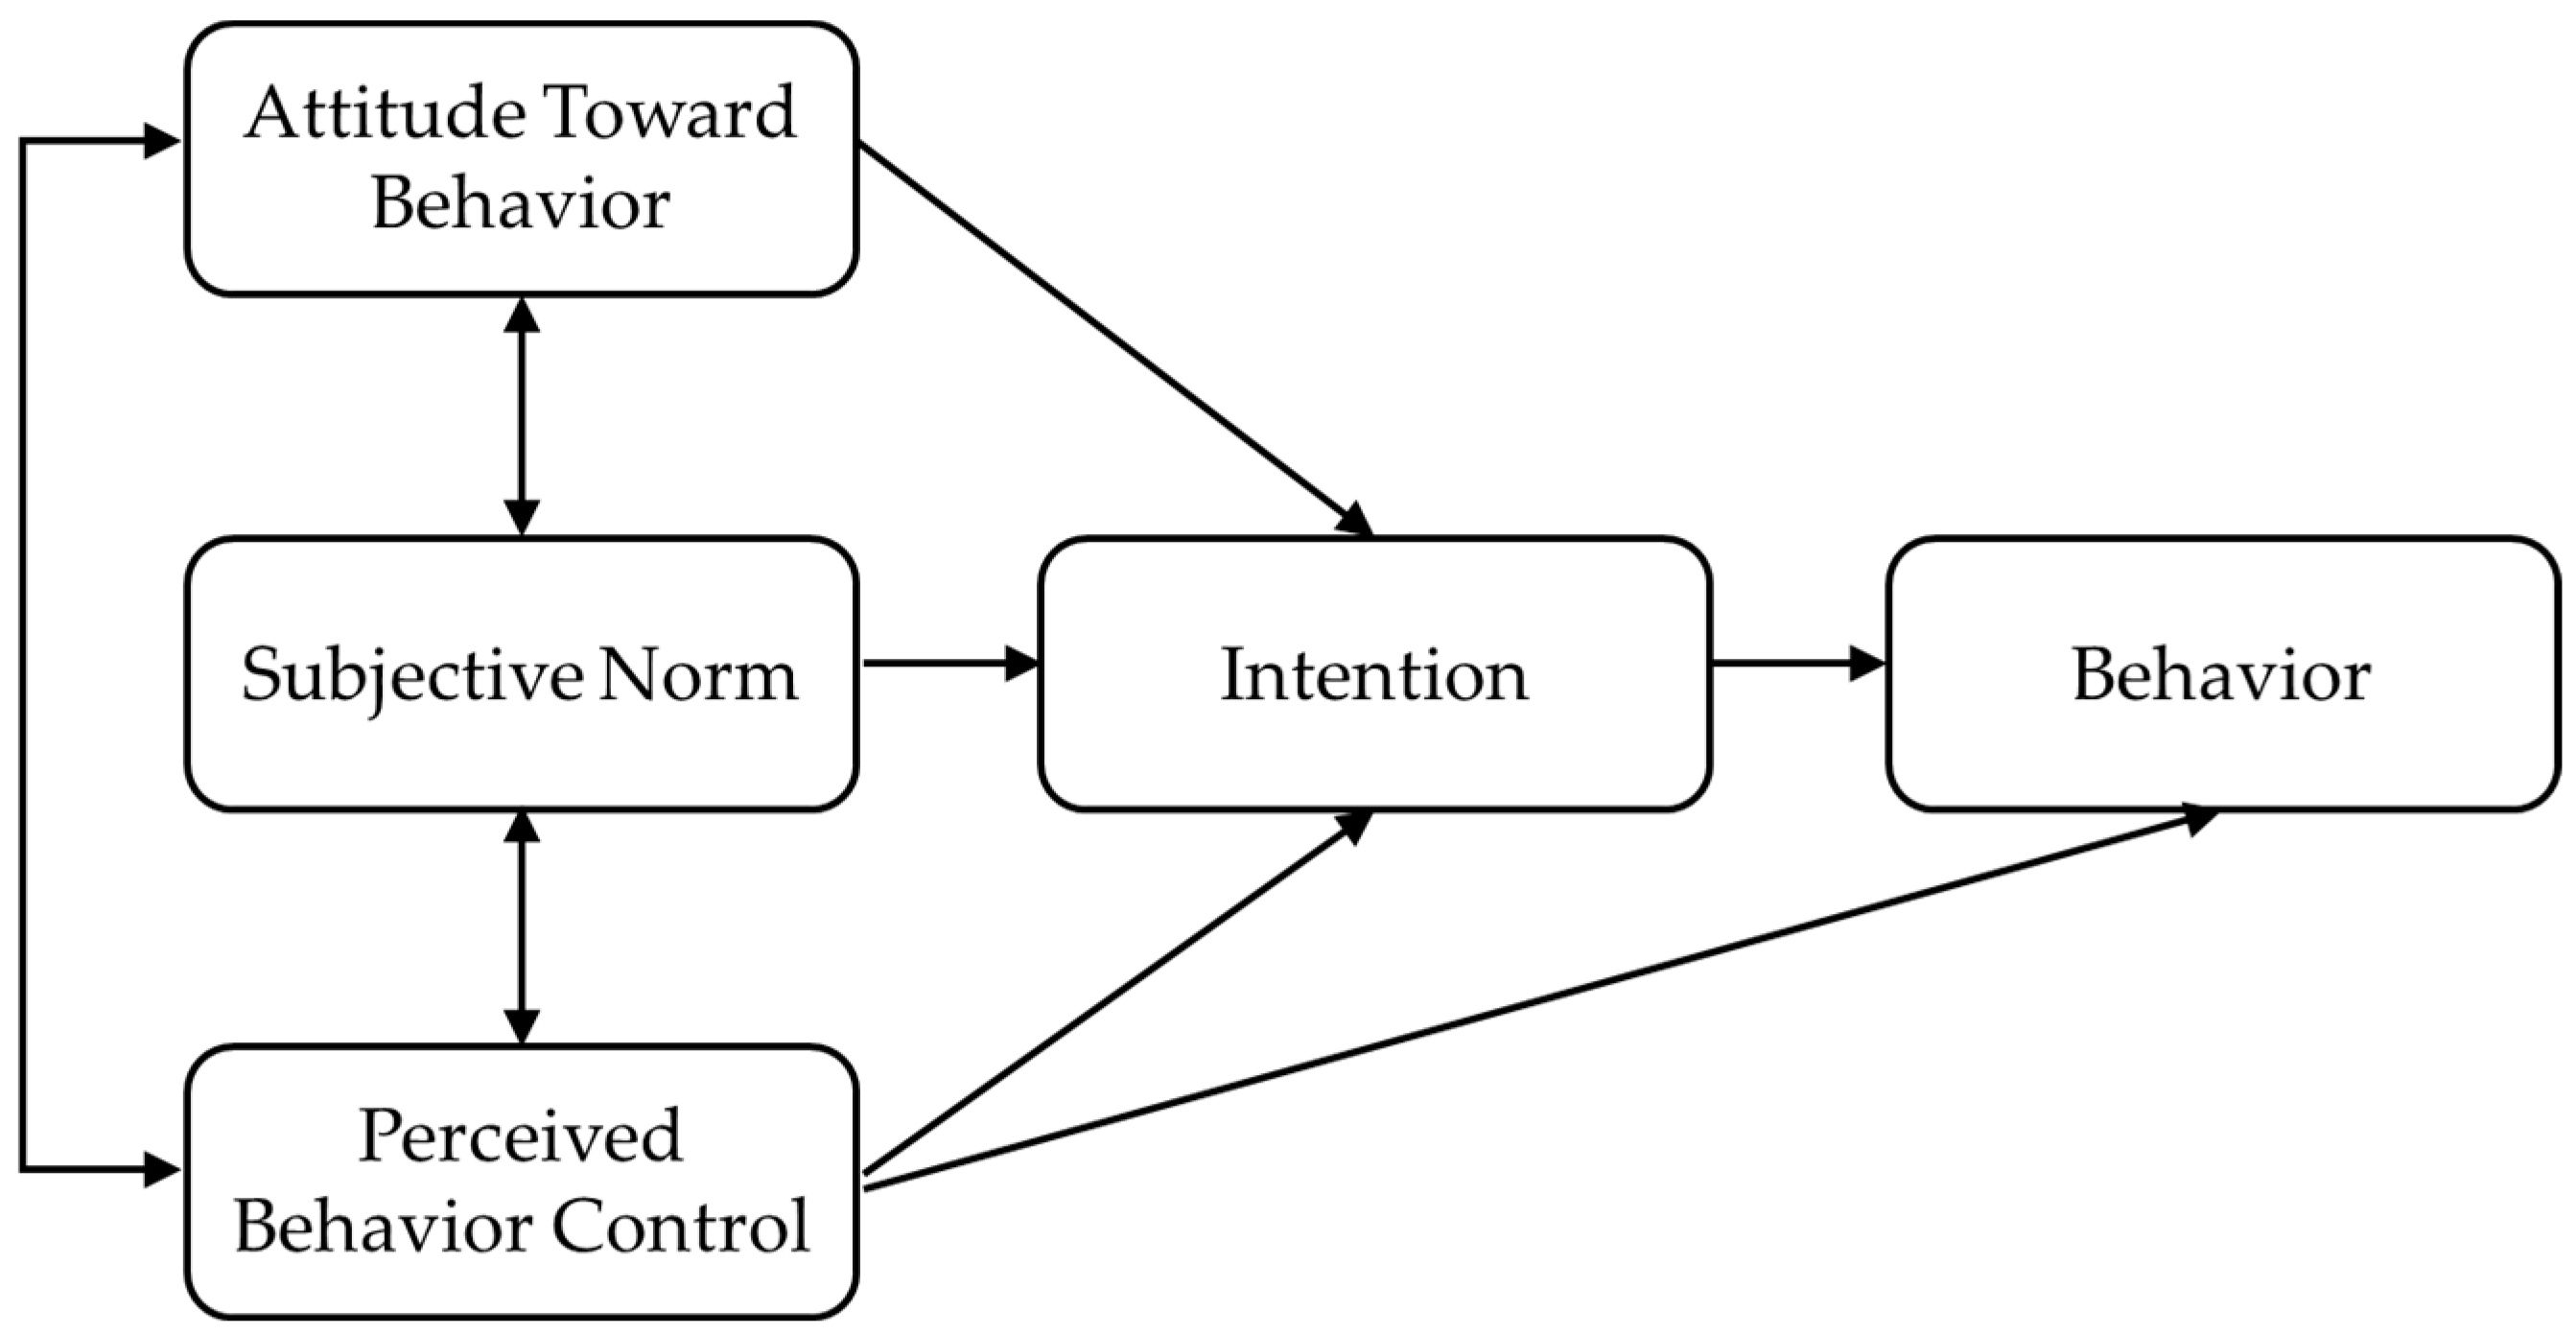
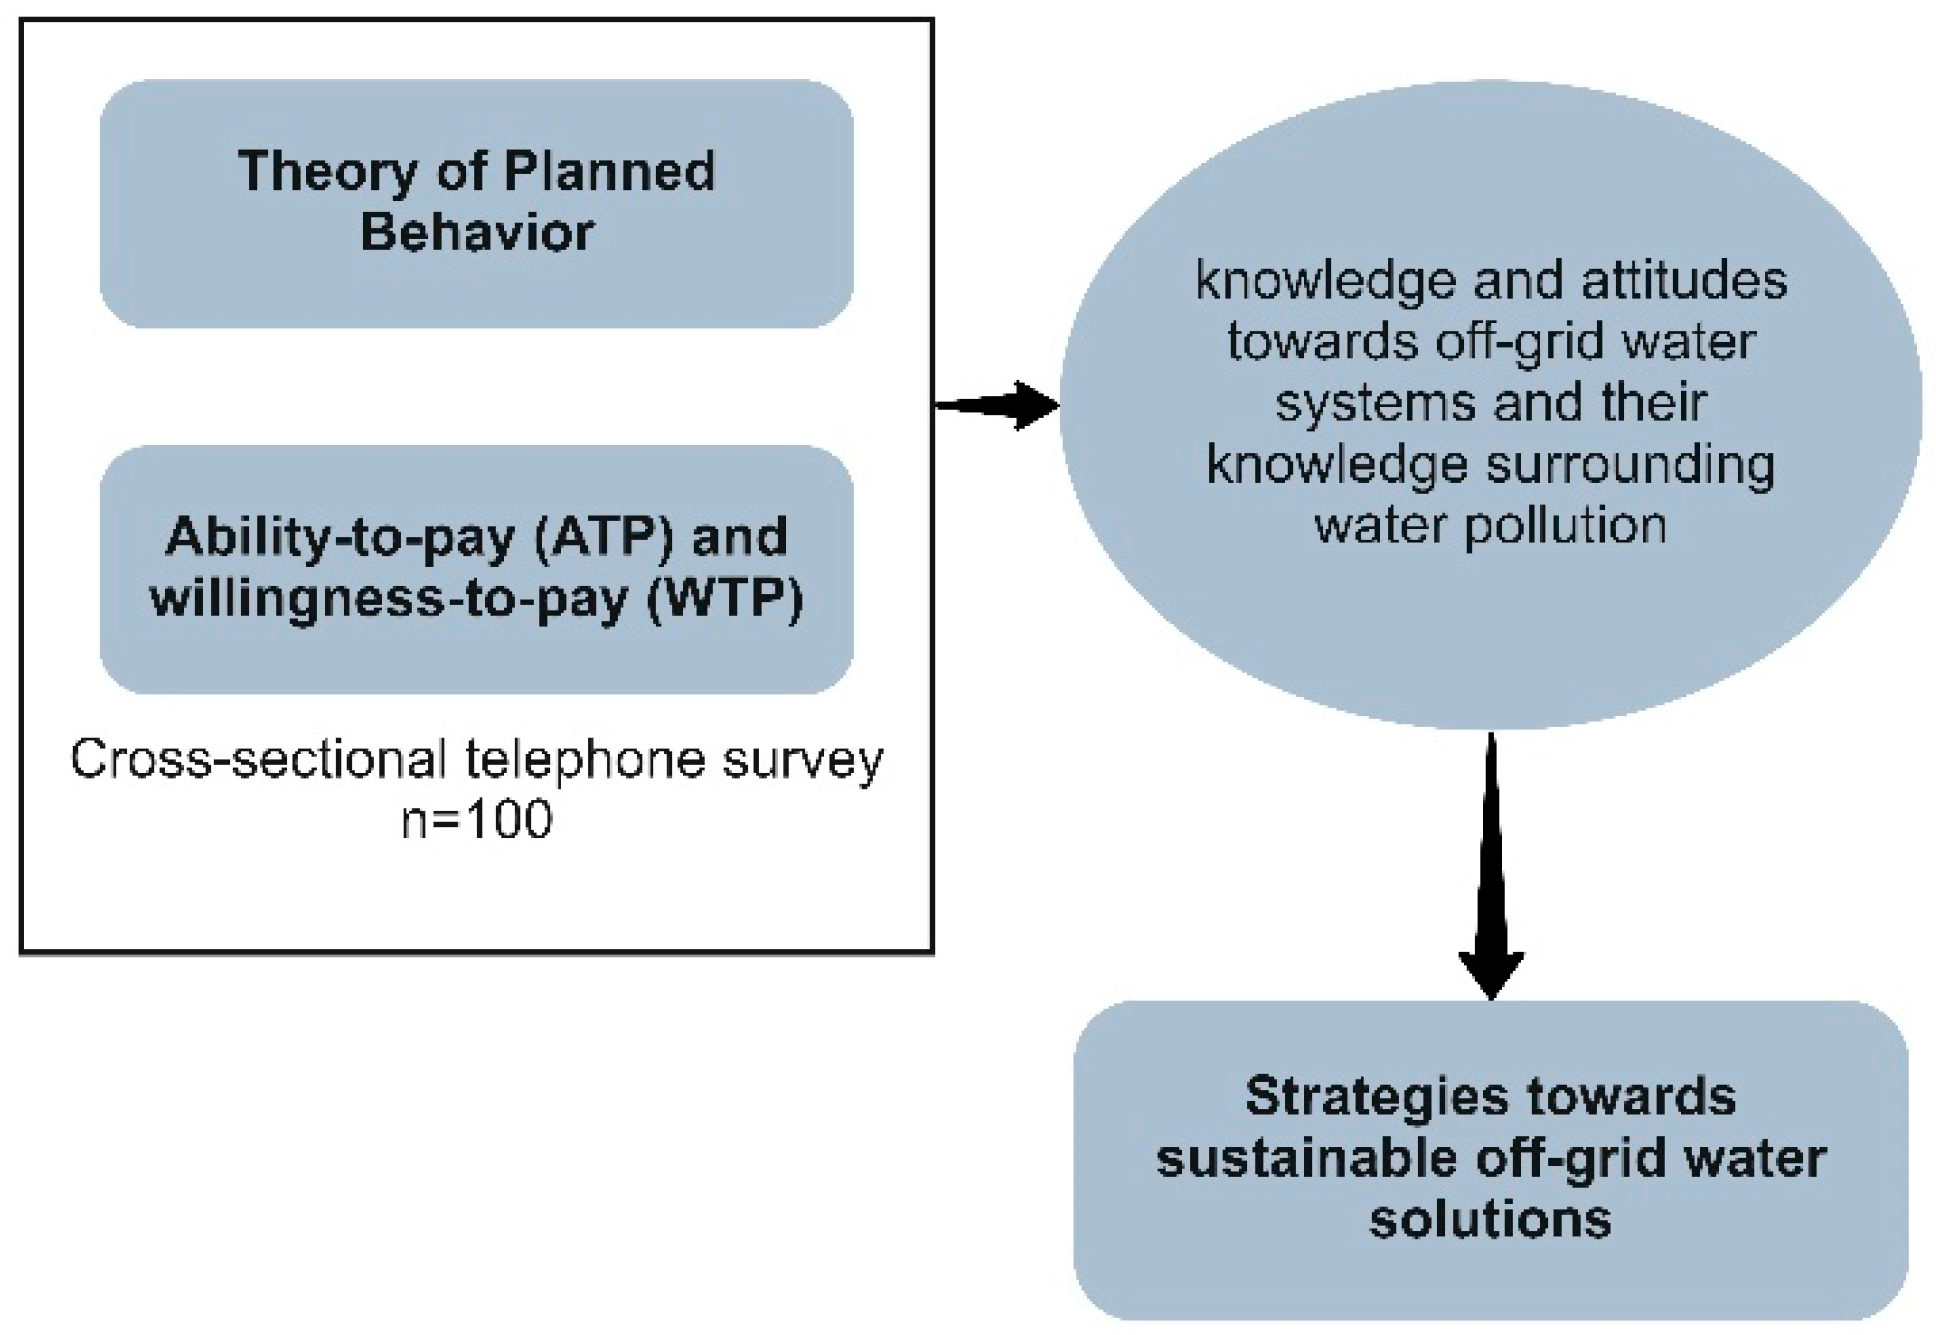
2. Framework
3. Materials and Methods
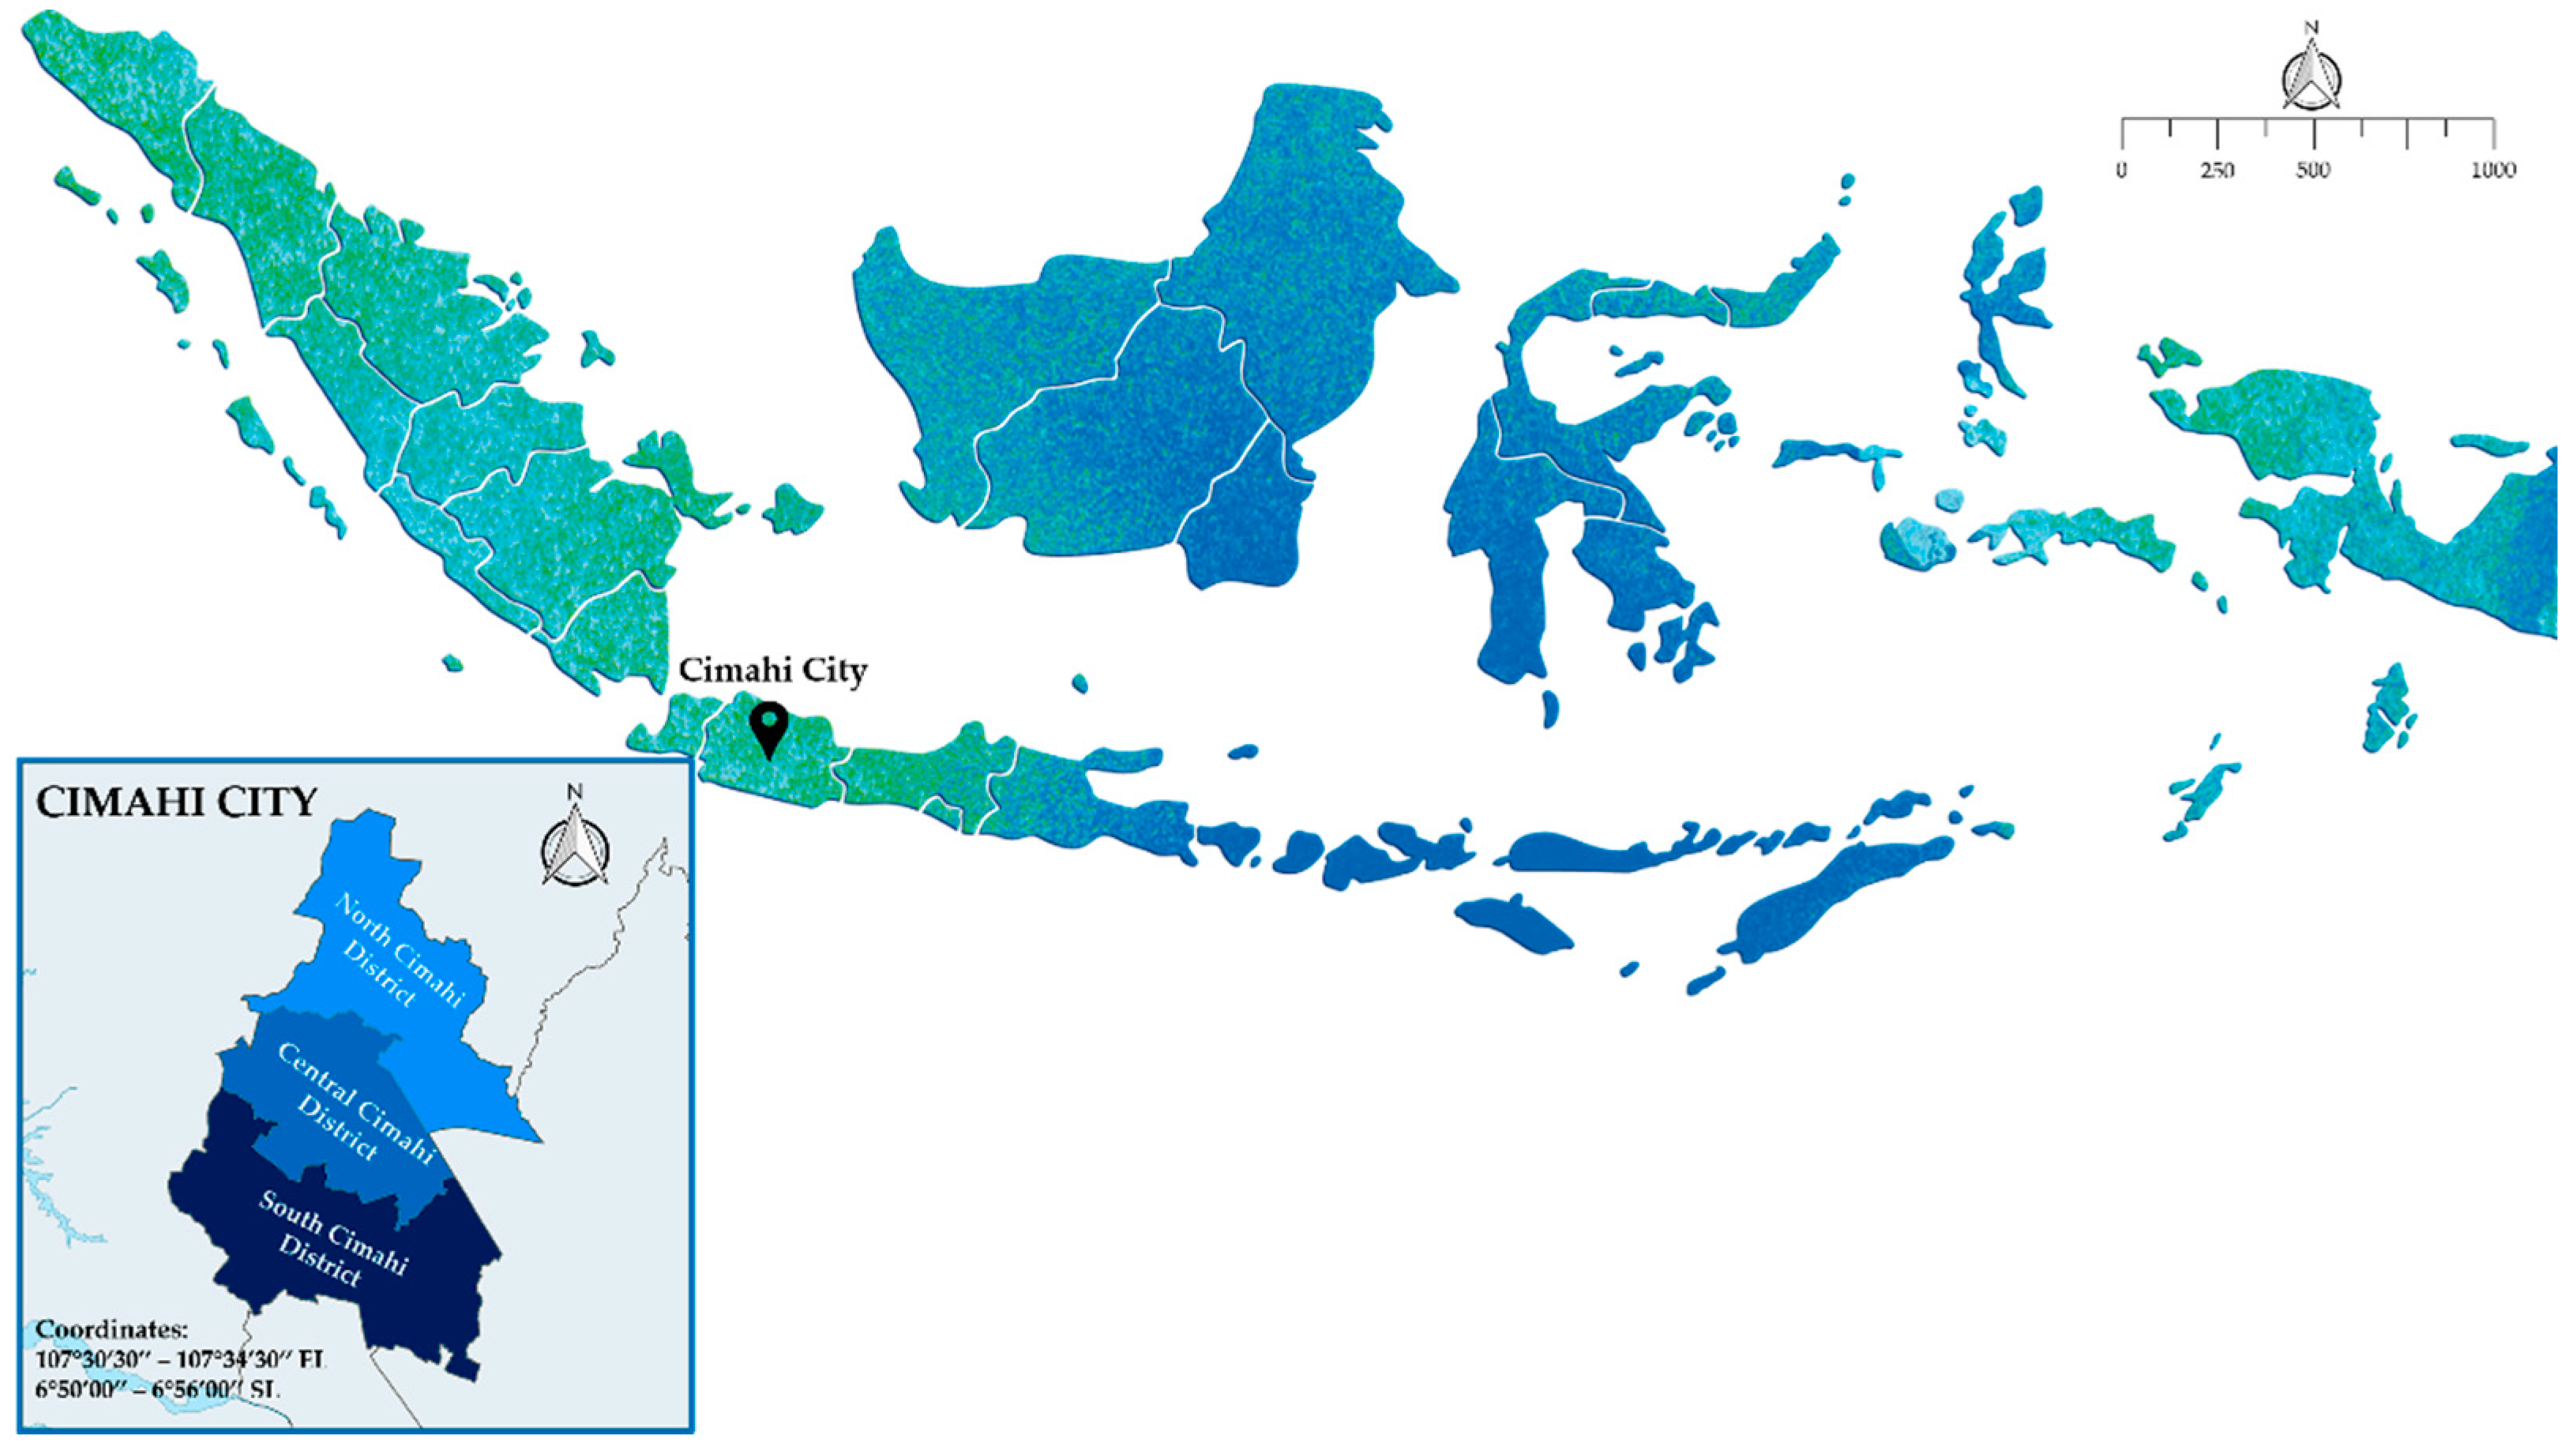
3.1. Cimahi City
3.2. Cross-Sectional Survey
3.3. Analysis
- ATP: Ability-to-pay (per m3 of water)
- It: Total household income per month
- Pp: % of water expenditure from non-food expenditure per month
- Tt : Total household water use per month, m3/month
- EWTP: Estimated value of WTP
- Wi: Value of WTP i
- Pfi: Relative frequency
4. Respondent Profile
5. Results
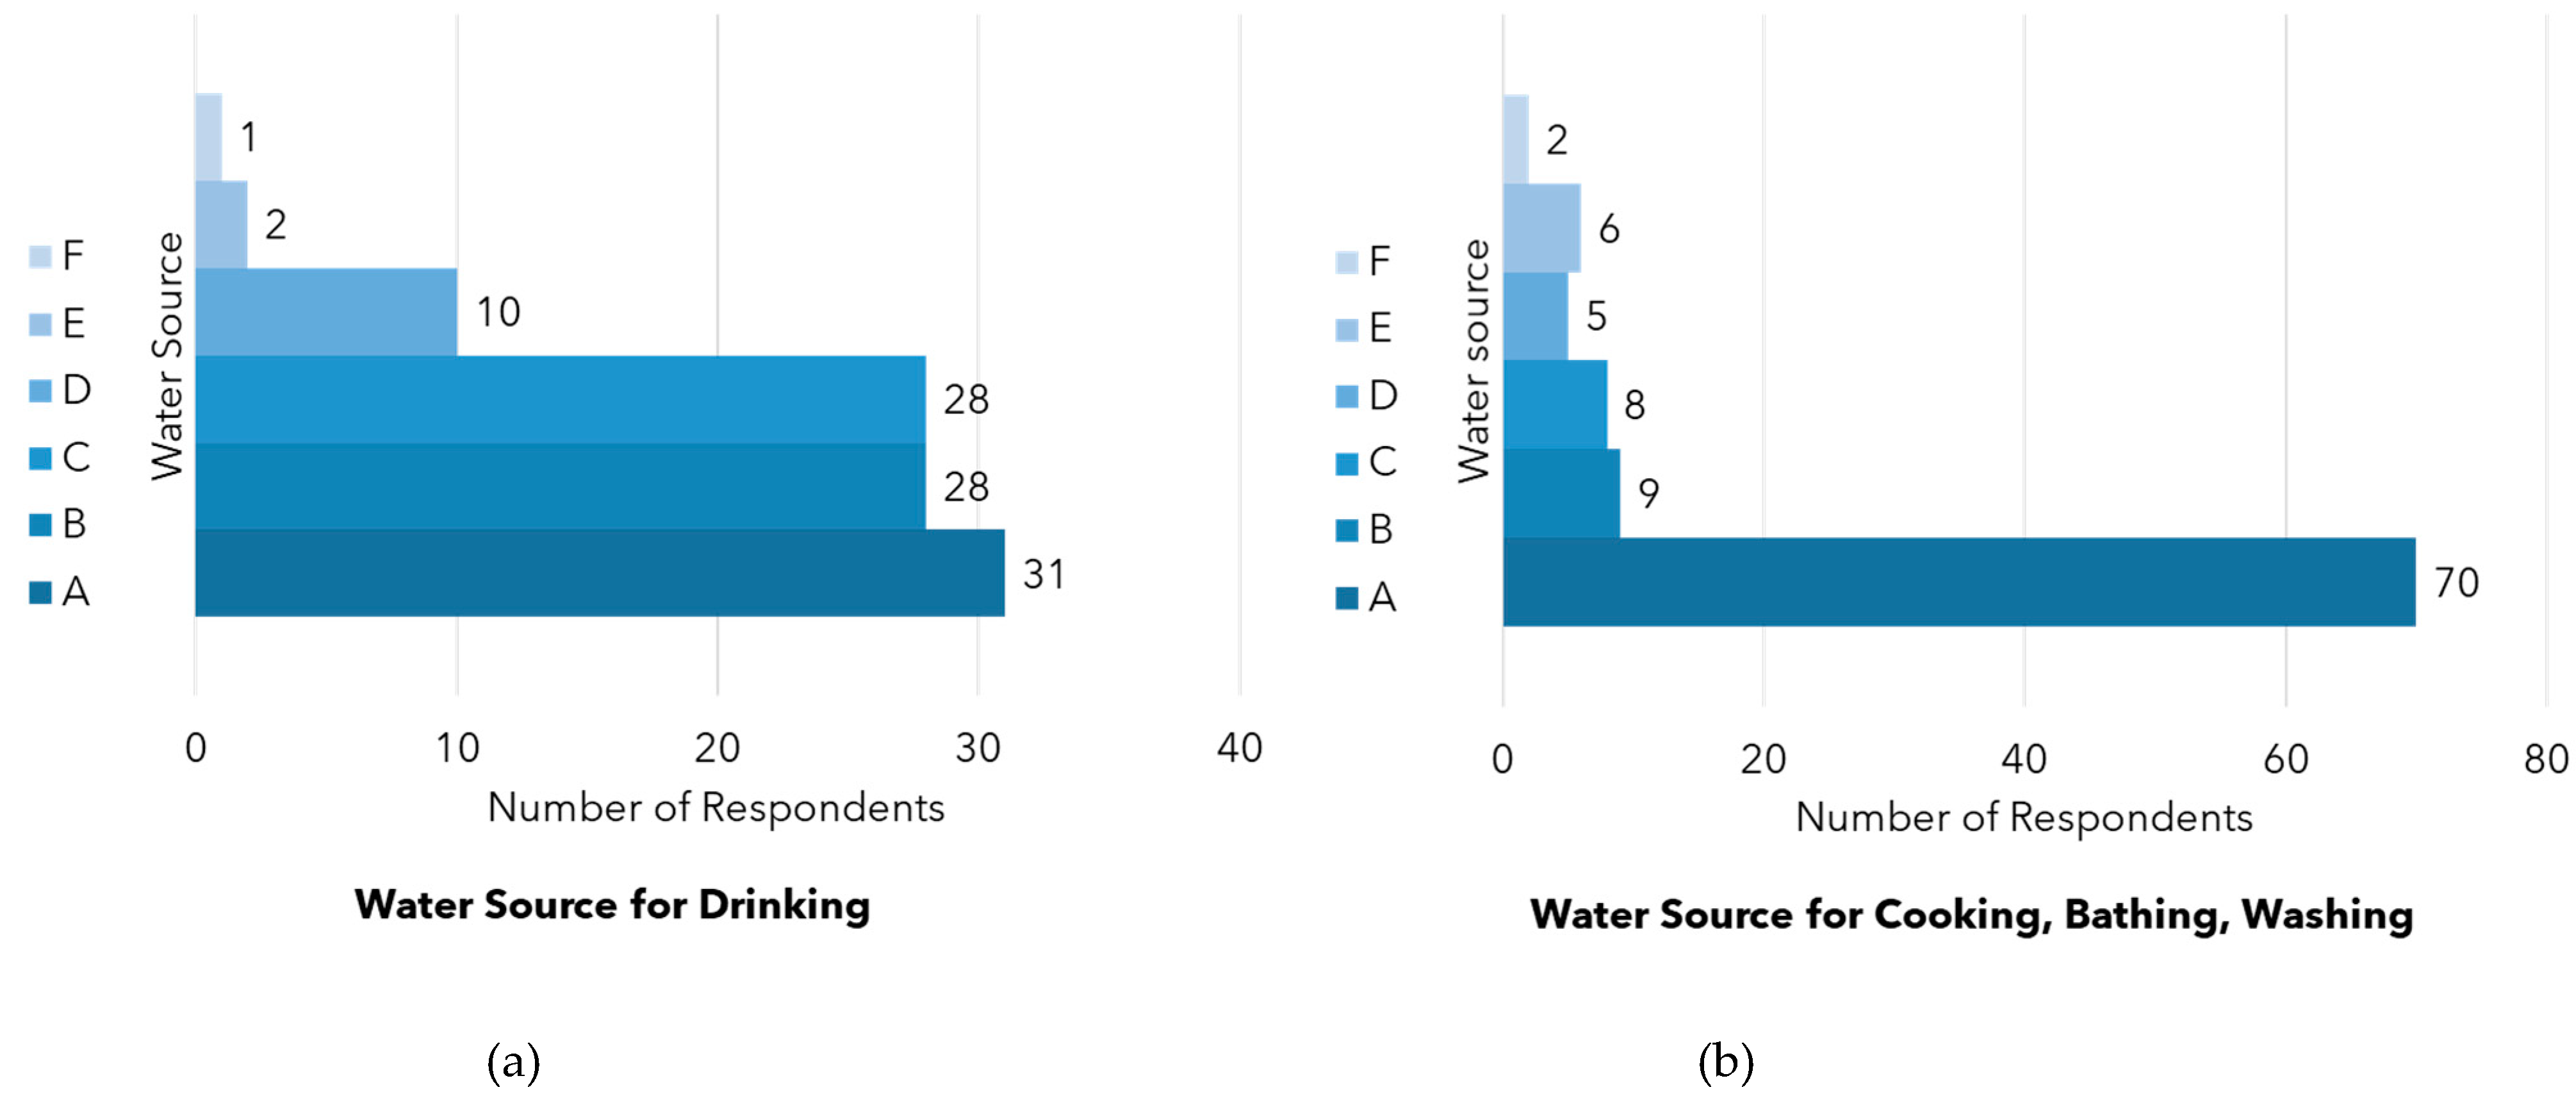
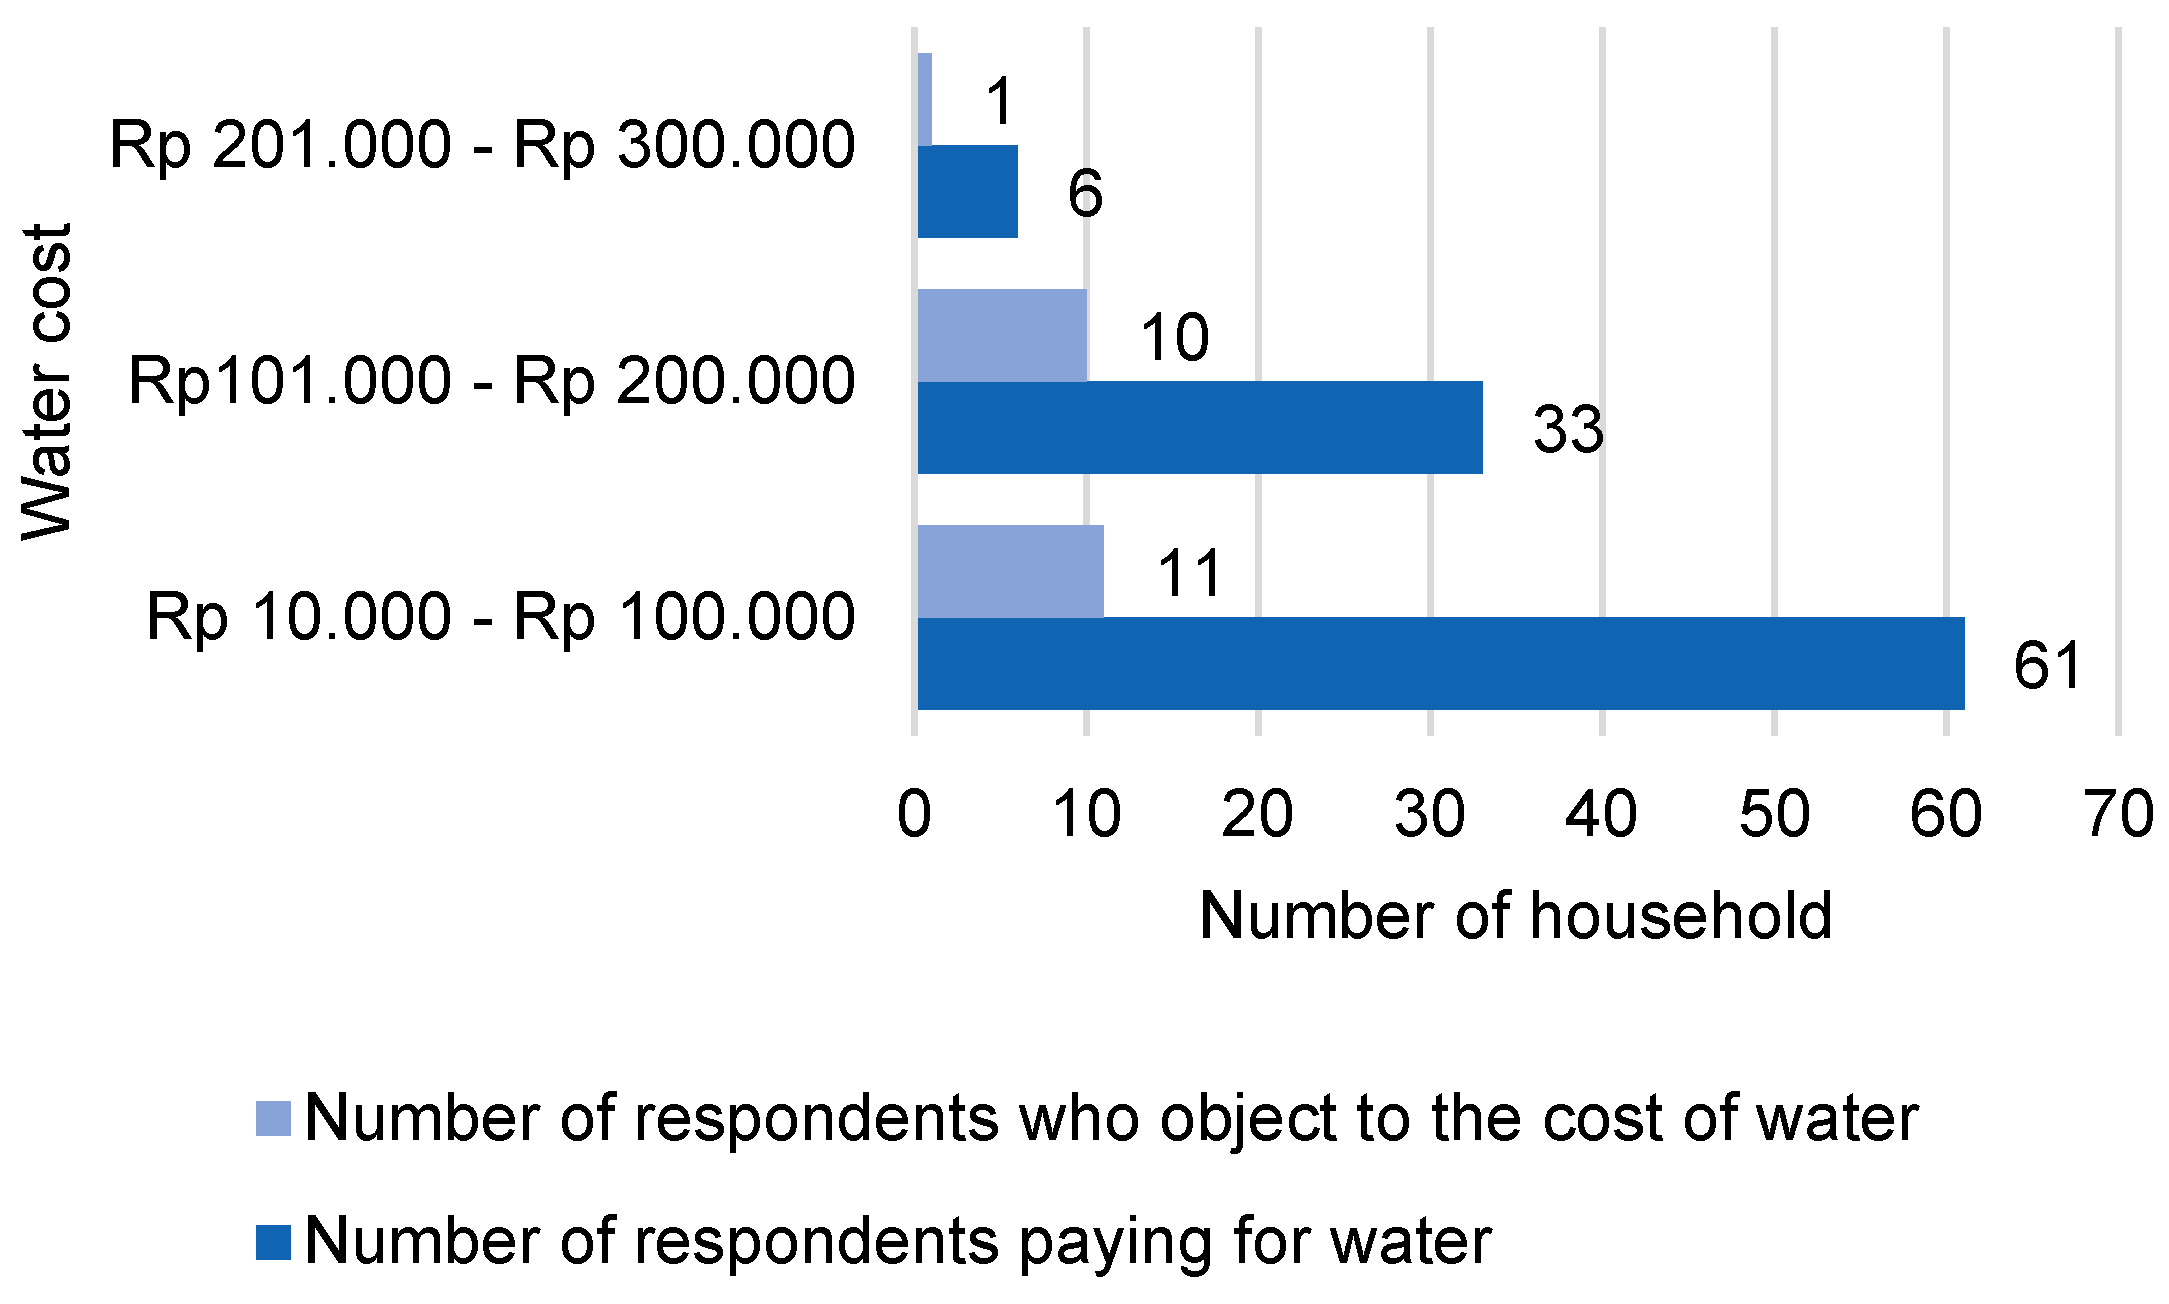
5.1. Access, Quality, Quantity, Continuity, and Affordability of Water Supply
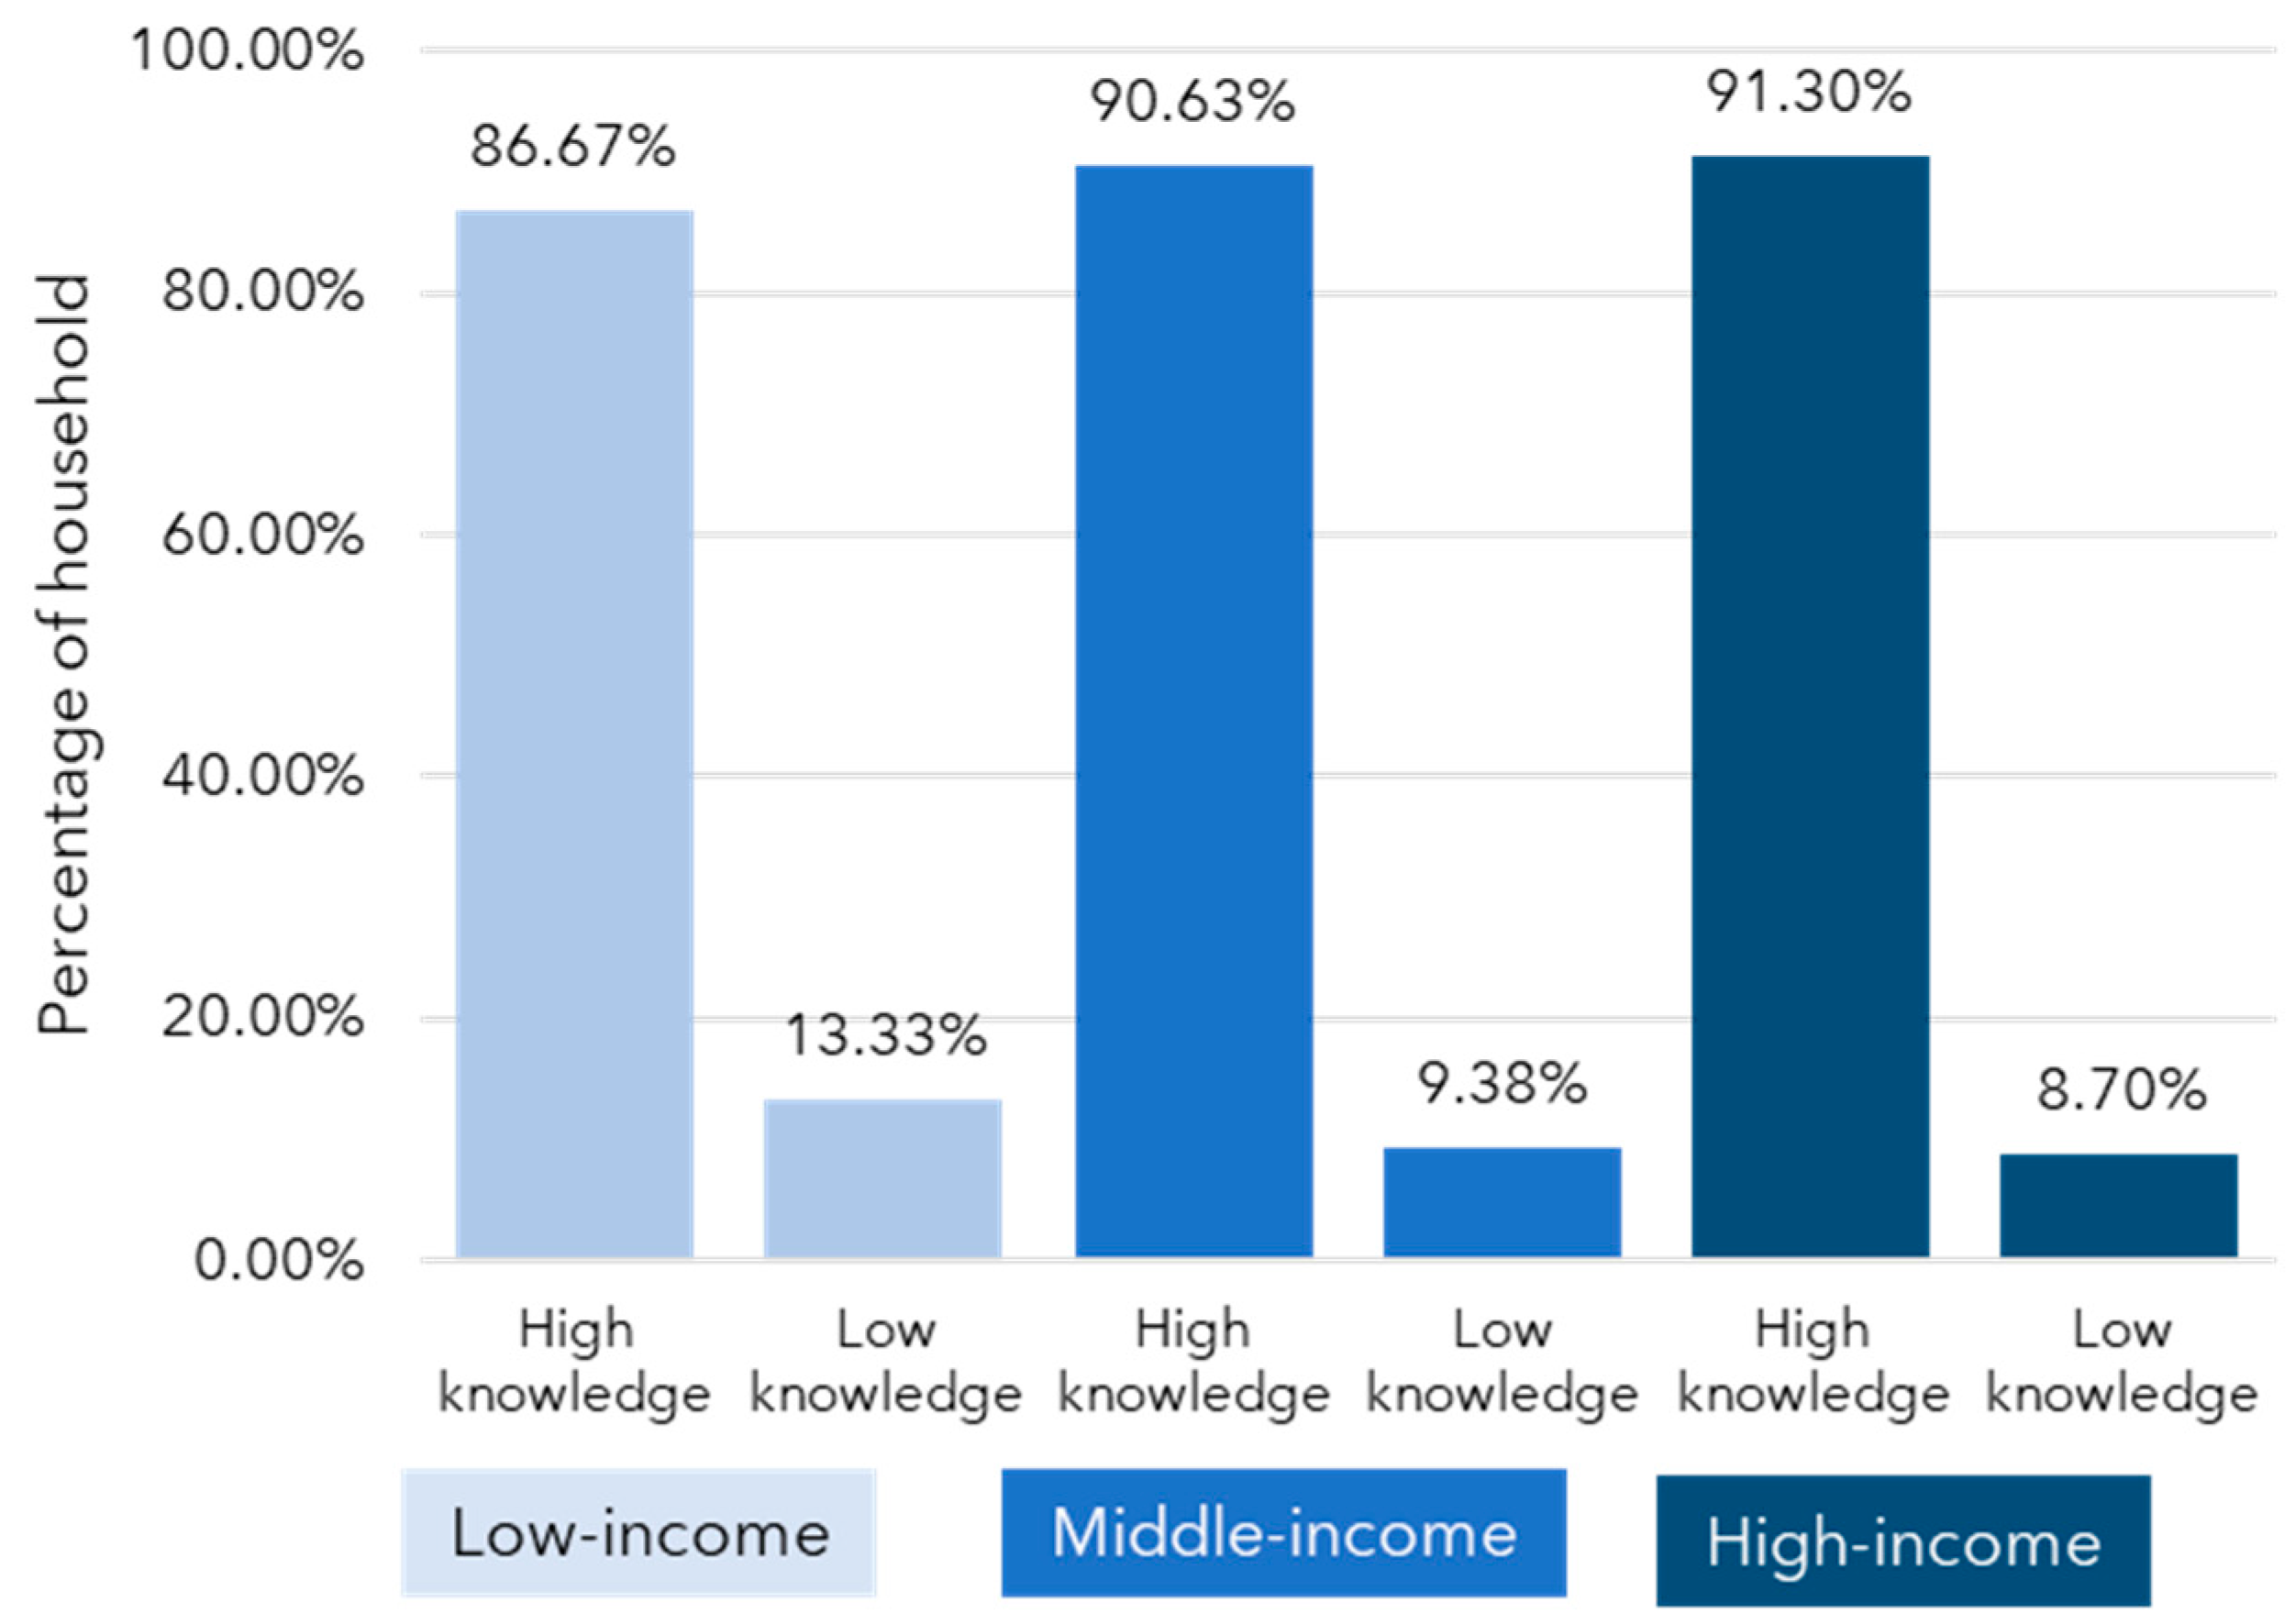
5.2. Knowledge and Perception of the ‘Off-Grid’ Community
- for low-income households
- for middle-income households
- for high-income households
6. Discussion
7. Conclusions
Supplementary Materials
Author Contributions
Funding
Institutional Review Board Statement
Informed Consent Statement
Data Availability Statement
Acknowledgments
Conflicts of Interest
Appendix A

| Questionnaire Items | Category |
|---|---|
| Drinking water can be consumed without treatment | Knowledge |
| Water quality must be tested first and meet the health requirements before it can be consumed | Knowledge |
| Water that is colorless, odorless, and tasteless has good quality | Knowledge |
| The quality of water used to meet daily needs does not affect human health | Knowledge |
| Various water sources available in nature have begun to deteriorate due to environmental pollution | Knowledge |
| The use of groundwater with boreholes/artesian wells to meet water needs can damage the environment | Knowledge |
| All Indonesian people have the same right to get water in sufficient quantities and of good quality | Knowledge |
| The government is obliged to provide drinking water for all Indonesian people | Knowledge |
| Waste that is disposed of in water bodies does not affect the production process carried out by the municipal water company | Knowledge |
| The community can receive water access from the government for free without being charged a fee | Knowledge |
| A quality drinking water supply system can be implemented if the community actively participates in the system | Knowledge |
| I believe that water quality will affect human health | ATB |
| I believe that I must participate in the drinking water supply system to meet my daily water needs (bathing, washing, cooking, drinking, etc.) | ATB |
| I believe that the solid waste problem will affect the quality of the water I use to meet my daily water needs (bathing, washing, cooking, drinking, etc.) | ATB |
| I believe that to get good quality water in sufficient quantities to meet daily needs (bathing, washing, cooking, drinking, etc.) costs money. | ATB |
| I believe community participation is needed in drinking water programs | ATB |
| I believe that new water service from community-based supply is superior in term of quality/quantity/affordability compared to my existing water sources. | ATB |
| I will dispose of solid waste in its designated place if people around me (family, neighbors, friends) do the same | SN |
| I will dispose of solid waste in its designated place if I get advice from community leaders (religious leaders, heads of neighborhood, etc.) | SN |
| I will pay the water fees even though the price increases if the people around me (family, neighbors, and friends) do the same. | SN |
| I will pay water fees even though the price increases if I get advice from local community leaders (religious leaders, heads of neighborhood, etc.) | SN |
| I will participate in water supply program if the people around me (family, neighbors, and friends) do the same. | SN |
| I will participate in water supply program if I get advice from local community leaders (religious leaders, heads of neighborhood, etc.) | SN |
| I will switch to a new water supply service from the community-based supply if the people around me (family, neighbors, and friends) do the same. | SN |
| I will switch to a new water supply service from the community-based supply if I get advice from local community leaders (religious leaders, heads of neighborhood, etc.) | SN |
| I can provide waste containers at my house to dispose of solid waste in its designated place | PBC |
| I will dispose of solid waste in its designated place if there are officers who take away solid waste from my house regularly | PBC |
| I have enough time to participate in water supply programs | PBC |
| I have enough money to participate in water supply programs | PBC |
| I will switch to a new water supply service from the community-based supply if the quality/quantity were acceptable or if it were affordable | PBC |
| I will not throw garbage or waste into water bodies | I |
| I will pay water retribution even though the tariff increases | I |
| I will participate in water supply program, in-kind or in cash | I |
| I will switch to a new water supply service from the community-based supply if such sources were available | I |
References
- Cassivi, A.; Johnston, R.; Waygood, E.O.D.; Dorea, C.C. Access to drinking water: Time matters. J. Water Health 2018, 16, 661–666. [Google Scholar] [CrossRef]
- Charles, K.J.; Nowicki, S.; Bartram, J.K. A framework for monitoring the safety of water services: From measurements to security. NPJ Clean Water 2020, 3, 1–6. [Google Scholar] [CrossRef]
- WHO/UNICEF. Progress on Drinking Water, Sanitation and Hygiene: Joint Monitoring Programme 2017 Update and SDG Baselines; WHO/UNICEF: Geneva, Switzerland, 2017; ISBN 978-92-4-151289-3. [Google Scholar]
- Deshpande, A.; Miller-Petrie, M.K.; Lindstedt, P.A.; Baumann, M.M.; Johnson, K.B.; Blacker, B.F.; Abbastabar, H.; Abd-Allah, F.; Abdelalim, A.; Abdollahpour, I.; et al. Mapping geographical inequalities in access to drinking water and sanitation facilities in low-income and middle-income countries, 2000–2017. Lancet Glob. Health 2020, 8, e1162–e1185. [Google Scholar] [CrossRef]
- Coutard, O.; Rutherford, J. Beyond the Networked City: Infrastructure Reconfigurations and Urban Change in the North and South; Routledge: New York, NY, USA, 2015; ISBN 978-1-138-79682-9. [Google Scholar]
- Al’Afghani, M.M.; Kohlitz, J.; Willetts, J. Not built to last: Improving legal and institutional arrangements for community-based water and sanitation service delivery in Indonesia. Water Altern. 2019, 12, 285–303. [Google Scholar]
- Jimenez-Redal, R.; Parker, A.; Jeffrey, P. Factors influencing the uptake of household water connections in peri-urban Maputo, Mozambique. Util. Policy 2014, 28, 22–27. [Google Scholar] [CrossRef] [Green Version]
- Arora, M.; Malano, H.; Davidson, B.; Nelson, R.; George, B. Interactions between centralized and decentralized water systems in urban context: A review. Wiley Interdiscip. Rev. Water 2015, 2, 623–634. [Google Scholar] [CrossRef]
- Schindler, S. Towards a paradigm of Southern urbanism. City 2017, 21, 1–8. [Google Scholar] [CrossRef]
- Lawhon, M.; Nilsson, D.; Silver, J.; Ernstson, H.; Lwasa, S. Thinking through heterogeneous infrastructure configurations. Urban. Stud. 2017, 55, 720–732. [Google Scholar] [CrossRef]
- Graham, S.; Marvin, S. Splintering Urbanism: Networked Infrastructures, Technological Mobilities and the Urban Condition; Psychology Press: New Fetter Lane, London, UK, 2001; ISBN 0-415-18964-0. [Google Scholar]
- Simone, A. People as Infrastructure: Intersecting Fragments in Johannesburg. Public Cult. 2004, 16, 407–429. [Google Scholar] [CrossRef] [Green Version]
- Carlitz, R.D. Money Flows, Water Trickles: Understanding Patterns of Decentralized Water Provision in Tanzania. World Dev. 2017, 93, 16–30. [Google Scholar] [CrossRef]
- Valcourt, N.; Javernick-Will, A.; Walters, J.; Linden, K. System Approaches to Water, Sanitation, and Hygiene: A Systematic Literature Review. Int. J. Environ. Res. Public Health 2020, 17, 702. [Google Scholar] [CrossRef] [Green Version]
- McConville, J.R.; Mihelcic, J.R. Adapting Life-Cycle Thinking Tools to Evaluate Project Sustainability in International Water and Sanitation Development Work. Environ. Eng. Sci. 2007, 24, 937–948. [Google Scholar] [CrossRef]
- Mimrose, D.; Gunawardena, E.R.N.; Nayakakorala, H.B. Assessment of Sustainability of Community Water Supply Projects in Kandy District. Trop. Agric. Res. 2012, 23, 51. [Google Scholar] [CrossRef] [Green Version]
- BPS-Statistics Indonesia. Statistical Yearbook of Indonesia 2021; BPS-Statistics Indonesia: Jakarta, Indonesia, 2021. [Google Scholar]
- Alnajdi, O.; Wu, Y.; Calautit, J.K. Toward a Sustainable Decentralized Water Supply: Review of Adsorption Desorption Desalination (ADD) and Current Technologies: Saudi Arabia (SA) as a Case Study. Water 2020, 12, 1111. [Google Scholar] [CrossRef] [Green Version]
- Bakker, K.; Kooy, M.; Shofiani, N.E.; Martijn, E.-J. Governance Failure: Rethinking the Institutional Dimensions of Urban Water Supply to Poor Households. World Dev. 2008, 36, 1891–1915. [Google Scholar] [CrossRef]
- Ajzen, I. The theory of planned behavior: Frequently asked questions. Hum. Behav. Emerg. Technol. 2020, 2, 314–324. [Google Scholar] [CrossRef]
- De Palencia, A.J.F.; Pérez-Foguet, A. Implementing pro-poor policies in a decentralized context: The case of the Rural Water Supply and Sanitation Program in Tanzania. Sustain. Sci. 2011, 6, 37–49. [Google Scholar] [CrossRef]
- Moriarty, P.; Smits, S.; Butterworth, J.; Franceys, R. Trends in rural water supply: Towards a service delivery approach. Water Altern. 2013, 6, 329–349. [Google Scholar]
- Ajzen, I.; Fishbein, M. Attitude-behavior relations: A theoretical analysis and review of empirical research. Psychol. Bull. 1977, 84, 888–918. [Google Scholar] [CrossRef]
- Qian, N. Bottled Water or Tap Water? A Comparative Study of Drinking Water Choices on University Campuses. Water 2018, 10, 59. [Google Scholar] [CrossRef] [Green Version]
- Webb, T.L.; Joseph, J.; Yardley, L.; Michie, S. Using the Internet to Promote Health Behavior Change: A Systematic Review and Meta-analysis of the Impact of Theoretical Basis, Use of Behavior Change Techniques, and Mode of Delivery on Efficacy. J. Med. Internet Res. 2010, 12, e4. [Google Scholar] [CrossRef] [PubMed] [Green Version]
- Steinmetz, H.; Knappstein, M.; Ajzen, I.; Schmidt, P.; Kabst, R. How Effective are Behavior Change Interventions Based on the Theory of Planned Behavior? Z. Psychol. 2016, 224, 216–233. [Google Scholar] [CrossRef]
- Tomczyk, S.; Schomerus, G.; Stolzenburg, S.; Muehlan, H.; Schmidt, S. Ready, Willing and Able? An Investigation of the Theory of Planned Behaviour in Help-Seeking for a Community Sample with Current Untreated Depressive Symptoms. Prev. Sci. 2020, 21, 749–760. [Google Scholar] [CrossRef] [Green Version]
- Elyasi, M.; Lai, H.; Major, P.W.; Baker, S.R.; Amin, M. Modeling the Theory of Planned Behaviour to predict adherence to preventive dental visits in preschool children. PLoS ONE 2020, 15, e0227233. [Google Scholar] [CrossRef] [Green Version]
- Liobikienė, G.; Dagiliūtė, R.; Juknys, R. The determinants of renewable energy usage intentions using theory of planned behaviour approach. Renew. Energy 2021, 170, 587–594. [Google Scholar] [CrossRef]
- Lim, H.-R.; An, S. Intention to purchase wellbeing food among Korean consumers: An application of the Theory of Planned Behavior. Food Qual. Prefer. 2021, 88, 104101. [Google Scholar] [CrossRef] [PubMed]
- Japutra, A.; Loureiro, S.M.C.; Molinillo, S.; Ekinci, Y. Travellers’ mindsets and theory of planned behaviour. Tour. Manag. Perspect. 2019, 30, 193–196. [Google Scholar] [CrossRef] [Green Version]
- Bagheri, A.; Emami, N.; Damalas, C.A. Farmers’ behavior towards safe pesticide handling: An analysis with the theory of planned behavior. Sci. Total. Environ. 2021, 751, 141709. [Google Scholar] [CrossRef] [PubMed]
- de Leeuw, A.; Valois, P.; Ajzen, I.; Schmidt, P. Using the theory of planned behavior to identify key beliefs underlying pro-environmental behavior in high-school students: Implications for educational interventions. J. Environ. Psychol. 2015, 42, 128–138. [Google Scholar] [CrossRef]
- Greaves, M.; Zibarras, L.D.; Stride, C. Using the theory of planned behavior to explore environmental behavioral intentions in the workplace. J. Environ. Psychol. 2013, 34, 109–120. [Google Scholar] [CrossRef]
- Department of Public Works and Spatial Planning. Cakupan Pelayanan Air Bersih Kota Cimahi Tahun 2018. Available online: https://data.cimahikota.go.id/data-detail/325 (accessed on 22 January 2021).
- Citeureup Village. Monografi Keluarahan Cituereup 2020; Citeureup Village: Cimahi, Indonesia, 2020. [Google Scholar]
- Cimahi City Health Office. Profil Kesehatan Kota Cimahi Tahun 2017; Cimahi City Health Office: Cimahi, Indonesia, 2018. [Google Scholar]
- Etikan, I.; Musa, S.A.; Alkassim, R.S. Comparison of Convenience Sampling and Purposive Sampling. Am. J. Theor. Appl. Stat. 2016, 5, 1. [Google Scholar] [CrossRef] [Green Version]
- Zar, J.H. Spearman Rank Correlation. Encycl. Biostat. 2005. [Google Scholar] [CrossRef]
- Yudariansyah, H.; Supriharyono; Nasrulah. Analisis Keterjangkauan Daya Beli Masyarakat Terhadap Tarif Air Bersih (PDAM) Kota Malang (Studi Kasus Perumahan Sawojajar). Pilar 2006, 15, 78–87. [Google Scholar]
- BPS-Statistics of West Java Province. West Java in Figures 2021; BPS-Statistics of West Java Province: West Java, Indonesia, 2021; ISSN 0215-2169. [Google Scholar]
- Ministry of Home Affairs of Republic of Indonesia. Peraturan Menteri Dalam Negeri Republik Indonesia Nomor 71 Tahun 2018 tentang Perhitungan dan Penetapan Tarif Air Minum; Ministry of Home Affairs of Republic of Indonesia: Jakarta, Indonesia, 2016. [Google Scholar]
- Nurul-Fitri, A. Analisis Skenario Pembiayaan untuk Meningkatkan Pelayanan Air Bersih dan Air Limbah Kota Bandung Berdasarkan Kesediaan dan Kemampuan Membayar Masyarakat; ITB: Bandung, Indonesia, 2021; pp. 130–163. [Google Scholar]
- Hastuti, E.; Nuraeni, R. Pendekatan Sanitasi untuk Pemulihan Kondisi Air Tanah di Perkotaan. J. Teknik Lingkung. 2017, 18, 1–70. [Google Scholar] [CrossRef] [Green Version]
- Tussupova, K.; Berndtsson, R.; Bramryd, T.; Beisenova, R. Investigating Willingness to Pay to Improve Water Supply Services: Application of Contingent Valuation Method. Water 2015, 7, 3024–3039. [Google Scholar] [CrossRef] [Green Version]
- Susilowati, I.; Malik, H.N.; Choirunnisa, A.; Afifah, F.A.N.; Niswah, U. Willingness to Pay to Overcome Pollution in Tapak River, Semarang. JEJAK 2019, 12, 204–217. [Google Scholar] [CrossRef]
- Sima, L.C.; Mccarty, K.M.; Elimelech, M.; Desai, M.M. Relationship between Use of Water from Community-Scale Water Treatment Refill Kiosks and Childhood Diarrhea in Jakarta. Am. J. Trop. Med. Hyg. 2012, 87, 979–984. [Google Scholar] [CrossRef] [PubMed] [Green Version]
- Pattanayak, S.K.; Yang, J.-C.; Whittington, D.; Kumar, K.C.B. Coping with unreliable public water supplies: Averting expenditures by households in Kathmandu, Nepal. Water Resour. Res. 2005, 41, 2. [Google Scholar] [CrossRef] [Green Version]
- Hasan, M.B.; Driessen, P.P.J.; Majumder, S.; Zoomers, A.; van Laerhoven, F. Factors Affecting Consumption of Water from a Newly Introduced Safe Drinking Water System: The Case of Managed Aquifer Recharge (MAR) Systems in Bangladesh. Water 2019, 11, 2459. [Google Scholar] [CrossRef] [Green Version]
- Nastiti, A.; Muntalif, B.S.; Roosmini, D.; Sudradjat, A.; Meijerink, S.; Smits, A. Coping with poor water supply in peri-urban Bandung, Indonesia: Towards a framework for understanding risks and aversion behaviours. Environ. Urban. 2017, 29, 69–88. [Google Scholar] [CrossRef]
- Agrawal, V.; Bhalwar, R. Household Water Purification: Low-Cost Interventions. Med. J. Armed Forces India 2009, 65, 260–263. [Google Scholar] [CrossRef] [Green Version]
- OECD. Social Issues in the Provision and Pricing of Water Services (Summary in Spanish); OECD: Paris, France, 2004. [Google Scholar]
- Fankhauser, S.; Tepic, S. Can poor consumers pay for energy and water? An affordability analysis for transition countries. Energy Policy 2007, 35, 1038–1049. [Google Scholar] [CrossRef]
- Katuwal, H.; Bohara, A.K. Coping with poor water supplies: Empirical evidence from Kathmandu, Nepal. J. Water Health 2011, 9, 143–158. [Google Scholar] [CrossRef] [PubMed] [Green Version]
- Cook, J.; Kimuyu, P.; Whittington, D. The costs of coping with poor water supply in rural Kenya. Water Resour. Res. 2016, 52, 841–859. [Google Scholar] [CrossRef] [Green Version]
- Kumar, A.; Taxak, A.K.; Mishra, S.; Pandey, R. Long term trend analysis and suitability of water quality of River Ganga at Himalayan hills of Uttarakhand, India. Environ. Technol. Innov. 2021, 22, 101405. [Google Scholar] [CrossRef]
- Lone, S.A.; Bhat, S.U.; Hamid, A.; Bhat, F.A.; Kumar, A. Quality assessment of springs for drinking water in the Himalaya of South Kashmir, India. Environ. Sci. Pollut. Res. 2021, 28, 2279–2300. [Google Scholar] [CrossRef] [PubMed]
- Otto, S.; Neaman, A.; Richards, B.; Marió, A. Explaining the Ambiguous Relations Between Income, Environmental Knowledge, and Environmentally Significant Behavior. Soc. Nat. Resour. 2015, 29, 628–632. [Google Scholar] [CrossRef]
- Clark, W.A.; Finley, J.C. Determinants of Water Conservation Intention in Blagoevgrad, Bulgaria. Soc. Nat. Resour. 2007, 20, 613–627. [Google Scholar] [CrossRef]


| Attribute | Responses |
|---|---|
| Gender | Male = 56%; Female = 44% |
| Age | <20 = 14%; 21–30 = 27%; 31–40 = 17%; 41–50 = 20%; 51–60 = 19%; 61–70 = 3% |
| Education | Primary school = 3%; junior high school = 11%; high school = 47%; diploma = 10%; undergraduate = 25%; postgraduate = 4% |
| Income | Low (<IDR 3,241,929 or <USD 233.17) = 45%; Middle (IDR 3,421,930–IDR 6,483,858 or USD 223.17–USD 471.12) = 32%; High (>IDR 5,483,858 or > USD 471.12) = 23% |
| Status | Head of household = 41%; Household member = 59% |
| Income | Number of Households, % |
|---|---|
| Low | 40 out of 45 households, 88.9 |
| Middle | 24 out of 32 households, 75 |
| High | 2 out of 23 households, 8.6 |
| Income | ATB | SN | PBC | I |
|---|---|---|---|---|
| Low | 4.11 | 3.49 | 4.08 | 4.02 |
| Middle | 4.23 | 3.55 | 4.10 | 3.96 |
| High | 4.09 | 3.77 | 4.08 | 4.09 |
| Variable | R | R2 | Reg. Coeff | Constant | SE | SR |
|---|---|---|---|---|---|---|
| Low-Income Household | ||||||
| ATB | 0.566 | 0.320 | 0.422 | 0.684 | 15.92% | 49.59% |
| SN | 0.202 | 8.63% | 26.89% | |||
| PBC | 0.219 | 7.55% | 23.52% | |||
| Middle-Income Household | ||||||
| ATB | 0.708 | 0.501 | 0.565 | −0.267 | 22.69% | 45.28% |
| SN | 0.217 | 13.52% | 26.99% | |||
| PBC | 0.285 | 13.90% | 27.74% | |||
| High-Income Household | ||||||
| ATB | 0.822 | 0.676 | 0.120 | 1.167 | 7.30% | 10.80% |
| SN | −0.163 | −4.95% | −7.32% | |||
| PBC | 0.745 | 65.24% | 96.52% | |||
Publisher’s Note: MDPI stays neutral with regard to jurisdictional claims in published maps and institutional affiliations. |
© 2021 by the authors. Licensee MDPI, Basel, Switzerland. This article is an open access article distributed under the terms and conditions of the Creative Commons Attribution (CC BY) license (https://creativecommons.org/licenses/by/4.0/).
Share and Cite
Prayoga, R.; Nastiti, A.; Schindler, S.; Kusumah, S.W.D.; Sutadian, A.D.; Sundana, E.J.; Simatupang, E.; Wibowo, A.; Budiwantoro, B.; Sedighi, M. Perceptions of Drinking Water Service of the ‘Off-Grid’ Community in Cimahi, Indonesia. Water 2021, 13, 1398. https://0-doi-org.brum.beds.ac.uk/10.3390/w13101398
Prayoga R, Nastiti A, Schindler S, Kusumah SWD, Sutadian AD, Sundana EJ, Simatupang E, Wibowo A, Budiwantoro B, Sedighi M. Perceptions of Drinking Water Service of the ‘Off-Grid’ Community in Cimahi, Indonesia. Water. 2021; 13(10):1398. https://0-doi-org.brum.beds.ac.uk/10.3390/w13101398
Chicago/Turabian StylePrayoga, Rizky, Anindrya Nastiti, Seth Schindler, Siska W. D. Kusumah, Arief D. Sutadian, Eka J. Sundana, Elivas Simatupang, Arie Wibowo, Bagus Budiwantoro, and Majid Sedighi. 2021. "Perceptions of Drinking Water Service of the ‘Off-Grid’ Community in Cimahi, Indonesia" Water 13, no. 10: 1398. https://0-doi-org.brum.beds.ac.uk/10.3390/w13101398