
The Role of Faults in Groundwater Circulation before and after Seismic Events: Insights from Tracers, Water Isotopes and Geochemistry

 ,
,  , , , and
Abstract
:1. Introduction
2. Materials and Methods
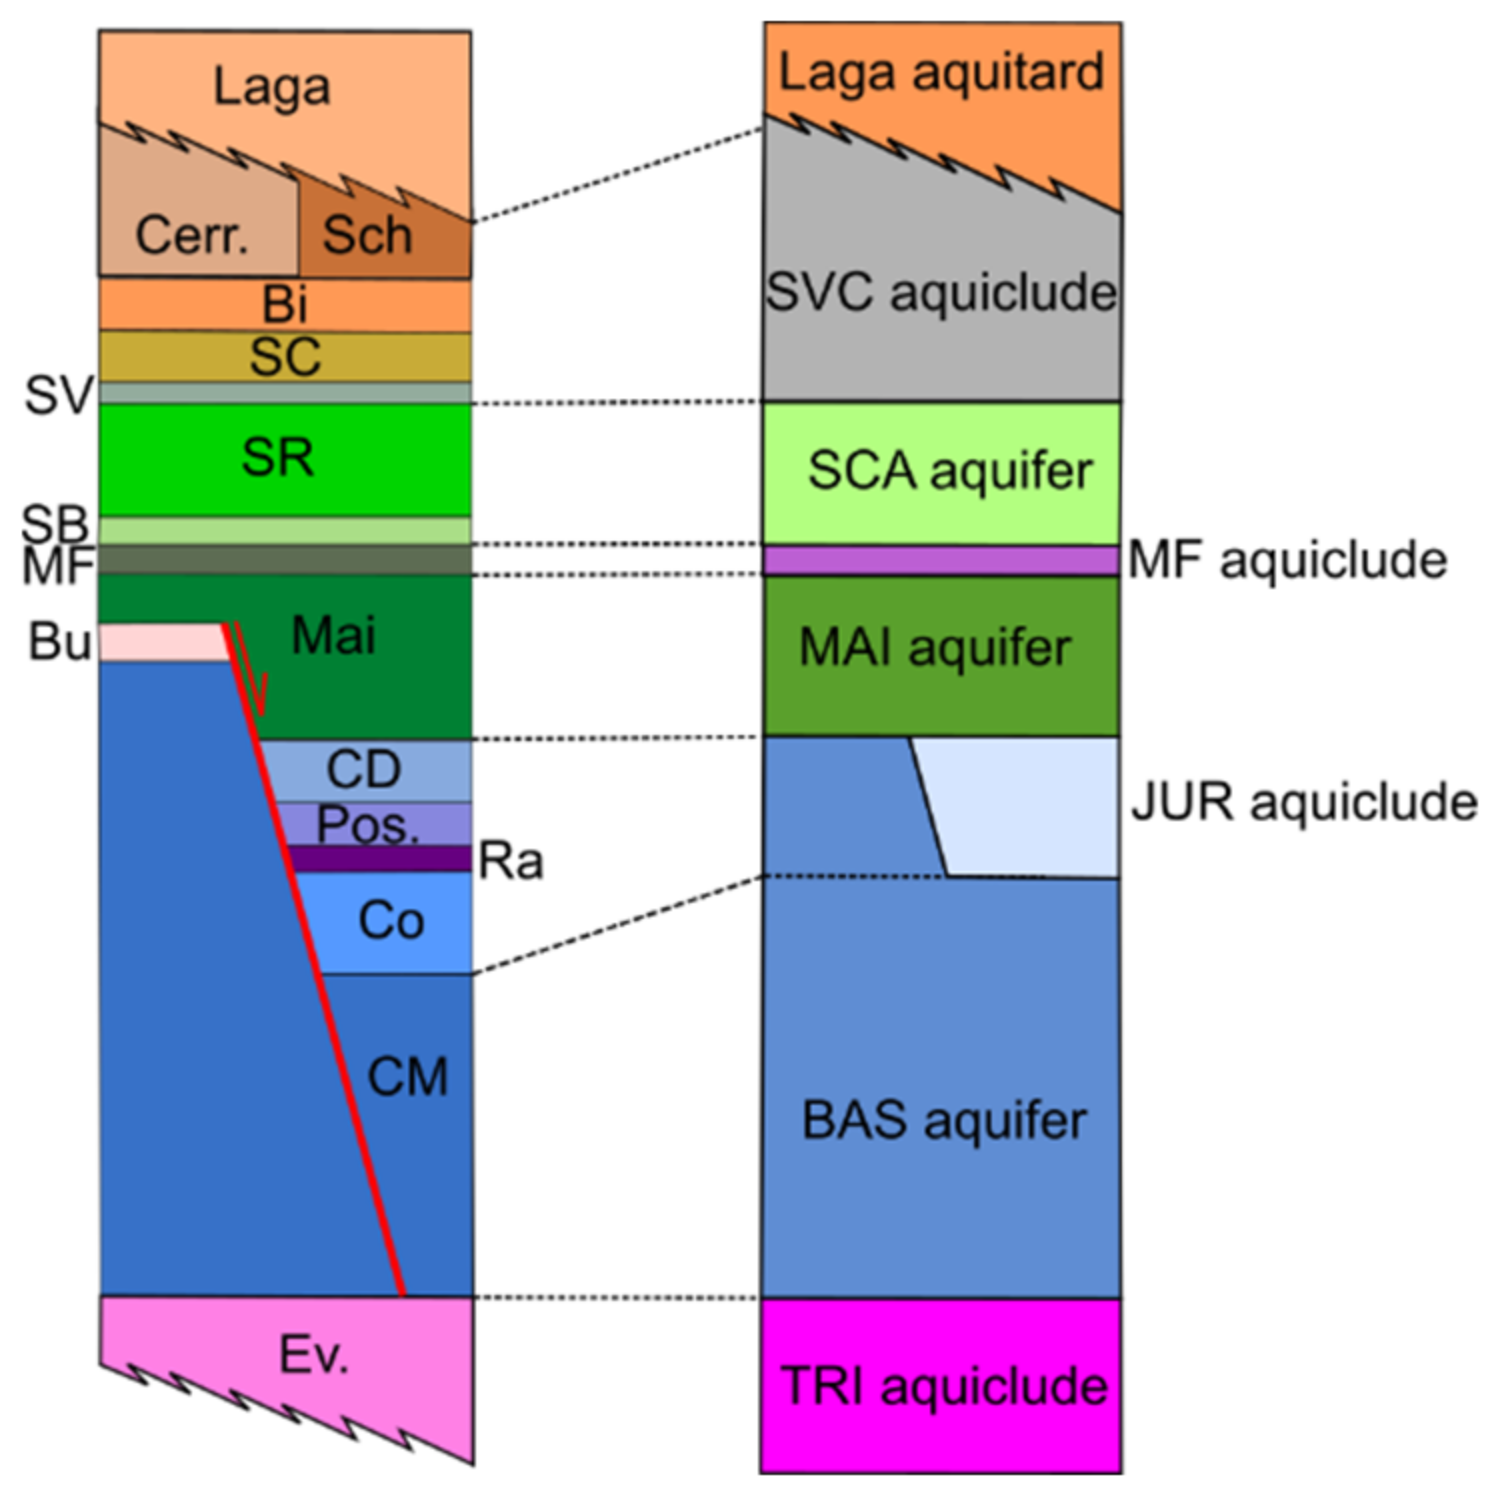
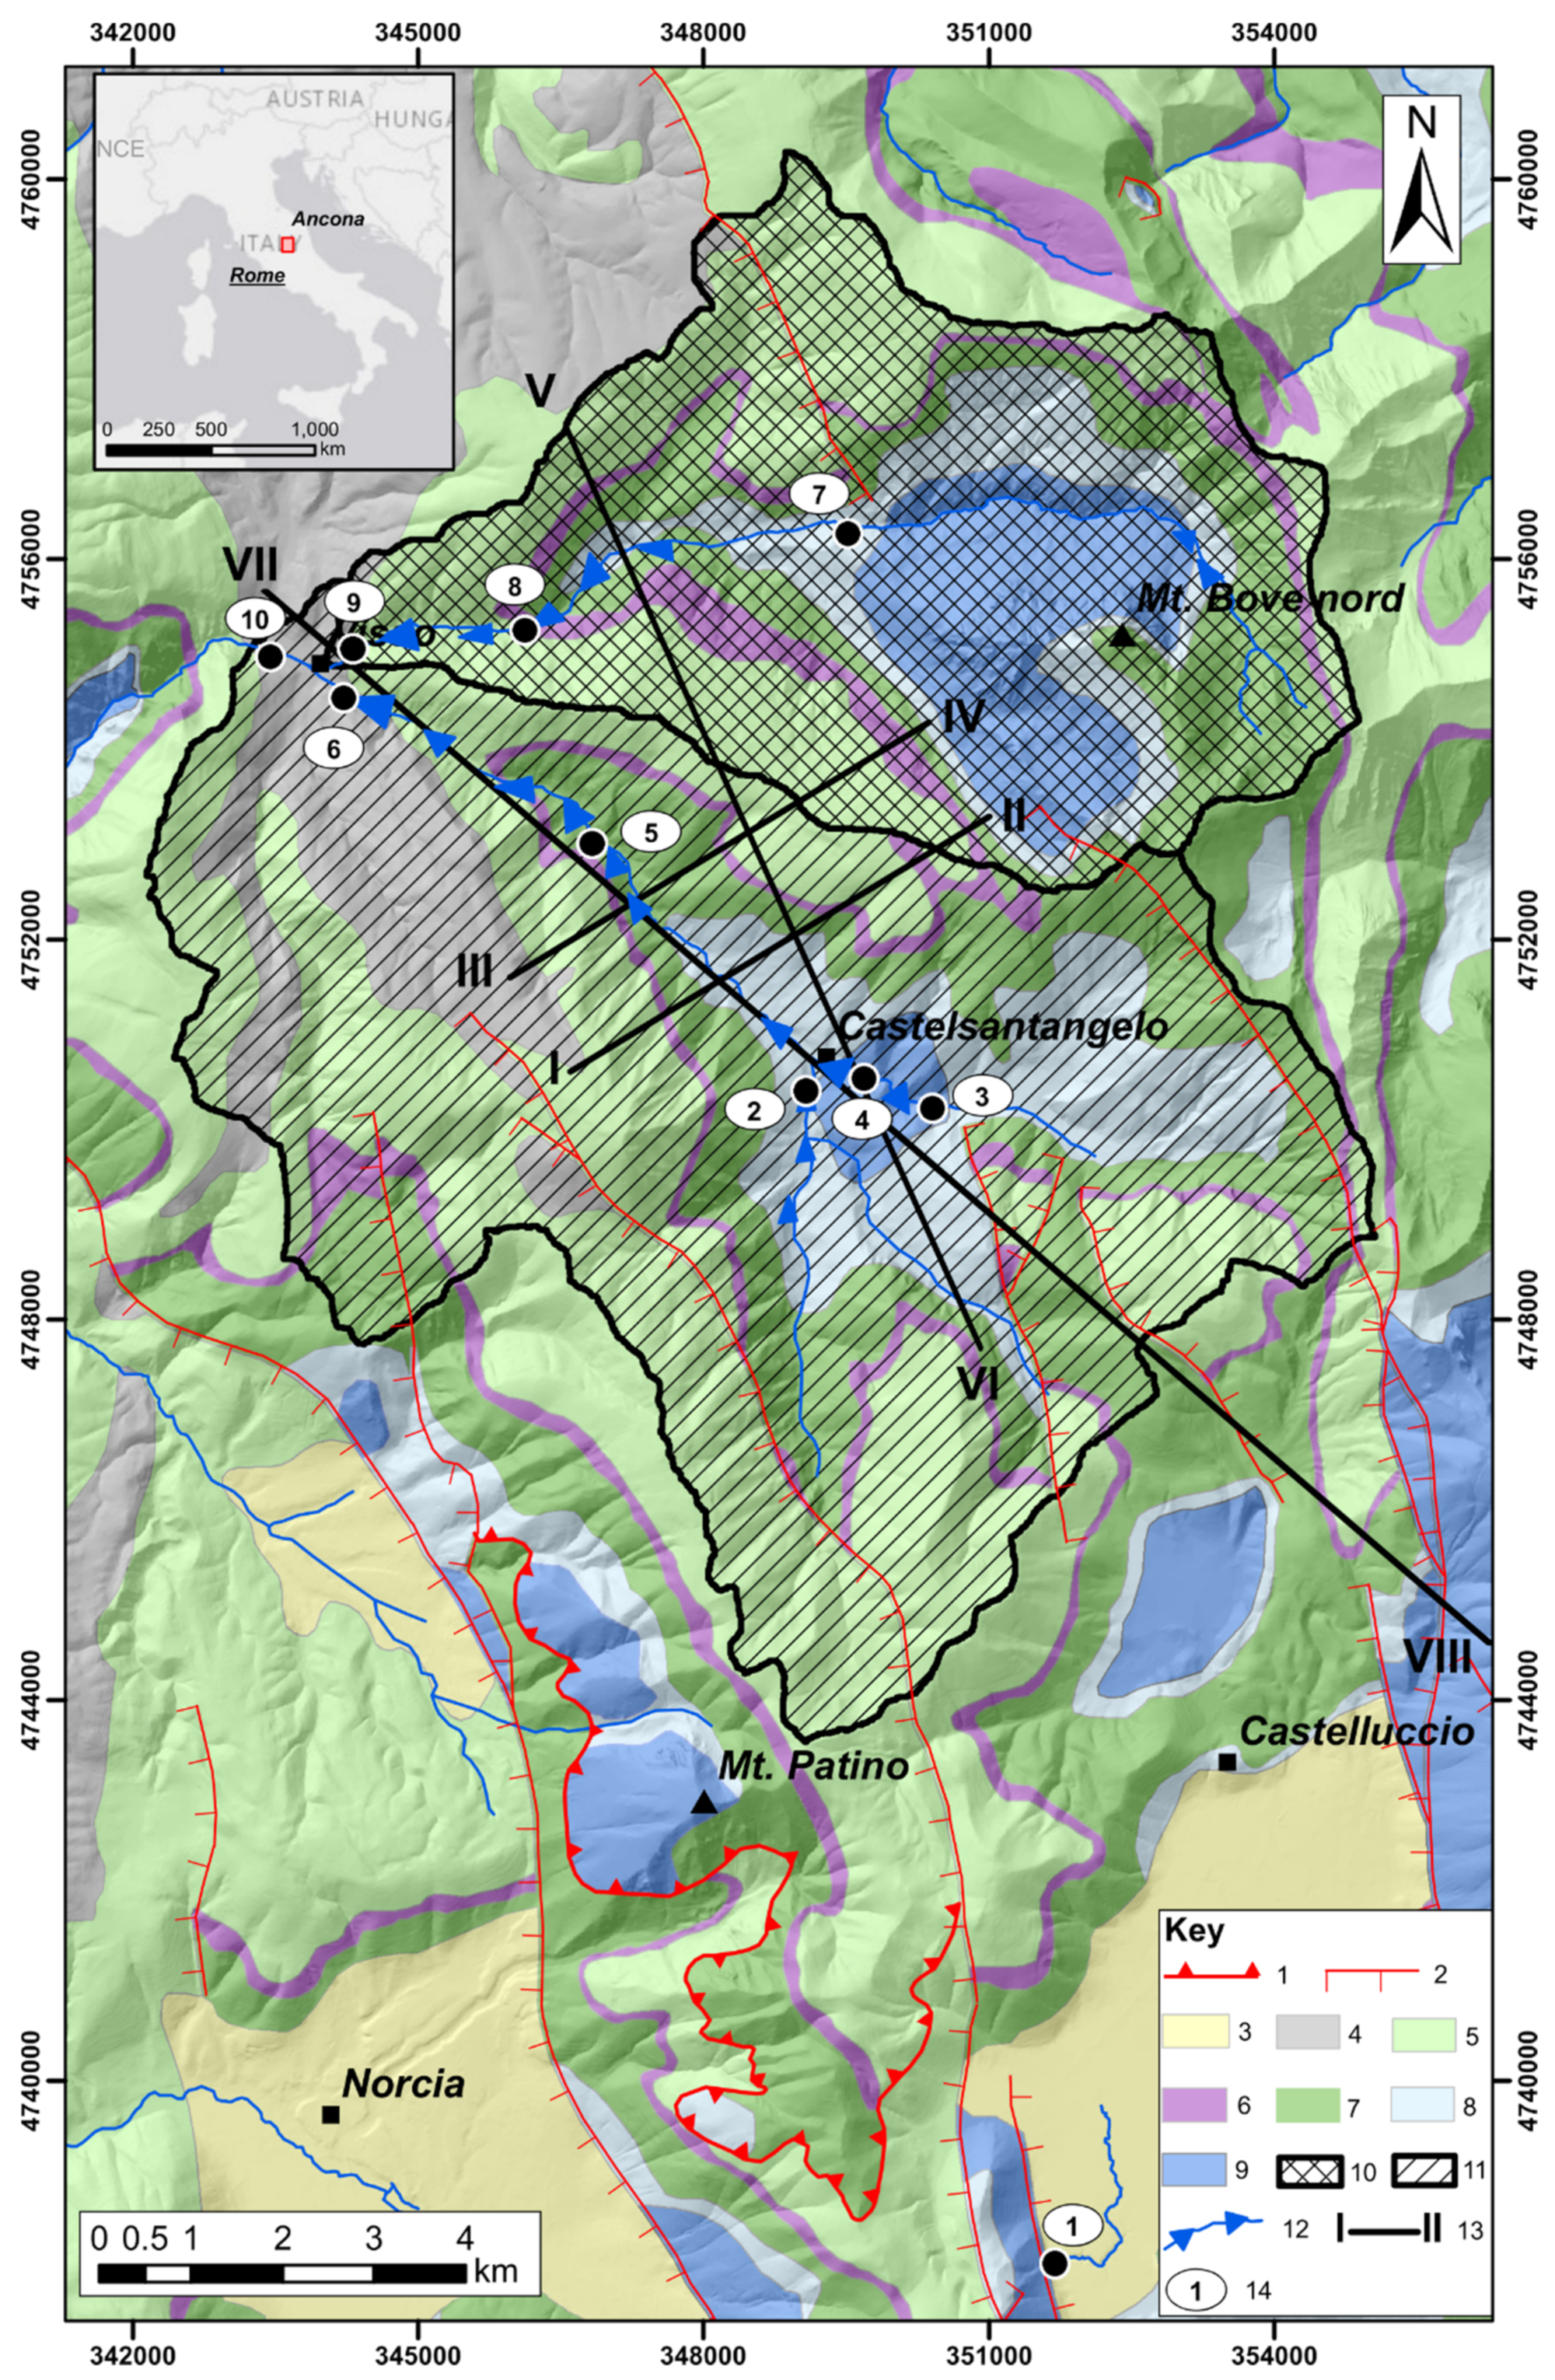
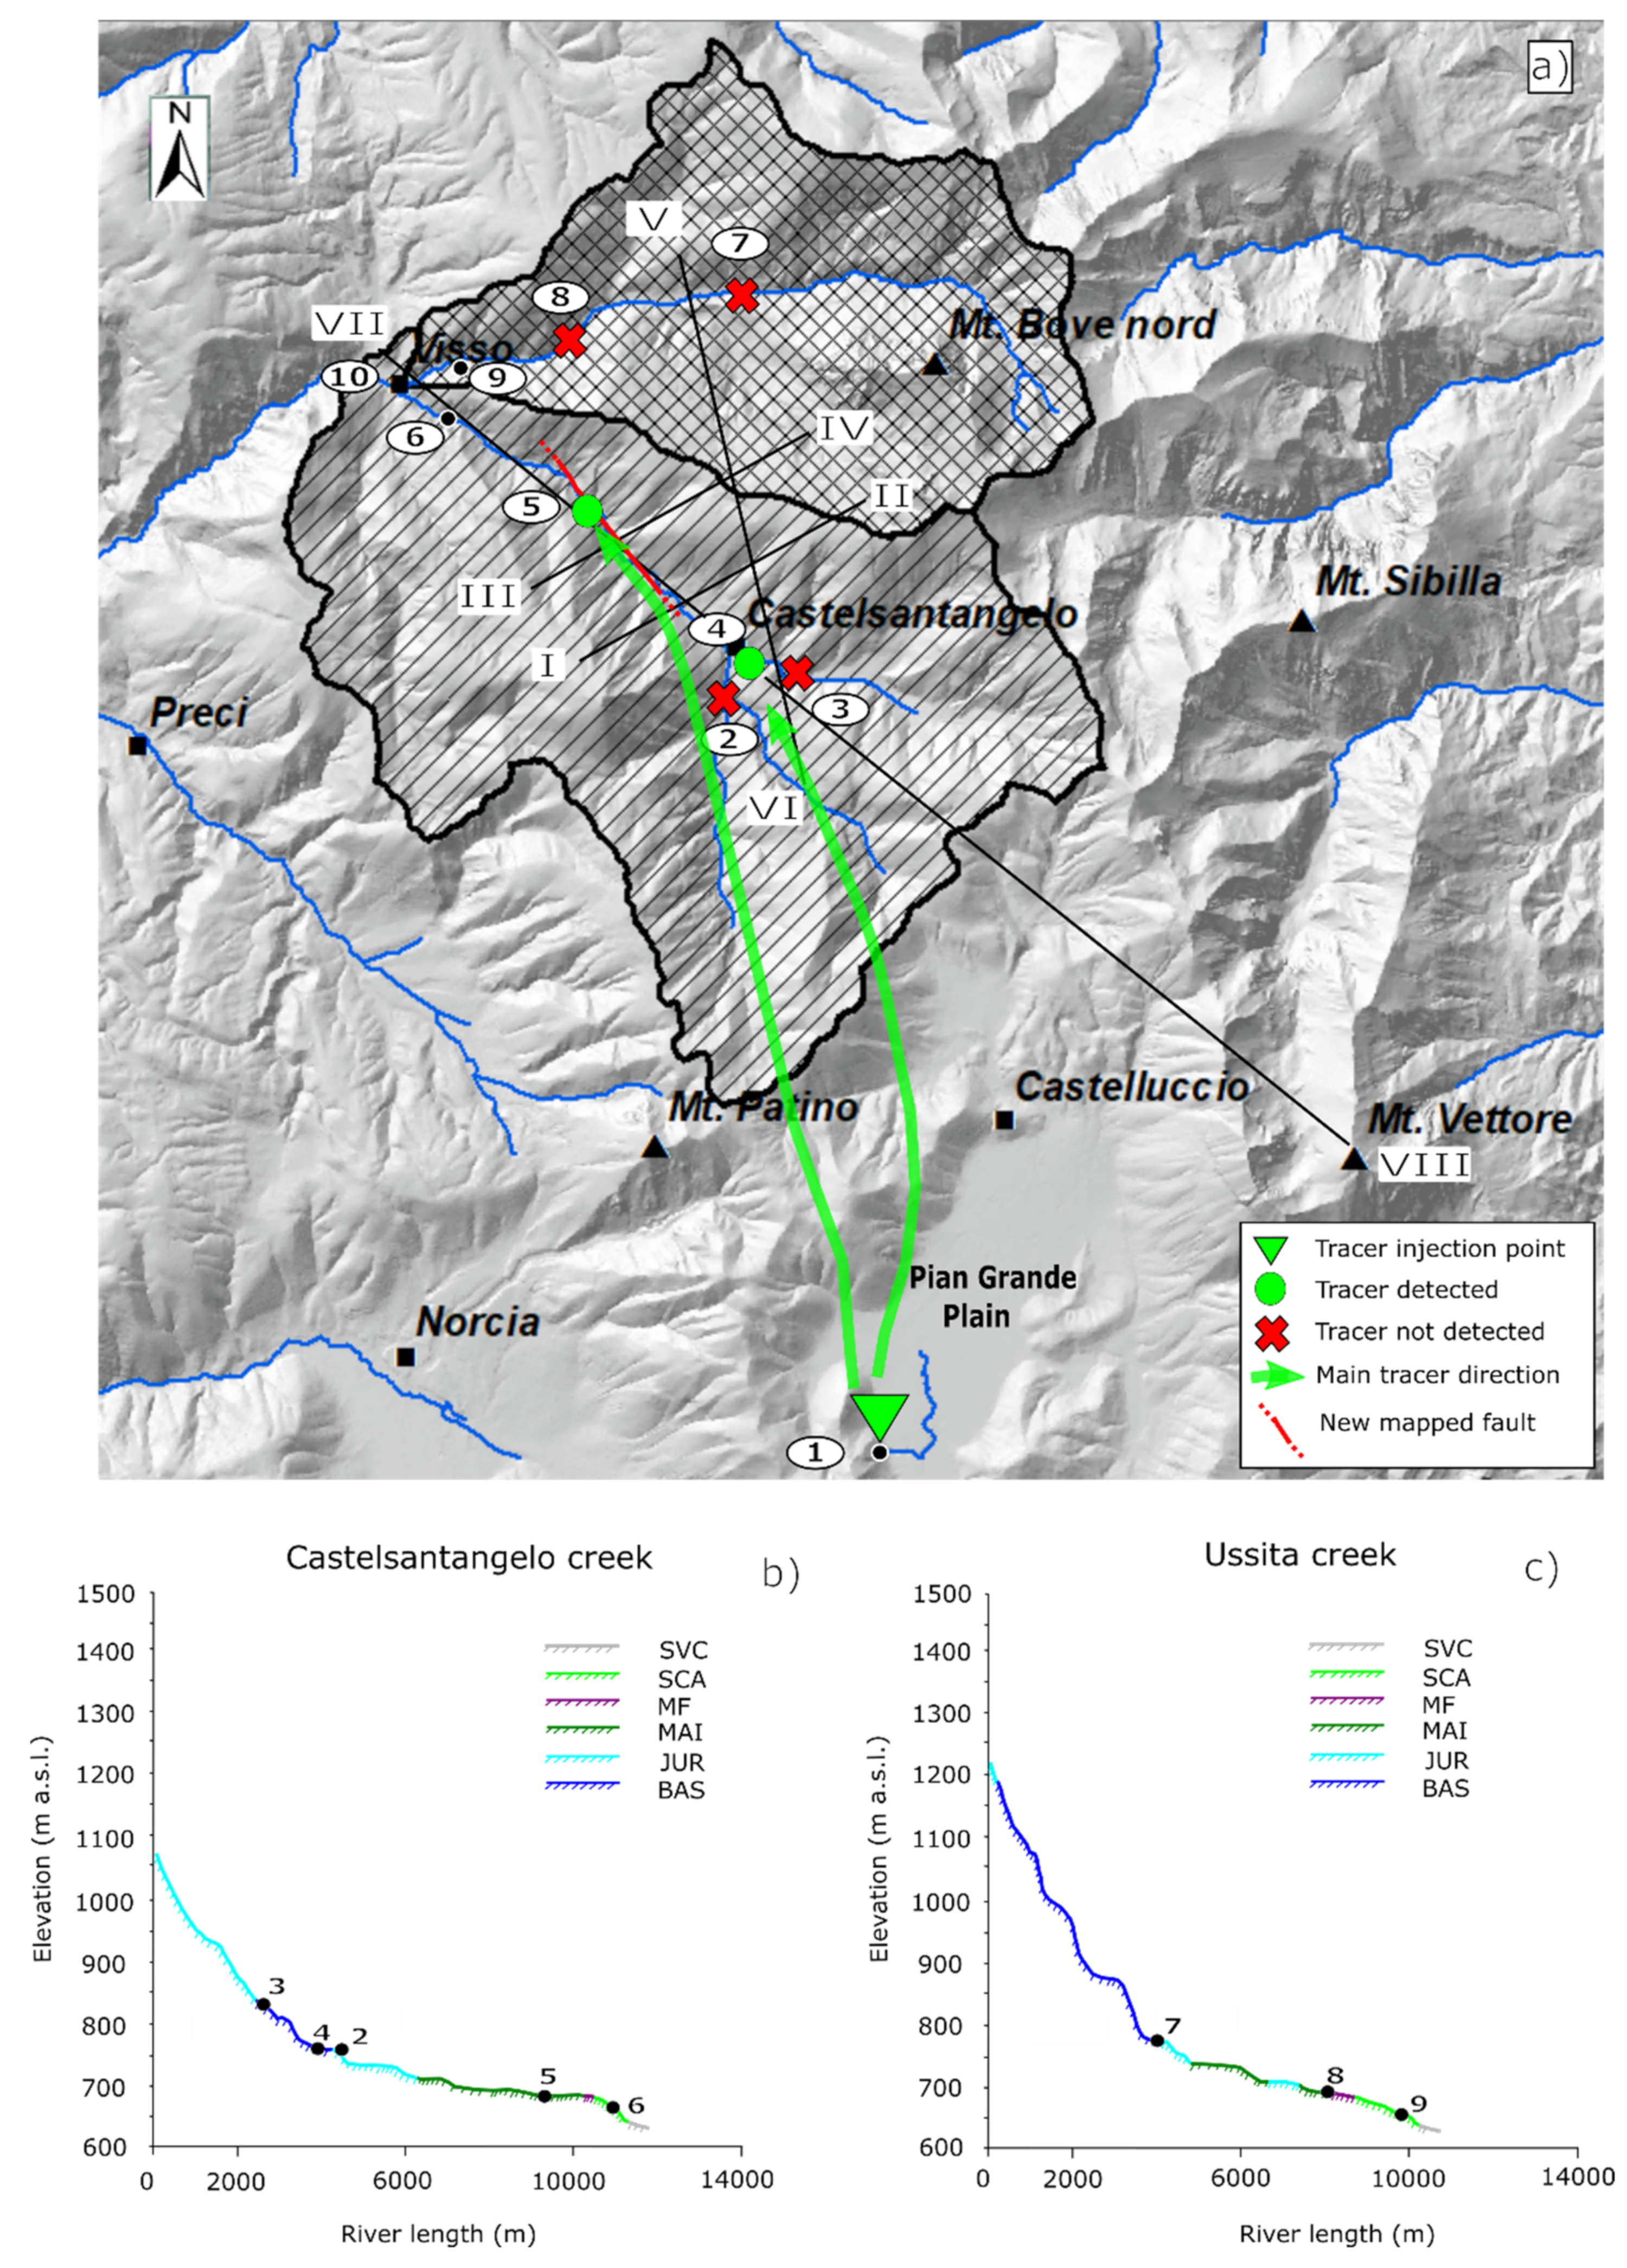
2.1. Study Area
2.2. Tracer Tests
2.3. Isotopic Investigation and Geochemical Analysis
2.4. Geological Field-Work and GIS-Based Analysis
3. Results
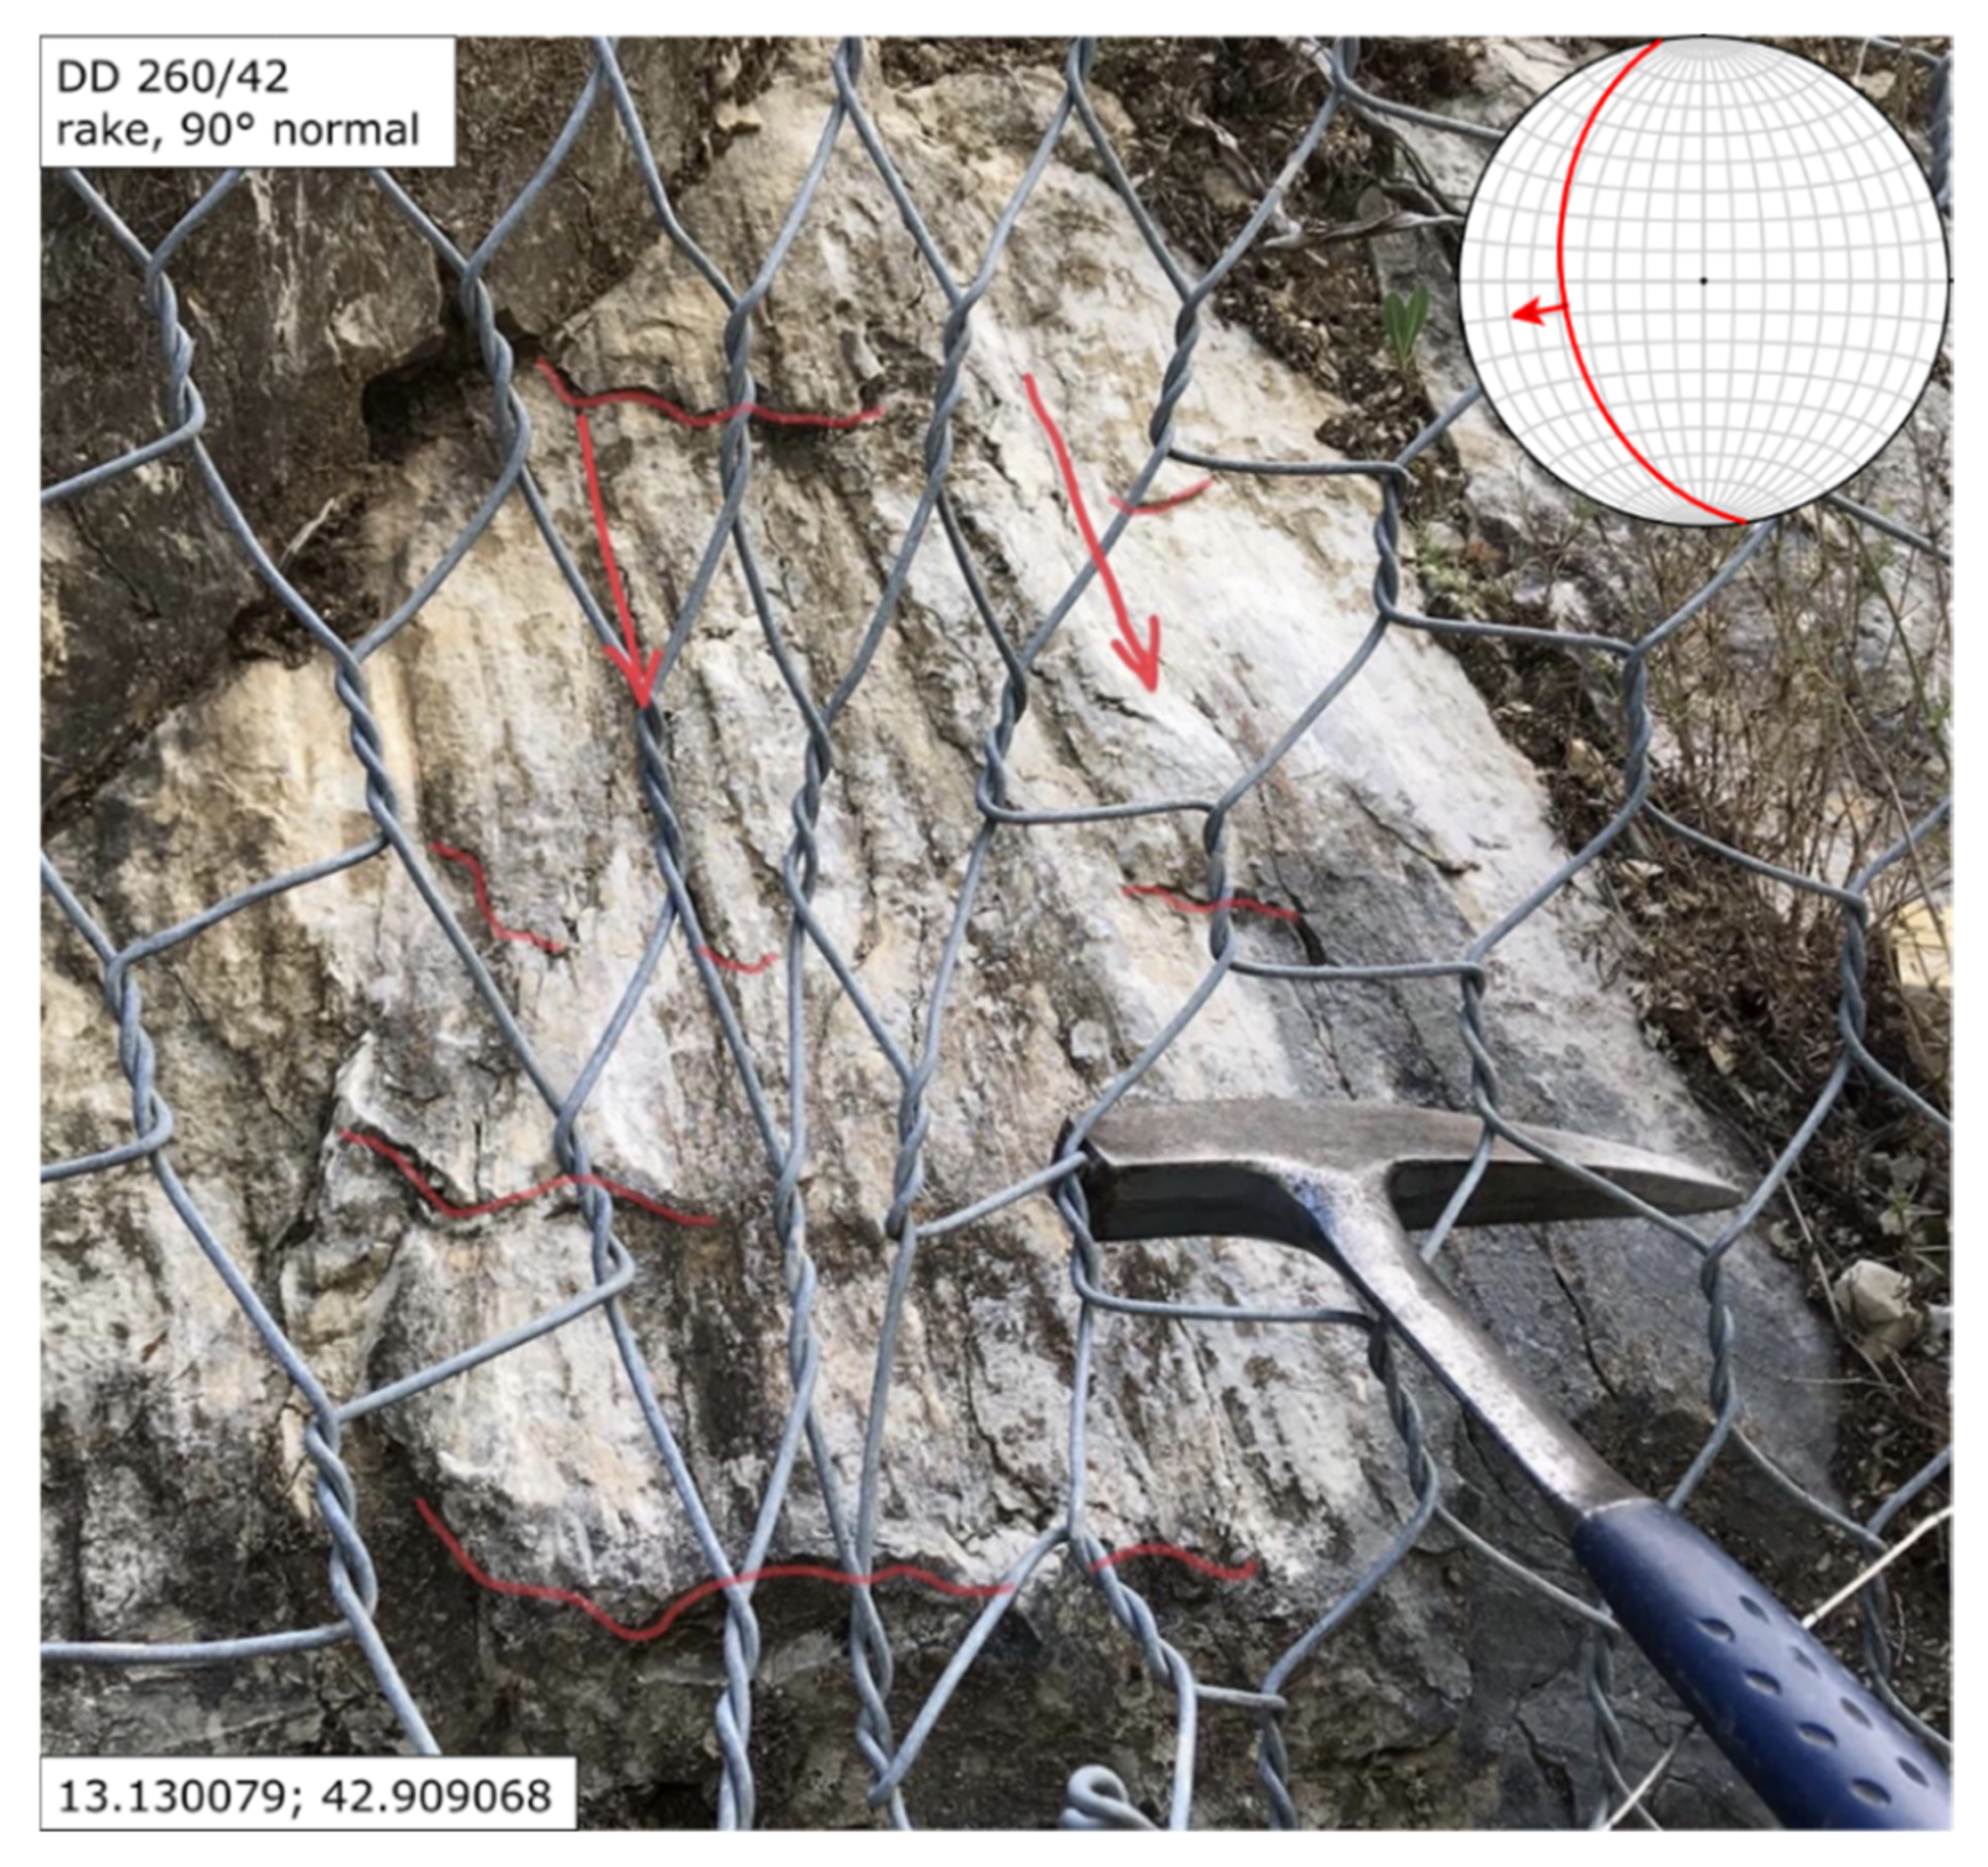
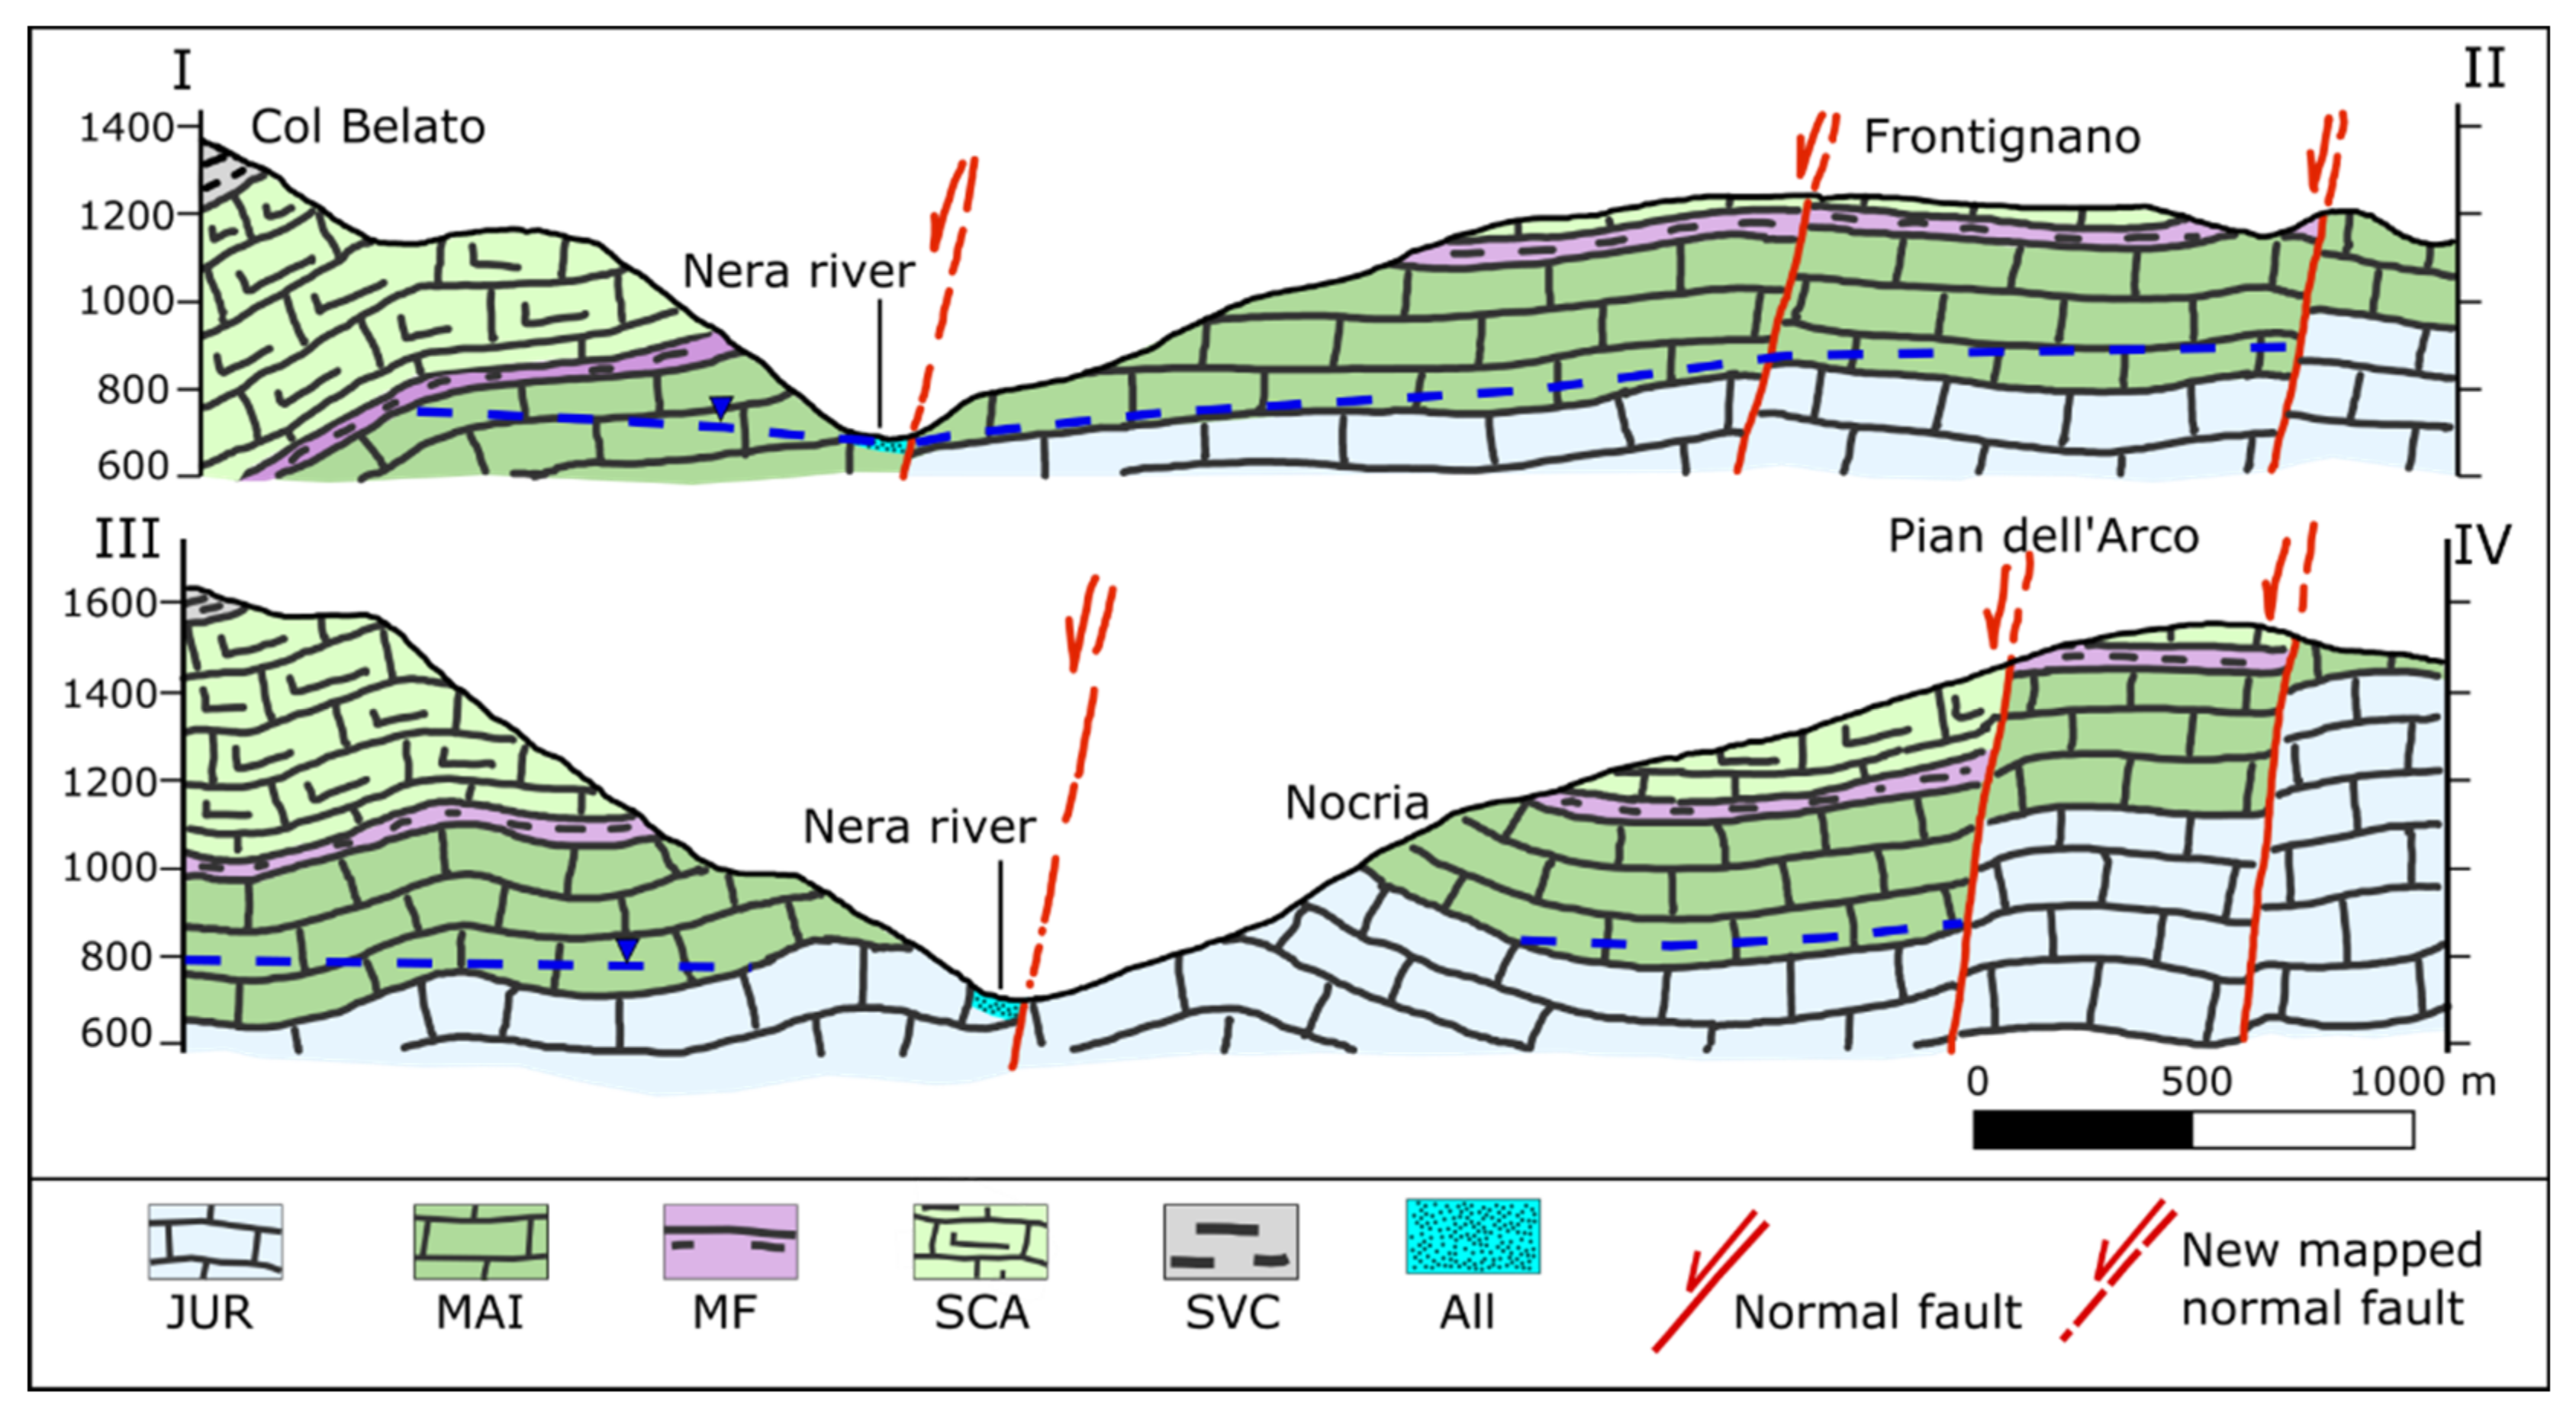
3.1. Geo-Structural Approach
3.2. Isotope Hydrology and Geo-Chemical Approaches
3.3. Tracer Hydrology Approach
4. Discussion
5. Conclusions
Supplementary Materials
Author Contributions
Funding
Institutional Review Board Statement
Informed Consent Statement
Data Availability Statement
Acknowledgments
Conflicts of Interest
References
- Manga, M.; Brodsky, E.E.; Boone, M. Response of streamflow to multiple earthquakes. Geophys. Res. Lett. 2003, 30. [Google Scholar] [CrossRef]
- Charmoille, A.; Fabbri, O.; Mudry, J.; Guglielmi, Y.; Bertrand, C. Post-seismic permeability change in a shallow fractured aquifer following a ML 5.1 earthquake (Fourbanne karst aquifer, Jura outermost thrust unit, eastern France). Geophys. Res. Lett. 2005, 32. [Google Scholar] [CrossRef]
- Shi, Z.; Wang, G.; Wang, C.; Manga, M.; Liu, C. Comparison of hydrological responses to the Wenchuan and Lushan earthquakes. Earth Planet. Sci. Lett. 2014, 391, 193–200. [Google Scholar] [CrossRef]
- Goldscheider, N.; Neukum, C. Fold and fault control on the drainage pattern of a double-karst-aquifer system, Winterstaude, Austrian Alps. Acta Carsologica 2010, 39. [Google Scholar] [CrossRef]
- Evans, J.P.; Forster, C.B.; Goddard, J.V. Permeability of fault-related rocks, and implications for hydraulic structure of fault zones. J. Struct. Geol. 1997, 19, 1393–1404. [Google Scholar] [CrossRef]
- Fairley, J.; Heffner, J.; Hinds, J. Geostatistical evaluation of permeability in an active fault zone. Geophys. Res. Lett. 2003, 30. [Google Scholar] [CrossRef] [Green Version]
- Medici, G.; Smeraglia, L.; Torabi, A.; Botter, C. Review of Modeling Approaches to Groundwater Flow in Deformed Carbonate Aquifers. Groundwater 2020, 59, 334–351. [Google Scholar] [CrossRef]
- Bense, V.; Gleeson, T.; Loveless, S.; Bour, O.; Scibek, J. Fault zone hydrogeology. Earth Sci. Rev. 2013, 127, 171–192. [Google Scholar] [CrossRef]
- Scibek, J.; Gleeson, T.; McKenzie, J.M. The biases and trends in fault zone hydrogeology conceptual models: Global compilation and categorical data analysis. Geofluids 2016, 16, 782–798. [Google Scholar] [CrossRef]
- Xue, L.; Brodsky, E.E.; Erskine, J.; Fulton, P.M.; Carter, R. A permeability and compliance contrast measured hydrogeologically on the San Andreas Fault. Geochem. Geophys. Geosyst. 2016, 17, 858–871. [Google Scholar] [CrossRef] [Green Version]
- Fronzi, D.; Di Curzio, D.; Rusi, S.; Valigi, D.; Tazioli, A. Comparison between Periodic Tracer Tests and Time-Series Analysis to Assess Mid- and Long-Term Recharge Model Changes Due to Multiple Strong Seismic Events in Carbonate Aquifers. Water 2020, 12, 3073. [Google Scholar] [CrossRef]
- Caine, J.S.; Evans, J.P.; Craig, B.F. Fault zone architecture and permeability structure. Geology 1996, 24, 1025–1028. [Google Scholar] [CrossRef]
- Faulkner, D.R.; Jackson, C.A.L.; Lunn, R.J.; Schlische, R.W.; Shipton, Z.K.; Wibberley, C.A.J.; Withjack, M.O. A review of recent developments concerning the structure, mechanics and fluid flow properties of fault zones. J. Struct. Geol. 2010, 32, 1557–1575. [Google Scholar] [CrossRef]
- Celico, F.; Petrella, E.; Celico, P. Hydrogeological behaviour of some fault zones in a carbonate aquifer of Southern Italy: An experimentally based model. Terra Nova 2006, 18, 308–313. [Google Scholar] [CrossRef]
- Manga, M.; Rowland, J.C. Response of Alum Rock springs to the October 30, 2007 Alum Rock earthquake and implications for the origin of increased discharge after earthquakes. Geofluids 2009, 9, 237–250. [Google Scholar] [CrossRef]
- Skelton, A.; Andrén, M.; Kristmannsdóttir, H.; Stockmann, G.; Mörth, C.M.; Sveinbjörnsdóttir, Á.; Jónsson, S.; Sturkell, E.; Guðrúnardóttir, H.R.; Hjartarson, H.; et al. Changes in groundwater chemistry before two consecutive earthquakes in Iceland. Nat. Geosci. 2014, 7, 752–756. [Google Scholar] [CrossRef] [Green Version]
- Chiodini, G.; Cardellini, C.; Di Luccio, F.; Selva, J.; Frondini, F.; Caliro, S.; Rosiello, A.; Beddini, G.; Ventura, G. Correlation between tectonic CO2 Earth degassing and seismicity is revealed by a 10-year record in the Apennines, Italy. Sci. Adv. 2020, 6, eabc2938. [Google Scholar] [CrossRef] [PubMed]
- Montgomery, D.R.; Manga, M. Streamflow and water well responses to earthquakes. Science 2003, 300, 2047–2049. [Google Scholar] [CrossRef] [Green Version]
- Léonardi, V.; Arthaud, F.; Tovmassian, A.; Karakhanian, A. Tectonic and seismic conditions for changes in spring discharge along the Garni right lateral strike slip fault (Armenian Upland). Geodin. Acta 1998, 11, 85–103. [Google Scholar] [CrossRef]
- Manga, M.; Beresnev, I.; Brodsky, E.E.; Elkhoury, J.E.; Elsworth, D.; Ingebritsen, S.E.; Mays, D.C.; Wang, C.-Y. Changes in permeability caused by transient stresses: Field observations, experiments, and mechanisms. Rev. Geophys. 2012, 50. [Google Scholar] [CrossRef]
- Lai, W.-C.; Koizumi, N.; Matsumoto, N.; Kitagawa, Y.; Lin, C.-W.; Shieh, C.-L.; Lee, Y.-P. Effects of seismic ground motion and geological setting on the coseismic groundwater level changes caused by the 1999 Chi-Chi earthquake, Taiwan. Earth Planets Space 2004, 56, 873–880. [Google Scholar] [CrossRef] [Green Version]
- Sanz, E.; Menéndez Pidal, I.; Escavy, J.I.; Ojeda, J.S.D. Hydrogeological Changes along a Fault Zone Caused by Earthquakes in the Moncayo Massif (Iberian Chain, Spain). Sustainability 2020, 12, 9034. [Google Scholar] [CrossRef]
- Cox, S.; Rutter, H.; Sims, A.; Manga, M.; Weir, J.; Ezzy, T.; White, P.; Horton, T.; Scott, D. Hydrological effects of the M W 7.1 Darfield (Canterbury) earthquake, 4 September 2010, New Zealand. N. Z. J. Geol. Geophys. 2012, 55, 231–247. [Google Scholar] [CrossRef] [Green Version]
- Mohr, C.H.; Manga, M.; Wang, C.-Y.; Korup, O. Regional changes in streamflow after a megathrust earthquake. Earth Planet. Sci. Lett. 2017, 458, 418–428. [Google Scholar] [CrossRef] [Green Version]
- Barberio, M.D.; Gori, F.; Barbieri, M.; Billi, A.; Caracausi, A.; De Luca, G.; Franchini, S.; Petitta, M.; Doglioni, C. New observations in Central Italy of groundwater responses to the worldwide seismicity. Sci. Rep. 2020, 10, 17850. [Google Scholar] [CrossRef] [PubMed]
- Rojstaczer, S.; Wolf, S. Permeability changes associated with large earthquakes: An example from Loma Prieta, California. Geology 1992, 20, 211–214. [Google Scholar] [CrossRef]
- De Luca, G.; Di Carlo, G.; Tallini, M. A record of changes in the Gran Sasso groundwater before, during and after the 2016 Amatrice earthquake, central Italy. Sci. Rep. 2018, 8, 15982. [Google Scholar] [CrossRef]
- Adinolfi Falcone, R.; Carucci, V.; Falgiani, A.; Manetta, M.; Parisse, B.; Petitta, M.; Rusi, S.; Spizzico, M.; Tallini, M. Changes on groundwater flow and hydrochemistry of the Gran Sasso carbonate aquifer after 2009 L’Aquila earthquake. Ital. J. Geosci. 2012, 131, 459–474. [Google Scholar]
- Amoruso, A.; Crescentini, L.; Petitta, M.; Rusi, S.; Tallini, M. Impact of the 6 April 2009 L’Aquila earthquake on groundwater flow in the Gran Sasso carbonate aquifer, Central Italy. Hydrol. Process. 2010, 25, 1754–1764. [Google Scholar] [CrossRef]
- Esposito, E.; Pece, R.; Porfido, S.; Tranfaglia, G. Ground effects and hydrological changes in the Southern Apennines (Italy) in response to the 23 July 1930 earthquake (MS = 6.7). Nat. Hazards Earth Syst. Sci. 2009, 9, 539–550. [Google Scholar] [CrossRef] [Green Version]
- Valigi, D.; Fronzi, D.; Cambi, C.; Beddini, G.; Cardellini, C.; Checcucci, R.; Mastrorillo, L.; Mirabella, F.; Tazioli, A. Earthquake-Induced Spring Discharge Modifications: The Pescara di Arquata Spring Reaction to the August–October 2016 Central Italy Earthquakes. Water 2020, 12, 767. [Google Scholar] [CrossRef] [Green Version]
- Mastrorillo, L.; Saroli, M.; Viaroli, S.; Banzato, F.; Valigi, D.; Petitta, M. Sustained post-seismic effects on groundwater flow in fractured carbonate aquifers in Central Italy. Hydrol. Process. 2019, 34, 1167–1181. [Google Scholar] [CrossRef] [Green Version]
- Petitta, M.; Mastrorillo, L.; Preziosi, E.; Banzato, F.; Barberio, M.D.; Billi, A.; Cambi, C.; De Luca, G.; Di Carlo, G.; Di Curzio, D.; et al. Water-table and discharge changes associated with the 2016–2017 seismic sequence in central Italy: Hydrogeological data and a conceptual model for fractured carbonate aquifers. Hydrogeol. J. 2018, 26, 1009–1026. [Google Scholar] [CrossRef] [Green Version]
- Valigi, D.; Mastrorillo, L.; Cardellini, C.; Checcucci, R.; Di Matteo, L.; Frondini, F.; Mirabella, F.; Viaroli, S.; Vispi, I. Springs discharge variations induced by strong earthquakes: The Mw 6.5 Norcia event (Italy, October 30th 2016). Rendiconti Online Soc. Geol. Ital. 2019, 47, 141–146. [Google Scholar] [CrossRef]
- Fronzi, D.; Banzato, F.; Caliro, S.; Cambi, C.; Cardellini, C.; Checcucci, R.; Mastrorillo, L.; Mirabella, F.; Petitta, M.; Valigi, D.; et al. Preliminary results on the response of some springs of the Sibillini Mountains area to the 2016–2017 seismic sequence. Acque Sotter. Ital. J. Groundw. 2020, 9. [Google Scholar] [CrossRef] [Green Version]
- Di Matteo, L.; Dragoni, W.; Azzaro, S.; Pauselli, C.; Porreca, M.; Bellina, G.; Cardaci, W. Effects of earthquakes on the discharge of groundwater systems: The case of the 2016 seismic sequence in the Central Apennines, Italy. J. Hydrol. 2020, 583, 124509. [Google Scholar] [CrossRef]
- Nanni, T.; Vivalda, P.M.; Palpacelli, S.; Marcellini, M.; Tazioli, A. Groundwater circulation and earthquake-related changes in hydrogeological karst environments: A case study of the Sibillini Mountains (central Italy) involving artificial tracers. Hydrogeol. J. 2020, 28, 2409–2428. [Google Scholar] [CrossRef]
- Chiaraluce, L.; Di Stefano, R.; Tinti, E.; Scognamiglio, L.; Michele, M.; Casarotti, E.; Cattaneo, M.; De Gori, P.; Chiarabba, C.; Monachesi, G.; et al. The 2016 Central Italy Seismic Sequence: A First Look at the Mainshocks, Aftershocks, and Source Models. Seism. Res. Lett. 2017, 88, 757–771. [Google Scholar] [CrossRef]
- Porreca, M.; Minelli, G.; Ercoli, M.; Brobia, A.; Mancinelli, P.; Cruciani, F.; Giorgetti, C.; Carboni, F.; Mirabella, F.; Cavinato, G.; et al. Seismic Reflection Profiles and Subsurface Geology of the Area Interested by the 2016–2017 Earthquake Sequence (Central Italy). Tectonics 2018, 37, 1116–1137. [Google Scholar] [CrossRef]
- Villani, F.; Pucci, S.; Civico, R.; De Martini, P.M.; Cinti, F.; Pantosti, D. Surface Faulting of the 30 October 2016 Mw 6.5 Central Italy Earthquake: Detailed Analysis of a Complex Coseismic Rupture. Tectonics 2018, 37, 3378–3410. [Google Scholar] [CrossRef]
- Puliti, I.; Pizzi, A.; Benedetti, L.; Di Domenica, A.; Fleury, J. Comparing Slip Distribution of an Active Fault System at Various Timescales: Insights for the Evolution of the Mt. Vettore-Mt. Bove Fault System in Central Apennines. Tectonics 2020, 39. [Google Scholar] [CrossRef]
- Pierantoni, P.; Deiana, G.; Galdenzi, S. Stratigraphic and structural features of the Sibillini Mountains (Umbria-Marche Apennines, Italy). Ital. J. Geosci. 2013, 132, 497–520. [Google Scholar] [CrossRef]
- Banzato, F.; Mastrorillo, L.; Nanni, T.; Palpacelli, S.; Petitta, M.; Vivalda, P.M. L’acquifero carbonatico fratturato delle Sorgenti del Fiume Aso (Parco Nazionale dei Monti Sibillini): Valutazioni sulla risorsa rinnovabile e sull’area di alimentazione. In Proceedings of the “La ricerca carsologica in Italia” Laboratorio Carsologico Sotterraneo di Bossea, Frabosa Soprana, Italy, 22–23 June 2013. [Google Scholar]
- Mastrorillo, L.; Baldoni, T.; Banzato, F.; Boscherini, A.; Cascone, D.; Checcucci, R.; Boni, C. Quantitative hydrogeological analysis of the carbonate domain of the Umbria Region (Central Italy). Ital. J. Eng. Geol. Environ. 2009, 1, 137–155. [Google Scholar]
- Aquilanti, L.; Clementi, F.; Nanni, T.; Palpacelli, S.; Tazioli, A.; Vivalda, P.M. DNA and fluorescein tracer tests to study the recharge, groundwater flowpath and hydraulic contact of aquifers in the Umbria-Marche limestone ridge (central Apennines, Italy). Environ. Earth Sci. 2016, 75, 626. [Google Scholar] [CrossRef]
- Viaroli, S.; Mirabella, F.; Mastrorillo, L.; Angelini, S.; Valigi, D. Fractured carbonate aquifers of Sibillini Mts. (Central Italy). J. Maps 2021, 17, 140–149. [Google Scholar] [CrossRef]
- Boni, C. Hydrogeological study for identification, characterisation and management of groundwater resources in the Sibillini Mountains National Park (Central Italy). Ital. J. Eng. Geol. Environ. 2010, 2, 21–39. [Google Scholar]
- Mastrorillo, L.; Petitta, M. Hydrogeological conceptual model of the upper Chienti River basin aquifers (Umbria-Marche Apennines). Ital. J. Geosci. 2014, 133, 396–408. [Google Scholar] [CrossRef]
- Scarpelli, G.; Bellezza, I.; Di Sante, M.; Fratalocchi, E.; Fruzzetti, V.M.E.; Mazzieri, F.; Nanni, T.; Pasqualini, E.; Ruggeri, P.; Sakellariadi, E.; et al. Environmental Sustainability of Engineering Works: Geological and Geotechnical Aspects. In The First Outstanding 50 Years of “Università Politecnica delle Marche”; Springer: Cham, Switzerland, 2019; pp. 259–278. [Google Scholar]
- Boni, C.; Petitta, M. Hydrogeological Study for the Identification and Characterization of Aquifers Recharging the Springs of the Perennial Streams of the Sibillini Mountains, Extended to the Whole Area of the National Park; Technical Note; Dipartimento Scienze della Terra, Università La Sapienza di Roma, Autorità di bacino del F. Tevere, Parco Nazionale dei Monti Sibillini: Roma, Italy, 2007. [Google Scholar]
- Biella, G.; Lavecchia, G.; Lazey, A.; Pialli, G.; Scarascia, S. First results of the geophysical survey and geological interpretation of the S. Scolastica plain and Piano Grande. Atti I Convegno GNGTS 1981, 293–308. [Google Scholar]
- Lippi Boncambi, C. Soil observations on the Sibillini Mountains, in particular on the peaty soils of the Castelluccio di Norcia plain. Boll. Soc. Geol. It. 1950, 69, 26–37. [Google Scholar]
- Coltorti, M.; Farabollini, P. Quaternary evolution of the Castelluccio di Norcia basin (Umbro-Marchean Apennines, Italy). Ital. J. Quatern. Sci. 1995, 8, 149–166. [Google Scholar]
- Tazioli, A.; Cervi, F.; Doveri, M.; Mussi, M.; Deiana, M.; Ronchetti, F. Estimating the isotopic altitude gradient for hydrogeological studies in mountainous areas: Are the low-yield springs suitable? Insights from the northern Apennines of Italy. Water 2019, 11, 1764. [Google Scholar] [CrossRef] [Green Version]
- Mussi, M.; Nanni, T.; Tazioli, A.; Vivalda, P.M. The Mt Conero limestone ridge: The contribution of stable isotopes to the identification of the recharge area of aquifers. Ital. J. Geosci. 2017, 136, 186–197. [Google Scholar] [CrossRef]
- Doveri, M.; Mussi, M. Water isotopes as environmental tracers for conceptual understanding of groundwater flow: An application for fractured aquifer systems in the “Scansano-Magliano in Toscana” area (Southern Tuscany, Italy). Water 2014, 6, 2255–2277. [Google Scholar] [CrossRef] [Green Version]
- Rosen, M.R.; Binda, G.; Archer, C.; Pozzi, A.; Michetti, A.M.; Noble, P.J. Mechanisms of Earthquake-Induced Chemical and Fluid Transport to Carbonate Groundwater Springs after Earthquakes. Water Resour. Res. 2018, 54, 5225–5244. [Google Scholar] [CrossRef]
- Giustini, F.; Brilli, M.; Patera, A. Mapping oxygen stable isotopes of precipitation in Italy. J. Hydrol. Reg. Stud. 2016, 8, 162–181. [Google Scholar] [CrossRef] [Green Version]
- Tarragoni, C. Determinazione della “quota isotopica” del bacino di alimentazione delle principali sorgenti dell’alta Valnerina. Geol. Romana 2006, 39, 55–62. [Google Scholar]
- Nanni, T. Caratteri idrogeologici delle Marche. In L’ambiente Fisico delle Marche; S.E.C.L.A. s.r.l.: Florence, Italy, 1991. [Google Scholar]
- ARPA Umbria. Monitoraggio Dell’impatto Ambientale Degli Impianti di Troticoltura in Valnerina—Monitoring of the Environmental Impact of Trout Farms in Valnerina; ARPA Umbria: Terni, Italy, 2002. [Google Scholar]
- Madonna, R.; Signanini, P.; Crema, G.; Di Sabatino, B.; Rainone, M.L.; Di Nunzio, A. The geothermal area of Acquasanta Terme (Central Italy): Main characteristics and an attempt of field evaluation. In Proceedings of the World Geothermal Congress 2005, Antalya, Turkey, 24–29 April 2005; pp. 1–8. [Google Scholar]
- Williams, P.W. The role of the epikarst in karst and cave hydrogeology: A review. Int. J. Speleol. 2008, 37, 1–10. [Google Scholar] [CrossRef] [Green Version]
- Zuber, A.; Motyka, J. Hydraulic parameters and solute velocities in triple-porosity karstic-fissured-porous carbonate aquifers: Case studies in southern Poland. Environ. Earth Sci. 1998, 34, 243–250. [Google Scholar] [CrossRef]
- Motyka, J. A conceptual model of hydraulic networks in carbonate rocks, illustrated by examples from Poland. Hydrogeol. J. 1998, 6, 469–482. [Google Scholar] [CrossRef]
- López, D.L.; Smith, L. Fluid flow in fault zones: Influence of hydraulic anisotropy and heterogeneity on the fluid flow and heat transfer regime. Water Resour. Res. 1996, 32, 3227–3235. [Google Scholar] [CrossRef]


| Sampling Point Type | Sampling Period | Name | Elevation (m a.s.l.) |
|---|---|---|---|
| Rainfall samplers | 2017–2018 | Cascia | 604 |
| 2017–2019 | Norcia | 700 | |
| 2013–2017 | Castelsantangelo sul Nera | 737 | |
| 2013–2017 | Vallefiume | 755 | |
| 2013–2017 | Capodacqua | 805 | |
| 2013–2017 | Foce | 930 | |
| 2013–2017 | San Pellegrino | 974 | |
| 2013–2019 | Mt. Prata | 1800 | |
| Minor springs | 2017 | Prati di San Marco | 1093 |
| 2017 | Fonte Acqua d’Abeto | 1267 | |
| 2017 | Fonte Secca | 1299 | |
| 2017 | San Lorenzo Basso | 1439 | |
| 2017 | San Lorenzo Alto | 1473 | |
| 2017 | Fonte dell’Asinella | 1500 | |
| 2017 | Fonte Conserva | 1520 | |
| 2017 | Fonte Civitella | 1557 | |
| 2017 | Fonte Utero | 1577 | |
| 2017 | Fonte del Grillo | 1598 | |
| 2017 | Fonte Fausole | 1645 |
| Catchment/ Hydrogeological Complexes | Mean Elevation (m a.s.l.) | Std. Dev. (m a.s.l.) |
|---|---|---|
| Ussita creek | ||
| DTMtot | 1291 | 377 |
| SCA | 1213 | 321 |
| MAI | 1440 | 451 |
| BAS | 1328 | 291 |
| AQUIFERSmean | 1327 | 354 |
| Castelsantangelo creek | ||
| DTMtot | 1245 | 301 |
| SCA | 1357 | 256 |
| MAI | 1278 | 331 |
| BAS | 862 | 71 |
| AQUIFERSmean | 1165 | 219 |
| Pre-Seismic Period | Post-Seismic Period | |||||
|---|---|---|---|---|---|---|
| No. on Map | SO42− ± σ (mg/L) | δ18O ± σ (‰ V-SMOW) | Elevation (m a.s.l.) | SO42− ± σ (mg/L) | δ18O ± σ (‰ V-SMOW) | Elevation (m a.s.l.) |
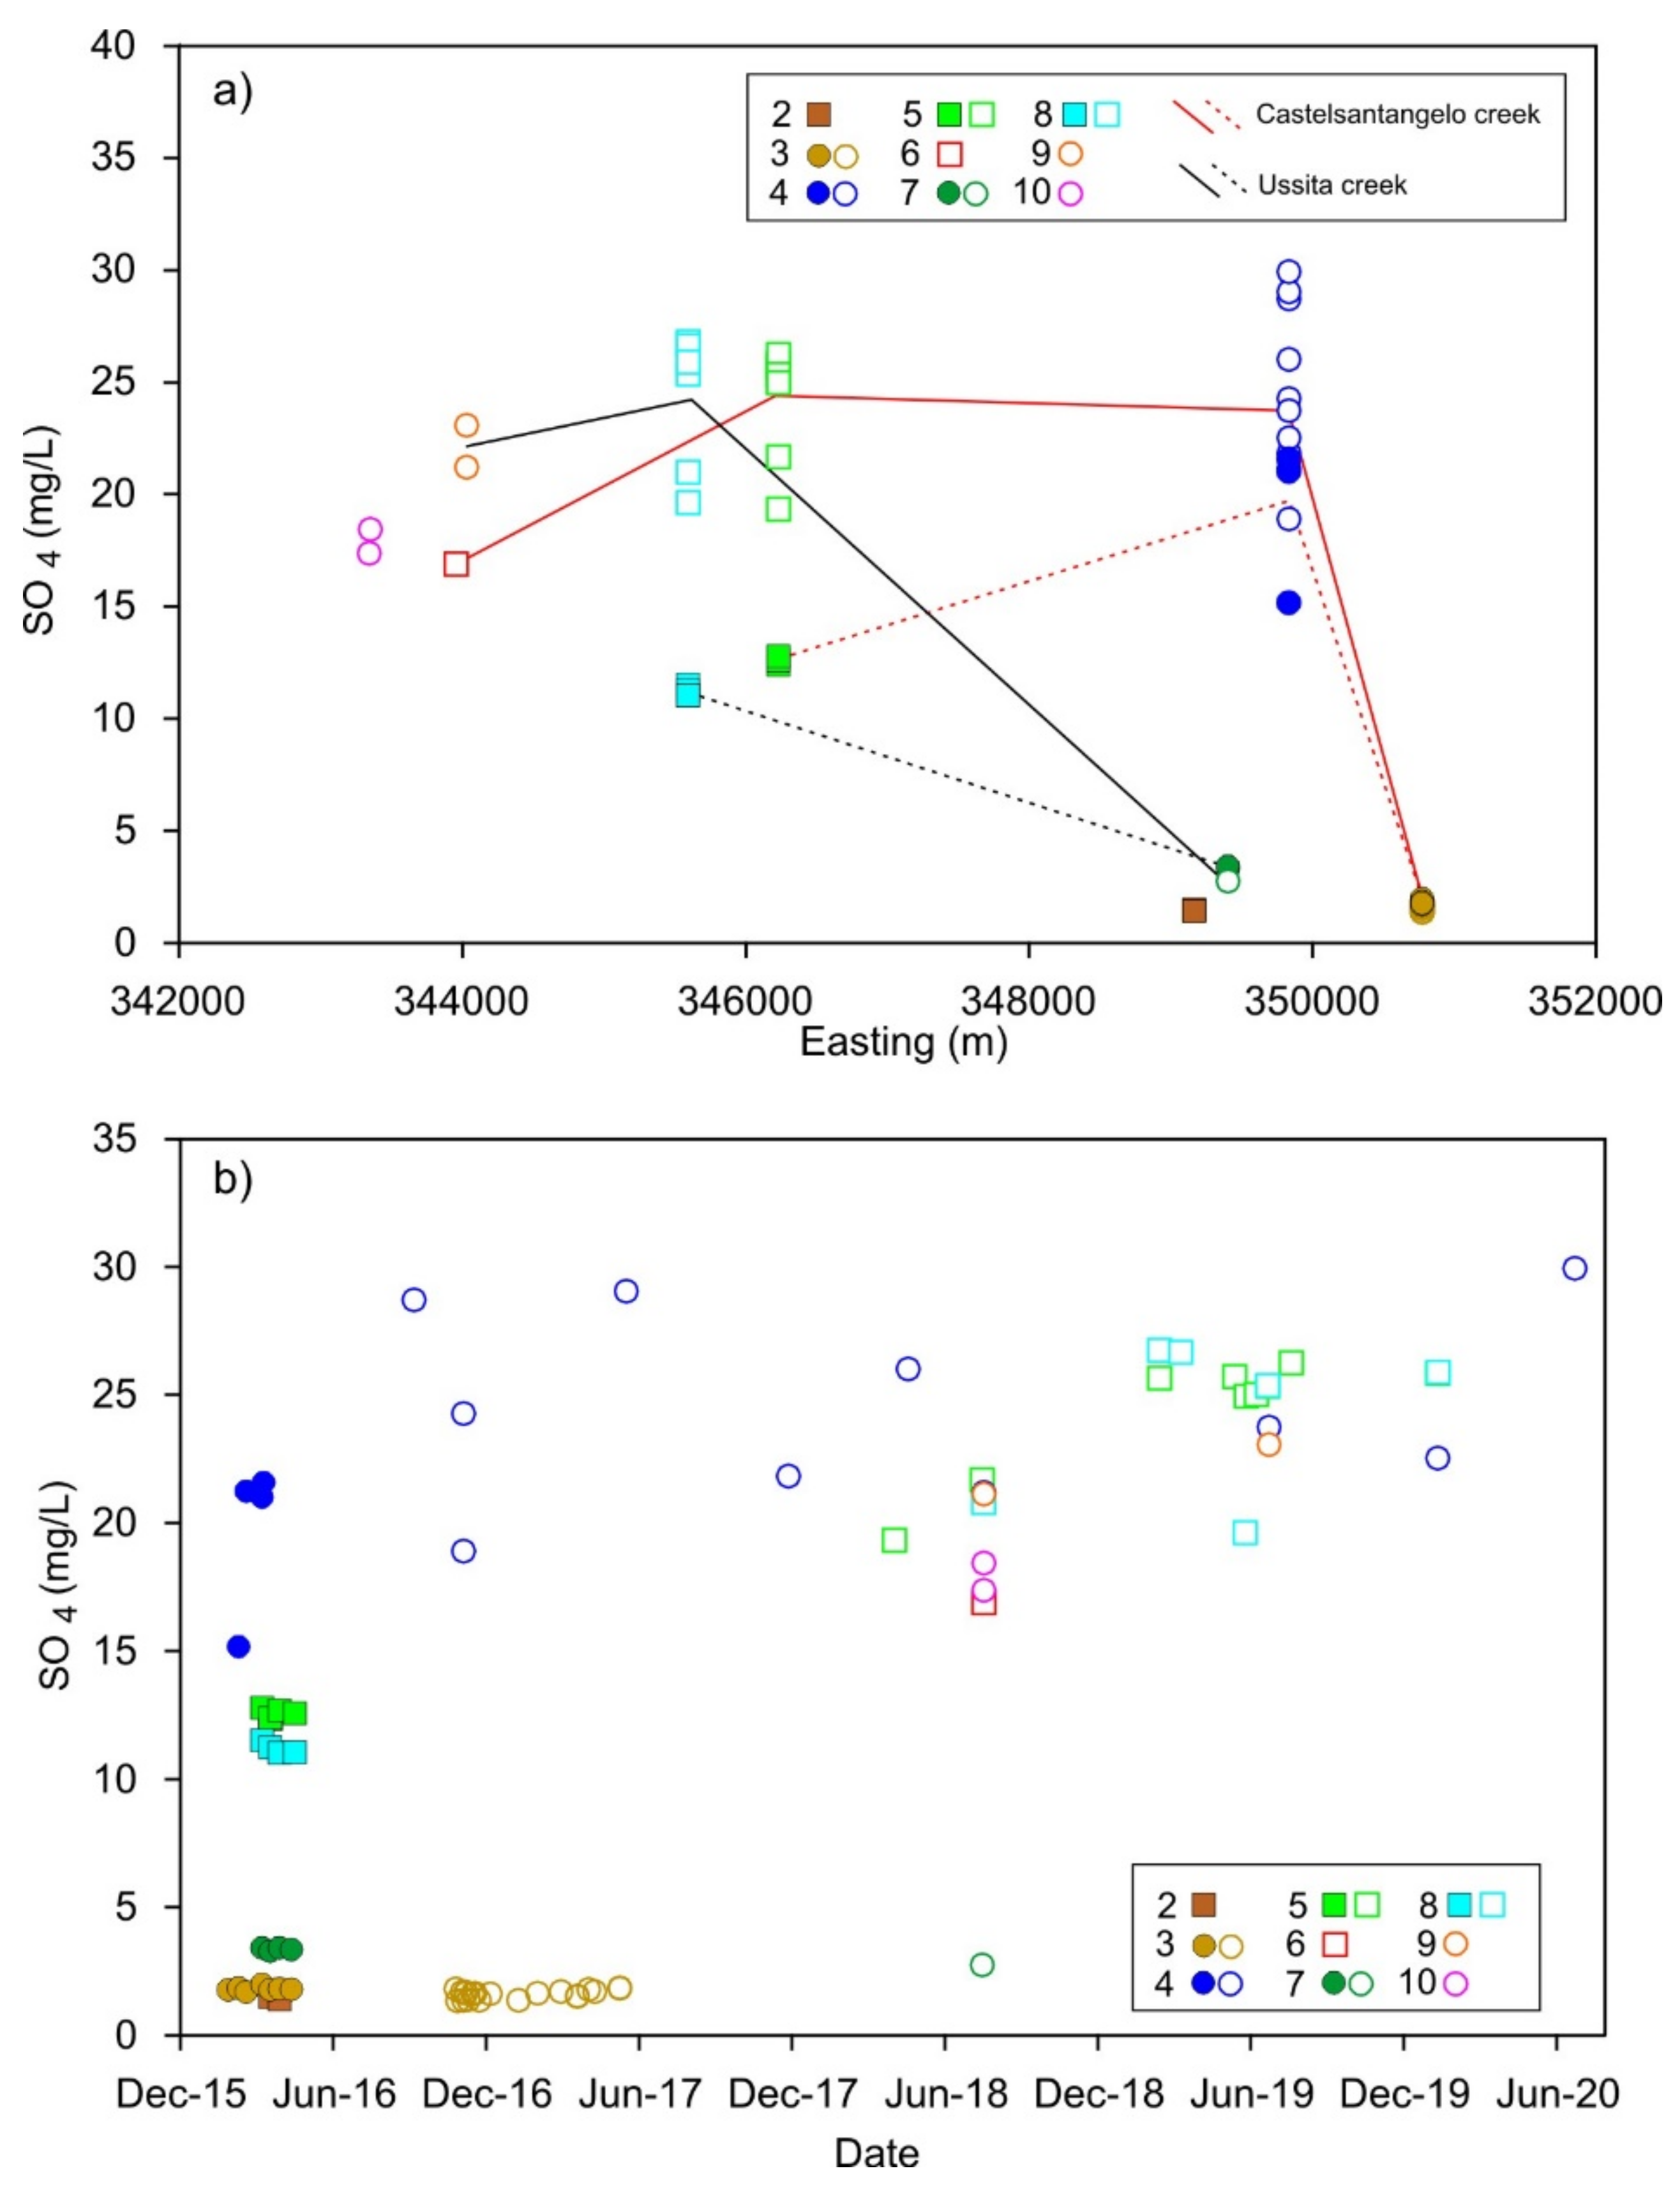
| 2 | 1.43 ± 0.06 | −9.62 ± 0.07 | 1356 | - | −9.57 ± 0.05 | 1341 |
| 3 | 1.78 ± 0.09 | −9.7 ± n.a. | 1379 | 1.58 ± 0.16 | −9.63 ± 0.15 | 1359 |
| 4 | 21.3 ± 0.28 | −10.25 ± 0.15 | 1545 | 25.2 ± 3.32 | −10.34 ± 0.23 | 1572 |
| 5 | 12.6 ± 0.17 | - | - | 24.4 ± 2.33 | −10.16 ± 0.25 | 1518 |
| 6 | - | - | - | 16.87 ± n.a. | −10.04 ± 0.33 | 1482 |
| 7 | 3.34 ± 0.06 | - | - | 2.7 ± n.a. | −10.01 ± n.a. | 1473 |
| 8 | 11.2 ± 0.23 | −10.19 ± 0.11 | 1526 | 24.2 ± 3.1 | −10.15 ± 0.33 | 1514 |
| 9 | - | - | - | 22.1 ± 1.32 | −9.88 ± 0.18 | 1434 |
| 10 | - | - | - | 17.9 ± 0.75 | −10.00 ± 0.03 | 1470 |
Publisher’s Note: MDPI stays neutral with regard to jurisdictional claims in published maps and institutional affiliations. |
© 2021 by the authors. Licensee MDPI, Basel, Switzerland. This article is an open access article distributed under the terms and conditions of the Creative Commons Attribution (CC BY) license (https://creativecommons.org/licenses/by/4.0/).
Share and Cite
Fronzi, D.; Mirabella, F.; Cardellini, C.; Caliro, S.; Palpacelli, S.; Cambi, C.; Valigi, D.; Tazioli, A. The Role of Faults in Groundwater Circulation before and after Seismic Events: Insights from Tracers, Water Isotopes and Geochemistry. Water 2021, 13, 1499. https://0-doi-org.brum.beds.ac.uk/10.3390/w13111499
Fronzi D, Mirabella F, Cardellini C, Caliro S, Palpacelli S, Cambi C, Valigi D, Tazioli A. The Role of Faults in Groundwater Circulation before and after Seismic Events: Insights from Tracers, Water Isotopes and Geochemistry. Water. 2021; 13(11):1499. https://0-doi-org.brum.beds.ac.uk/10.3390/w13111499
Chicago/Turabian StyleFronzi, Davide, Francesco Mirabella, Carlo Cardellini, Stefano Caliro, Stefano Palpacelli, Costanza Cambi, Daniela Valigi, and Alberto Tazioli. 2021. "The Role of Faults in Groundwater Circulation before and after Seismic Events: Insights from Tracers, Water Isotopes and Geochemistry" Water 13, no. 11: 1499. https://0-doi-org.brum.beds.ac.uk/10.3390/w13111499