
Impact of Meteorological Factors on Thermokarst Lake Changes in the Beilu River Basin, Qinghai-Tibet Plateau, China (2000–2016)


1
School of Earth and Environmental Sciences, The University of Queensland, St Lucia, QLD 4072, Australia
2
School of Water and Environment, Chang’an University, No. 126 Yanta Road, Xi’an 710054, China
3
College of Geology Engineering and Geomatics, Chang’an University, No. 126 Yanta Road, Xi’an 710054, China
*
Author to whom correspondence should be addressed.
Water 2021, 13(11), 1605; https://0-doi-org.brum.beds.ac.uk/10.3390/w13111605
Submission received: 30 March 2021
/
Revised: 27 May 2021
/
Accepted: 2 June 2021
/
Published: 6 June 2021
(This article belongs to the Special Issue Hydrology of the Arctic Region)
Abstract
:Variations in weather conditions have a significant impact on thermokarst lakes, such as the sub-lake permafrost thawing caused by global warming. Based on the analysis of Landsat sensor images by ENVI TM 5.3 software, the present study quantitatively determined the area of the thermokarst lakes and the area of the single selected thermokarst lake in the Beilu River Basin from 2000 to 2016. In an effort to explore the reason for changes in the area of thermokarst lakes, this work used Pearson correlation to analyze the relationship between the area of thermokarst lakes and precipitation, wind speed, average temperature, and relative humidity as obtained from the weather station Wudaoliang. Furthermore, this study used multiple linear regression to comprehensively study the correlation between the meteorological factors and changes in the thermokarst lake area. In this case, the total lake-area changes and the single-area changes exhibited unique patterns. The results showed that the total lake area and the single selected lake area increased year by year. Furthermore, the effects of the four meteorological factors defined above on the total area of typical thermokarst lakes are different from the effects of these factors on the single selected thermokarst lake. While the total area of specific thermokarst lakes exhibited a time lag in their response to the four factors, the surface area of the selected thermokarst lake responded to these factors on time. The dominant meteorological factor contributing to total lake area variations of typical thermokarst lakes is the increasing annual average temperature. The Pearson correlation coefficient between the total area and the annual average temperature is 0.717, suggesting a statistically significant correlation between the two factors. For the selected thermokarst lake, the surface area is related to annual average temperature and wind speed. As a result, wind speed and average temperature could infer the variation law on the thermokarst lake due to the linear fitting equation between area and significant meteorological factors.
1. Introduction
The Qinghai-Tibetan Plateau (QTP) is characterized by high mean elevation (4000–5000 ma.s.l.) and a cold climate, with a mean annual air temperature of −3 °C to −7 °C, and is thus often called the Third Pole of the Earth [1]. In QTP, permafrost covers about 55.6% of the total land area and is characterized by high ice contents and high negative ground temperature. During the past 30 years, the permafrost in QTP has undergone significant degradation due to the rapid global temperature warming and increased human activity [2,3]. When ice-rich permafrost thaws and massive ice begins to melt, it leads to ground subsidence, followed by the formation of thermokarst lakes. Thermokarst lakes have unique limnological, morphological, and biogeochemical characteristics closely tied to cold-climate conditions and permafrost properties [4,5,6]. In recent decades, more research has been performed on the thermokarst lakes, as they usually cause soil erosion, transform permafrost landscapes [7,8], change regional groundwater discharge, cause local ecosystem variations [9,10], and release carbon preserved in the frozen soils in the form of CO2 and CH4, thereby providing positive feedback to global warming [11,12,13]. Therefore, thermokarst has important effects on the ecology, geomorphology, hydrology, and the local climate of affected landscapes [14].
After a thermokarst lake has formed, lake size may change due to continued permafrost thaw, variations in air temperature and precipitation [15,16,17], the drainage through open talks, degrading ice-wedge networks, and eroding gullies. The evolution and development of QTP’s thermokarst lakes have been studied numerically in recent years. Niu’s group measured the ages of formation, enlargement rates, water depth, size, and mean annual temperature of 11 thermokarst lakes between 2007 and 2009. They mainly focused on the characteristics of thermokarst lakes and their influence on permafrost in the Qinghai-Tibet Plateau. However, they did not describe the relationship between meteorological factors and thermokarst lakes. If we could confirm the relationship between meteorological factors and thermokarst lakes, we would be able to infer the changes in thermokarst lakes by this relationship, which is beneficial for the prediction of the influence of thermokarst lakes on the surrounding ecological environment. Thus far, the formation of thermokarst lakes, particularly the impact of meteorological factors on thermokarst lakes changes, has not yet been analyzed in detail. The Beilu river basin is a typical arid inland river basin in northwestern China. The Beilu River Basin in QTP is a region sensitive to climate change. This region is also one of the most vulnerable and sensitive areas of the world [18,19]. Simultaneously, five major projects, Qinghai-Tibet Highway, Golmud-Lhasa oil pipeline, Lanzhou-Xining-Lhasa optical cable, Qinghai-Tibet Power Transmission Line, and Qinghai-Tibet Railway pass through this area [20]. Therefore, the changes of thermokarst lakes in the Beilu River Basin are related to climate and human activities. Their relationship will help us predict the natural disasters caused by typical thermokarst lakes on the Qinghai-Tibet Plateau.
In light of these considerations, the work presented herein has selected a representative region in the Beilu River Basin to investigate the thermokarst lake area changes from 2000 to 2016 by analyzing Landsat sensor images by ENVI 5.3 software (Harris Geospatial Solutions Inc., Broomfield, CO, USA). Additionally, this paper contributes the meteorological data from the weather station Wudaoliang, such as precipitation, wind speed, average temperature, and relative humidity. Furthermore, this work quantitatively demonstrates the relationship between the thermokarst lake area and the four meteorological factors described above by correlation analysis to explain the main reason for changes in the thermokarst lake area. Through linear fitting equation and correlation coefficient, the future trend of the thermokarst lake can thus be inferred.
2. Data and Methods
2.1. Study Area
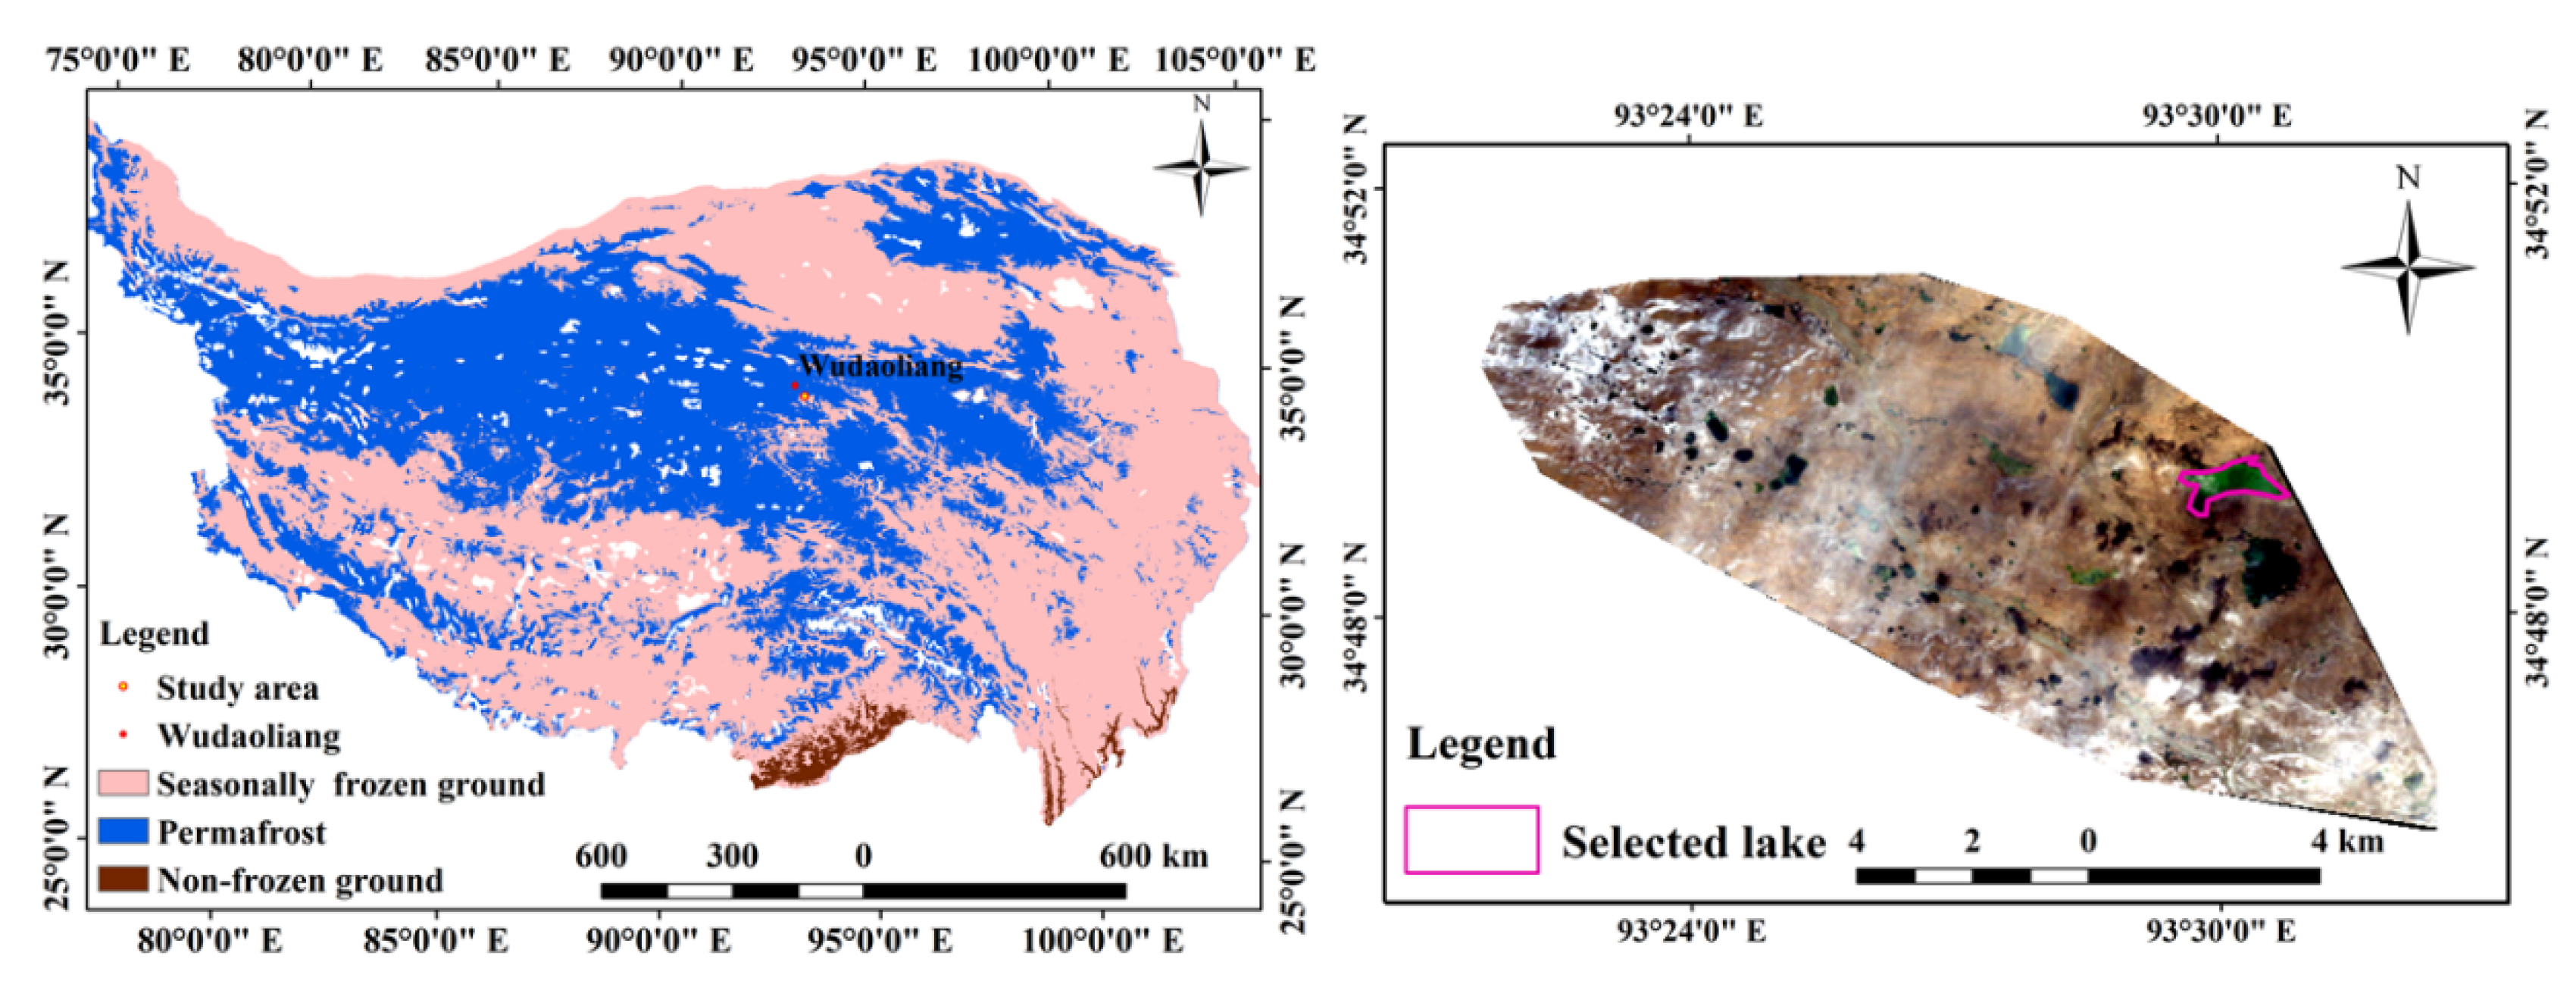
The study area covered about 89.54 km2 in the Beilu River Basin’s middle reaches in Yushu City (Figure 1), lying between 4500 and 5000 m in elevation. Figure 1 shows that the latitude of the region chosen covered the area from 34°46′1.56″ N to 34°51′11.68″ N, while the longitude of this area was from 93°21′33.32″ E to 93°32′48.06″ E during the period of 2000–2016. This region was mainly underlain by ice-rich permafrost. The mean annual air temperature measured at a meteorological station 20 km from the study area changed from −5.4 ℃ to −3.6 ℃. According to the literature [21,22], the lakes in this region are typical thermokarst lakes. To explore the development of a single thermokarst lake, the lake located on 34°49′18.70″ N, 93°30′14.77″ E, was also chosen as the representative study object, marked as selected lake in right map of Figure 1. In this area, there is an average of 265 lakes per year. Images from 2015 demonstrated that from among 265 lakes in the area, the largest lake measured 922,500 m2, while the area of the smallest lake was at 900 m2. The average area of these thermokarst lakes is 21,762.774 m2. According to the previous publication [23], the mean depth of these thermokarst lakes is 2.1 m. All this information is listed in Table 1.
2.2. Dataset
The Landsat-5 TM sensor images from 2000 to 2012 and Landsat-8 OLI sensor images from 2013 to 2016 were chosen to estimate the variation of thermokarst lakes in this study area. Most research about thermokarst lakes use Landsat images because of their high resolution. Ian Olthof’s group used Landsat images to study Canada’s Northwest Territories [24]. Prajna Regmi used the Landsat-5 images to identify the post-drainage succession in thermokarst lake basins on the Seward Peninsula, Alaska [25]. Landsat-5 and Landsat-8 images were taken between September and December. All the map data were acquired from the United States Geological Survey (https://www.usgs.gov/ (accessed on 6 June 2021)), obtained from Worldwide Reference System-2 (WRS-2) path/row system. All images were only mapped at a scale of 1: 1,500,000. The spatial resolution of all images acquired by the satellite sensor systems was 30 m × 30 m. To explore the reasons for the variation of a thermokarst lake in the study area, the meteorological data were collected from the weather station Wudaoliang (https://www.weatherhq.co.uk/weather-station/wudaoliang (accessed on 6 June 2021)), which was 20 km from the study area. The meteorological data collected include precipitation, wind speed, average temperature, and relative humidity.
2.3. Methodology
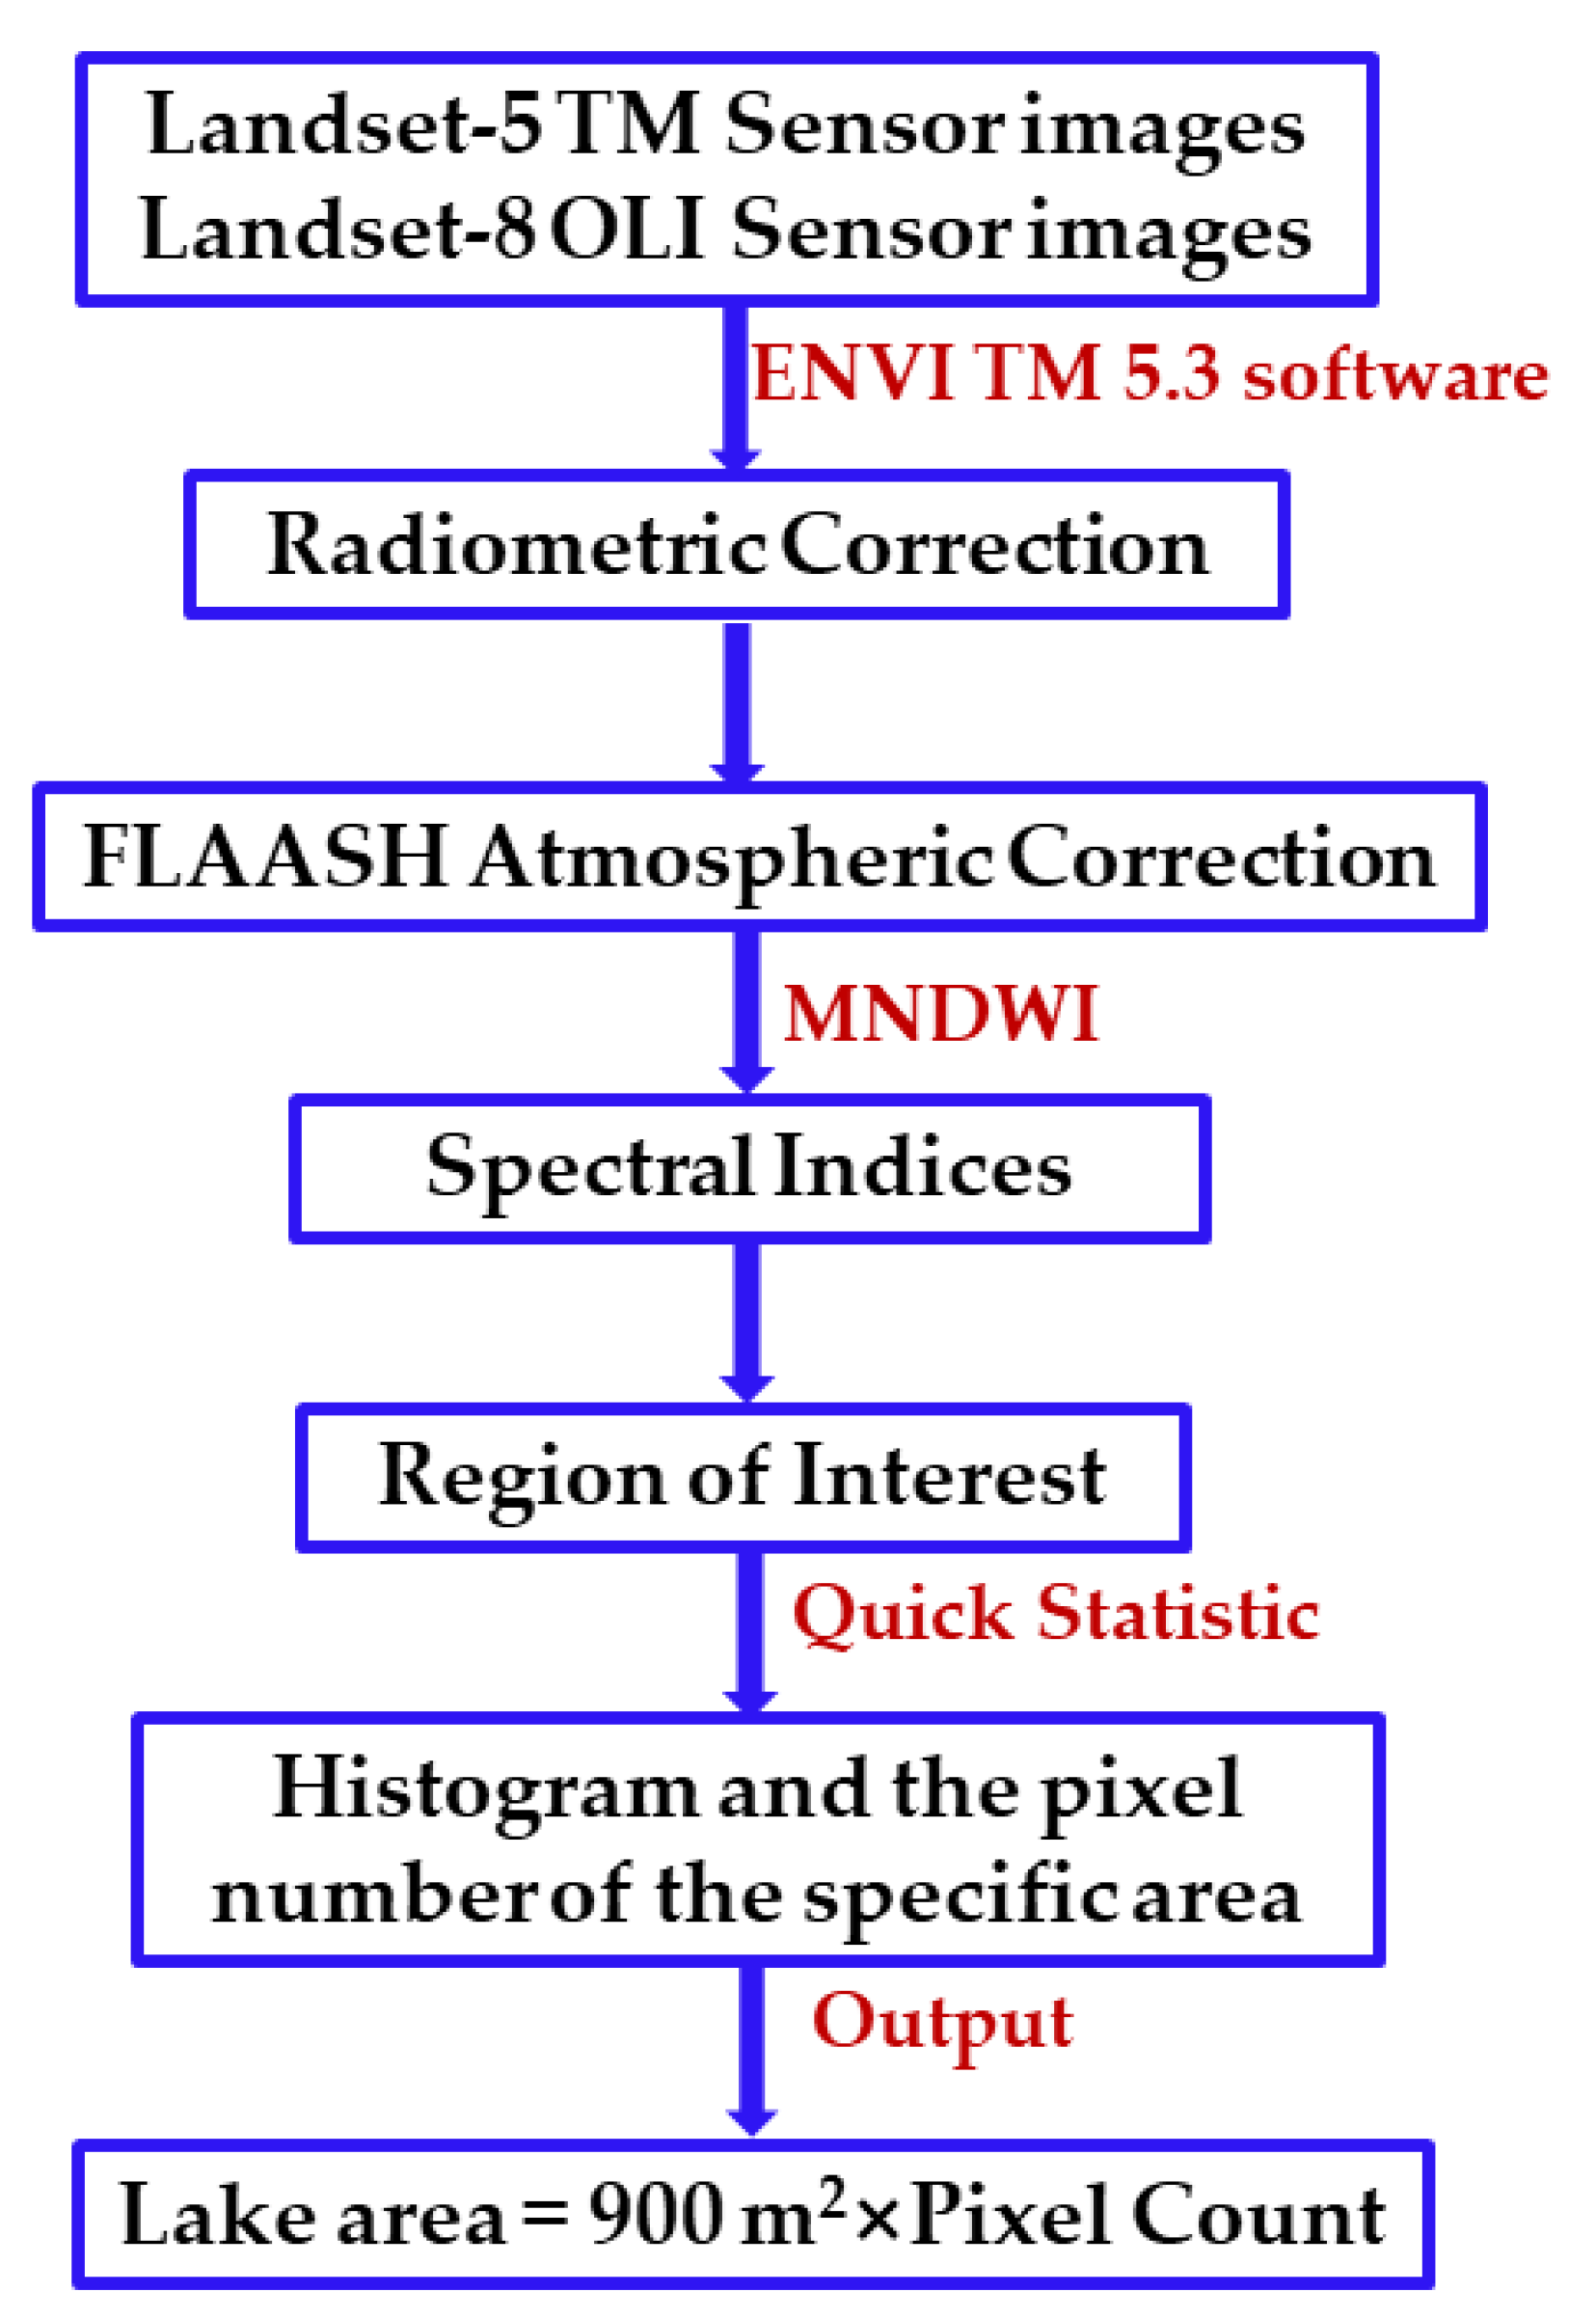
The ENVI 5.3 edition image analysis software (Harris Geospatial Solutions Inc., Broomfield, CO, USA) was used to delineate thermokarst lakes in the multispectral images. Water bodies are strong absorbers of infrared radiation. Therefore, thermokarst lakes can easily be distinguished from other land cover types in multispectral images [23]. The radiometric correction and atmospheric correction were applied to ensure image calculation accuracy, and the Modified Normalized Difference Water Index (MNDWI) was used to delineate water bodies in the multispectral images [26]. The process is shown in Figure 2 and is as follows: First, the selected image was imported to the ENVI image analysis software. The “Radiometric Calibration” tool was used to calibrate the pixel value and correct the image error. Next, the tool called “Fast Line-of-sight Atmospheric Analysis of Hypercubes (FLAASH) Atmospheric Correction” was selected to remove the effects of the atmosphere on the reflectance values of the images.
The ENVI “Spectral Indices” tool was subsequently used to apply the MNDWI index in order to change the band value. Finally, “Region of Interest (ROI)” in ENVI software was used to separate the thermokarst lakes from another land cover in the image, which provided the histogram and the specific area’s pixel number. The area of thermokarst lakes could then be obtained by multiplying pixel counts and pixel area size, which was at 900 m2.
2.3.1. Image Processing
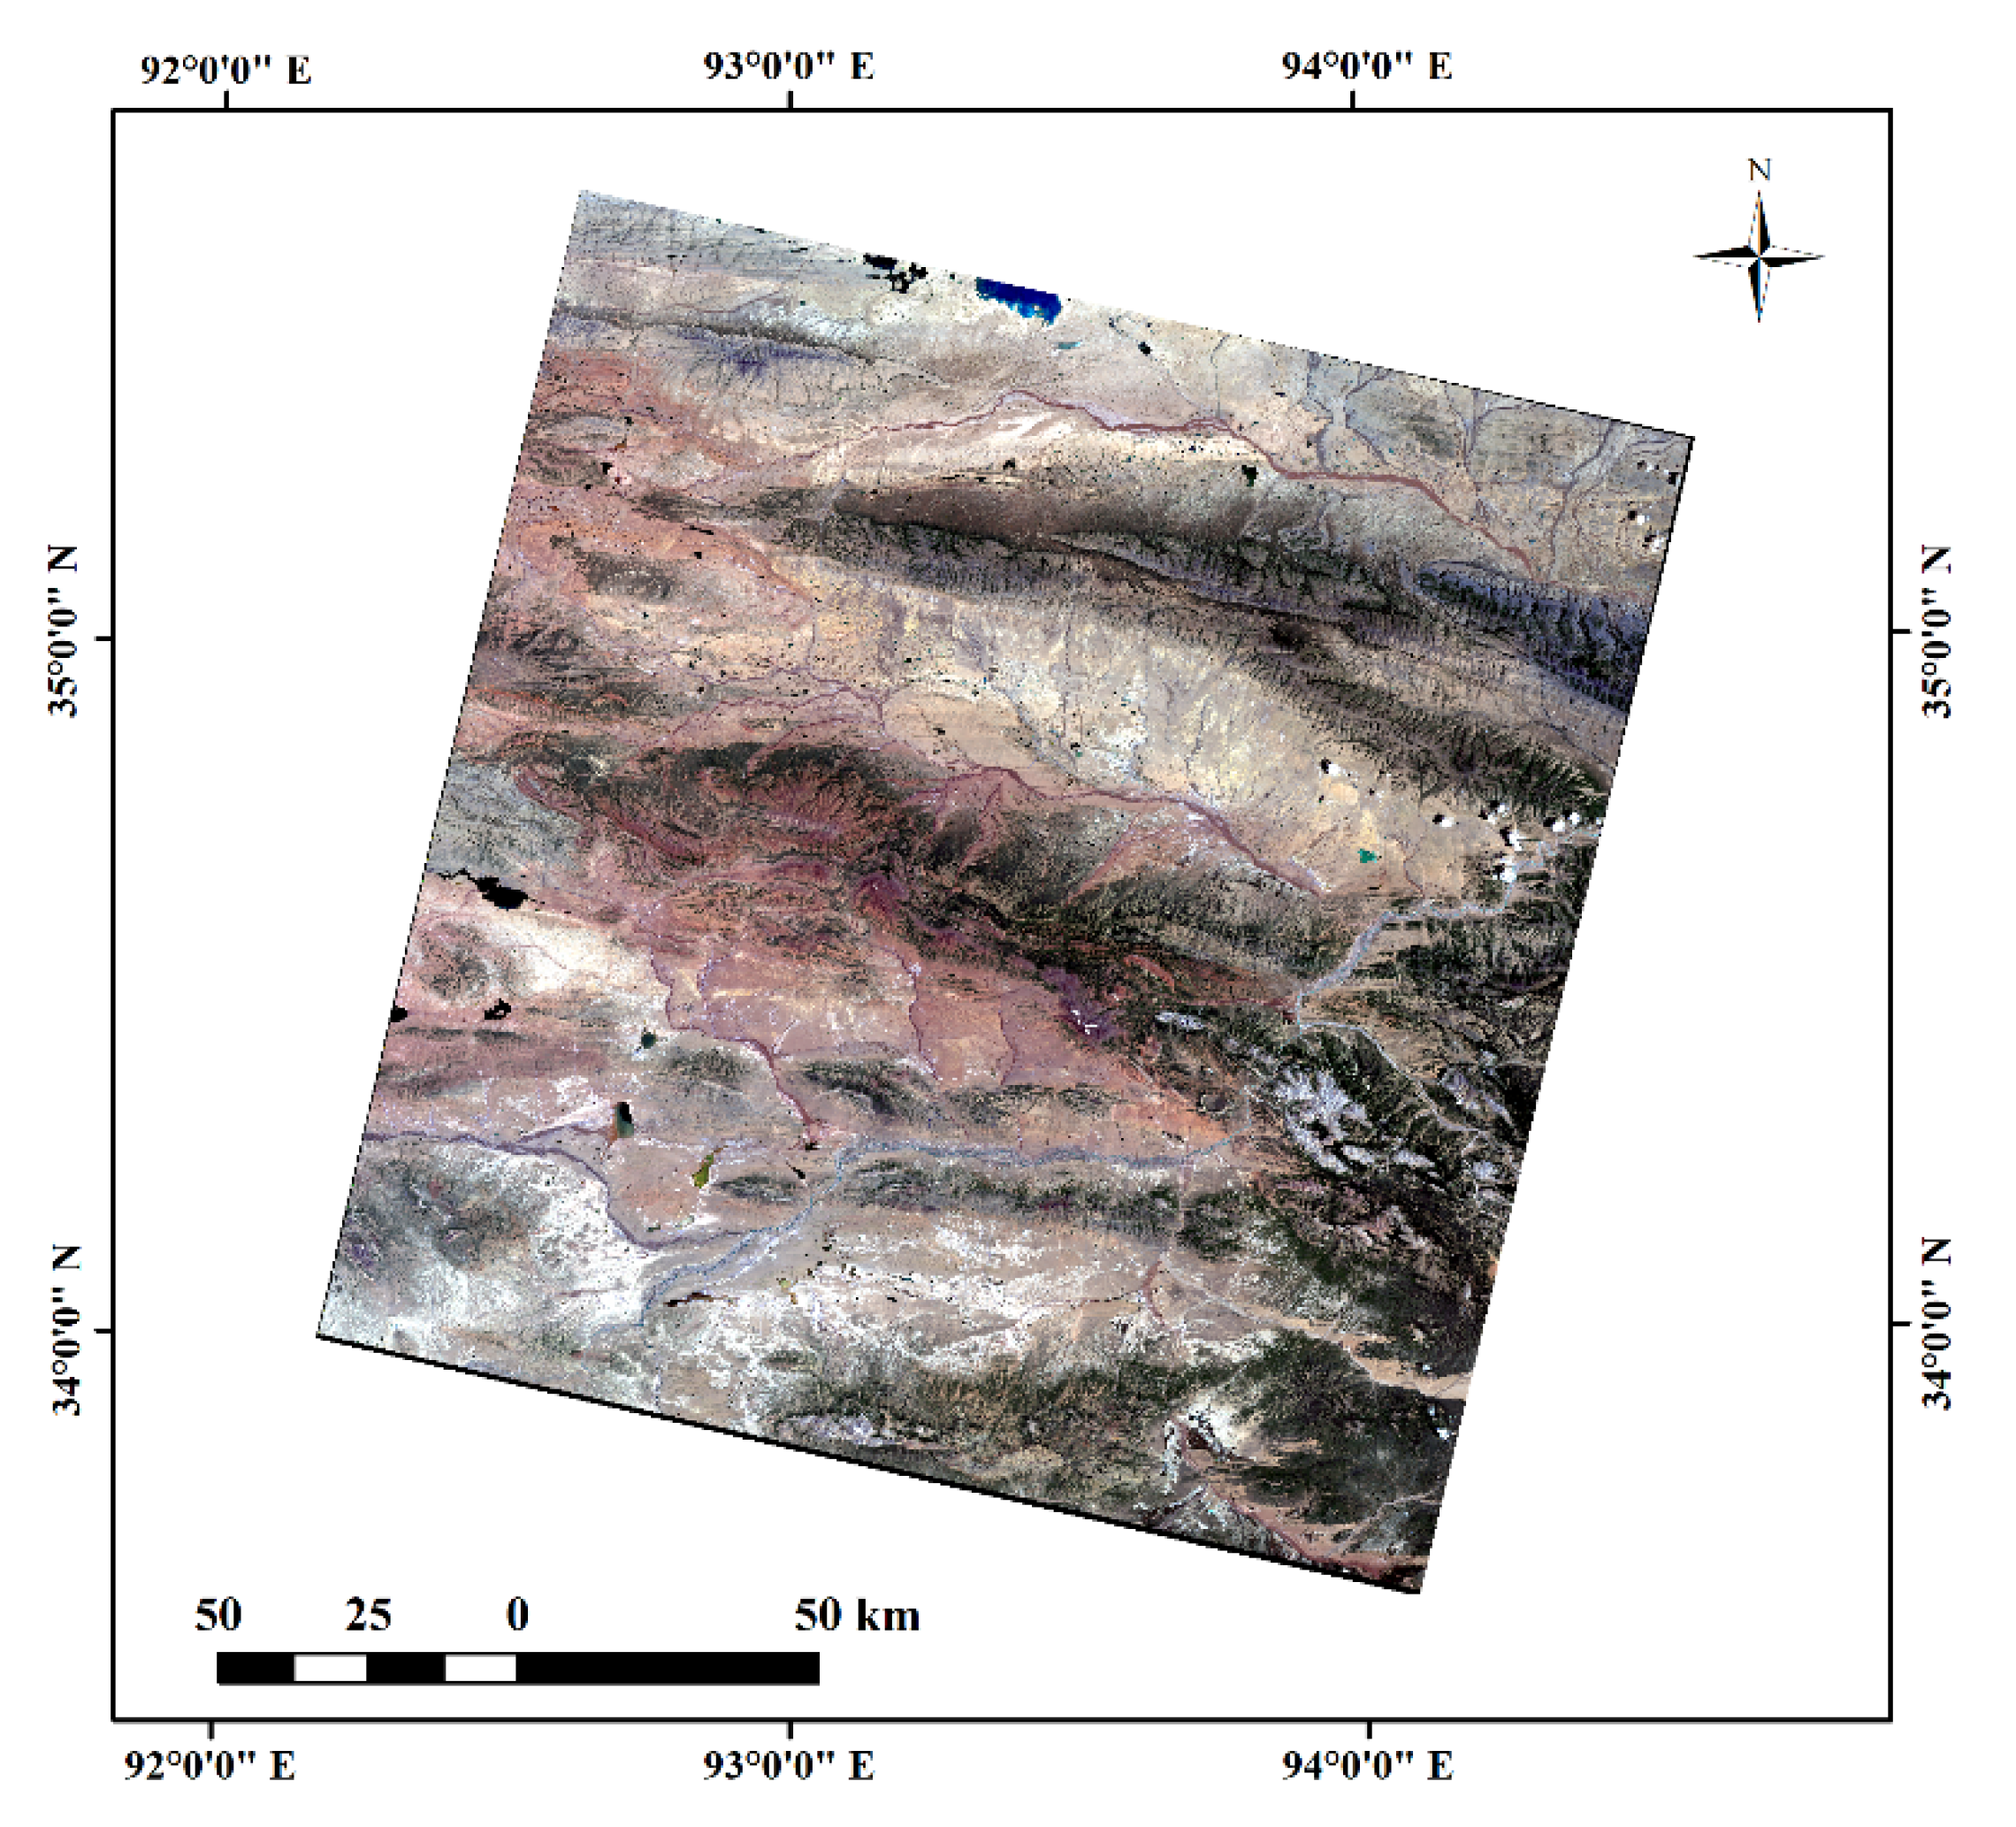
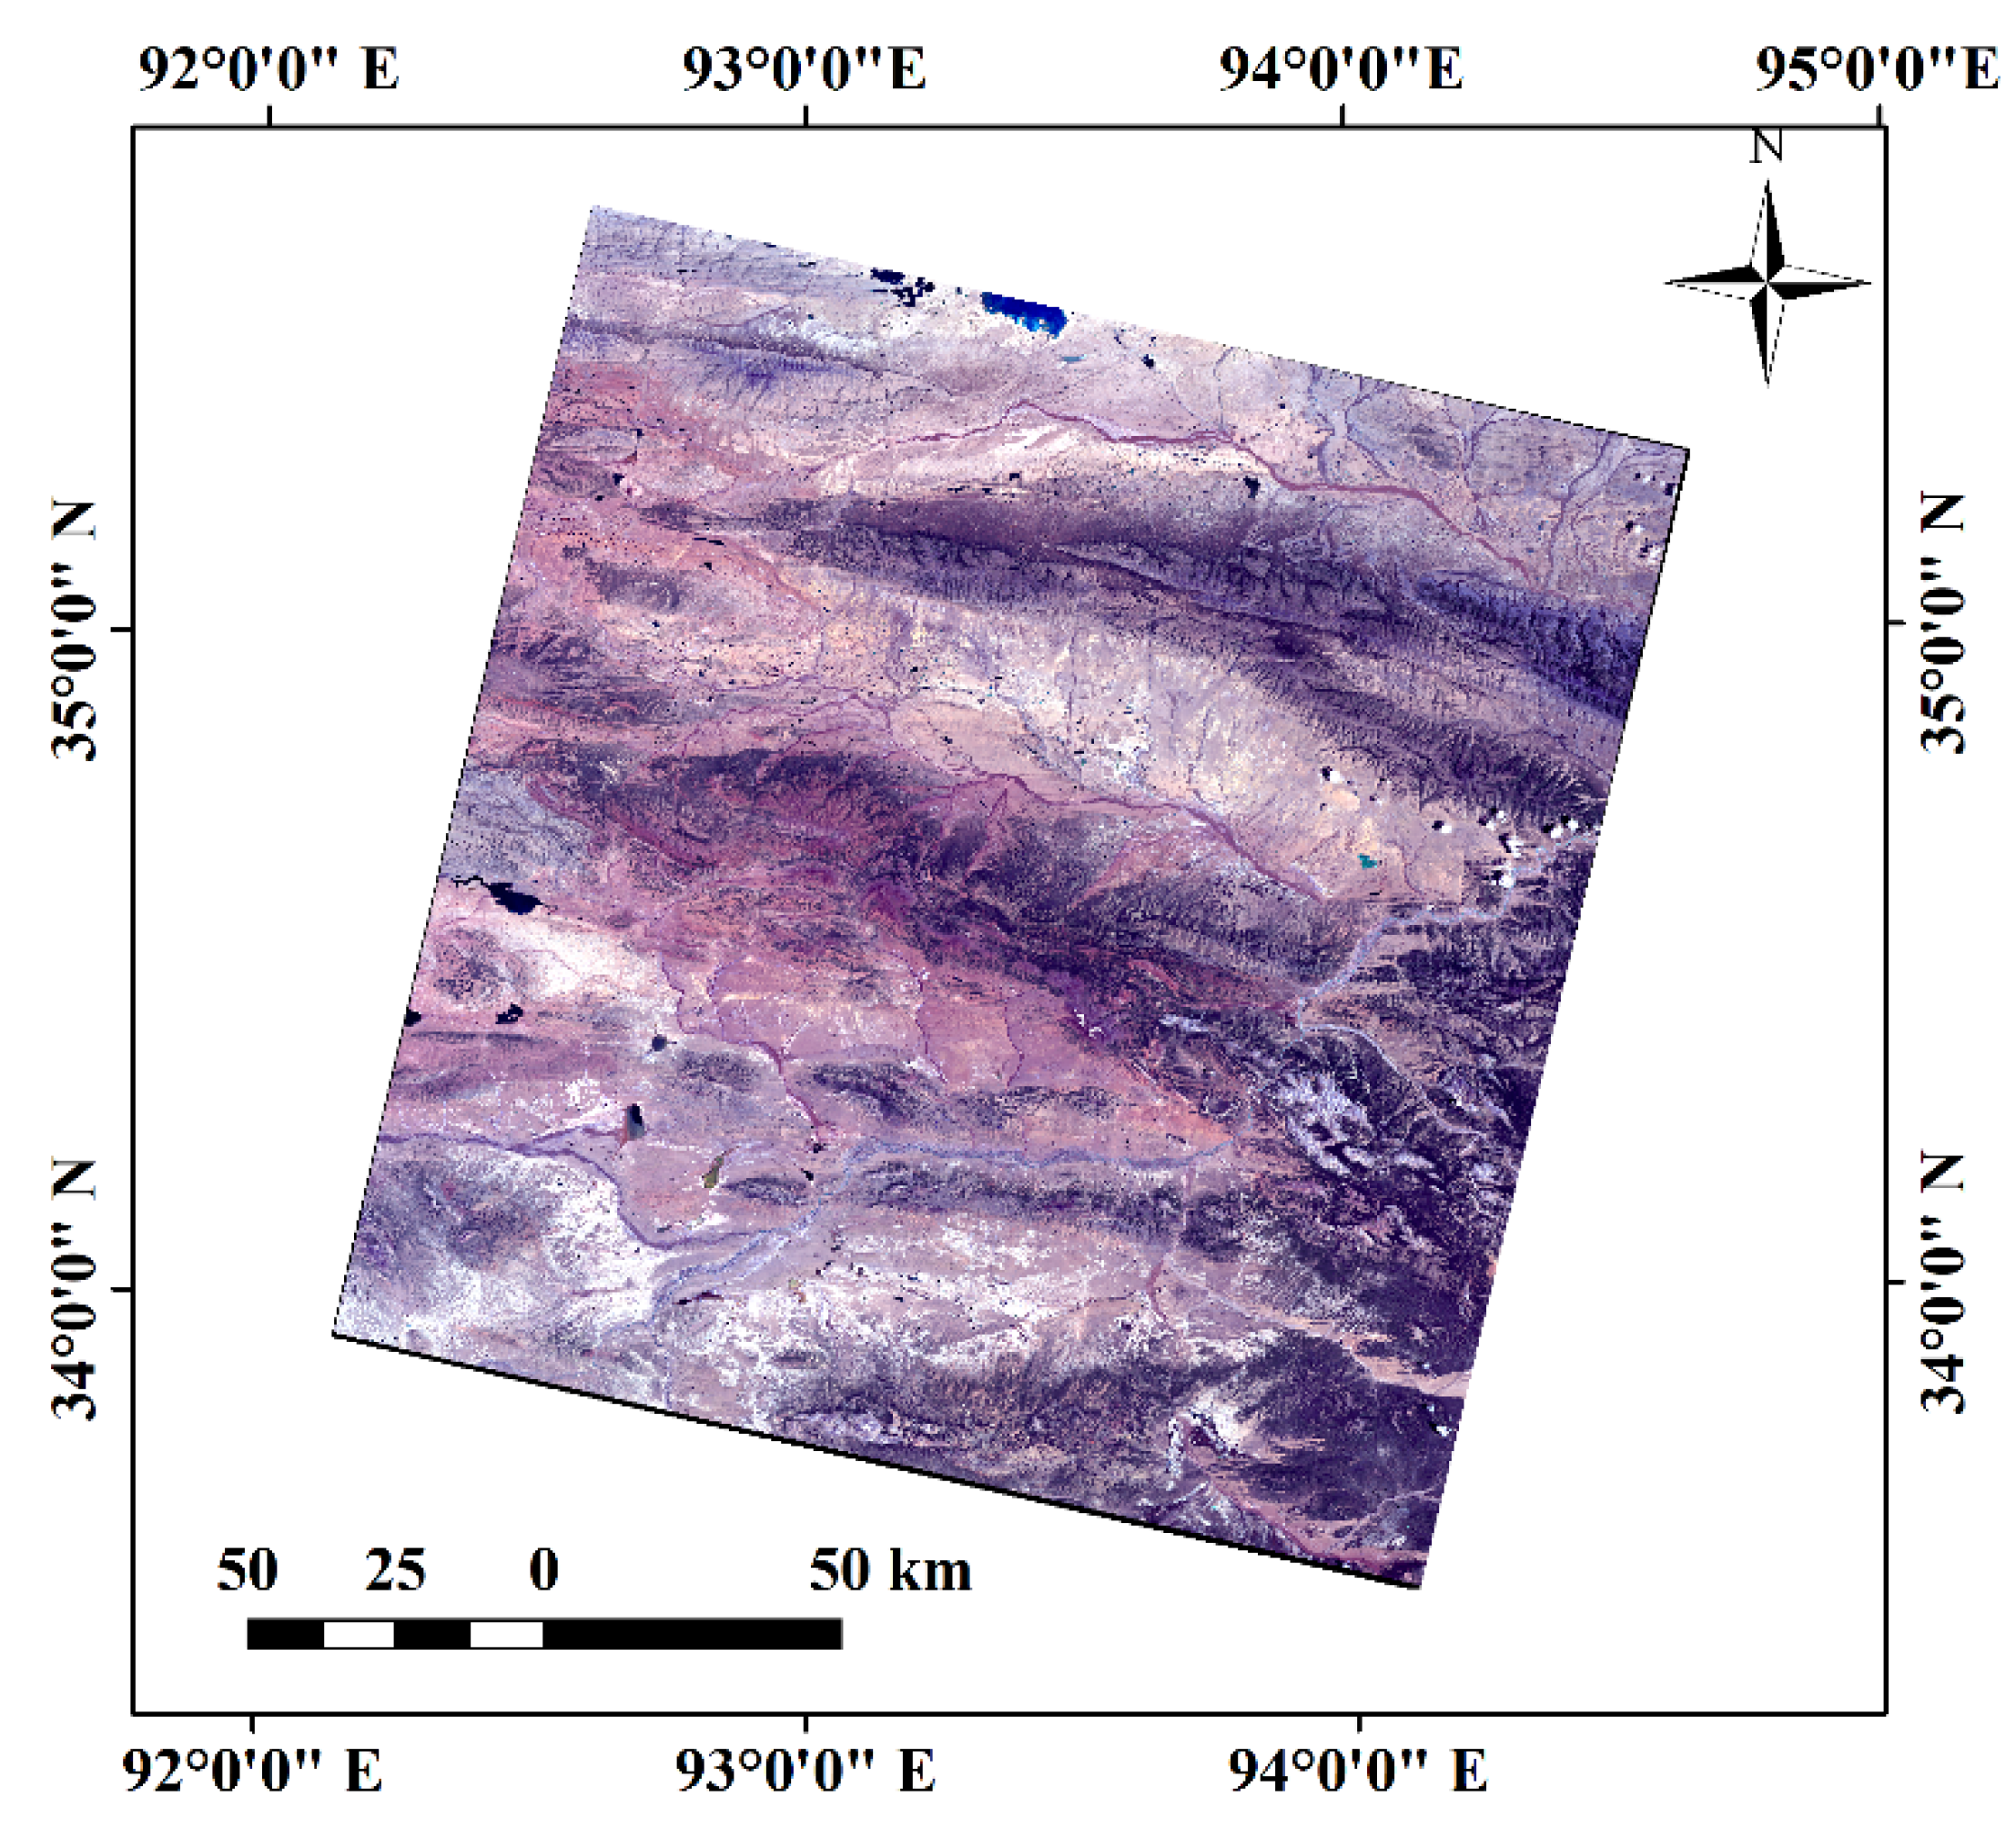
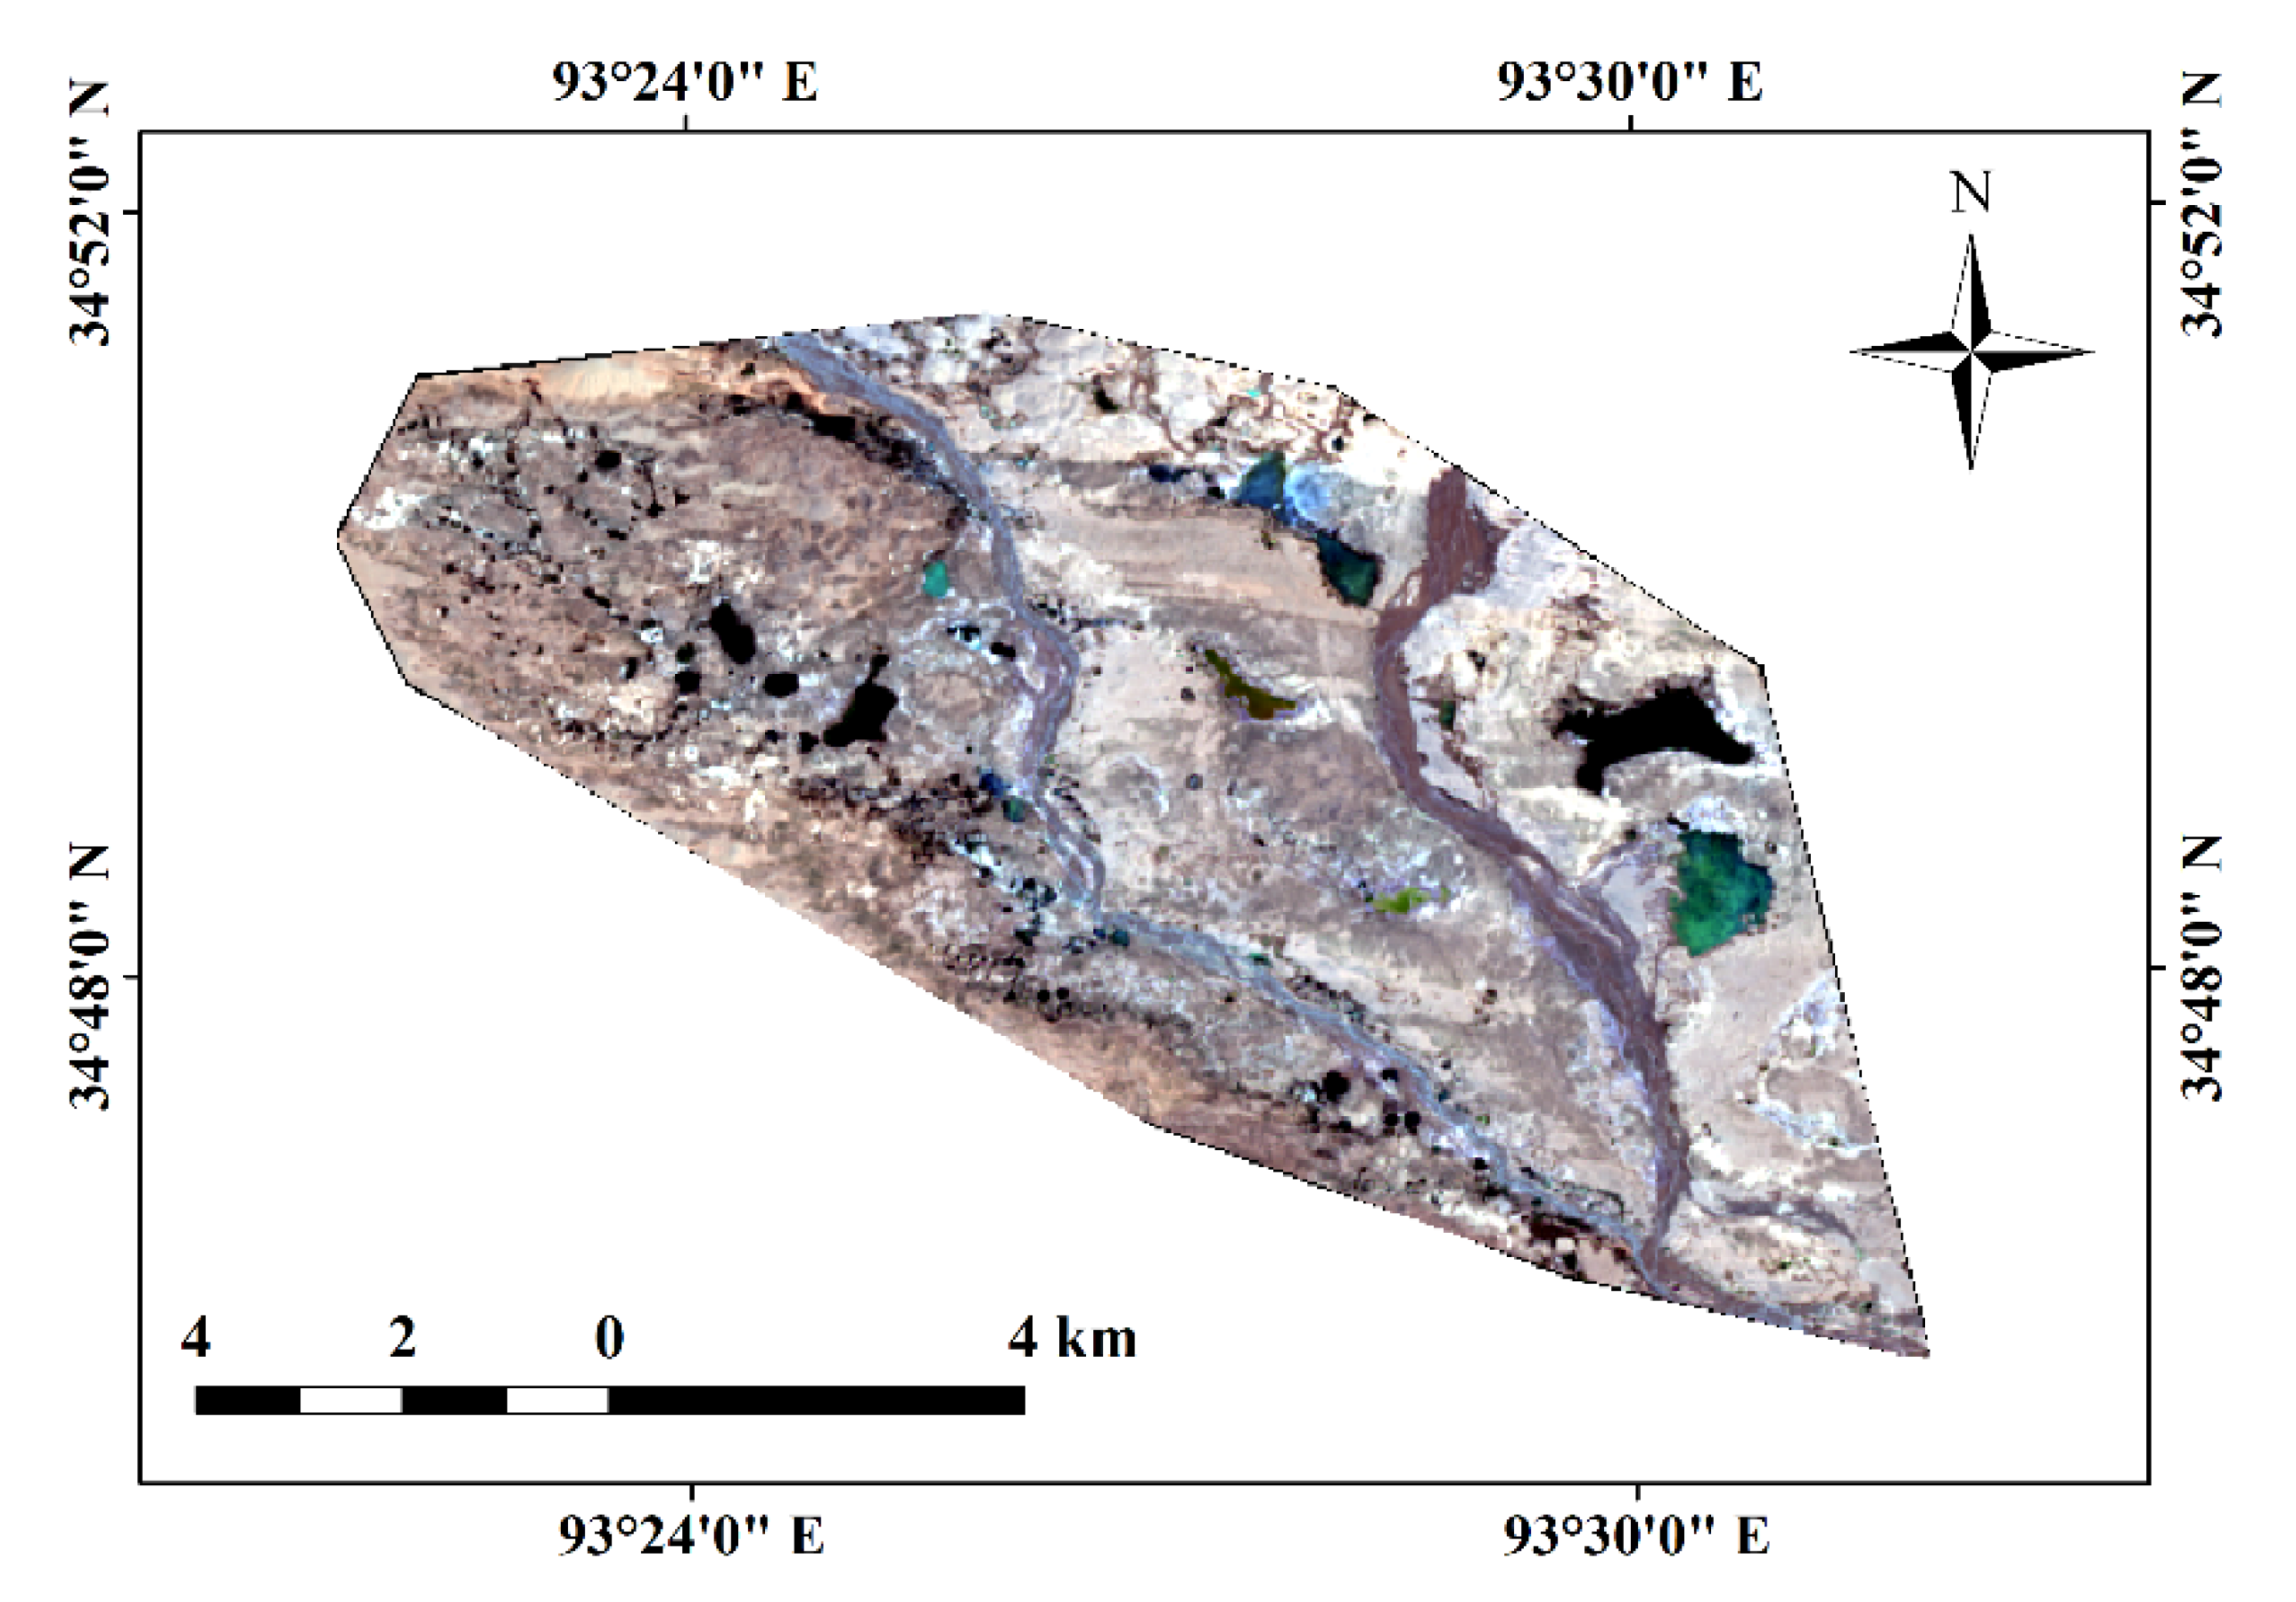
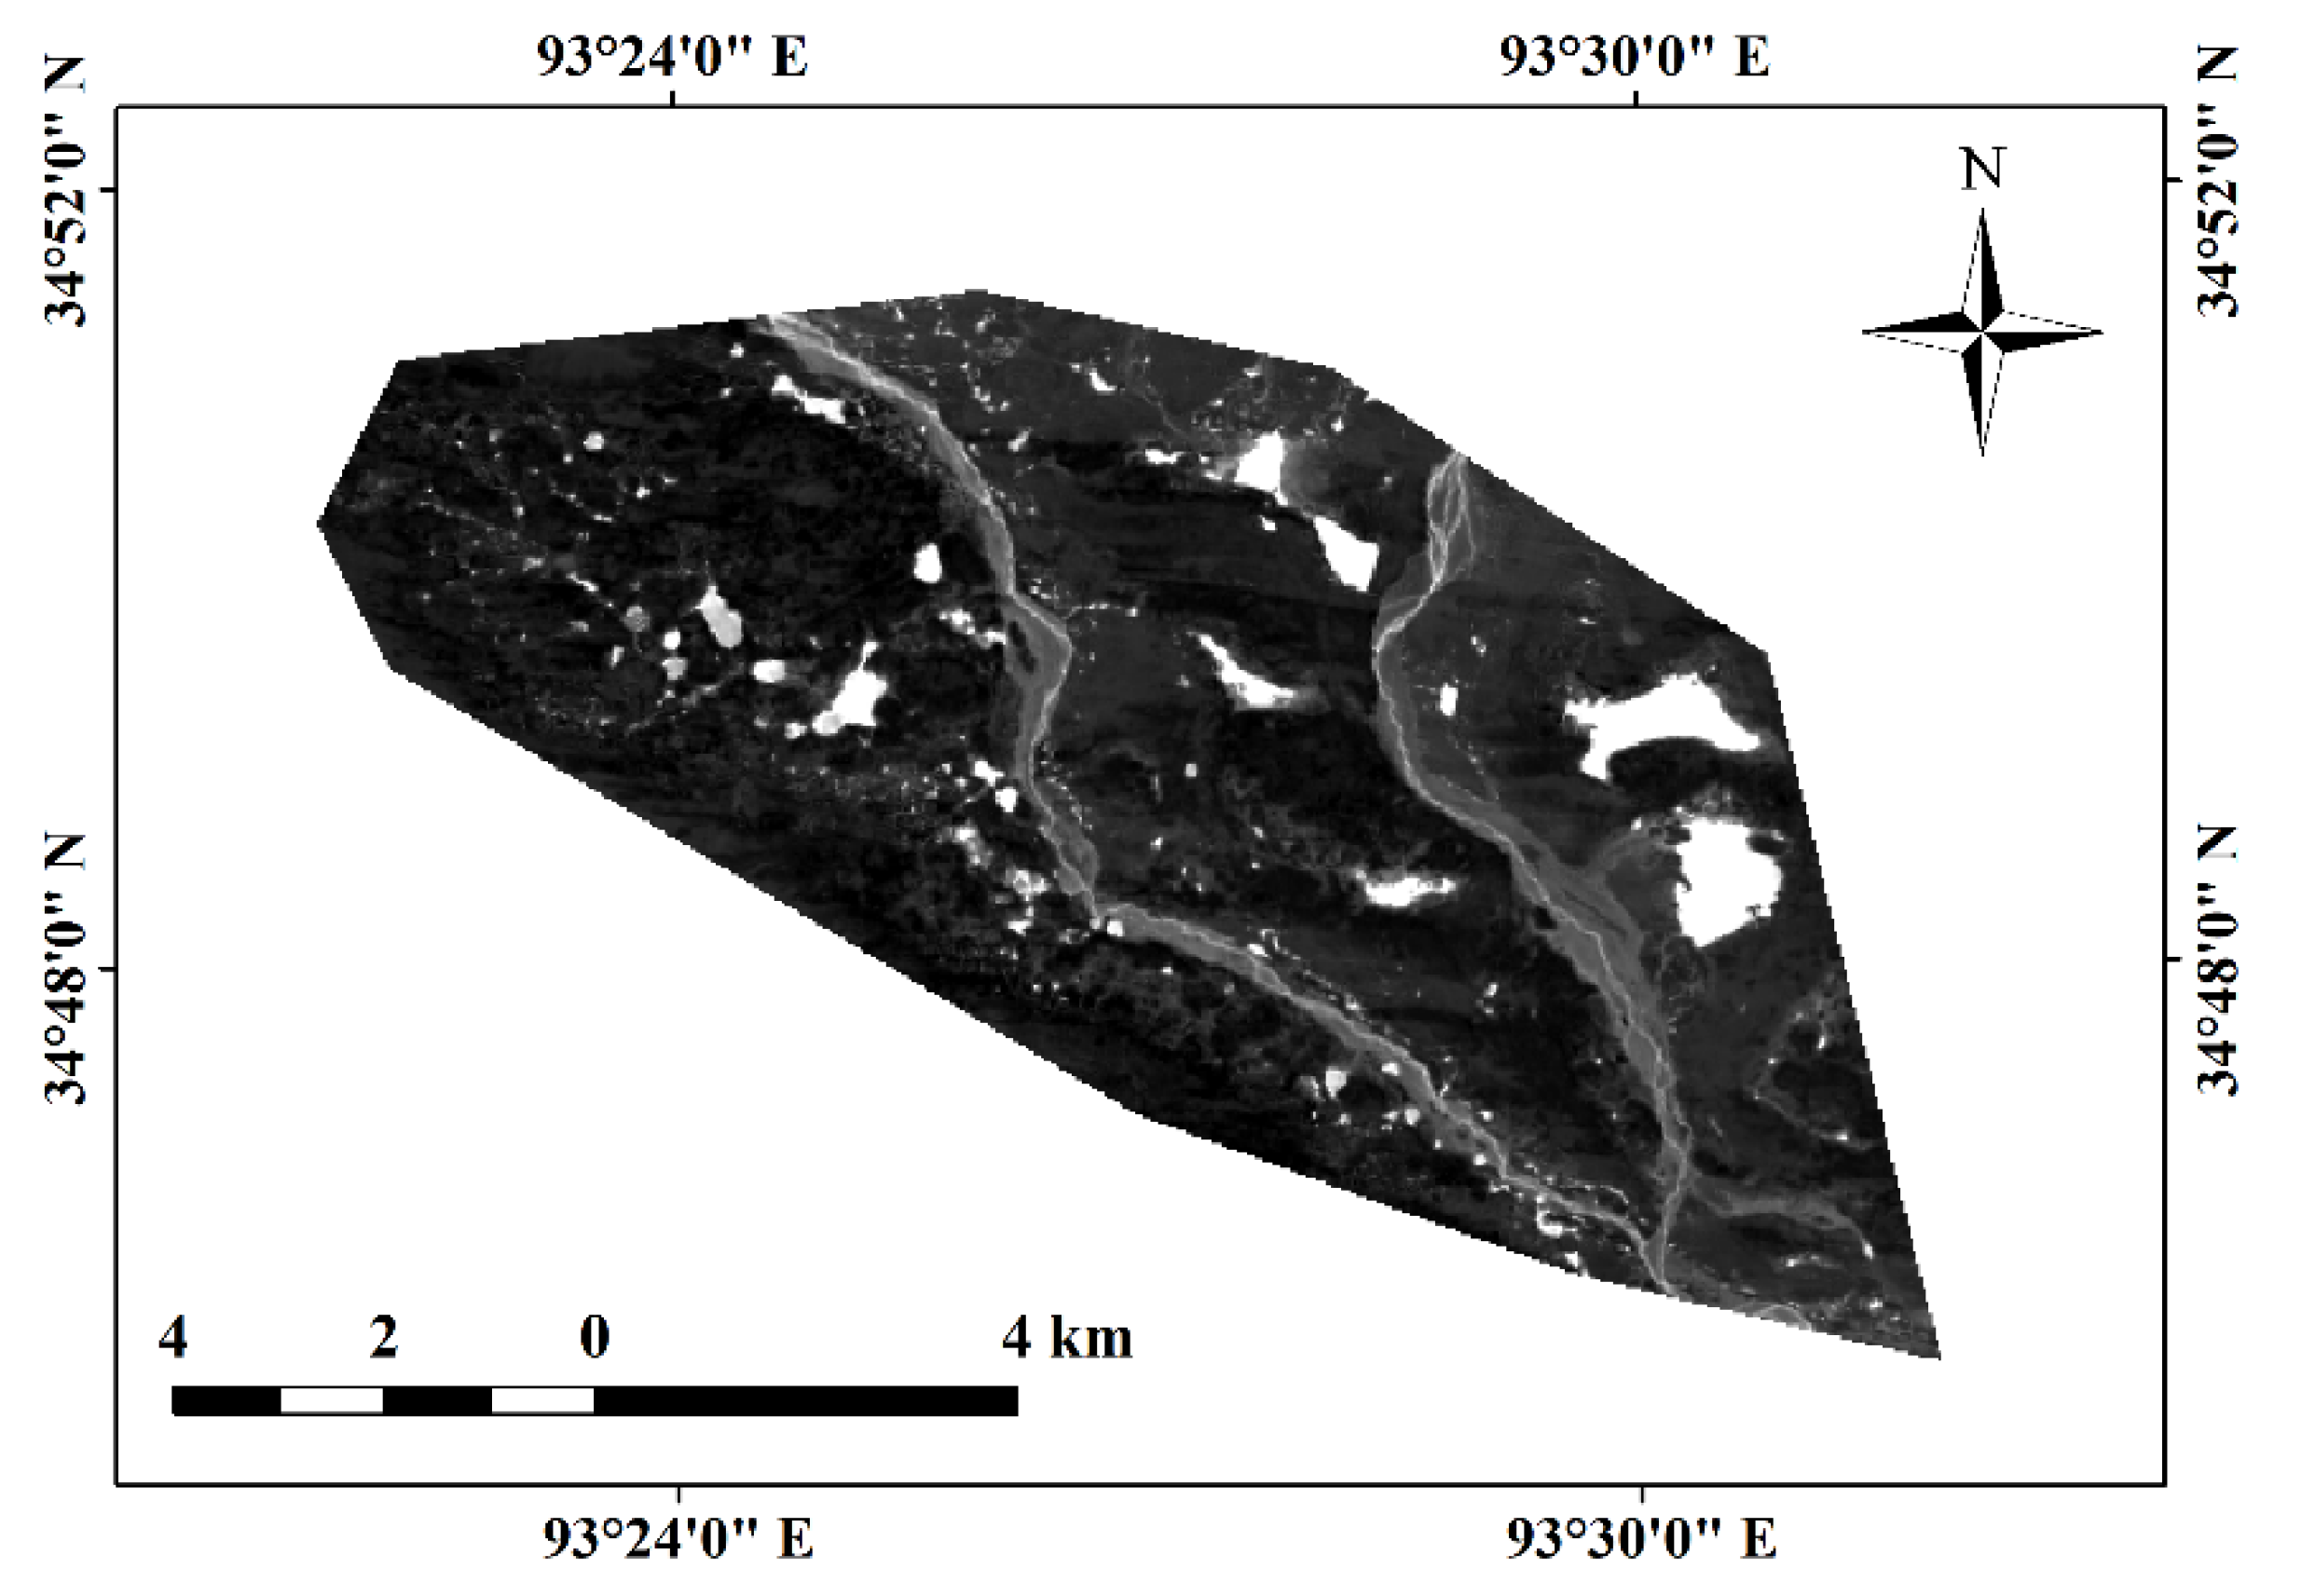
From the above description, it could easily be understood that "radiometric correction" and "atmospheric correction" are the important pre-processing steps. Radiometric correction is aimed at removing the effects that alter the spectral characteristics of land features, except for actual changes in ground target, becoming mandatory in multi-sensor, multi-date studies [27]. The image of the study area in 2015, shown in Figure 3, illustrates the result after radiometric correction. Atmospheric correction aims to remove the effects of the atmosphere on the reflectance values of images taken by satellite or airborne sensors [28]. The image of the study area in 2015 is shown in Figure 4 to demonstrate the results after FLAASH Atmospheric Correction. After the correction was finished, the selection of the study area could then be carried out.
The study area was manually chosen as a leaf-shaped polygon in the correction image. In the ENVI image analysis software, ROI was used to fix the study area. There were more than 130 thermokarst lakes with different sizes in this area, as indicated in Figure 5. To explore the modification of a single thermokarst lake located on 34°49′18.70″ N, 93°30′14.77″ E, it was manually checked with a red boundary line as the study object.
After determining the study area, thermokarst lakes needed to be distinguished from any other feature in the study area. Compared with other methods, the MNDWI index is more likely to enhance water information so that the water surface can be extracted more accurately and has been widely used to produce surface water maps at different scales. Therefore, the MNDWI index was selected to distinguish thermokarst lakes in the study area [29,30]; it can be calculated by Equation (1).
where Green is a green band such as TM band 2, and MIR is a middle infrared band such as TM band 5.
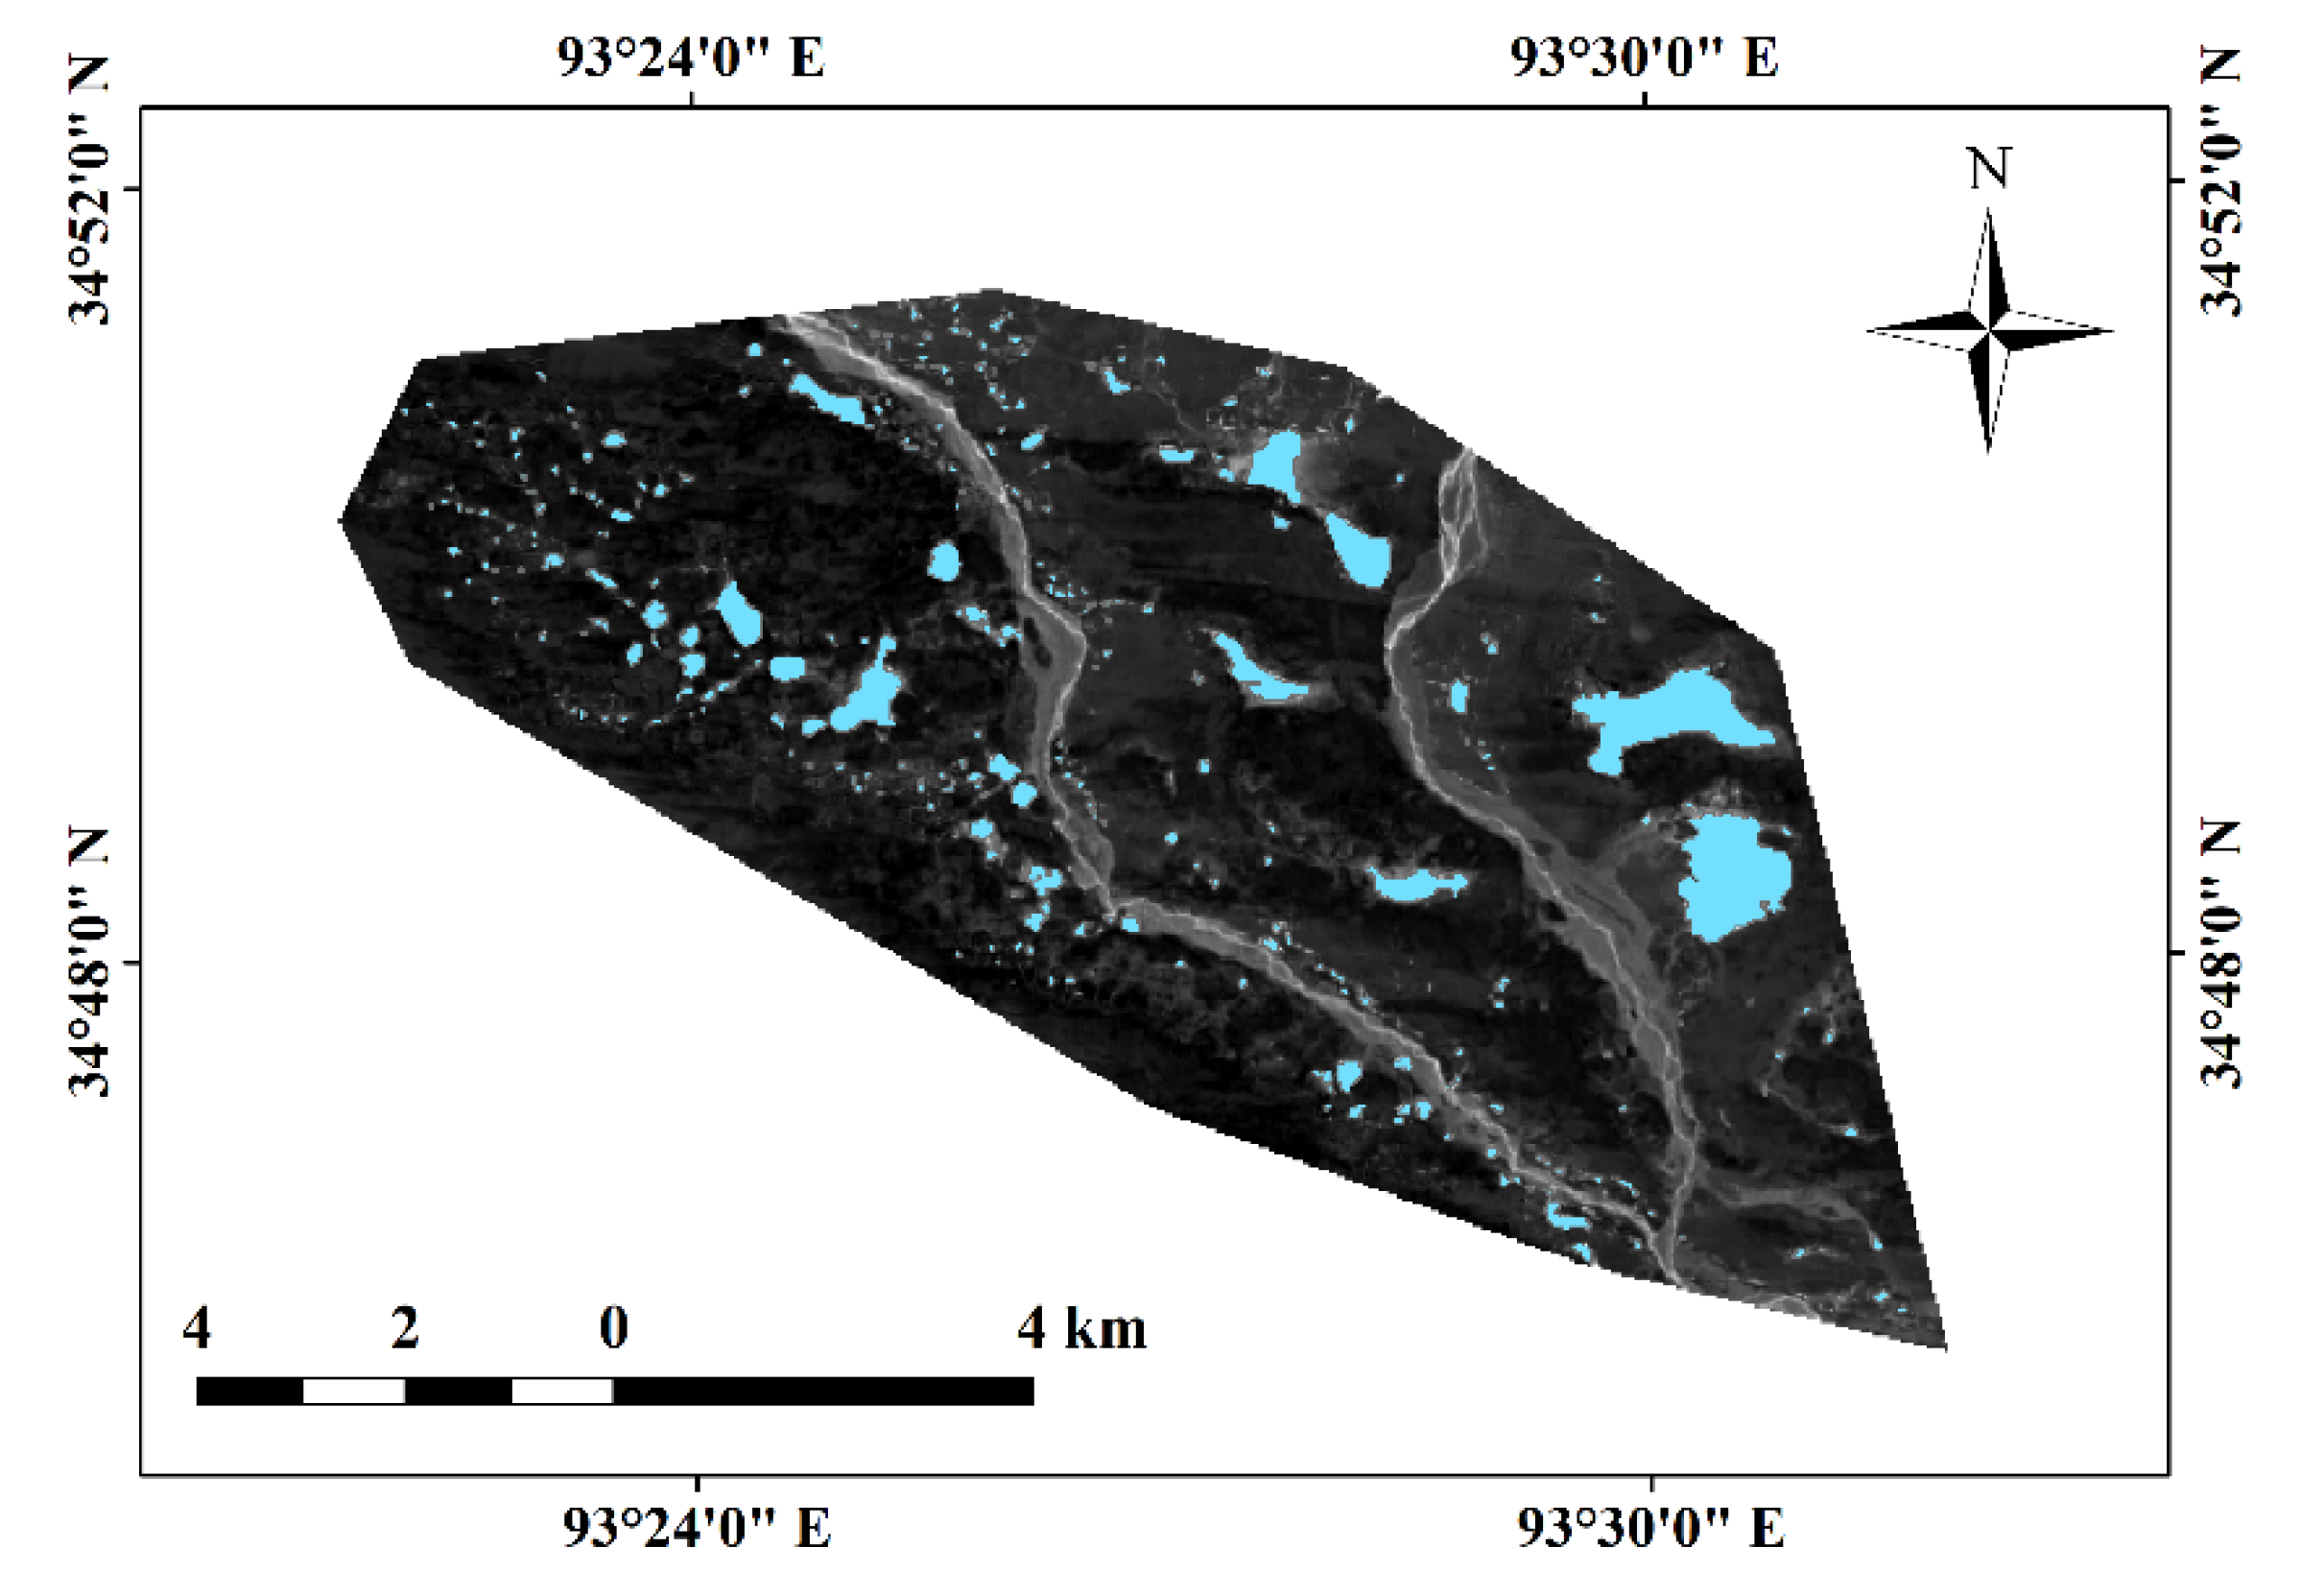
After performing this process, this work applied “Spectral Indices” in ENVI software to obtain the MNDWI image of the study area. The output image in 2015 is shown in Figure 6.
2.3.2. Image Information and Area Output
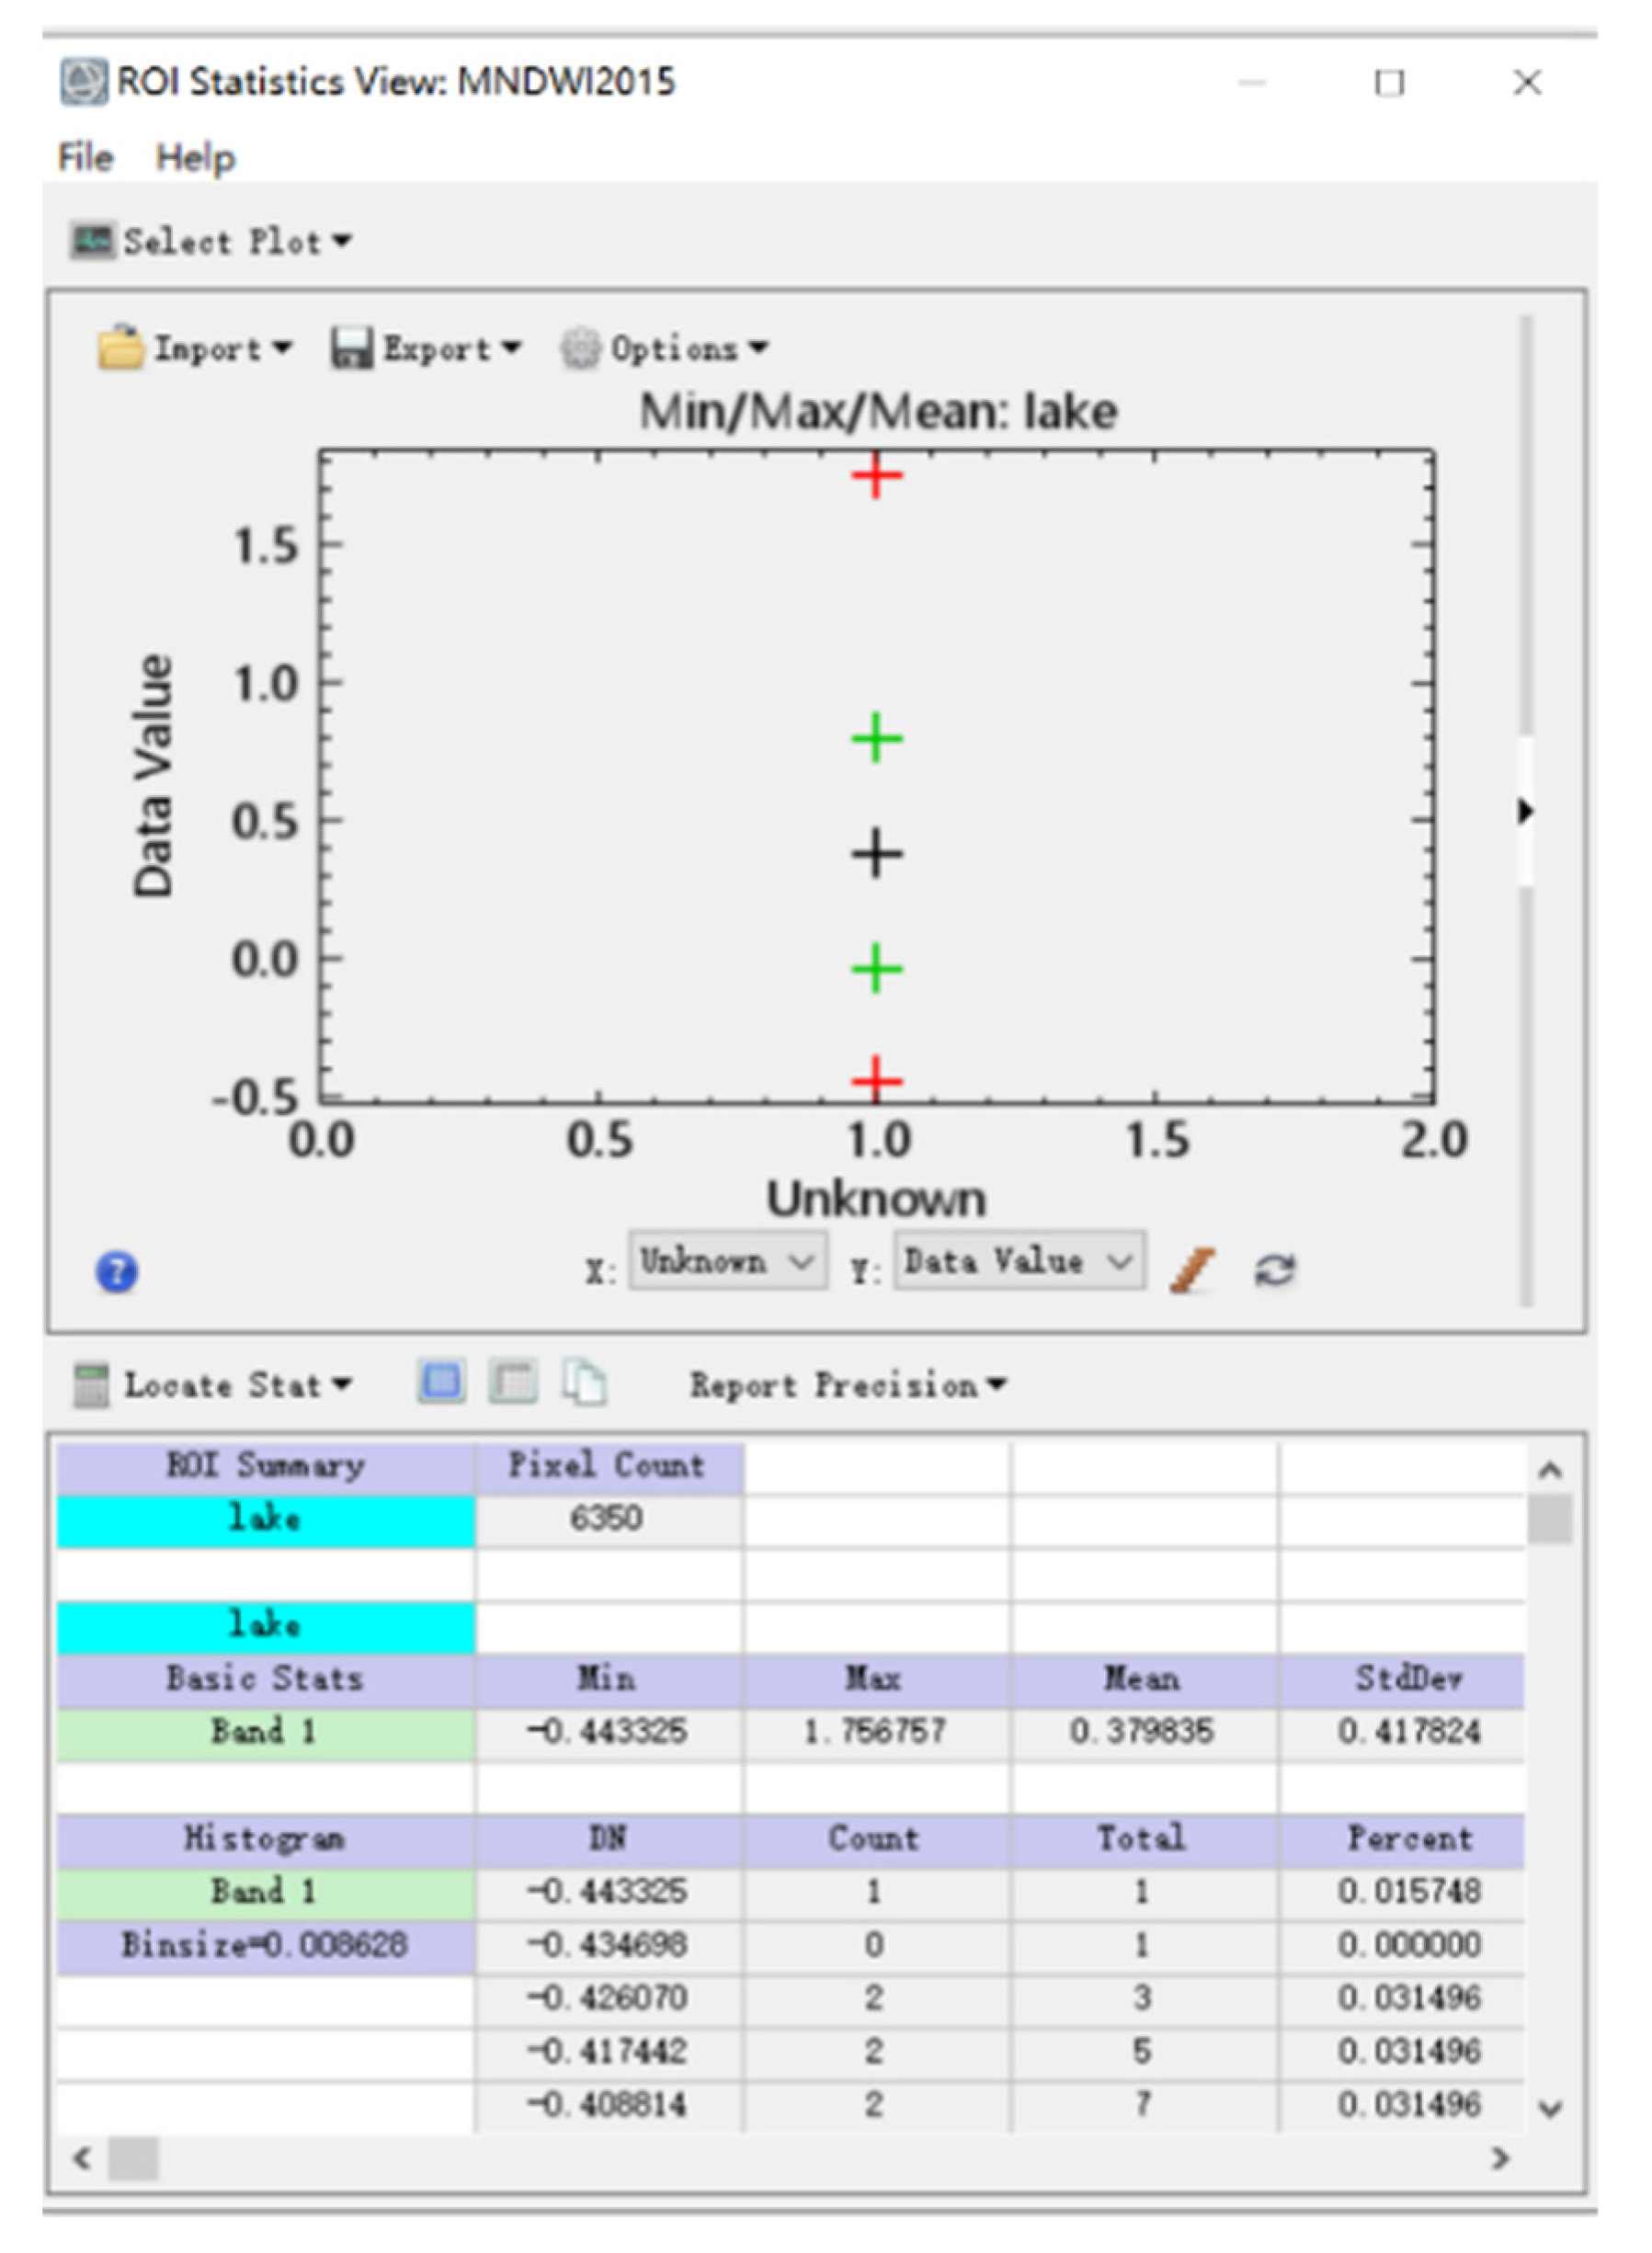
After MNDWI index calculation, ROI was used to manually fix the boundaries of the thermokarst lakes in order to distinguish them from the rivers and the snow in this area (shown in Figure 7) because all three appeared as light colors in the image [31]. To improve the accuracy, this work used the tool "quick statistic" to generate the histogram and the pixel number of the specific area, such that the total area could simply be calculated by multiplying resolution by pixels. The result of the image in 2015 is shown in Figure 8. All measurements of the area of thermokarst lakes from 2000 to 2016 were displayed in Supporting Information Figures S1–S48.
2.4. Statistical Analysis of the Relationship between the Thermokarst Lake Area and Meteorological Factors
To explore the relationship between the thermokarst lake area and meteorological factors, multivariate statistics were employed via IBM SPSS Statistics 23 software. First, input variables were chosen, as this article sought to obtain correlations such as those between the total lake area and annual average temperature. Next, the "Bivariate" tool in SPSS was used to calculate the Pearson coefficient r value through this formula for input variables: The coefficient value is between +1 and −1. When the coefficient value is close to 0, the correlation between the two variables is considered small. When the coefficient value is close to −1 or 1, the correlation is considered large. With an interval from 0 to 1, the correlation is positive; with an interval from −1 to 0, the correlation is negative [32,33]. After that, we also used the SPSS tool to apply multiple linear regression to obtain the correlation between the meteorological factors, the total area of the thermokarst lakes, and the accuracy. The data input process was similar to the correlation analysis. Then, the "Regression" tool was used and the "Linear’’ option was chosen to process the data. Finally, the regression equation produced the output and illustrated the result.
3. Results and Discussion
3.1. Variation of the Total Area of Thermokarst Lakes in the Beilu River Basin
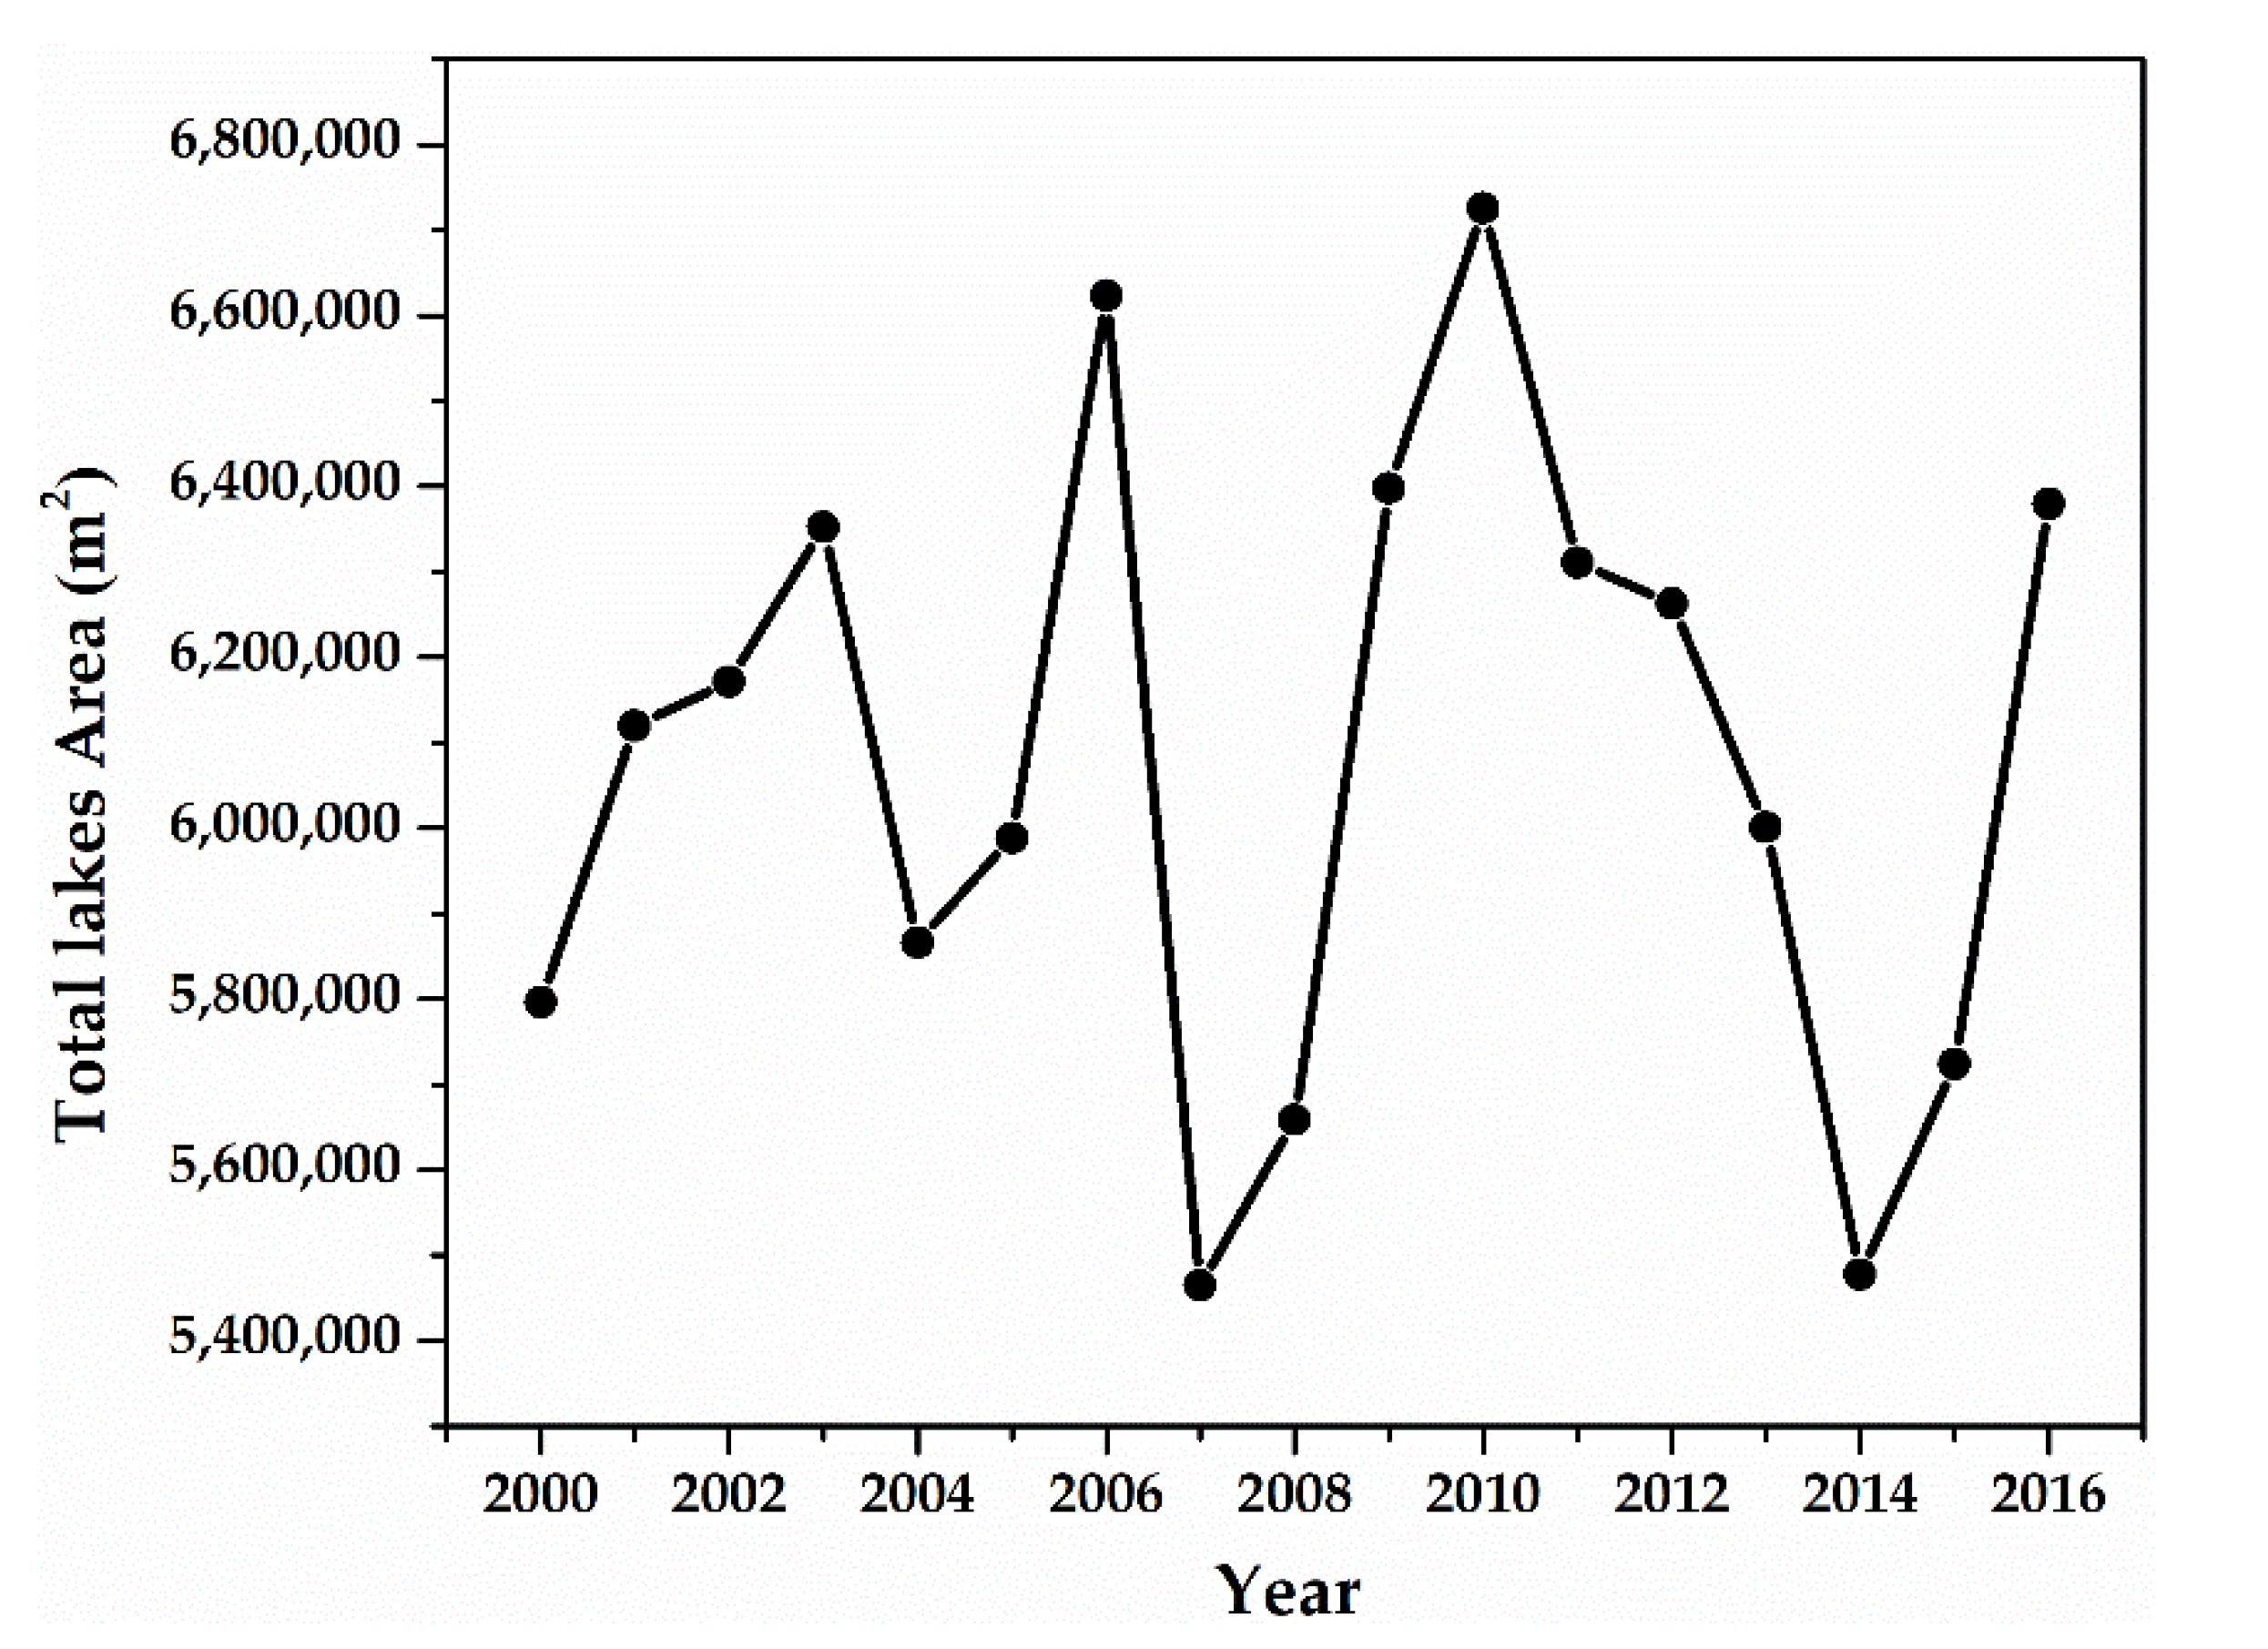
In the southeast of the Beilu River Basin, we selected 265 thermokarst lakes to calculate the total area. To illustrate the development of thermokarst lakes, we calculated the total area of the thermokarst lakes within the study area from 2000 to 2016, shown in Figure 9. During the past decades, the total area of thermokarst lakes oscillated in the period between 2000 and 2016. During this period, the total area of thermokarst lakes within the study area increased from 5,464,800 m2 to 6,310,800 m2. Figure 9 shows that the largest total areas were 6,310,800 m2, appearing in 2010, while the smallest total area was 4,873,500 m2 in 2007. Between 2000 and 2011, the total area of thermokarst lakes reached a maximum value almost once every four years, such as in 2003, in 2006, and in 2010. From 2012 to 2016, the total area of thermokarst lakes within the study area first decreased and then increased. After 2012, the smallest total area was 5,477,400 m2 in 2014.
3.2. Variation of the Single Selected Thermokarst Lake in the Beilu River Basin
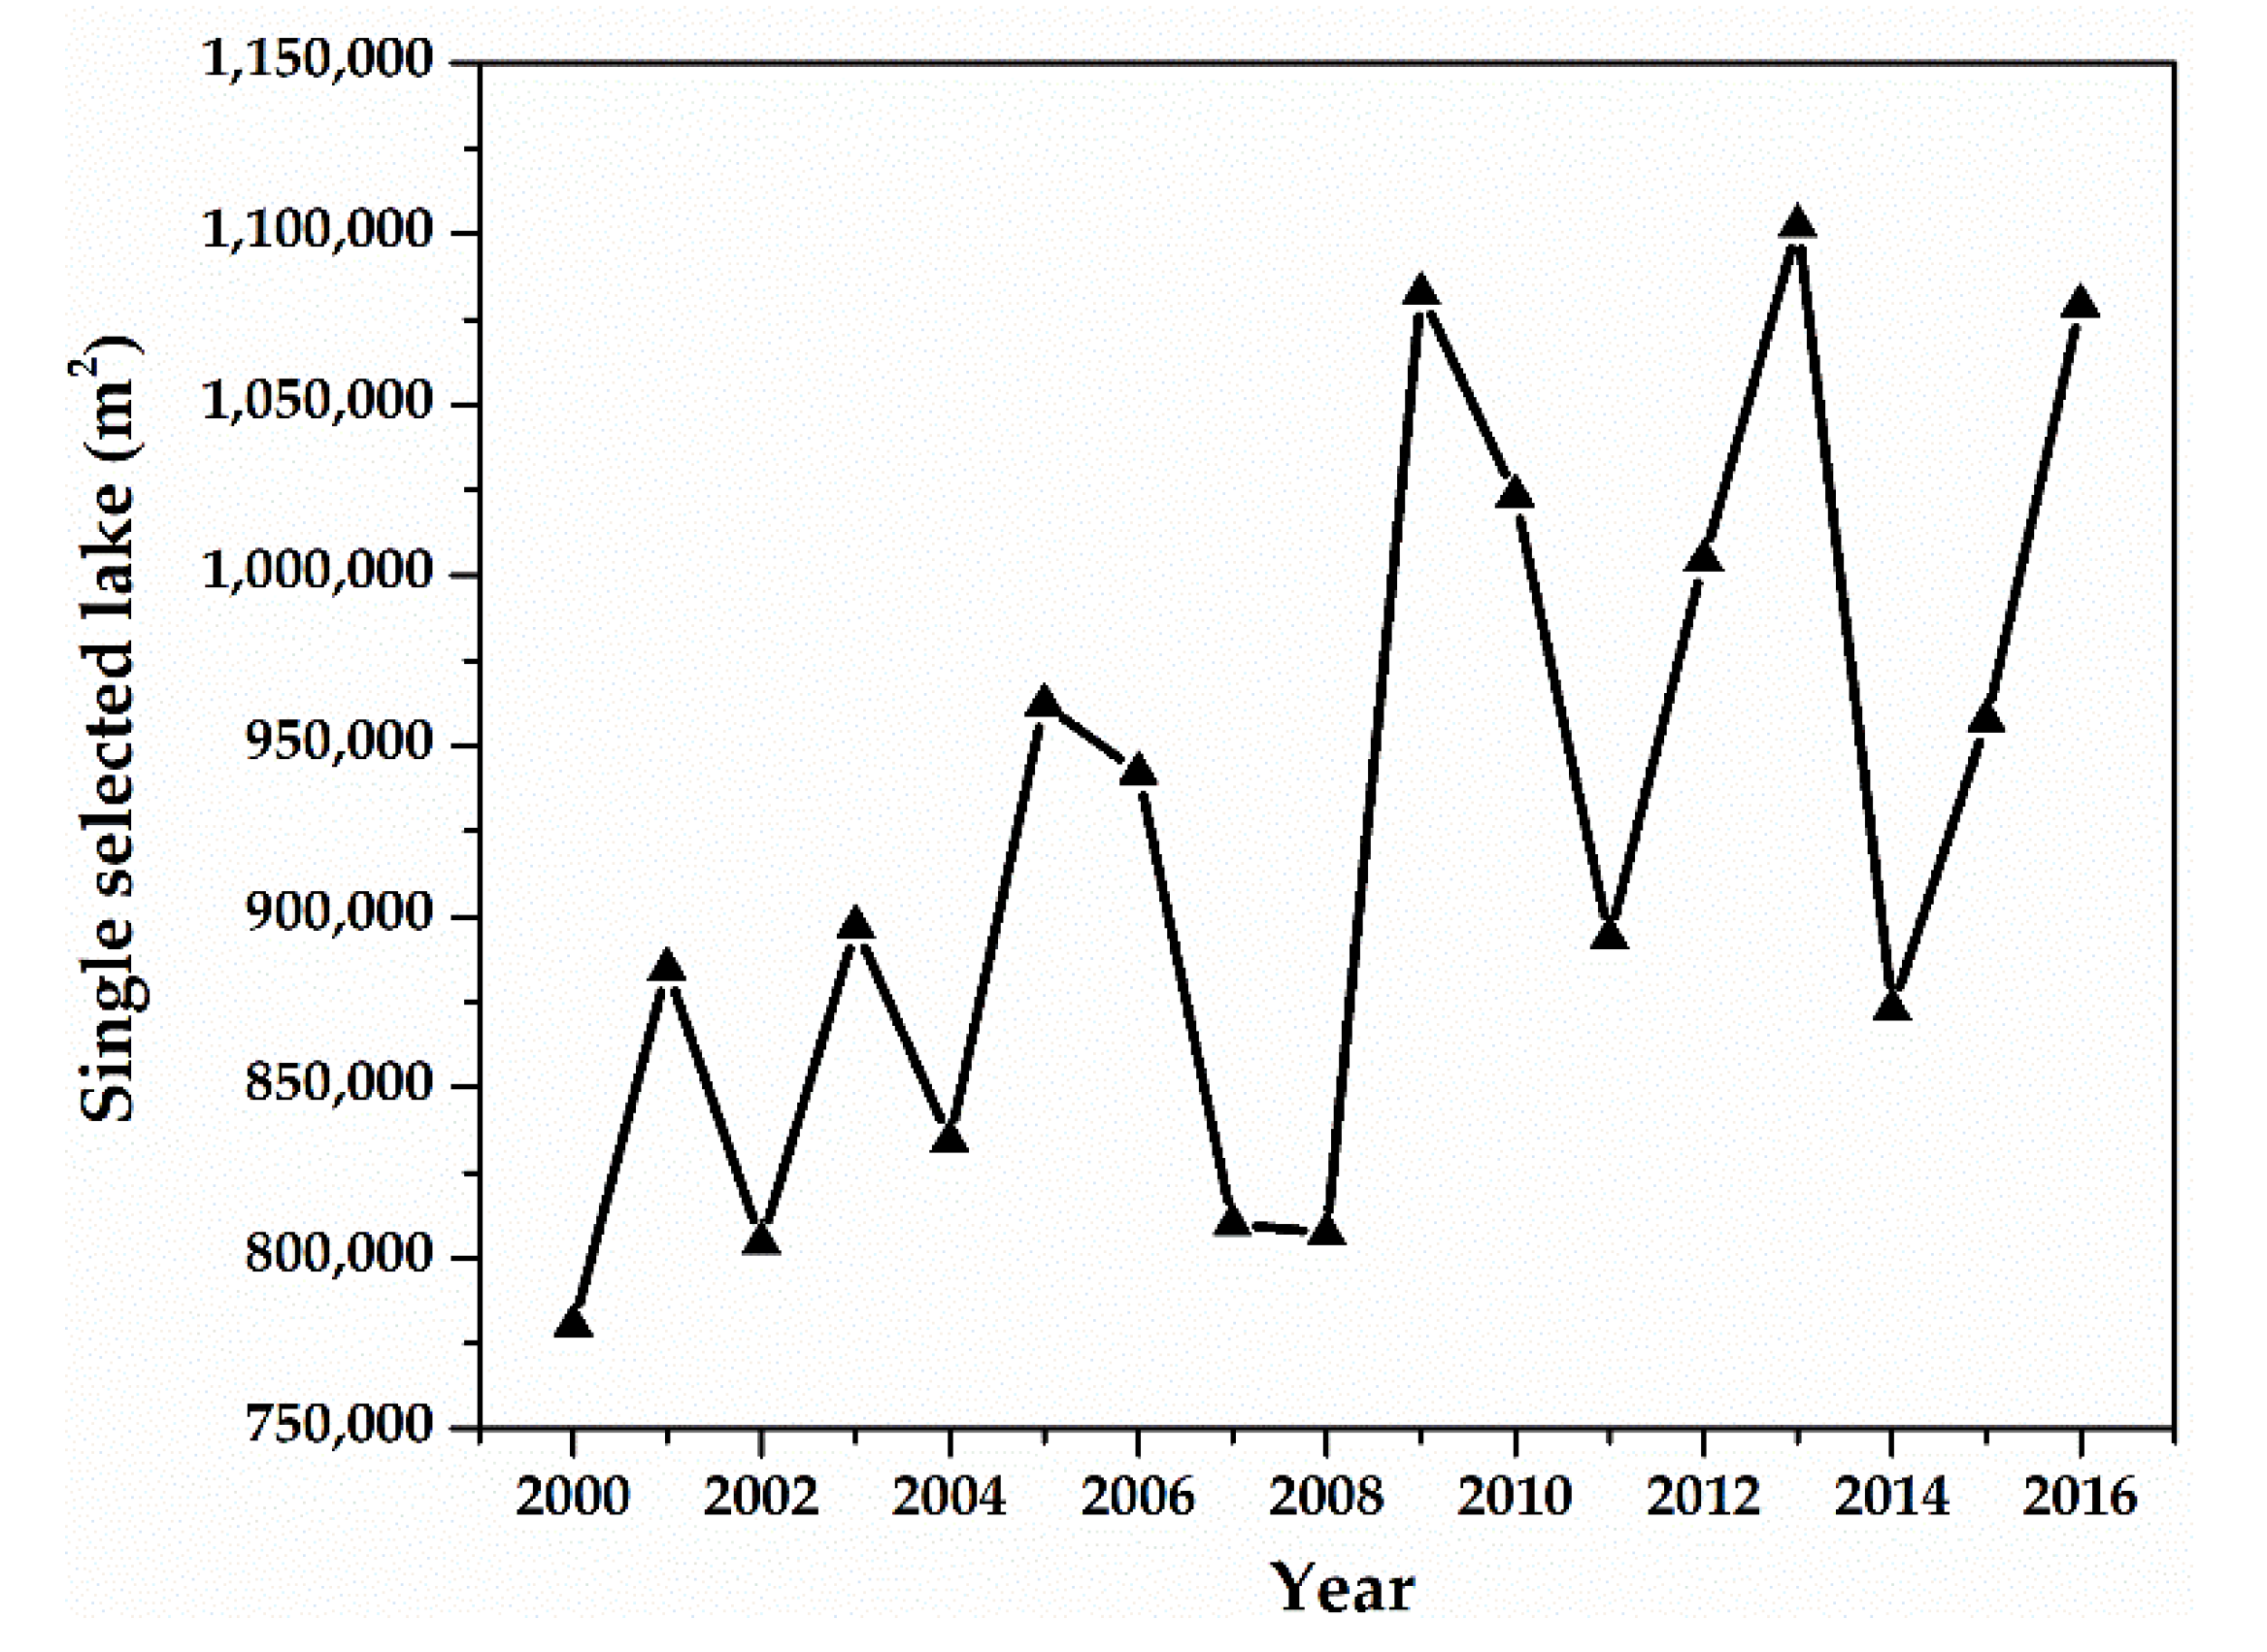
Although the total area of thermokarst lakes in this area increased erratically, it was unclear whether this change was representative of the single lake in the study area or only a small portion. Therefore, this work selected the largest lake located on 34°49′18.70″ N, 93°30′14.77″ E to explore the development of a single thermokarst lake, and the results are shown in Figure 10. From 2000 to 2016, the area of the single selected thermokarst lake increased from 780,300 m2 to 1,102,500 m2. Figure 10 shows that the maximum area of the single selected thermokarst lake was 1,102,500 m2, appearing in 2013, while the minimum area of the single selected lake was at 780,300 m2 in 2000. Compared with the total area of thermokarst lakes, the area of the single selected thermokarst lake changed more drastically from 2000 to 2016. The figures indicate that the area of the single selected thermokarst lake reached a maximum value almost once every three years, such as in 2001, 2003, 2005, 2009, 2013, and 2016. Furthermore, the trend of this curve shows that the area will continue to grow in the long term. Compared with the total area of thermokarst lake, the single selected thermokarst lake changed in size more frequently.
3.3. Influences of Meteorological Factors on the Total Area of Thermokarst Lakes in Beilu River Basin
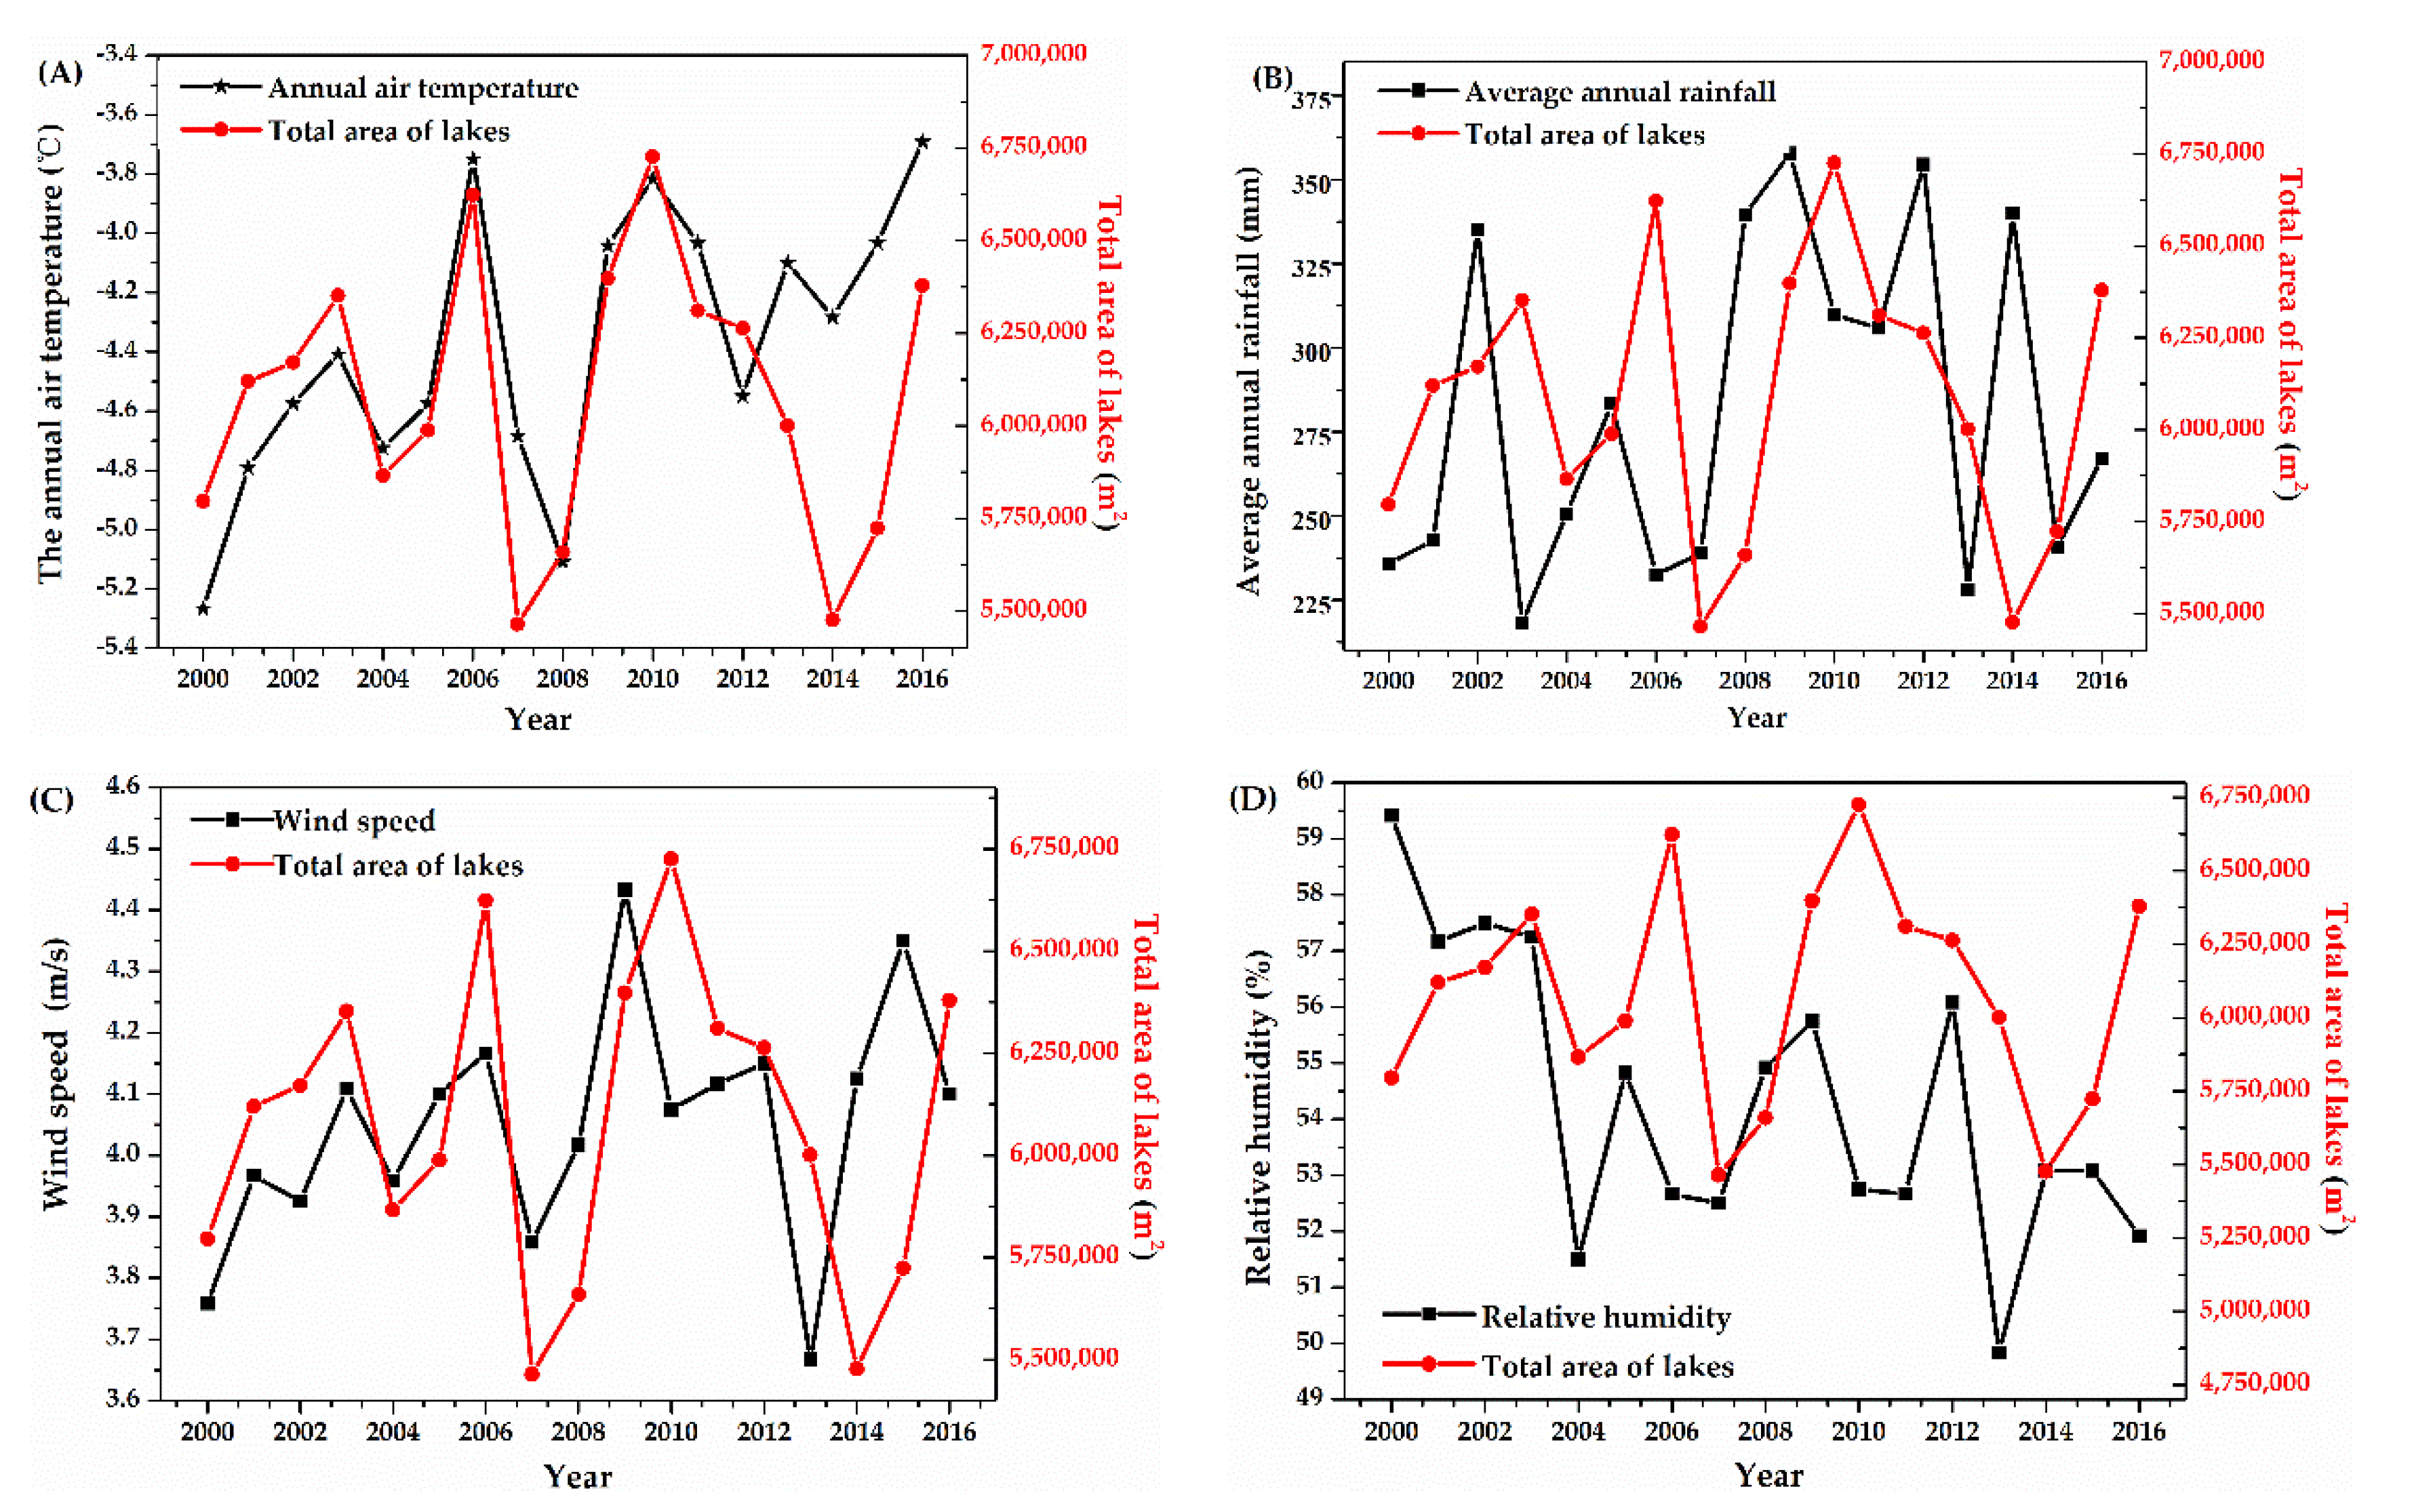
To analyze the reason for the increasing total area of thermokarst lakes in the Beilu River Basin, four meteorological factors—the average annual temperature, average annual precipitation, wind speed, and relative humidity—of the Beilu River Basin were chosen. The annual average trend for four meteorological factors and the total area of thermokarst lakes are shown in Figure 11. Figure 11 demonstrates that the four meteorological factors influenced the total area of thermokarst lakes in the Beilu River Basin, especially after 2000. The total area of thermokarst lakes’ change patterns correlate with meteorological factors, as the total area of thermokarst lakes increased with an increase in average annual temperature. Figure 11 also shows a time lag between the total area of thermokarst lakes and meteorological factors (i.e., average annual temperature and average annual precipitation). The reason may be attributed to the study area being located in a semi-arid region with little annual precipitation and high annual evapotranspiration due to the increasing average annual temperature [34,35].
To further analyze the relationships between the total area of thermokarst lakes and meteorological parameters, we used a statistical analysis to provide a reliable basis for the total area of thermokarst lakes by each meteorological parameter, the Pearson correlation coefficient, and a linear fitting equation. In addition, we also conducted multiple linear regression analysis on the four factors to observe the influence of comprehensive factors on the area of the thermokarst lakes. The Pearson correlation coefficient’s calculation processing is illustrated in the Supporting Information, and the results are presented in Table 1. Likewise, the result of the multiple linear regression analysis is shown in Table 2 and in the Supporting Information. The results showed that only air temperature and rainfall had significant positive correlations with the total area of thermokarst lakes in the Beilu River Basin (Pearson correlation coefficient > 0), and the other two meteorological parameters had negative correlations with the total area of thermokarst lakes (not significant). Among the four meteorological parameters, the average annual temperature had the strongest influence on the thermokarst lakes’ total area in the Beilu River Basin. The main reason for the negative correlation with the other parameters may be explained by the parameters positively correlating with evapotranspiration, leading to an acceleration in evaporation of the surface, which inhibited the total area’s growth of thermokarst lakes. Moreover, in the multiple linear regression analysis equation, the relative humidity and temperature affect the lake area in a similar proportion and are more significant among the four meteorological factors from Table 2. It may be the reason that temperature is an important cause of relative humidity changes. Around 2013, climatic factors and area changes showed opposite trends, but this was due to the extreme climate impacts that led to abnormal changes in the lake areas [36]. These findings suggest that the main driver of change in the total area of thermokarst lakes is the average annual temperature, which may be the key factor controlling the growth of thermokarst lakes annually.
3.4. Influences of Meteorological Factors on the Single Selected Thermokarst Lake in Beilu River Basin
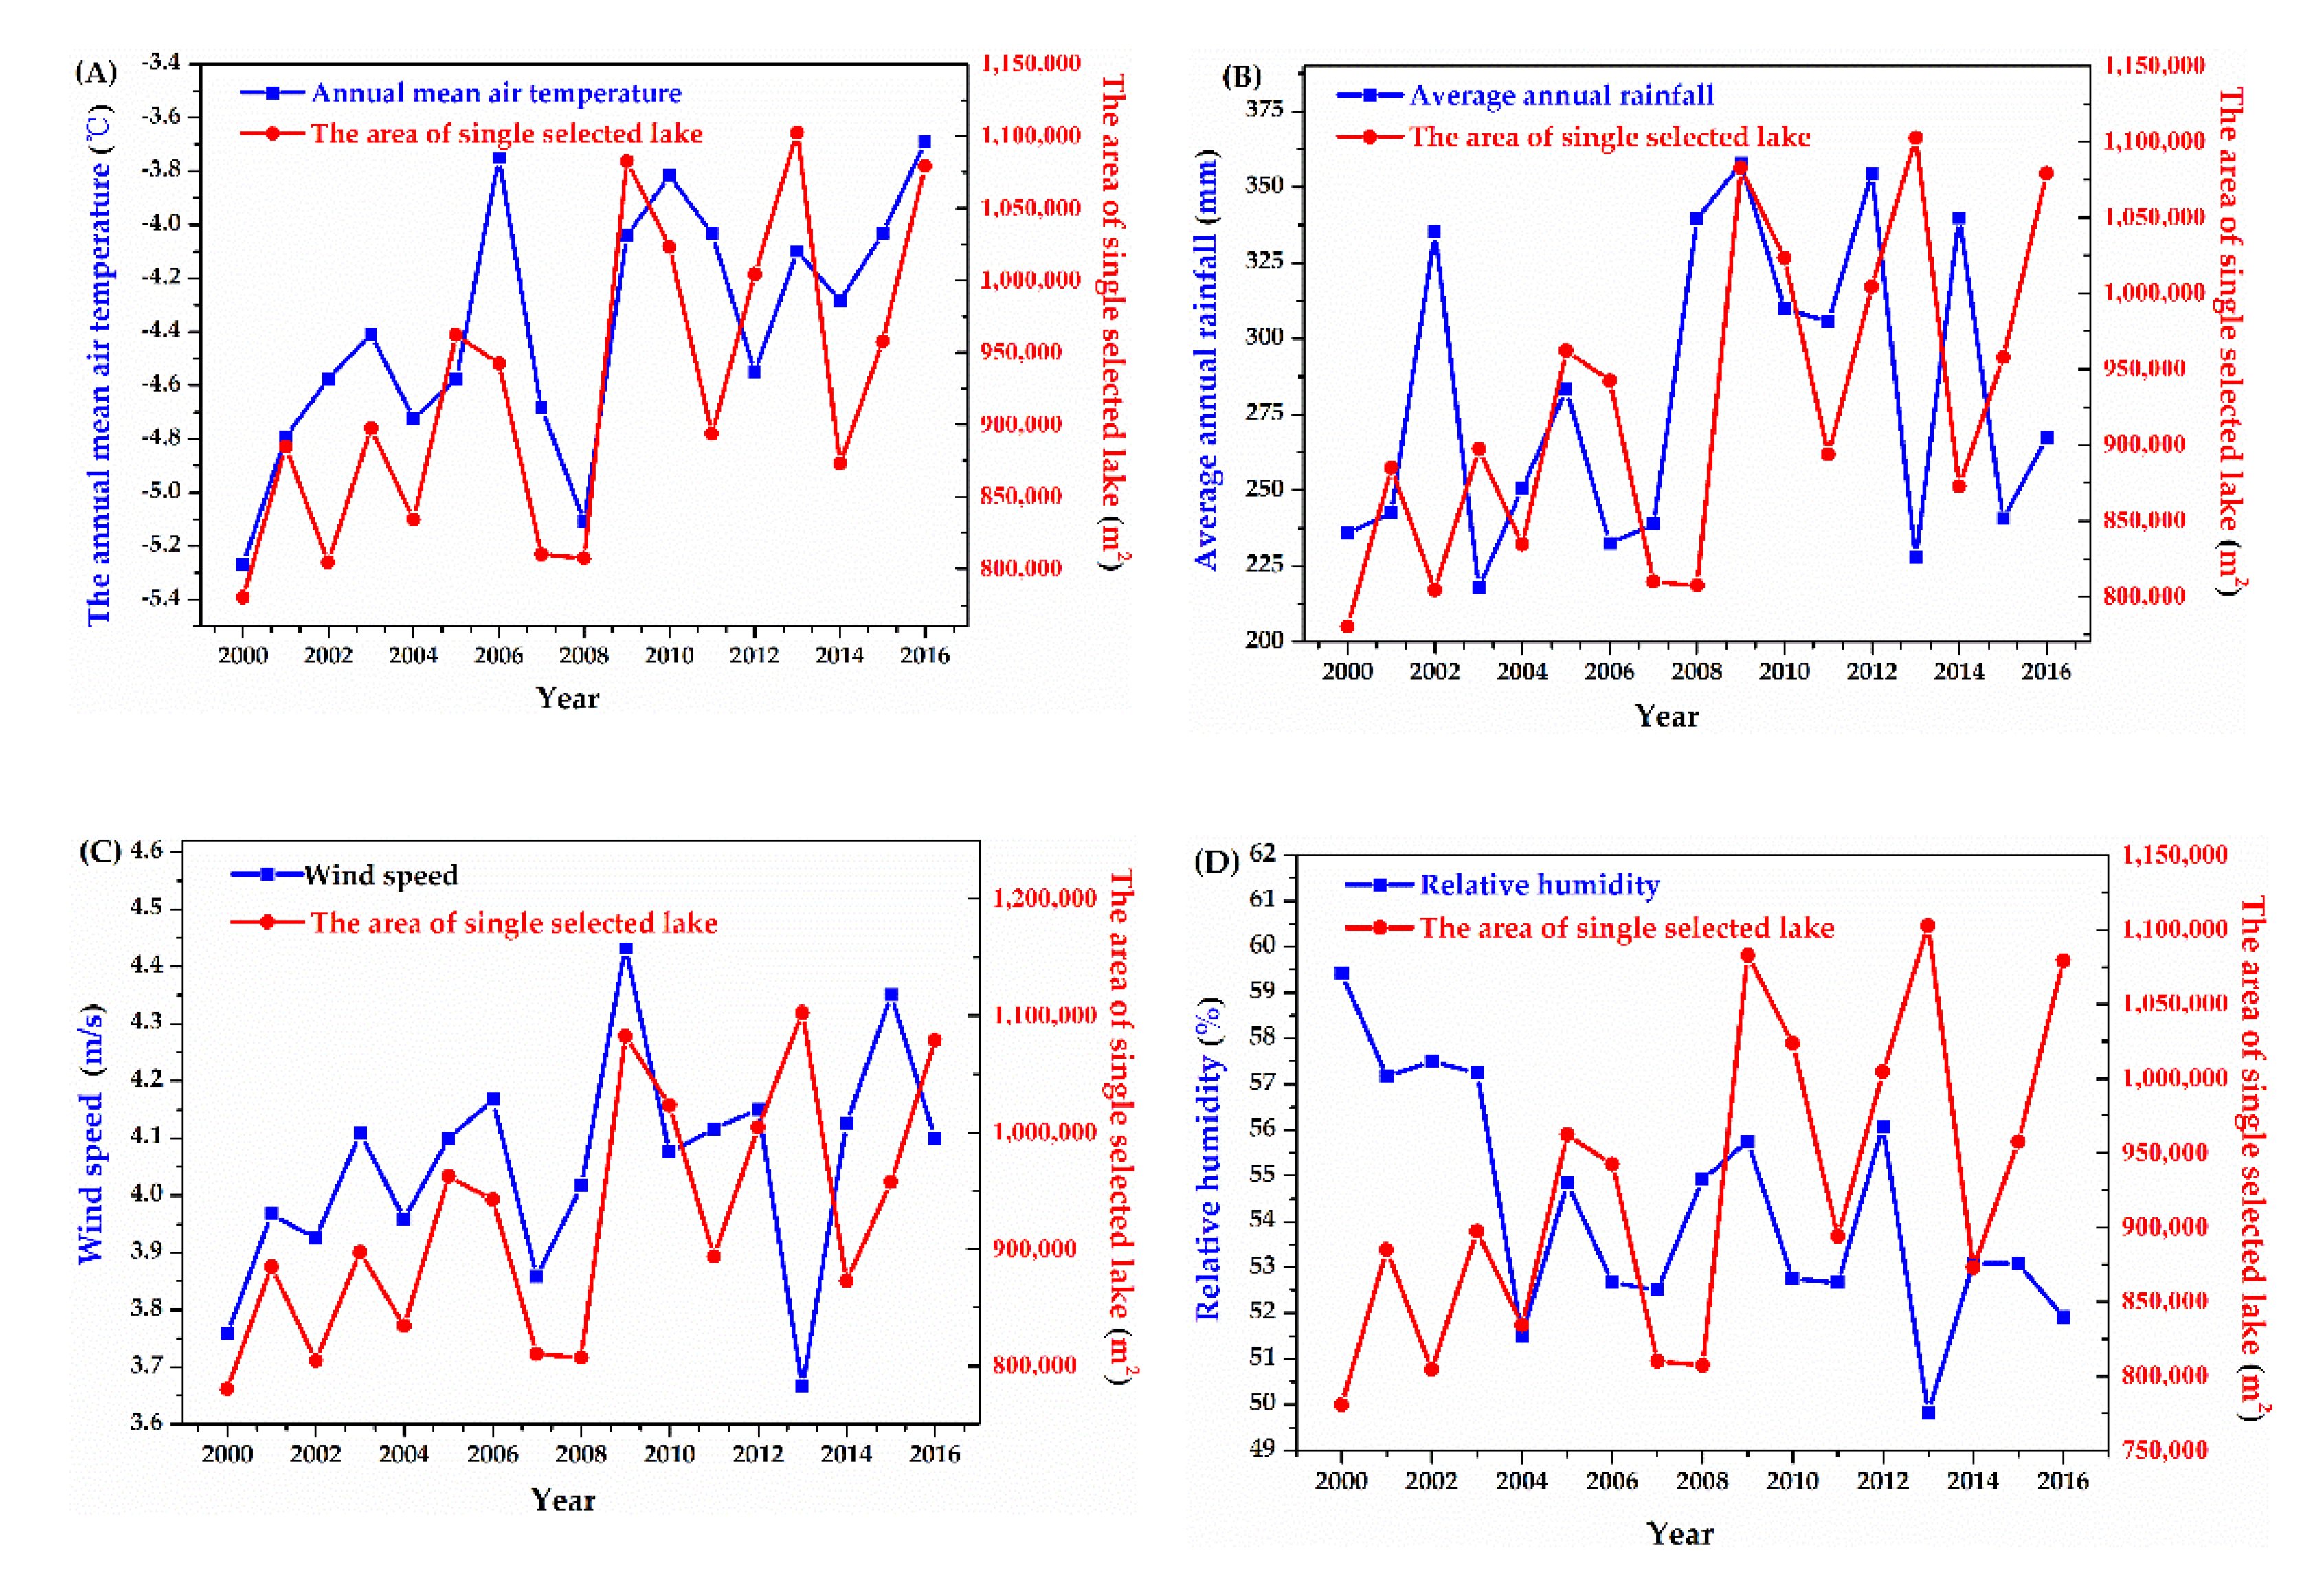
In order to determine the influence of meteorological factors on the single selected thermokarst lake, the relationship between the area of the selected thermokarst lake and the four meteorological factors were analyzed from 2000 to 2016, shown in Figure 12. Our results indicate that the four meteorological factors had apparent effects on the selected thermokarst lake’s area. The selected thermokarst lake area is small, making it more sensitive to climate change than the total area of thermokarst lakes. According to the annual curves of climate factors and area in Figure 12, the average annual temperature and wind speed had the greatest impacts on the surface area of the selected thermokarst lake, as confirmed by quantitative correlations (Table 3). The change patterns of the total area of thermokarst lakes correlate with the meteorological factors from 2000 to 2011. There is no time lag between the total area of thermokarst lakes and meteorological factors. The quantitative correlations between the selected thermokarst lake’s surface area and the four meteorological factors were analyzed using the Pearson correlation coefficient and linear fitting, shown in Table 4. Compared with the relationship between total area and the four meteorological factors, the selected thermokarst lake’s surface area was more closely related to wind speed and average annual temperature. Simultaneously, the surface area of the selected thermokarst lake responded to these four factors on time. From previous literature [37], the evapotranspiration of thermokarst lakes also increased with increasing wind speed and annual air temperatures; these two factors mainly influenced the area of the selected thermokarst lake. The Pearson correlation coefficient between the surface area of the selected thermokarst lake and wind speed was 0.864, and the Pearson correlation coefficient between the surface area of the selected thermokarst lake and the annual average temperature was 0.760.
These data indicate that the area of the single selected thermokarst lake was positively related to wind speed and annual average temperature. It was also inferred that the increase in the area of the single selected thermokarst lake mainly depended on the increasing thawing speed caused by high wind speed, and the thawing of ice-rich permafrost and massive ice near the selected thermokarst lake [38]. According to the literature [39], we inferred that wind speed greatly affects the freezing and thawing processes of the thermokarst lakes. The changes in wind speed make the newly appeared ice layer disappear, leading to the repeated freezing–thawing phenomena in the freezing process of the lakes. The same phenomenon can also be caused by a sudden rise in air temperature. At the same time, wind speed influences the thawing of ice-rich permafrost and massive ice near the selected thermokarst lake, leading to increasing water and surface areas. The increase in wind speed takes away a lot of heat from the surface of the lake, thereby accelerating the formation of ice on the water’s surface. Subsequently, as global warming increases temperatures, the surface ice melts and becomes part of the lake. Simultaneously, the massive ice in the permafrost starts to melt due to the increase in temperature. Therefore, the thawing of ice-rich permafrost and massive ice are the main sources of water for the thermokarst lakes. Furthermore, from the results of the multiple linear regression, the fitting coefficients of air temperature and wind speed were 177,405 and −40,383.94, respectively. These values are much greater than the fitting coefficients of both rainfall and relative humidity. They also demonstrate that air temperature and wind speed are the main factors causing the changes in the area of the single selected area.
4. Conclusions
Based on the ENVI 5.3 software, this work quantitatively exploited the relationship between the thermokarst lakes area and the meteorological factors by calculating the total area of typical thermokarst lakes and the area of a selected thermokarst lake in the Beilu River Basin from 2000 to 2016. The results illustrated that the total area of the thermokarst lakes and the single selected thermokarst lake increased variably in the long term. While the total area of typical thermokarst lakes increased from 5,464,800 m2 to 6,310,800 m2 between 2000 and 2016, the single selected thermokarst lake area increased from 780,300 m2 to 1,102,500 m2 during this period. Furthermore, by analyzing meteorological factors driving change in the thermokarst lakes area, including average annual temperature, average annual precipitation, wind speed, and relative humidity, we found that the influence of the four meteorological factors on the total area of typical thermokarst lakes is different from the effect of these factors on the selected thermokarst lake: while the total area of specific thermokarst lakes exhibited a time lag in their response to the four factors, the surface area of the selected thermokarst lake responded to these factors more quickly. Air temperature and wind speed might be important drivers for the change patterns in the total thermokarst lake area and the single thermokarst lake. Moreover, this work further verified the validity of the correlation analysis by using a multiple linear regression analysis, and the results proved to be valid within the statistical interval. At the same time, it could infer the trend of variation on thermokarst lakes due to the linear fitting equation between area and significant meteorological factors. Based on this relationship, we can easily predict the change patterns in the total thermokarst lake area and prevent geological disasters caused by this change through real-time monitoring of temperature and wind speed. These data provide insight into the factors that influence thermokarst lakes and may help predict future trends.
Supplementary Materials
Supporting information is available from the authors. The following are available online at https://0-www-mdpi-com.brum.beds.ac.uk/article/10.3390/w13111605/s1, Figures S1–S48.
Author Contributions
Z.N. and X.L. designed research; Z.N. performed the experiments, analyzed the data, and wrote the paper; G.H. reviewed the manuscript. All authors have read and agreed to the published version of the manuscript.
Funding
This work was supported by the Programs of the National Natural Science Foundation of China (41774025, 41731066), Special Fund for Technological Innovation Guidance of Shaanxi Province (2018XNCGG05), and the Fundamental Research Funds for the Central Universities (Program No. 300102290202).
Institutional Review Board Statement
Not applicable.
Informed Consent Statement
Not applicable.
Data Availability Statement
https://www.usgs.gov/ (accessed on 6 June 2021), https://www.weatherhq.co.uk/weather-station/wudaoliang (accessed on 6 June 2021).
Conflicts of Interest
The authors declare no conflict of interest.
References
- Ling, F.; Pan, F. Quantifying Impacts of Mean Annual Lake Bottom Temperature on Talik Development and Permafrost Degradation below Expanding Thermokarst Lakes on the Qinghai–Tibet Plateau. Water 2019, 11, 706. [Google Scholar] [CrossRef] [Green Version]
- Lin, Z.; Niu, F.; Liu, H.; Lu, J. Hydrothermal processes of Alpine Tundra Lakes, Beiluhe Basin, Qinghai-Tibet Plateau. Cold Reg. Sci. Technol. 2011, 65, 446–455. [Google Scholar] [CrossRef]
- Zou, D.; Zhao, L.; Sheng, Y.; Chen, J.; Hu, G.; Wu, T.; Wu, J.; Xie, C.; Wu, X.; Pang, Q.; et al. A new map of permafrost distribution on the Tibetan Plateau. Cryosphere 2017, 11, 2527–2542. [Google Scholar] [CrossRef] [Green Version]
- Grosse, G.; Jones, B.; Arp, C. 8.21 Thermokarst Lakes, Drainage, and Drained Basins. In Treatise on Geomorphology; Elsevier: Amsterdam, The Netherlands, 2013; pp. 325–353. ISBN 978-0-08-088522-3. [Google Scholar]
- Cheng, G.; Wu, T. Responses of permafrost to climate change and their environmental significance, Qinghai-Tibet Plateau. J. Geophys. Res. 2007, 112. [Google Scholar] [CrossRef] [Green Version]
- Karlsson, J.M.; Lyon, S.W.; Destouni, G. Thermokarst lake, hydrological flow and water balance indicators of permafrost change in Western Siberia. J. Hydrol. 2012, 464–465, 459–466. [Google Scholar] [CrossRef]
- Arp, C.D.; Jones, B.M.; Lu, Z.; Whitman, M.S. Shifting balance of thermokarst lake ice regimes across the Arctic Coastal Plain of northern Alaska. Geophys. Res. Lett. 2012, 39. [Google Scholar] [CrossRef] [Green Version]
- Huang, W.; Li, R.; Han, H.; Niu, F.; Wu, Q.; Wang, W. Ice processes and surface ablation in a shallow thermokarst lake in the central Qinghai–Tibetan Plateau. Ann. Glaciol. 2016, 57, 20–28. [Google Scholar] [CrossRef] [Green Version]
- Marsh, P.; Russell, M.; Pohl, S.; Haywood, H.; Onclin, C. Changes in thaw lake drainage in the Western Canadian Arctic from 1950 to 2000. Hydrol. Process. 2009, 23, 145–158. [Google Scholar] [CrossRef]
- Yoshikawa, K.; Hinzman, L.D. Shrinking thermokarst ponds and groundwater dynamics in discontinuous permafrost near council, Alaska. Permafrost Periglac. Process 2003, 14, 151–160. [Google Scholar] [CrossRef]
- Serikova, S.; Pokrovsky, O.S.; Laudon, H.; Krickov, I.V.; Lim, A.G.; Manasypov, R.M.; Karlsson, J. High carbon emissions from thermokarst lakes of Western Siberia. Nat. Commun. 2019, 10, 1552. [Google Scholar] [CrossRef] [PubMed] [Green Version]
- Wik, M.; Varner, R.K.; Anthony, K.W.; MacIntyre, S.; Bastviken, D. Climate-sensitive northern lakes and ponds are critical components of methane release. Nat. Geosci. 2016, 9, 99–105. [Google Scholar] [CrossRef]
- Laurion, I.; Vincent, W.F.; MacIntyre, S.; Retamal, L.; Dupont, C.; Francus, P.; Pienitz, R. Variability in greenhouse gas emissions from permafrost thaw ponds. Limnol. Oceanogr. 2010, 55, 115–133. [Google Scholar] [CrossRef] [Green Version]
- Morison, M.Q.; Volik, O.; Hall, R.I.; Wiklund, J.A.; Macrae, M.L.; Petrone, R.M. Effects of shoreline permafrost thaw on nutrient dynamics and diatom ecology in a subarctic tundra pond. J. Paleolimnol. 2019, 62, 151–163. [Google Scholar] [CrossRef]
- Plug, L.J.; Walls, C.; Scott, B.M. Tundra lake changes from 1978 to 2001 on the Tuktoyaktuk Peninsula, western Canadian Arctic. Geophys. Res. Lett. 2008, 35. [Google Scholar] [CrossRef]
- Riordan, B.; Verbyla, D.; McGuire, A.D. Shrinking ponds in subarctic Alaska based on 1950–2002 remotely sensed images. J. Geophys. Res. 2006, 111. [Google Scholar] [CrossRef]
- Luo, J.; Niu, F.; Lin, Z.; Liu, M.; Yin, G. Thermokarst lake changes between 1969 and 2010 in the Beilu River Basin, Qinghai–Tibet Plateau, China. Sci. Bull. 2015, 60, 556–564. [Google Scholar] [CrossRef] [Green Version]
- Luo, J.; Niu, F.; Lin, Z.; Liu, M.; Yin, G. Recent acceleration of thaw slumping in permafrost terrain of Qinghai-Tibet Plateau: An example from the Beiluhe Region. Geomorphology 2019, 341, 79–85. [Google Scholar] [CrossRef]
- Luo, J.; Lin, Z.; Yin, G.; Niu, F.; Liu, M.; Gao, Z.; Fan, X. The ground thermal regime and permafrost warming at two upland, sloping, and undisturbed sites, Kunlun Mountain, Qinghai-Tibet Plateau. Cold Reg. Sci. Technol. 2019, 167, 102862. [Google Scholar] [CrossRef]
- Crossing the Line: China’s Railway to Lhasa, Tibet. CROSSING THE LINE 76. Available online: https://www.savetibet.org/wp-content/uploads/2013/01/2003RailwayReport.pdf (accessed on 6 June 2021).
- Gao, Z.; Niu, F.; Lin, Z. Effects of permafrost degradation on thermokarst lake hydrochemistry in the Qinghai-Tibet Plateau, China. Hydrol. Process. 2020, 34, 5659–5673. [Google Scholar] [CrossRef]
- Lin, Z.; Luo, J.; Niu, F. Development of a thermokarst lake and its thermal effects on permafrost over nearly 10 yr in the Beiluhe Basin, Qinghai-Tibet Plateau. Geosphere 2016, 12, 632–643. [Google Scholar] [CrossRef] [Green Version]
- Niu, F.; Lin, Z.; Liu, H.; Lu, J. Characteristics of thermokarst lakes and their influence on permafrost in Qinghai–Tibet Plateau. Geomorphology 2011, 132, 222–233. [Google Scholar] [CrossRef]
- Olthof, I.; Fraser, R.H.; Schmitt, C. Landsat-Based Mapping of Thermokarst Lake Dynamics on the Tuktoyaktuk Coastal Plain, Northwest Territories, Canada since 1985. Remote Sens. Environ. 2015, 168, 194–204. [Google Scholar] [CrossRef]
- Regmi, P.; Grosse, G.; Jones, M.C.; Jones, B.M.; Anthony, K.W. Characterizing Post-Drainage Succession in Thermokarst Lake Basins on the Seward Peninsula, Alaska with TerraSAR-X Backscatter and Landsat-Based NDVI Data. Remote Sens. 2012, 4, 3741–3765. [Google Scholar] [CrossRef] [Green Version]
- Xu, H. Modification of normalised difference water index (NDWI) to enhance open water features in remotely sensed imagery. Int. J. Remote Sens. 2006, 27, 3025–3033. [Google Scholar] [CrossRef]
- Paolini, L.; Grings, F.; Sobrino, J.A.; Jiménez Muñoz, J.C.; Karszenbaum, H. Radiometric correction effects in Landsat multi-date/multi-sensor change detection studies. Int. J. Remote Sens. 2006, 27, 685–704. [Google Scholar] [CrossRef]
- Pacifici, F.; Longbotham, N.; Emery, W.J. The Importance of Physical Quantities for the Analysis of Multitemporal and Multiangular Optical Very High Spatial Resolution Images. IEEE Trans. Geosci. Remote Sens. 2014, 52, 6241–6256. [Google Scholar] [CrossRef]
- Szabó, S.; Gácsi, Z.; Balázs, B. Specific Features of NDVI, NDWI and MNDWI as Reflected in Land Cover Categories. Landsc. Environ. 2016, 10, 194–202. [Google Scholar] [CrossRef]
- Zhang, Y.; Wang, X.; Li, C.; Cai, Y.; Yang, Z.; Yi, Y. NDVI dynamics under changing meteorological factors in a shallow lake in future metropolitan, semi-arid area in North China. Sci. Rep. 2018, 8, 15971. [Google Scholar] [CrossRef] [PubMed] [Green Version]
- Vonk, J.E.; Tank, S.E.; Bowden, W.B.; Laurion, I.; Vincent, W.F.; Alekseychik, P.; Amyot, M.; Billet, M.F.; Canário, J.; Cory, R.M.; et al. Reviews and syntheses: Effects of permafrost thaw on Arctic aquatic ecosystems. Biogeosciences 2015, 12, 7129–7167. [Google Scholar] [CrossRef] [Green Version]
- Manasypov, R.M.; Pokrovsky, O.S.; Kirpotin, S.N.; Shirokova, L.S. Thermokarst lake waters across the permafrost zones of western Siberia. Cryosphere 2014, 8, 1177–1193. [Google Scholar] [CrossRef] [Green Version]
- Jones, B.M.; Grosse, G.; Arp, C.D.; Jones, M.C.; Walter Anthony, K.M.; Romanovsky, V.E. Modern thermokarst lake dynamics in the continuous permafrost zone, northern Seward Peninsula, Alaska. J. Geophys. Res. 2011, 116. [Google Scholar] [CrossRef]
- Chen, Z.; Wang, W.; Fu, J. Vegetation response to precipitation anomalies under different climatic and biogeographical conditions in China. Sci. Rep. 2020, 10, 830. [Google Scholar] [CrossRef] [PubMed] [Green Version]
- Chou, C.; Lan, C.-W. Changes in the Annual Range of Precipitation under Global Warming. J. Clim. 2012, 25, 222–235. [Google Scholar] [CrossRef] [Green Version]
- Nitzbon, J.; Westermann, S.; Langer, M.; Martin, L.C.P.; Strauss, J.; Laboor, S.; Boike, J. Fast Response of Cold Ice-Rich Permafrost in Northeast Siberia to a Warming Climate. Nat. Commun. 2020, 11, 2201. [Google Scholar] [CrossRef] [PubMed]
- Chen, M.; Rowland, J.C.; Wilson, C.J.; Altmann, G.L.; Brumby, S.P. Temporal and spatial pattern of thermokarst lake area changes at Yukon Flats, Alaska. Hydrol. Process 2014, 28, 837–852. [Google Scholar] [CrossRef]
- Sannel, A.B.K.; Kuhry, P. Warming-induced destabilisation of peat plateau/thermokarst lake complexes. J. Geophys. Res. 2011, 116. [Google Scholar] [CrossRef]
- Qi, M.; Liu, S.; Yao, X.; Xie, F.; Gao, Y. Monitoring the Ice Phenology of Qinghai Lake from 1980 to 2018 Using Multisource Remote Sensing Data and Google Earth Engine. Remote Sens. 2020, 12, 2217. [Google Scholar] [CrossRef]
Figure 1.
Map of the study area in the Beilu River Basin, QTP, China.

Figure 2.
Work process flowchart.

Figure 3.
An image of the study area in 2015 after radiometric correction.

Figure 4.
An image of the study area in 2015 after (FLAASH) atmospheric correction.

Figure 5.
An image of Study Area in 2015.

Figure 6.
MNDWI image of the study area in 2015.

Figure 7.
Distribution image of the selected thermokarst lake by ROI.

Figure 8.
Histogram of all thermokarst lakes in 2015.

Figure 9.
The changes in the total area of thermokarst lakes in the Beilu River Basin, from 2000 to 2016.
Figure 9.
The changes in the total area of thermokarst lakes in the Beilu River Basin, from 2000 to 2016.

Figure 10.
The area changes of the selected thermokarst lake in Beilu River Basin, from 2000 to 2016.
Figure 10.
The area changes of the selected thermokarst lake in Beilu River Basin, from 2000 to 2016.

Figure 11.
The relationship between the total area of thermokarst lakes and meteorological parameters in the Beilu River Basin: (A) total lake area and annual air temperature; (B) total lake area and average annual rainfall; (C) total area of lakes and wind speed; (D) total area of lakes and relative humidity.

Figure 12.
The relationship between the area of selected thermokarst lake and meteorological parameters in the Beilu River Basin ((A): selected lake area and average annual temperature; (B): selected lake area and average annual precipitation; (C): selected lake area and wind speed; (D): selected lake area and relative humidity).


Table 1.
General Information about the thermokarst lake in the study area from 2000 to 2016.
| Thermokarst Lake Information | Remote Sensing Data |
|---|---|
| number of thermokarst lakes | 265 |
| the minimum area of the single lake | 900 m2 |
| the maximum area of the single lake | 922,500 m2 |
| the total area of all lakes | 5,767,135.3 m2 |
| the average area of a single lake | 21,762.774 m2 |
Table 2.
Fitting information on the total area and different meteorological factors.
| Relationship | Pearson Correlation Coefficient | Linear Fitting Equation |
|---|---|---|
| Total lake area—average annual temperature | 0.717 | y = 664,701.4x + 8,892,580 |
| Total lake area—precipitation | 0.351 | y = 3649.207x + 4,938,302 |
| Total lake area—windspeed | −0.360 | y = −732,818.2x + 8,947,587 |
| Total lake area—relative humidity | −0.272 | y = −54,143.03x + 8,866,460 |
| Total lake area—meteorological factors | 0.482 | y = 913,331.1x1 + 476.7300x2 − 534,324.8x3 + 99,637.97x4 + 6,698,135 * |
* x1, x2, x3, and x4 represent annual air temperature, rainfall, windspeed, and relative humidity, respectively.
Table 3.
Fitting information of single selected lake area and different meteorological factors*.
| Relationship | Pearson Correlation Coefficient * | The Linear Fitting Equation * |
|---|---|---|
| The single selected lake area-average annual temperature | 0.760 | y = 147,847.4x + 11,556,090 |
| The single selected lake area-average annual precipitation | 0.330 | y = 639.5354x + 715,008.6 |
| The single selected lake area-windspeed | 0.864 | y = 475,825.9x − 1,028,920 |
| The single selected lake area-relative humidity | −0.222 | y = −8308.593x + 1,349,770 |
| The single selected lake area-meteorological factors | 0.400 | y = 177,405x1 + 227.9100x2 − 40,383.94x3 + 984.9100x4 + 1,748,645 ** |
* These results were calculated based on the data from 2000 to 2011. ** x1, x2, x3, and x4 represent annual air temperature, rainfall, wind speed, and relative humidity, respectively.
Table 4.
Results of multiple linear regression analysis on the total area of lakes and area of the single selected lake.
Table 4.
Results of multiple linear regression analysis on the total area of lakes and area of the single selected lake.
| Relationship | Value | Standard Error | t-value | Prob > |t| |
|---|---|---|---|---|
| total area of lake—rainfall | 476.73 | 1520.06 | 0.31 | 0.76 |
| total area of lake—air temperature | 913,331.2 | 230,454 | 3.96 | 0 |
| total area of lake—windspeed | −534,325 | 492,603.3 | −1.0847 | 0.30 |
| total area of lake—relative humidity | 99,637.97 | 35,713.59 | 2.78992 | 0.01635 |
| Adjust R-Square = 0.48 | ||||
| area of single selected lake—rainfall | 227.9146 | 455.723 | 0.5 | 0.63 |
| area of single selected lake—air temperature | 177,405 | 69,091.69 | 2.57 | 0.02 |
| area of single selected lake—windspeed | −40,383.9 | 147,685.8 | −0.27 | 0.79 |
| area of single selected lake—relative humidity | 984.91 | 10,707.18 | 0.09 | 0.93 |
| Adjust R-Square = 0.40 | ||||
Publisher’s Note: MDPI stays neutral with regard to jurisdictional claims in published maps and institutional affiliations. |
© 2021 by the authors. Licensee MDPI, Basel, Switzerland. This article is an open access article distributed under the terms and conditions of the Creative Commons Attribution (CC BY) license (https://creativecommons.org/licenses/by/4.0/).
Share and Cite
MDPI and ACS Style
Ni, Z.; Lü, X.; Huang, G. Impact of Meteorological Factors on Thermokarst Lake Changes in the Beilu River Basin, Qinghai-Tibet Plateau, China (2000–2016). Water 2021, 13, 1605. https://0-doi-org.brum.beds.ac.uk/10.3390/w13111605
AMA Style
Ni Z, Lü X, Huang G. Impact of Meteorological Factors on Thermokarst Lake Changes in the Beilu River Basin, Qinghai-Tibet Plateau, China (2000–2016). Water. 2021; 13(11):1605. https://0-doi-org.brum.beds.ac.uk/10.3390/w13111605
Chicago/Turabian StyleNi, Zixuan, Xiangfei Lü, and Guanwen Huang. 2021. "Impact of Meteorological Factors on Thermokarst Lake Changes in the Beilu River Basin, Qinghai-Tibet Plateau, China (2000–2016)" Water 13, no. 11: 1605. https://0-doi-org.brum.beds.ac.uk/10.3390/w13111605
Note that from the first issue of 2016, this journal uses article numbers instead of page numbers. See further details here.