
Development and Application of a SWMM-Based Simulation Model for Municipal Scale Hydrologic Assessments


1
One Water Solution Institute (OWSI), Civil and Environmental Engineering, Walter Scott, Jr. College of Engineering, Colorado State University, Fort Collins, CO 80523, USA
2
Remington and Vernick Engineers, 3 Jocama Blvd Suite 300-400, Old Bridge, NJ 08857, USA
*
Author to whom correspondence should be addressed.
Water 2021, 13(12), 1644; https://0-doi-org.brum.beds.ac.uk/10.3390/w13121644
Submission received: 27 April 2021
/
Revised: 31 May 2021
/
Accepted: 3 June 2021
/
Published: 11 June 2021
(This article belongs to the Special Issue Hydrological Modeling in Urban Water Management)
Abstract
:There is growing interest for the installation of green stormwater infrastructure (GSI) to improve stormwater control, increase infiltration of stormwater, and improve receiving water body quality. Planning level tools are needed to inform municipal scale decisions on the type and extent of GSI to apply. Here, a modified methodology is developed for the EPA Storm Water Management Model (SWMM) to create SWMM for Low Impact Technology Evaluation (SWWM-LITE) that enables municipal scale assessment of stormwater control measure (SCM) performance with minimal input data requirements and low processing time. Hydrologic outputs of SWMM-LITE are compared to those for SWMM and the National Stormwater Calculator (SWC) to assess the performance of SWMM-LITE. Three scenarios including the baseline without SCMs and the installation of varying SCMs were investigated. Across the three scenarios, SWMM-LITE estimates of annual average hydrologic performance (runoff, infiltration, and evaporation) were within +/−0.1% of estimates from a rigorously developed SWMM model in the City of Fort Collins, CO, for an evaluation of 30 years of continuous simulation. Analysis conducted for 2 year (y), 10 y, and 100 y storm events showed less than +/−2.5% difference between SWMM and SWMM-LITE hydrologic outputs. SWC provided reasonable estimates of hydrologic parameters for the case study area, but was designed for site level analyses of performance of SCMs rather than on the municipal scale. A sensitivity analysis revealed that the most sensitive parameters were primarily consistent for the SWMM-LITE and the complete SWMM. SWMM-LITE has low input data requirements and processing time and can be applied for assessing the hydrologic performance of SCMs to inform planning level decisions.
1. Introduction
Increasing population growth in urban areas has resulted in extensive land use change and increased runoff with negative impacts to receiving water body quality [1]. Municipalities are more challenged than ever to meet the requirements from wet weather discharge permits [2]. Green stormwater infrastructure (GSI), sustainable drainage systems (SuDS), low impact development (LID), or the sponge city concept have been under development to achieve goals to mimic pre-development conditions by reducing runoff to stormwater and wastewater collection systems, increasing infiltration to replenish local groundwater, and removing pollutants from stormwater runoff [3,4,5,6]. While these GSI, SuDS, and LID may come at a higher cost than conventional gray stormwater infrastructure, they offer many social, environmental, and economic co-benefits [7]. The hydrologic and water quality improvements of these technologies at the watershed scale must be well understood to inform municipal planning level decision on the type and extent of the technologies that motivate widespread use for effective stormwater control [6,8,9].
EPA Storm Water Management Model (SWMM) is a widely used model for planning, research, and design for stormwater management [4]. SWMM includes the capability to provide continuous simulations of hydrologic performance of various types of stormwater control measures (SCMs), including both gray and green infrastructure (i.e., GSI, LID, and SuDS) [10,11]. While SWMM has shown tremendous value for stormwater design and modeling performance SCMs, it has been observed to be complex for untrained users [4]. In order to run a complete SWMM simulation, a full network of drainage pipes and conveyance is required. The inclusion of drainage networks (e.g., drainage catchments, pipes, roadways, and detention ponds) requires extensive inputs that are not readily available and are often considered sensitive data for sharing. Additionally, the inclusion of complex drainage systems increases the computational time required to route runoff through the drainage system, especially if a probabilistic analysis of several years of annual precipitation by using continuous simulation is conducted.
In order to overcome input data requirements and processing time associated with SWMM simulations, models and tools have been developed to inform site scale decisions on appropriate SCMs based on performance and cost. Examples include the CNT Green Values Calculator [12,13] and the National Stormwater Calculator (SWC) [14]. SWC includes an extensive set of SCMs and detailed estimates of hydrologic performance of those technologies, with applicability across the US [14]. SWC was designed for site-level design and decisions, with the maximum size of the study area in the desktop version being 50 acres and 12 acres in the online version (20 ha and 5 ha, respectively). While SWC has been successfully applied to inform site level SCM decisions [13], applicability to municipal scale studies has not been demonstrated.
The need to demonstrate the effectiveness of SCMs from lot scale to watershed and regional scale has been widely recognized [4,9,15]. Researchers have noted the need for further catchment-scale studies to better detect and quantify the effects of SCMs on flow regimes and thus guide approaches to stormwater management that protects receiving waters from hydrological alteration [6,8,9]. In addition, there is a lack of understanding about the aggregated effect of multiple SCMs at watershed scales as described by Bell et al. [16]. Further investigation is required to develop models to simulate various scenarios and combinations of SCMs and to develop user friendly decision support tools.
In order to conduct municipal scale analyses that include hydraulic networks for the continuous simulation of rainfall timeseries, SWMM can take on the order of hours to days to complete simulations. This is too computationally expensive for a planning level model that informs decisions on the type and extent of SCMs. Here, SWMM is modified to create SWMM for Low Impact Technology Evaluation (SWWM-LITE) that enables municipal scale assessment of SCM performance with minimal input data requirements and low processing time. The purpose of SWMM-LITE is to provide outputs useful to inform planning level decisions regarding the type and extent of SCM technologies to deploy. Planning level decision can be informed based on estimates of annual runoff, evaporation, and infiltration associated with varying scenarios of type and extent of SCMs.
SWMM-LITE uses a modified methodology for the development of SWMM that both simplifies the drainage subcatchments and removes hydraulic components of a drainage network that route or temporarily store water. Including the drainage network does not change the water balance (e.g., how much water becomes runoff, infiltrates, or evaporates) because volumes are generally conserved throughout the routing process [14]. Thus, hydrologic outputs relevant to planning level decisions (i.e., runoff, infiltration, and evaporation) may be estimated without the inclusion of the drainage network. After planning level decisions are made regarding the type and extent of SCMs to deploy using SWMM-LITE, other models such as complete SWMM simulations and SWC would be required to inform site level design and operation decisions.
The goal of this investigation is to demonstrate the capability of SWMM-LITE to estimate hydrologic parameters associated with storm events, e.g., runoff, evaporation, and infiltration in order to inform planning level decisions. Specifically, the objectives are to (1) modify the SWMM model to create SWMM-LITE that disaggregates rainfall-runoff simulations from complex subcatchments and hydraulic/conveyance/routing components; (2) to compare the performance of SWMM-LITE to complete SWMM and SWC outputs using robust statistical analysis. The intent of the comparison was to demonstrate the capability of SWMM-LITE for estimating the performance of SCMs at the municipal scale. The McClelland basin in Fort Collins, CO, is used as a case study to assess performance of SWMM-LITE.
2. Materials and Methods
SWMM, SWC, and SWMM-LITE models were developed for a study basin in Fort Collins, CO. A complete SWMM model including the drainage network was received from the City of Fort Collins. A SWC model was developed for the study area using the web-based version of the National Stormwater Calculator and a SWMM-LITE model was developed using the methodology described below. Each of the models were run with and without SCMs using continuous simulation for 30 years of precipitation. Uncertainty analysis was then conducted for the SWMM and SWMM-LITE to assess the performance of the models under varying parameter estimates and to identify the sensitivity of hydrologic outputs to parameter estimates.
2.1. SWMM-LITE Development
In SWMM, hydrologically delineated subcatchments are connected and drained to an outfall using a robust drainage network with several hydraulic elements (e.g., conduits, streets, and detention basins) to evaluate the hydrologic and hydraulic performance of the stormwater drainage system. A SWMM-LITE model is developed that does not include the hydraulic components of a complete SWMM model. Then, through modification and, in many cases, simplification, subcatchment boundaries that are user selected (typically based on selection of US census subunits) are applied. In many cases, subcatchment boundaries may be defaulted to political boundaries relevant to municipal scale analyses, instead of hydrologic boundaries. In a complete SWMM model this would impact the flood response but since SWMM-LITE is primarily considering hydrology, changing the boundaries has minimal effect. Conveyance systems and storage units are not included and, instead, dummy pipes, hydraulic links that do not attenuate or modify flow are used as the mechanism to route runoff hydrographs from the subcatchment to the outflow point. The inclusion of the drainage network does not change the water balance (e.g., how much water becomes runoff, infiltrates, or evaporates) because volumes are generally conserved throughout the routing process [14]. However, it does allow SWMM to provide more accurate estimates concerning the timing of water delivery as well as internal system flooding.
The hydraulic components that were removed, though necessary for estimating flooding conditions such as the magnitude and timing of peak flow rates throughout the system or locations of internal flooding within the system, are not relevant for the evaluation of SCMs. Many SCMs, especially GSI, are not designed to substantially influence large flooding events, but rather to increase infiltration and evaporation of smaller events and improve water quality. Since SWMM-LITE is designed to assess the performance of SCMs measured by impact to stormwater runoff, infiltration, and evaporation, conveyance system and storage may not be needed. The capacity of SWMM-LITE to adequately represent hydrologic parameters associated with SCMs is assessed in this research.
The SWMM-LITE model is developed by partitioning a study area into its pervious and impervious components. The pervious component is defined as the separate pervious area (SPA), which is assumed to be directly connected to the storm sewer system. The impervious component is defined as the directly connected impervious area (DCIA), which is also assumed to be directly connected to the storm sewer system and does not interact with the pervious area. SCMs can then be added based on a percentage of the DCIA which is routed to the technology. SCMs are modeled using the LID components within SWMM. Detention based SCMs that use storage units and links were not modeled using SWMM-LITE primarily because they require hydraulic structures and because they are primarily modeled to demonstrate the impact on peak flow rates and conveyance system capacity. Additionally, conveyance based SCMs (e.g., swales) were also not included due to the complexities of incorporating the hydraulic elements which can substantially impact performance of the SCMs.
2.2. Case Study Application
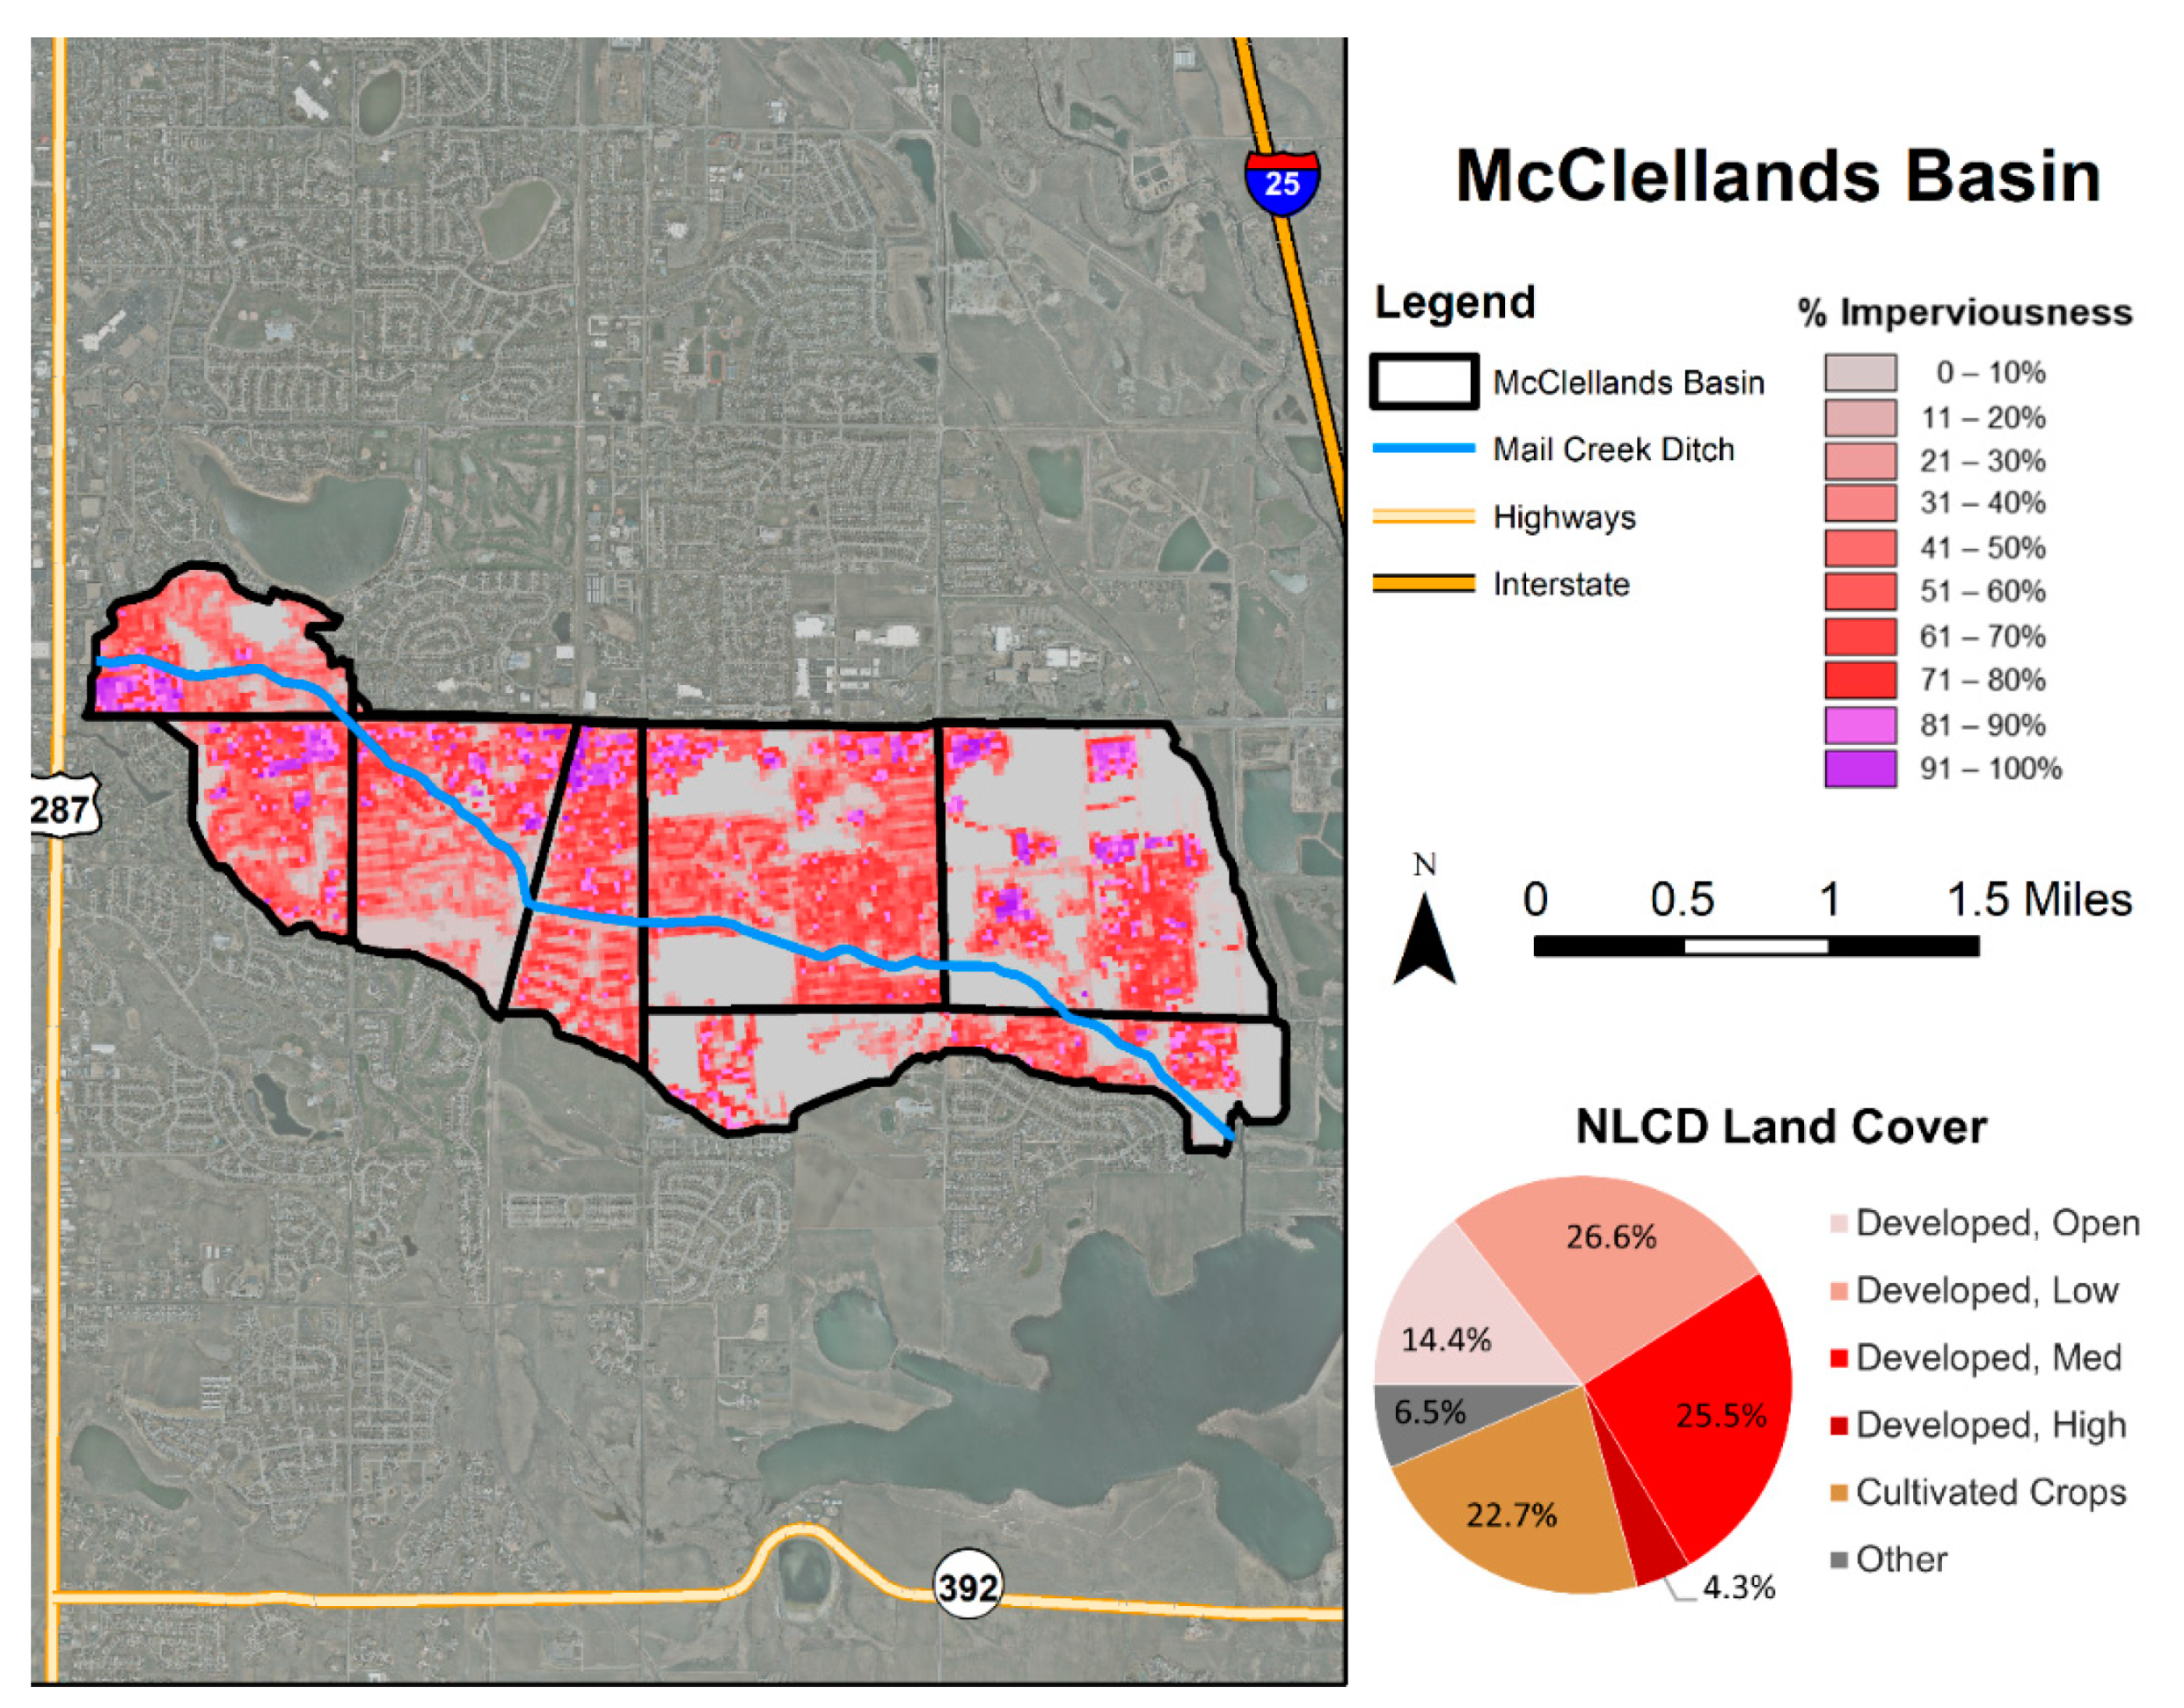
A case study was developed for the McClelland basin that is located in Fort Collins, Colorado (Figure 1). The McClelland basin is one of twelve primary drainage basins in Fort Collins, CO, and is 2153 acres (871 ha). The imperviousness and percent landcover were determined using the 2011 National Land Cover Dataset [17]. The average annual precipitation is 15.1 inches (384 mm) and primarily occurs in short and intense rainfall events. Soils are predominantly of the hydrologic soil group type C.
Timeseries of precipitation were collected from the Fort Collins weather station and contained hourly rainfall data from 1980 to 2009. Average daily evaporation was also collected from the weather station and summarized for each month. Precipitation and evaporation datasets were used to conduct continuous simulation to provide several years of annual hydrologic responses for each scenario and model. Results from the continuous simulation of the 30 years of rainfall data were used for comparison across scenarios and models. Annual and daily hydrological outputs of each of the models, including infiltration, evaporation, and runoff, were analyzed.
For the analysis, a complete SWMM model for the McClelland basin was obtained from the City of Fort Collins. The SWMM model was developed based on the detailed infrastructure characteristics that has been installed (e.g., inlets, manholes, pipes, natural channels, basins, pumps, etc.). The model contained 180 subcatchments, 86 storage nodes, and 260 link elements consisting of conduits, weirs, orifices, and outlets. Subcatchments were delineated using surface contours where other subcatchment parameters were defined on drainage criteria by the City. The SWMM model is used by the City of Fort Collins to evaluate the storm sewer system and for the determination of the effectiveness and impacts of SCMs for the area. Since this SWMM model was developed with a rigorous data set, outputs from SWMM-LITE can be compared to the model developed by the City of Fort Collins to assess performance of SWMM-LITE.
Three versions of a SWMM-LITE model were developed and evaluated for the McClelland study area without SCMs to assess the performance of SWMM-LITE using default parameters and data readily available in national datasets. Within all three SWMM-LITE models, the study area was represented as a single sub-basin with identical area and imperviousness consistent with the area weighted average of the developed SWMM model. Other input parameters varied between the three SWMM-LITE models (Table 1). SWMM-LITE Default Parameters (DP) used national datasets (e.g., National Land Cover Dataset (NLCD), and SSURGO Soil Survey), default SWMM parameters from the SWMM Manual, and local design criteria recommendations for the infiltration parameters. The second model, SWMM-LITE Limited Parameter Modification (LPM) matched values for Manning’s N, depression storage, and Zero Impervious to the complete SWMM model. Finally, the third model, SWMM-LITE Consistent Parameters (CP) also utilized an average of overland flow length and slope from the complete SWMM model and matched infiltration parameters relative to the complete SWMM model. This third and final model permits a comparison between a complete SWMM model and the simplified methodology that is proposed here. Any variation that arises between SWMM and SWMM-LITE CP may be attributed to differences that arise from model methodology and not from different parameters, such as depression storage.
After this analysis, three models were created or obtained for the McClelland basin to evaluate and compare the hydrologic response of the study area using each model and to assess performance of SWMM-LITE to estimate performance of SCMs at the municipal scale. The first model was the complete SWMM model for the McClelland basin obtained from the City of Fort Collins, the second, SWMM-LITE (CP), and the final model was the web-based version the SWC. The SWC model, like SWMM-LITE, evaluated the basin as a single sub-unit with similar imperviousness from the SWMM model (Table 2). Because SWC has a maximum study area size of 50 acres (4.05 ha), average characteristics of the 2153 acres (871 ha) McClelland basin area were applied (Table 2) to SWC for estimation of depth of runoff, infiltration, and volume. Depth estimates were then multiplied by the total area to estimate volumes. SWC limits input adjustment for several parameters (e.g., width and slope), causing different values to be assumed for the single subunit analysis between SWC and SWMM-LITE for these parameters (Table 2).
Each model evaluated the McClelland basin for three different scenarios. The first scenario considered was the Baseline Scenario. In this scenario, no stormwater control measures (SCMs) were added into the models. The Baseline Scenario allowed for the comparison between the three model types for basic hydrology without considering the effects of SCMs. The next scenario, Scenario 1, included one SCM technology type treating 10% of the impervious area in the study area. The final scenario, Scenario 2 simulated four types of SCMs including street planters, rain gardens, sand filters, and permeable pavement. The technologies were added to treat 40% of the total impervious area with each technology type treating 10% of the impervious area.
2.3. SCM Technology Deployment
Scenario 1 and Scenario 2 included an evaluation of the hydrologic outputs when including SCMs. In the SWC model, SCMs were defined using the LID control section of the model. Specifications for SCM design parameters were the same across all models. Scenario 1 treated 10% of the impervious area using medium rain gardens, defined as vegetated areas with 12 inches (30.48 cm) of ponding depth and containing 18 inches (45.72 cm) of designed filter media to provide high infiltration rates and remove pollutants before exfiltrating water into the native soils. Scenario 2 simulated treating 40% of the impervious area with four SCMs including small rain gardens or street planters (rain gardens with 6 inches (15.24 cm) ponding depth), medium rain gardens (12 inches (30.48 cm) ponding depth), sand filters, and permeable interlocking concrete pavers. Sand filters were defined as non-vegetated bioretention areas with a 6 inch (15.24 cm) ponding depth, containing an 18 inch (45.72 cm) layer of clean sand to provide high infiltration rates and to remove pollutants before exfiltrating runoff into the native soils. Permeable pavements included a 4 inch (10.16 cm) wearing course, with a 12 inch (30.48 cm) storage depth.
For the SWMM and SWMM-LITE models, SCMs were defined using the LID modules within SWMM. In the SWMM-LITE and SWMM models, technologies were deployed based on an estimation of the necessary volume needed to be treated (rain garden and sand filter) or based on the amount of area needed (permeable pavement) to be treated. The volume-based deployment method involves determining the percent of directly connected impervious area to capture and the watershed design precipitation depth (e.g., for Colorado the design depth is 0.50 inches (12.7 mm), however, for other locations it could be as low as 0.25 inches (6.4 mm) or as high as several inches). The total volume to be captured is then calculated by multiplying area by the watershed precipitation depth.
Each volume-based technology has an associated volume capacity per unit/area. By dividing the total volume to be captured by the capacity the technology can capture per area, the area required to capture the specified volume is calculated. Both impervious areas captured and the area needed for the technology is placed into a pervious–impervious pair with the impervious area flowing to the pervious area and the pervious area containing the stormwater technology.
The area-based deployment method involves determining the percentage of directly connected impervious area to be captured by the technology. Each area-based technology has an associated capture ratio or ratio of area of technology to total impervious area captured. Multiplying the total captured area by the capture ratio provides the area of the technology that is required to provide the appropriate capture for the selected impervious area. Both the impervious areas are captured and the area needed for the technology is placed into a pervious–impervious pair with the impervious area flowing to the pervious area and the pervious area containing the stormwater technology.
The SWC model does not include sand filters within the LID control options. Thus, small rain gardens, medium rain gardens, and sand filters were all represented by the rain garden module in LID controls. An average ponding depth of 10 inch (25.4 cm) was specified for the three technologies and a filter media depth of 18 inches (45.72 cm) was specified. Permeable interlocking concrete pavers were modeled using the permeable pavement module in LID controls. Similar to SWMM and SWMM-LITE models, Scenario 1 involved treating 10% of the impervious area with rain gardens. For scenario 2, the rain garden LID control captured 30% of the impervious area and the permeable pavement module was used to capture 10% of the impervious area.
2.4. Design Storm Scenarios
The developed models were also tested against the Colorado design storms. The 2 y, 10 y, and 100 y, point precipitations were extracted from the NOAA ATLAs 14 [19]. According to the Urban Drainage and Flood Control District (UDFCD), the primary drainage district in the region with the most common rainfall events for Colorado design storms occurs over periods that are less than one or two hours in Colorado [18]. Using the Colorado Urban Hydrograph Procedure (CUHP), which is an evolution of the Snyder unit hydrograph [20], the point precipitation was distributed across two hours creating a two-hour design storm for each return period. The design storms were used to evaluate the performance of the SWMM and SWMM-LITE models for each scenario to compare the outputs of the models.
2.5. Sensitivity Analysis
A simulation environment for uncertainty and sensitivity analysis program, SimLab version 2.2.1, was used to estimate model sensitivity and uncertainty for SWMM and SWMM-LITE simulations. SimLab 2.2.1 is a software designed for Monte Carlo based uncertainty and sensitivity analysis [21,22]. Monte Carlo (MC) methods are used in SimLab for pseudorandom number generation with an emphasis on a sampling set of points from joint probability distributions. MC-based sensitivity analyses are based on performing multiple model evaluations with probabilistically selected model input.
For MC analysis, a range and distribution of effective input variables (input factors) were selected based on literature review and the SWMM model technical manual [23] recommendations, as summarized in Table 2. These bound selections were used to generate a sample from the input factors. A sample of points was generated from the distribution of the inputs specified. All parameters were assumed to have a uniform distribution. The selected parameter values were then applied to all subunits in the SWMM and SWMM-LITE models. SWMM was delineated into 180 subcatchments using surface contours to represent detailed drainage areas while SWMM-LITE was delineated into 7 subunits based on the US Census tract boundaries. This exemplifies a typical application of each model where a detailed SWMM model may include a large number of small subunits and SWMM-LITE would use larger subunits to enable low processing times to support planning level decisions on the type and extent of SCMs.
The Morris method was selected for generating the sample data [24,25,26]. The rationale for using the Morris method is the determination of which factors may be considered to have effects, which are negligible, linear and additive, or non-linear or involved in the interactions with other parameters [26]. The Morris method is composed of individually randomized or “one-factor at-a-time” experiments in which the impact of changing the value of each of the selected factor is evaluated in turn. The number of model executions is computed as r x (k + 1), where r is the number of trajectories (successions of points starting from a random base vector in which two consecutive elements differ only for one component) and k the number of model input factors. The k-dimensional vector X of the model input has components Xi each of which can assume integer values in the set {0, 1/(p − 1), 2/(p − 1),…, 1}. The region of experimentation, Ω, will then be a k-dimensional p-level grid.
The method suggested by Morris is based on what is called an elementary effect. The elementary effect for the ith input is defined as follows. Let Δ be a predetermined multiple of 1/ (p − 1). For a given value x of X, the elementary effect of the ith input factor is defined as:
where x = (x1, x2,…, xk) is any selected value in Ω such that the transformed point (x + eiΔ), where ei is a vector of zeros but with a unit as its ith component and is still in Ω for each index i = 1…, k. The finite distribution of elementary effects associated with the ith input factor is obtained by randomly sampling different x from Ω and is denoted by Fi. The number of elements of each Fi is pk−1 [p − (p − 1)]. The total number of elementary effects can be counted from the grid by simply keeping in mind that each elementary effect relative to a factor i is computed by using two points for which their relative distance in the coordinate Xi is Δ.
In this study, k was 11, r was 10, and 8 levels of quantile were considered for the simulation. By employing the Morris method, 120 samples were generated for this study. Both SWMM and SWMM-LITE were fed with the sample elements and two sets of model outputs (240) were produced. These model evaluations created a map or relation from the space of the inputs to the space of the results. Once this mapping was generated and stored, the sensitivity of model predictions to individual input variables was estimated. In the post-processing module of the SimLab, Morris method sensitivity indicators, the estimated mean (µ), and standard deviation (σ) of each sample were generated.
3. Results and Discussion
Analysis was conducted to compare model performance based on hydrologic outputs of a complete SWMM model and three variations of SWMM-LITE models. Additionally, the complete SWMM model was compared to an SWC model along with the SWMM-LITE. A sensitivity analysis was conducted to determine the most sensitive parameters for both the SWMM and SWMM-LITE models.
3.1. Model Comparison of SWMM to Three Different Versions of SWMM-LITE
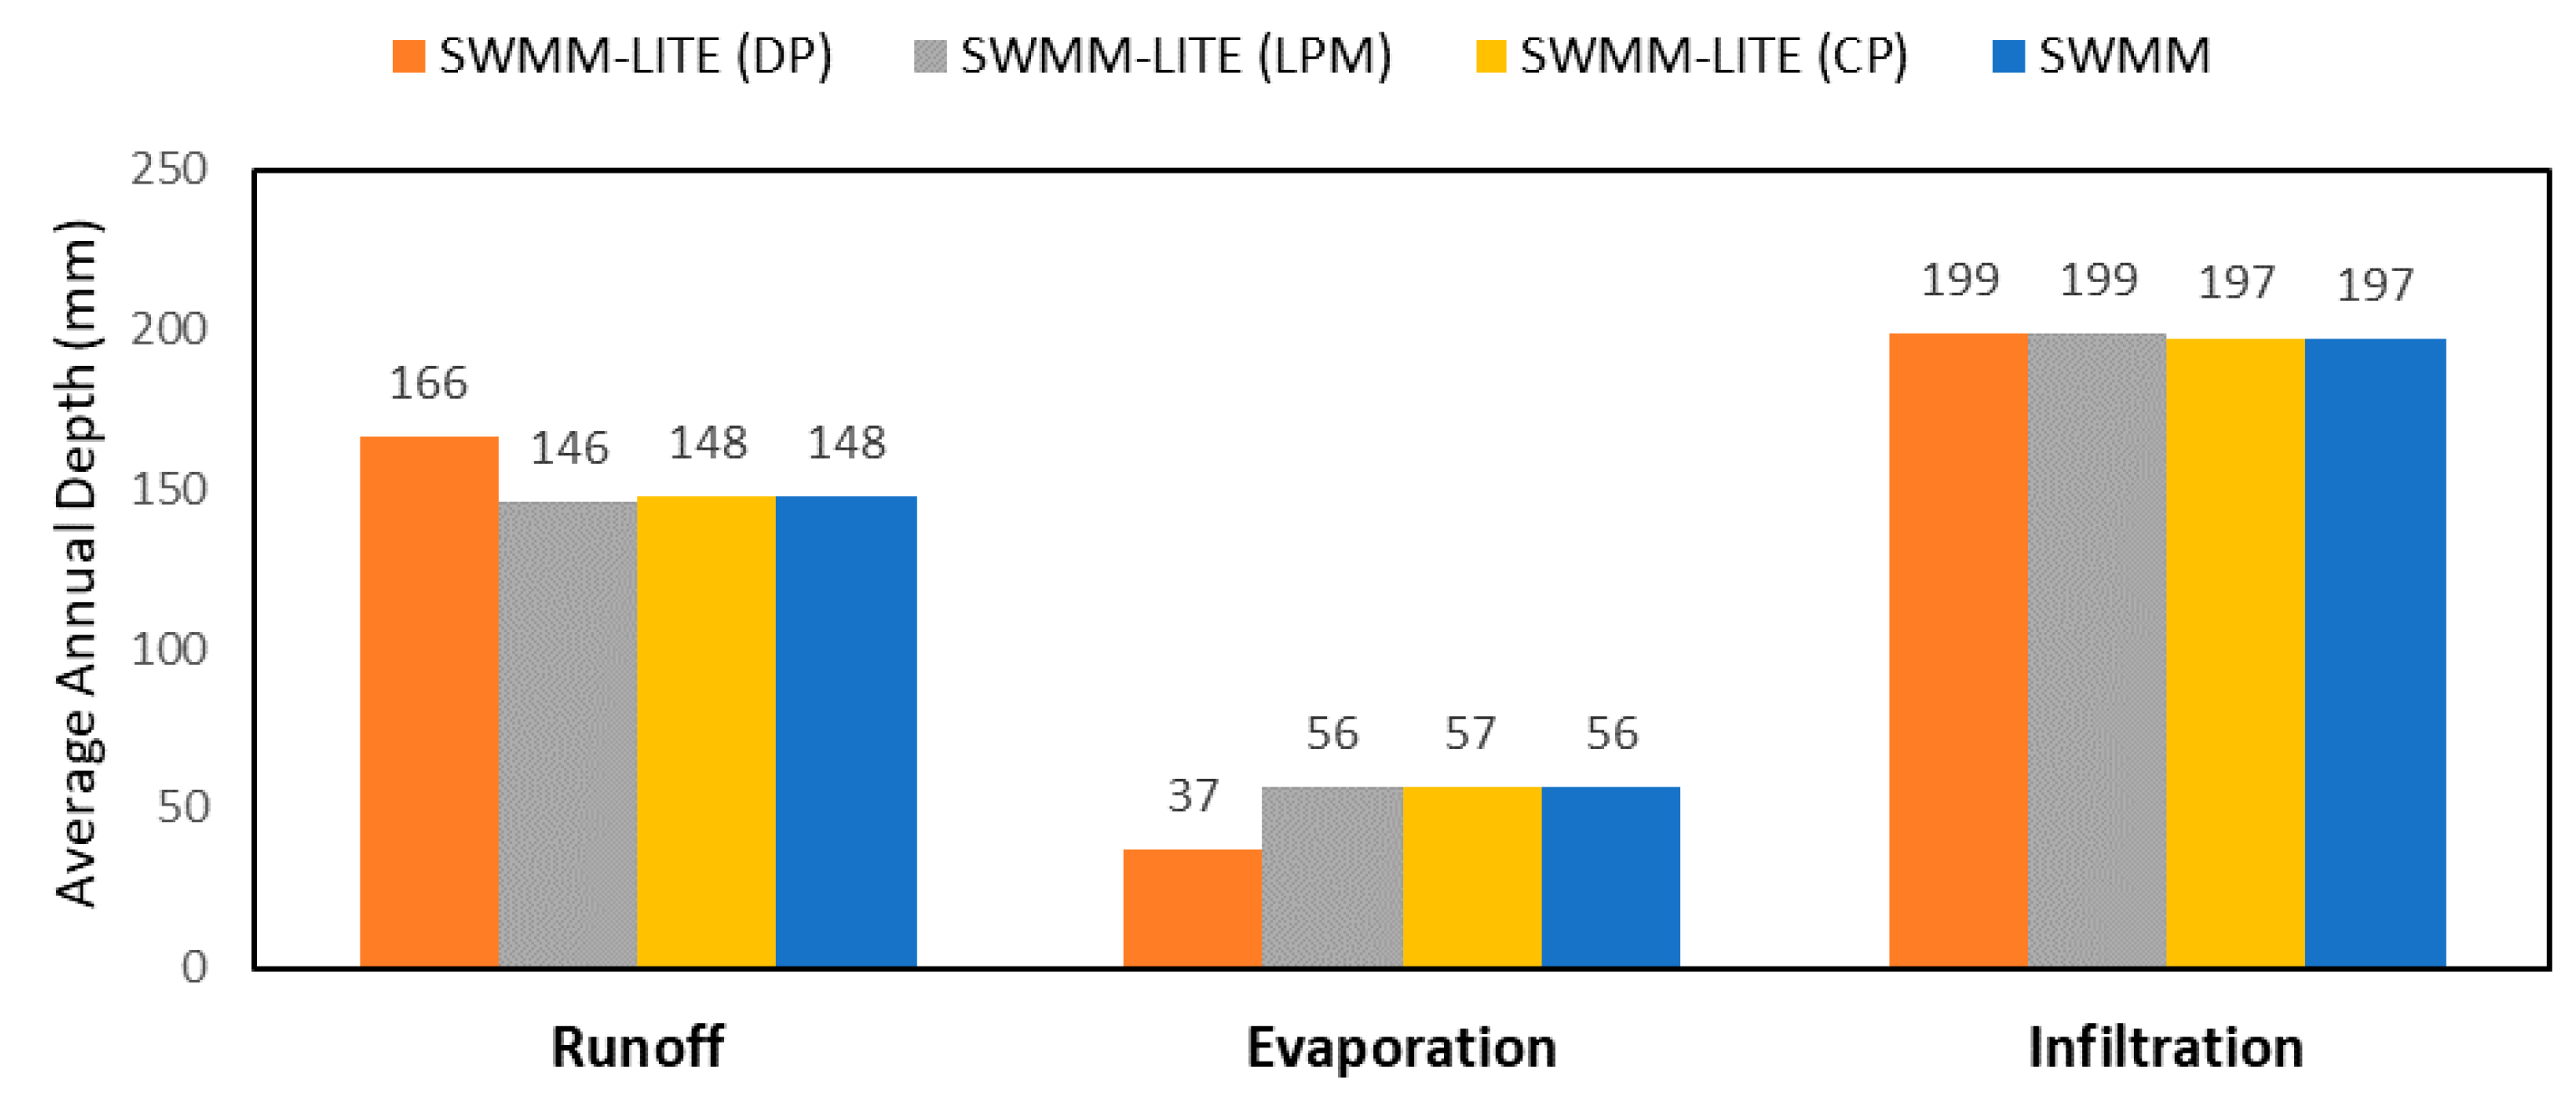
The SWMM-LITE methodology was deployed with three sets of subcatchment parameters, DP, LPM, and CP (Table 1). Each of the simulations were compared to the Fort Collins SWMM to evaluate influences the parameters may have played on model output compared to the complexities of the model itself. The largest difference occurred when the SWMM-LITE DP was compared to SWMM (Figure 2). SWMM-LITE DP represented the outputs when national datasets and the best available data were used to populate subcatchment parameters. Even though this difference was the largest, it was still within 12.2% for runoff, −34.9% for evaporation, and 1.0% for infiltration of the complete SWMM. In SWMM-LITE (LPM), N-pervious and N-impervious, D-store pervious and D-store impervious, and Zero-Impervious were consistent with the complete SWMM received from the City of Fort Collins. This change resulted in strong agreement in results causing errors to be less than +/−0.1%. This was further improved for runoff and infiltration when overland flow length and infiltration parameters were made consistent. Comparing SWMM-LITE CP and SWMM determined that the methodology of removing conveyance elements and simplifying complex subcatchment delineations does not introduce unacceptable error. For comparison, the continuity error ranged between −0.18% to −0.1% when simulating each model using EPA SWMM.
3.2. Model Outputs for Scenario Simulations
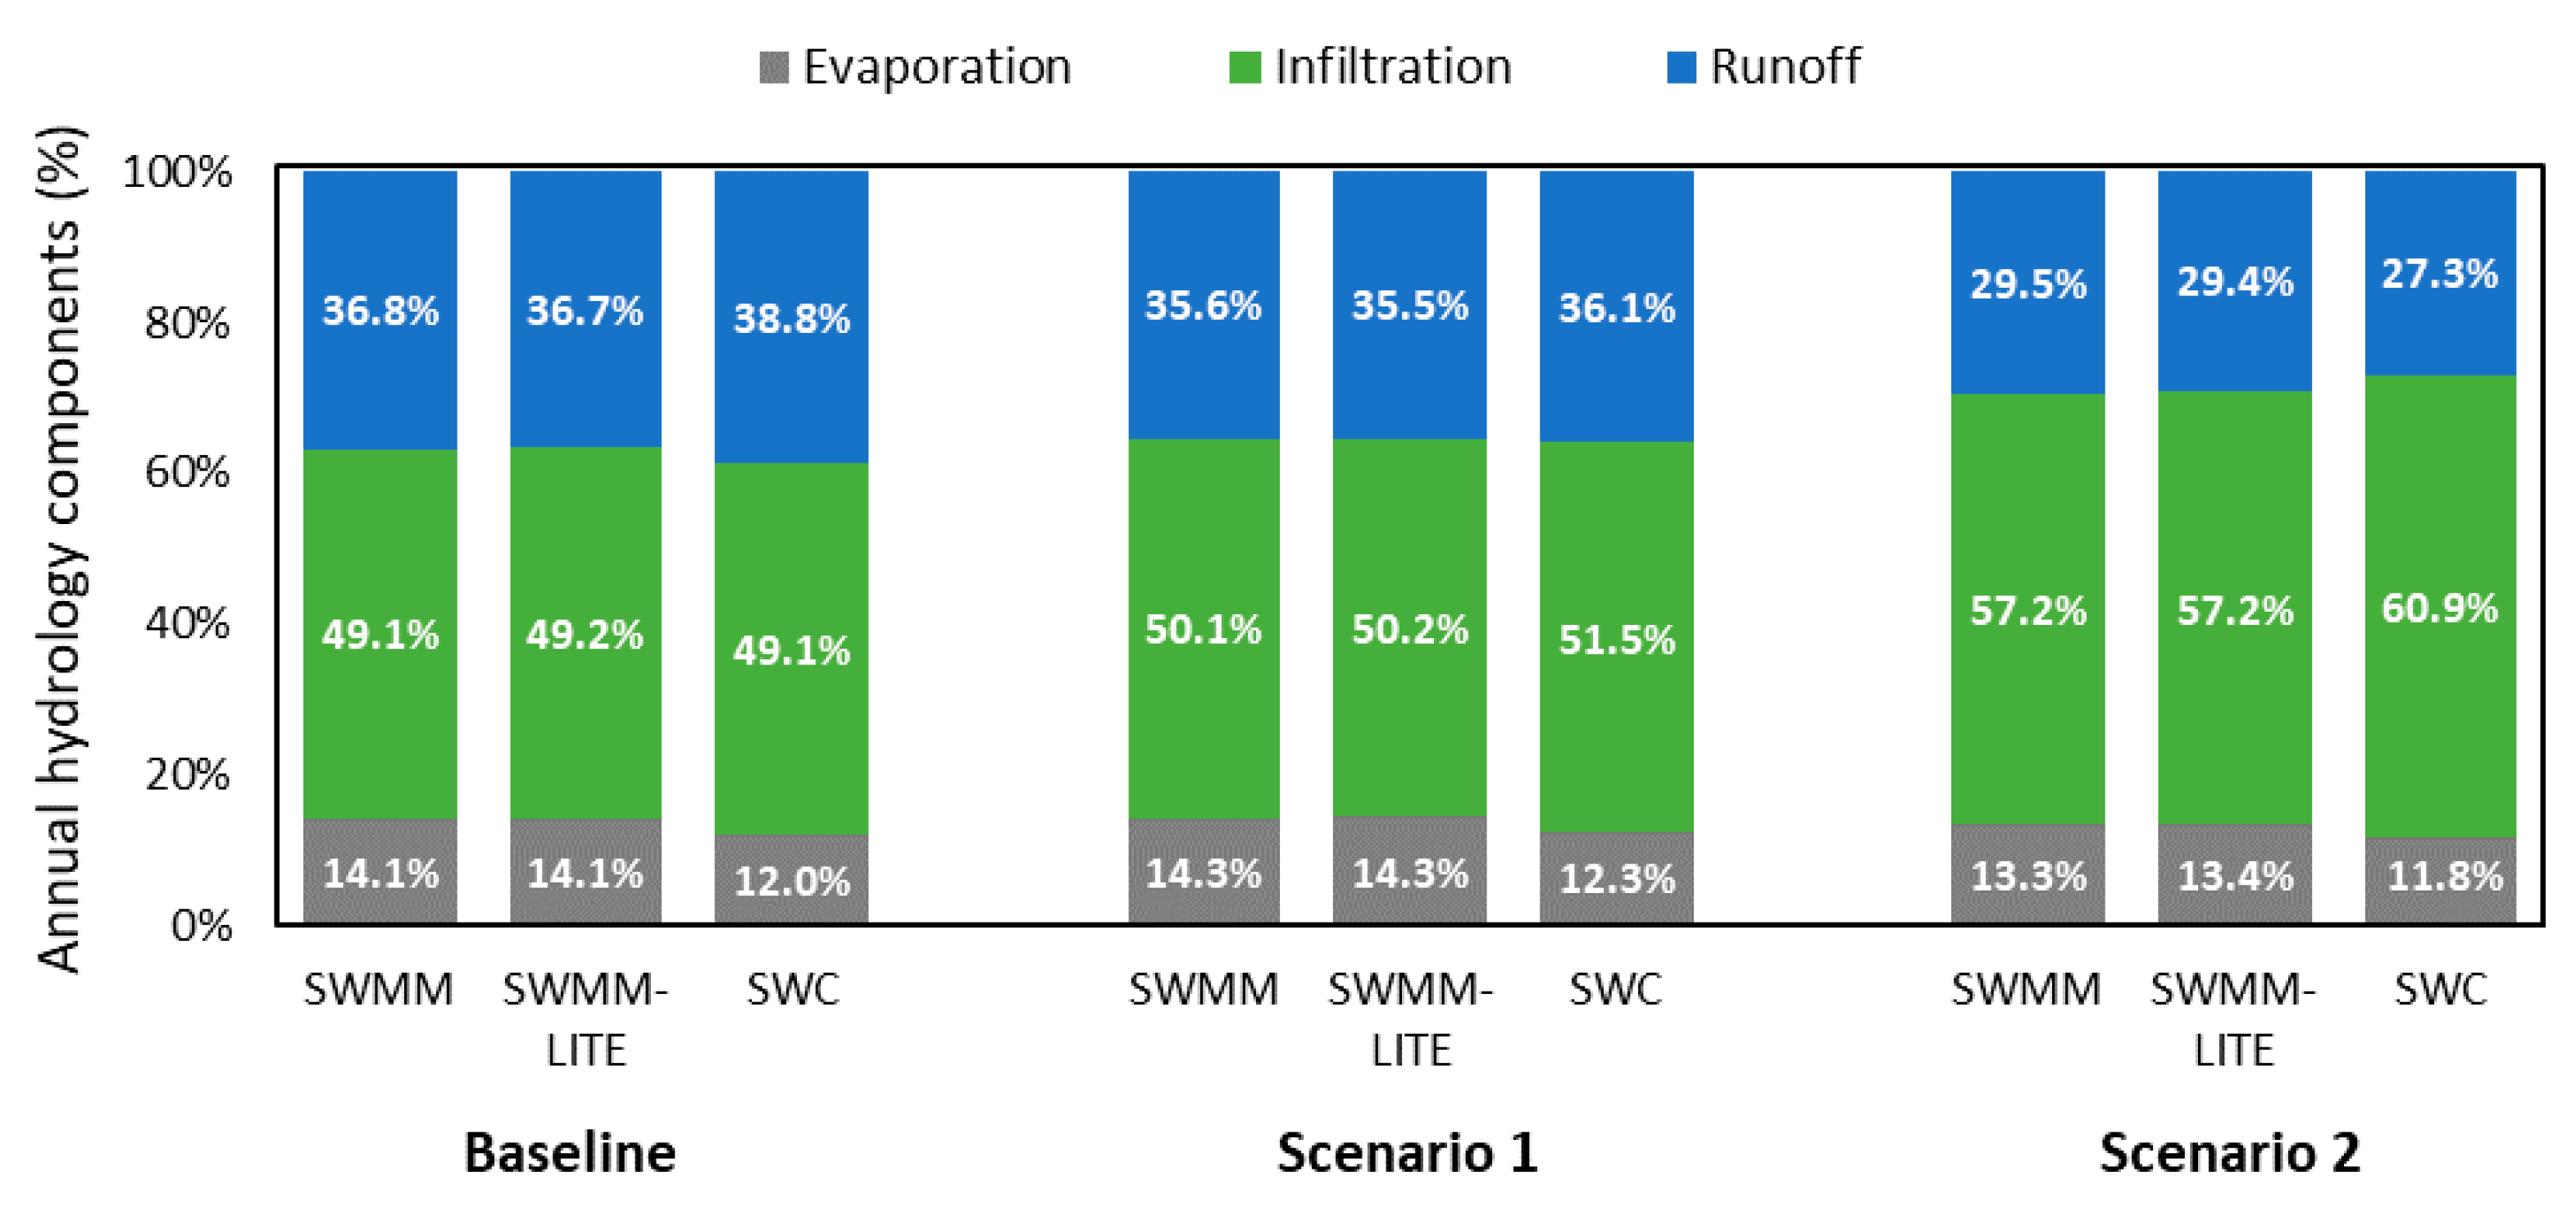
Hydrologic performance outputs were collected from running SWC, SWMM-LITE CP, and SWMM simulations for the Baseline Scenario, Scenario 1, and Scenario 2. Runoff, infiltration, and evaporation were observed from the model simulations (Figure 3). The SWMM and SWMM-LITE models consistently reported similar hydrologic results with the greatest variation occurring in the SWC model. Estimates of runoff, infiltration and evaporation varied by less than 0.1% for SWMM and SWMM-LITE. SWC outputs varied from SWMM and SWMM-LITE by between 0.1–3.8% (Figure 3). In all scenarios, SWMM-LITE estimated larger or near equivalent values for evaporation and infiltration and smaller values for percent runoff when compared with the SWMM model (Figure 3). The SWC model reported smaller evaporation loss in all three scenarios, larger total runoff in the baseline scenario and scenario 1, and larger infiltration in scenarios 1 and 2. This indicates that the SWC model overestimated infiltration as a result of adding SCMs in scenario 1 and 2, but overestimated runoff and underestimating evaporation in the baseline scenario. Adding SCMs in all models increased infiltration volume while the volume of runoff decreased, determined by comparing the Baseline Scenario to Scenarios 1 and 2. The reason that is postulated for the difference between SWC results and the other two models is that the SWC is designed for small-scale studies or site-level design and assumes a 10 acre area with specified characteristics. When volumes are estimated by scaling up to the larger area, the errors increase. Additionally, SWC provides limited variability in key parameters such as width and depression storage.
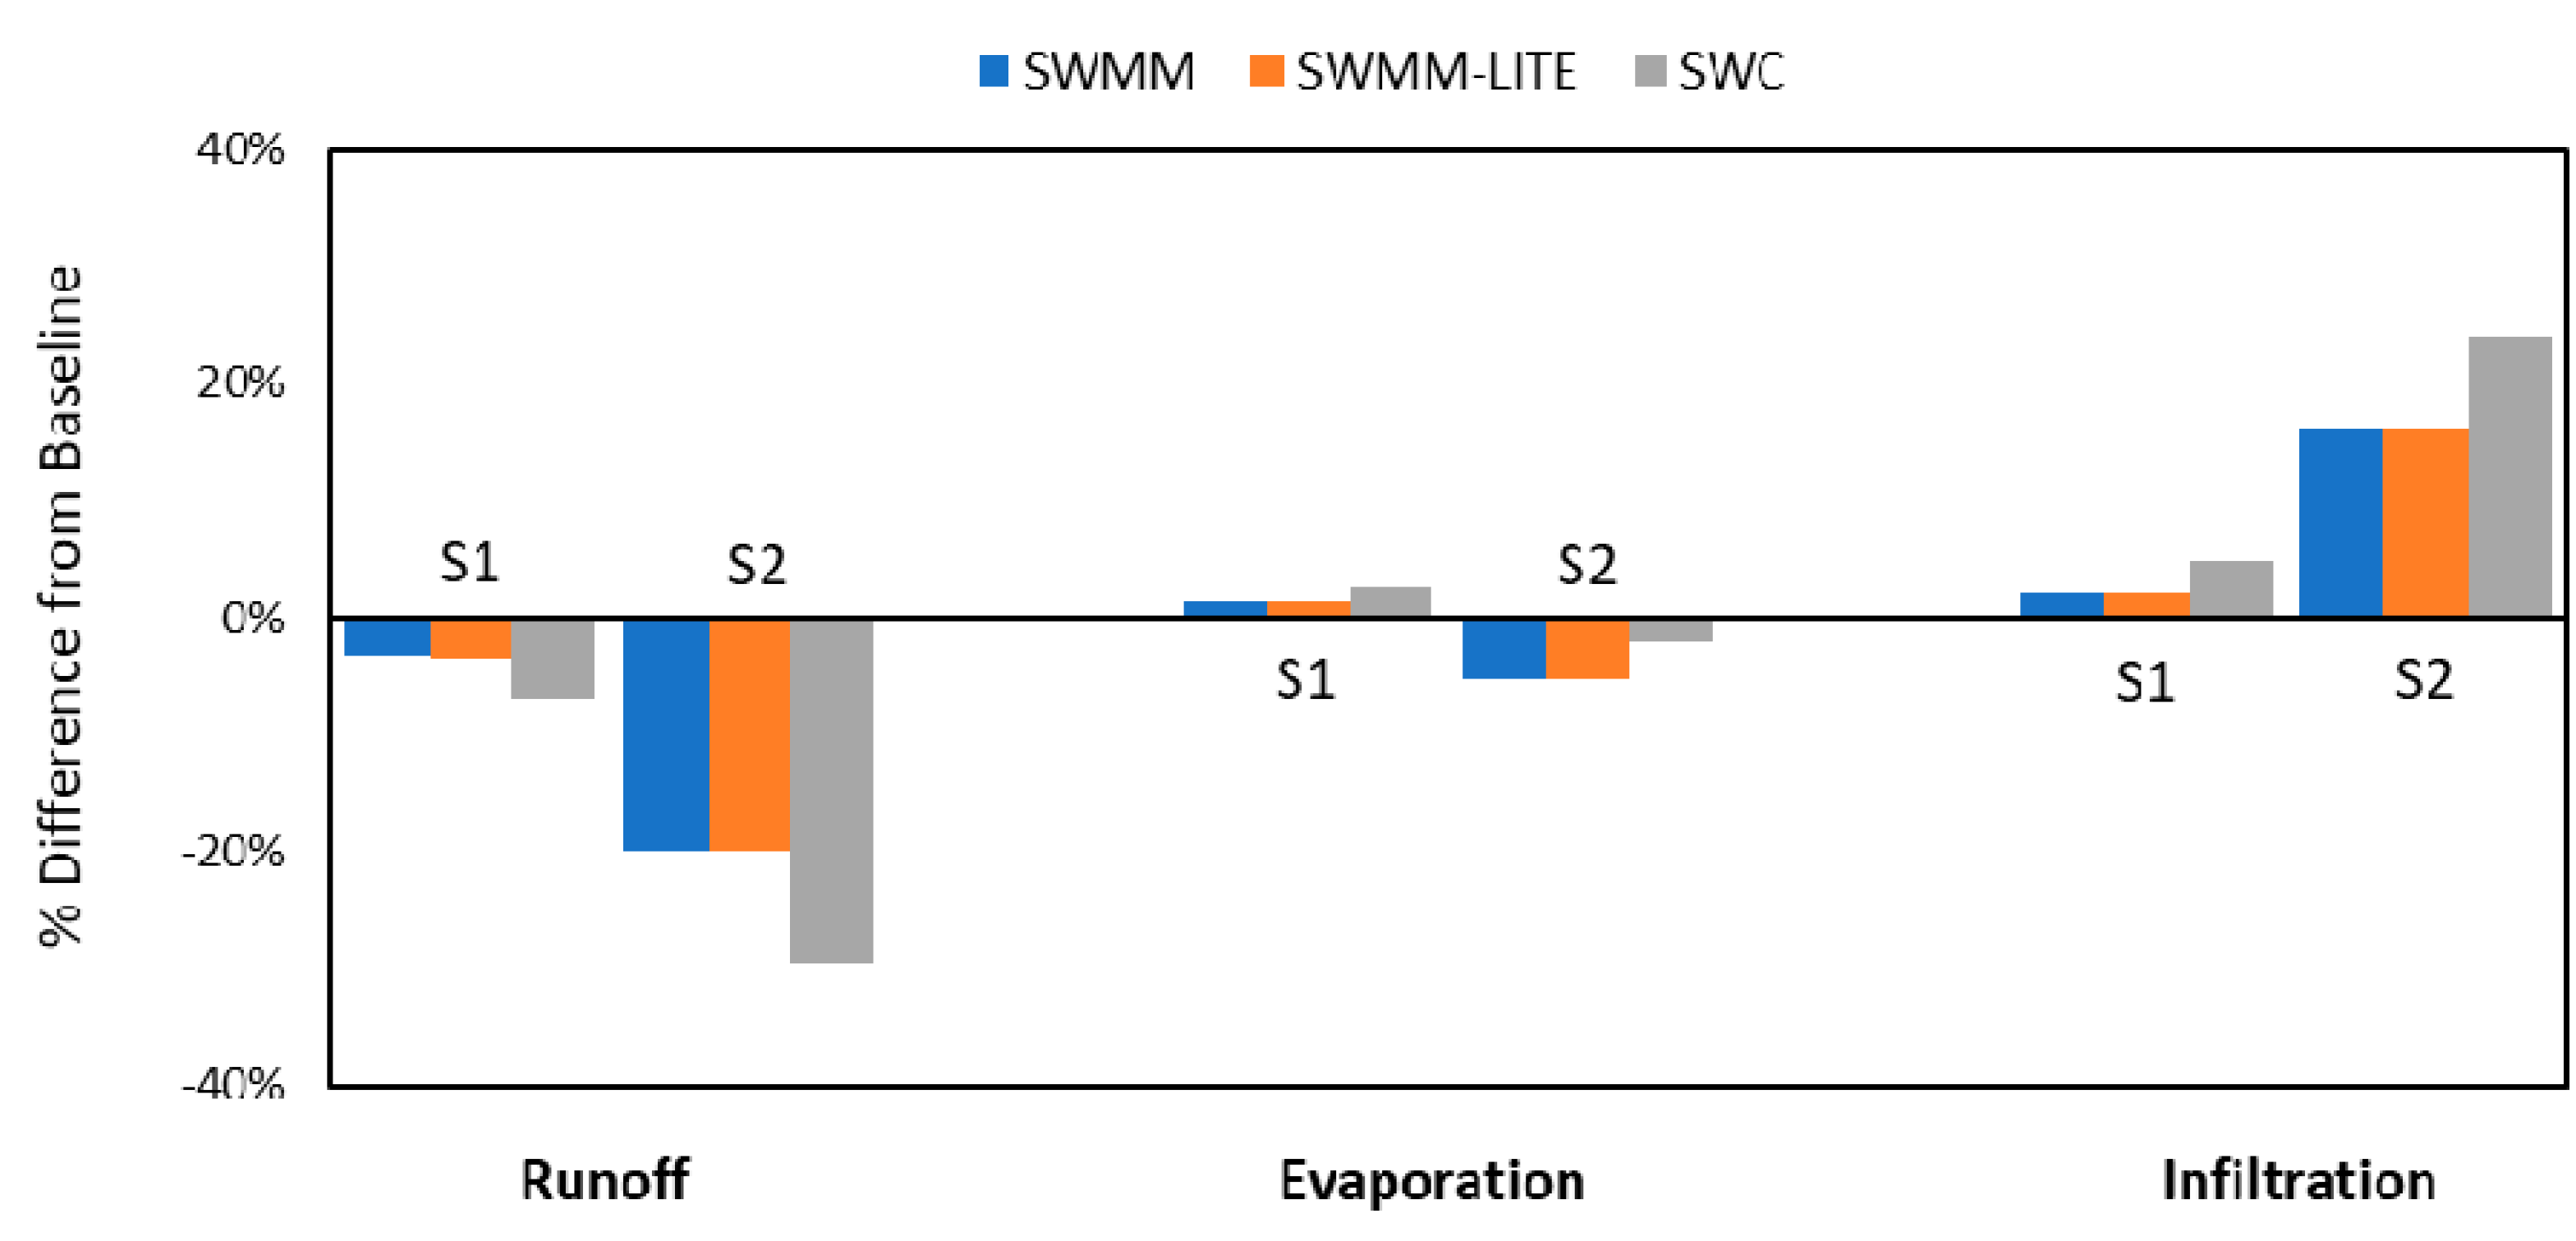
The primary purpose of SWMM-LITE is to rapidly compare the performance of scenarios of SCMs for varying complexities of study areas. Thus, analysis was conducted comparing the differences in hydrologic outputs between Scenario 1 and Scenario 2 to the Baseline scenario for each of the three scenarios (Figure 4). SWMM-LITE outputs continued to be very close to SWMM, with the predicted changes from Baseline being within 0.1% of each other. The SWC model provided more variation in comparisons to the Baseline scenario, with predicted changes from Baseline varying from SWMM output by 1.5–7.5% (Figure 4). Overall, estimates of hydrologic parameters from SWMM-LITE are comparable to those from SWMM, while SWC outputs were slightly different from the other two models when considering basic hydrologic outputs that did not include delivery or timing of flow. While SWC has been demonstrated to adequately estimate site level performance of SCMs [13], it was designed for site level analysis up to 50 acres (20.2 ha) and it is not appropriate for application in municipal scale analysis. SWC maintains value use for site level design of SCMs and the estimation of hydrologic performance. While SWC does reasonable estimates of hydrologic outputs, the methodology applied is not appropriate for large scale analyses (>50 acres). In order to model larger areas, a user would need to manually delineate sub-units, run the SWC model for each sub-unit, and then extrapolate each model result by multiplying the area of the sub-unit. This requires substantial post-processing of outputs to obtain analyses for a larger scale area with multiple sub-units.
3.3. Design Storm Scenarios
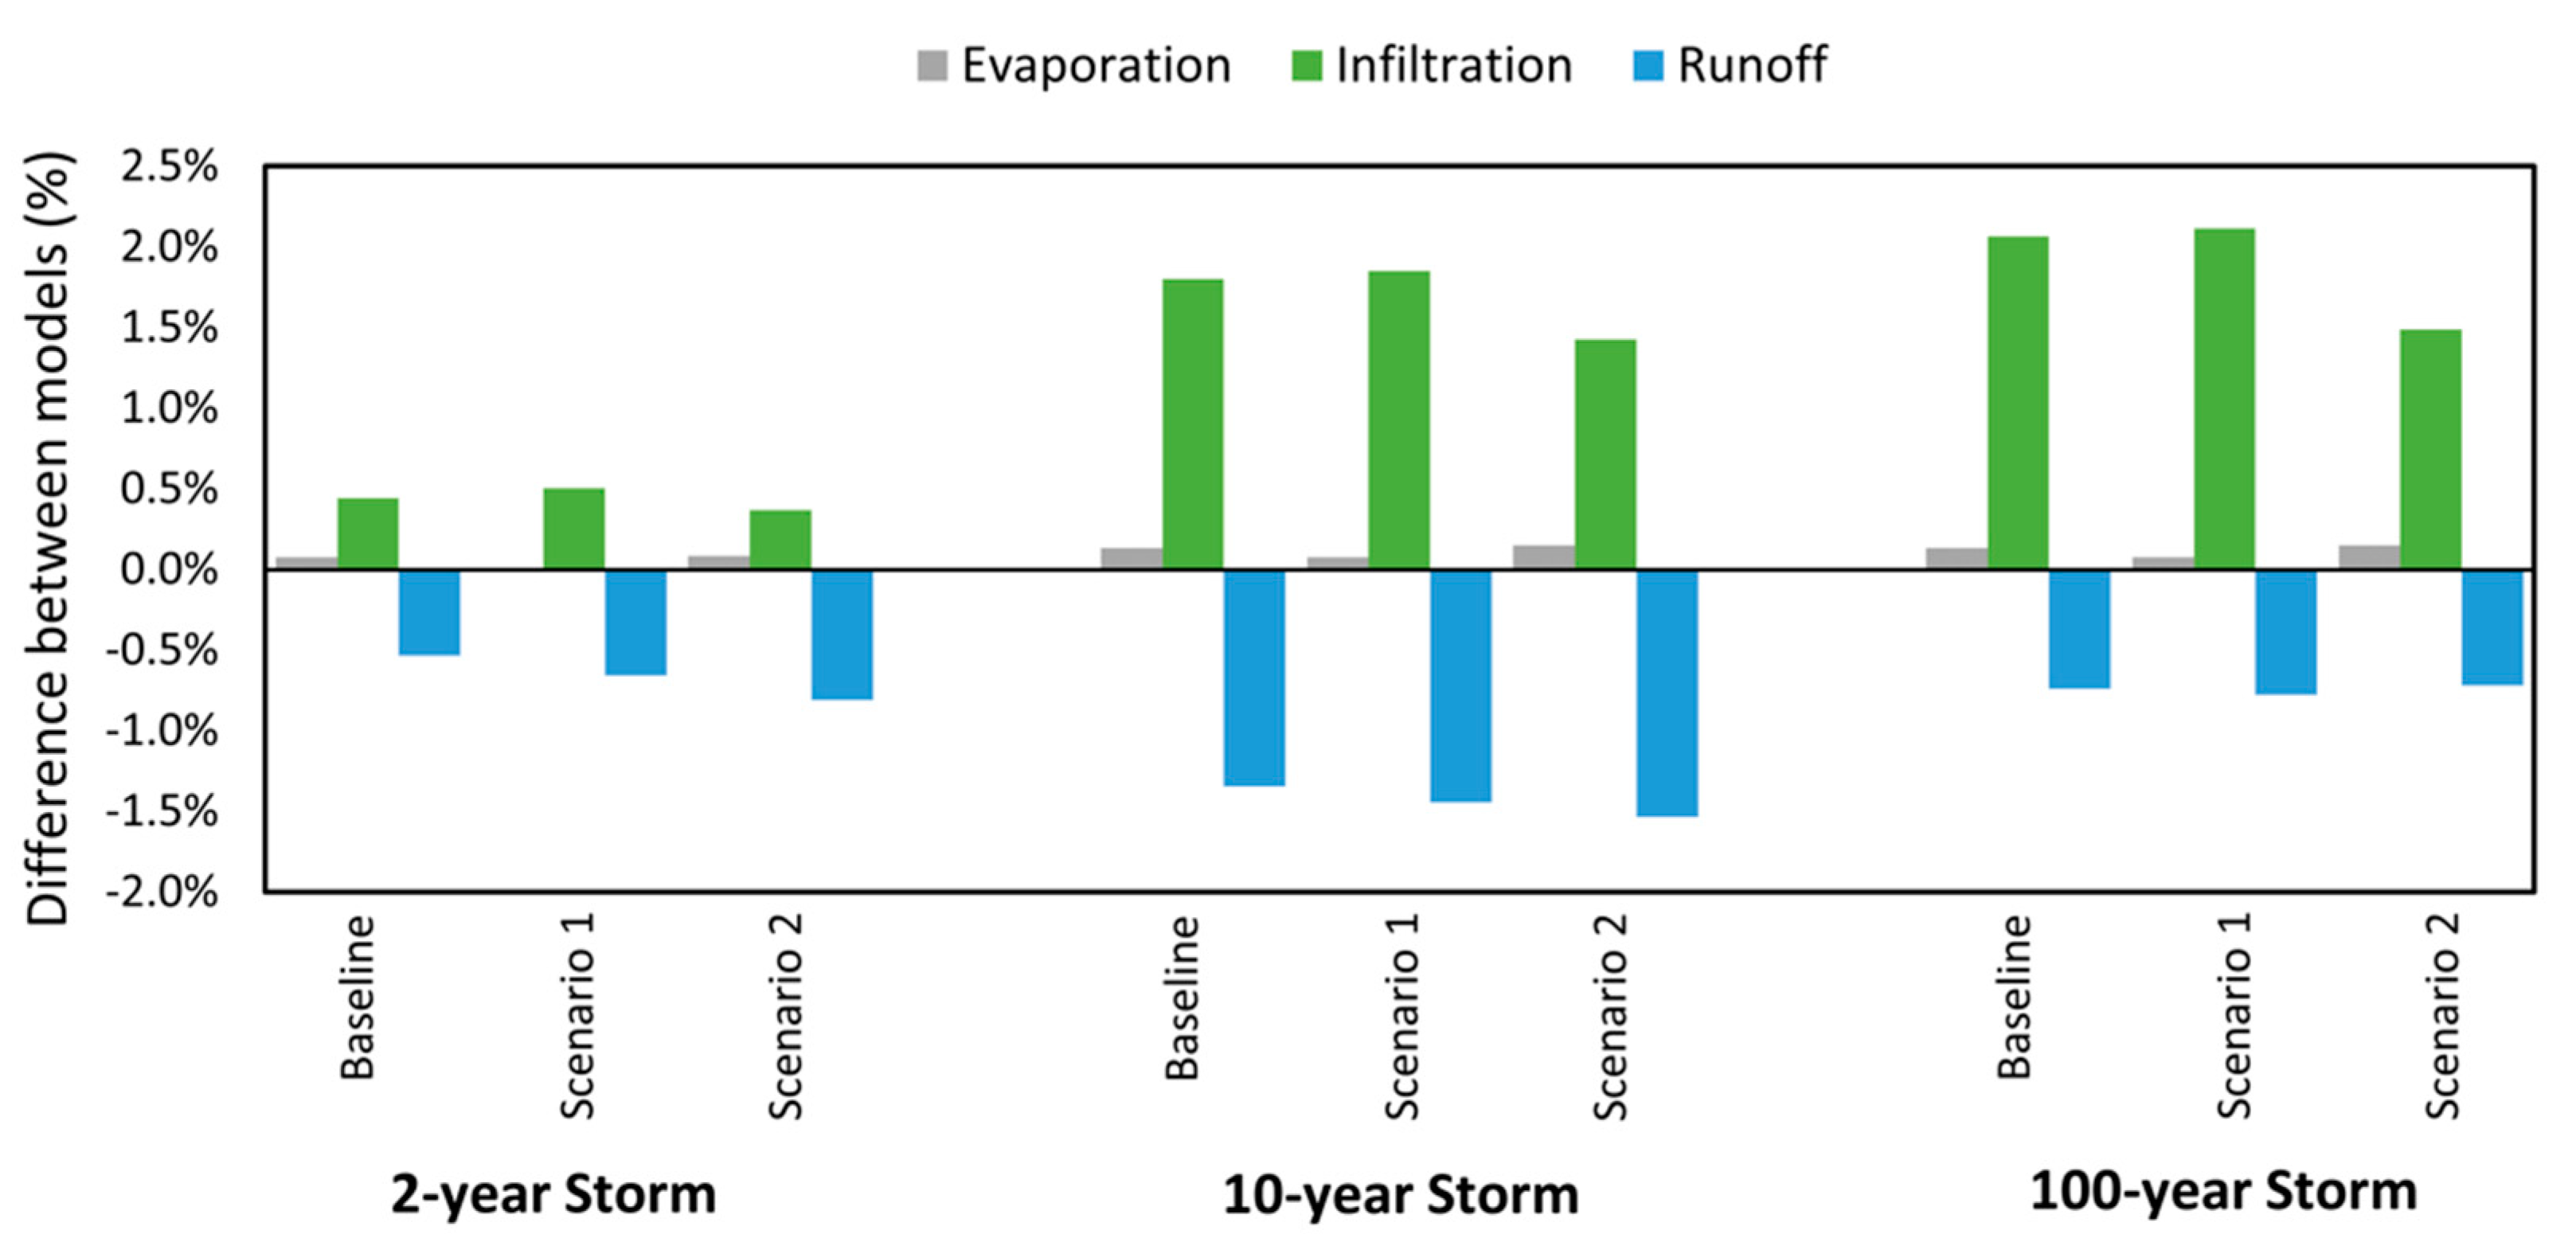
Design storms were modeled to compare hydrologic performance for different sizes of storms (Figure 5). The percent difference was found by comparing outputs from SWMM and SWMM-LITE. Differences between outputs from the two models were within 2.5%., demonstrating very good agreement across simulated storm events. In all of the design storms, evaporation and infiltration were consistently overestimated and runoff was underestimated by SWMM-LITE. For smaller storms, which are 2 y events, the difference in runoff appeared to increase as additional technologies are added. However, this decrease in runoff did not correspond to a direct increase in either infiltration or evaporation but varied between Scenarios 1 and 2. For Scenario 1, the further decrease in runoff was likely caused by an increase in infiltration. However, for Scenario 2, the precipitation that did not become runoff became evaporation and additional infiltration. From this variation it appears that SCMs do not all have the same effect or result in the same errors, in particular, when considering smaller design storms.
The 10 y event produced the highest difference between runoff estimates from SWMM and SWMM-LITE for all scenarios. This could be a result of the higher water volume producing errors than the 2 y storm, but not too much water that causes the percent difference between the models to be inconsequential. The 100 y storms had the greatest variation for infiltration, but the difference was reduced as more technologies were applied. This could be explained by the methodology used to apply SCMs. From the analysis it appears that the different input parameters defining subcatchment characteristics for SWMM and SWMM-LITE (Table 2) was more critical when modeling design storms. Design storm analysis consists of larger storms that cause increased ponding duration as well as depths on subcatchments, which influences functions for both infiltration and runoff. However, when considering continuous simulations (Figure 3 and Figure 4) very little of the overall precipitation occurs from design storm events, but is driven by the smaller regular events. When considering the smaller regular events (e.g., 2 y storm), there is strong agreement between SWMM and SWMM-LITE (Figure 5). It was also observed that as more technologies were added, the percent difference appeared to decrease. As SCMs are applied to each model, the subcatchment area is replaced by SCM area and SCM input parameters are the same in the two models. This has the potential to reduce discrepancies in infiltration output.
3.4. Parameter Sensitivity Analysis
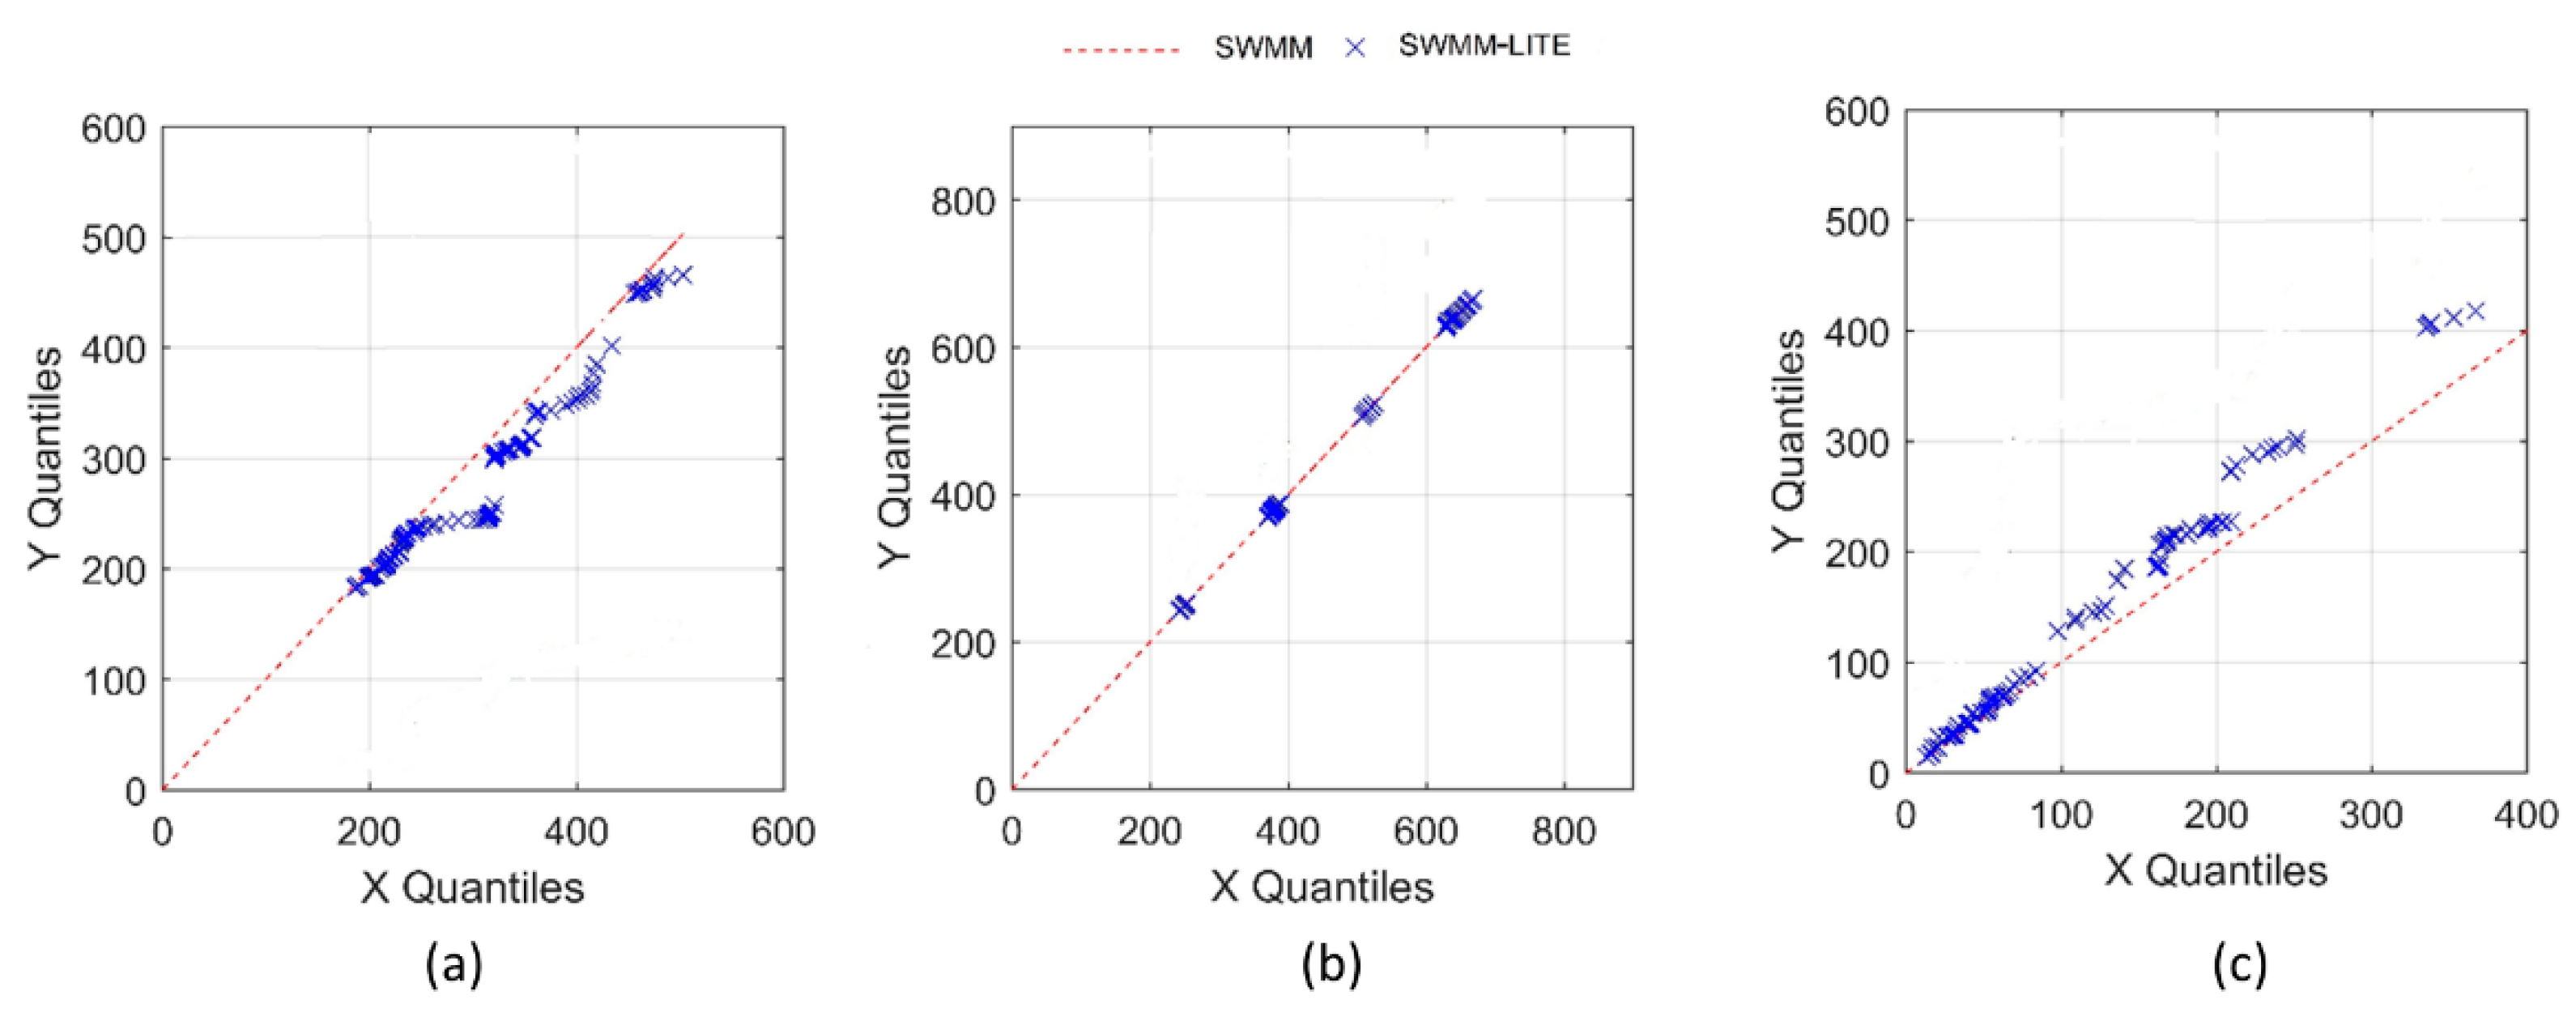
A quantile–quantile graph shows agreement between SWMM and SWMM-LITE using MC generated inputs (Figure 6). Good agreement between the SWMM and SWMM-LITE was found, with the largest difference associated with evaporation estimates. Small differences likely occurred due to the differences in subcatchment arrangement which changes the amount of time water was left on the surface of a subcatchment as well as the evaporation potential of open channel conveyance elements in SWMM. Additionally, because the magnitude of precipitation that became evaporation was much smaller than the other categories, any error resulting from the difference of modeling procedure was exacerbated. Overall, results demonstrate that SWMM-LITE provides reasonable estimates of hydrologic parameters compared to SWMM.
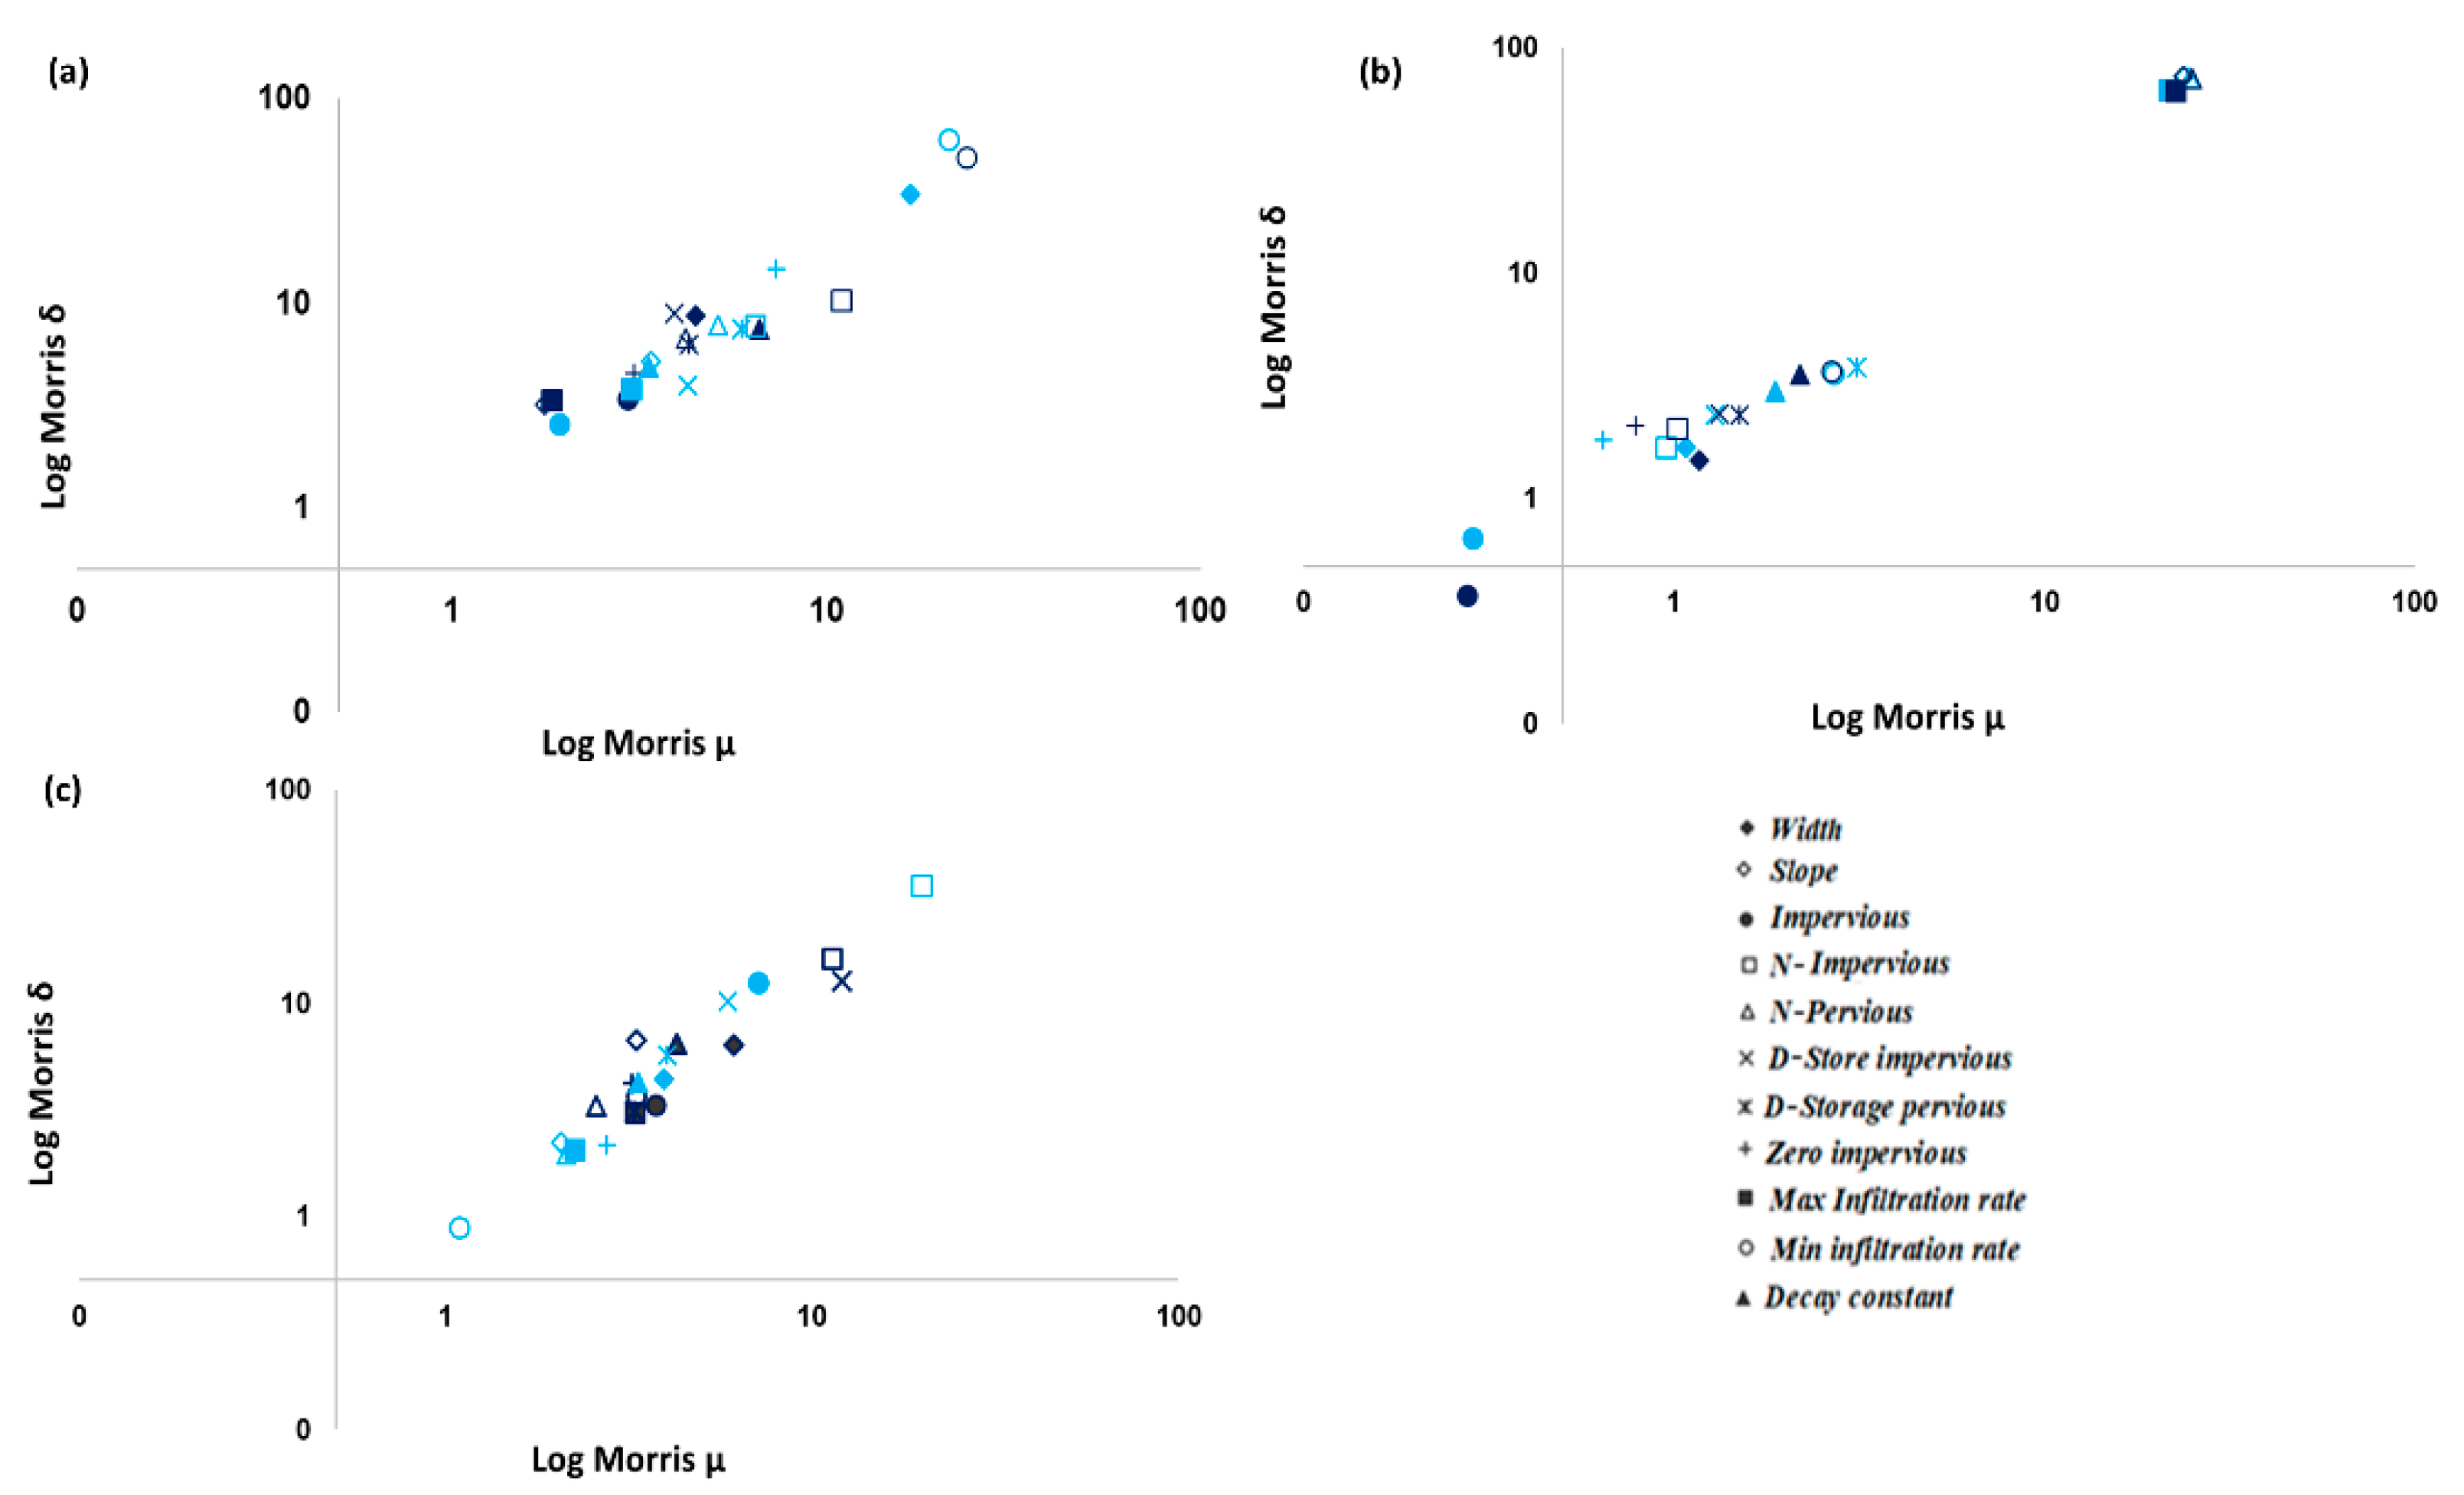
The output of the Morris method is reported with two parameters for each hydrology component (Figure 7a–c). The parameter µ is used to detect input factors with an important overall influence on the output and σ is used to detect factors involved in interaction with other factors or for which the effect is non-linear. According to Figure 7a, the Min Infiltration Rate is the most influential parameters on the simulated total runoff of both SWMM and SWMM-LITE simulations. Results also suggests that the Min Infiltration Rate has more interaction and possesses a non-linear relation with the estimated runoff for both models. For SWMM, the second influential parameter is Width, followed by Zero Impervious. Zero Impervious was a parameter that was adjusted for the case study SWMM-LITE (LPM and CP) simulations that resulted in lower observed difference between SWMM and SWMM-LITE compared to default parameters (Figure 2). Other studies have shown sensitivity of SWMM to Width [27]. For SWMM-LITE, sensitivity of Min Infiltration Rate was followed by N Impervious and Decay Constant. In general, sensitivity of parameters for the estimation of total volume are similar between SWMM and SWMM-LITE, with a few exceptions. For example, Width and Zero Impervious were found to be a highly sensitive parameter for total volume estimates in SWMM, while they did not appear as sensitive for SWMM-LITE (Figure 7a).
Other sensitivity analyses on SWMM have shown variable sensitivity of SWMM parameters. A sensitivity analysis was performed by Barco et al. [28] in a large urban subcatchment in Southern California. Four parameters were considered for sensitivity analysis and imperviousness and depression storage were the most sensitive parameters affecting total runoff and peak flow, while subcatchment width and Manning’s N were less sensitive. In another study by Ballinas-González et al. [29], the Manning coefficient of the impervious surface (N-Impervious), which was the most sensitive to changes, followed by the Max Infiltration Rate were found to be the more sensitive parameters in the estimation of total runoff. In another study, in a small subcatchment adjacent to a highway, the multiparameter sensitivity analysis effectively identified 15 sensitive parameters in SWMM that had a significant influence on inflow discharge. Wang et al. [27] found that infiltration parameters (represented by curve number in this study), Width, and surface roughness, which is related to Manning’s coefficient (N-impervious or N-pervious), were found to be the most sensitive parameters. Wide variation in parameter sensitivity has been shown in these studies, indicating that study area infrastructure and land use characteristics may have a large impact on sensitivity of parameters. In addition, the studies had different objectives that may impact variability of parameter sensitivity.
Max Infiltration Rate and N-Pervious are most influential parameters on the simulated infiltration of both SWMM and SWMM-LITE (Figure 7b). For the estimation of evaporation, N-Impervious is a highly sensitive parameter for both SWMM and SWMM-LITE, followed by D-store Impervious (Figure 7c). Modification of N-Impervious and D-store Impervious for SWMM-LITE (LPM and CP) also resulted in closer estimates between SWMM and SWMM-LITE (Figure 2). Parameter sensitivity for the estimation of infiltration is very similar between SWMM and SWMM-LITE (Figure 7b) and is consistent with the comparison of estimates from the two models (Figure 6). Similar to total runoff estimation, sensitivity to parameters is mostly consistent between SWMM and SWMM-LITE for estimation of evaporation (Figure 7c). Exceptions are that Impervious is more sensitive for the estimation of infiltration in SWMM compared to SWMM-LITE and Width appears as a more sensitive parameter for the estimation of evaporation for SWMM-LITE compared to SWMM (Figure 7c).
4. Conclusions
SWMM-LITE was developed as a methodology to develop simplified models to estimate hydrologic parameters associated with storm events to make comparisons between scenarios of SCM addition, informing planning level decisions. SWMM-LITE was demonstrated to provide comparable outputs to a SWMM model with complex subcatchment delineation and complete hydraulic and infrastructure data, as well as to the SWC model via an application of a case study in Fort Collins. Estimates of average annual hydrologic performance of scenarios of SCM addition over a 30 y study period showed less than 0.1% difference for SWMM and SWMM-LITE, which is less than the continuity error for each individual model run. Differences were higher between SWC outputs and SWMM, which were up to 3.8%. Probabilistic approaches were employed for sensitivity analysis. The sensitivities of parameters for SWMM and SWMM-LITE outputs were very consistent. The most influential parameters for estimation of runoff volume were minimum infiltration rate and Manning’s N for impervious area.
While SWC provides reasonable estimates for hydrologic outputs, it is more suitable for small scale or site studies. The SWMM-LITE model dramatically reduces the burden of a user to develop a SWMM model without sacrificing accuracy of hydrologic outputs, i.e., annual runoff, evaporation, and infiltration. Future work may be considered to verify the use of SWMM-LITE for additional climate regimes, however, based on the methodology for estimating runoff within SWMM and the minimal error demonstrated in this study, it seems unlikely that a substantial difference would be observed for wetter climates. SWMM-LITE enables municipal scale analysis to compare the performance of SCMs and to inform planning level decisions. Future work will apply SWMM-LITE to a web-based tool that informs decisions on extent and the type of SCMs to achieve goals based on hydrologic performance, lifecycle costs, and co-benefits.
Author Contributions
Conceptualization, T.D., S.S. and M.A.; methodology, T.D., S.S. and M.R.; software, T.D. and M.R.; validation, S.S. and M.A.; formal analysis, M.R. and T.D.; investigation, M.R.; writing—original draft preparation, M.R.; writing—review and editing, T.D. and S.S.; supervision, S.S. All authors have read and agreed to the published version of the manuscript.
Funding
This project was jointly funded by the United Stated Environmental Protection Agency (US EPA), the Water Research Foundation (WRF), and the National Science Foundation Sustainability Research Network (SRN) Cooperative Agreement 1444758.
Data Availability Statement
The data presented in this study are available upon request from the corresponding author. The data are not publicly available due to permissions required by local municipalities prior to sharing the data.
Acknowledgments
The authors would like to acknowledge the City of Fort Collins and Chris Olson for providing a copy of the McClelland basin SWMM model.
Conflicts of Interest
The authors declare no conflict of interest.
References
- Eckart, K.; McPhee, Z.; Bolisetti, T. Performance and implementation of low impact development—A review. Sci. Total Environ. 2017, 607–608, 413–432. [Google Scholar] [CrossRef] [PubMed]
- Chang, N.-B.; Lu, J.-W.; Chui, T.F.M.; Hartshorn, N. Global policy analysis of low impact development for stormwater management in urban regions. Land Use Policy 2018, 70, 368–383. [Google Scholar] [CrossRef]
- Fletcher, T.D.; Shuster, W.; Hunt, W.F.; Ashley, R.; Butler, D.; Arthur, S.; Trowsdale, S.; Barraud, S.; Semadeni-Davies, A.; Bertrand-Krajewski, J.; et al. SUDS, LID, BMPs, WSUD and more—The evolution and application of terminology surrounding urban drainage. Urban Water J. 2015, 12, 525–542. [Google Scholar] [CrossRef]
- Ahiablame, L.M.; Engel, B.A.; Chaubey, I. Effectiveness of Low Impact Development Practices: Literature Review and Suggestions for Future Research. Water Air Soil Pollut. 2012, 223, 4253–4273. [Google Scholar] [CrossRef]
- Askarizadeh, A.; Rippy, M.A.; Fletcher, T.D.; Feldman, D.L.; Peng, J.; Bowler, P. From Rain Tanks to Catchments: Use of Low-Impact Development to Address Hydrologic Symptoms of the Urban Stream Syndrome. Environ. Sci. Technol. 2015, 49, 11264–11280. [Google Scholar] [CrossRef] [PubMed] [Green Version]
- Li, C.; Fletcher, T.D.; Duncan, H.P.; Burns, M.J. Cost-Benefit Analysis of Onsite Residential Graywater Recycling—A Case Study: The City of Los Angeles. J. Hydrol. 2017, 549, 631–653. [Google Scholar] [CrossRef]
- Bell, C.D.; Spahr, K.; Grubert, E.; Stokes-Draut, J.; Gallo, E.; McCray, J.E.; Hogue, T.S. Decision Making on the Gray-Green Stormwater Infrastructure Continuum. J. Sustain. Water Built Environ. 2019, 5, 1–15. [Google Scholar] [CrossRef]
- Baek, S.-S.; Choi, D.-H.; Jung, J.-W.; Lee, H.-J.; Lee, H.; Yoon, K.-S.; Cho, K.H. Optimizing low impact development (LID) for stormwater runoff treatment in urban area, Korea: Experimental and modeling approach. Water Res. 2015, 86, 122–131. [Google Scholar] [CrossRef] [PubMed]
- Ahiablame, L.; Shakya, R. Modeling flood reduction effects of low impact development at a watershed scale. J. Environ. Manag. 2016, 171, 81–91. [Google Scholar] [CrossRef] [PubMed]
- Rossman, L.A. Storm Water Management Model User’s Manual Version 5.1.; United States Environmental Protection Agency (USEPA): Cincinnati, OH, USA, 2015. [Google Scholar]
- Gironas, J.; Roesner, L.A.; Rossman, L.A.; Davis, J. A new applications manual for the Storm Water Management Model (SWMM). Environ. Modeling Softw. 2010, 25, 813–814. [Google Scholar] [CrossRef]
- Center for Neighborhood Technology (CNT). Green Values Stormwater Management Calculator; Center for Neighborhood Technology: Chicago, IL, USA, 2009. [Google Scholar]
- Schifman, L.; Tryby, M.; Berner, J.; Shuster, W. Managing uncertainty in runoff estimation with the US Environmental Protection Agency national stormwater calculator. J. Am. Water Resour. Assoc. 2018, 54, 148–159. [Google Scholar] [CrossRef] [PubMed]
- Rossman, L.A.; Bernagros, J.T. National Stormwater Calculator User’s Guide—Version 1.2.0.1; EPA/600/R-13/085e; Office of Research and Development, United States Environmental Protection Agency (USEPA): Cincinnati, OH, USA, 2018. [Google Scholar]
- Kong, F.; Ban, Y.; Yin, H.; James, P.; Dronova, I. Modeling stormwater management at the city district level in response to changes in land use and low impact development. Environ. Model. Softw. 2017, 95, 132–142. [Google Scholar] [CrossRef]
- Bell, C.D.; McMillan, S.K.; Clinton, S.M.; Jefferson, A.J. Hydrologic response to stormwater control measures in urban watersheds. J. Hydrol. 2016, 541, 1488–1500. [Google Scholar] [CrossRef] [Green Version]
- Homer, C.G.; Dewitz, J.; Yang, L.; Jin, S.; Danielson, P.; Xian, G.; Coulston, J.; Herold, N.; Wickham, J.; Megown, K. Completion of the 2011 National Land Cover Database for the conterminous United States—Representing a decade of land cover change information. Photogramm. Eng. Remote Sens. 2015, 81, 345–353. [Google Scholar]
- Urban Drainage Flood Control District (UDFCD). Urban Storm Drainage Criteria Manual: Volume 1 Management, Hydrology, and Hydraulics; UDFCD: Denver, CO, USA, 2016. [Google Scholar]
- Bonnin, G.M.; Martin, D.; Lin, B.; Parzybok, T.; Yekta, M.; Riley, D. Precipitation-Frequency Atlas of the United States, NOAA Atlas 14; Version 4.0; National Oceanic and Atmospheric Administration (NOAA), National Weather Service: Silver Spring, MD, USA, 2006; Volume 1. [Google Scholar]
- Urban Drainage Flood Control District (UDFCD). Colorado Urban Hydrograph Procedure (CUHP) 2005 User Manual; Version 2.0.0; UDFCD: Denver, CO, USA, 2016. [Google Scholar]
- Tarantola, S. Simlab 2.2 Reference Manual; Institute for Systems, Informatics and Safety, European Commission, Joint Research Center: Ispra, Italy, 2005. [Google Scholar]
- Saltelli, A.; Tarantola, S.; Campolongo, F.; Ratto, M. Sensitivity Analysis in Practice: A Guide to Assessing Scientific Models; John Wiley & Sons Ltd.: West Sussex, UK, 2004. [Google Scholar]
- Rossman, L.A.; Huber, W.C. Storm Water Management Model Reference Manual Volume I—Hydrology (Revised); EPA/600/R-15/162A; National Risk Management Laboratory Office of Research and Development, United States Environmental Protection Agency (USEPA): Cincinnati, OH, USA, 2016. [Google Scholar]
- Morris, M.D. Factorial sampling plans for preliminary computational experiments. Technometrics 1991, 33, 161–174. [Google Scholar] [CrossRef]
- Giglioli, N.; Saltelli, A. Simlab 2.2 Reference Manual; Institute for Systems, Informatics and Safety, European Commission, Joint Research Center: Ispra, Italy, 2008. [Google Scholar]
- Saltelli, A.; Chan, K.; Scott, M. Sensitivity Analysis. Probability and Statistics Series; John Wiley & Sons Ltd.: New York, NY, USA, 2000. [Google Scholar]
- Wang, J.; Forman, B.A.; Davis, A.P. Probabilistic stormwater runoff and water quality modeling of a highway in suburban Maryland. J. Hydrol. Eng. 2017, 23, 05017034. [Google Scholar] [CrossRef]
- Barco, J.; Wong, K.M.; Stenstrom, M.K. Automatic Calibration of the U.S. EPA SWMM Model for a Large Urban Catchment. J. Hydraul. Eng. 2008, 134, 466–474. [Google Scholar] [CrossRef]
- Ballinas-González, H.; Alcocer-Yamanaka, V.; Pedrozo-Acuña, A. Uncertainty Analysis in Data-Scarce Urban Catchments. Water 2016, 8, 524. [Google Scholar] [CrossRef] [Green Version]
Figure 1.
Location of the McClelland basin.

Figure 2.
Hydrologic outputs for SWMM-Lite variations of Default Parameters (DP), Limited Parameter Modification (LPM), and Consistent Parameters (CP) compared to SWMM.
Figure 2.
Hydrologic outputs for SWMM-Lite variations of Default Parameters (DP), Limited Parameter Modification (LPM), and Consistent Parameters (CP) compared to SWMM.

Figure 3.
Hydrologic outputs for scenarios using different models.

Figure 4.
Evaluation of percent change from baseline for each hydrologic output when comparing different models.
Figure 4.
Evaluation of percent change from baseline for each hydrologic output when comparing different models.

Figure 5.
Difference between SWMM and SWMM-LITE for runoff, infiltration, and evaporation under the Colorado design storm modeling scenarios (positive values show a higher estimate from SWMM-LITE compared to SWMM and negative values show a lower estimate from SWMM-LITE compared to SWMM).
Figure 5.
Difference between SWMM and SWMM-LITE for runoff, infiltration, and evaporation under the Colorado design storm modeling scenarios (positive values show a higher estimate from SWMM-LITE compared to SWMM and negative values show a lower estimate from SWMM-LITE compared to SWMM).

Figure 6.
Quantile-quantile chart of simulated models including SWMM and SWMM-LITE; (a) total runoff; (b) infiltration; and (c) evaporation.
Figure 6.
Quantile-quantile chart of simulated models including SWMM and SWMM-LITE; (a) total runoff; (b) infiltration; and (c) evaporation.

Figure 7.
Morris sensitivity analysis for (a) total runoff, (b) infiltration, and (c) and evaporation where dark blue shows sensitivity of noted parameter for SWMM-LITE and light blue for SWMM.
Figure 7.
Morris sensitivity analysis for (a) total runoff, (b) infiltration, and (c) and evaporation where dark blue shows sensitivity of noted parameter for SWMM-LITE and light blue for SWMM.


Table 1.
Input Parameters Applied to SWMM and SWMM-LITE models.
| Parameter | Description | SWMM | (DP) | SWMM-LITE (LPM) | (CP) |
|---|---|---|---|---|---|
| Overland Flow Length (m) | Overland flow path water must travel to calculate width to approximate a rectangular subcatchment | 3.66–629.9 | 47.2 1 | 51.7 2 | 51.7 |
| Width (m) 3 | Rectangular subcatchment width | 137–26,470 | 183,244 | 183,244 | 167,298 |
| Slope (%) | Rectangular subcatchment slope | 0.5–12.62 | 2.0 | 2.0 | 1.6 2 |
| Impervious (%) | Percent of land area (excluding the area used for LID controls) which is impervious | 1–99 | 49.5 2 | 49.5 2 | 49.5 2 |
| N-Impervious | Manning’s N for overland flow over the impervious portion of the subcatchment | 0.016 | 0.01 | 0.016 | 0.016 |
| N-Pervious | Manning’s N for overland flow over the pervious portion of the subcatchment | 0.25 | 0.3 | 0.25 | 0.25 |
| D-Store-Impervious (mm) | Depth of depression storage on the impervious portion of the subcatchment | 2.54 | 1.27 | 2.54 | 2.54 |
| D-Store-Pervious (mm) | Depth of depression storage on the pervious portion of the subcatchment | 7.62 | 5.08 | 7.62 | 7.62 |
| Zero-Impervious (%) | Percent of the impervious area with no depression storage | 5 | 0 | 5 | 5 |
| Max Infiltration Rate (cm/hr) | Maximum infiltration rate on the Horton curve. | 1.30 | 7.62 4 | 7.62 4 | 1.30 |
| Min Infiltration Rate (cm/hr) | Minimum infiltration rate on the Horton curve. | 1.27 | 1.27 4 | 1.27 4 | 1.27 |
| Decay Constant (1/h) | Infiltration rate decay constant for the Horton curve | 6.48 | 6.48 4 | 6.48 4 | 6.48 |
1 Overland flow length was determined as a function of NLCD land cover type. 2 Value represents the area weighted average of the SWMM model. 3 Widths were determined for each subcatchment based on subcatchment features in the complete SWMM model and was determined using the overland flow length for SWMM-LITE. 4 Infiltration parameters were collected from local design criteria by the Mile High Flood District in Denver, CO, for Type C soils [18].
Table 2.
Input parameters applied to tested models and for sensitivity analysis.
| Parameter | SWMM | SWMM-LITE | SWC | Range for Sensitivity Analysis |
|---|---|---|---|---|
| Overland Flow Length (m) | 3.66–629.9 | 51.7 1 | 45.7 | 10–1966 2 |
| Width (m) 3 | 137–26,470 | 548,875 | 14,520 | 42–34205 |
| Slope (%) | 0.5–12.62 | 1.6 1 | 2.0 | 0–50 |
| Impervious (%) | 1–99 | 49.5 1 | 49.5 1 | 0–75 |
| N-Impervious | 0.016 | 0.016 | 0.01 | 0.001–0.80 |
| N-Pervious | 0.25 | 0.25 | 0.3 | 0.01–0.80 |
| D-Store-Impervious (mm) | 2.54 | 2.54 | 1.27 | 0–2.54 |
| D-Store-Pervious (mm) | 7.62 | 7.62 | 5.08 | 2.54–7.62 |
| Zero-Impervious (%) | 5 | 5 | 0 | 0–100 |
| Max Infiltration Rate (cm/h) | 1.30 | 1.30 | 1.27 | 2.1–9.3 |
| Min Infiltration Rate (cm/h) | 1.27 | 1.27 | 1.27 | 0.06–3.0 |
| Decay Constant (1/h) | 6.48 | 6.48 | − 4 | 4.8–12.0 |
1 Value represents the average of the SWMM model. 2 Width was varied for sensitivity analysis and the range of overland flow length is estimated from the width values applied. 3 Widths between SWMM, SWMM-LITE, and SWC are not relatable due to differences in subunit sizes. 4 Decay Constant was not provided for SWC as the SWC only asks for a single hydraulic conductivity.
Publisher’s Note: MDPI stays neutral with regard to jurisdictional claims in published maps and institutional affiliations. |
© 2021 by the authors. Licensee MDPI, Basel, Switzerland. This article is an open access article distributed under the terms and conditions of the Creative Commons Attribution (CC BY) license (https://creativecommons.org/licenses/by/4.0/).
Share and Cite
MDPI and ACS Style
Dell, T.; Razzaghmanesh, M.; Sharvelle, S.; Arabi, M. Development and Application of a SWMM-Based Simulation Model for Municipal Scale Hydrologic Assessments. Water 2021, 13, 1644. https://0-doi-org.brum.beds.ac.uk/10.3390/w13121644
AMA Style
Dell T, Razzaghmanesh M, Sharvelle S, Arabi M. Development and Application of a SWMM-Based Simulation Model for Municipal Scale Hydrologic Assessments. Water. 2021; 13(12):1644. https://0-doi-org.brum.beds.ac.uk/10.3390/w13121644
Chicago/Turabian StyleDell, Tyler, Mostafa Razzaghmanesh, Sybil Sharvelle, and Mazdak Arabi. 2021. "Development and Application of a SWMM-Based Simulation Model for Municipal Scale Hydrologic Assessments" Water 13, no. 12: 1644. https://0-doi-org.brum.beds.ac.uk/10.3390/w13121644
Note that from the first issue of 2016, this journal uses article numbers instead of page numbers. See further details here.