
The Impact of Rainfall Movement Direction on Urban Runoff Cannot Be Ignored in Urban Hydrologic Management


1
State Key Laboratory of Simulation and Regulation of Water Cycle in River Basin, China Institute of Water Resources and Hydropower Research, Beijing 100038, China
2
Institute of Geographic Sciences and Natural Resources Research, Chinese Academy of Sciences, Beijing 100101, China
*
Author to whom correspondence should be addressed.
Water 2021, 13(20), 2923; https://0-doi-org.brum.beds.ac.uk/10.3390/w13202923
Submission received: 12 September 2021
/
Revised: 15 October 2021
/
Accepted: 15 October 2021
/
Published: 17 October 2021
(This article belongs to the Special Issue Application of Remote Sensing and GIS in Droughts and Floods Assessment and Monitoring)
Abstract
:Urban floods have been exacerbated globally, associated with increasing spatial-temporal variations in rainfall. However, compared with rainfall variabilities of intensity and duration, the effect of rainfall movement direction is always ignored. Based on 1313 rainfall scenarios with different combinations of rainfall intensity and rainfall movement direction in the typically rainy city of Shenzhen in China, we find that the effect of rainfall movement direction on the peak runoff may reach up to 20%, which will decrease to less than 5% under heavy rainfall intensity conditions. In addition, our results show that the impact of rainfall movement direction is almost symmetrical and is associated with the direction of the river. The closer rainfall movement direction is to the Linear Directional Mean of rivers, the larger is the peak runoff of section. Our results reveal that rainfall movement direction is significant to urban peak runoff in the downstream reaches, which should be considered in urban hydrological analysis.
1. Introduction
Extreme rainstorms have been increasing in urban areas due to continued global warming and rapid urbanization [1,2,3,4].This increase is expected to lead to an increment in urban runoff generation and, consequently, to the intensification of urban flood risks [5,6]. During 2010–2018, more than 160 cities in China suffered from floods each year [7]. Hydrological processes in urban areas are sensitive to small-scale temporal and spatial variations in rainfall [8]. Furthermore, the probability of extreme rainfall in urban areas is very likely to increase, with high spatial and temporal variabilities [9,10], yielding further uncertainties in urban runoff estimations and flood-related damages [11,12]. Understanding the impacts of spatial and temporal rainfall variabilities on runoff is significant for urban hydrologic management (e.g., urban drainage design and construction, forecasting and prevention of flood risk) [13,14,15] and the development of an Early Warning System (EWS) [16,17].
However, the interactions among extreme rainfall variability, river features and runoff responses remain poorly understood, especially in urban areas [11,18]. Such attributions require sufficient information about the spatial distribution of short-term rainstorms and runoff responses, which is lacking in measurements for the sudden rainfall process and the complex inhomogeneity of urban areas introduced by the building envelope. With the development of new instruments, techniques and methods for capturing rainfall and hydrological processes at high resolution, urban hydrological models, such as the Storm Water Management Model [19], have been proposed and applied in urban hydrologic management [20,21]. Although various components of rainfall variability such as the RI, rainfall duration spatial and temporal resolution, and degree of imperviousness are involved in previous studies, these components are far from complete. For example, similar extreme rainfall patterns of RI and rainfall duration in the same urban area may induce different flood damages. As a result, there remain critical errors and uncertainties in the impacts of rainfall variabilities on hydrological process such as runoff and floods [22].
Rainfall movement direction (RMD) is a significant component of rainfall variability [23,24,25,26,27,28,29] that is always ignored. While some studies have found no impact of RMD on hydrological responses [8,30], relatively few studies reported in the literature have remained inconclusive with respect to the impact of RMD on urban runoff. This contrast may be explained by (1) the limited RMDs observed from rainstorm events, which is almost fixed rather than 360 degree and lacks information in an urban area; (2) isolated analyses of the impacts of RMD were conducted in these studies by neglecting the interactions between RMD and the directions of urban river segments.
In this study, we focus on verifying whether RMDs play a significant role in generating peak runoff in urban areas. This paper is organized as follows: Section 2 introduces the study area and the experimental design. Results and discussion are given in Section 3, which also summarizes the main findings of the impact of RMD on runoff.
2. Materials and Methods
2.1. Study Area
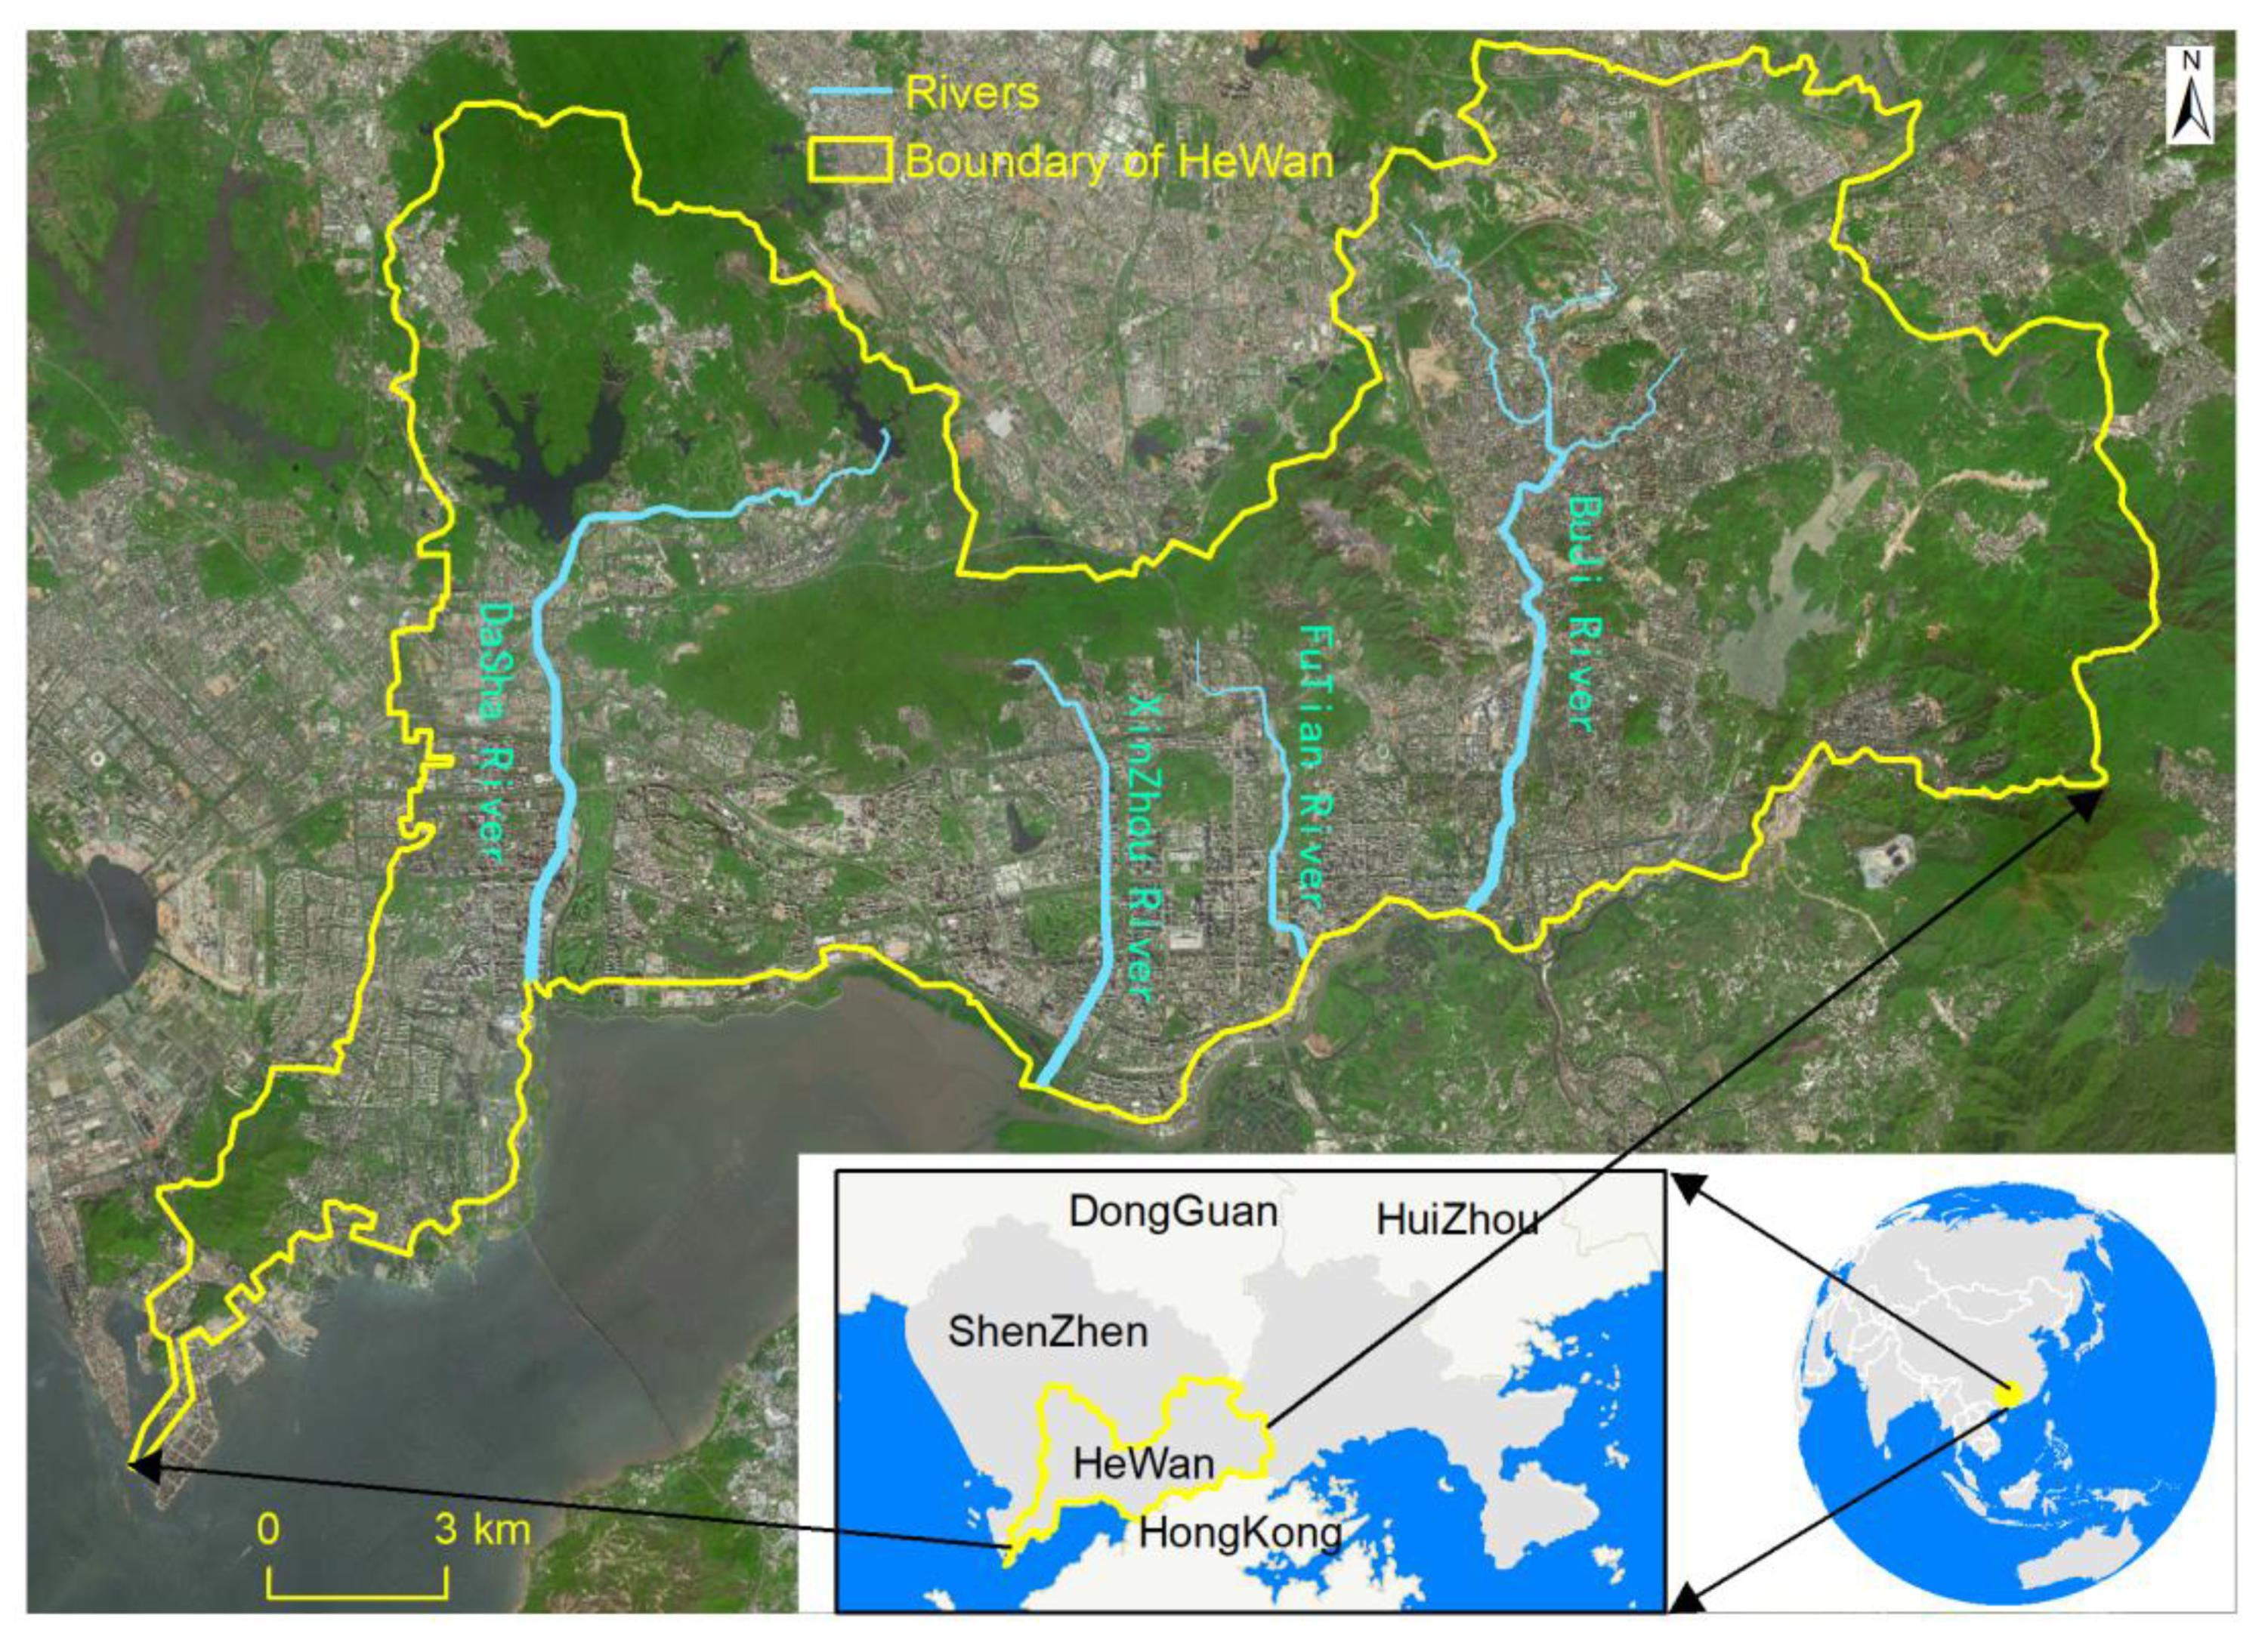
The typically rainy city of Shenzhen in China, with four urban rivers, is selected as the study area [31], this city has complete hydrological infrastructure and observation information systems. Shenzhen, located in the southeast coast of China, has the most rapid urbanization of any city in China with high urban flood risk caused by extreme rainfall. Shenzhen city ranks fifth among the 136 coastal cities in the world in terms of future flood loss risk [32]. Shenzhen city is a typical case study area, in which the spatial and temporal variations in rainfall is wide with rapid movement and obvious “squall line” [33]. Additionally, urban hydrological datasets are sufficient in Shenzhen, which is the benefit from a 30 million RMB project of building an urban flood model, which began in 2018. These datasets include underground pipe network data (nearly 3000 km), 1:1000 terrain data, 13 years of rainfall monitoring data, historical water level data, reservoir operation data, and more.
2.2. Methods
2.2.1. Construction of Rainfall Schemes
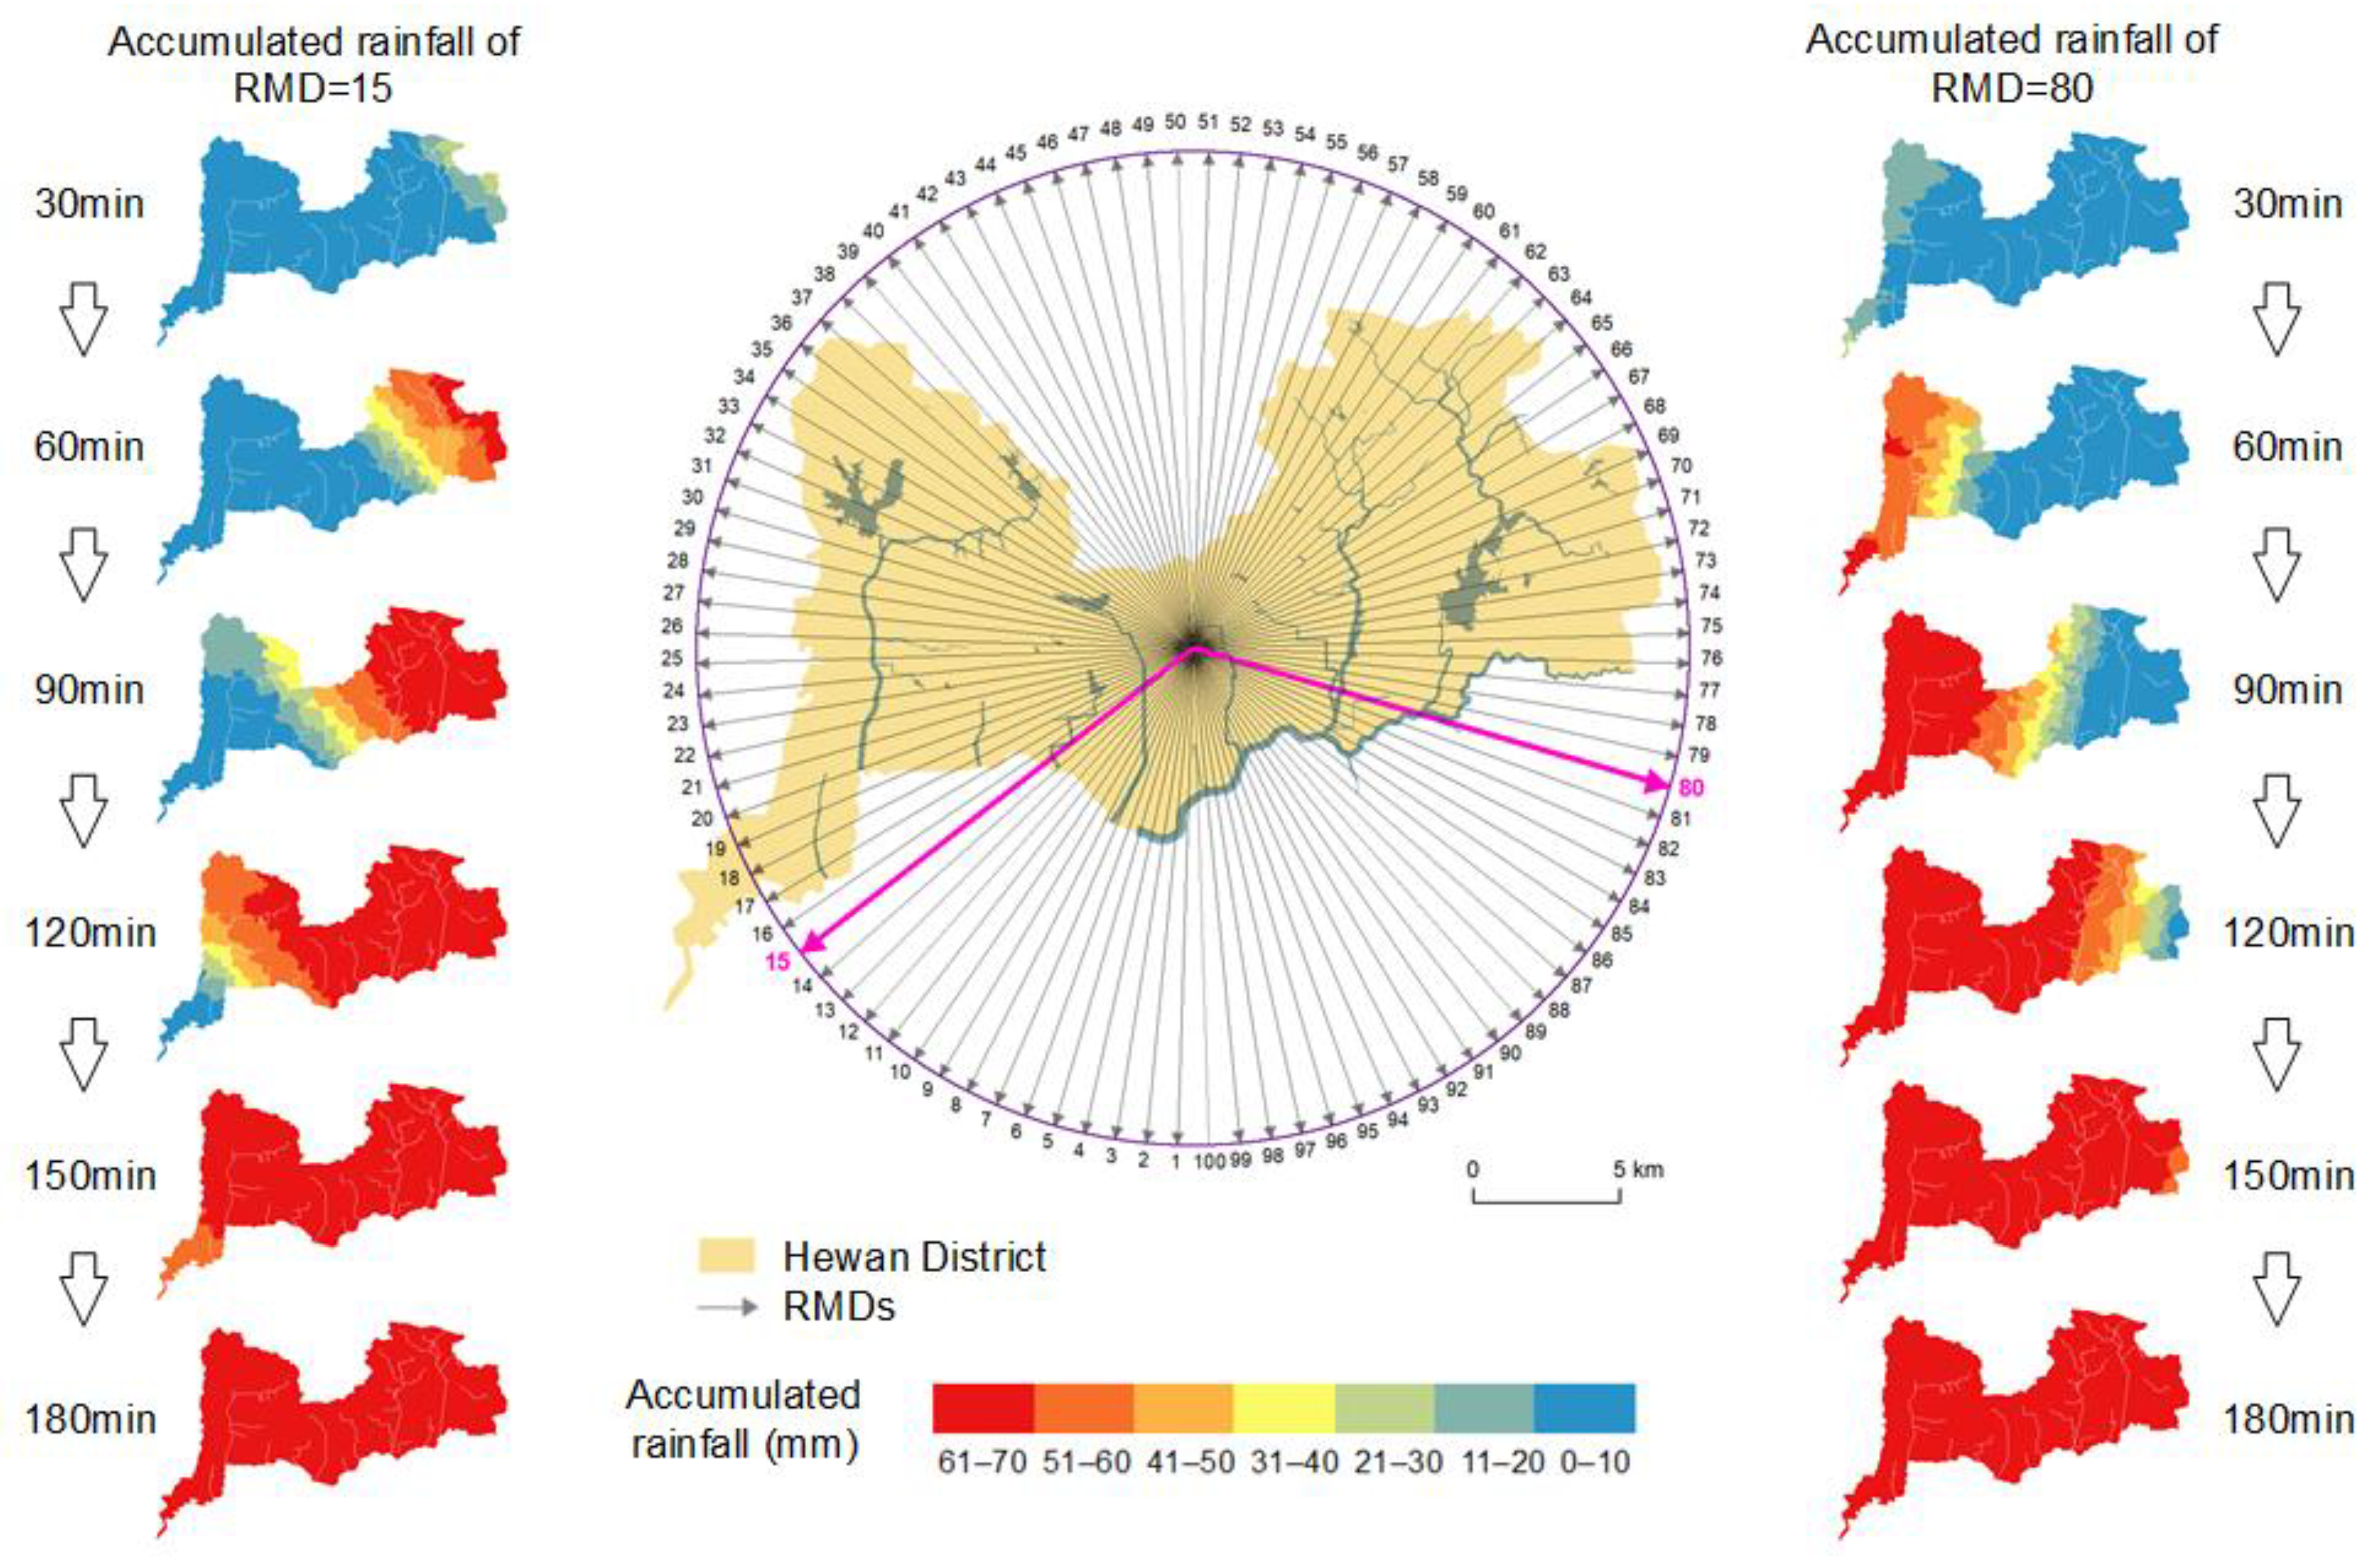
We designed the idealized experimental conditions of rainfall intensity (RI) and RMD to construct comprehensive rainfall schemes. According to the RI value of 132.7 mm/h recorded once every 1000 years in Shenzhen, we constructed 13 RIs with 10 mm intervals from 10 mm/h to 130 mm/h, and chose the commonly used Chicago rain pattern (Table 1) to represent short-term rainfall. In addition, 100 moving directions with equal intervals were designed to reflect the continuous RMD. We collected rainfall monitoring data from 63 meteorological stations in Shenzhen from 2008 to 2018, with a time resolution of 5 min. The rainfall events were extracted from the data and the rainfall center of every 5 min is calculated, then the moving speed of each rainfall events is calculated through the movement of the center. The average speed of all rainfall events is about 10 km/h.The asynchronous rainfall process of the whole basin is set to 3 h based on the average moving speed of the rainfall center (10 km/h) and the diameter of the circumscribed circle of the basin (30 km). By combining RI and RMD, 1300 rainfall processes (13 RIs × 100 RMDs = 1300) were constructed in Figure 1. The two rainfall distribution maps in Figure 1 show distributions when the RI is 80 mm and the RMDs are 15 and 80 respectively.
2.2.2. Runoff Numerical Simulation
We applied the IFMS/urban (Integrated Urban Flood Modeling System) platform, an urban flood simulation platform developed by China Institute of Water Resources and Hydropower Research, to simulate the runoff processes of the studied rivers (Figure 2). Before the simulations, the model was calibrated by the rainfall–runoff relationship measured from 2018 to 2020. Based on 1313 rainfall processes, we constructed a set of input conditions for the model, including the initial water level of each section, the previous rainfall, and the infiltration process; these conditions were kept consistent for comparison. We calculated the runoff processes of 414 sections in each scheme by using a parallel computing program and output the result to structured files in CSV format.
IFMS/urban model is a flood analysis model developed in China, which has been successfully applied in Shenzhen, Beijing, Chengdu, Shanghai, Foshan and other cities [34,35]. Its main modules include: (1) Flood simulation and analysis: River, lake, nearshore flow, flood simulation analysis and calculation of flood protection area and flood storage area; urban rainstorm and waterlogging, overflow (break) flood and dam break flood simulation Analysis; storm surge simulation and analysis; (2) Engineering scheduling simulation: reservoir and lake gate dam, weir, culvert, box culvert and pumping station and other water conservancy engineering facilities scheduling simulation; pipeline one-way valve control; lake reservoir, underground storage, tank storage, and so on. (3) Data management and pre-processing functions: 2D and 3D data and result display platform; data pre-processing (grid generation, pipeline processing, data management).
2.2.3. Index of Peak Runoff Deviation
We designed a concise index to describe the peak runoff deviation (Equation (1)):
where is the peak runoff deviation of a section caused by the rainfall scheme with RI = p and RMD = f, is the peak runoff (m3/s) of the section under the condition of a synchronous rainfall scheme with RI = p, and is the peak runoff (m3/s) with RI = p and RMD = f, where f ∊ 1, 2, …, 100.
In this paper, the values of 414 sections were extracted from all 1300 rainfall processes.
2.2.4. Rainfall Movement Direction and Flow Concentration Direction
The trend in a set of line features is measured by calculating the average angle of the lines, which called the “Linear Directional Mean”(LDM) in GIS [36,37]. The LDM often represents the paths of objects that move, such as rainfall. We use the LDM to represent the confluence direction above a certain river section (Equation (2)):
where is the angle between section i-1 and section i in the confluence area.
The LDM is adjusted according to the angle quadrant, and the adjusted LDM is between 0° and 360°:
The angle between the LDM and RMD is calculated as Equation (3):
where represents RMD, represents the LDM, and is between 0 and 180°.
2.2.5. Dynamic Clustering of Sections
We use the dynamic clustering machine learning method to classify the values of all sections. The value of each section in different RMD with same RI is used as the attribute to construct the sample set. The calculation is as follows:
where is section i and is the simulated result with RMD = f(1) and RI = p.
The dynamic cluster analysis method is used to classify the sections in Ω; then, the features of each subset, that is, the typical features influencing the peak runoff of the section, are extracted.
The k-means clustering algorithm is used to classify low dimensional with 4 steps:
(1) A total of r initial cluster centers is set up: , where p is the number of iterations.
(2) The distance from samples x to each cluster center is calculated,
where represents cluster j with the center of .
(3) The new center of each cluster is calculated. The new center of is calculated as follows.
where N is the number of samples contained in cluster and is sample i. using as the new cluster center, the clustering criterion function can be minimized:
where .
(4) If , j = 1, 2, …, r, then go to step (2); if , j = 1, 2, …, r, then cease the iteration.
In this paper, different r values are calculated, and the initial values of different cluster centers are selected for the k-means cluster analysis. Then, the rainstorms are divided into 3 modes. The mean value of each rainstorm is taken as a typical rainstorm mode.
In addition, we reconstructed the typical features of the river sections. With the inverse calculation of the principal component analysis, the low-dimensional array is reduced to a high-dimensional array to express the spatiotemporal process of each rainstorm. The i clustering centers are reconstructed into i × m matrices (Equation (6)):
where i is the number of rainstorm modes and m is the dimension of the original data.
3. Results and Discussion
3.1. Influence of Variation in RI and RMD Combinations on the Peak Runoff
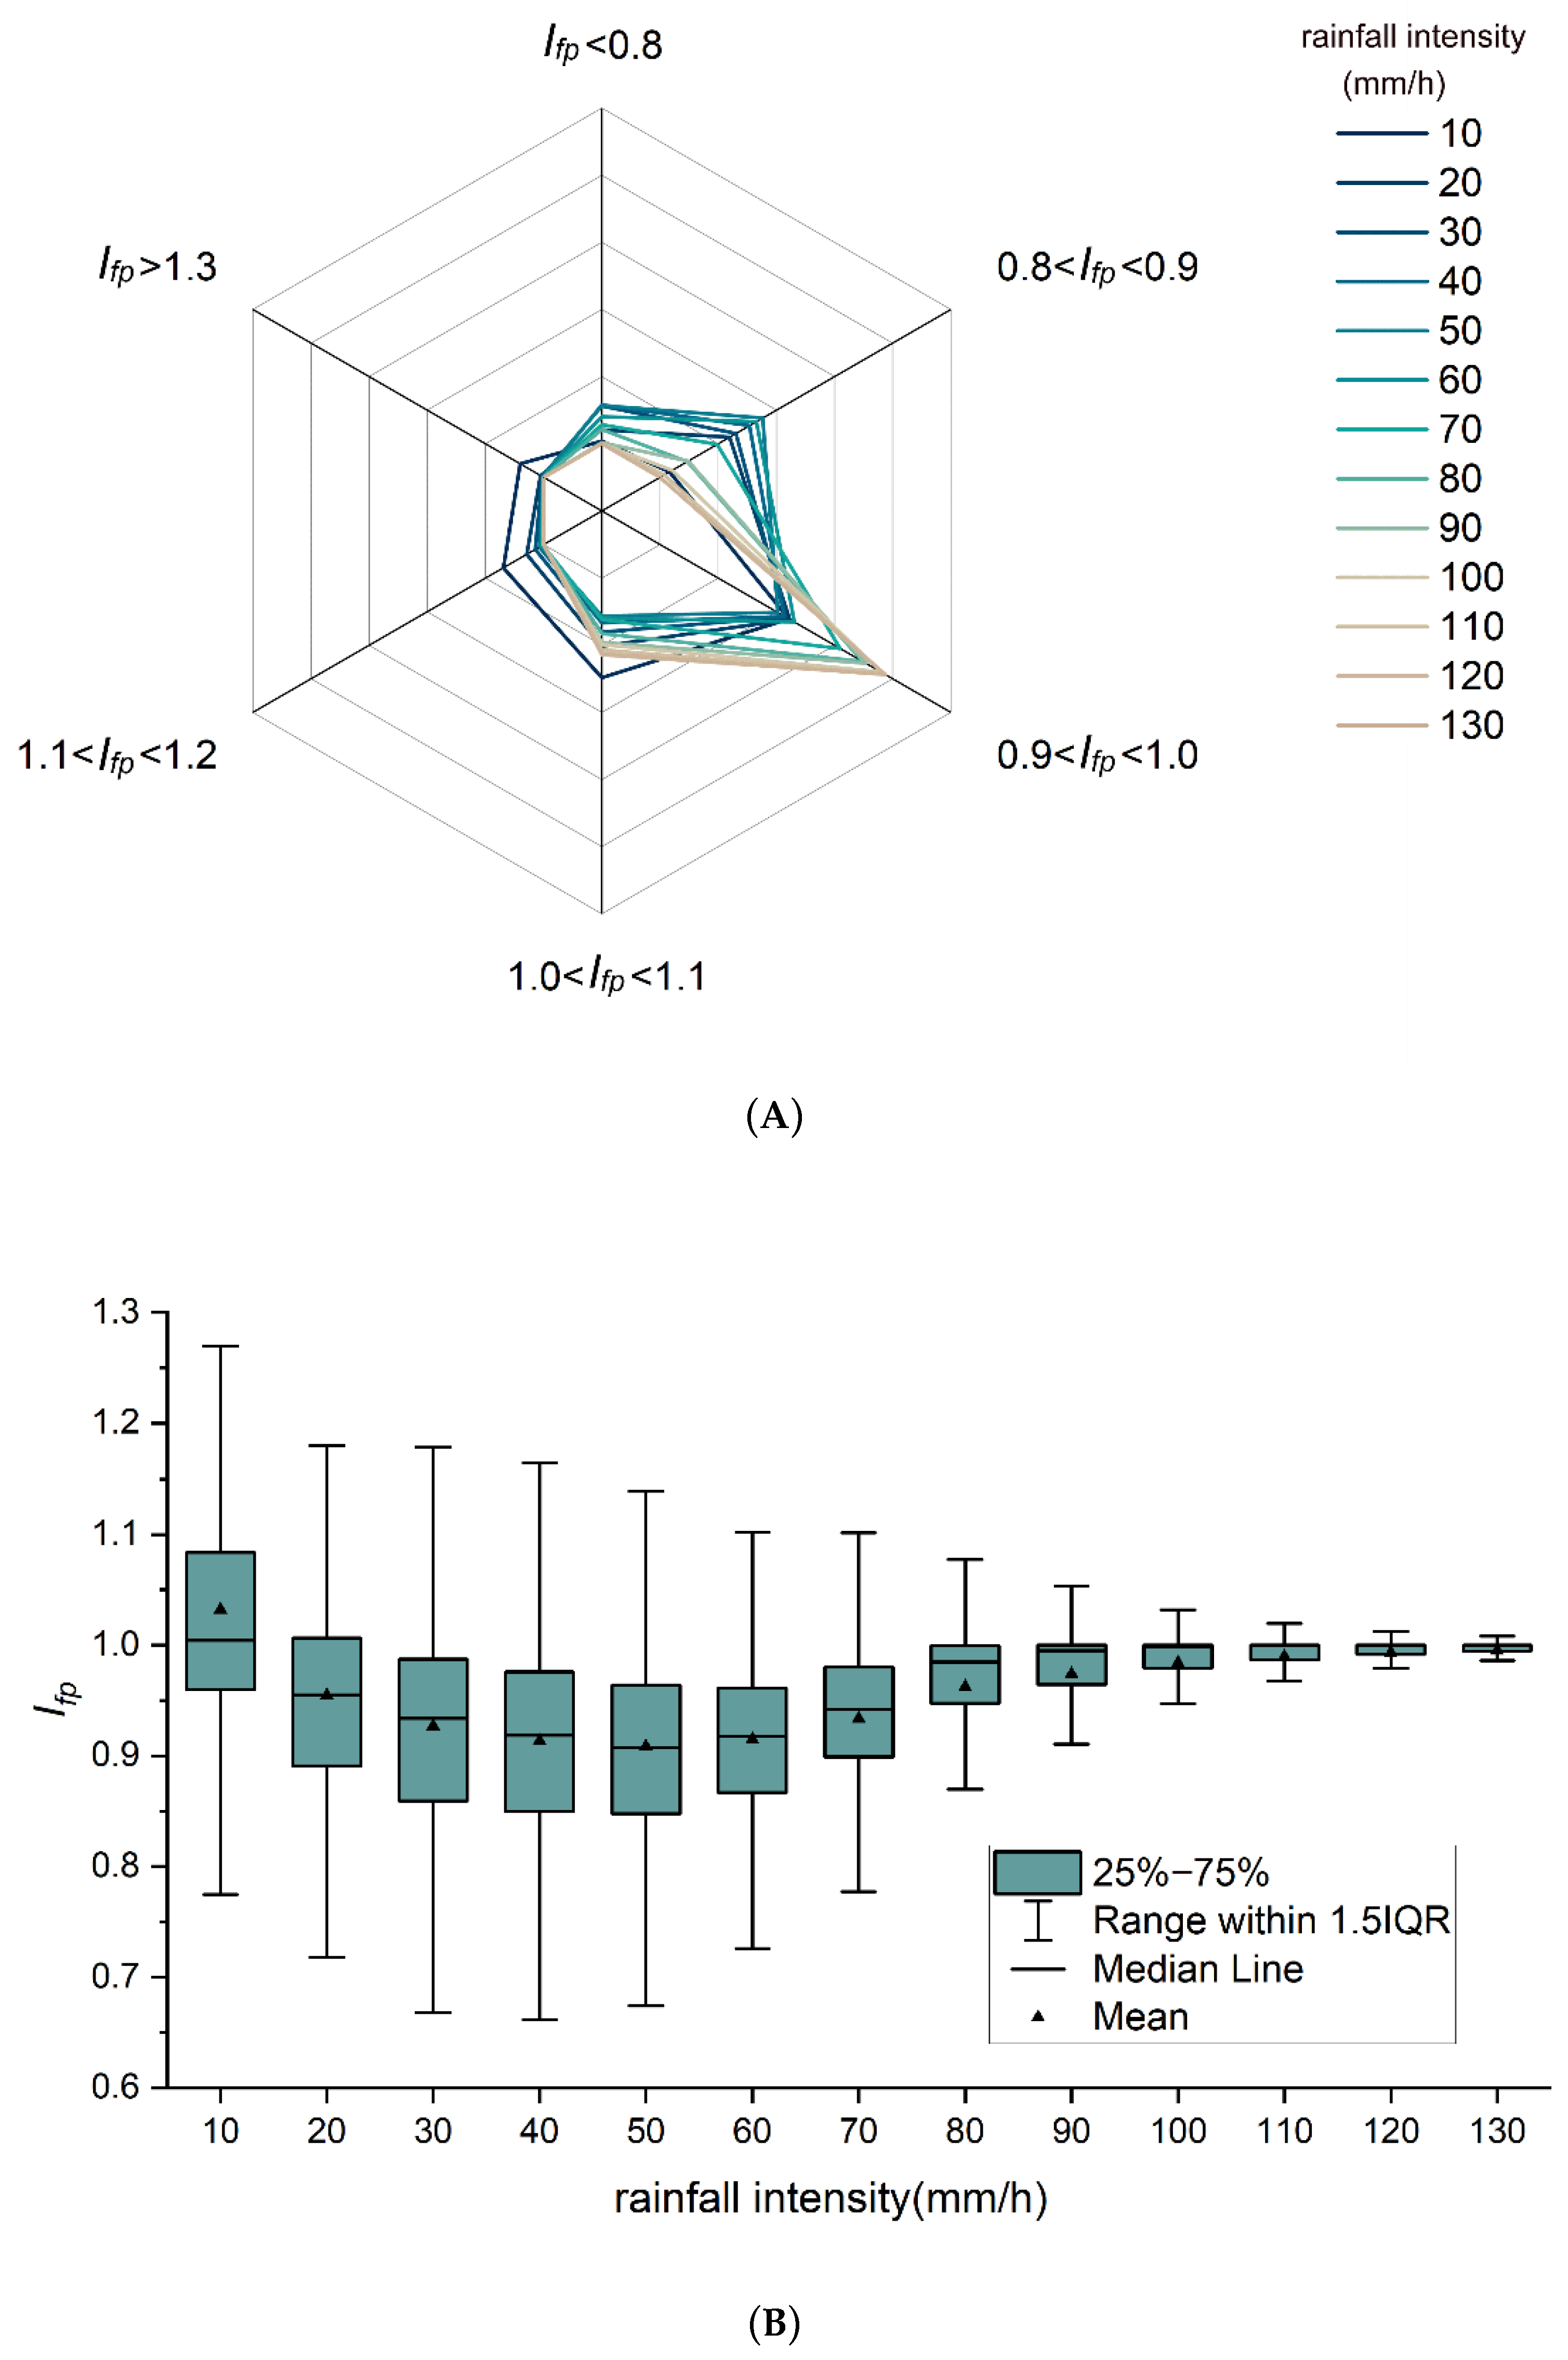
We found that the influence of variation in RI and RMD combinations on the peak runoff can reach 30% based on the index of peak runoff deviation (Ifp) in the study area. The statistics of 538,200 Ifps show that the variations in the RI and RMD are more likely to cause negative effects on peak runoff, with 77.1% of Ifps < 1.0 and 22.9% of Ifps > 1.0. However, this influence is always ignored, possibly due to most Ifps (83.3%) ranging from 0.9 to 1.1, indicating that the effect of these variations is smaller than 10% in most instances. Additionally, a heavy RI will reduce the effect of RMD on the peak runoff, with more concentrated of Ifps value of approximately 1.0 correspondingly with the more enhanced RI. We found that 96% of Ifps values ranged from 0.9 to 1.1 when RI > 70mm/h. Furthermore, the range of Ifps decreased to 0.95–1.05 when the RI reach an extreme value larger than the once-in-one-hundred-years value (100 mm/h). We also found that the duration of the peak runoff was lengthened with extremely high RI values (Figure 3), which is associated with the processes of drainage networks operating under maximum waterlogging-elimination capacities. Figure 3A shows that the heavier the RI is, the more concentrated the Ifp is between 0.9 and 1.1, and the number of Ifp values less than 1.0 is obviously greater than that of Ifp values more than 1 for all RIs. Figure 3B shows that with an increase in the RI, the fluctuation range of Ifp decreases obviously and tends toward 1.0.
3.2. Influence of Variation in RMD on the Peak Runoff
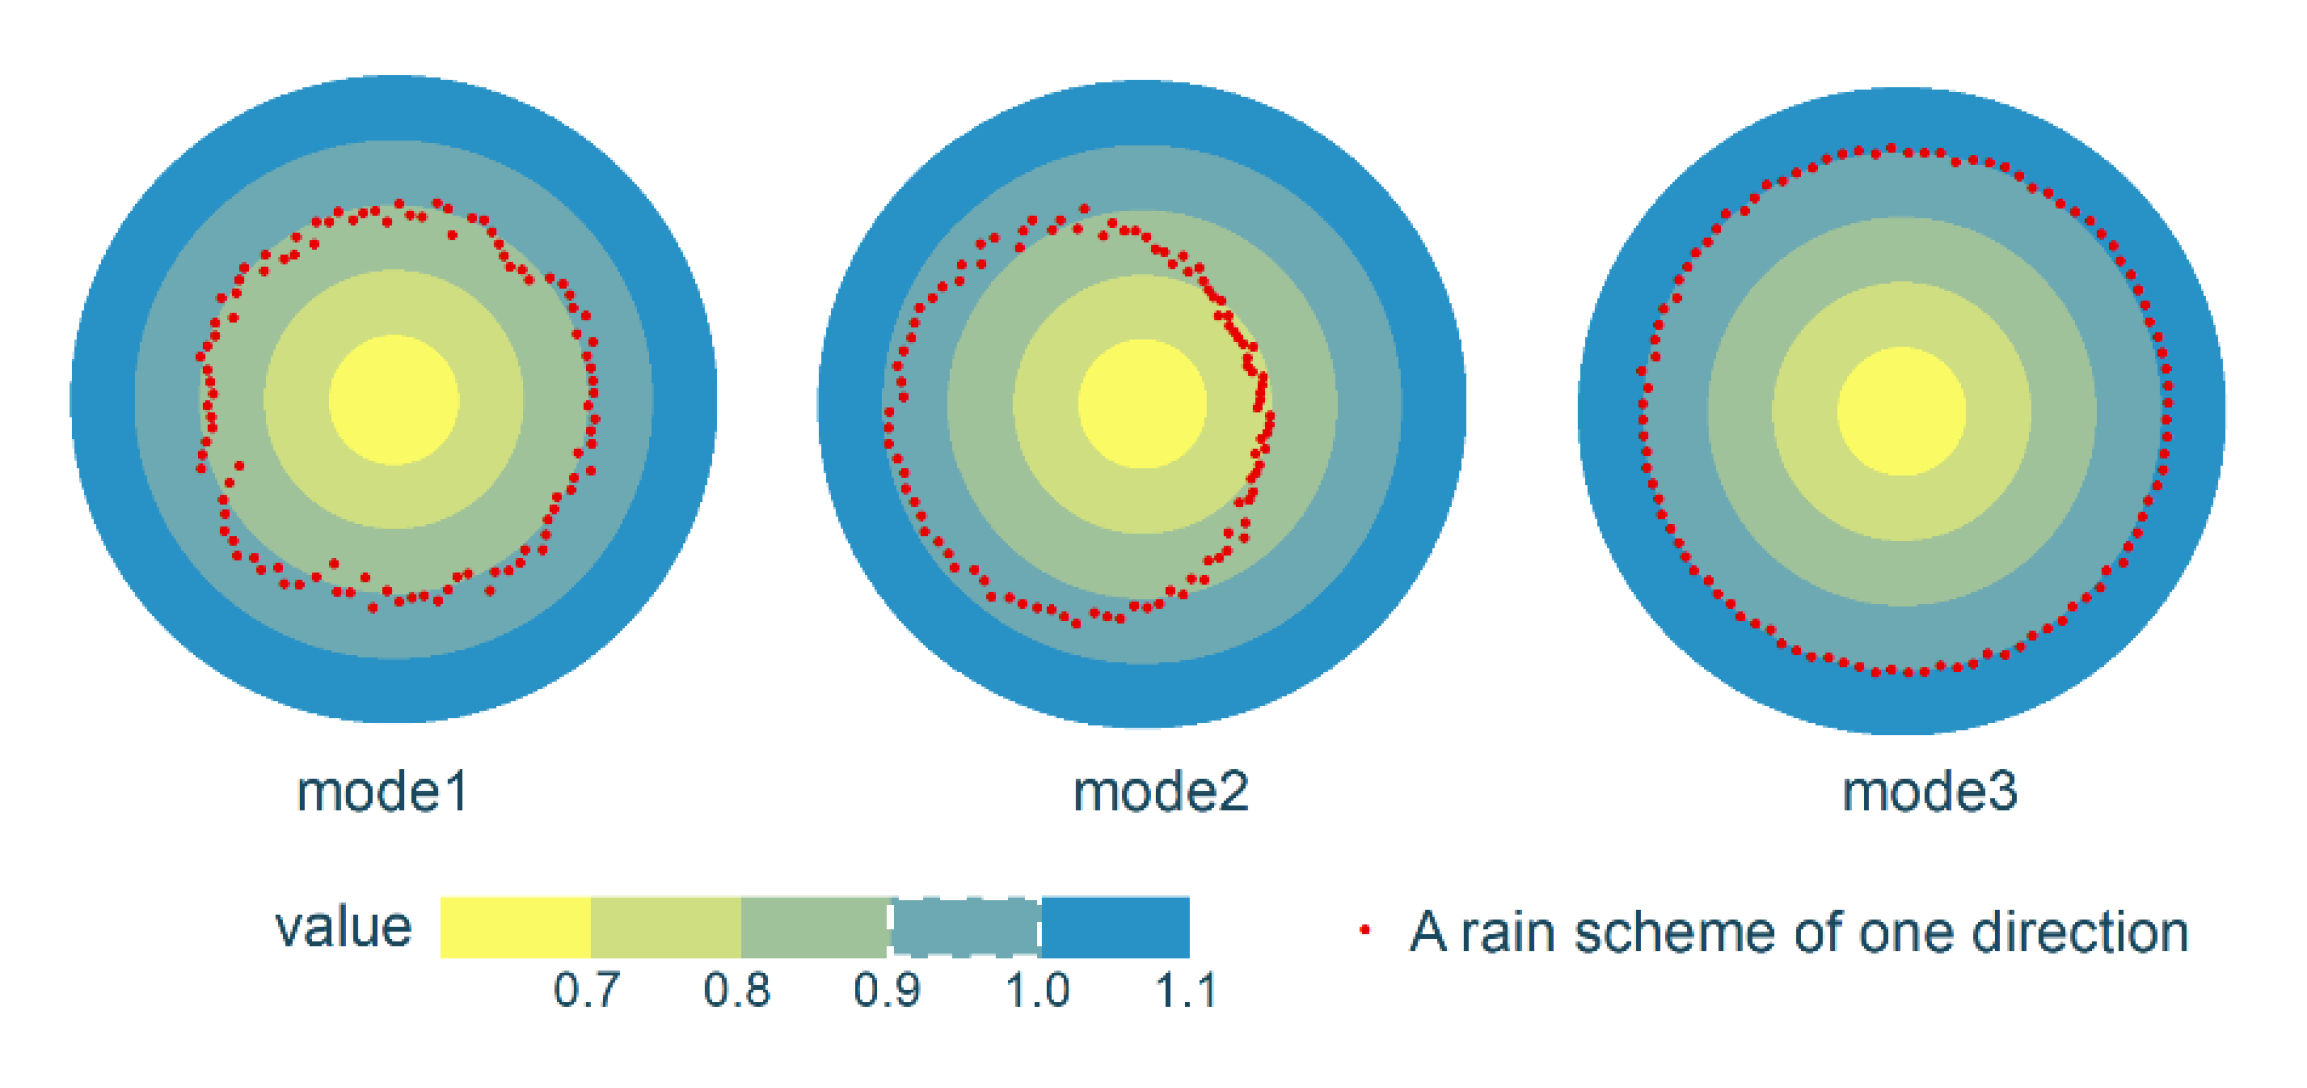
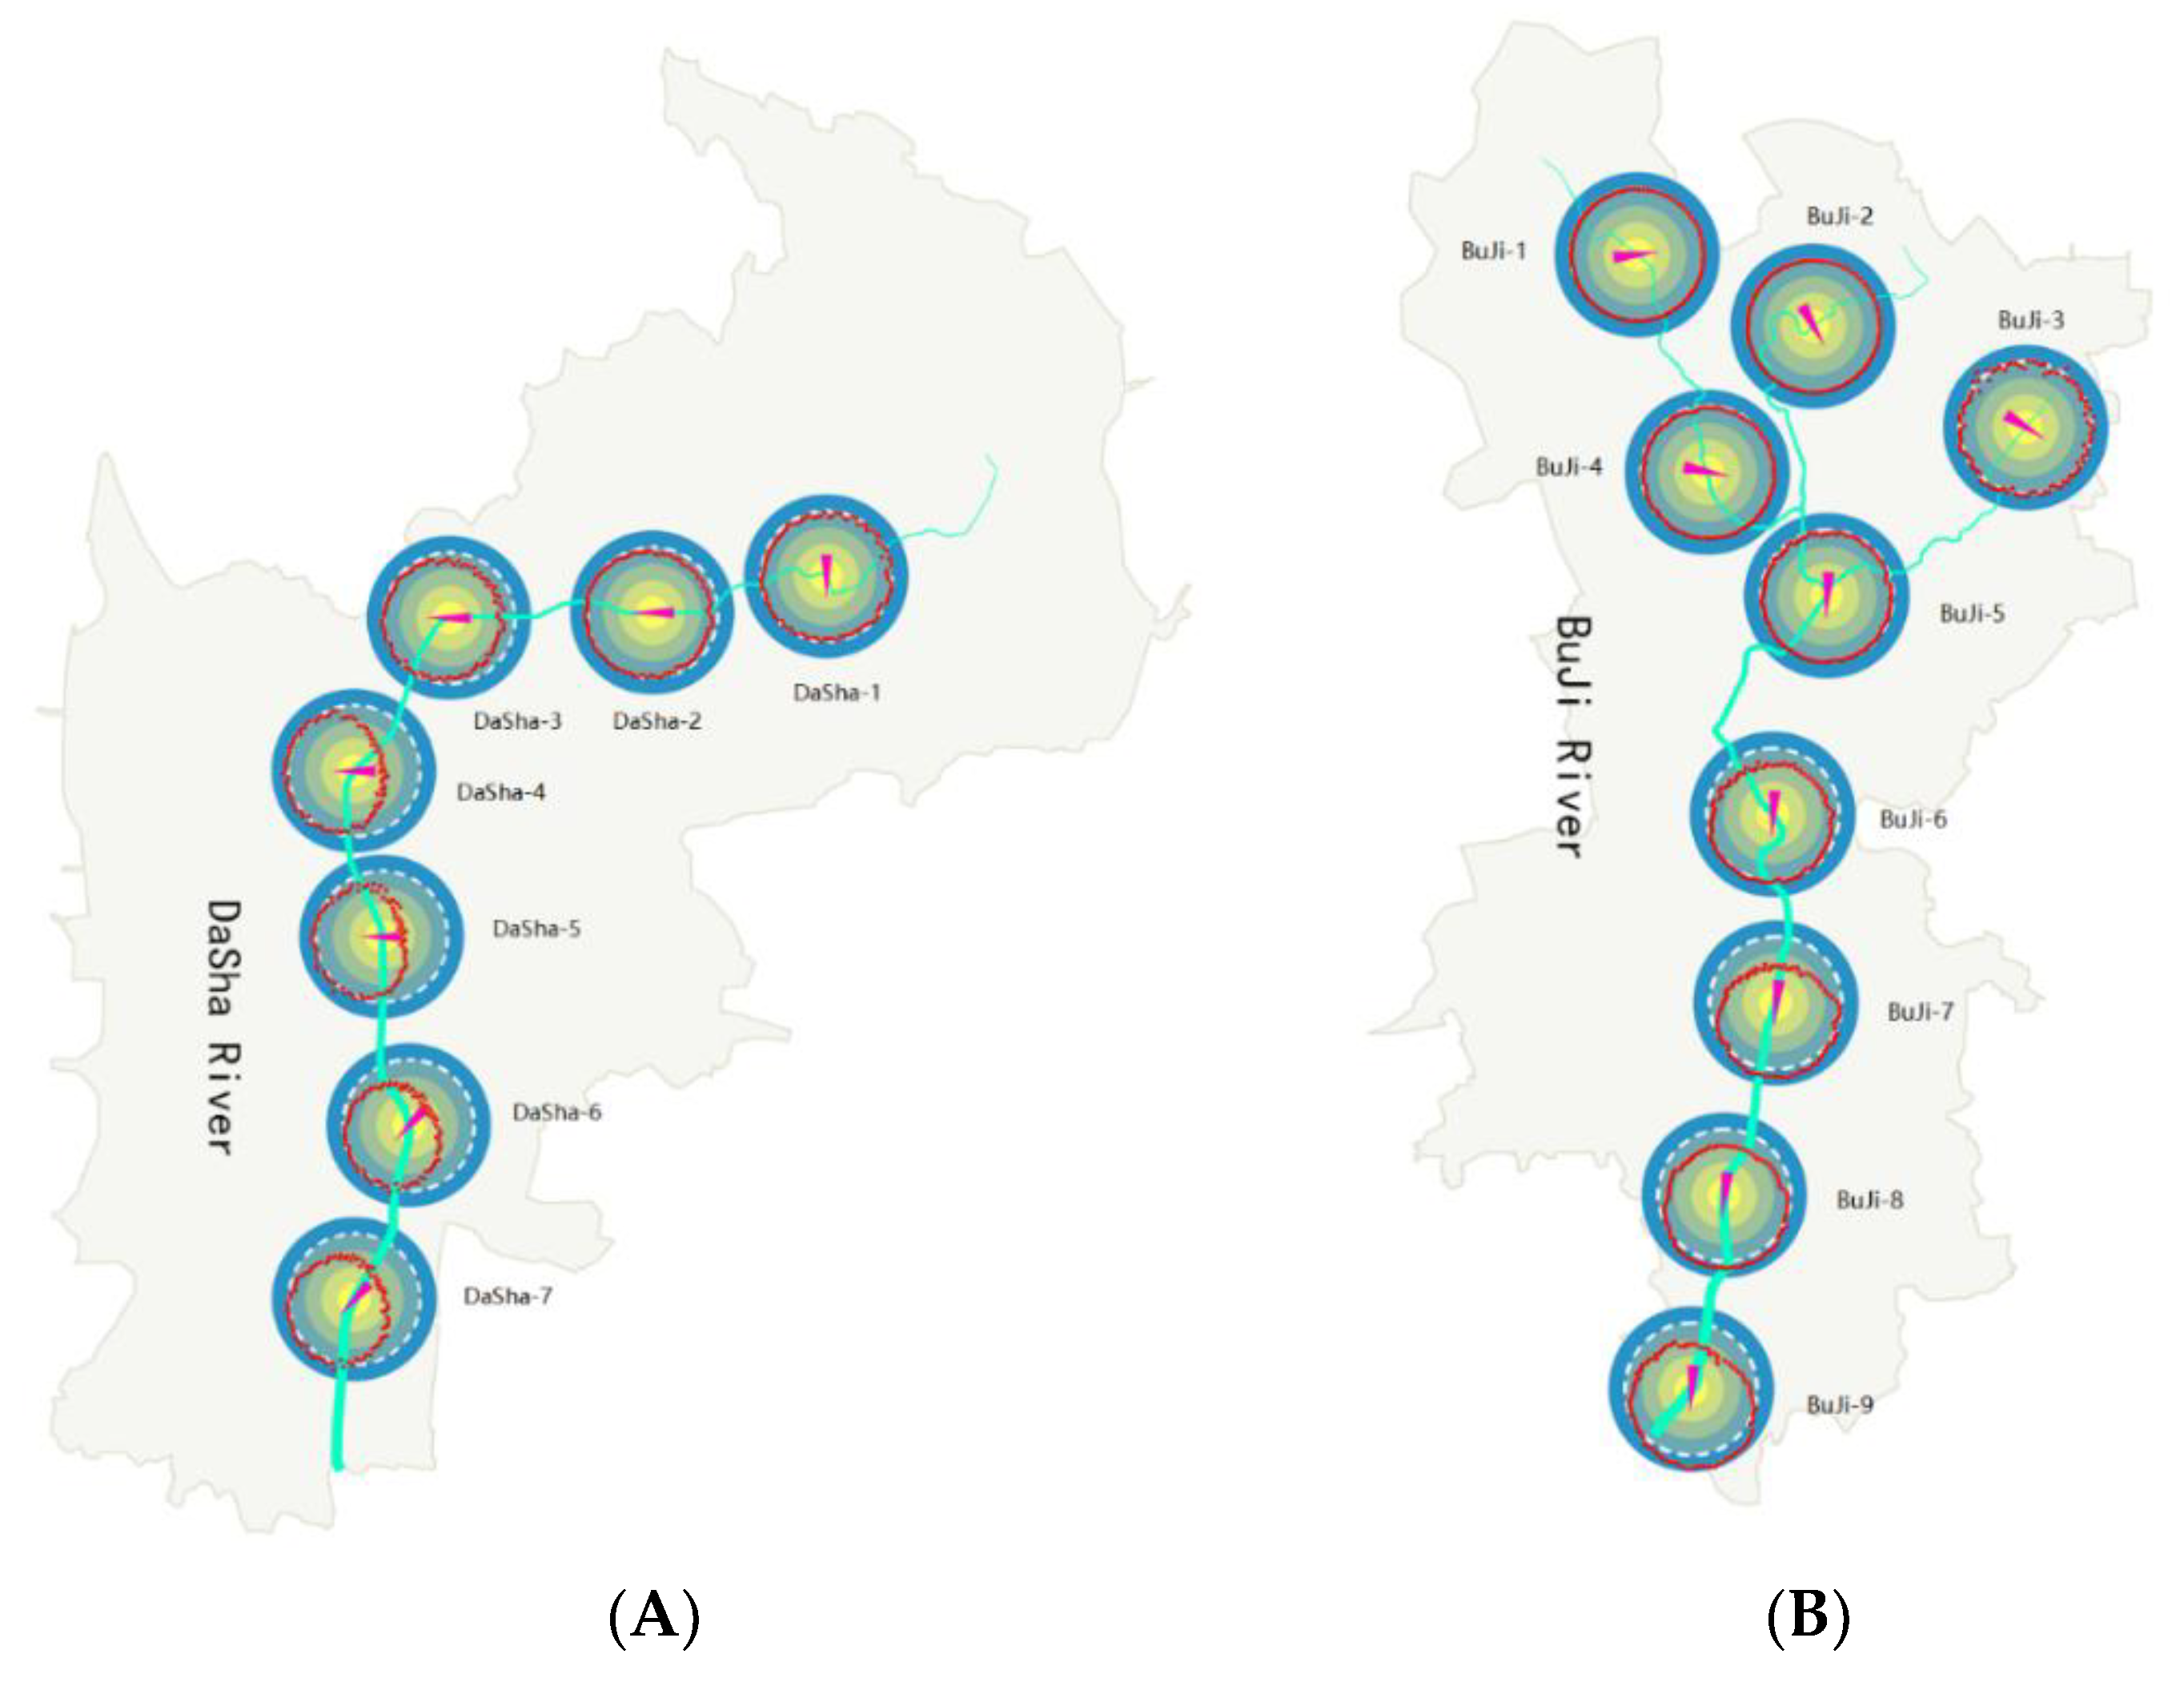
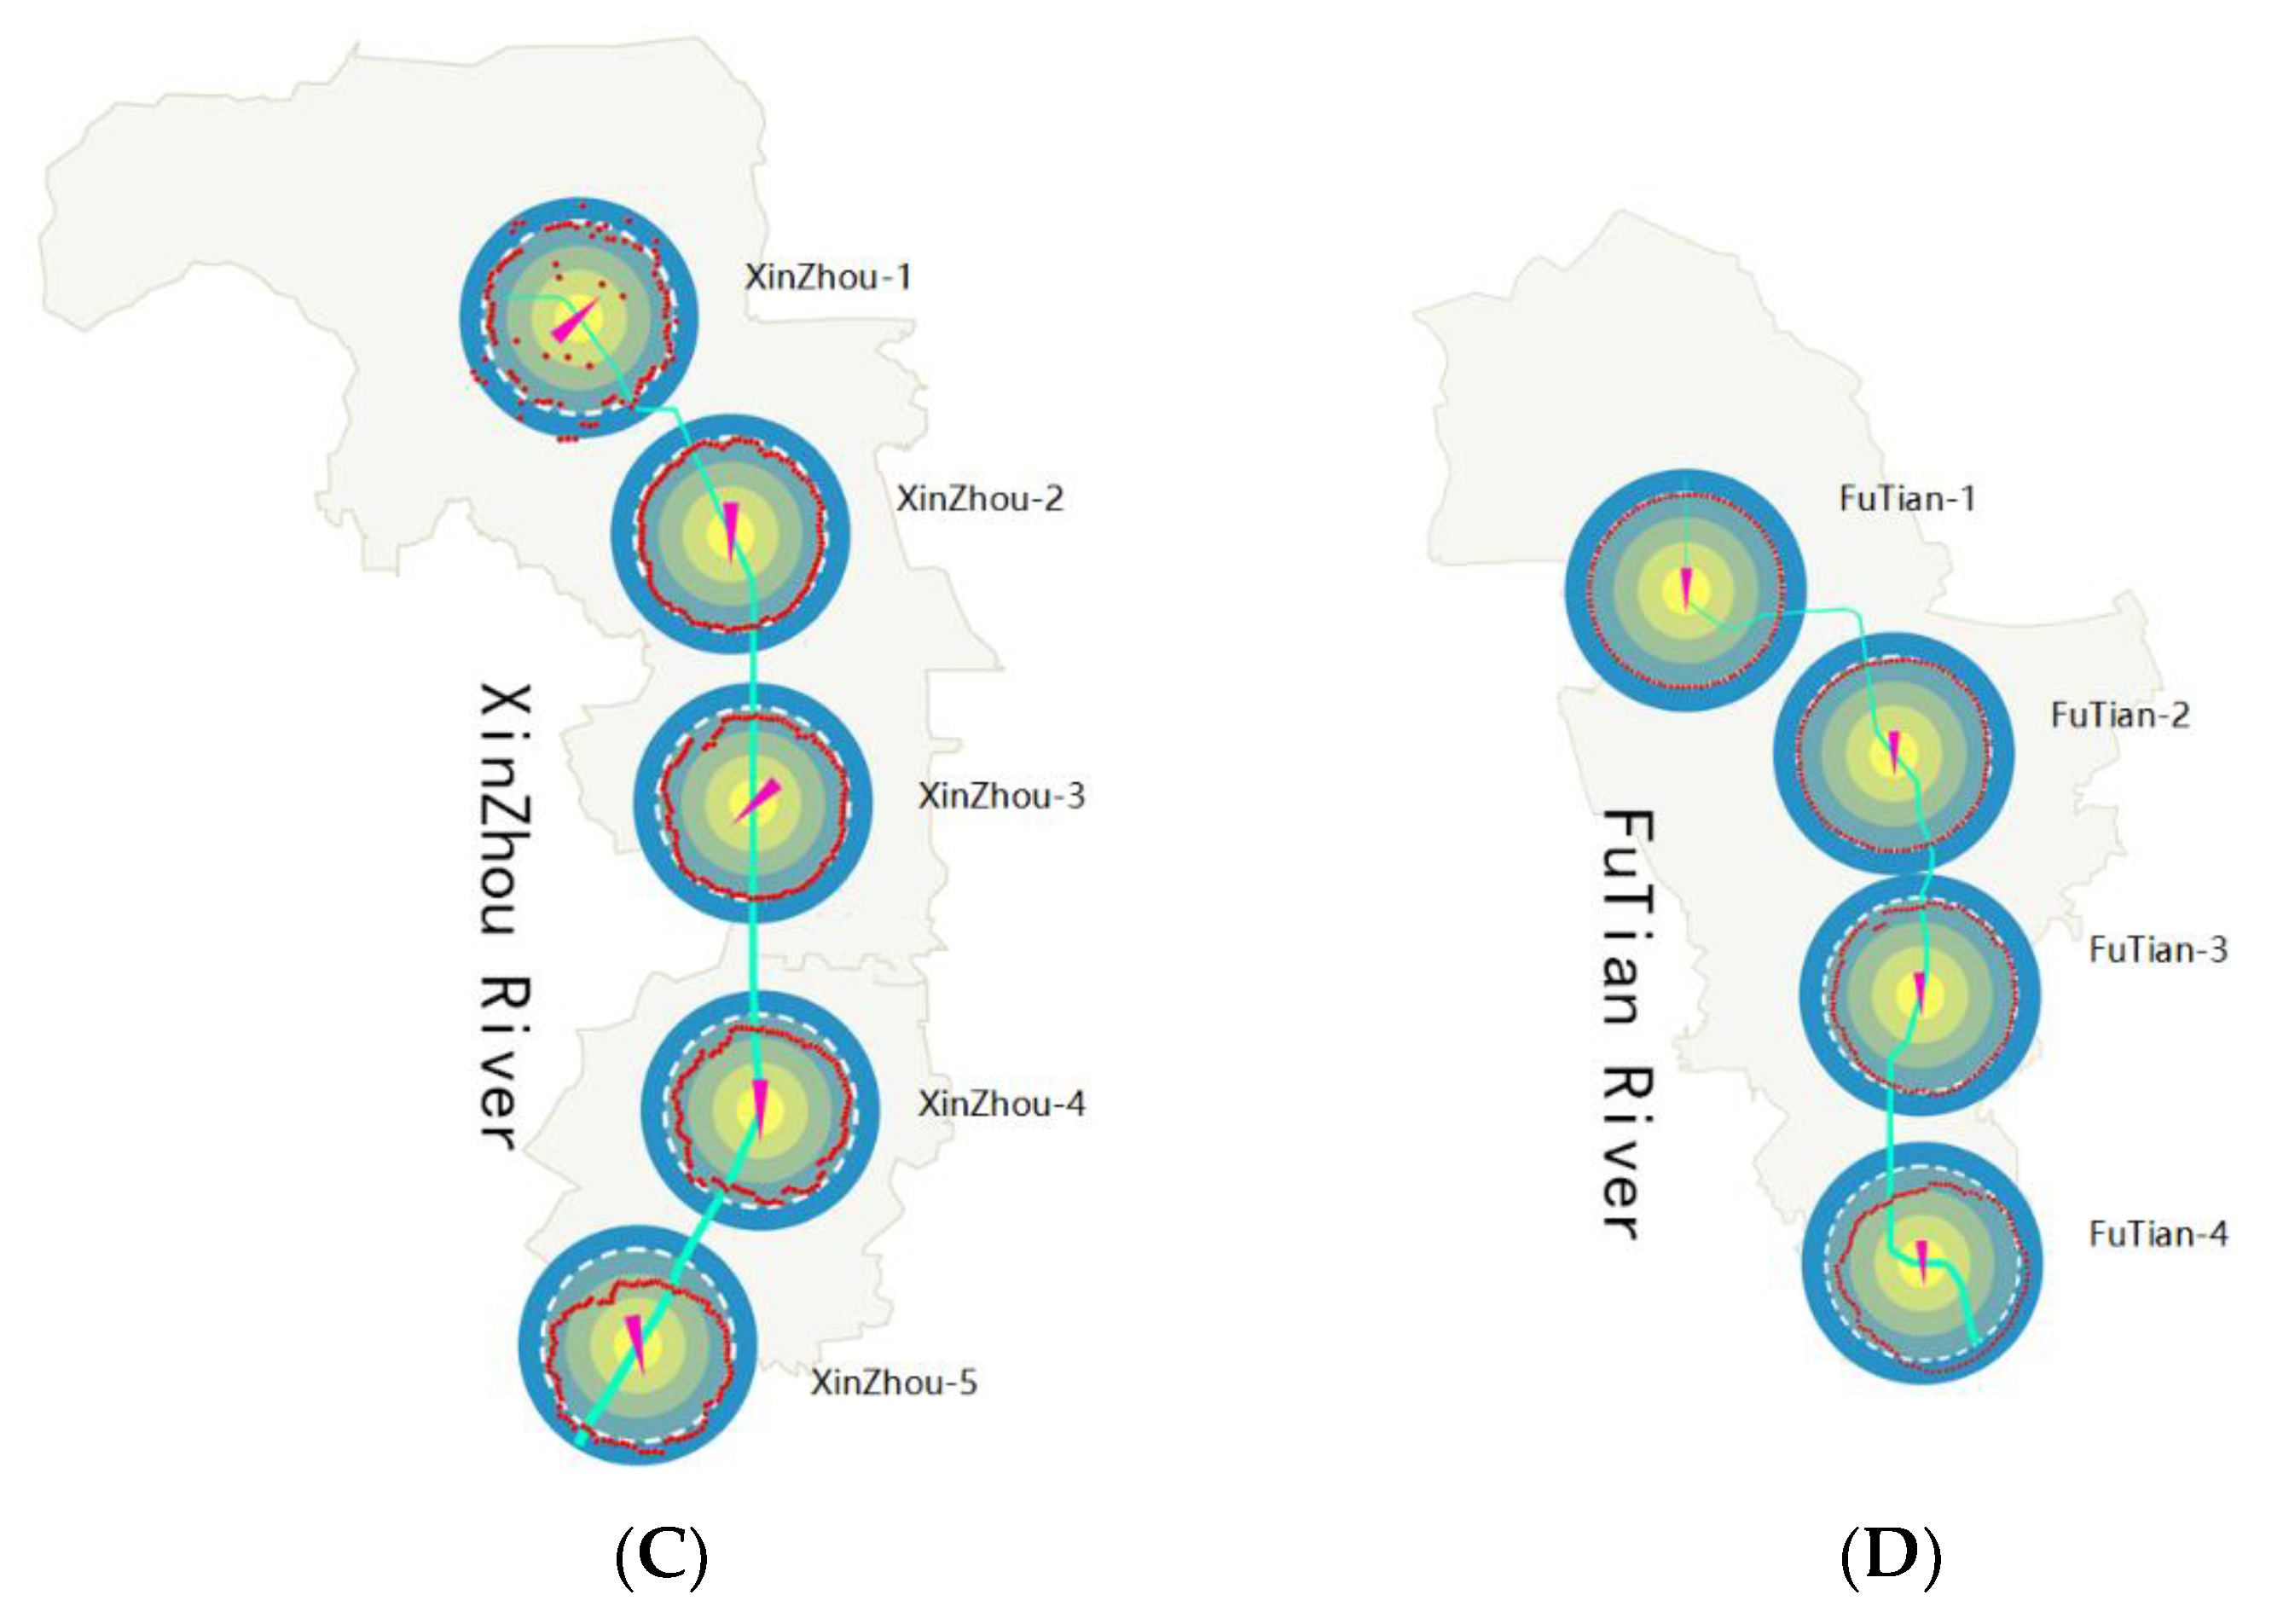
To estimate the impact of RMD, we isolate the effect of RMD from the RI by analyzing the spatial pattern of the RMD impact under similar RI. Based on the dynamic clustering of 414 sections with 100 RMDs each, we do find three typical patterns with proportions of 42%, 21% and 37% of total number of sections, including (1) model 1 shows a nondirectional effect of RMD by reducing the peak runoff with most Ifps < 1.0; (2) model 2 shows an obvious directional effect of RMD with a symmetrical distribution of Ifps, in which the minimum effect of direction is opposite to direction of the maximum; (3) model 3 shows completely no obvious effect of RMD on peak runoff neither in direction nor in magnitude with Ifps approximately equal to 1.0 (Figure 4).
Spatially, these three models are primarily related to the location of sections in rivers (Figure 5).
Figure 5 shows that the in lower reaches of the rivers, the larger the variation range of Ifp is, the more symmetrical is the influence. In model 1 and model 3, the influence of RMD on the peak runoff is negligible in the upper reaches of the river. However, model 2 shows symmetrical variations in the lower reaches of the river. We also find that the river length potentially influences the RMD effect. Taking four rivers in Shenzhen as an example, the Dasha River and Buji River show the effect of model 2 from middle reaches to lower reaches. While, this effect occurs at the ends of the lower reaches in the other two rivers, Xinzhou River and Futian River, the lengths of which are just half of the two aforementioned rivers. The impact of RMD on the peak runoff is primarily present in the lower reaches, possibly due to the longer duration and larger area of the flow concentration that gradually increased the asynchrony of rainfall with the peak runoff. Furthermore, we find a slightly jagged shape in models of Ifps compared with the natural watershed, which may be explained by the uneven distribution of underground pipes used to drain flows into rivers in urban areas and their corresponding covering areas. In rapidly urbanizing area, the lack of pipe network datasets will increase the complexity of urban flood analyses.
3.3. How RMD Affect the Peak Runoff across Rivers
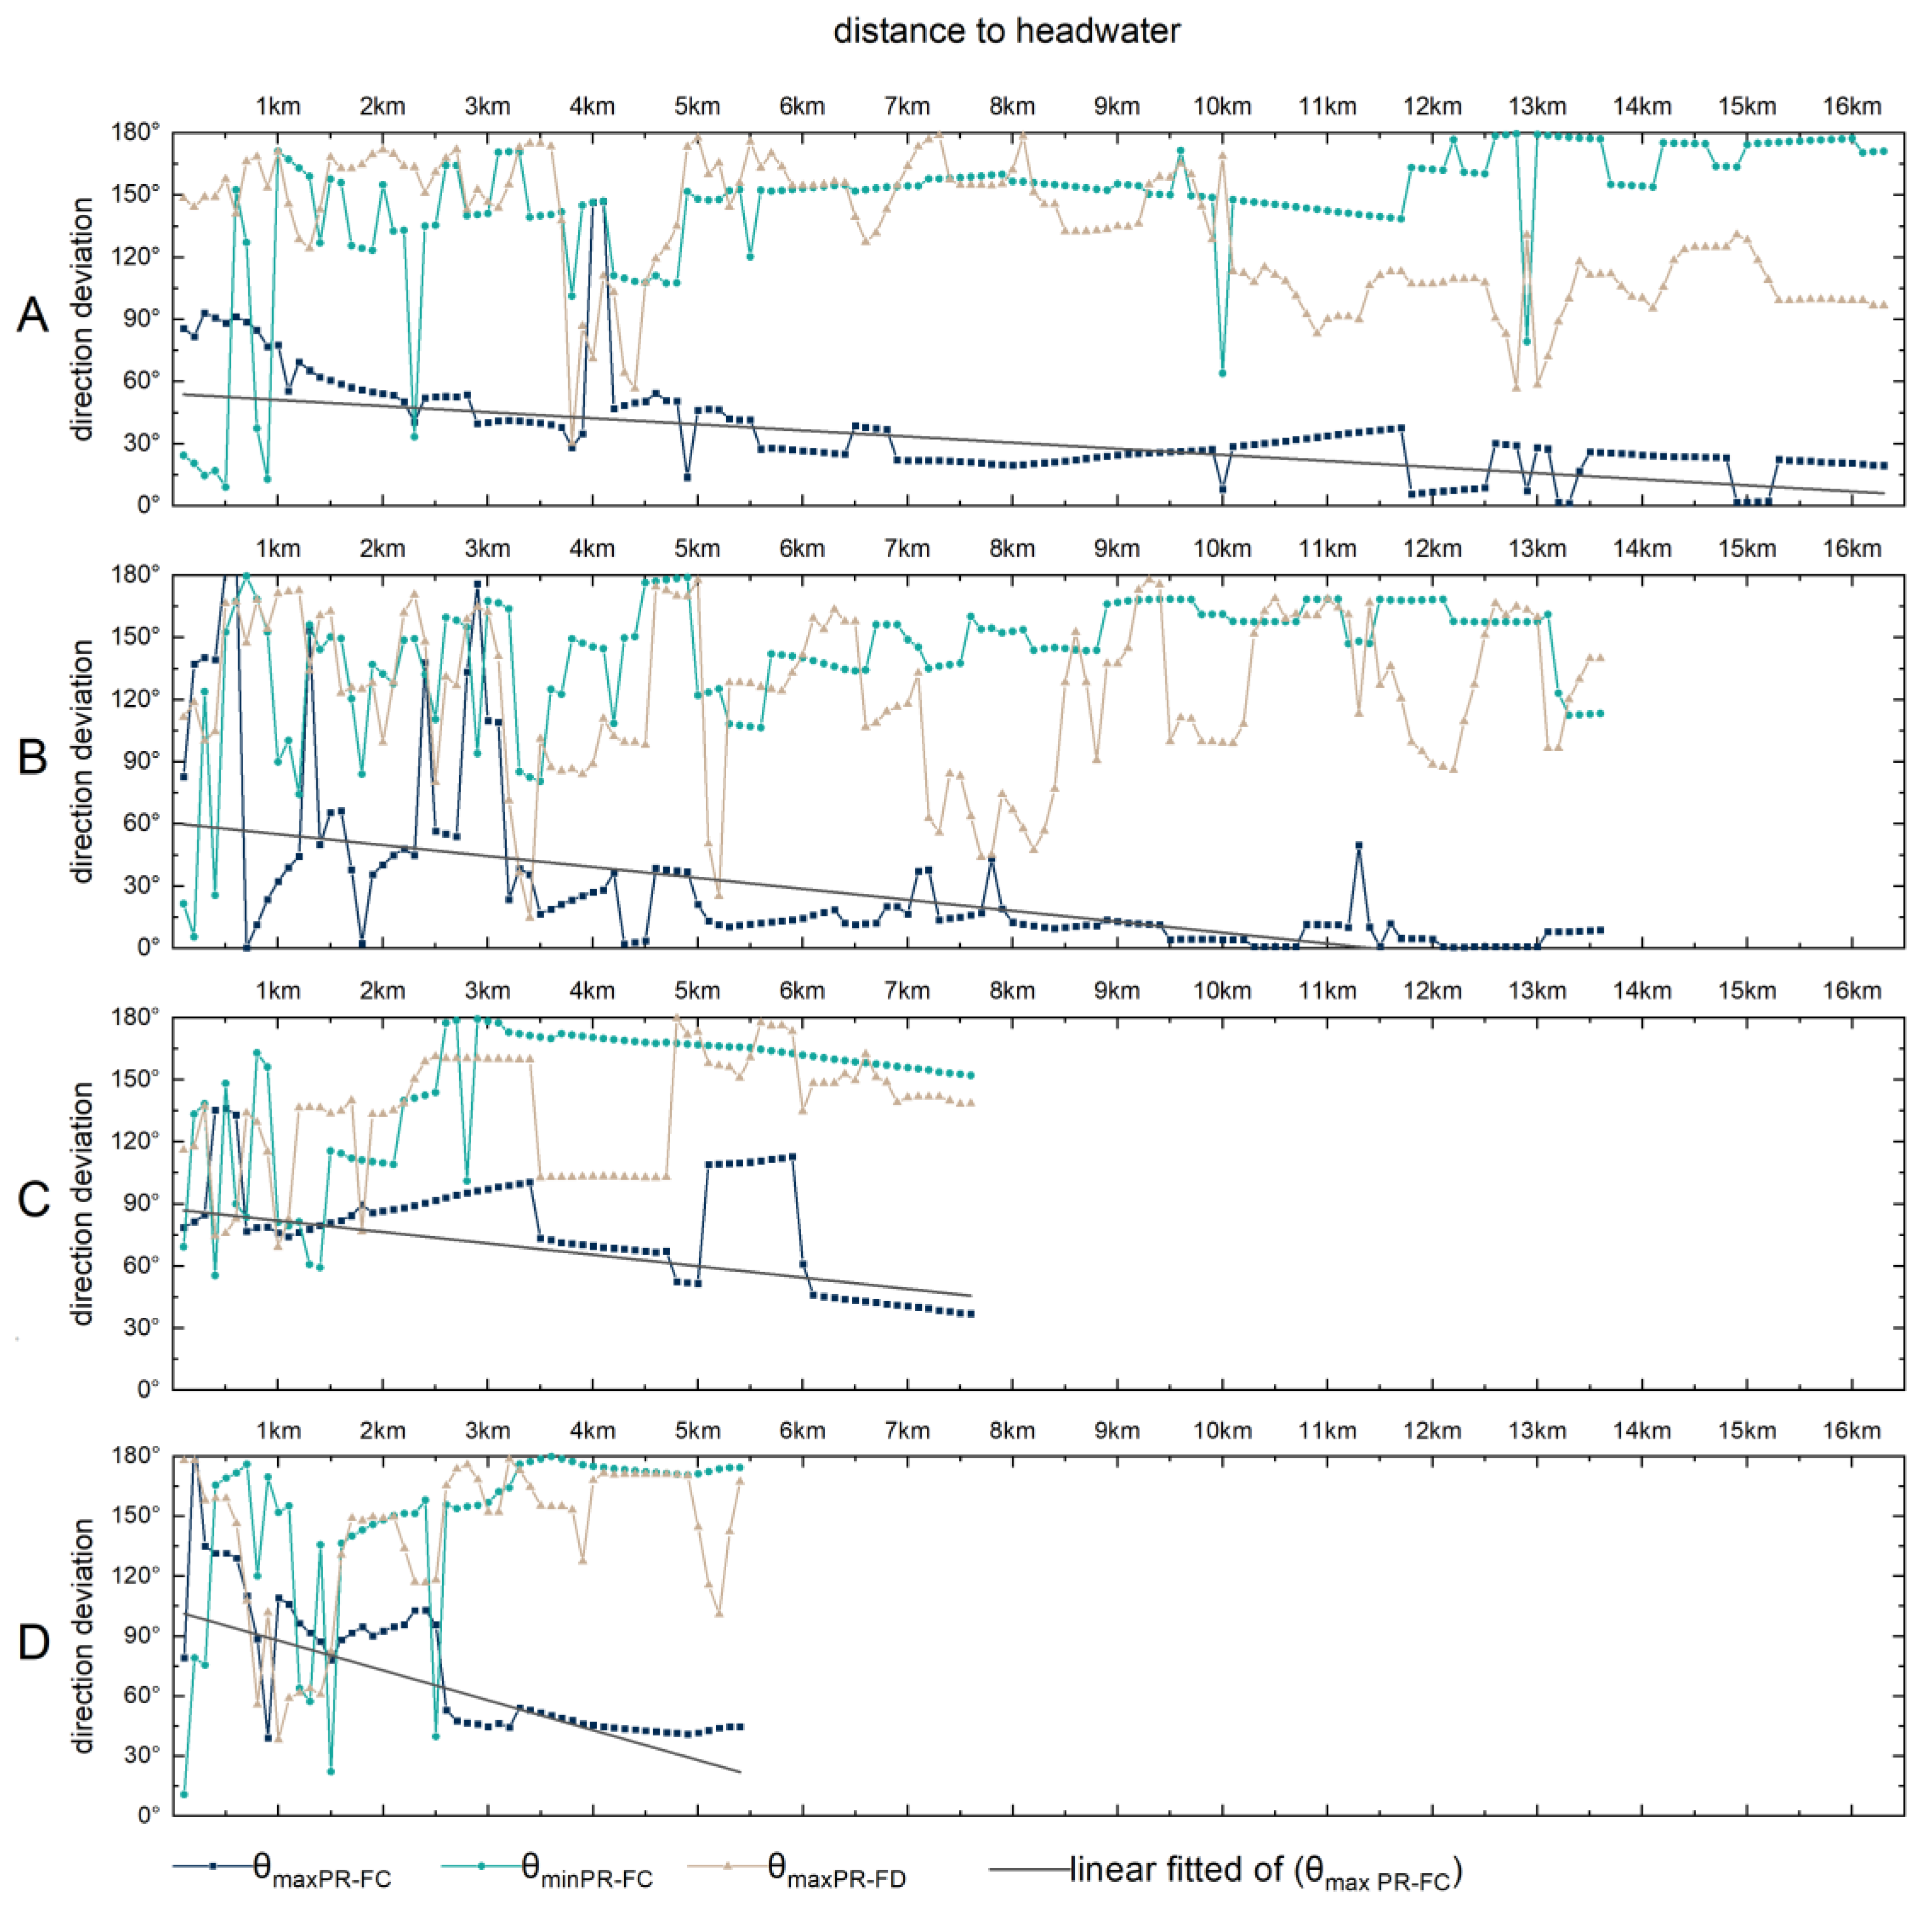
To further understand how RMD affect the peak runoff, we calculated three angles of sections: θmaxPR-FC (the angle between RMD with maximum peak runoff and flow concentration direction), θmin PR-FC (the angle between RMD with minimum peak runoff and flow concentration direction) and θmax PR-FD (the angle between RMD with maximum peak runoff and flow direction). In this paper, we used “Linear Directional Mean” (LDM) to represent the flow concentration direction, which is the geometric mean of all the reaches upstream. In contrast with the flow direction, we do find a significant relationship between RMD and the flow concentration direction during maximum peak runoff (Figure 6), with decreasing trends of θmaxPR-FC from upstream to downstream. For example, the angles of the second half of downstream reaches of the Buji River are almost smaller than 20°, and some sections even reach 0°. In contrast, θminPR-FC is gradually increased with the opposite RMD to θmaxPR-FC, which is consistent with the result of model 2 shown in Figure 4. Additionally, the θmax PR-FC values are larger in more meandering rivers (e.g., Dasha River) than in rivers with straight channels (e.g., Buji River). We can therefore conclude that RMD is a significant factor to peak runoff downstream in urban areas, and this influence is not isolated but needs to be combined with the spatial feature of rivers such as direction and bending.
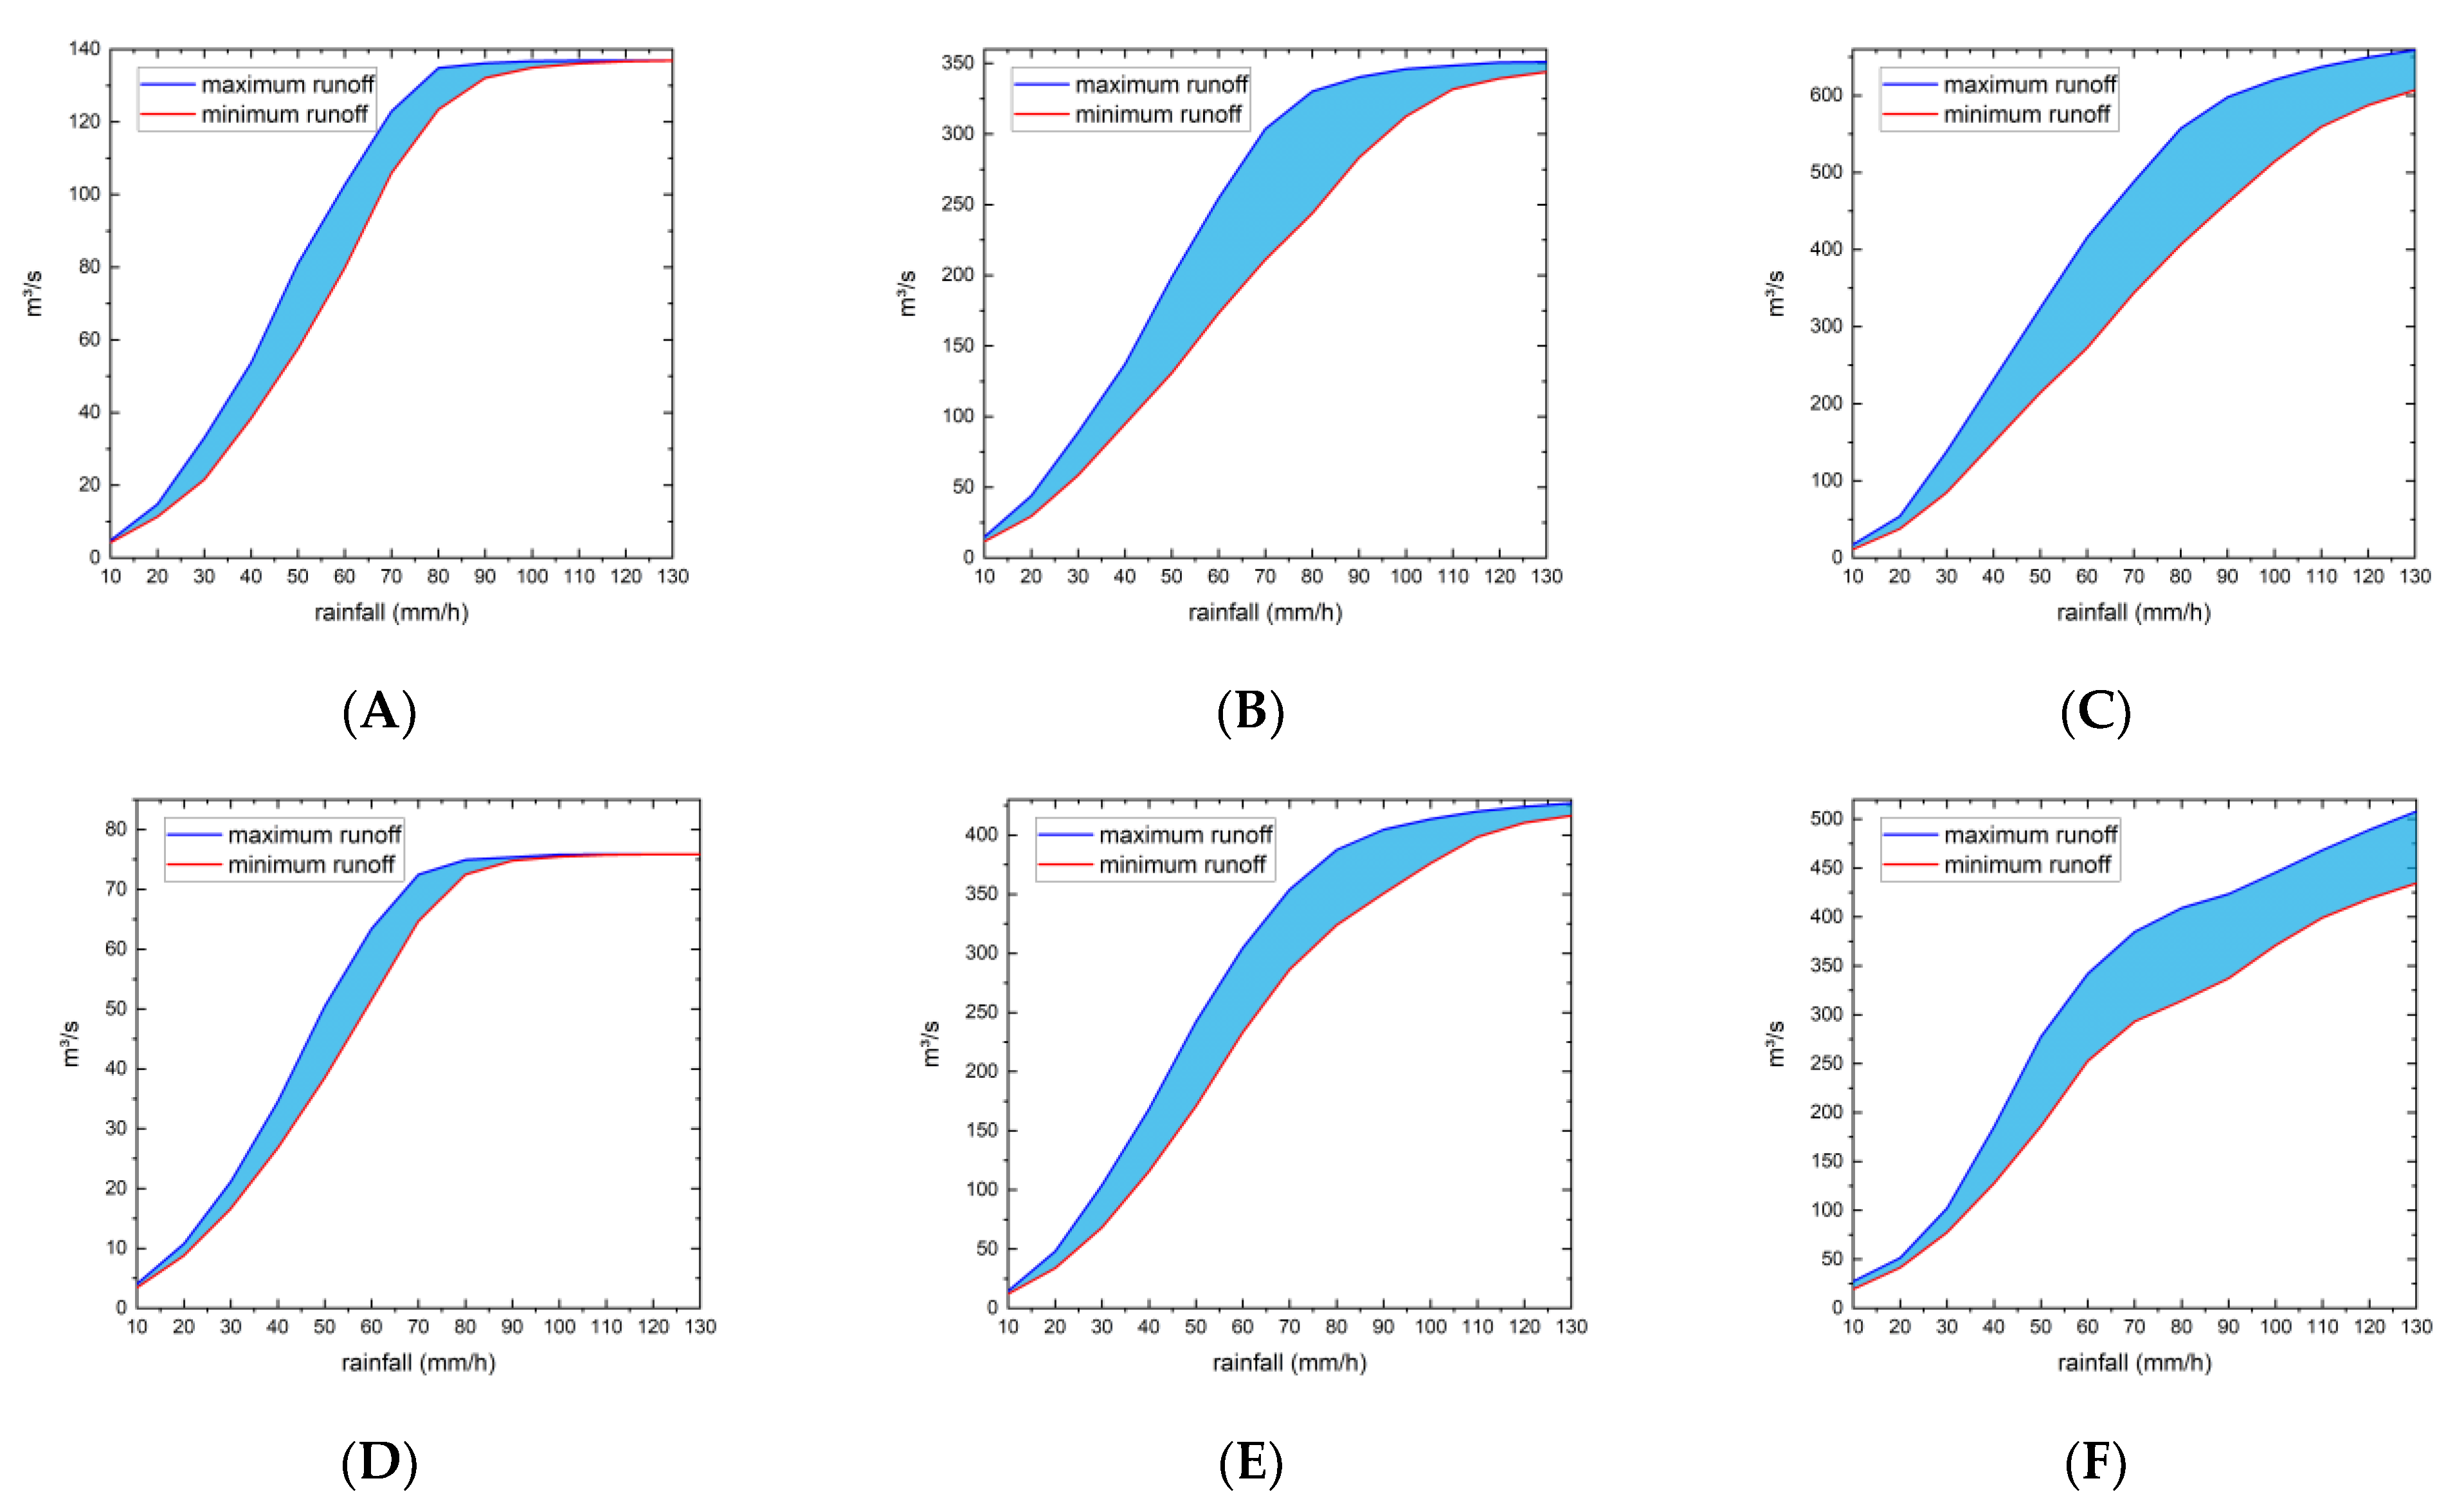
The impact of RMD on the peak runoff indicates that river flood risks and discharge capacities should be evaluated from more rainfall variations including RI, rainfall duration, etc. Commonly used methods that do not consider the impact of RMD, such as constructing rainfall processes by independent zoning [34,38,39], may underestimate or overestimate the peak runoff magnitude in rivers. Figure 7 compares the difference of peak runoff between considering and not considering the impact of RMD, in four urban rivers of Shenzhen with similar RIs. We found that the uncertainties yielded from RMD may reach −40% and 50% (Figure 7). In most cases, these uncertainties range from −20% to 20%. These analyses confirm that the impact of RMD on runoff cannot be ignored in urban hydrologic management.
4. Conclusions
Our results show that rainfall movement direction (RMD) are very likely responsible for variations in flood risks in different sections of urban rivers, which should not be ignored in urban hydrologic management. Although the impact of RMD on peak runoff in rivers is always covered up by heavy rainfall intensity (RI), this impact is significant in the downstream reaches of urban river when combined with spatial features of rivers, such as the river direction and bending. We propose that RMD should be involved in urban hydrologic models and predication, as it may yield substantial uncertainties in peak runoff in rivers. We provide an empirical evaluation to quantify the contribution of RMD to peak runoff in urban rivers, indicating that the river flood risk and discharge capacity should be evaluated based on more variations in rainfall such as RMD. Given the importance of the prevention and treatment of urban waterlogging with the accelerating process of urbanization, this empirical evaluation of peak runoff variations due to changing RMDs represents a contribution for the development of an Early Warning System (EWS) for the study area and provides critical information to inform policy and decision making.
Author Contributions
Y.L. (Yesen Liu) and M.L. collected and processed the data, Y.L. (Yesen Liu), K.L. and Y.L. (Yuanyuan Liu) proposed the model and analyzed the results, Y.H. and Y.L. (Yesen Liu) wrote the manuscript. All authors have read and agreed to the published version of the manuscript.
Funding
This work was supported by National Natural Science Foundation of China (Grant NO. 41822104), the Strategic Priority Research Program of the Chinese Academy of Sciences (XDA19040402), the National Key Research and Development Program of China (Grant No. 2017YFB0503005), National Science and Technology Major Project of China’s High Resolution Earth Observation system (21-Y20B01-9001-19/22), the Fundamental Research Funds of IWHR (WH0145B032024), the Fundamental Research Funds of IWHR(WH0145B032024).
Institutional Review Board Statement
Not applicable.
Informed Consent Statement
Not applicable.
Data Availability Statement
The data presented in this study are available on request from the corresponding author.
Conflicts of Interest
The authors declare no conflict of interest.
References
- Lai, Y.; Li, J.; Gu, X.; Chen, Y.D.; Kong, D.; Gan, T.Y.; Liu, M.; Li, Q.; Wu, G. Greater flood risks in response to slowdown of tropical cyclones over the coast of China. Proc. Natl. Acad. Sci. USA 2020, 117, 14751–14755. [Google Scholar] [CrossRef] [PubMed]
- DeGaetano, A.T. Time-Dependent Changes in Extreme-Precipitation Return-Period Amounts in the Continental United States. J. Appl. Meteorol. Clim. 2009, 48, 2086–2099. [Google Scholar] [CrossRef] [Green Version]
- Papalexiou, S.M.; Montanari, A. Global and Regional Increase of Precipitation Extremes under Global Warming. Water Resour. Res. 2019. [Google Scholar] [CrossRef]
- Arnell, N.W.; Gosling, S.N. The impacts of climate change on river flood risk at the global scale. Clim. Chang. 2016, 134, 387–401. [Google Scholar] [CrossRef] [Green Version]
- Cristiano, E.; Deidda, R.; Viola, F. EHSMu: A New Ecohydrological Streamflow Model to Estimate Runoff in Urban Areas. Water Resour. Manag. 2020, 34, 4865–4879. [Google Scholar] [CrossRef]
- Davenport, F.; Burke, M.; Diffenbaugh, N. Contribution of historical precipitation change to US flood damages. Proc. Natl. Acad. Sci. USA 2021, 118, e2017524118. [Google Scholar] [CrossRef]
- Xu, Z.; Chen, H.; Ren, M.; Cheng, T. Progress on disaster mechanism and risk assessment of urban flood/waterlogging disasters in China. Shuikexue Jinzhan/Adv. Water Sci. 2020, 31, 713–724. [Google Scholar] [CrossRef]
- Veldhuis MC, T.; Zhou, Z.; Yang, L.; Liu, S.; Smith, J. The role of storm scale, position and movement in controlling urban flood response. Hydrol. Earth Syst. Sci. 2018, 22, 417–436. [Google Scholar] [CrossRef] [Green Version]
- Yan, M.; Chan, J.; Zhao, K. Impacts of Urbanization on the Precipitation Characteristics in Guangdong Province, China. Adv. Atmos. Sci. 2020, 37, 696–706. [Google Scholar] [CrossRef]
- Marelle, L.; Myhre, G.; Steensen, B.; Hodnebrog, Ø.; Alterskjær, K.; Sillmann, J. Urbanization in megacities increases the frequency of extreme precipitation events far more than their intensity. Environ. Res. Lett. 2020. [Google Scholar] [CrossRef]
- Cristiano, E.; ten Veldhuis, M.C.; van de Giesen, N. Spatial and temporal variability of rainfall and their effects on hydrological response in urban areas—A review. Hydrol. Earth Syst. Sci. 2017, 21, 3859–3878. [Google Scholar] [CrossRef] [Green Version]
- Hailegeorgis, T.T.; Alfredsen, K. Analyses of extreme precipitation and runoff events including uncertainties and reliability in design and management of urban water infrastructure. J. Hydrol. 2017, 544, 290–305. [Google Scholar] [CrossRef]
- Hénonin, J.; Russo, B.; Roqueta, D.S.; Sanchezdiezma, R.; Domingo, N.S.; Domingo, S.; Thomsen, F.; Mark, O. Urban Flood Real-time Forecasting and Modelling: A State-of-the-Art Review; Publishr: Copenhagen, Denmark, 2010. [Google Scholar]
- Xu, H.; Ma, C.; Xu, K.; Lian, J.; Long, Y. Staged optimization of urban drainage systems considering climate change and hydrological model uncertainty. J. Hydrol. 2020, 587, 124959. [Google Scholar] [CrossRef]
- Pang, B.; Shi, S.; Zhao, G.; Shi, R.; Zhu, Z. Uncertainty Assessment of Urban Hydrological Modelling from a Multiple Objective Perspective. Water 2020, 12, 1393. [Google Scholar] [CrossRef]
- Luca, D.L.D.; Versace, P. Diversity of Rainfall Thresholds for early warning of hydro-geological disasters. Adv. Geosci. 2017, 44, 53–60. [Google Scholar] [CrossRef] [Green Version]
- Singh, A.; Zommers, Z. Reducing Disaster: Early Warning Systems for Climate Change; Springer: Washington, DC, USA, 2014; pp. 89–108. [Google Scholar] [CrossRef]
- Cristiano, E.; Ten Veldhuis, M.-C.; Wright, D.; Smith, J.; van de Giesen, N. The Influence of Rainfall and Catchment Critical Scales on Urban Hydrological Response Sensitivity. Water Resour. Res. 2019, 55, 3375–3390. [Google Scholar] [CrossRef]
- Rossman, L. Modeling Low Impact Development Alternatives with SWMM. J. Water Manag. Modeling 2010. [Google Scholar] [CrossRef] [Green Version]
- Lyu, H.; Ni, G.; Cao, X.; Ma, Y.; Tian, F. Effect of Temporal Resolution of Rainfall on Simulation of Urban Flood Processes. Water 2018, 10, 880. [Google Scholar] [CrossRef] [Green Version]
- Malik, S.; Pal, S.; Sattar, A.; Singh, S.; Das, B.; Chakrabortty, R.; Mohammad, P. Trend of extreme rainfall events using suitable Global Circulation Model to combat the water logging condition in Kolkata Metropolitan Area. Urban Clim. 2020, 32. [Google Scholar] [CrossRef]
- Mu, D.; Luo, P.; Lyu, J.; Zhou, M.; Huo, A.; Duan, W.; Nover, D.; He, B.; Zhao, X. Impact of temporal rainfall patterns on flash floods in Hue City, Vietnam. J. Flood Risk Manag. 2020, 14, e12668. [Google Scholar] [CrossRef]
- Zoccatelli, D.; Borga, M.; Viglione, A.; Chirico, G.B.; Blöschl, G. Spatial moments of catchment rainfall: Rainfall spatial organisation, basin morphology, and flood response. Hydrol. Earth Syst. Sci. 2011, 15, 3767–3783. [Google Scholar] [CrossRef] [Green Version]
- Smith, J.A.; Bradley, A.A.; Baeck, M.L. The SpaceTime Structure of Extreme Storm Rainfall in the Southern Plains. J. Appl. Meteorol. 1994, 33, 1402–1417. [Google Scholar] [CrossRef] [Green Version]
- Ogden, F.L.; Richardson, J.R.; Julien, P.Y. Similarity in Catchment Response: 2. Moving Rainstorms. Water Resour. Res. 1995, 31, 1543–1547. [Google Scholar] [CrossRef]
- Singh, V.P. Effect of spatial and temporal variability in rainfall and watershed characteristics on stream flow hydrograph. Hydrol. Process. 1997, 11, 1649–1669. [Google Scholar] [CrossRef]
- Emmanuel, I.; Andrieu, H.; Leblois, E.; Flahaut, B. Temporal and spatial variability of rainfall at the urban hydrological scale. J. Hydrol. 2012, 430–431, 162–172. [Google Scholar] [CrossRef]
- Nikolopoulos, E.I.; Borga, M.; Zoccatelli, D.; Anagnostou, E.N. Catchment-scale storm velocity: Quantification, scale dependence and effect on flood response. Int. Assoc. Sci. Hydrol. Bull. 2014, 59, 1363–1376. [Google Scholar] [CrossRef] [Green Version]
- Emmanuel, I.; Andrieu, H.; Leblois, E.; Janey, N.; Payrastre, O. Influence of rainfall spatial variability on rainfall-runoff modelling: Benefit of a simulation approach? J. Hydrol. 2015, 531, 337–348. [Google Scholar] [CrossRef]
- Zoccatelli, D.; Borga, B.; Zanon, F.; Antonescu, B.A.; Stancalie, G. Which rainfall spatial information for flash flood response modelling? A numerical investigation based on data from the Carpathian range, Romania. J. Hydrol. 2010, 394, 148–161. [Google Scholar] [CrossRef]
- Liu, Y.Y.; Li, L.; Liu, Y.S.; Chan, P.W.; Zhang, W.H. Dynamic spatial-temporal precipitation distribution models for short-duration rainstorms in Shenzhen, China based on machine learning. Atmos. Res. 2020, 237, 104861. [Google Scholar] [CrossRef]
- Hallegatte, S.; Green, C.; Nicholls, R.; Corfee-Morlot, J. Future flood losses in major coastal cities. Nat. Clim. Chang. 2013, 3, 802–806. [Google Scholar] [CrossRef]
- Zhou, L.; Wu, X.; Ji, Z.; Gao, G. Characteristic analysis of rainstorm-induced catastrophe and the countermeasures of flood hazard mitigation about Shenzhen city. Geomatics 2017, 8, 1886–1897. [Google Scholar] [CrossRef] [Green Version]
- Zang, W.; Shu, L.; Huang, S.; Li, J.; Fu, Y.; Sun, Y.; Zheng, J. Impact of urbanization on hydrological processes under different precipitation scenarios. Nat. Hazards 2019, 99, 1233–1257. [Google Scholar] [CrossRef]
- Haijun, Y.U.; Jianming, M.A. Application of IFMS Urban software in urban flood risk mapping. China Flood Drought Manag. 2018, 28, 13–17. [Google Scholar]
- Kim, I.H.; Feng, C.C.; Wang, Y.C. A simplified linear feature matching method using decision tree analysis, weighted linear directional mean, and topological relationships. Int. J. Geogr. Inf. Sci. 2017, 31, 1042–1060. [Google Scholar] [CrossRef]
- Mitchell, A. The ESRI Guide to GIS Analysis; ESRI Press: Redlands, CA, USA, 1999. [Google Scholar]
- Wheater, H.S.; Chandler, R.E.; Onof, C.J.; Isham, V.S.; Bellone, E.; Yang, C.; Lekkas, D.; Lourmas, G.; Segond, M.L. Spatial-temporal rainfall modelling for flood risk estimation. Stoch. Environ. Res. Risk Assess. 2005, 19, 403–416. [Google Scholar] [CrossRef]
- Aronica, G.; Cannarozzo, M. Studying the hydrological response of urban catchments using a semi-distributed linear non-linear model. J. Hydrol. 2000, 238, 35–43. [Google Scholar] [CrossRef]
Figure 1.
Schematic diagram of rainfall schemes.

Figure 2.
Location of the four rivers.

Figure 3.
Influence of the rainfall intensity (RI) and rainfall movement direction (RMD) on the peak runoff. (A) The distribution of Ifp values under 13 different RIs. (B) The distribution of Ifp under different RIs.
Figure 3.
Influence of the rainfall intensity (RI) and rainfall movement direction (RMD) on the peak runoff. (A) The distribution of Ifp values under 13 different RIs. (B) The distribution of Ifp under different RIs.

Figure 4.
Distribution of Ifps for typical modes.

Figure 5.
Influence of the peak runoff on the sections of four rivers. (A) Dasha River. (B) Buji River. (C) Xinzhou River. (D) Futian River. Only certain parts of the 414 sections are drawn.
Figure 5.
Influence of the peak runoff on the sections of four rivers. (A) Dasha River. (B) Buji River. (C) Xinzhou River. (D) Futian River. Only certain parts of the 414 sections are drawn.


Figure 6.
Influences of rainfall movement direction (RMD) and the direction of river confluence on the peak runoff. (A) Dasha River. (B) Buji River. (C) Xinzhou River. (D) Futian River.
Figure 6.
Influences of rainfall movement direction (RMD) and the direction of river confluence on the peak runoff. (A) Dasha River. (B) Buji River. (C) Xinzhou River. (D) Futian River.

Figure 7.
The peak runoff ranges with the same rainfall intensity (RI) value but different RMDs for 6 river sections. (A), section 50 of the Dasha River. (B), section 100 of the Dasha River. (C), section 150 of the Dasha River. (D), section 30 of the Buji River. (E), section 80 of the Buji River. (F), section 130 of the Buji River.


Table 1.
Rainfall process of 13 rainfall intensity schemes.
| RI Scheme | Total Rainfall | Rainfall of 5 min Intervals | |||||||||||
|---|---|---|---|---|---|---|---|---|---|---|---|---|---|
| 5 | 10 | 15 | 20 | 25 | 30 | 35 | 40 | 45 | 50 | 55 | 60 | ||
| RI1: | 10 | 0.4 | 0.6 | 0.8 | 1.4 | 2.0 | 1.2 | 0.9 | 0.7 | 0.6 | 0.5 | 0.5 | 0.4 |
| RI2: | 20 | 0.9 | 1.1 | 1.6 | 2.8 | 4.0 | 2.4 | 1.8 | 1.4 | 1.2 | 1.0 | 0.9 | 0.8 |
| RI3: | 30 | 1.3 | 1.7 | 2.4 | 4.3 | 5.9 | 3.7 | 2.7 | 2.1 | 1.8 | 1.6 | 1.4 | 1.2 |
| RI4: | 40 | 1.8 | 2.3 | 3.2 | 5.7 | 7.9 | 4.9 | 3.6 | 2.9 | 2.4 | 2.1 | 1.8 | 1.7 |
| RI5: | 50 | 2.2 | 2.8 | 4.0 | 7.1 | 9.9 | 6.1 | 4.5 | 3.6 | 3.0 | 2.6 | 2.3 | 2.1 |
| RI6: | 60 | 2.7 | 3.4 | 4.7 | 8.5 | 11.9 | 7.3 | 5.4 | 4.3 | 3.6 | 3.1 | 2.8 | 2.5 |
| RI7: | 70 | 3.2 | 4.0 | 5.5 | 9.6 | 13.2 | 9.3 | 6.2 | 5 | 4.2 | 3.7 | 3.3 | 3.0 |
| RI8: | 80 | 3.9 | 4.7 | 6.3 | 10.7 | 14.6 | 10.3 | 7.1 | 5.8 | 5.0 | 4.4 | 4.0 | 3.6 |
| RI9: | 90 | 4.5 | 5.4 | 7.1 | 11.8 | 16.1 | 11.3 | 7.9 | 6.5 | 5.7 | 5.1 | 4.6 | 4.3 |
| RI10: | 100 | 5.1 | 6.1 | 7.9 | 12.9 | 17.6 | 12.3 | 8.7 | 7.3 | 6.4 | 5.7 | 5.2 | 4.8 |
| RI11: | 110 | 5.8 | 6.7 | 8.6 | 13.9 | 18.8 | 14.1 | 9.5 | 8.0 | 7.0 | 6.3 | 5.9 | 5.5 |
| RI12: | 120 | 6.3 | 7.4 | 9.4 | 15.2 | 20.7 | 15.3 | 10.3 | 8.7 | 7.6 | 7.0 | 6.4 | 6.0 |
| RI13: | 130 | 6.8 | 8.0 | 10.2 | 16.4 | 22.4 | 16.4 | 11.2 | 9.4 | 8.4 | 7.6 | 6.9 | 6.5 |
Publisher’s Note: MDPI stays neutral with regard to jurisdictional claims in published maps and institutional affiliations. |
© 2021 by the authors. Licensee MDPI, Basel, Switzerland. This article is an open access article distributed under the terms and conditions of the Creative Commons Attribution (CC BY) license (https://creativecommons.org/licenses/by/4.0/).
Share and Cite
MDPI and ACS Style
Liu, Y.; Huang, Y.; Liu, Y.; Li, K.; Li, M. The Impact of Rainfall Movement Direction on Urban Runoff Cannot Be Ignored in Urban Hydrologic Management. Water 2021, 13, 2923. https://0-doi-org.brum.beds.ac.uk/10.3390/w13202923
AMA Style
Liu Y, Huang Y, Liu Y, Li K, Li M. The Impact of Rainfall Movement Direction on Urban Runoff Cannot Be Ignored in Urban Hydrologic Management. Water. 2021; 13(20):2923. https://0-doi-org.brum.beds.ac.uk/10.3390/w13202923
Chicago/Turabian StyleLiu, Yesen, Yaohuan Huang, Yuanyuan Liu, Kuang Li, and Min Li. 2021. "The Impact of Rainfall Movement Direction on Urban Runoff Cannot Be Ignored in Urban Hydrologic Management" Water 13, no. 20: 2923. https://0-doi-org.brum.beds.ac.uk/10.3390/w13202923
Note that from the first issue of 2016, this journal uses article numbers instead of page numbers. See further details here.