Review

Policy, Technology, and Management Options for Water Conservation in the Ogallala Aquifer in Kansas, USA

1
Department of Agronomy, Kansas State University, Manhattan, KS 66506, USA
2
Kansas Center for Agricultural Resources and the Environment, Kansas State University, Manhattan, KS 66506, USA
3
Kansas Department of Agriculture, Water Resources Division, Topeka, KS 66612, USA
4
Department of Biological and Agricultural Engineering, Kansas State University, Manhattan, KS 66505, USA
5
Department of Agricultural Economics, Kansas State University, Manhattan, KS 66506, USA
6
Kansas Water Office, 900 SW Jackson Street, Suite 404, Topeka, KS 66612, USA
*
Author to whom correspondence should be addressed.
Submission received: 30 September 2021 / Revised: 24 November 2021 / Accepted: 26 November 2021 / Published: 2 December 2021
(This article belongs to the Special Issue Water Conservation in Irrigated Agricultural Systems)

Abstract

:
The Ogallala Aquifer underlies 45 million ha, providing water for approximately 1.9 million people and supporting the robust agriculture economy of the US Great Plains region. The Ogallala Aquifer has experienced severe depletion, particularly in the Southern Plains states. This paper presents policy innovations that promote adoption of irrigation technology, and management innovations. Innovation in Kansas water policy has had the dual effects of increasing the authority of the state to regulate water while also providing more flexibility and increasing local input to water management and regulation. Technology innovations have focused on improved timing and placement of water. Management innovations include soil water monitoring, irrigation scheduling, soil health management and drought-tolerant varieties, crops, and cropping systems. The most noted success has been in the collective action which implemented a Local Enhanced Management Area (LEMA), which demonstrated that reduced water pumping resulted in low to no groundwater depletion while maintaining net income. Even more encouraging is the fact that irrigators who have participated in the LEMA or other conservation programs have conserved even more water than their goals. Innovative policy along with creative local–state–federal and private–public partnerships are advancing irrigation technology and management. Flexibility through multi-year allocations, banking of water not used in a given year, and shifting water across multiple water rights or uses on a farm are promising avenues to engage irrigators toward more sustainable irrigation in the Ogallala region.

1. Introduction

With a global population of 7.8 billion people, projected to grow to about 10 billion over the next 30 years, current and future food insecurity is an urgent threat. At the same time, a changing climate poses uncertainty about future productive capacity in many of the world’s breadbaskets due to increasing frequency and intensity of agricultural droughts, heat waves, and flooding [1,2]. Irrigation reduced year-to-year crop yield variability by about 41% in the US [3] and with climate change, irrigation may play an even more important role in stabilizing yields. Agriculture is the largest use of the human consumptive water use, so finding ways to sustain irrigated agriculture while conserving water for other critical needs is essential [4]. As temperatures increase and precipitation becomes more variable, irrigated agriculture will be important to sustain the relatively higher food production as compared to rainfed agriculture. However, water supplies are finite, and in many cases over-allocated or declining in quality.
Over the past two decades, global groundwater storage has been depleted in all major irrigation areas [5]. Dieter et al. [6] reported that groundwater extractions for irrigation in the US increased by 16% from 2010 to 2015. Famiglietti and Ferguson [7] found that the Southern Ogallala aquifer in the US Great Plains was among the most rapidly depleting aquifers over the past two decades, with rate of decline abating somewhat in last 2 years. The Ogallala Aquifer constitutes a major portion of the High Plains Aquifer, which underlies 45 million ha (111 million acres) of land in the US states of Wyoming, South Dakota, Nebraska, Kansas, Colorado, Oklahoma, Texas, and New Mexico [8]. The aquifer provides water for approximately 1.9 million people and has been instrumental in the development of the robust agriculture economy of the Great Plains region. The Ogallala Aquifer region accounts for about 30% of all irrigation in the US [6] and more than 30% of US crops and livestock are produced in this region [9].
The aquifer characteristics, such as saturated thickness, depth to water, and recharge rates vary significantly across the multi-state region. McGuire [10] reported that the 2015 saturated thickness as a percentage of pre-development saturated thickness has declined substantially, particularly in Texas, Oklahoma, Kansas, Colorado, and New Mexico. In addition, the Great Plains region, where the aquifer is located, exhibits a strong precipitation gradient, decreasing from east to west, as well as pronounced temperature gradients, increasing from south to north and is vulnerable to projected climate changes [11]. Deines et al. [12] identified regions of stable, expanding, and decreasing irrigated area in the High Plains from 1984–2017, and projected that 40% and 54% of currently irrigated land in the central and southern High Plains, respectively, would no longer be viable for irrigation by 2100. Increased sustainability of irrigation in the region will require innovations in technologies and management systems to slow groundwater depletion [13,14]. Since portions of the aquifer have uranium, arsenic, and other naturally occurring constituents of concern, [15], it is also important that water conservation consider potential impacts on regional water quality.
In the Southern Plains, there is widespread awareness of the aquifer decline. Lauer et al. [16] found that irrigators in the region believe water conservation is important, not only to allow future irrigation on their own fields, but also to ensure the future of their communities and region. However, adoption of many new technologies and management systems has been slow. The hypothesis of this paper is that innovations in policy are needed to accelerate adoption of more efficient irrigation technologies and management systems and slow the rate of aquifer depletion. Water law and policy that govern options for water conservation vary considerably from state to state [17]. Because the greatest decline in the Ogallala Aquifer has occurred in the Southern Plains states, and because Kansas has implemented policy innovations that are not available in Oklahoma and Texas, this paper will focus on Kansas, and show that policy innovations have played a critical role in accelerating adoption of technology and irrigation management innovations. Applicability of the demonstrated success of these innovations in slowing the rate of groundwater depletion to other parts of the Ogallala region as well as other irrigated regions will be discussed.

2. Kansas Irrigated Agriculture Background

2.1. Water Policy

Water use in Kansas is governed under the 1945 Water Appropriation Act, which established that water is owned by the state and can be used by individuals under the prior appropriation doctrine. Approval of water rights to private uses is the responsibility of the Chief Engineer of the Division of Water Resources in the Kansas Department of Agriculture (KDA) [18]. There are more than 35,000 active water rights in Kansas [19], mostly in the Ogallala Aquifer area. With water resources fully developed in many areas of the state, policies have been implemented which allow water rights to be modified or transferred, subject to approval by the Chief Engineer. As concern about depletion of the Ogallala Aquifer increased, the 1972 Groundwater Management District (GMD) Act allowed more local input into water policies [18]. Currently there are five GMD in Kansas, of which GMD No. 1, GMD No. 3, and GMD No. 4 are located over the Ogallala Aquifer in the west-central, southwest, and northwest portions of the state (Figure 1). Legislation in 1978 established Intensive Groundwater Use Control Areas (IGUCA). Minimum desirable streamflow limits (MDS) were established following passage of legislation in 1984.
In 1981, the Kansas Water Office (KWO) was established to plan, coordinate, and market water. Responsibilities of KWO include compilation of climate, water, and soil data as related to water resources, develop a State Water Plan, develop guidelines for water conservation and establish guidelines for management during times of drought (KWO website). The annual budget to support the State Water Plan is developed by the Kansas Water Authority, an appointed board, in consultation with watershed-based Regional Advisory Committees. Implementation of the Water Plan is conducted by the KWO, KDA, the Kansas Department of Health and the Environment (KDHE) and other agencies. Importantly, for this paper, in 2012, legislation was passed that authorize additional options to establish procedures for water leasing, incentive-based water right retirement, multi-year water allocations, and Local Enhanced Management Areas [18]. Additional policy options to reduce water allocations through Water Conservation Areas (WCA) were allowed following passage of legislation in 2015.

2.2. Irrigated Agriculture in Kansas

Agriculture accounts for 88% of land use in Kansas, with the 14% of Kansas cropland that is irrigated producing 33% of the crop production. Irrigation utilizes about 85% of the non-domestic consumptive water use in the state, with the largest amount of irrigation occurring in the western portion of the state. The most common irrigated crops are corn (Zea maiz), soybeans (Glycine max), winter wheat (Triticum aestivum), alfalfa (Medicago sativa), and sorghum (Sorghum bicolor). Over 90% of irrigation systems in Kansas are center pivot systems [21]. Irrigation water extraction developed rapidly in Kansas from the 1950s through the 1970s, initially using furrow irrigation methods. Early conservation innovations included use of gated pipe to replace open ditches, and later installation of tailwater reuse systems [14]. In the 1970s, center pivot irrigation technology triggered transition to sprinkler irrigation for new systems. The most common appropriation for irrigation water rights was 6096 m3 ha−1 (2 acre-feet). The development of irrigation in western Kansas was followed by rapid development of concentrated animal production systems and later ethanol energy production systems, greatly increasing the employment and economic impact of irrigated agriculture in the region. However, significant water level and saturated thickness declines in the aquifer were documented by Luckey et al. [22], and that trend continues to this date. Whittemore et al. [20] reported that the saturated thickness decline since pre-development was 17.1, 31.4, and 7.6 m (56, 103, and 25 ft) for GMD No. 1, 3, and 4, respectively, and that remaining aquifer thickness for GMD No. 1, 3, and 4, respectively, was 9.4, 46.0, 21.0 m (31, 151, and 69 ft).

2.3. Resource Monitoring

The Kansas Geological Survey established the Index Well Network in 2007, initially with three instrumented and continuously monitored wells. Currently, this network has 19 instrumented wells in the three western Kansas GMDs, with additional sites in the central Kansas GMD. These measurements support modeling and analysis of mechanisms that control water level changes [23] as well as complement the annual measurement program, which monitors over 1000 wells manually during the non-irrigation season.
The Kansas Mesonet consisting of automated and near real-time weather monitoring was established in 1986, with initial sites located at Kansas State Research and Extension (KSRE) locations [24]. Additional sites to a total of 62 distributed throughout the state have been added in collaboration with the KWO, GMDs, and USDA Soil Climate Analysis Network. The stations monitor solar radiation, wind speed and direction, relative humidity, air temperature and rainfall, and in some sites, soil moisture. These and other weather data support natural resource monitoring and assessment programs as well as operational programs such as growing degree days, heat indices, cooling degree days, and evapotranspiration estimates for irrigation scheduling.

3. Innovation to Enhance Sustainability of the Ogalalla Aquifer

There has been a strong multi-state focus on irrigation technologies, irrigation management, and irrigation efficiency for many years. The Ogallala Aquifer Program was established in 2003 as a consortium between the US Department of Agriculture, Agricultural Research Service, Texas A&M University, Texas Tech University, West Texas A&M University, Kansas State University and the Texas Water Resources Institute [14]. From 2016–2020, the USDA-NIFA funded Ogallala Water Coordinated Agriculture Project [13,25] conducted multidisciplinary research and outreach focused long-term agricultural sustainability in the High Plains region. Findings from these groups and others contributed greatly to technology and management innovations discussed below, but policy is dominated by state law making extension of policy innovations across the region a much slower process.

3.1. Innovations in Policy

There has been a long history of innovation in Kansas water policy with the goal to reduce the depletion rate in the Ogallala aquifer (Table 1). The body of legislation over the years has had the dual effects of increasing the authority of the Chief Engineer to regulate water while also increasing the authority for local input to water management and regulation. Following passage of the Groundwater Management District Act in 1972, the Western Kansas GMD (GMD No. 1), the Southwest Kansas GMD (GMD No. 3), and the Northwest Kansas GMD (GMD No. 4) were established in 1970s. The districts established various policies, such as spacing requirements from existing water right wells that have precluded future water rights in most of the western part of Kansas. In addition, metering requirements were established by the districts to meet the state’s requirement for water level reporting. Currently, the Chief Engineer requires annual water use reports which are submitted to the online Kansas Water Use Reporting System. The allocation of water rights for irrigation has been reduced below the historic 6096 m3 ha−1 (2 acre-feet), with quantity varying by district. In 1978, the Chief Engineer was authorized to declare Intensive Groundwater Use Control Areas, based on the following premises: a public hearing which determined that groundwater levels are declining excessively, the rate of groundwater withdrawal exceeds the rate of groundwater recharge, unreasonable deterioration of groundwater quality has occurred or may occur, or other conditions exist warranting additional regulation to protect public interest. The IGUCA’s faced strong local resistance and have been implemented primarily in riparian areas. Legislation in 2012 and 2015 passed to allow establishment of local (Local Enhanced Management Area or LEMA) and individual (water conservation areas or WCA) voluntary reductions in water allocations in exchange for increased flexibilities including multi-year water allocations, and in some cases changes in location or use of allocated water.
In addition to legislation and policy described above to reduce water allocations, in 2006, the Kansas House Bill 2710 established the Water Transition Assistance Program (WTAP) pilot. This established a fund managed by the Kansas Conservation Commission to purchase and permanently retire partial or full water rights in targeted areas. The pilot program expires in 2022.

3.2. Innovations in Technology

Innovations in irrigation technology were the focus of a symposium and journal special issue as introduced by Lamm et al. [26]. Innovations have focused on engineering systems to deliver the highest possible fraction of water to the root zone and automation to improve the timing and placement of water and other inputs to optimize the “crop per drop”. Lamm et al. [27] reviewed in-canopy and near-canopy sprinkler irrigation and found they result in nearly 15% lower evaporation losses compared to high-pressure sprinkler designs, but pose greater challenges for non-uniform applications that can result in runoff, erosion, and deep drainage losses. One of the earliest near-surface systems was the low-energy precision application (LEPA), which produced about 16% yield increase compared to above canopy sprinkler irrigation for irrigation treatments below 50% of full irrigation [28]. A more recent innovation, mobile drip irrigation (MDI) is a gaining popularity by combining the efficiency of sub-surface drip irrigation (SDI) [29] with the versatility of center pivot systems together in a unit [30]. Compared to in-canopy spray nozzles, MDI systems have 35% lower soil evaporation [31] due to a smaller wetted perimeter associated with MDI. In the Texas High Plains, SDI compared to mid-canopy spray systems reduced corn water use by 17–18% while increasing yield by 0–20%, primarily by reducing early season evaporation [32]. In contrast, Oker et al. [33] compared low elevation spray application (LESA), LEPA, and MDI irrigation systems with a range of irrigation capacities and found little effect of irrigation system on biomass, leaf area, yield, or water use efficiency (WUE). They did identify reduced wheel-track rutting and ease of fertigation as benefits of MDI. Reynolds et al. [34] found that producers growing high water use crops such as corn could recover the costs of conversion from LESA to MDI in 2.3 to 4.9 years for low to medium conversion costs. Evett et al. [32] identified benefits of SDI to include warmer soil temperatures early in the season, which reduced evaporation and improved root development and early crop growth. Goebel and Lascano [35] analyzed the isotopic signature of water in the petioles of cotton grown with sub-surface drip (SDI) and center pivot irrigation of cotton and found petiole water of sprinkler-irrigated cotton was 63% rainwater compared to 17% for sub-surface drip and 32% for rainfed cotton. This could be related to more rooting near the surface with more frequent wetting by sprinkler irrigation.
Precision application and automation of irrigation systems offers the opportunity to increase the efficiency even further by meeting crop input needs which vary spatially within a field and through the season [36]. These systems integrate technologies such as geographic position system (GPS) location and guidance systems, soil and crop mapping, precision crop inputs, and precision irrigation based on soil and plant monitoring and knowledge of critical growth periods. O’Shaughnessy et al. [37] reviewed advantages and disadvantages of variable rate irrigation technologies and identified changes needed to better realize the potential of the systems.

3.3. Innovations in Management

Innovations in irrigation management include use of soil water monitoring and automated computer-aided irrigation scheduling to determine timing and quantity of applications; improving soil health to maximize infiltration of precipitation and irrigation water, improve soil water storage capacity, optimize water extraction from the soil by roots; and drought-tolerant varieties, crops, and cropping systems. Irrigation scheduling has been recommended for many decades to save water and energy, optimize crop yield and quality, and minimize loss of inputs to the environment [38]. Approaches to irrigation scheduling have evolved to include increased use of evapotranspiration (ET) and crop growth modeling, automated soil moisture sensing, and spectral crop monitoring [38]. Although ET measurement and modeling have been a research focus for decades, recent research [39] found that commonly used methods still can under-estimate ET under the low humidity and high wind conditions common in the Great Plains. Irrigation scheduling often relies on crop coefficients to relate potential ET rates to actual ET rates through the crop growing season. Evett et al. [40] found that the type of irrigation system can affect the crop coefficients, with crop coefficient values for corn being 10% lower for SDI compared to MESA sprinkler irrigation.
As groundwater levels and well capacities decline, research has focused on optimal irrigation scheduling for different deficit irrigation strategies and different crops. Araya et al. [41] found that highest simulated yield of corn in southwestern Kansas required 400 to 450 mm of irrigation application and 650–800 mm of ET, and that the highest irrigation water productivity was 30–33 kg/ha/mm when irrigating at 25% or 50% plant available soil water. In the Texas High Plains, Thapa et al. [42] evaluated corn production with 300 mm irrigation, 60% of average irrigation applications in the region, and determined that modern corn hybrids could produce acceptable yields in favorable rainfall years but with risk of crop failure in drought years.
Monitoring soil water content provides valuable information for making irrigation decisions. Evett et al. [43] found that in field conditions that have layered soils, plants available soil water (PASW) is greater than that determined in laboratory conditions. They recommended irrigators focus on maximum use of soil water stored during wet periods in the season, measured soil water depletion, and critical sensitive periods for the crop to optimize amount and timing of irrigation.
As groundwater supply declines, irrigators may have inadequate capacity to irrigate traditional high water use crops such as corn. Bhattarai et al. [44] evaluated alternative forage crops that could supply beef and dairy production, and found that with deficit irrigation, forage sorghum and millet extracted water from deeper in the profile and produced greater yield and WUE than corn. In the same experiment, Bhattarai et al. [45] found that lignin content was lower and digestible energy was higher in corn than millet and sorghum, but that the forage quality of the higher yielding sorghum was acceptable for silage. Katuwal et al. [46] evaluated growth-stage-based deficit irrigation for canola, and found that eliminating a vegetative stage irrigation resulted in deeper water extraction during a dry year and resulted in reduced ET compared to full irrigation but higher WUE and similar oil content. Similarly, Himanshu et al. [47] found that imposing water deficits in the initial or final growth stages had little effect on seed cotton yield, while the peak bloom growth stage (GS4) was the most sensitive stage to water stress. While cotton has not been a common crop in western Kansas, it has the potential to produce net returns comparable to corn, and Baumhardt et al. [48] found that short season, early planted cotton could be a viable, low-water requirement crop in the southwestern part of Kansas.
In looking to the future of irrigation in the region, Lamm et al. [49] and Evett et al. [14] emphasize the need to utilize the best engineering and agronomic advances combined. For example, use of improved cultivars and precision application tools to precisely apply water and other inputs to meet the plant needs within a field and through the season.

4. Demonstrated Water Conservation

Moving toward more sustainable irrigation in the Ogallala region requires an interplay of innovation in policy, technology, and management. Policy innovation in Kansas over recent decades have increased the adoption of innovative technologies and management as described in the 2021 Kansas Water Authority Annual Report to the Governor and Legislature [50]. Significant irrigation efficiency advances have been documented through many programs at farm to field as well as landscape to community scales as briefly summarized below. Additional information about programs discussed below are provided on the relevant agency websites.

4.1. Farm and Field Scale Conservation

The KDA supports the WCA program to provide a voluntary, flexible tool available to any water right owner or a group of water right owners to reduce withdrawals from the aquifer in exchange for flexibilities such as multi-year water right allocations, moving allocations between enrolled water rights and allowing the use of water to be changed (e.g., from irrigation to stock water). To establish a WCA, the water right owner/s develop a management plan that includes the geographic boundaries, time period, and goals and approaches of the plan. After approval by the Chief Engineer, the plan is implemented through a consent agreement. To date, fifty-three WCA’s have been enrolled, mostly in the Ogallala region, with a projected water savings of 14.7 mil m3 (11,900 acre-feet) each year. Most WCA’s are implemented for three-year periods, and some have been renewed.
The Water Technology Farms (WTFarms) are a public–private partnership supported by the KWO since 2016 that showcase the latest in technology and water conservation efforts. Over 100 sponsors work with the water right holders who partner to demonstrate technologies, support field-scale research, and support outreach activities. Seventeen farms are enrolled in the program, demonstrating a wide range of technologies such as soil moisture monitoring, irrigation scheduling tools, efficient emitter technologies, subsurface drip systems, soil health enhancement, precision technologies, and alternative cropping systems. The farmers work closely with private sector partners who help adapted available technologies to the goals of the producer. The KWO and KSRE assist with monitoring and evaluation of the program. Producers submit annual reports that indicate savings of water extractions ranging from 30 to over 50% of the water right appropriation, generally with yields and net returns maintained or in some cases increased [51]. Producers who enroll in other conservation programs are supported with numerous state and federal cost-sharing programs and technical support through the KSRE, state agencies, and conservation districts. Additionally, the KDA Irrigation Technology program supported cost sharing for irrigation technology and management on over 2200 ha (5000 acres) in 2020 to support conservation in a targeted ecological region.
The Water Transition Assistance Program has retired water rights for annual savings of over 3.1 mil m3 (2500 acre-feet). Because the program is targeted to areas that have been declared sensitive, the retirement of these water rights has been essential in allowing citizens to meet their drinking water needs while protecting important ecosystems.

4.2. Collective Action for Conservation

While conservation at field to farm scale is important, some challenges may be better addressed at larger scales that require many people to work together. Legislation passed in the last decade and implemented through the groundwater management districts and other agencies have demonstrated the power of collective action for water conservation.
The first LEMA, known as SD-6, was established in GMD No. 4 on 1 January 2013, for a 5 year period. In the early 21st century, the contiguous 256 km2 area in Sheridan and Thomas Counties had been identified as a clustered subunit with similar aquifer characteristics and declared a High Priority Area. Drysdale and Hendricks [52] give additional details of the LEMA.
Prior to establishment of the LEMA, irrigated area, total water extracted, and water extracted per unit area inside the LEMA boundaries were similar to the land surrounding and adjacent to the boundary of the LEMA, which were used as a control area for further assessment [53]. Drysdale and Hendricks [52] applied difference-in-difference econometric analysis and determined that farmers within the LEMA reduced water use by 26% compared to the control area, primarily through reduced water applications on similar crops to the pre-LEMA period. Analysis of the first five years of the LEMA (2013 to 2017) indicated that the LEMA area had 10.9% less irrigated area, 23.1% less groundwater use, and 16% less water use per unit irrigated area compared to the surrounding control area [54]. Prior to 2012, the LEMA area had 9.2% less irrigated corn area, but from 2013 to 2017, it had 23.3% less area of corn compared to the surrounding control area. The LEMA had no significant impact on alfalfa or soybean irrigated area, but increased sorghum and wheat areas relative to the control. Producer-reported economic data indicated that cash flow per unit area or per unit water applied was higher in the LEMA compared to the control area for corn, sorghum, and wheat crops, but not for soybean which had similar amount of irrigation applied but lower yield for LEMA than control fields.
In a separate analysis of SD-6, Deines et al. [55] found that the LEMA reduced water use by 31% over five years, with 72% of the savings realized through increased irrigation efficiency and 19% of the savings achieved through transition to crops with lower water demand. Zwickle et al. [56] found that the collaborative governance model was essential in this LEMA to achieve the collective water savings. Because of the benefits of water conservation while maintaining economic viability of agriculture in the region, the SD-6 LEMA was extended from 2018 through 2022. Subsequently, a GMD No. 4 District-wide LEMA was approved, effective 2018 through 2022.
The GMD No. 1 had low pre-development saturated thickness, relative to GMD No. 3 and GMD No. 4 and the area has experienced severe depletion of groundwater levels. The GMD No. 1 established the Wichita County LEMA effective 2021 through 2025. The plan will result in 25% reduction in use relative to the 2009–2015 historical period, with five-year allocations being developed with consideration of low output wells and prior conservation. A GMD No. 1 district-wide LEMA is under development as of writing.
Additional examples of collective action for conservation are engagement of a variety of private and public stakeholders including the GMDs and agencies engaged in the Kansas Water Plan in federal partnerships for conservation. One important effort in the Ogallala Region of Kansas is the WTAP partnership with the USDA Conservation Reserve Enhancement Program (CREP) to achieve permanent retirement of water rights along the Upper Arkansas River Basin to stem aquifer declines and mitigate municipal water supply shortages. Both WTAP and CREP contracts require participants to permanently retire water rights in exchange for compensation. Contracts under the CREP program require the landowner to plant a permanent vegetative cover while WTAP allows transition to dryland cropping, pasture, or conservation vegetation. Deines et al. [57] determined that about 24% of currently irrigated lands in the High Plains Aquifer may not be able to support irrigation by 2100, and that soils on 13% of the area would be unsuitable to sustain dryland cropping, indicating that the water right retirement programs are needed and that conservation plantings following retirement of irrigation and conversion to dryland farming are both needed options in the region.
Another recent partnership is the Groundwater Recharge and Sustainability Project (GRASP) funded under the USDA Resource Conservation Partnership Program. The GRASP project is led by the Playa Lake Joint Venture partnership and focuses on playa restoration, reduce irrigation pumping, retirement of wells, and/or transition to dryland cropping in Wichita and Greeley Counties to promote localized recharge and stabilized water levels near municipal and domestic wells.

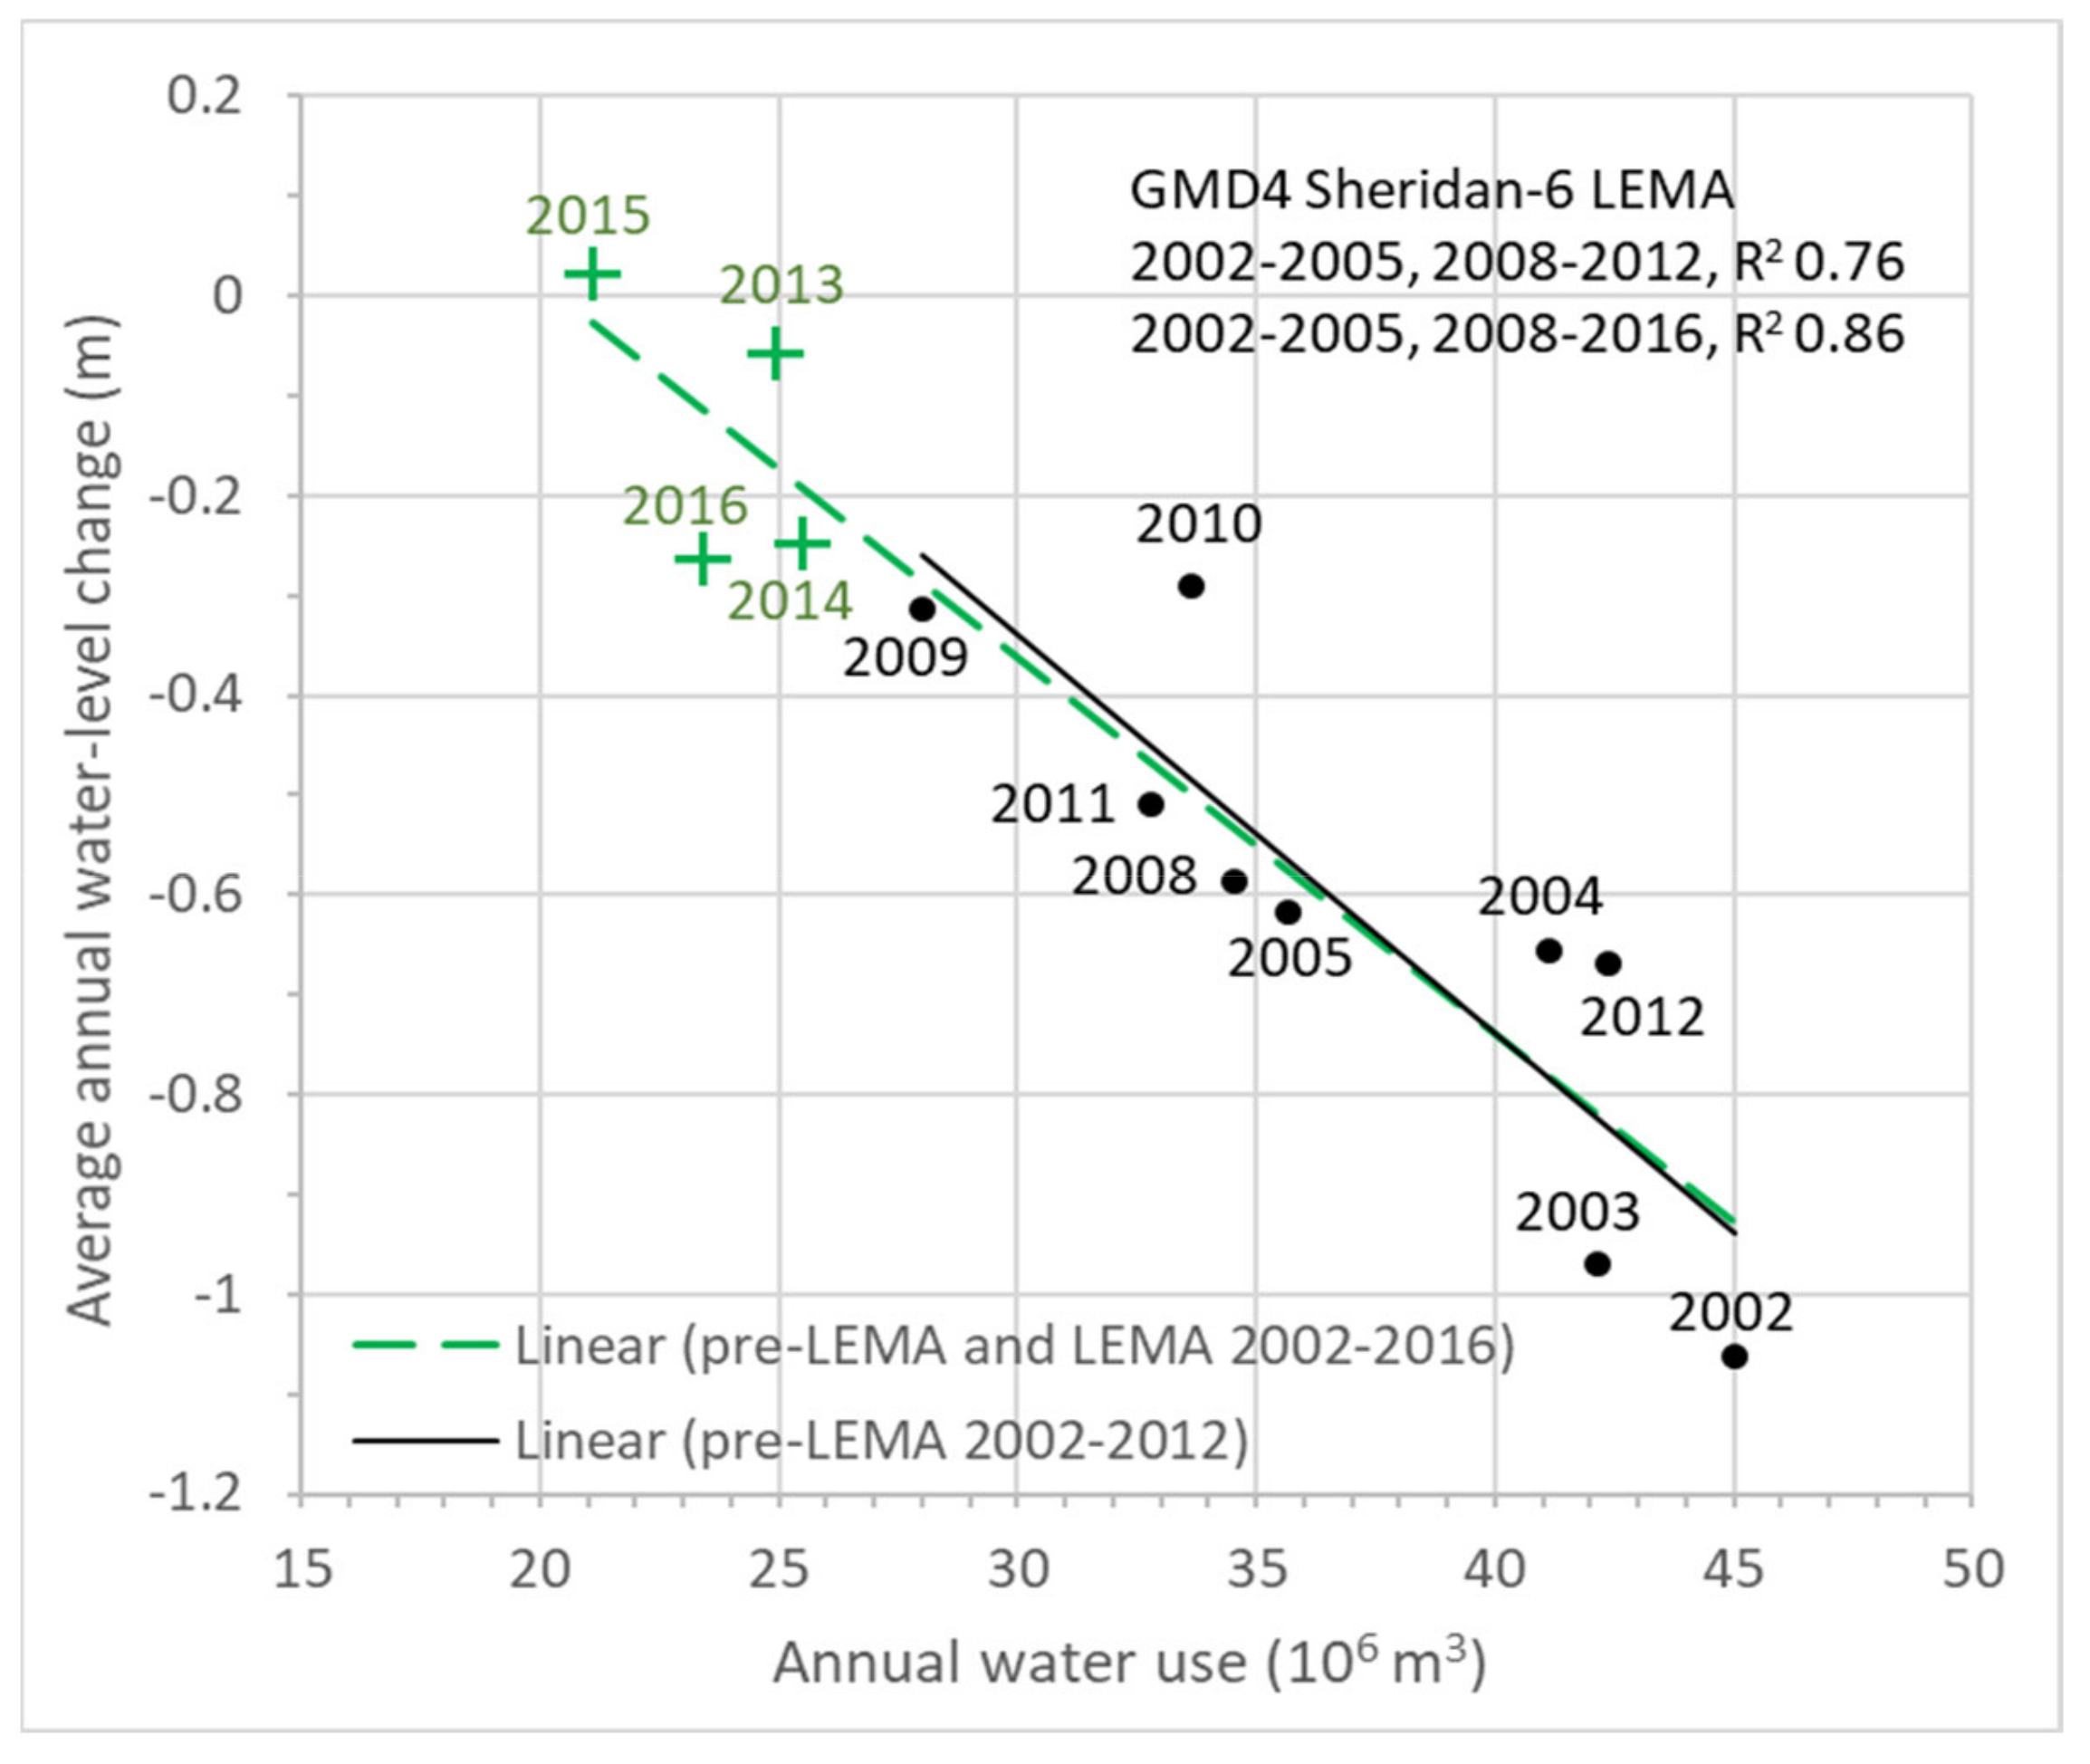
4.3. Impacts of Conservation on Groundwater Depletion

Because irrigation is managed independently on different farms in the Ogallala region, and because of the heterogeneity of the groundwater characteristics, weather, and irrigation management, it has been difficult to quantify impacts of conservation on groundwater depletion. Implementation of the SD-6 LEMA in 2013 provided a unique opportunity to monitor cumulative impacts of the concentrated adoption of irrigation technologies and efficient management on a community scale. Whittemore et al. [20] found that annual water use in the SD-6 area declined with growing season precipitation across the region with lower water use after implementation of the LEMA compared to prior to LEMA. Butler et al. [58] found a similar relationship (Figure 2) using annual precipitation from the PRISM system [59]. These studies demonstrated that implementation of the LEMA policy resulted in the intended reduced extraction of water from the aquifer.
Even more encouraging, not only was groundwater pumping reduced, but the groundwater level decline was reduced during the LEMA years. Additionally, the slope of trajectory of water level change relative to water pumped flattened (Figure 3). Both linear per-LEMA and full period relationships were significant (p = 0.002 and p < 0.001) and the ratio of the slope for the period including the LEMA years to the pre-LEMA years was 0.94. These results from SD-6 are rare, because all water users within a contiguous area were required to reduce water pumping.
Irrigation pumping in a given system is affected by combinations of precipitation and evapotranspiration. To examine water conservation impacts at a GMD-wide level, a regression equation was developed to relate annual water use to growing season precipitation and summer ET rates for GMD No. 4 (See Appendix A). The equation was applied to estimate water use for the years 2005–2017, prior to the impacts of new district-wide LEMA which started in 2018. Figure 4 shows that the 2018–2020 reported water use across the entire GMD 4 was lower than would have been predicted based on the growing season climate. While three years of results do not allow comprehensive statistical analysis, the result is an important indication that the culture of water conservation under innovative water policy is impacting water extraction.
A similar response was seen in GMD No. 3 (Figure 5), which did not have a LEMA in the GMD, but which had producers participating in WTFarms, WCAs, and other water conservation programs that had been made possible by evolving water law and policy in Kansas (Table 1).

5. Applicability to Other States and Regions

The diversity of climate and water availability in the US Great Plains makes it a good test site for technologies that can be introduced in other regions of the world. Given the diversity of water policy environments in states overlaying the Ogallala Aquifer (Table 2), many states lack the legal and policy basis for flexible local management that have proved successful in Kansas in reducing water pumping. It remains to be seen the extent to which policies and programs to establish collective conservation areas are essential to reduce or stem depletion of the aquifer. However, the Ogallala overall is depleting, and there is a need and potential to extend the demonstrated innovations in technology and management to enhance irrigation efficiency and reduce annual water extractions across the region.
The irrigated area has changed differently in different portions of the Great Plains for a variety of reasons [12]. While Kansas irrigated acres have only declined by 1.3 percent (16,313 ha) from 1989 to 1997, regional changes are more dramatic (Table 3). In western Kansas, which basically covers GMD Nos. 1, 3, and 4, about 11% (102,942 ha) of irrigated area has been converted to dryland agriculture. On the Eastern side of Kansas, there has been a 93% (19,601 ha) increase in irrigated agriculture. This is reflective of what is happening across the Great Plains and the whole US. Irrigated area in some GMDs in Nebraska have decreased due to local regulation of water use; Wyoming irrigated area was decreased by federal programs to retire water rights; and in other regions due to declines in well capacity. Some regions have increased irrigated area as efficient technologies were adopted allowing a given amount of water to be applied to more land. Quintana et al. [62] evaluated groundwater extraction under irrigation scenarios that included climate change and technical change and found that optimal groundwater extraction would peak in western Kansas by about 2040. When accounting for climate change, gains from management were almost 30%, compared to about 6% in prior studies which ignored climate and technical change.
Irrigation technology and management innovations are widely promoted for adoption on a field or farm scale. However, without the flexibility provided by multi-year water allocations and ability to transfer water from one water right to another or one use to another, producers may not invest in these technologies. Additionally, if water savings achieved by more efficient technology or management are not “banked” for future years but instead are applied to a different area, then the potential of groundwater depletion reduction will not be realized. Edwards and Guilfoos [63] evaluated groundwater governance in contrasting basins and found that while broad, basin-wide solutions to over-allocation are limited, when policies allow for more stringent pumping controls then externality problems associated with groundwater over-pumping can be reduced.
Whittemore et al. [20] analyzed annual water use and annual water level change from 2009 to 2016 and determined that the zero water level change intercept occurred at 31, 33, and 27% reduced pumping for GMD Nos. 1, 3, and 4, relative to the 2009–2016 average. While these reductions are substantial, they provide a tangible goal which individuals as well as GMDs could adopt. The WCA and WTFarms are voluntary programs where water right holders agree to reduced water allocations in exchange for increased flexibility on use of the water. There are many cost-share and technical assistance resources available to help irrigators in these voluntary programs to find technology and management systems that will allow them to sustain their productivity and income while using less water.
In many cases, participants in these programs have reduced their water applications even more than agreed to in their agreements. The question is whether irrigators will widely adopt innovative technologies and management and voluntarily reduce their total water extractions. The results of the WTA, WTFarms, and LEMA programs are showing a path toward a “new normal” of what irrigation could look like in the area. Bertone et al. [64] found that farmers manage groundwater allocations dynamically, even if the water rights do not incentivize them to do so based on crop and energy prices or practices of their neighbors. In the High Plains Aquifer region of Kansas covering 1990–2014, Sampson and Perry [65] found clear evidence of peer influence in adoption of LEPA systems from 1990–2014. Concern for the future value of their land and enterprises may provide another motivation for change. As the variability of aquifer characteristics are better understood through monitoring and detailed analysis (e.g., 23), irrigators in areas where velocity in the aquifer is low are seeing that the benefits of conservation are relatively localized which may be motivation to adopt more stringent water conservation practices to extend the value of their farms and sustainability of their communities over decadal time scales.
In promoting water conservation, it is important to learn from past experiences. In a meta-analysis of social science research, Witzling et al. [66] found that farmers got information from three or more sources when considering change. Preferred sources included extension and university sources, NRCS, soil and water conservation districts, and peers, but also crop advisors, input providers, and traditional as well as digital media. Weather, time, and economics, rather than lack of information, were identified as major challenges to conservation adoption in the studies they considered, but information was important to producers. In a survey analysis, agricultural consultants indicated in-person contact works best with farmers and landowners, and that excessive application time and paperwork for some programs reduces number of clients worked with as well as the interest of producers. The consultants suggested that when new programs or changes in existing programs are being planned, policy makers should focus on streamlined paperwork, consistent rules and approaches across programs, and communicating changes far in advance of implementation [67].
Innovative policy implemented in Kansas following enabling state legislation over recent decades (Table 1), supported by a decades-long commitment to research that has provided irrigation technology and management innovations [26,49], along with creative local–state–federal and private–public partnerships have focused on transfer of the new technologies and management to end users [14]. The most noted success today has been in the collective action implemented in GMD No. 4, the SD-6 LEMA, which has demonstrated that reduced water pumping resulted in low to no groundwater depletion in the years immediately after implementation (Figure 3). Even more encouraging is the fact that irrigators who have enrolled in one or more of the innovative programs have conserved more water than their set goals. Flexibility of the new programs through multi-year allocations, banking of water not used in a given year, and shifting water across multiple water rights or uses on a farm are promising avenues to engage irrigators toward more sustainable irrigation in the Ogallala region.

Author Contributions

Conceptualization, J.L.S. and M.U.; methodology, J.L.S.; validation, S.P.; J.P.A.; and M.U.; data curation, M.U., S.P; writing—original draft preparation, J.L.S.; writing—review and editing, D.L.D., E.A.S., J.P.A., B.G., and S.P.; visualization, S.P.; project administration, M.U. All authors have read and agreed to the published version of the manuscript.

Funding

The first author was supported in this work by USDA-NIFA Award Number 2019-69012-29853.

Data Availability Statement

Water use data used to prepare Figure 2, Figure 3, Figure 4 and Figure 5, as well as water use and irrigated area in Table 3 are available at: https://agriculture.ks.gov/divisions-programs/dwr/water-appropriation/water-use-reporting (accessed on 27 September 2021).

Acknowledgments

The authors acknowledge the Kansas Water Authority and Kansas Water Office for information provided in the 2021 Kansas Water Authority Annual Report to the Governor and Legislature.

Conflicts of Interest

The authors declare no conflict of interest.

Abbreviations

GMDGroundwater Management District
IGUCAIntensive Groundwater Use Control Area
KSREKansas State Research and Extension
LEMALocal Enhanced Management Area
LEPALow-Energy Precision Application
LESALow Elevation Spray Application
MDIMobile Drip Irrigation
SDISub-Surface Drip Irrigation
WCAWater Conservation Area
WRISWater Rights Information System

Appendix A

Reported groundwater pumping for irrigation was queried from the KDA-DWR Water Rights Information System (WRIS) and summarized for each GMD for years 2000–2020. Predictive variables are based on monthly precipitation and temperature data that were downloaded from PRISM [59] at https://prism.oregonstate.edu/ (accessed on 29 November 2021), sampled at PLSS section centroids, and spatially averaged over each GMD’s extent. Sampled temperature data (monthly average daily maximum and minimum, tmax and tmin) were used to calculate monthly ET for each PLSS section, as approximated by Hargreaves and Samani [68] following a procedure described by Snyder and Eching [69]. ET was spatially averaged over PLSS sections in each GMD’s extent. Predictive variables are sums over selected ranges of monthly ET (July–August) and precipitation (March–June) and are plotted for GMD 4 (Figure A1) and GMD 3 (Figure A2). Ranges of months selected as predictive variables were arrived at by trial and error, guided by coefficient of determination (r-squared), standard error of estimate, and coefficient p-values. Regressions were calculated with Microsoft Excel’s regression tool. The range of years included in the regression begins with 2005 or 2006 to exclude early years when water use reporting based on metered wells was ramping up. The estimator error increases significantly after 2017, so years of regression end in 2017, and estimates for 2018–2020 are based on regression conditions through 2017 (Figure A3 and Figure A4).
Figure A1. Predictive climatological variables used to estimate pumping for GMD 4 2000–2020 are reference ET (Jul–Aug, blue) and precipitation (Mar–June, orange), both plotted against the left axis. Annual precipitation, plotted against the righthand axis, is shown for comparison.
Water 13 03406 g0a1
Figure A2. Predictive climatological variables used to estimate pumping for GMD 3 2000–2020 are reference ET (Jul–Aug, blue) and precipitation (Mar–June, orange), both plotted against the left axis. Annual precipitation, plotted against the righthand axis, is shown for comparison.
Water 13 03406 g0a2
Figure A3. GMD 4 reported and estimated * pumping 2000–2020 using a regression based on 2005–2017 data.
Water 13 03406 g0a3
Figure A4. GMD 3 reported and estimated * pumping 2000–2020 using a regression based on 2006–2017 data.
Water 13 03406 g0a4

References

  1. Gowda, P.; Steiner, J.L.; Olson, C.; Boggess, M.; Farrigan, T.; Grusak, M.A. Agriculture and Rural Communities. In Impacts, Risks, and Adaptation in the United States: Fourth National Climate Assessment, Volume II; Reidmiller, D.R., Avery, C.W., Easterling, D.R., Kunkel, K.E., Lewis, K.L.M., Maycock, T.K., Stewart, B.C., Eds.; U.S. Global Change Research Program: Washington, DC, USA, 2018; pp. 391–437. [Google Scholar] [CrossRef]
  2. IPCC. 2021: Summary for Policymakers. 2021. In Climate Change 2021: The Physical Science Basis. Contribution of Working Group I to the Sixth Assessment Report of the Intergovernmental Panel on Climate Change; Masson-Delmotte, V., Zhai, P., Pirani, A., Connors, S.L., Péan, C., Berger, S., Caud, N., Chen, Y., Goldfarb, L., Gomis, M.I., et al., Eds.; Cambridge University Press: Cambridge, UK, in press; Printed October 2021 by the IPCC, Switzerland.
  3. Kukal, M.S.; Irmak, S. Impact of irrigation on interannual variability in United States agricultural productivity. Agric. Water Manag. 2020, 234, 106141. [Google Scholar] [CrossRef]
  4. Rehkamp, S.; Canning, P.; Birney, C. Tracking the U.S. Domestic Food Supply Chain’s Freshwater Use over Time; U.S. Department of Agriculture, Economic Research Service: Washington, DC, USA, 2021; ERR-288.
  5. Gleick, P.H.; Pacific Institute; Ajami, N.; Christian-Smith, J.; Cooley, H.; Donnelly, K.; Fulton, J.; Ha, M.-L.; Heberger, M.; Moore, E.; et al. The World’s Water: The Biennial Report on Freshwater Resources Volume 8; Island Press: Washington, DC, USA, 2014. [Google Scholar]
  6. Dieter, C.A.; Maupin, M.A.; Caldwell, R.R.; Harris MAIvahnenko, T.I.; Lovelace, J.K.; Barber, N.L.; Linsey, K.S. Estimated Use of Water in the United States in 2015; U S Geological Survey Circular 1441, U.S. Department of the Interior, U.S. Geological Survey: Reston, VA, USA, 2018. [Google Scholar]
  7. Famiglietti, J.S.; Ferguson, G. The hidden crisis beneath our feet: Disappearing groundwater requires widespread action to prevent widespread water scarcity. Science 2021, 372, 344–345. [Google Scholar] [CrossRef]
  8. Qi, S.L. Digital Map of Aquifer Boundary for the High Plains Aquifer in Parts of Colorado, Kansas, Nebraska, New Mexico, Oklahoma, South Dakota, Texas, and Wyoming: U.S. Geological Survey Data Series 543. 2010. Available online: http://pubs.usgs.gov/ds/543/ (accessed on 29 November 2021).
  9. Gowda, P.; Bailey, R.; Kisekka, I.; Lin, X.; Uddameri, V. Featured series introduction: Optimizing Ogallala Aquifer water use to sustain food systems. JAQWA 2019, 55, 3–5. [Google Scholar] [CrossRef] [Green Version]
  10. McGuire, V.L. Water-Level and Recoverable Water in Storage Changes, High Plains Aquifer, Predevelopment to 2015 and 2013–15; U.S. Geological Survey Scientific Investigations Report 2017–5040, U.S. Geological Survey: Reston, VA, USA, 2017; 14p. [Google Scholar] [CrossRef]
  11. Steiner, J.L.; Briske, D.D.; Brown, D.P.; Rottler, C.M. Vulnerability of Southern Plains agriculture to climate change. Clim. Chang. 2018, 146, 201–218. [Google Scholar] [CrossRef] [Green Version]
  12. Deines, J.M.; Kendall, A.D.; Crowley, M.A.; Rapp, J.; Cardille, J.A.; Hyndman, D.W. Mapping three decades of annual irrigation across the US High Plains Aquifer using Landsat and Google Earth Engine. Rem. Sen. Environ. 2019, 233, 111400. [Google Scholar] [CrossRef]
  13. Bailey, R.T.; Schipanski, M.E.; Kisekka, I. Special issue introduction: Managing the Ogallala. Agric. Water Manag. 2020, 233, 106405. [Google Scholar] [CrossRef]
  14. Evett, S.R.; Colaizzi, P.D.; Lamm, F.R.; O’Shaughnessy, S.A.; Heeren, D.M.; Trout, T.J.; Kranz, W.L.; Lin, X. Past, present and future of irrigation on the U.S. Great Plains. Trans. ASABE 2020, 63, 703–729. [Google Scholar] [CrossRef]
  15. Musgrove, M. Groundwater Quality in the High Plains Aquifer: U.S. Geological Survey Fact Sheet 2019-3055; Kansas Geological Survay: Lawrence, KS, USA, 2020; 4p. [Google Scholar] [CrossRef] [Green Version]
  16. Lauer, S.; Sanderson, M.R.; Manning, D.T.; Suter, J.F.; Hrozencik, R.A.; Guerrero, B.; Golden, B. Values and groundwater management in the Ogallala Aquifer region. J. Soil Water Conserv. 2018, 3, 593–600. [Google Scholar] [CrossRef]
  17. Guerrero, B.B.; Golden, K.; Schoengold, J.; Suter, A.; Stoeker, C.; Goemans, D. Manning. Groundwater laws across the Ogallala Aquifer region. Colo. Water 2017, 34, 12–16. [Google Scholar]
  18. Rogers, D.H.; Powell, G.M.; Ebert, K. Water Primer, Part 5: Water Law; Kansas State University: Manhattan, KS, USA, 2013; MF-3024. [Google Scholar]
  19. Kansas Department of Agriculture (KDA). Irrigation Water Use in Kansas, 2017. KDA Division of Water Resources in Cooperation with the United States Geological Survey. 2017. Available online: https://agriculture.ks.gov/divisions-programs/dwr/water-appropriation/water-use-reporting (accessed on 27 September 2021).
  20. Whittemore, D.O.; Butler, J.J., Jr.; Wilson, B.B. Status of the High Plains Aquifer in Kansas. In Kansas Geological Survey 2018; Technical Series 22; Kansas Geological Survey: Lawrence, KS, USA, 2018; Available online: http://www.kgs.ku.edu/Publications/Bulletins/TS22/index.html (accessed on 10 September 2021).
  21. Rogers, D.H.; Lamm, F.R. Kansas Irrigation Trends. In Proceedings of the 24th Annual Central Plains Irrigation Conference, Colby, KS, USA, 21–22 February 2012; Thompson: Colby, KS, USA, 2012. [Google Scholar]
  22. Luckey, R.R.; Gutentag, E.D.; Weeks, J.B. Water-Level and Saturated-Thickness Changes, Predevelopment to 1980, in the High Plains Aquifer in Parts of Colorado, Kansas, Nebraska, New Mexico, Oklahoma, South Dakota, Texas, and Wyoming: U.S. Geological Survey Hydrologic Investigations Atlas 1981, HA-652, 2 Sheets, Scale 1:2,500,000. Available online: https://pubs.er.usgs.gov/publication/ha652 (accessed on 29 November 2021).
  23. Stotler, R.; Butler, J.J., Jr.; Buddemeier, R.W.; Bohling, G.C.; Comba, S.; Jin, W.; Reboulet, E.; Whittemore, D.O.; Wilson, B.B.; Munson, J.; et al. High Plains Aquifer Calibration Monitoring Well Program: Fourth Year Progress Report; Kansas Geological Survey; Open-File Report No. 2011-4; Kansas Geological Survey: Lawrence, KS, USA, 2011. [Google Scholar]
  24. Patrignani, A.; Knapp, M.; Redmond, C.; Santos, E. Technical overview of the Kansas Mesonet. J. Atmos. Ocean. Technol. 2020, 37, 2167–2183. [Google Scholar] [CrossRef]
  25. Schipanski, M.E.; Kremen, A. Linking innovations in practices and policies for groundwater conservation across the Ogallala aquifer region. In Proceedings of the 30th Annual Central Plains Irrigation Conference, Colby, KS, USA, 20–21 February 2018. [Google Scholar]
  26. Lamm, F.R.; Stone, K.C.; Dukes, M.D.; Howell, T.A., Sr.; Robbins, J.W.D., Jr.; Mecham, B.Q. Emerging technologies for sustainable irrigation: Selected papers from the 2015 ASABE and IA irrigation symposium. Trans. ASABE 2016, 59, 155–161. [Google Scholar]
  27. Lamm, F.R.; Bordovsky, J.P.; Howell, T.A., Sr. A review of in-canopy and near-canopy sprinkler irrigation concepts. Trans. ASABE 2019, 62, 1355–1364. [Google Scholar] [CrossRef]
  28. Bordovsky, J.P. Low-energy precision application (LePA) irrigation: A forty-year review. Trans. ASABE 2019, 62, 1343–1353. [Google Scholar] [CrossRef]
  29. Goyal, M.R. Management of Drip/Trickle or Micro Irrigation; CRC Press: Boca Raton, FL, USA; Academic Press: Cambridge, MA, USA, 2012; 350p, ISBN 9781774632000. [Google Scholar]
  30. Oker, T.E.; Kisekka, I.; Sheshukov, A.Y.; Aguiar, J.; Rogers, D. Evaluation of dynamic uniformity and application efficiency of mobile drip irrigation. Irrig. Sci. 2020, 38, 17–35. [Google Scholar] [CrossRef]
  31. Kisekka, I.; Oker, T.; Nguyen, G.; Aguilar, J.; Rogers, D. Revisiting precision mobile drip irrigation under limited water. Irrig. Sci. 2017, 35, 483–500. [Google Scholar] [CrossRef]
  32. Evett, S.R.; Marek, G.W.; Colaizzi, P.D.; Brauer, D.K.; O’Shaughnessy, S.A. Corn and sorghum ET, E, yield and CWP affected by irrigation application method: SDI versus mid-elevation spray irrigation. Trans. ASABE 2019, 62, 1377–1393. [Google Scholar] [CrossRef]
  33. Oker, T.E.; Kisekka, I.; Sheshukov, A.Y.; Aguilar, J.; Rogers, D.H. Evaluation of maize production under mobile drip irrigation. Agric. Water Manag. 2018, 210, 11–21. [Google Scholar] [CrossRef]
  34. Reynolds, S.; Guerrero, B.; Golden, B.; Amosson, S.; Marek, T.; Bell, J.M. Economic feasibility of conversion to mobile drip irrigation in the Central Ogallala region. Irrig. Sci. 2020, 38, 569–575. [Google Scholar] [CrossRef]
  35. Goebel, T.S.; Lascano, R.J. Rainwater use by cotton under subsurface drip and center pivot irrigation. Agric. Water Manag. 2019, 215, 1–7. [Google Scholar] [CrossRef]
  36. Evett, S.R.; O’Shaughnessy, S.A.; Andrade, M.A.; Kustas, W.P.; Anderson, M.C.; Schomberg, H.H.; Thompson, A.I. Precision agriculture and irrigation: Current U.S. perspectives. Trans. ASABE 2020, 63, 57–67. [Google Scholar] [CrossRef]
  37. O’Shaughnessy, S.A.; Evett, S.R.; Colaizzi, P.D.; Andrade, M.A.; Marek, T.H.; Heeren, D.M.; Lamm, F.R.; LaRue, J.L. Identifying advantages and disadvantages of variable rate irrigation: An updated review. Appl. Engin. Agric. 2019, 35, 837–852. [Google Scholar] [CrossRef]
  38. Taghvaeian, S.; Andales, A.A.; Allen, N.L.; Kisekka, I.; O’Shaughnessy, S.A.; Porter, D.O.; Sui, R.; Irmak, S.; Fulton, A.; Aguilar, J. Irrigation scheduling for agriculture in the United States: The progress made and the path forward. Trans. ASABE 2020, 63, 1603–1618. [Google Scholar] [CrossRef]
  39. Dhungel, R.; Aiken, R.; Evett, S.R.; Colaizzi, P.D.; Marek, G.; Moorhead, J.E.; Baumhardt, R.L.; Brauer, D.K.; Kutikoff, S.; Lin, X. Energy imbalance and evapotranspiration hysteresis under an advective environment: Evidence from lysimeter, eddy covariance, and energy balance modeling. Geophys. Res. Lett. 2020, 48, e2020GL091203. [Google Scholar] [CrossRef]
  40. Evett, S.R.; Marek, G.W.; Colaizzi, P.D.; Brauer, D.K.; Howell, T.A., Sr. Are crop coefficients for SDI different from those for sprinkler irrigation application? Trans. ASABE 2020, 63, 1233–1242. [Google Scholar] [CrossRef]
  41. Araya, A.; Prasad, P.V.V.; Gowda, P.H.; Sharda, V.; Rice, C.W.; Ciampitti, I.A. Evaluating optimal irrigation strategies for maize in Western Kansas. Agric. Water Manag. 2021, 246, 106677. [Google Scholar] [CrossRef]
  42. Thapa, S.; Xue, Q.; Marek, T.H.; Xu, W.; Porter, D.; Jessup, K.E. Corn production under restricted irrigation in the Texas High Plains. Agron. J. 2020, 112, 1190–1200. [Google Scholar] [CrossRef]
  43. Evett, S.R.; Stone, K.C.; Schwartz, R.C.; O’Shaughnessy, S.A.; Colaizzi, P.D.; Anderson, S.K.; Anderson, D.J. Resolving discrepancies between laboratory-determined field capacity values and field water content observations: Implications for irrigation management. Irrig. Sci. 2019, 37, 751–759. [Google Scholar] [CrossRef] [Green Version]
  44. Bhattarai, B.; Singh, S.; West, C.P.; Ritchie, G.L.; Trostle, C.L. Water depletion pattern and water use efficiency of forage sorghum, pearl millet, and corn under water limiting condition. Agric. Water Manag. 2020, 238, 106206. [Google Scholar] [CrossRef]
  45. Bhattarai, B.; Singh, S.; West, C.P.; Ritchie, G.L.; Trostle, C.L. Effect of deficit irrigation on physiology and forage yield of forage sorghum, pearl millet, and corn. Crop Sci. 2020, 60, 2167–2179. [Google Scholar] [CrossRef]
  46. Katuwal, K.B.; Cho, Y.; Singh, S.; Angadi, S.V.; Begna, S.; Stamm, M. Soil water extraction pattern and water use efficiency of spring canola under growth-stage-based irrigation management. Agric. Water Manag. 2020, 239, 106232. [Google Scholar] [CrossRef]
  47. Himanshu, S.K.; Ale, S.; Bordovsky, J.; Darapuneni, M. Evaluation of crop-growth-stage-based deficit irrigation strategies for cotton production in the Southern High Plains. Agric. Water Manag. 2019, 225, 105782. [Google Scholar] [CrossRef]
  48. Baumhardt, R.L.; Haag, L.A.; Gowda, P.H.; Schwartz, R.C.; Marek, G.W.; Lamm, F.R. Modeling cotton growth and yield response to irrigation practices for thermally limited growing seasons in Kansas. Trans. ASABE 2021, 64, 1–12. [Google Scholar] [CrossRef]
  49. Lamm, F.R.; Porter, D.O.; Bordovsky, J.P.; Evett, S.R.; O’Shaughnessy, S.A.; Stone, K.C.; Kranz, W.L.; Rogers, D.H.; Colaizzi, P.D. Targeted, precision irrigation for moving platforms: Selected papers from a center pivot technology transfer effort. Trans. ASABE 2019, 62, 1409–1415. [Google Scholar] [CrossRef]
  50. Kansas Water Authority (KWA). 2021 Kansas Water Authority Annual Report to the Governor and Legislature. 2021. Available online: https://kwo.ks.gov/about-the-kwo/kansas-water-authority (accessed on 28 September 2021).
  51. Kansas Water Office (KWO). Water Technology Farm Report, Growing Season 2019. 2020. Available online: https://www.kwo.ks.gov/projects/water-technology-farms (accessed on 28 September 2021).
  52. Drysdale, K.M.; Hendricks, N.P. Adaptation to an irrigation water restriction imposed through local governance. J. Environ. Econ. Manag. 2018, 91, 150–165. [Google Scholar] [CrossRef]
  53. Golden, B. Monitoring the Impacts of Sheridan County 6 Local Enhanced Management Area. Final Report for 2013–2017; Kansas Water Office Contract #15-0112; Kansas Water Office: Topeka, KS, USA, 2018; Available online: https://www.agmanager.info/ag-policy/water-policy/monitoring-impacts-sheridan-county-6-local-enhanced-management-area (accessed on 30 August 2021).
  54. Golden, B.; Leibsch, K. Monitoring the impacts of Sheridan County 6 Local Enhanced Management Area. Interim Report for 2013–2016. In Proceedings of the 30th Annual Central Plains Irrigation Conference, Colby, KS, USA, 20–21 February 2018; Available online: https://www.agmanager.info/contributors/golden (accessed on 30 August 2021).
  55. Deines, J.M.; Kendall, A.D.; Butler, J.J.; Hyndman, D.W. Quantifying irrigation adaptation strategies in response to stakeholder-driven groundwater management in the US High Plains Aquifer. Environ. Res. Lett. 2019, 14, 044014. [Google Scholar] [CrossRef]
  56. Zwickle, A.; Feltman, B.C.; Brady, A.J.; Kendall, A.D.; Hyndman, D.W. Sustainable irrigation through local collaborative governance: Evidence for a structural fix in Kansas. Environ. Sci. Pol. 2021, 124, 517–526. [Google Scholar] [CrossRef]
  57. Deines, J.M.; Schipanski, M.E.; Golden, B.; Zipper SCNozari, S.; Rottler, C.; Guerrero, B.; Sharda, V. Transitions from irrigated to dryland agriculture in the Ogallala Aquifer: Land use suitability and regional economic impacts. Agric. Water Manag. 2020, 233, 106061. [Google Scholar] [CrossRef]
  58. Butler, J.J., Jr.; Bohling, G.C.; Whittemore, D.O.; Wilson, B.B. Charting pathways towards sustainability for aquifers supporting irrigated agriculture. Water Resour. Res. 2020, 56, e2020WR027961. [Google Scholar] [CrossRef]
  59. Daly, C.; Bryant, K. Daly. The PRISM Climate and Weather System—An Introduction. 2013. Available online: http://www.prism.oregonstate.edu/documents/PRISM_history_jun2013.pdf (accessed on 29 November 2021).
  60. Butler, J.J.; Whittemore, D.O.; Wilson, B.; Brownie, B.; Geoffrey, C. Sustainability of aquifers supporting irrigated agriculture: A case study of the High Plains aquifer in Kansas. Water Intern. 2018, 43, 815–828. [Google Scholar] [CrossRef]
  61. Jacobs, J.J.; Fassett, G.; Brosz, D.J. Wyoming Water Law: A Summary; University of Wyoming, Cooperative Extension Service and Wyoming Water Cent.: Laramie, WY, USA, 1995; B-849R; Available online: http://library.wrds.uwyo.edu/wrp/90-17/90-17.html (accessed on 29 November 2021).
  62. Quintana Ashwell, N.E.; Peterson, J.M.; Hendricks, N.P. Optimal groundwater management under climate change and technical progress. Resourc. Energy Econ. 2018, 51, 67–83. [Google Scholar] [CrossRef] [Green Version]
  63. Edwards, E.C.; Guilfoos, T. The economics of groundwater governance institutions across the globe. Appl. Econ. Perspect. Pol. 2020. [Google Scholar] [CrossRef]
  64. Bertone Oehninger, E.; Lin Lawell, C.-Y.C. Property rights and groundwater management in the High Plains Aquifer. Resour. Energy Econ. 2021, 63, 101147. [Google Scholar] [CrossRef]
  65. Sampson, G.S.; Perry, E.D. Peer effects in the diffusion of water-saving agricultural technologies. Agric. Econ. 2019, 50, 693–706. [Google Scholar] [CrossRef] [Green Version]
  66. Witzling, L.; Wald, D.; Williams, E. Communicating with farmers about conservation practices: Lessons learned from a systematic review of survey studies. J. Soil Water Conserv. 2021, 76, 424–434. [Google Scholar] [CrossRef]
  67. Morris, C.; Arbuckle, J.G.; DeLong, C.; Lindahl, C. Supporting on-the-ground conservationists: The Conservation Practitioner Poll. J. Soil Water Conserv. 2021, 76, 92A–94A. [Google Scholar] [CrossRef]
  68. Hargreaves, G.H.; Samani, Z.A. Reference crop evapotranspiration from temperature. Appl. Eng. Agric. 1985, 1, 96–99. [Google Scholar] [CrossRef]
  69. Snyder, R.L.; Eching, S. Penman-Monteith daily (24-h) and Hargreaves-Samani Equations for Estimating Reference Evapotranspiration from Monthly Data. UC-Davis. Monthly reference ET. 2002 (Revised 2006). Available online: https://www.researchgate.net/profile/Richard-Snyder-2/publication/238006282_Penman-Monteith_daily_24-hour_and_Hargreaves-Samani_Equations_for_Estimating_Reference_Evapotranspiration_from_Monthly_Data/links/540f32540cf2df04e75a2884/Penman-Monteith-daily-24-hour-and-Hargreaves-Samani-Equations-for-Estimating-Reference-Evapotranspiration-from-Monthly-Data.pdf (accessed on 29 November 2021).
Figure 1. Groundwater Management Districts No. 1, 3, and 4 located in the Ogallala Region of the Kansas High Plains Aquifer. Source: Whittemore et al. [20].
Water 13 03406 g001
Figure 2. Water use vs. precipitation 2002–2018 for Sheridan-6 LEMA. Source: data for Figure 5 in Butler et al. [58].
Water 13 03406 g002
Figure 3. Average annual water level change versus annual groundwater use for the SD-6 LEMA in GMD4. Source: data for Figure 3 in Butler et al. [60].
Water 13 03406 g003
Figure 4. GMD No. 4 average reported and estimated water use per unit area for 2005–2017 (base period), 2000–2004, and 2018–2020. See Appendix A for methods.
Water 13 03406 g004
Figure 5. GMD No. 3 average reported vs estimated water use per unit area for 2006–2017 (base period), 2000–2005, and 2018–2020. See Appendix A for methods.
Water 13 03406 g005
Table 1. History of water law and associated policy in Kansas.
YearLawPolicy Implemented under the Law
1945K.S.A. 82a702. Water Appropriation ActEstablished Chief Engineer position in the Division of Water Resources, Department of Agriculture
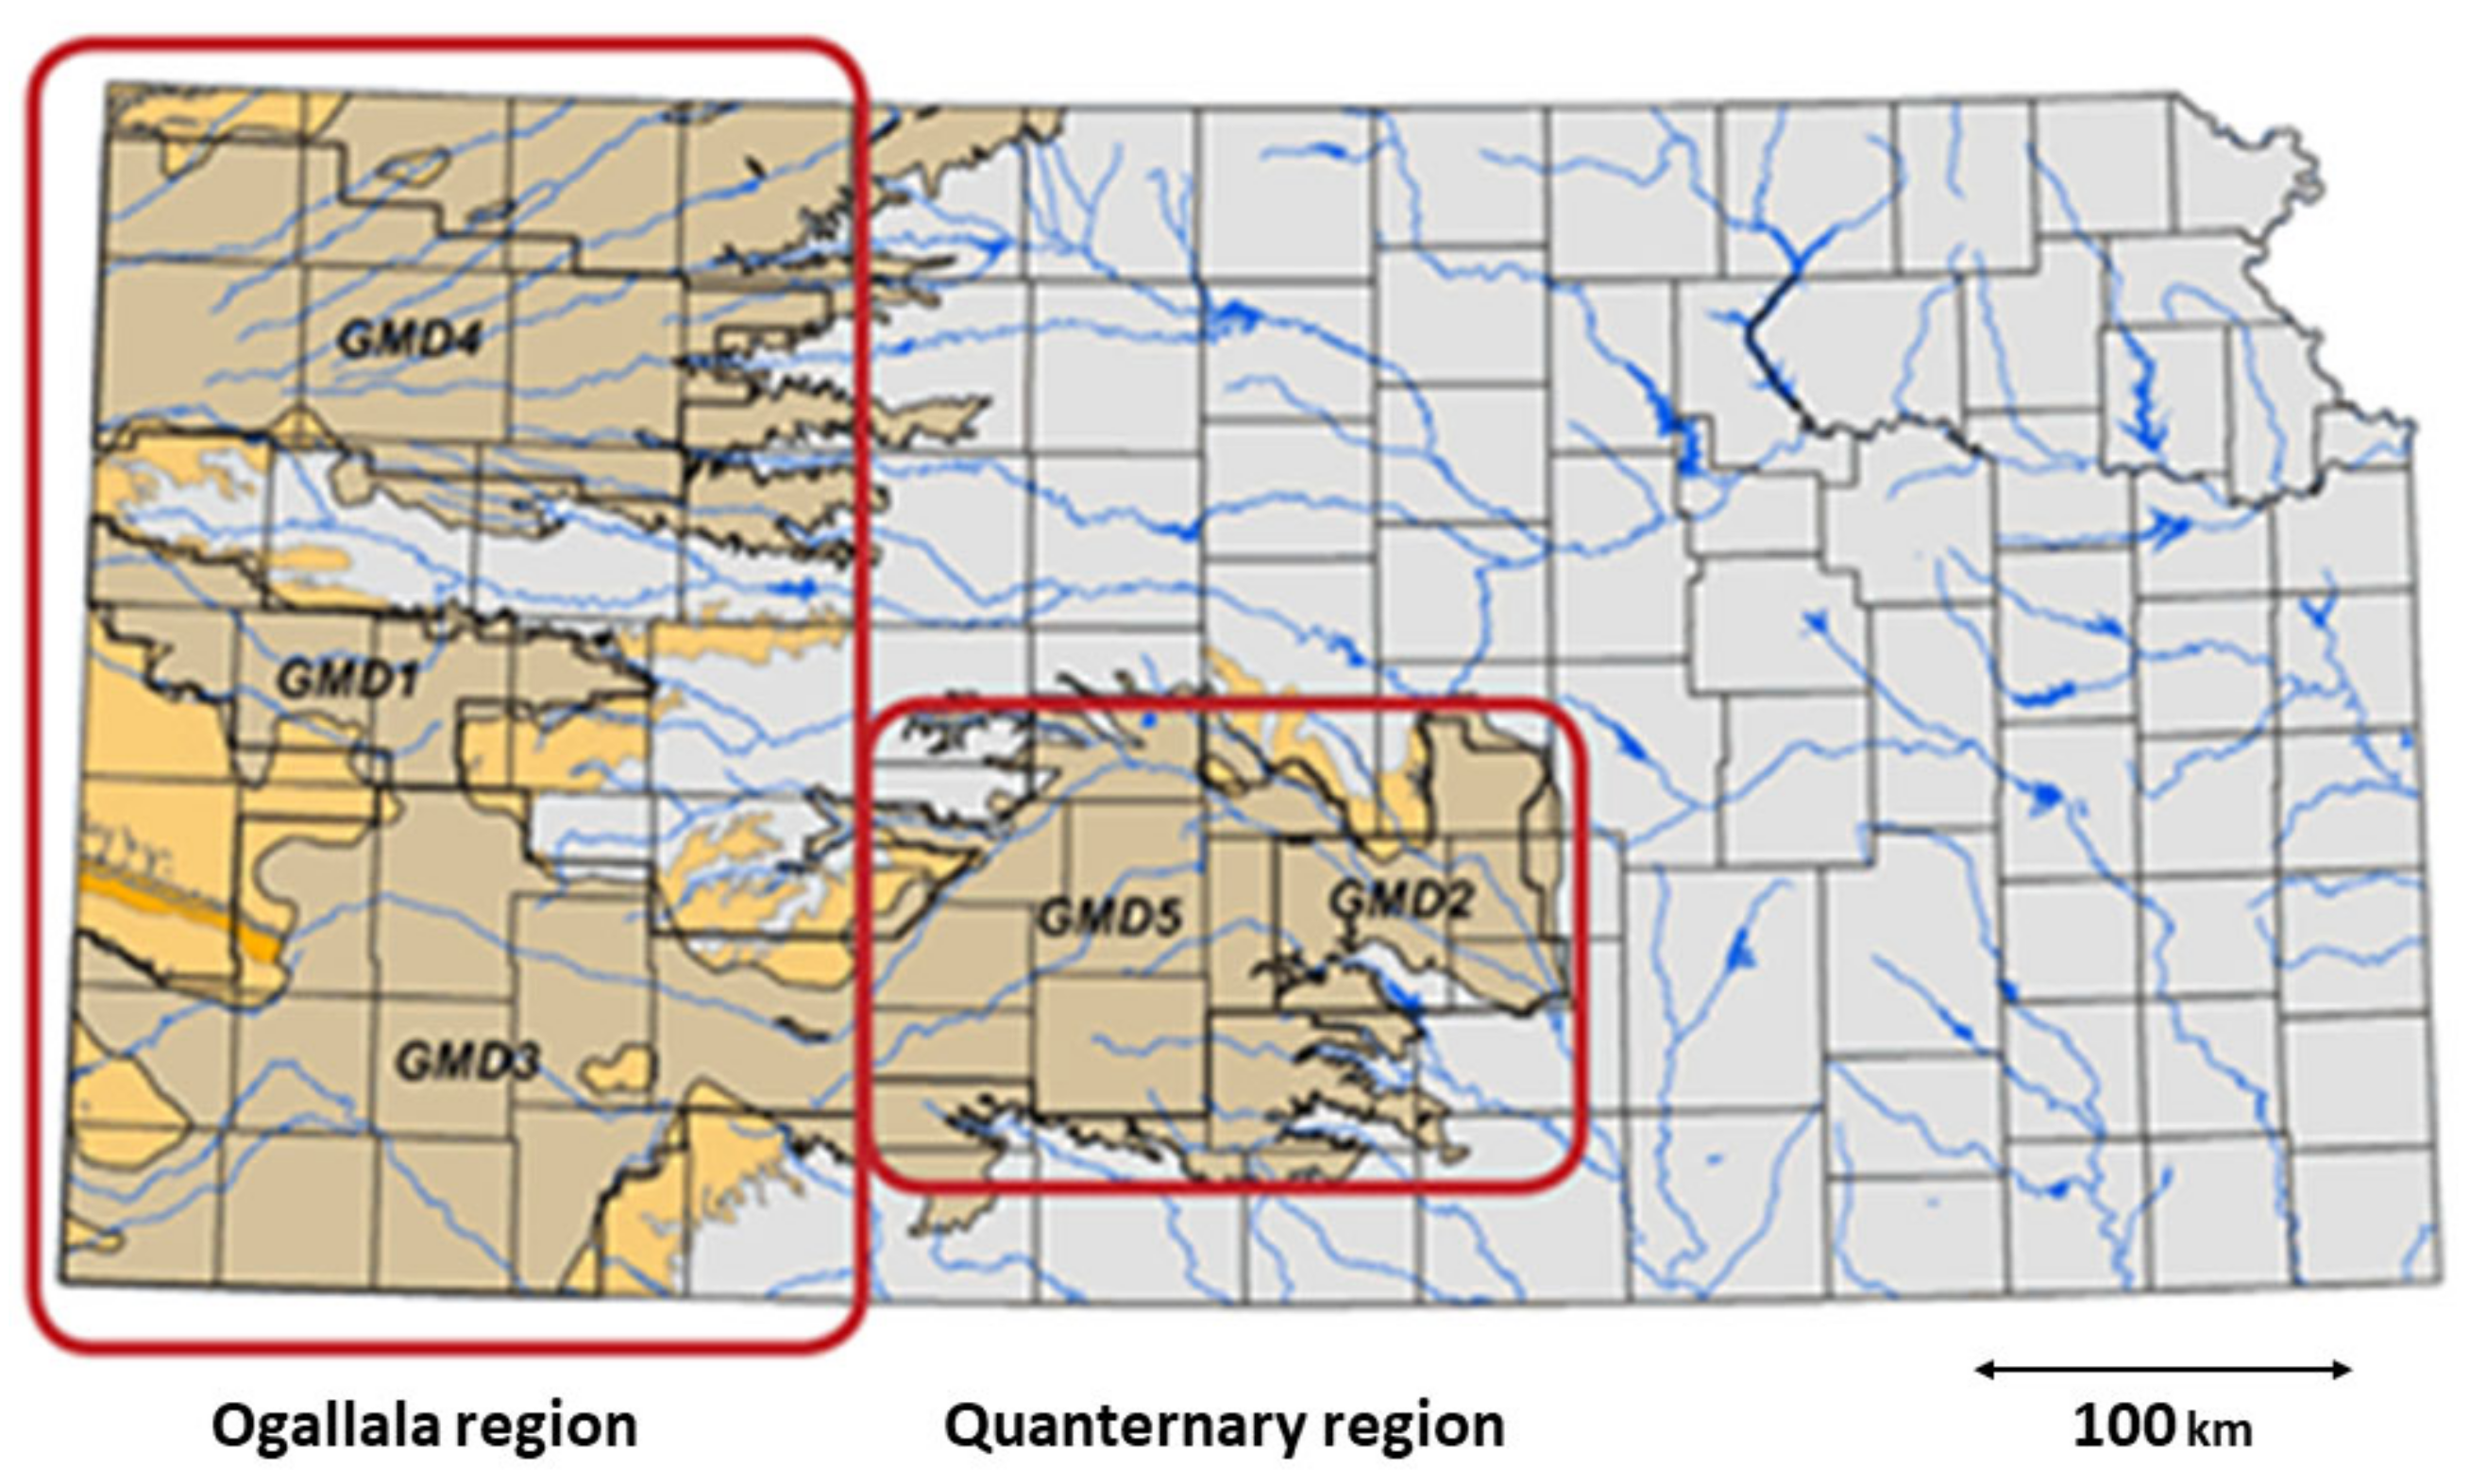
1972K.S.A. 82a-1020 through 82a-1040 Groundwater Management District ActFive groundwater management districts (GMD) established. GMD’s 1, 3, 4 are over the Ogallala Aquifer
1978K.A.R. 5-20-2 Intensive Groundwater Use Control Areas (IGUCA) authorized
1981Kansas Statute 74-2608Kansas Water Office established
1981Kansas Statute 74-2622Kansas Water Authority established
1984K.S.A. 82a-703 a, b, c Minimum streamflows established
2006 Water Transition Assistance Program pilot established for permanent retirement of partial or full water right in targeted areas. Expires 2022.
2012K.S.A. 82a-1041 Local Enhanced Management Areas implemented
2015K.S.A. 82a-745 Water Conservation Areas implemented
Table 2. Contrasting water policy in states overlying the Ogallala Aquifer. Sources: [17,61].
StateWater LawPermitting Agency Local DistrictsPolicy OptionsOther
TexasCommon-law rule of captureNo statewide permitting authorityGroundwater Conservation Areas (WCA) WCA required to develop plans for desired future conditions (DFC). Can limit allowable annual use. 50/50 rule is common for DFC, 50% current aquifer storage remains after 50 years
New MexicoWater belongs to the public. Prior appropriation subject to beneficial use. Water rights are private property. State Engineer OfficeNo Adjudication of water rights in NM has not occurred in NE New Mexico Region.
OklahomaSurface—prior appropriation. Groundwater—property right with appropriation based on land area and availability of unappropriated water. Oklahoma Department of Water ResourcesNoAnnual groundwater use reports required.Permit required for feedlots, irrigation exceeding 3 ac, commercial use exceeding 5 ac-ft.
26 tribes have water rights dating to time of establishment of a reservation
KansasPrior appropriationChief Engineer, KDA5 Groundwater Management Districts, 3 in Ogallala area, with taxing and regulatory authority Metering, moratorium on new wells. See Table 1 for history of water law and policy. GMD policy may require approval of Chief Engineer
ColoradoPrior appropriationColorado Ground Water Commission8, 2 in OgallalaMonitoring, well spacing, new well development Republican R Compact settlement
NebraskaCorrelative rights with reasonable use clauseNebraska Department of Natural Resources23 Natural Resource Districts with taxing authorityWell registration required,
Integrated management plans for linked surface and groundwater
Limited state oversite of NRDs. Policy depends on district, may include flowmeters, multi-year allocations, no net new irrigated area
WyomingPrior appropriation. Water is property of the state. Beneficial use. Wyoming State Engineer Office 3 Control Areas in SE Wyoming with local Advisory Boards that advise State Engineer and Board of Control. Board of Control consisting of State Engineer and four District Supervisors responsible for adjudication of water rights. Permit required well drilling for beneficial use. Irrigation allocation 1cfs per 70 ac.
Table 3. Irrigated area reported to the Kansas Department of Agriculture, Division of Water Resources in 1989 and 2017 [19].
Reporting Unit19892017Change% Change
hahain haSince 1989
GMD 1118,00071,846−46,154−39.1
GMD 3636,379563,788−72,591−11.4
GMD 4145,294158,64413,3509.2
Rest of Western Kansas43,26945,74024725.7
Total of Western Kansas942,941840,017−102,924−10.9
GMD 238,31861,02322,70559.3
GMD 5173,670185,40111,7316.8
Rest of Central Kansas77,971110,54532,57341.8
Total of Central Kansas289,959356,96867,00923.1
Total of Eastern Kansas21,19640,79719,60192.5
Total of State of Kansas1,254,0971,237,783−16,313−1.3
Publisher’s Note: MDPI stays neutral with regard to jurisdictional claims in published maps and institutional affiliations.

