Article

Optimization of Nitrogen Fertilizer Application with Climate-Smart Agriculture in the North China Plain

1
Key Laboratory of Crop Water Use and Regulation, Ministry of Agriculture and Rural Affairs, Institute of Farmland Irrigation, Chinese Academy of Agricultural Sciences, Xinxiang 453002, China
2
College of Agronomy, China Agricultural University, Beijing 100081, China
*
Authors to whom correspondence should be addressed.
Submission received: 23 October 2021 / Revised: 23 November 2021 / Accepted: 28 November 2021 / Published: 3 December 2021

Abstract

:
Long−term excessive nitrogen fertilizer input has resulted in several environmental problems, including an increase in N2O emissions and the aggravation of nitrate leaching; monitoring nitrogen fertilizer is crucial for maize with high yield. This study aimed to optimize the amount of nitrogen applied to maize by Climate−Smart Agriculture (CSA) so as to continuously improve agricultural productivity and reduce or eliminate N2O emissions as much as possible. Field experiments with a completely randomized design were conducted to examine the effects of six nitrogen treatments (N application levels of 0, 120, 180, 240, 300, 360 kg·ha−1, respectively) on N2O emissions, residual concentration of nitrate and ammonium nitrogen, maize yield, and nitrogen utilization efficiency in 2018 and 2019. The results indicated that the residual concentration of nitrate nitrogen ( NO 3 - −N) in the two seasons significantly increased; N2O emissions significantly increased, and the nitrogen fertilizer agronomic efficiency and partial productivity of maize fell dramatically as the nitrogen application rate increased. The maize grain yield rose when the N application amount was raised (N application amount <300 kg·ha−1) but decreased when the N application amount > 300 kg·ha−1. An increase in the nitrogen application rate can decrease nitrogen use efficiency, increase soil NO 3 - −N residual, and N2O emissions. Reasonable nitrogen application can increase maize yield and reduce N2O emissions and be conducive to improving nitrogen use efficiency. By considering summer maize yield, nitrogen use efficiency, and farmland ecological environment, 173.94~178.34 kg N kg·ha−1 could be utilized as the nitrogen threshold for summer maize in the North China Plain.

1. Introduction

Climate−Smart Agriculture (CSA) is an approach to developing agricultural strategies to secure sustainable food security during climate change. CSA includes three essential objectives: (1) improve the adaptability of agricultural production against climate change; (2) minimize agricultural greenhouse gas emissions as much as possible; (3) sustainably increase agricultural productivity and grower incomes. This is the main developing direction for global agricultural production to respond to climate change (www.fao.org, accessed on 9 July 2021). Reducing nitrogen fertilizer input and greenhouse gas emissions in agricultural production is of great significance to realizing CSA. Maize is one of the most widely planted and important food crops worldwide [1]. The application of nitrogen fertilizer is crucial for maize with high yield. However, long-term excessive nitrogen fertilizer input has brought a series of environmental safety problems, such as an increase in N2O emissions, the aggravation of nitrate leaching, and the promotion of soil and water acidification [2,3]. Although more yield can be obtained by increasing nitrogen application, the question is whether the increase in yield is sufficient to offset the negative effects of the correspondingly increased N2O emissions [4]. Farmland total N2O emissions substantially increase in an exponential curve with the increase in the nitrogen application rate, but after a certain amount of nitrogen application, the increase in N2O emissions can be an exponential curve or a sigmoidal curve [5,6]. The leaching risk of NO 3 - −N in soil is not considered in similar optimum nitrogen application rate studies [7], and the results show that with the increase in nitrogen application rate, the risk of soil NO 3 - −N leaching increases [8]. In this study, the content of NO 3 - −N in 0~20 cm soil represents the leaching risk of NO 3 - −N. The higher the content of NO 3 - −N in the maize growing season, the greater the leaching risk.
Higher yield can be obtained by increasing the input of nitrogen fertilizer in a certain range [1]. Previous studies have found that with the increase in the nitrogen application rate, the yield of summer maize could not always increase [9]. Similar conclusions were obtained in the study of the effect of nitrogen application rate on wheat yield [10]. While, with the increase in the nitrogen application rate, the absorption of nitrogen by maize did not further increase and the nitrogen use efficiency decreased [11]. In order to obtain high-yield crops and reduce the leaching of water and nitrogen in different precipitation years, Xu et al. [12] carried out a simulation and found that the most suitable amount of nitrogen application was 140 kg N ha−1 for maize and 240 kg N ha−1 for wheat. Li et al. [13] took soil NO 3 - −N as the main evaluation index in the study of winter wheat and summer maize rotation in the North China Plain (NCP). An N application rate of 110 kg·ha−1 per crop season was recommended for summer maize under the conditions of sprinkler irrigation in the NCP and areas with similar conditions. The determination of the nitrogen threshold depends on the supply of nitrogen from the soil, which is a complex system. This system includes the concentration of nitrate and ammonium at sowing, the mineralization of organic N during the cycle, the losses of available N during the cycle [14], and the requirements of the crop that are associated with the efficiency of the use of the nutrient, etc. [15]. All these factors are modified by the environment (soil and climate) and by the characteristics of the crop. The estimation of the nitrogen threshold is limited and specific to each agroecosystem. However, the significance of this study is to provide a method to determine the amount of nitrogen fertilizer for a long−term model production of crops in this region. The results may be limited, but the method can be used to determine the nitrogen threshold of different crops and regions. The study area, object, and evaluation index directly affect the determination of the nitrogen application threshold. Therefore, in this study, it is more reasonable to determine the nitrogen threshold of summer maize according to the effects of the nitrogen application rate on soil nitrogen content, crop yield, nitrogen use efficiency, and greenhouse gas emissions.
To reasonably evaluate the optimal amount of nitrogen application in maize planting in this region, this study was carried out on the fixed position experimental field with six nitrogen application rates from 2012. The optimal range of nitrogen application was determined, taking into account the environment and yield, to provide a new evaluation method for the study of the best nitrogen application rate for maize.

2. Materials and Methods

2.1. Sampling Site Description

The field experiments were conducted in 2018~2019 at the experimental station of the Institute of Farmland Irrigation, Chinese Academy of Agriculture Sciences, (35°14′ N, 113°76′ E, Qiliying town, Henan Province, China). The locality is in a warm, temperate, continental, monsoon climate. Temperature and rainfall during the two growing seasons are presented in Figure 1. The soil is of a sandy loam texture (4.52% clay, 40.27% silt, 55.21% sand) with a bulk density of 1.51 g cm−3, a pH (1:5 for soil to water) of 8.58, as well as a groundwater depth of >5 m. In total, 0~40 cm of soil was taken to measure the basic soil nutrient contents before maize sowing in 2018 (Table 1).

2.2. Experimental Design

The test site has been a long−term positioning test field for the winter wheat–summer maize rotation since 2012. A completely randomized design was used in this study. Moreover, six treatments were set up in the experiment: N0, N120, N180, N240, N300, N360 (nitrogen application rates were 0, 120, 180, 240, 300, 360 kg·ha−1, respectively). Each treatment was 30 m long and 5 m wide with three replications. The maize variety was ‘Denghai 605’, and it was planted in a north–south direction with 60 cm row spacing and 25 cm plant spacing. The planting date of summer maize in 2018 was June 10 and the harvest date was September 27; the planting date of summer maize in 2019 was June 14 and the harvest date was September 27. The amount of phosphate fertilizer and potassium fertilizer for the 6 treatments was the same when sowing: K2O−105 kg·ha−1, P2O5−120 kg·ha−1. Nitrogen fertilizer (urea) was applied twice; for the first application, nitrogen fertilizer was applied together with phosphorus and potassium fertilizer at sowing, and the second application in 2018 and 2019 were performed on July 13 and July 26, respectively. The ratio of base nitrogen fertilizer to top dressing was 50% to 50%.

2.3. Measurements

2.3.1. Nitrous Oxide Sampling and Analysis

The nitrous oxide (N2O) released from the soil surface was tested by chamber gas chromatography, and the flux was then calculated. Regarding the size of the static chamber: length × width × height = 30 cm × 20 cm × 10 cm. The soil gas sampling was taken every 7 days. If there was any heavy rainfall, samples would be taken on the third day after the rainfall. This deferred treatment was intended to avoid the sharp rise in N2O emission flux caused by the increase in soil water filled porosity (WFPS) after rainfall. Due to the different distributions of rainfall in the maize growing season in 2018 and 2019, the sampling times of the two seasons were different (12 and 9 times in 2018 and 2019, respectively) so as to ensure that there was no extreme value in each sampling. Sampling was collected between 8 and 10 a.m. A 50 mL syringe was used to take 50 mL gas samples, respectively, at 0, 10, 20 min after the box was covered [16]. The collected samples were taken back to the laboratory afterwards and a gas chromatograph (Shimadzu, 2010 plus) was used for taking measurement.
The gas flux was calculated as described by Mehmood et al. [16]:
F   = M V × h × dc dt × 273 ( 273 + T ) × P P 0
where F denotes emission flux (mg m−2 h−1) and dc/dt denotes the rate of change in gas concentration; M represents the measured gas’ mole mass (g mol−1); P represents atmospheric pressure (Pa); T represents the absolute temperature (K) inside the chamber; V and P0 represent volume (mL) and pressure (Pa) at standard conditions, respectively; H denotes the height of the chamber above the level of the earth (cm).
By adding up the daily flux of the sampled and non−sampled days, the annual cumulative emissions were calculated, then, the linear interpolation between the time intervals was used for estimation [17]:
TF   =   [ ( F i + 1 + F i ) 2 × ( T i + 1 T i ) ] × 24 × 10 5
where TF is the total cumulative gas emission of the whole growing season (kg·ha−1); (Fi+1 + Fi) is the sum of gas emissions from two adjacent observations (kg·ha−1), and (Ti+1 − Ti) is the number of days between this sampling and the last sampling.
The global warming potential of gases was calculated as follows:
GWP − N2O = TF − N2O × 298
where GWP is global warming potential (kg·ha−1); TF−N2O is the total cumulative N2O emission (kg·ha−1). On the time scale of 100 years, the warming potential of N2O per unit mass is 298 times that of CO2 [18].

2.3.2. Soil Sampling and Analysis

Before maize sowing, the representative sites were randomly selected in the field with different fertilizer treatments and soil samples of 0–40 cm layers were taken back to the laboratory to detect soil organic matter, alkali−hydrolyzed N, available K, and available P. Their detection methods were hydrated hot potassium dichromate oxidation−colorimetry, alkali hydrolysis diffusion method, Olsen method, and ammonium acetate extraction, respectively [19]. When collecting gas samples, 0~20 cm of soil was taken between rows placed in static boxes and repeated 3 times. The collected filtrate was used to measure the content of nitrate and ammonium nitrogen in soil by AA3−HR flow analyzer (SEAL Analytical). The mass water content of soil in 0~20 cm was determined by drying and weighing, which was used to calculate the WFPS [17]:
WFPS = VSWC/(1 − BD/PD)
where PD is the particle density of the soil, which was 2.65 g cm−3; VSWC is the measured soil volumetric water content (%); and BD is the soil bulk density, whose average value of the soil in 0~20 cm was 1.56 g cm−3 [20]. When collecting gas samples, the soil temperature of the entire range of 0–10 cm depth was measured by TESTO mini probe thermometer near the static box.

2.3.3. Yield, Agronomic Efficiency of Nitrogen Fertilizer, and Partial Productivity of Nitrogen Fertilizer

Samples were taken from continuous three−meter lines in three adjacent rows and then harvested, dried, threshed, and weighed. Based on 60 cm row spacing and 25 cm plant spacing, the yield per unit area was converted into yield per hectare.
The following equations were used to calculate partial factor productivity of applied N (PFPN) and nitrogen agronomic efficiency (NAE) [21].
Nitrogen agronomic efficiency (NAE) = Yield of nitrogen treatment − Yield of N0)/Nitrogen application rate
Nitrogen partial productivity (PFPN) = Yield of nitrogen treatment/Nitrogen application rate

2.4. Statistical Analysis

The data consisted of N2O, NO 3 - −N, and ammonium nitrogen concentrations, maize yield, soil moisture content, and temperature, etc. Piecewise linear interpolation was used to estimate the threshold of nitrogen application. Piecewise linear interpolation needs to construct linear interpolation basis function on each interpolation node, and then make their linear combination. A one−way ANOVA and Duncan’s Multiple New Range Test in SPSS 22.0 were performed to test the effects of different nitrogen application rates on all the data obtained in the experiment. Pearson’s correlation analysis was used to determine the relationship between nitrogen fertilizer application and yield, NO 3 - −N residual, and N2O global warming potential.

3. Results

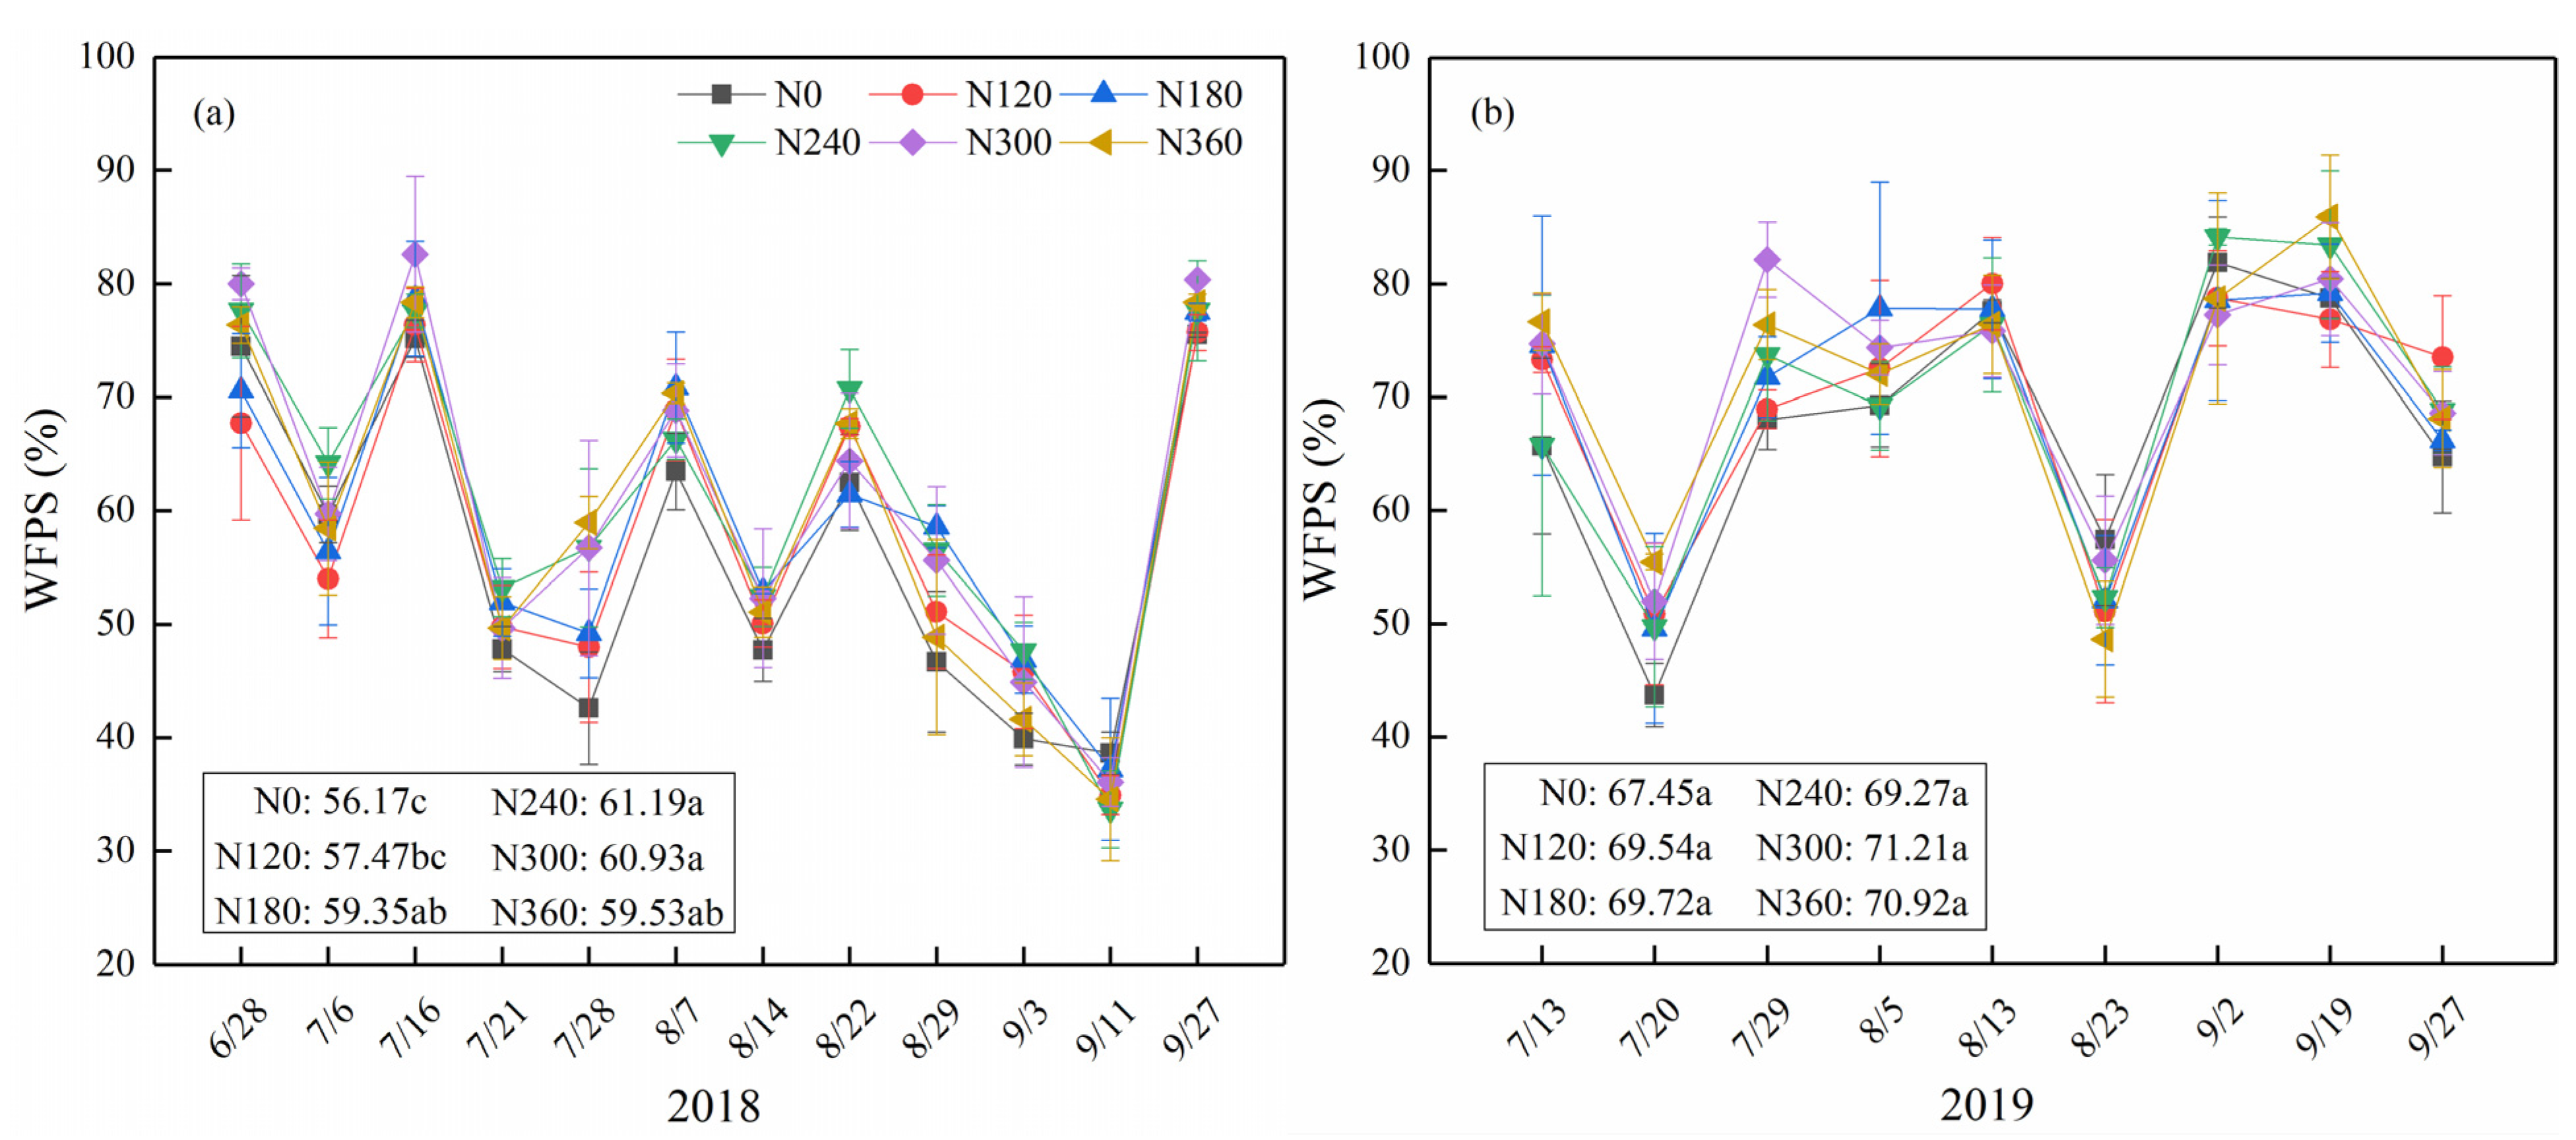
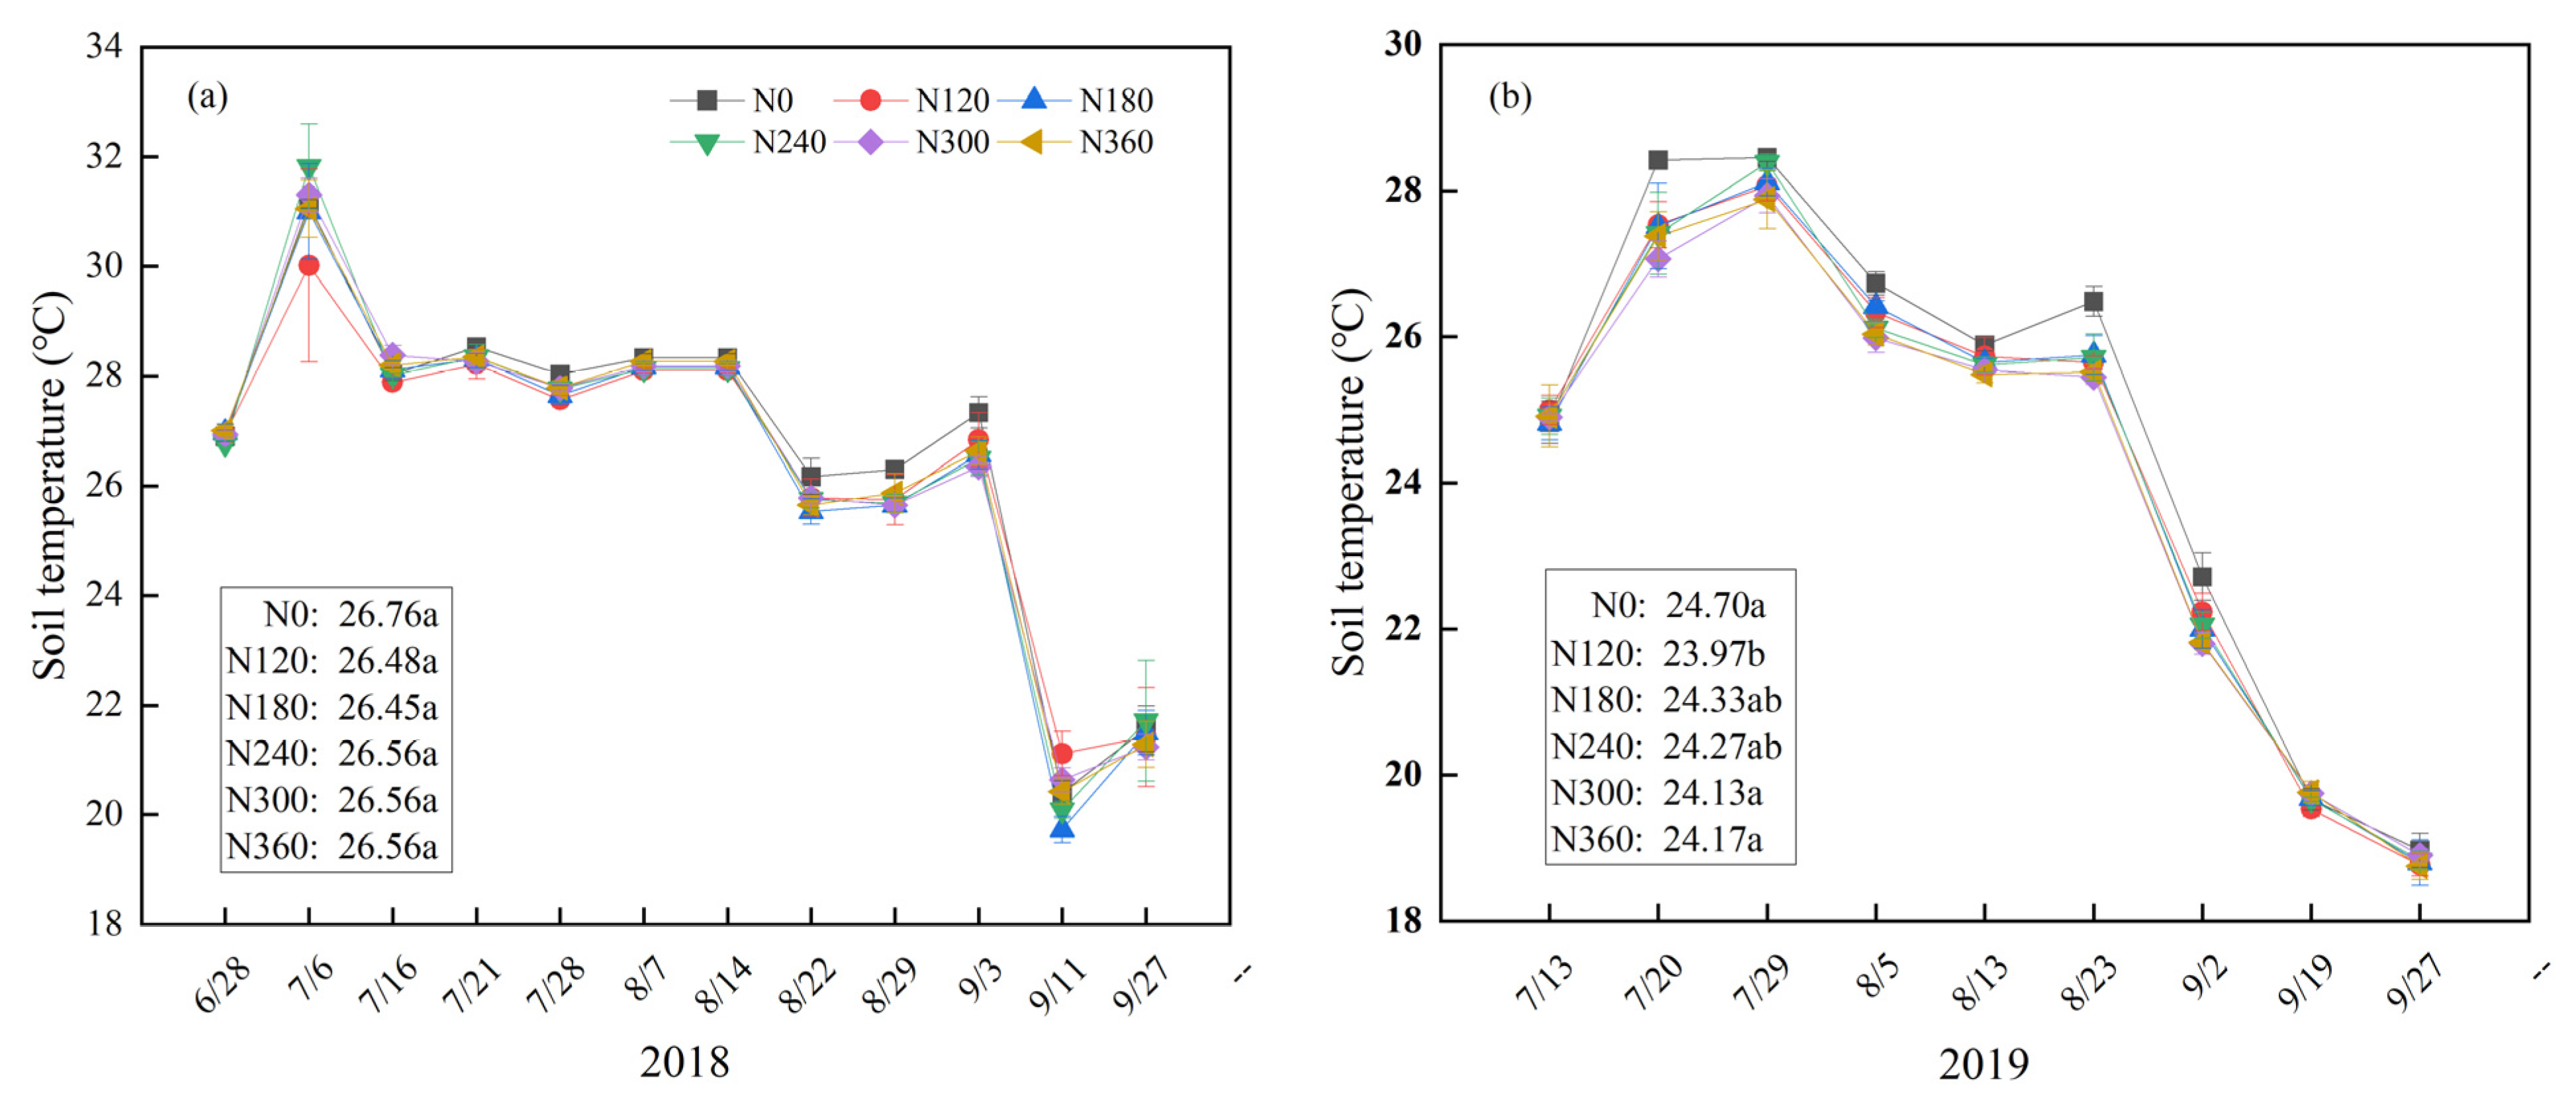
3.1. Dynamics of Soil WFPS and Soil Temperature under Different Nitrogen Fertilizer Treatments

The soil water filled pore space and temperature in soil aeration zones can affect microbial activity, which is an important factor affecting N2O emission. The variation of soil WFPS in the two growing seasons was basically the same and both significantly increased under the influence of rainfall and irrigation (Figure 2). One−way ANOVA revealed that there were differences in WFPS of 0~20 cm soil layer under different nitrogen treatments in 2018 (p < 0.05), and the WFPS of N0 and N120 were significantly lower than those of other treatments, but there was no significant difference in WFPS of 0~20 cm soil layer from N120 to N360. However, in 2019, there was no significant difference (p > 0.05) in WFPS of 0~20 cm soil layer among different nitrogen treatments (Figure 2). The linear regression analysis between the two−year WFPS and the nitrogen application rate revealed that there was no linear relationship between nitrogen application rate and WFPS (Table 2). The changing trend of soil temperature in the 0~10 cm layer within the two seasons was basically the same, showing a trend of initially increasing and then decreasing, which was similar to air temperature change (Figure 3). At the end of the growing period in 2018, the soil temperature in the 0~10 cm depth slightly increased, which was caused by the increase in air temperature and solar radiation intensity. The difference in soil temperature in the 0~10 cm layer between different nitrogen application rates was not significant (p < 0.05) and there was no linear relationship (Table 2) within the two years, which indicated that the factor affecting the change in temperature of 0~10 cm soil was not nitrogen fertilizer treatment but environmental temperature.

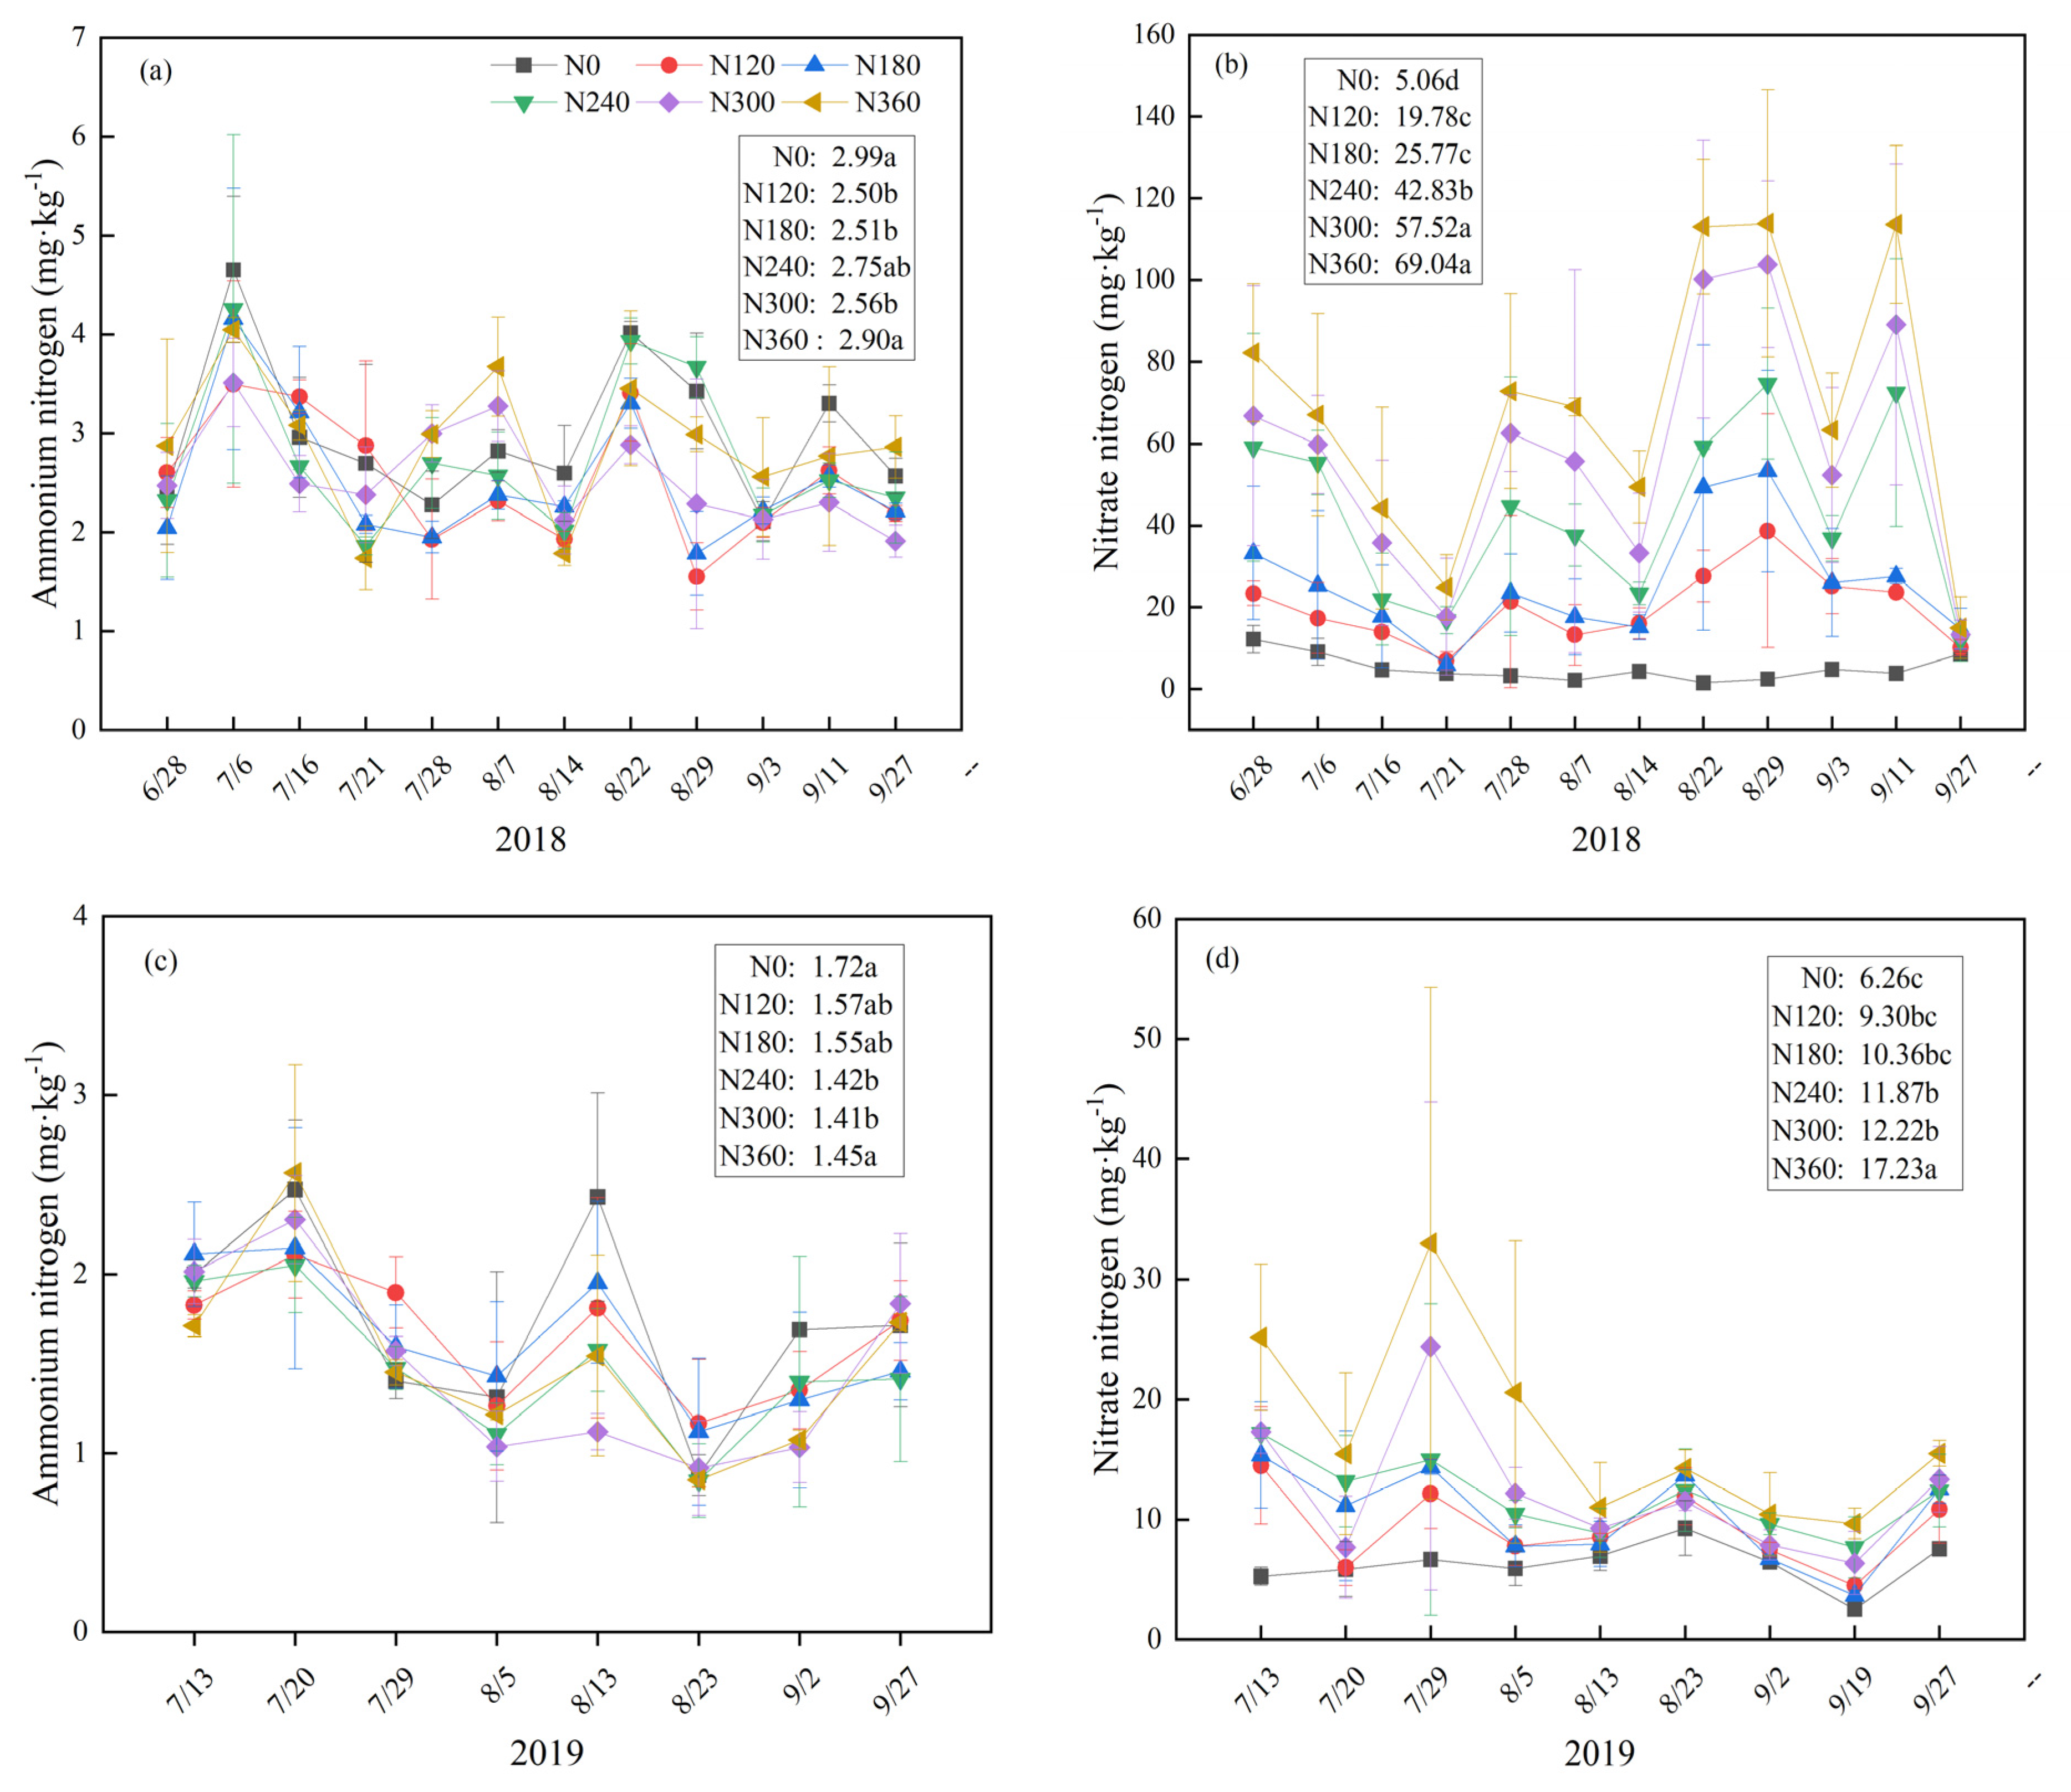
3.2. Effects of Different Nitrogen Treatments on Soil N O 3 - −N and Ammonium Nitrogen

During the growth period, the NO 3 - −N content of each treatment increased with the increase in nitrogen fertilizer input (Figure 4). However, the content of ammonium nitrogen in the soil of each treatment did not follow this pattern. In 2019, the contents of ammonium nitrogen and NO 3 - −N in each treatment decreased by 36.1% and 63.9%, respectively, compared with that of 2018. The soil ammonium nitrogen content of each treatment was not significantly affected (p > 0.05) by nitrogen fertilizer treatment in 2019, but there were differences in the soil ammonium nitrogen content of each treatment in 2018 (Figure 4). The average NO 3 - −N content of N360 and N300 in 2018 and N360 in 2019 was significantly higher (p < 0.05) than that of other treatments (Figure 4). From Table 2, there was no significant linear correlation between nitrogen application rate and soil ammonium nitrogen, but a significant positive correlation with soil NO 3 - −N. However, the R2 of the fitting equation was low, indicating that the relationship between nitrogen application rate and soil NO 3 - −N could have other functional relationships.

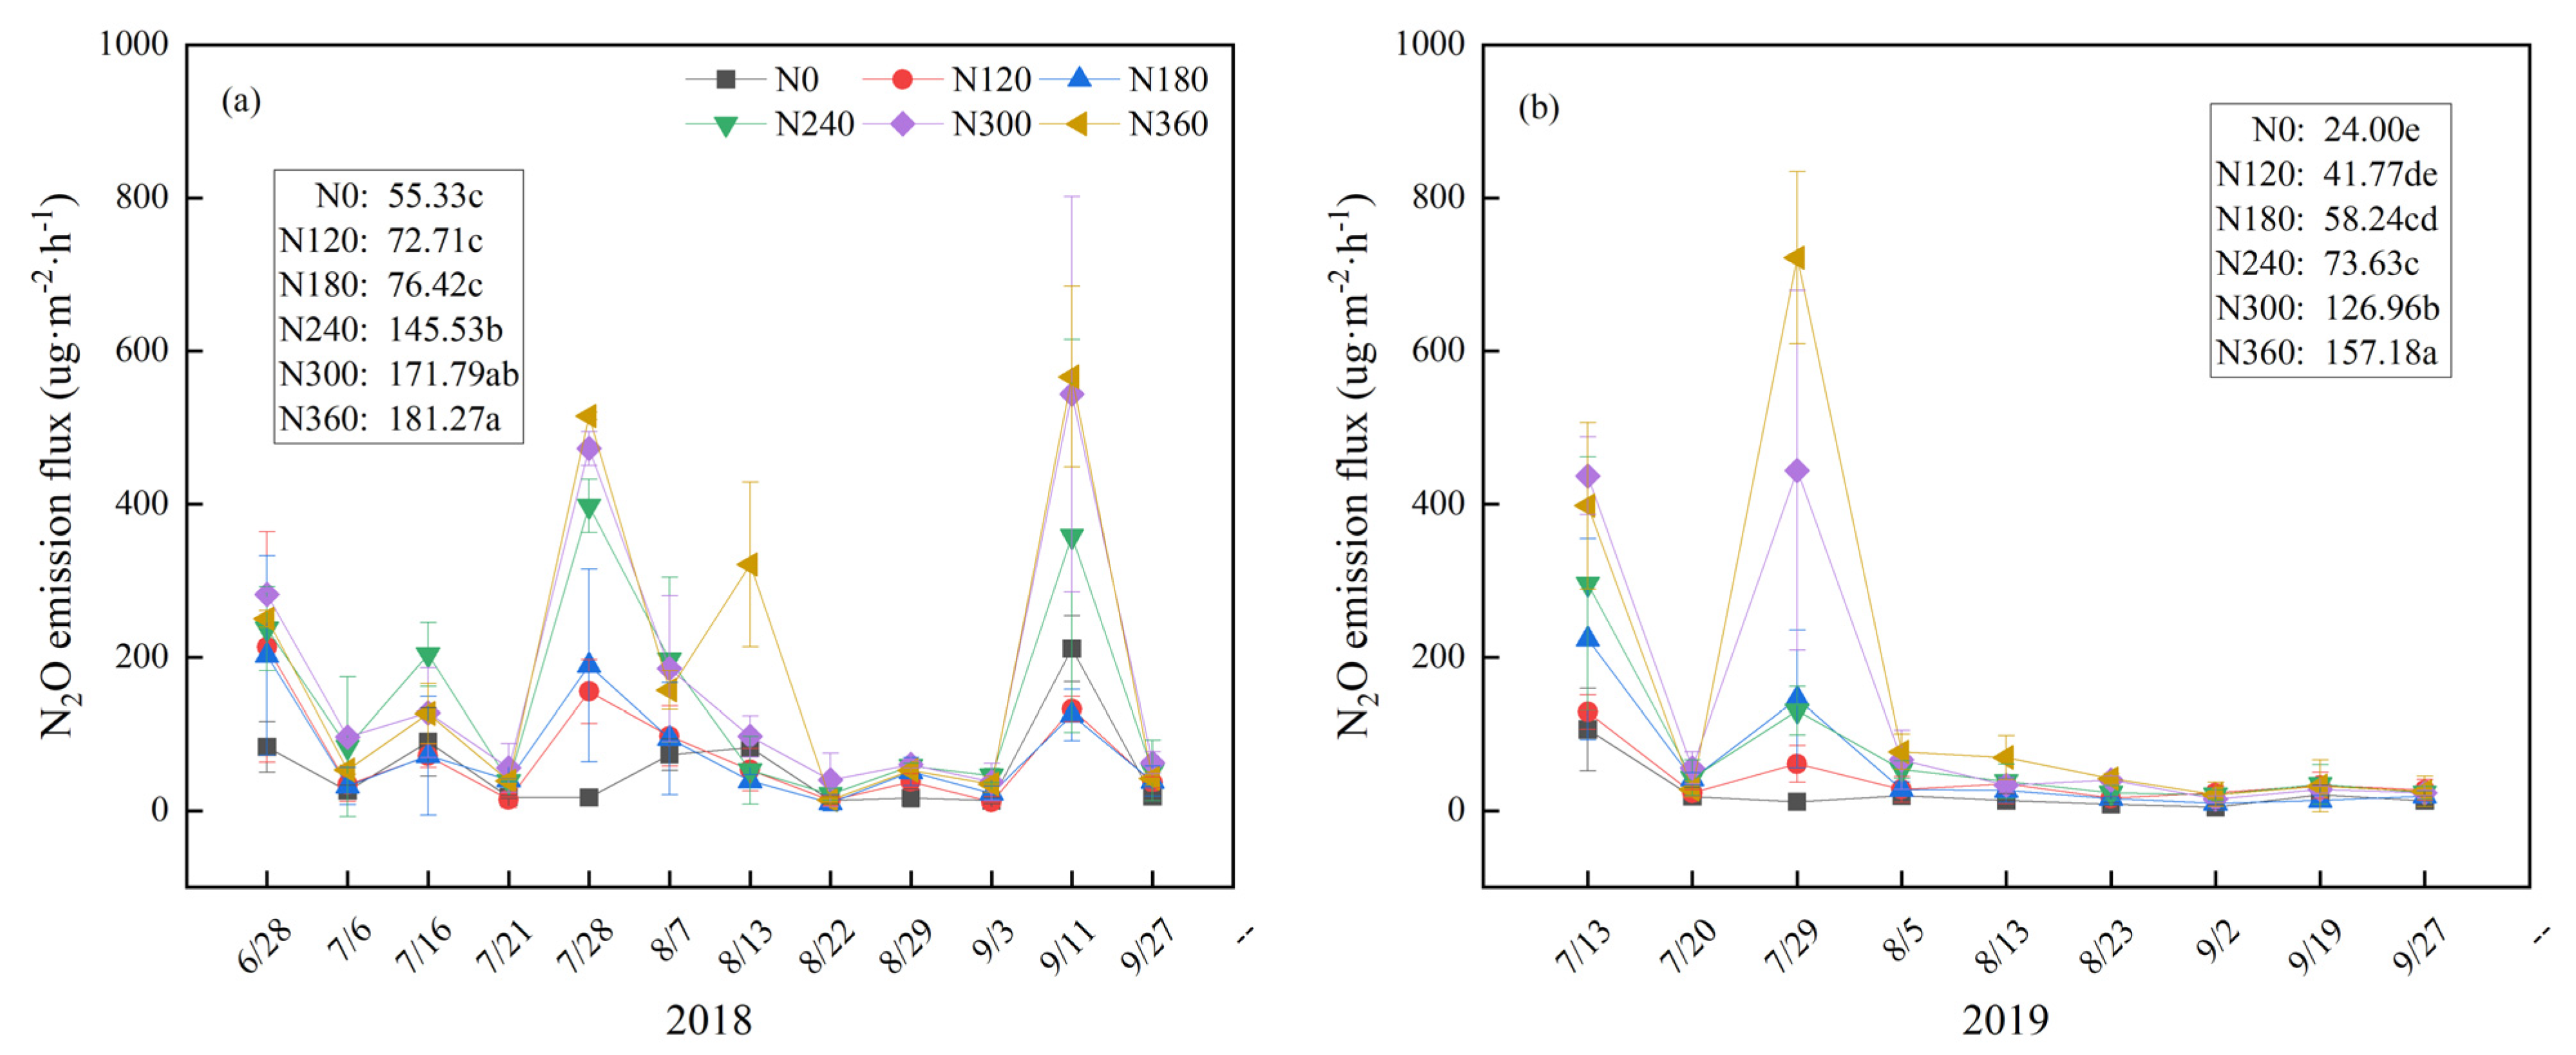
3.3. Effects of Different Nitrogen Treatments on N2O Emission Flux, Cumulative Emission, and Global Warming Potential

The peak value of each treatment appeared after the input of nitrogen and water (irrigation, rainfall, topdressing) in the field (Figure 5). The average N2O emission fluxes of the six treatments increased with the increase in nitrogen application rate for the two years, indicating a positive correlation between nitrogen application rate and soil N2O emission flux (Table 2). The average N2O emission fluxes of N360 and N300 were significantly higher than those of the other four nitrogen treatments (p < 0.01). In addition, there was no significant difference in N2O cumulative emission flux and N2O global warming potential among N360, N300, and N240, and no significant difference was displayed among N120, N180, and N0. The GWP N2O of each treatment was > 0, which indicated that the summer maize field was the source of N2O emission. The warming potential of N2O with different nitrogen application rates was as follows: N0 < N120 < N180 < N240 < N300 < N360 (p < 0.001). In addition, there was a significant linear correlation between nitrogen application rate and the cumulative N2O emission and GWP (Table 2).

3.4. Yield, NAE, and PFPN of Applied N in Different Treatments

The grain yield of summer maize increased at first, and then decreased with the increase in nitrogen application rate; the highest yield treatment was N300 (Table 3). One−way ANOVA showed that there was no significant difference in yield among treatments except for N0 in 2018, and the difference among treatments in 2019 was not completely significant. The overall maize yield in 2019 was 30.14% lower than that in 2018, and NAE and PFPN decreased significantly with the increase in nitrogen application rate (p < 0.01). To some extent, increasing the application rate of nitrogen fertilizer will increase the yield of summer maize, but nitrogen use efficiency will decrease significantly.

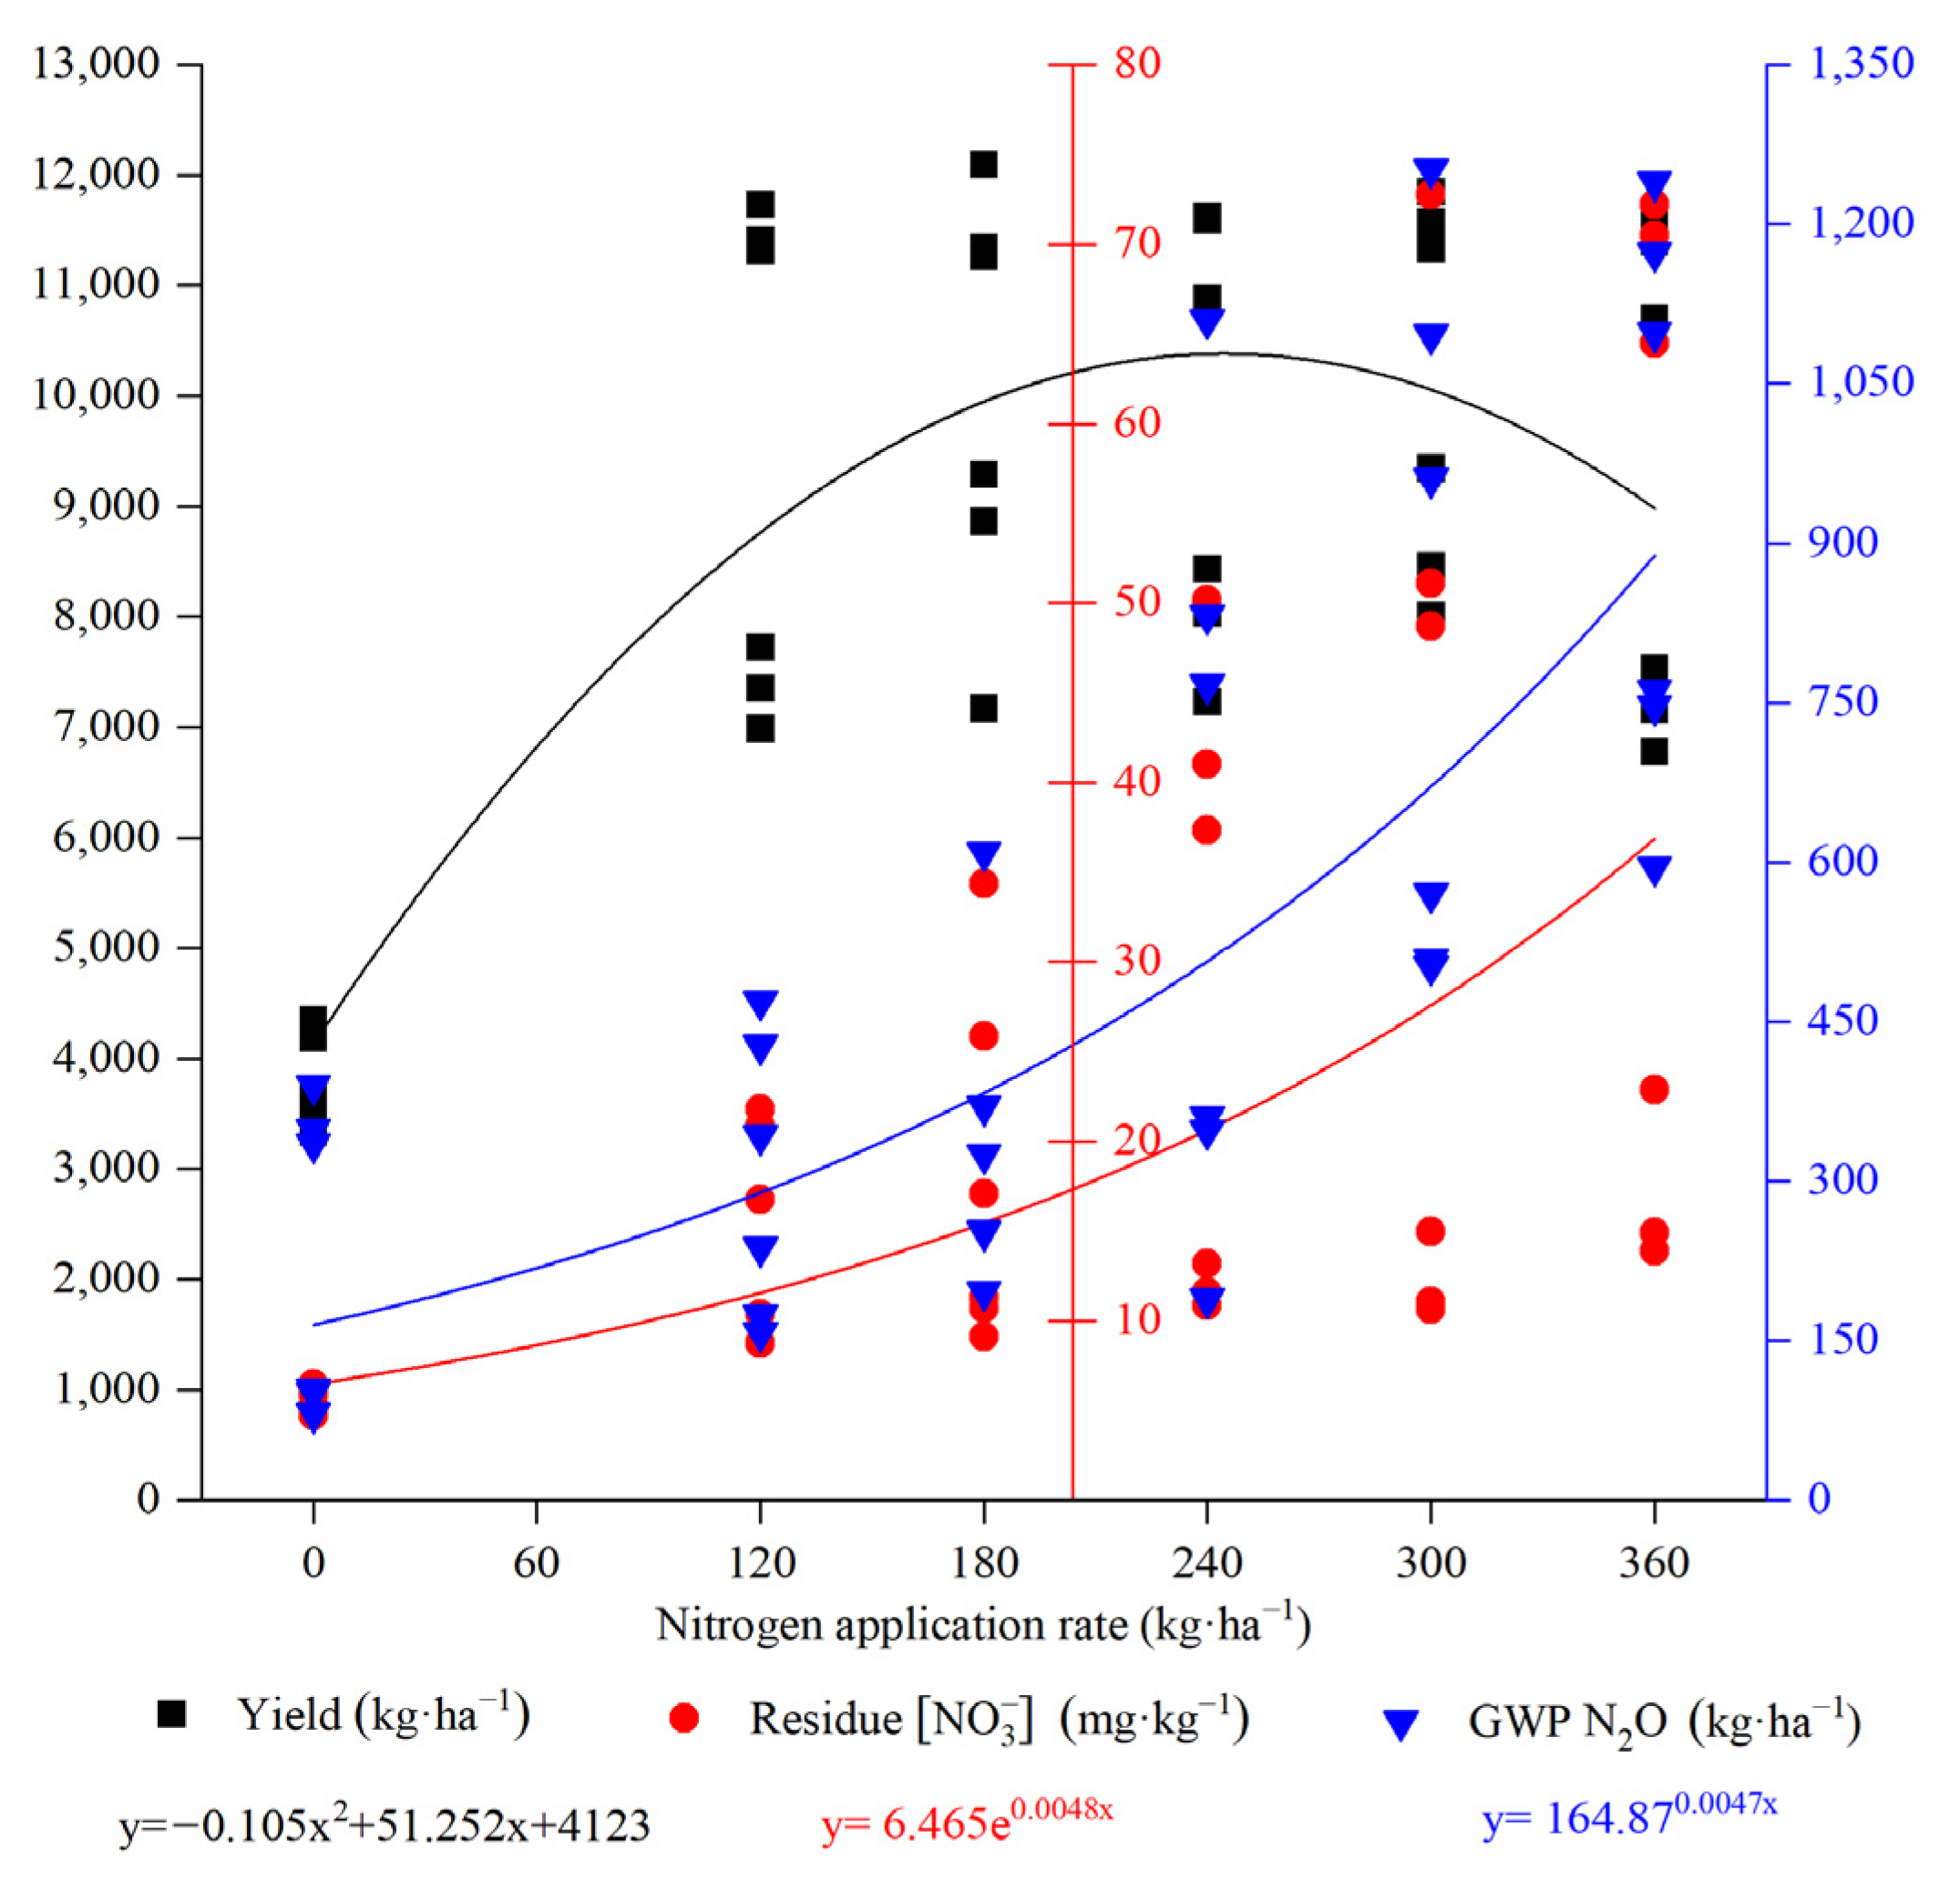
3.5. Threshold of Nitrogen Application Rate for Summer Maize

The N application rate was mathematically fitted with the grain yield, NO 3 - −N residual, and GWP N2O in 2018 and 2019 (Figure 6) and the fitting curve was obtained (Table 4). According to the characteristics and piecewise linear interpolation method of each function, the extremum point or the inflection point was calculated. When the nitrogen application rate was 244.29 kg·ha−1, the maximum grain yield was 10,383.17 kg·ha−1. The inflection point of the function fitting equation between soil NO 3 - −N and nitrogen application rate appears at the nitrogen application rate of 180 kg·ha−1. Furthermore, the piecewise linear interpolation was used to study the threshold value of nitrogen application and an equation group was obtained: y = 0.0697x + 5.7892 (0~180 kg·ha−1), y = 0.1379x − 6.3739 (180~360 kg·ha−1). The results showed that when the N application rate was more than 178.34 kg·ha−1, the soil NO 3 - −N content would sharply increase. Using the same method, the linear equation system of N2O warming potential response to nitrogen application rate can be obtained: y = 0.6005x + 227.5, y = 3.3624x − 236.42. The inflection point (x = 167.97 kg·ha−1) of N2O warming potential in the maize field was obtained by solving this equation system. In order to ensure that the maize yield would not be greatly reduced, 95% Yieldmax was taken as the lower limit of the N application threshold. According to the function, nitrogen application rate, residual nitrogen concentration, and GWP N2O were calculated. The function image is shown in Figure 6, and the calculation results are shown in Table 4. While considering the yield, soil, and greenhouse gas emissions, when the nitrogen application rate was 173.94~178.34 kg·ha−1, the yield decreased by 4.39~5.00% compared with the maximum yield. Moreover, the residual concentration of NO 3 - −N in soil could be reduced by 27.1~28.7%, and GWP−N2O could be reduced by 26.7~28.2%. So this range of N application (173.94~178.34 kg·ha−1) could not significantly reduce maize yield while it could significantly reduce soil NO 3 - −N residual and N2O global warming potential.

4. Discussion

4.1. Effects of Nitrogen Application Rate on N O 3 - −N Residual in Soil

In this study, before the long−term field experiment (2012), the soil NPK content was basically the same; after six years, NPK (nitrogen, phosphorus, and potassium) and soil organic matter (SOM) were different with the N fertilizer gradient test, and the temporal variability of NO 3 - −N residual in each treatment was large (Table 2). The rainfall in 2018 was 80% higher than that in 2019 (Figure 1). The precipitation of NO 3 - −N and ammonium nitrogen caused by rainfall may be the reason why the average content of NO 3 - −N in 0~20 cm soil in 2018 was 1.77 times higher than that in 2019. In 2018, the excess nitrate and ammonium nitrogen in N240, N300, and N360 soil could not be utilized by maize plants, resulting in a significant increase in residual NO 3 - −N in soil, which was higher than before maize sowing in 2018. Weng et al. [22] reported that the accumulation of NO 3 - −N in 0~90 cm soil layer of N180, which had the highest summer maize yield in the NCP, was 49.4~314.3 kg·ha−1, and the residual amount of NO 3 - −N in soil was also significantly different between different seasons. Fertilization, environmental climate factors, and plant uptake and utilization were the main factors affecting the residual concentration and temporal and spatial distribution of NO 3 - −N in dryland soil, this is similar to the seasonal difference of NO 3 - −N in 0~60 cm (Table 5). Yang et al. [23], through their study of the wheat–maize rotation system, found that the content of soil NO 3 - −N increased exponentially with the increase in the nitrogen application rate, within limits, indicating that nitrogen application in the maize season significantly affected soil NO 3 - −N residual. However, some studies also found that when nitrogen fertilizer application was lower than 240 kg·ha−1, the content of NO 3 - −N in maize rhizosphere was not significantly affected [24]. Although the meteorological conditions in the growth period of maize in 2018 and 2019 were different, and the conditions of crop absorption and utilization were not completely the same, resulting in a large annual variation of NO 3 - −N residual, the law of NO 3 - −N residual increasing with the increase in the nitrogen application rate was still consistent with the existing research results. In this study, there was no significant difference in ammonium nitrogen content among different treatments during the maize growing season while there was a significant difference in NO 3 - −N content. As maize fields belong to dry farming fields, the nitrification process is dominant in the soil. Ammonium nitrogen, as the substrate of the nitrification process, will be consumed and transformed into NO 3 - −N [5] so that the content of ammonium nitrogen remains almost unchanged with the increase in nitrogen fertilizer (urea).

4.2. Effects of Nitrogen Application Level on N2O Emissions

Previous studies have shown that summer maize farmland soil is the primary source of N2O emissions [25,26]. In this study, the N2O emission fluxes, cumulative emissions, and global warming potential are all greater than zero, which also proves this conclusion. The effect of nitrogen application on N2O emissions from farmland was similar to previous studies that found that N2O emissions increase following the increase in nitrogen application level [27]. However, the changing trend of N2O emission flux was different between the two years. The reason for this could be that the content of soil NO 3 - −N in 2019 was significantly lower than that in 2018, and the changing trend was also different. With the augment of nitrogen application level, the emissions of N2O increased [27]. N2O emission flux can be affected by soil NO 3 - −N, ventilation, temperature, water content, and fertilizer application as well as weather changes such as rainfall, temperature, and other factors [28]. However, the impact of farmland on N2O emission fluxes is not a comprehensive effect caused by the simple superposition of various factors, but a comprehensive embodiment of the overall effect by the synthesis of multiple factors [22]. Therefore, the mechanism of the effect on N2O and emission flux from maize fields needs to be further studied. Urea is generally not advocated in high−efficiency, intensive, and sustainable agriculture; however, it is commonly used by local farmers. Considering the popularization of the test results, urea was selected as the nitrogen fertilizer in this study.

4.3. Confirmation of Nitrogen Application Threshold

It is complicated to confirm the threshold of nitrogen application for maize because the planting areas of maize are widely distributed around the world, with various regional conditions, numerous varieties, and the contrasting responses of maize to different nitrogen levels. Tong et al. [29] aimed to increase yield and reduce nitrogen loss and obtained a safe nitrogen application rate of 207.27 kg·ha−1. Fang et al. [1] pointed out that the optimal nitrogen application rate for maize under the cover of biodegradable film and polyethylene film was 205 and 196 kg·ha−1, respectively. Tonitto et al. [30] suggested that 200 kg N kg·ha−1 could be used as the recommended nitrogen application rate for the maize belt in the United States. Different regions, external conditions, and evaluation indexes will affect the determination of the optimal nitrogen application threshold. Based on the long−term location experiment of different nitrogen rates, the soil–crop–atmosphere was taken as the research object, and the soil NO 3 - −N residual, maize grain yield, and N2O warming potential were used as evaluation indexes. Therefore, the nitrogen application threshold was 173.94~178.34 kg·ha−1, which could significantly reduce soil and air pollution while not significantly reducing maize yield. However, the results of this study also had some limitations. For example, there were great interannual differences in maize yield. The possible reasons for this include that the rainfall in the corn growing season in 2018 was 80% higher than in 2019 (Figure 6) and the lower yield in 2019 was probably due to the “continuous cropping obstacle”. At this time, taking yield as the index for estimating the N threshold may lead to a result deviation. Moreover, this study was a single point positioning test, therefore the results of this study cannot be directly applied to other areas with large differences in soil and climate factors. However, the purpose of this study was to improve the nitrogen threshold estimation and evaluation method according to CSA.

5. Conclusions

In the present study, the effects of nitrogen application rate on yield and environmental impacts of summer maize fields were evaluated by yield, N2O warming potential, and the average concentration of soil NO 3 - −N in growing season. The most obvious results from this research are as follows: with the increase in nitrogen application rate, the yield of summer maize initially increased and then decreased, soil NO 3 - −N content and N2O global warming potential increased exponentially. According to the characteristics of the function, the conclusion is drawn that the amount of nitrogen application at the maximum yield of summer maize was 244.29 kg·ha−1, whereas the nitrogen application rate before the sharp increase in GWP−N2O was 167.97 kg·ha−1. It was put forward that the amount of nitrogen application before the sharp rise in soil nitrate concentration was 178.34 kg·ha−1. When the decrease was less than 5% compared to the maximum yield, the threshold of nitrogen application that could significantly reduce GWP−N2O and soil NO 3 - −N residual was 173.94~178.34 kg·ha−1. The two−year test data are very limited, thus it is impossible to obtain the nitrogen fertilizer threshold that is very in line with local demand. Therefore, it is necessary to conduct long−term research in multiple places in the future, and it is best to enable the research to experience different rainfall years within the study region.

Author Contributions

Conceptualization, Z.L. and Y.G.; methodology, G.W.; software, A.S.A.; validation, G.W., Y.G. and Z.L.; formal analysis, J.C.; investigation, J.C. and W.S.; data curation, Y.Z.; writing—original draft preparation, J.C.; writing—review and editing, A.K.M.H. and Y.G.; funding acquisition, Z.L. and Y.G. All authors have read and agreed to the published version of the manuscript.

Funding

This research was supported by the China Agriculture Research System (CARS−02), the National Natural Science Foundation of China (No. 51879267), the Basic Scientific Research Project of Chinese Academy of Agricultural Sciences (FIRI202004−02, FIRI 2019−05−03), and the Agricultural Science and Technology Innovation Program (ASTIP), Chinese Academy of Agricultural Sciences.

Institutional Review Board Statement

Not applicable.

Informed Consent Statement

Not applicable.

Data Availability Statement

The data that support the findings of this study are available from the corresponding authors upon reasonable request.

Conflicts of Interest

The authors declare that they have no competing interests.

References

  1. Fang, H.; Gu, X.; Jiang, T.; Yang, J.; Li, Y.; Huang, P.; Chen, P.; Yang, J. An optimized model for simulating grain−filling of maize and regulating nitrogen application rates under different film mulching and nitrogen fertilizer regimes on the Loess Plateau, China. Soil Till. Res. 2020, 199, 104546. [Google Scholar] [CrossRef]
  2. Su, W.; Kamran, M.; Xie, J.; Meng, X.; Han, Q.; Liu, T.; Han, J. Shoot and root traits of summer maize hybrid varieties with higher grain yields and higher nitrogen use efficiency at low nitrogen application rates. PeerJ 2019, 7, e7294. [Google Scholar] [CrossRef] [PubMed]
  3. Mancuso, G.; Bencresciuto, G.F.; Lavrnić, S.; Toscano, A. Diffuse Water Pollution from Agriculture: A Review of Nature−Based Solutions for Nitrogen Removal and Recovery. Water 2021, 13, 1893. [Google Scholar] [CrossRef]
  4. Linquist, B.; Van Groenigen, K.J.; Adviento-Borbe, M.A.; Pittelkow, C.; Van Kessel, C. An agronomic assessment of greenhouse gas emissions from major cereal crops. Glob. Chang. Biol. 2012, 18, 194–209. [Google Scholar] [CrossRef]
  5. Liu, X.; Mosier, A.R.; Halvorson, A.D.; Reule, C.A.; Zhang, F. Dinitrogen and N2O emissions in arable soils: Effect of tillage, N source and soil moisture. Soil Biol. Biochem. 2007, 39, 2362–2370. [Google Scholar] [CrossRef]
  6. Millar, N.; Robertson, G.P.; Grace, P.R.; Gehl, R.J.; Hoben, J.P. Erratum to: Nitrogen fertilizer management for nitrous oxide (N2O) mitigation in intensive corn (Maize) production: An emissions reduction protocol for US Midwest agriculture. Mitig. Adapt. Strat. Glob. Chang. 2010, 15, 411–411. [Google Scholar] [CrossRef] [Green Version]
  7. Sapkota, T.B.; Singh, L.K.; Yadav, A.K.; Khatri−Chhetri, A.; Jat, H.S.; Sharma, P.C.; Jat, M.L.; Stirling, C.M. Identifying optimum rates of fertilizer nitrogen application to maximize economic return and minimize nitrous oxide emission from rice–wheat systems in the Indo−Gangetic Plains of India. Arch. Agron. Soil Sci. 2020, 66, 2039–2054. [Google Scholar] [CrossRef] [Green Version]
  8. Li, Z.; Wen, X.; Hu, C.; Li, X.; Li, S.; Zhang, X.; Hu, B. Regional simulation of nitrate leaching potential from winter wheat−summer maize rotation croplands on the North China Plain using the NLEAP−GIS model. Agric. Ecosyst. Environ. 2020, 294, 106861. [Google Scholar] [CrossRef]
  9. Jiang, C.; Ren, X.; Wang, H.; Lu, D.; Zu, C.; Wang, S. Optimal nitrogen application rates of one−time root zone fertilization and the effect of reducing nitrogen application on summer maize. Sustainability 2019, 11, 2979. [Google Scholar] [CrossRef] [Green Version]
  10. Sedri, M.H.; Amini, A.; Golchin, A. Evaluation of nitrogen effects on yield and drought tolerance of rainfed wheat using drought stress indices. J. Crop Sci. Biotechnol. 2019, 22, 235–242. [Google Scholar] [CrossRef]
  11. Li, Y.; Liu, H.; Huang, G. The effect of nitrogen rates on yields and nitrogen use efficiencies during four years of wheat–maize rotation cropping seasons. Agron. J. 2016, 108, 2076–2088. [Google Scholar] [CrossRef]
  12. Xu, J.; Cai, H.; Wang, X.; Ma, C.; Lu, Y.; Ding, Y.; Wang, X.; Chen, H.; Wang, Y.; Saddique, Q. Exploring optimal irrigation and nitrogen fertilization in a winter wheat−summer maize rotation system for improving crop yield and reducing water and nitrogen leaching. Agric. Water Manag. 2020, 228, 105904. [Google Scholar] [CrossRef]
  13. Li, Y.; Liu, H.; Huang, G.; Zhang, R.; Yang, H. Nitrate nitrogen accumulation and leaching pattern at a winter wheat: Summer maize cropping field in the North China Plain. Environ. Earth Sci. 2016, 75, 118. [Google Scholar] [CrossRef]
  14. Peng, Y.; Yu, P.; Li, X.; Li, C. Determination of the critical soil mineral nitrogen concentration for maximizing maize grain yield. Plant Soil. 2013, 372, 41–51. [Google Scholar] [CrossRef]
  15. Peng, Y.; Li, X.; Li, C. Temporal and spatial profiling of root growth revealed novel response of maize roots under various nitrogen supplies in the field. PLoS ONE 2012, 7, e37726. [Google Scholar] [CrossRef] [PubMed]
  16. Mehmood, F.; Wang, G.; Gao, Y.; Liang, Y.; Chen, J.; Si, Z.; Ramatshaba, T.S.; Zain, M.; Duan, A. Nitrous oxide emission from winter wheat field as responded to irrigation scheduling and irrigation methods in the North China Plain. Agric. Water Manag. 2019, 222, 367–374. [Google Scholar] [CrossRef]
  17. Wang, C.; Yang, X.; Xu, K. Effect of chronic nitrogen fertilization on soil CO2 flux in a temperate forest in North China: A 5-year nitrogen addition experiment. J. Soil. Sediments 2018, 18, 506–516. [Google Scholar] [CrossRef]
  18. Htun, Y.M.; Tong, Y.; Gao, P.; Xiaotang, J. Coupled effects of straw and nitrogen management on N2O and CH4 emissions of rainfed agriculture in Northwest China. Atmos. Environ. 2017, 157, 156–166. [Google Scholar] [CrossRef]
  19. Lu, R. Analytical Methods of Soil Agrochemistry; China Agricultural Science and Technology Press: Beijing, China, 2000. [Google Scholar]
  20. Jha, S.K.; Gao, Y.; Liu, H.; Huang, Z.; Wang, G.; Liang, Y.; Duan, A. Root development and water uptake in winter wheat under different irrigation methods and scheduling for North China. Agric. Water Manag. 2017, 182, 139–150. [Google Scholar] [CrossRef]
  21. Guo, J.; Wang, Y.; Blaylock, A.D.; Chen, X. Mixture of controlled release and normal urea to optimize nitrogen management for high−yielding (>15 Mg ha−1) maize. Field Crops Res. 2017, 204, 23–30. [Google Scholar] [CrossRef]
  22. Weng, L.; Yang, X.; Lyu, M.J.; Xin, S.Y.; Chen, S.; Ma, W.; Wei, J. Characteristics of soil nitrate accumulation and leaching under different long-term nitrogen application rates in winter wheat and summer maize rotation system. Chin. J. Appl. Ecol. 2018, 29, 2551–2558. [Google Scholar] [CrossRef]
  23. Yang, X.; Lu, Y.; Ding, Y.; Yin, X.; Raza, S. Optimising nitrogen fertilisation: A key to improving nitrogen−use efficiency and minimising nitrate leaching losses in an intensive wheat/maize rotation (2008–2014). Field Crops Res. 2017, 206, 1–10. [Google Scholar] [CrossRef]
  24. Chen, L.; Song, S.; Yun, P.; Zhou, L.; Gao, X.; Lu, C.; Liu, R.; Wang, H. Effects of reduced nitrogen fertilizer for three consecutive years on maize growth and rhizosphere nitrogen supply in fluvo−aquic soil. J. Plant Nutr. Fert. 2019, 25, 1482–1494. [Google Scholar] [CrossRef]
  25. Forte, A.; Fiorentino, N.; Fagnano, M.; Fierro, A. Mitigation impact of minimum tillage on CO2 and N2O emissions from a Mediterranean maize cropped soil under low−water input management. Soil Till. Res. 2017, 166, 167–178. [Google Scholar] [CrossRef]
  26. Zhang, X.; Wu, L.; Nan, S.; Ding, X.; Li, J.; Wang, B.; Li, D. Soil CO2 and N2O emissions in maize growing season under different fertilizer regimes in an upland red soil region of South China. J. Integr. Agric. 2014, 13, 604–614. [Google Scholar] [CrossRef]
  27. Zhang, C.; Gao, Y.; Wang, G.; Li, S. Effects of drying−wetting and additional nitrogen on CO2 and N2O emissions from farmland soils. J. Agro-Environ. Sci. 2018, 37, 2079–2090. [Google Scholar] [CrossRef]
  28. Ball, B. Soil structure and greenhouse gas emissions: A synthesis of 20 years of experimentation. Eur. J. Soil Sci. 2013, 64, 357–373. [Google Scholar] [CrossRef]
  29. Tong, L.; Zhao, J.; Wu, D.; Song, J.; Song, D.; Liu, F. Optimization model of corn fertilization and change characteristics of soil inorganic nitrogen. J. Maize Sci. 2019, 27, 145–152. [Google Scholar] [CrossRef]
  30. Tonitto, C.; Woodbury, P.B.; Carter, E. Predicting greenhouse gas benefits of improved nitrogen management in North American maize. J. Environ. Qual. 2000, 4, 882–895. [Google Scholar] [CrossRef]
Figure 1. Air temperature and rainfall during the maize growing season in (a) 2018 and (b) 2019.
Water 13 03415 g001
Figure 2. Changes in soil water filled pore space (WFPS) in different treatments in (a) 2018 and (b) 2019. Values (%) in the textbox indicate results of one−way ANOVA, (n = 3). Different small letters mean the significant differences among various nitrogen treatments (p < 0.05). The same as below.
Water 13 03415 g002
Figure 3. Changes in soil temperature in different treatments in (a) 2018 and (b) 2019.
Water 13 03415 g003
Figure 4. Changes in soil nitrate nitrogen and ammonium nitrogen content in different treatments in 2018 and 2019. Note: (ad) represent ammonium nitrogen content and nitrate nitrogen content in 2018 and 2019, respectively.
Water 13 03415 g004
Figure 5. Dynamics of soil N2O emission flux in different treatments in (a) 2018 and (b) 2019. Values (μg m−2 h−1) in the textbox indicate results of one−way ANOVA.
Water 13 03415 g005
Figure 6. Relationships between yield, nitrate nitrogen residual, and N2O global warming potential under different nitrogen application rates.
Water 13 03415 g006
Table 1. Soil parameters in the 0~40 cm soil depth in 2018.
YearTreatmentOrganic Matter (%)Alkali−Hydrolyzed Nitrogen (mg·kg−1)Available K (mg·kg−1)Available P (mg·kg−1)
2018N01.02 ± 0.0149.81 ± 2.63205.04 ± 16.9910.70 ± 0.79
N1201.11 ± 0.0451.46 ± 1.16178.42 ± 11.509.49 ± 1.20
N1801.06 ± 0.0550.95 ± 1.47171.07 ± 13.579.12 ± 1.04
N2401.22 ± 0.0456.92 ± 1.56190.93 ± 17.5715.27 ± 1.49
N3001.30 ± 0.0465.18 ± 3.91259.44 ± 12.7815.98 ± 1.69
N3601.17 ± 0.0472.17 ± 1.49215.87 ± 21.0314.20 ± 0.39
Table 2. Linear regression analysis of nitrogen application rate and soil WFPS, temperature, NO 3 - −N, ammonium nitrogen, N2O emission, N2O cumulative emissions, GWP N2O.
YR2Linear Equation
WFPS0.05 nsY = 0.0101x + 57.573
Temperature0.01 nsY = −0.0007x + 25.557
NO 3 - −N 0.36 **Y = 0.1051x + 2.922
Ammonium nitrogen0.01 nsY = −0.0005x + 2.222
N2O emission0.73 **Y = 0.3872x + 21.283
N2O cumulative emissions0.46 **Y = 0.0077x + 0.4102
GWP−N2O 0.52 **Y = 2.1314x + 109.41
The ns stands for p > 0.05 and ** stands for p < 0.01; WFPS: soil water filled pore space.
Table 3. Yield, agronomic efficiency of applied N, and partial factor productivity of applied N in different treatments in 2018 and 2019.
YearTreatmentYield (kg·ha−1)NAE (kg·kg−1)PFPN (kg·kg−1)
2018N04277.99 ± 47.03b
N12011,487.75 ± 127.86a60.08 ± 1.07a95.73 ± 1.07a
N18011,571.12 ± 264.83a40.52 ± 1.47b64.28 ± 1.47b
N24011,370.60 ± 246.79a29.55 ± 1.03c47.38 ± 1.03c
N30011,589.07 ± 148.69a24.37 ± 0.50d38.63 ± 0.50d
N36011,234.67 ± 270.97a19.32 ± 0.75e31.21 ± 0.75e
2019N03517.95 ± 106.90d
N1207355.92 ± 212.35bc31.98 ± 1.77a61.30 ± 1.77a
N1808440.42 ± 644.65ab27.34 ± 3.58a46.89 ± 3.58b
N2407900.40 ± 354.28abc18.26 ± 1.48b32.92 ± 1.48c
N3008607.10 ± 392.62a16.96 ± 1.31b28.69 ± 1.31c
N3607160.36 ± 217.58c10.12 ± 0.60c19.89 ± 0.60d
NEA, nitrogen agronomic efficiency; PFPN, partial factor productivity of applied N. Different small letters mean the significant differences among various nitrogen treatments (p < 0.05). The same as below.
Table 4. Relationships of nitrogen application rates to yield, NO 3 - −N residual, and N2O global warming potential.
FactorFitting FunctionR2Nitrogen Threshold (kg·ha−1)Yield (kg·ha−1) NO 3 - −N Residual (mg·kg−1)GWP−N2O (kg·ha−1)
Yieldy = −0.1049x2 + 51.252x + 41230.597 **244.2910,383.1720.89519.74
NO 3 - −N residualy = 6.4654e0.0048x0.492 **178.349926.9215.22381.21
GWP N2Oy = 164.87e0.0047x0.564 **167.979772.1614.48363.08
95% Yieldmax173.949864.0114.90373.41
The row labeled “Yield, NO 3 - −N residual, GWP N2O” means that these factors were used as y to fit the nitrogen application rate (x), respectively. The column labeled “Yield, NO 3 - −N residual, GWP N2O” means that the nitrogen threshold in the same line was brought into the y value obtained by the three fitting functions. ** F value means significant at the p = 0.001 levels, respectively (n = 36).
Table 5. Soil NO 3 - −N in the 0~60 cm soil depth in 2018 and 2019.
TreatmentBefore Sowing in 2018
(mg·kg−1)
At Harvesting in 2018
(mg·kg−1)
Before Sowing in 2019
(mg·kg−1)
At Harvesting in 2019
(mg·kg−1)
N01.25 ± 0.01e1.04 ± 0.02f3.25 ± 0.41b3.60 ± 0.10e
N1202.21 ± 0.01d3.53 ± 0.09e4.32 ± 0.65b5.53 ± 0.09d
N1805.08 ± 0.20c5.35 ± 0.28d4.56 ± 2.01b5.51 ± 0.18d
N2408.60 ± 0.07b28.27 ± 0.64c24.37 ± 2.80a6.83 ± 0.63c
N3009.21 ± 0.24a32.28 ± 0.13b26.13 ± 3.38a9.48 ± 0.26b
N3609.77 ± 0.31a42.33 ± 0.54a32.84 ± 5.47a10.74 ± 0.60a
Different small letters mean the significant differences among various nitrogen treatments (p < 0.05).
Publisher’s Note: MDPI stays neutral with regard to jurisdictional claims in published maps and institutional affiliations.

