
A Comparison of Methods to Address Anaerobic Conditions in Rainwater Harvesting Systems
by
Kathy DeBusk Gee
1,*, 
Daniel Schimoler
2,
Bree T. Charron
3,
Mitch D. Woodward
4 and
William F. Hunt
5 1
Biological and Environmental Sciences Department, Longwood University, Farmville, VA 23909, USA
2
DFM Development Services, LLC, Falls Church, VA 22046, USA
3
North Carolina Coastal Federation, Newport, NC 28570, USA
4
North Carolina Cooperative Extension, North Carolina State University, Raleigh, NC 27695, USA
5
Biological and Agricultural Engineering Department, North Carolina State University, Raleigh, NC 27695, USA
*
Author to whom correspondence should be addressed.
Water 2021, 13(23), 3419; https://0-doi-org.brum.beds.ac.uk/10.3390/w13233419
Submission received: 29 October 2021
/
Revised: 23 November 2021
/
Accepted: 1 December 2021
/
Published: 3 December 2021
(This article belongs to the Special Issue Hydrologic and Water Quality Performance of Stormwater Best Management Practices)
Abstract
:Although historically used in semi-arid and arid regions, rainwater harvesting (RWH) systems have increasingly been used in non-arid and humid regions of the world to conserve potable water and mitigate stormwater runoff. Rainfall characteristics and usage patterns of stored rainwater are distinctly different in (semi-)arid and humid regions, thus presenting a unique set of challenges with respect to their utilization. Coupled with infrequent use, the addition of nitrogen and organic matter via pollen during the spring season can lead to anaerobic conditions within storage tanks, which hinders nitrogen removal, gives stored water an offensive odor, and ultimately discourages use of the water. This study evaluated three measures that can be implemented for new and existing RWH systems to prevent the development of anaerobic conditions within storage tanks: first flush diversion, simulated use, and the continuous circulation of stored water. Study findings indicate that preventing anaerobic conditions via simulated use and recirculation (1) does not necessarily remedy the issue of poor aesthetics within rainwater storage tanks, and (2) can decrease the water quality benefits provided by these systems. Rather, preventing the introduction of pollen and particulate matter to the storage tank via a first flush diverter and minimizing disturbance of settled material in the tank appear to be the most effective methods of addressing the poor aesthetics and odor problems associated with anaerobic conditions.
1. Introduction
Rainwater harvesting (RWH) is the collection of runoff from a surface, usually a rooftop, and storing it for later use. RWH systems are typically comprised of a catchment surface, conveyance system, pre-storage filtration, storage container(s), pump, post-storage filtration/treatment, and post-storage distribution system. Depending upon the complexity of the system and the designated uses of the harvested water, systems may or may not contain all of these elements. For most systems, precipitation falls onto the catchment surface (i.e., roof), is collected via gutters, and is conveyed to the storage container(s) via piping. Pre-storage filtration is frequently used to prevent sediment, organic matter, and other debris from entering the storage container. A first flush diverter can also be employed to prevent the initial runoff from the catchment surface, which contains the highest concentration of pollutants, from entering the storage tank; this has been shown to improve the quality of harvested rainwater [1,2,3]. Harvested rainwater can be extracted from the storage container via gravity or pumped to its final point(s) of use. Post-storage filtration and disinfection can be included when the designated uses of the harvested rainwater require high- or potable-quality water.
The practice of RWH has been documented as far back as ancient Greek and Roman civilizations [4,5]. From the Middle Ages through the late 1900s, it was commonly used in (semi-)arid regions where access to water resources was limited, such as India, Jordan, and other parts of Asia, Italy, South America, and portions of Africa [6,7,8,9]. The 20th and 21st centuries have brought population growth, climate change, and increasing water supply shortages to many areas, including Australia, Germany, China, and the United States; thus, RWH systems have grown in popularity and quantity in recent years as an alternative water supply in these regions [10,11,12,13,14]. For example, in Australia, household RWH system capacity has almost doubled from 6 Gl in 2000 to 11.2 Gl in 2015 [15] and by 2007, over 10 million RWH systems were supplying domestic water to approximately 22 million people throughout humid and sub-humid areas of China [16].
The installation of RWH systems has multiple benefits. Perhaps one of the most obvious benefits of this practice is that it reduces reliance on other water sources—especially potable water sources. For example, Campisano et al. (2017) found that harvested rainwater could replace 30–50% of toilet flushing water demand in most domestic buildings within a studied area of southern Italy [3]. This is particularly important as climate change increasingly threatens water security, especially in low-income regions; by 2050 it is projected that 70% of the world’s urban population will experience increased water stress due to climate change [10,17,18]. The widespread adoption of RWH systems can improve water sustainability and increase water security [19,20]. Rainwater harvesting can also facilitate financial savings by serving as an alternative to more expensive water acquisition options (e.g., hauled water or desalination) [3], reducing the need for detergent and fabric softener due to the softness of rainwater, [21] and increasing property values [22]. Finally, RWH systems can provide stormwater management and flood reduction benefits while simultaneously serving as an alternative water supply [23,24]. These systems can significantly reduce stormwater volumes and peak flow rates leaving a site by capturing and detaining/retaining surface runoff onsite until the water is used or discharged [25,26,27].
In addition to stormwater quantity mitigation, RWH systems can provide water quality improvements of captured water via physical and chemical processes within the storage tank. Several studies have found concentrations of total phosphorus (TP), total nitrogen (TN), total suspended solids (TSS), and other pollutants to be significantly lower in harvested rainwater when compared to that of roof runoff [28,29,30]. However, the extent of water quality improvement provided by a RWH system depends upon the quantity and frequency of stored water use. DeBusk and Hunt (2014) established a relationship between the lack of use (i.e., increased residence time) of stored water and the development of anaerobic conditions, which are accompanied by changes in water color and noxious odors [28]. Additionally, the lack of use and resulting anaerobic conditions could potentially result in increased concentrations of some nitrogen species within stored water [28]. Thus, there exists a need for further research into methods of mitigating the water quality and aesthetic (sight and odor) problems created by infrequent use of stored rainwater. This is particularly true in humid regions, as frequency of usage in these areas tends to be lower than those in (semi-) arid regions [31]. This paper aims to identify and evaluate simple, low-input maintenance methods of preventing the development of anaerobic conditions, and the associated aesthetic and water quality concerns, in a minimally-used humid-region RWH system.
2. Materials and Methods
2.1. Site Description
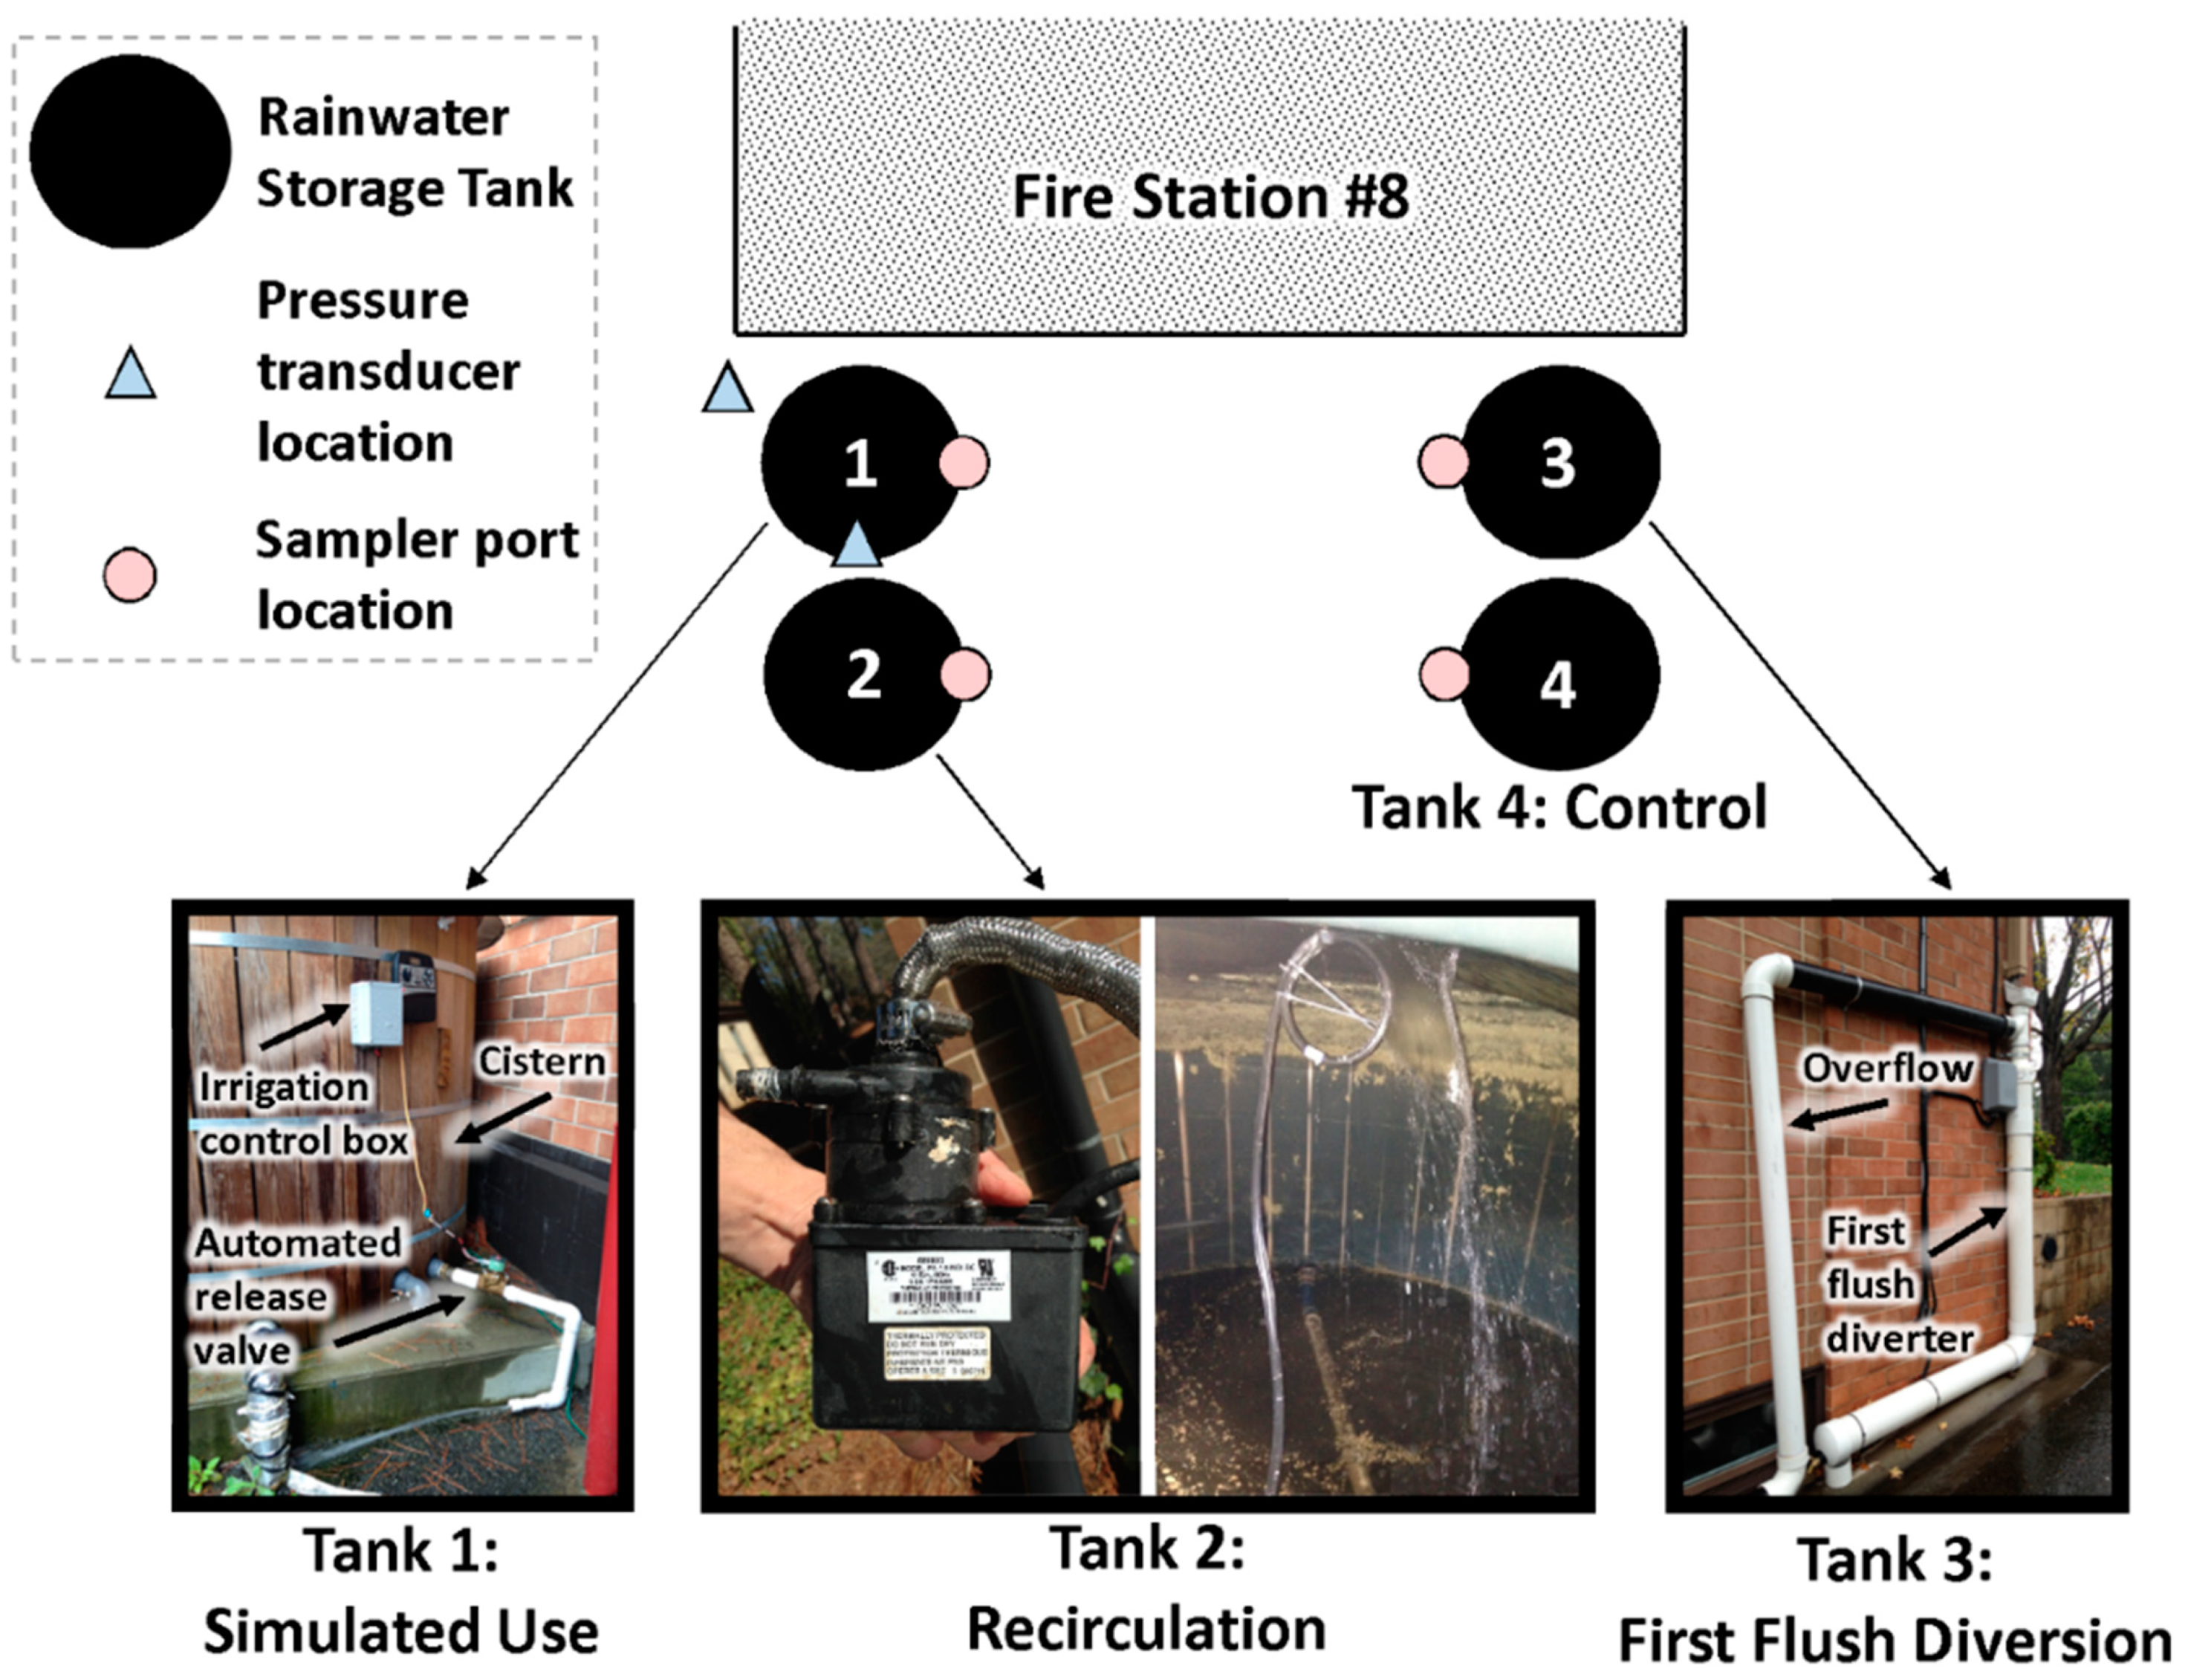
This study was conducted at the City of Raleigh (NC, USA) Fire Station #8 (FS 8), which was retrofitted with a RWH system in 2009. The station was built in 2001 and is situated in a largely urbanized area adjacent to a major interstate (motorway) that receives an average of 77,000 vehicles daily [32]. The 386-m2 roof has a slight pitch and is comprised of asphalt shingles. Several large, mature Loblolly pine trees (Pinus taeda) surround the fire station and their branches extend over the roof area. The RWH system implemented at FS 8 consists of four downspouts that drain the entire roof surface to four polypropylene storage tanks: two 4165 L tanks and two 4540 L tanks. Polyvinyl chloride (PVC) piping connected to a jet pump (Sta-Rite, Inc., Delavan, WI, USA) is used to extract water from the system. For this study, the four storage tanks were disconnected to prevent mixing of water among the tanks. Each of the four downspouts emptied into mesh screen filters with 0.8 mm aperture mesh screen filters (Leaf Eater Advanced™, Rain Harvesting, Aurora, IL, USA) to keep leaves and debris from entering the storage tanks. An in-line sediment filter, located between the storage tank and the pump, filtered out particles larger than 100 microns. All tanks were drained and the inside cleaned to remove any residual pollen, sediment, and organic matter before the study began.
2.2. Monitoring Design
Three of the four storage tanks used in this study employed a different treatment mechanism designed to prevent the formation of anaerobic conditions and the corresponding decline in water quality (Figure 1). DeBusk and Hunt (2014) found that infrequent use of stored rainwater led to anaerobic conditions [28]; thus, use was simulated for tank 1 using an irrigation clock and automated valve that released 757 L during a one-hour period three times per week. This configuration was selected to mimic irrigation of an area equivalent to the contributing drainage area (79 m2) with 25.4 mm per week. Other Stormwater Control Measures (SCMs), such as wet detention ponds, utilize pumps and fountains to facilitate aeration and prevent stratification within the water column [33]. Tank 2 mimicked this technique via a recirculating pump that ran continuously at a rate of 0.3 L/s (Little Giant Pump Company, Oklahoma City, OK, USA). Water was pumped from the bottom of the tank and released above the water surface to maximize aeration (Figure 1). Finally, organic matter serves as a food source for denitrifying bacteria that can contribute to poor aesthetic quality (odor) of water when anaerobic conditions are present. It was hypothesized that if the majority of the pollen were diverted from the storage tank, then the lack of a food source would limit the proliferation of, and water quality impacts associated with, denitrifying bacteria. A first flush diverter was installed on tank 3 and captured the first 0.76 mm of rainfall from the roof surface, or approximately 61 L, and diverted it away from the RWH storage tank. The captured first flush volume was released slowly between rain events to create space for the next precipitation event. The fourth tank, tank 4, served as a control with no treatment mechanism installed.
DeBusk and Hunt (2014) monitored this system as part of a water quality study in 2011 and 2012 and found that water quality diminished greatly during spring and summer months [28]. The study hypothesized that pollen originating from overhanging vegetation, which settled on the roof surface and washed into the storage tanks during rain events in April and May, was the main source of deteriorating water quality and related odors. Thus, pollen data were obtained for this study from the North Carolina Department of Environmental Quality (NCDEQ) and included “pollen count trees”—the number of tree pollen grains contained in 1 m3 of air, “pollen count grasses”—the number of grass pollen grains contained in 1 m3 of air, “pollen count weeds”—the number of weed pollen grains contained in 1 m3 of air, and “total pollen count”—the sum of all the individual pollen counts for grasses, trees, and weeds [34]. Collection and reporting methods may be found in NCDEQ (2015) [34]. Pollen data were not collected on weekends or major holidays; however, linear extrapolation techniques were utilized to estimate pollen counts on days without collected data. As the only method by which pollen was added to the tanks was by rainfall, the total amount of pollen that accumulated between storm events was computed by summing the daily pollen count for all days within the antecedent dry period for each storm event. These data were used to determine the impact pollen had on water quality and dissolved oxygen levels within each tank.
Hydrologic and water quality monitoring for this study began on 1 April 2014, just before trees began pollinating, and continued until 1 September 2014, thus fully capturing the spring + summer pollen season. Rainfall depth and intensity were measured using a tipping bucket rain gage (Environment Information Technology, Alstonville, Australia) located 2.64 Km away from FS 8. A pressure-transducer data logger measured water level within the Simulated Use tank every three minutes (Onset Computer Corporation, Bourne, MA, USA). As this was the only tank with fluctuating water levels due to the periodic draining of water, it was the only one for which water level was recorded.
Dissolved oxygen (DO) concentrations were measured within each tank at 15-cm depth intervals within 24 h following rainfall events (Milwaukee SM600DOmeter, Milwaukee Instruments, Inc., Rocky Mount, NC, USA). DO concentrations were also measured once per week independent of rainfall events. Average DO concentrations were computed for each measurement event by averaging the DO readings from all depth intervals within the tanks.
Water quality samples were collected from a sampling port located approximately 5 cm above the bottom of the storage tank. All samples were collected within 24 h following a rain event and ports were flushed for 10 s prior to sample collection. The small diameter of the sampling port and the distance between the port and the bottom of the tank prevented the disturbance, and thus collection, of sediment that had accumulated on the tank bottom. Each water sample was analyzed by a state-certified laboratory (Center for Applied Aquatic Ecology at North Carolina State University) for TSS, total Kjeldahl nitrogen (TKN), nitrite (NO2) + nitrate (NO3), and total ammoniacal nitrogen (TAN) using the following standard methods: 2540 D (TSS), 4500 N Org D (TKN), 4500 NO3 F (NO2 + NO3), and 4500 NH3 G (TAN) [35]. TN concentrations were calculated by summing TKN and NO2 + NO3 values. A pollen grab sample was collected from the roof of the fire station building from pollen that had collected in a low area adjacent to the gutter. This sample was analyzed for total carbon and total nitrogen content.
2.3. Data Analyses
It was determined via the Shapiro–Wilks normality test that the majority of water quality and DO data were non-normal (α = 0.05); therefore, the Kruskal–Wallis Multiple Comparison test was used to compare water quality parameters and DO concentrations among the four tanks. Additionally, the nonparametric Kendall’s τ correlation method was used to identify correlations among DO concentrations, water quality parameters, and pollen data. Statistical significance of all comparisons and correlations was determined using an α = 0.05. All statistical analyses were performed using R version 4.1.1.
3. Results and Discussion
3.1. Pollen
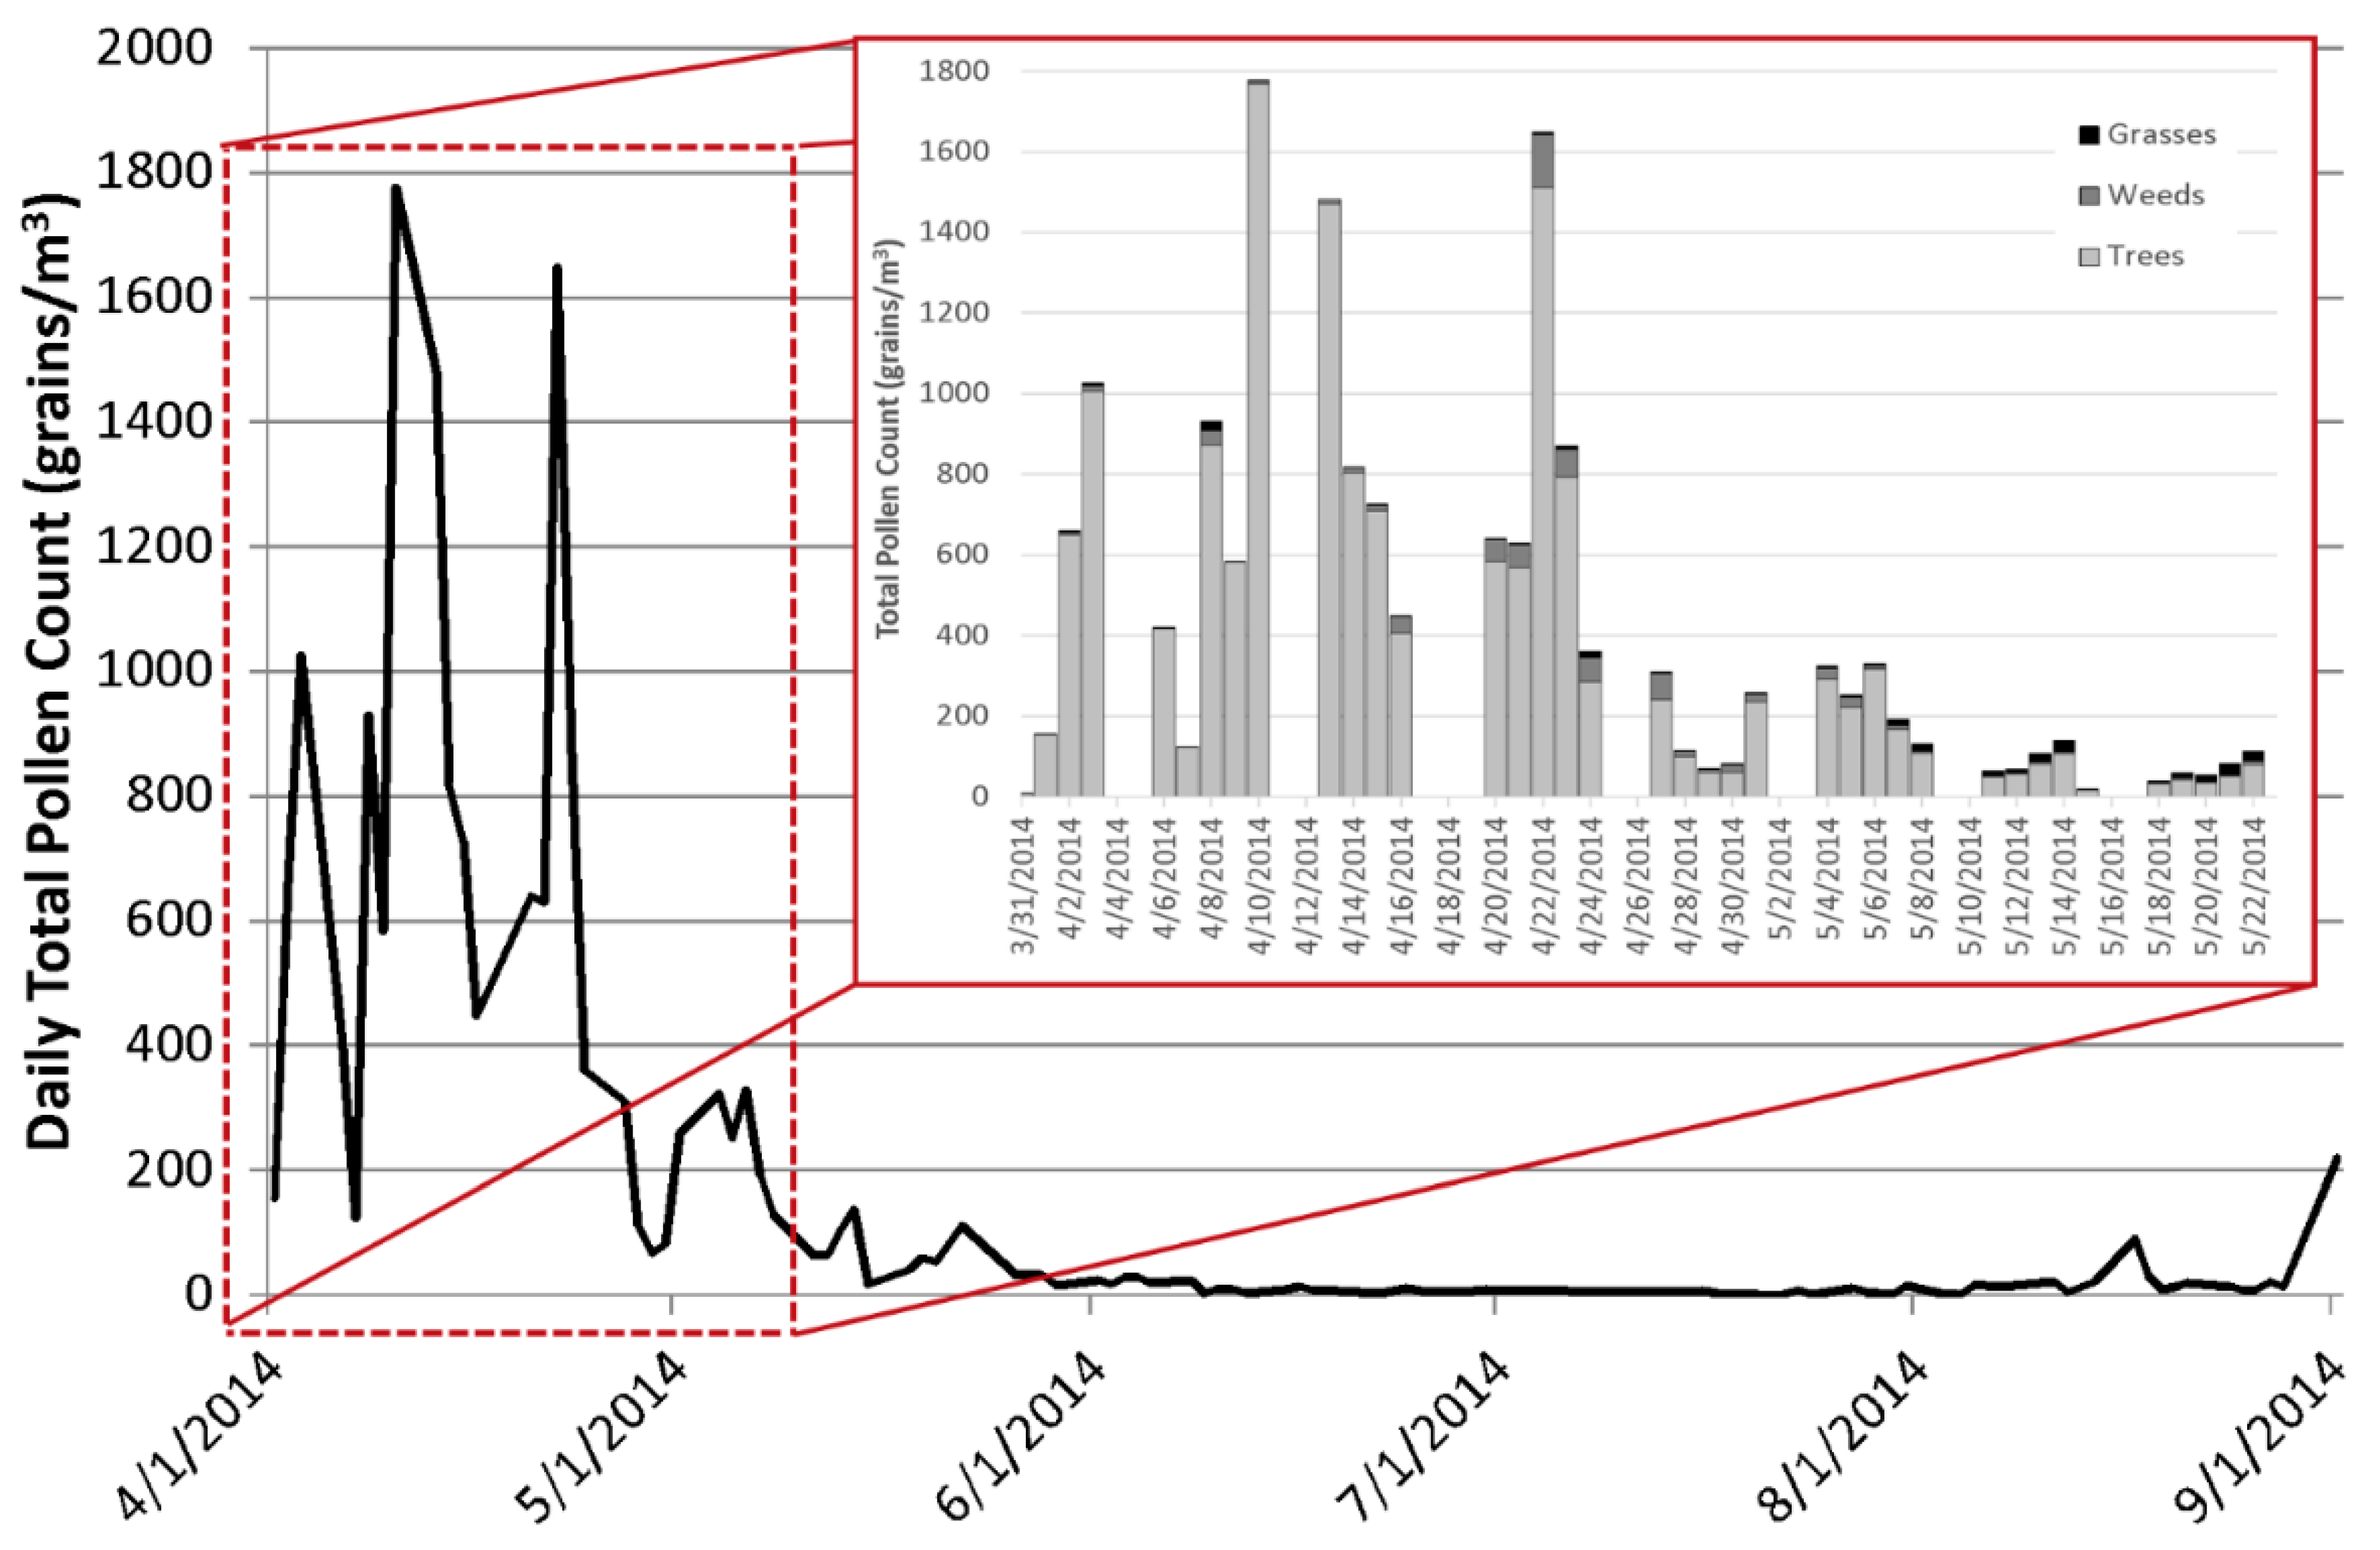
High pollen levels were reported from the beginning of April, peaked in mid-April at a total pollen count of roughly 1800 grains/m3, and curtailed off to very low levels by the end of May (Figure 2). As shown in the figure, the relative amount of tree pollen reported by NCDEQ (2015) was substantially greater during the study period than pollen from grasses and weeds. As the majority of vegetation contributing to pollen within the RWH system was from Loblolly pine trees surrounding the study site, the pollen levels at the study site likely closely resembled the reported total pollen counts.
3.2. Dissolved Oxygen
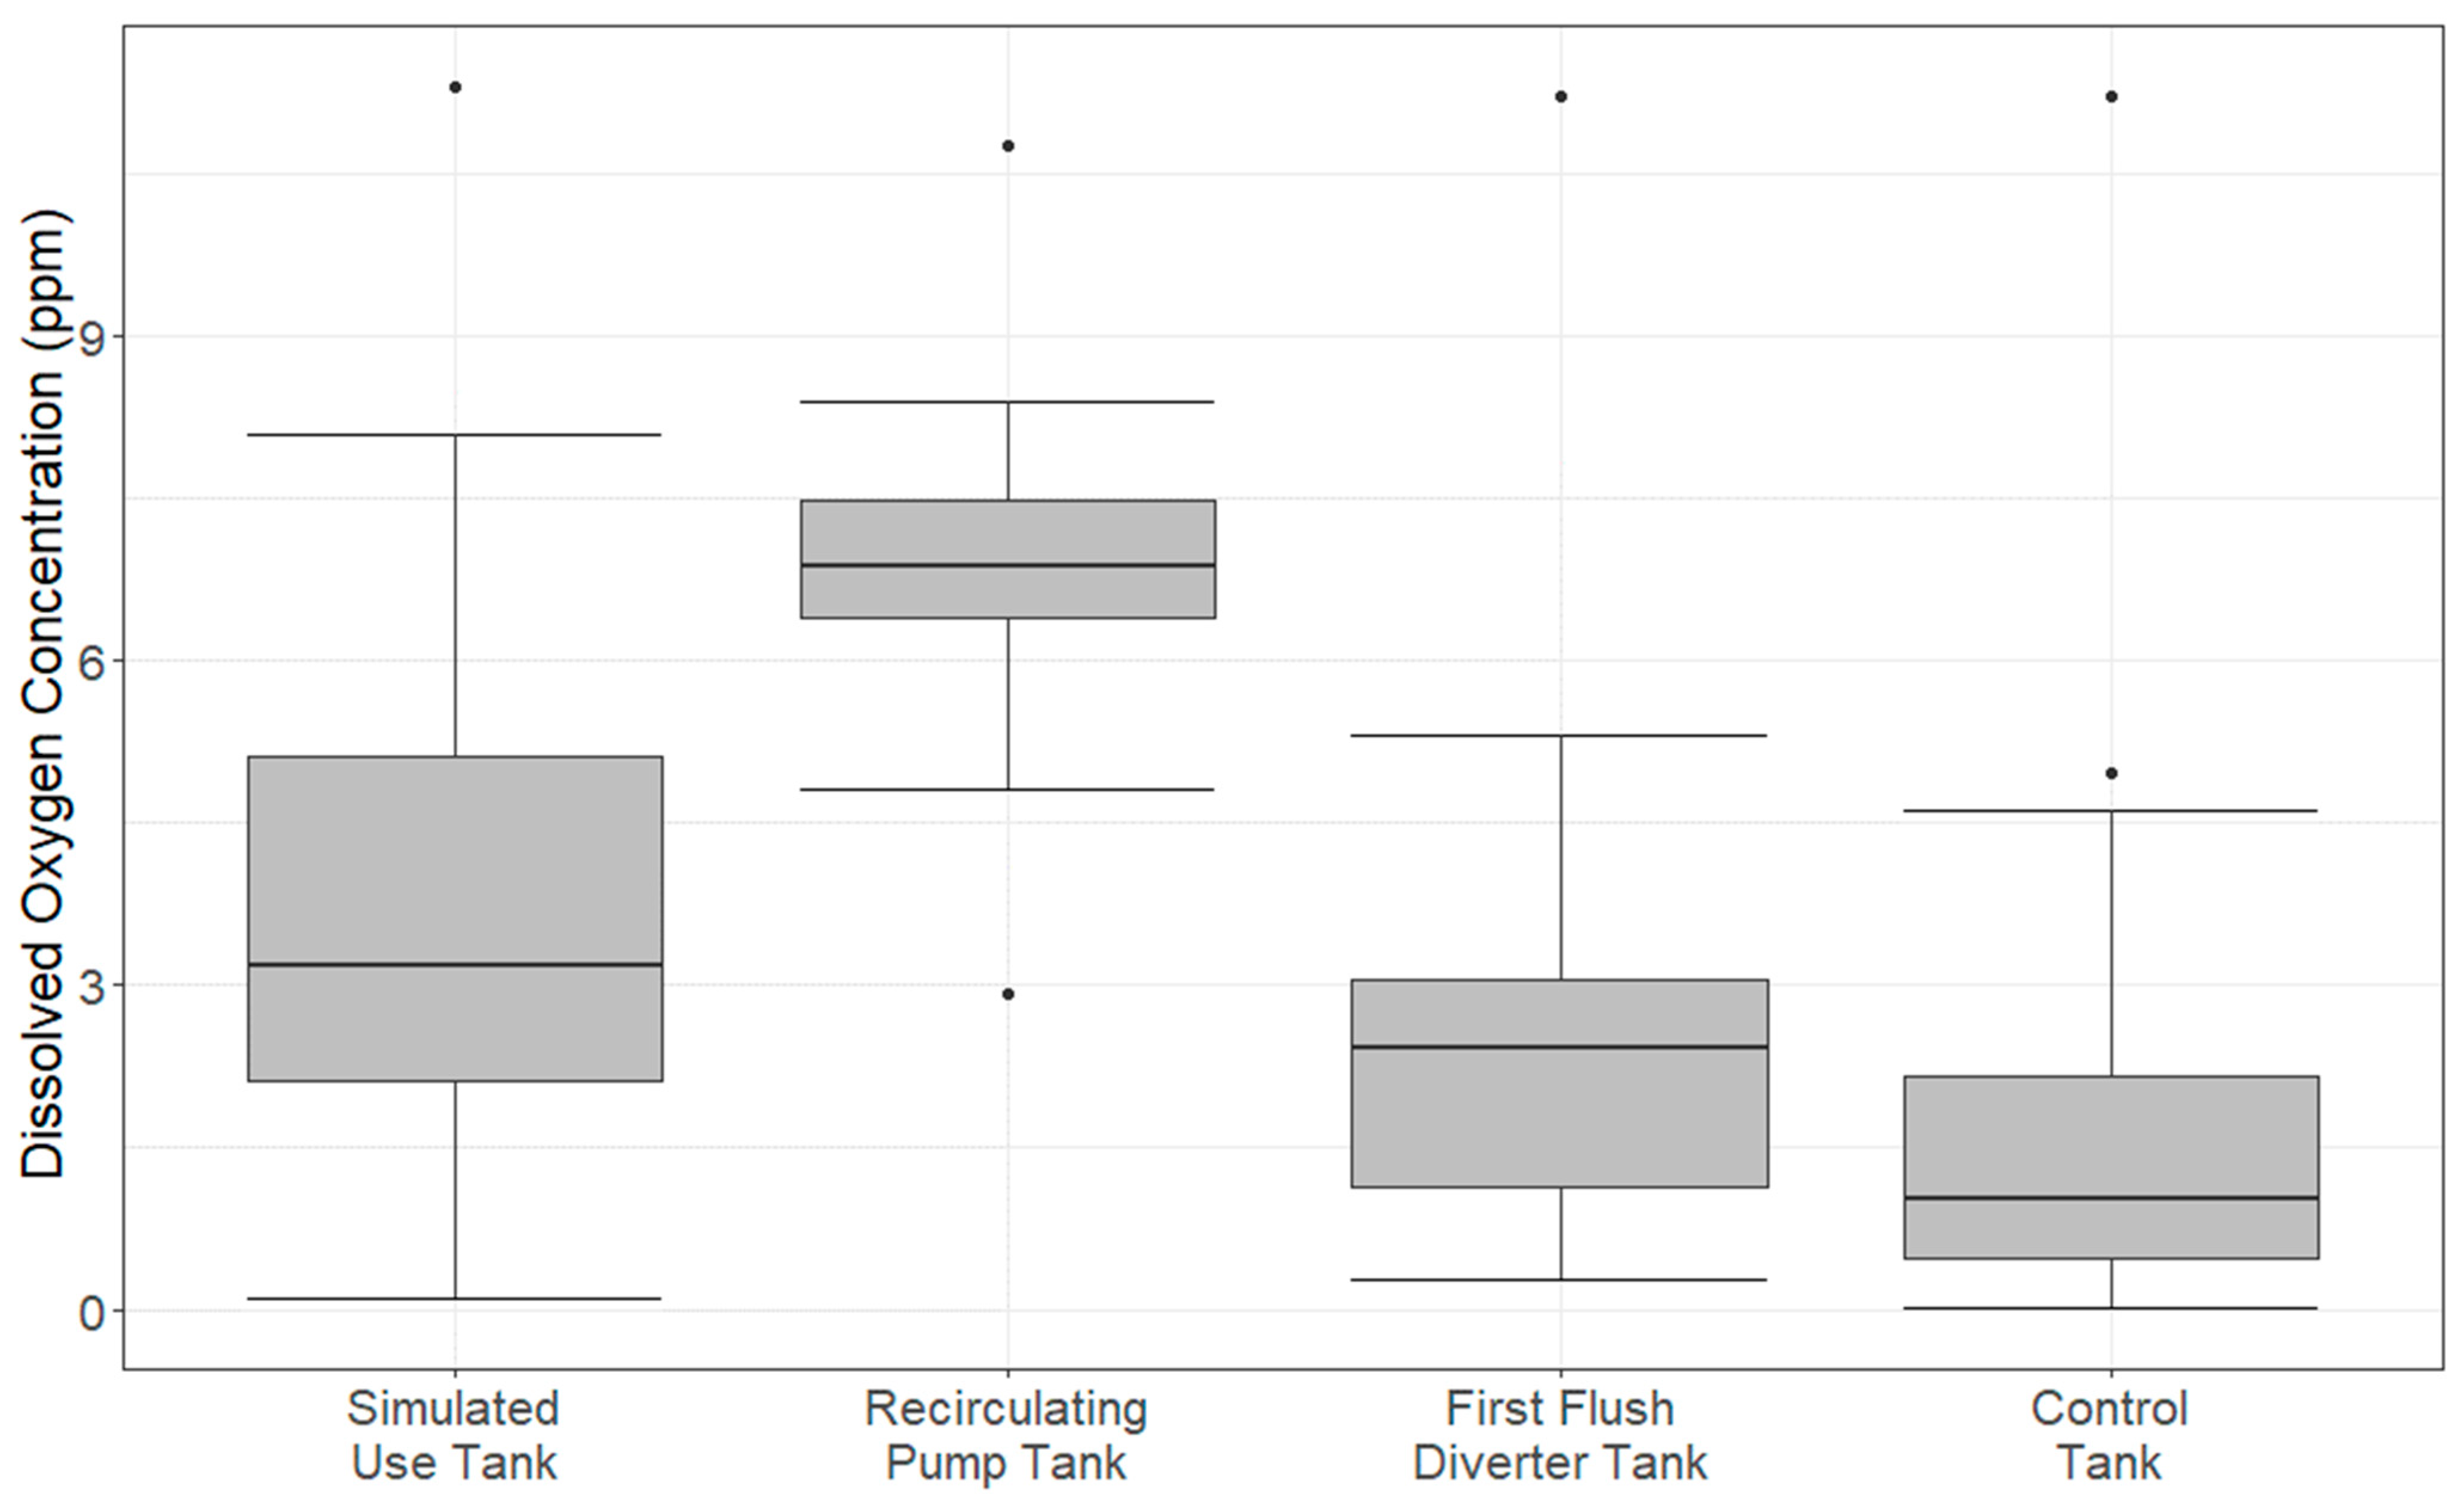
Average DO concentrations for each tank are displayed in Figure 3. Of the four treatments used, the Recirculating Pump tank maintained a significantly higher average DO concentration than all other treatments, including the Control tank. The next highest average DO concentration was observed in the Simulated Use tank, which was significantly higher than the Control tank, but not significantly higher than the tank equipped with the first flush diverter. The First Flush Diverter tank did not exhibit significantly different average DO concentrations from the Control tank, which represented the lowest average DO concentration out of the four treatments.
These results indicate that the Recirculating Pump tank produced the highest concentrations of DO. This was expected, as moving water contains higher amounts of DO than stagnant water [36]. The second most effective treatment was simulating use. The first flush diverter did not produce DO concentrations that were significantly different than the control system, thereby making it the least effective treatment option for preventing anaerobic conditions.
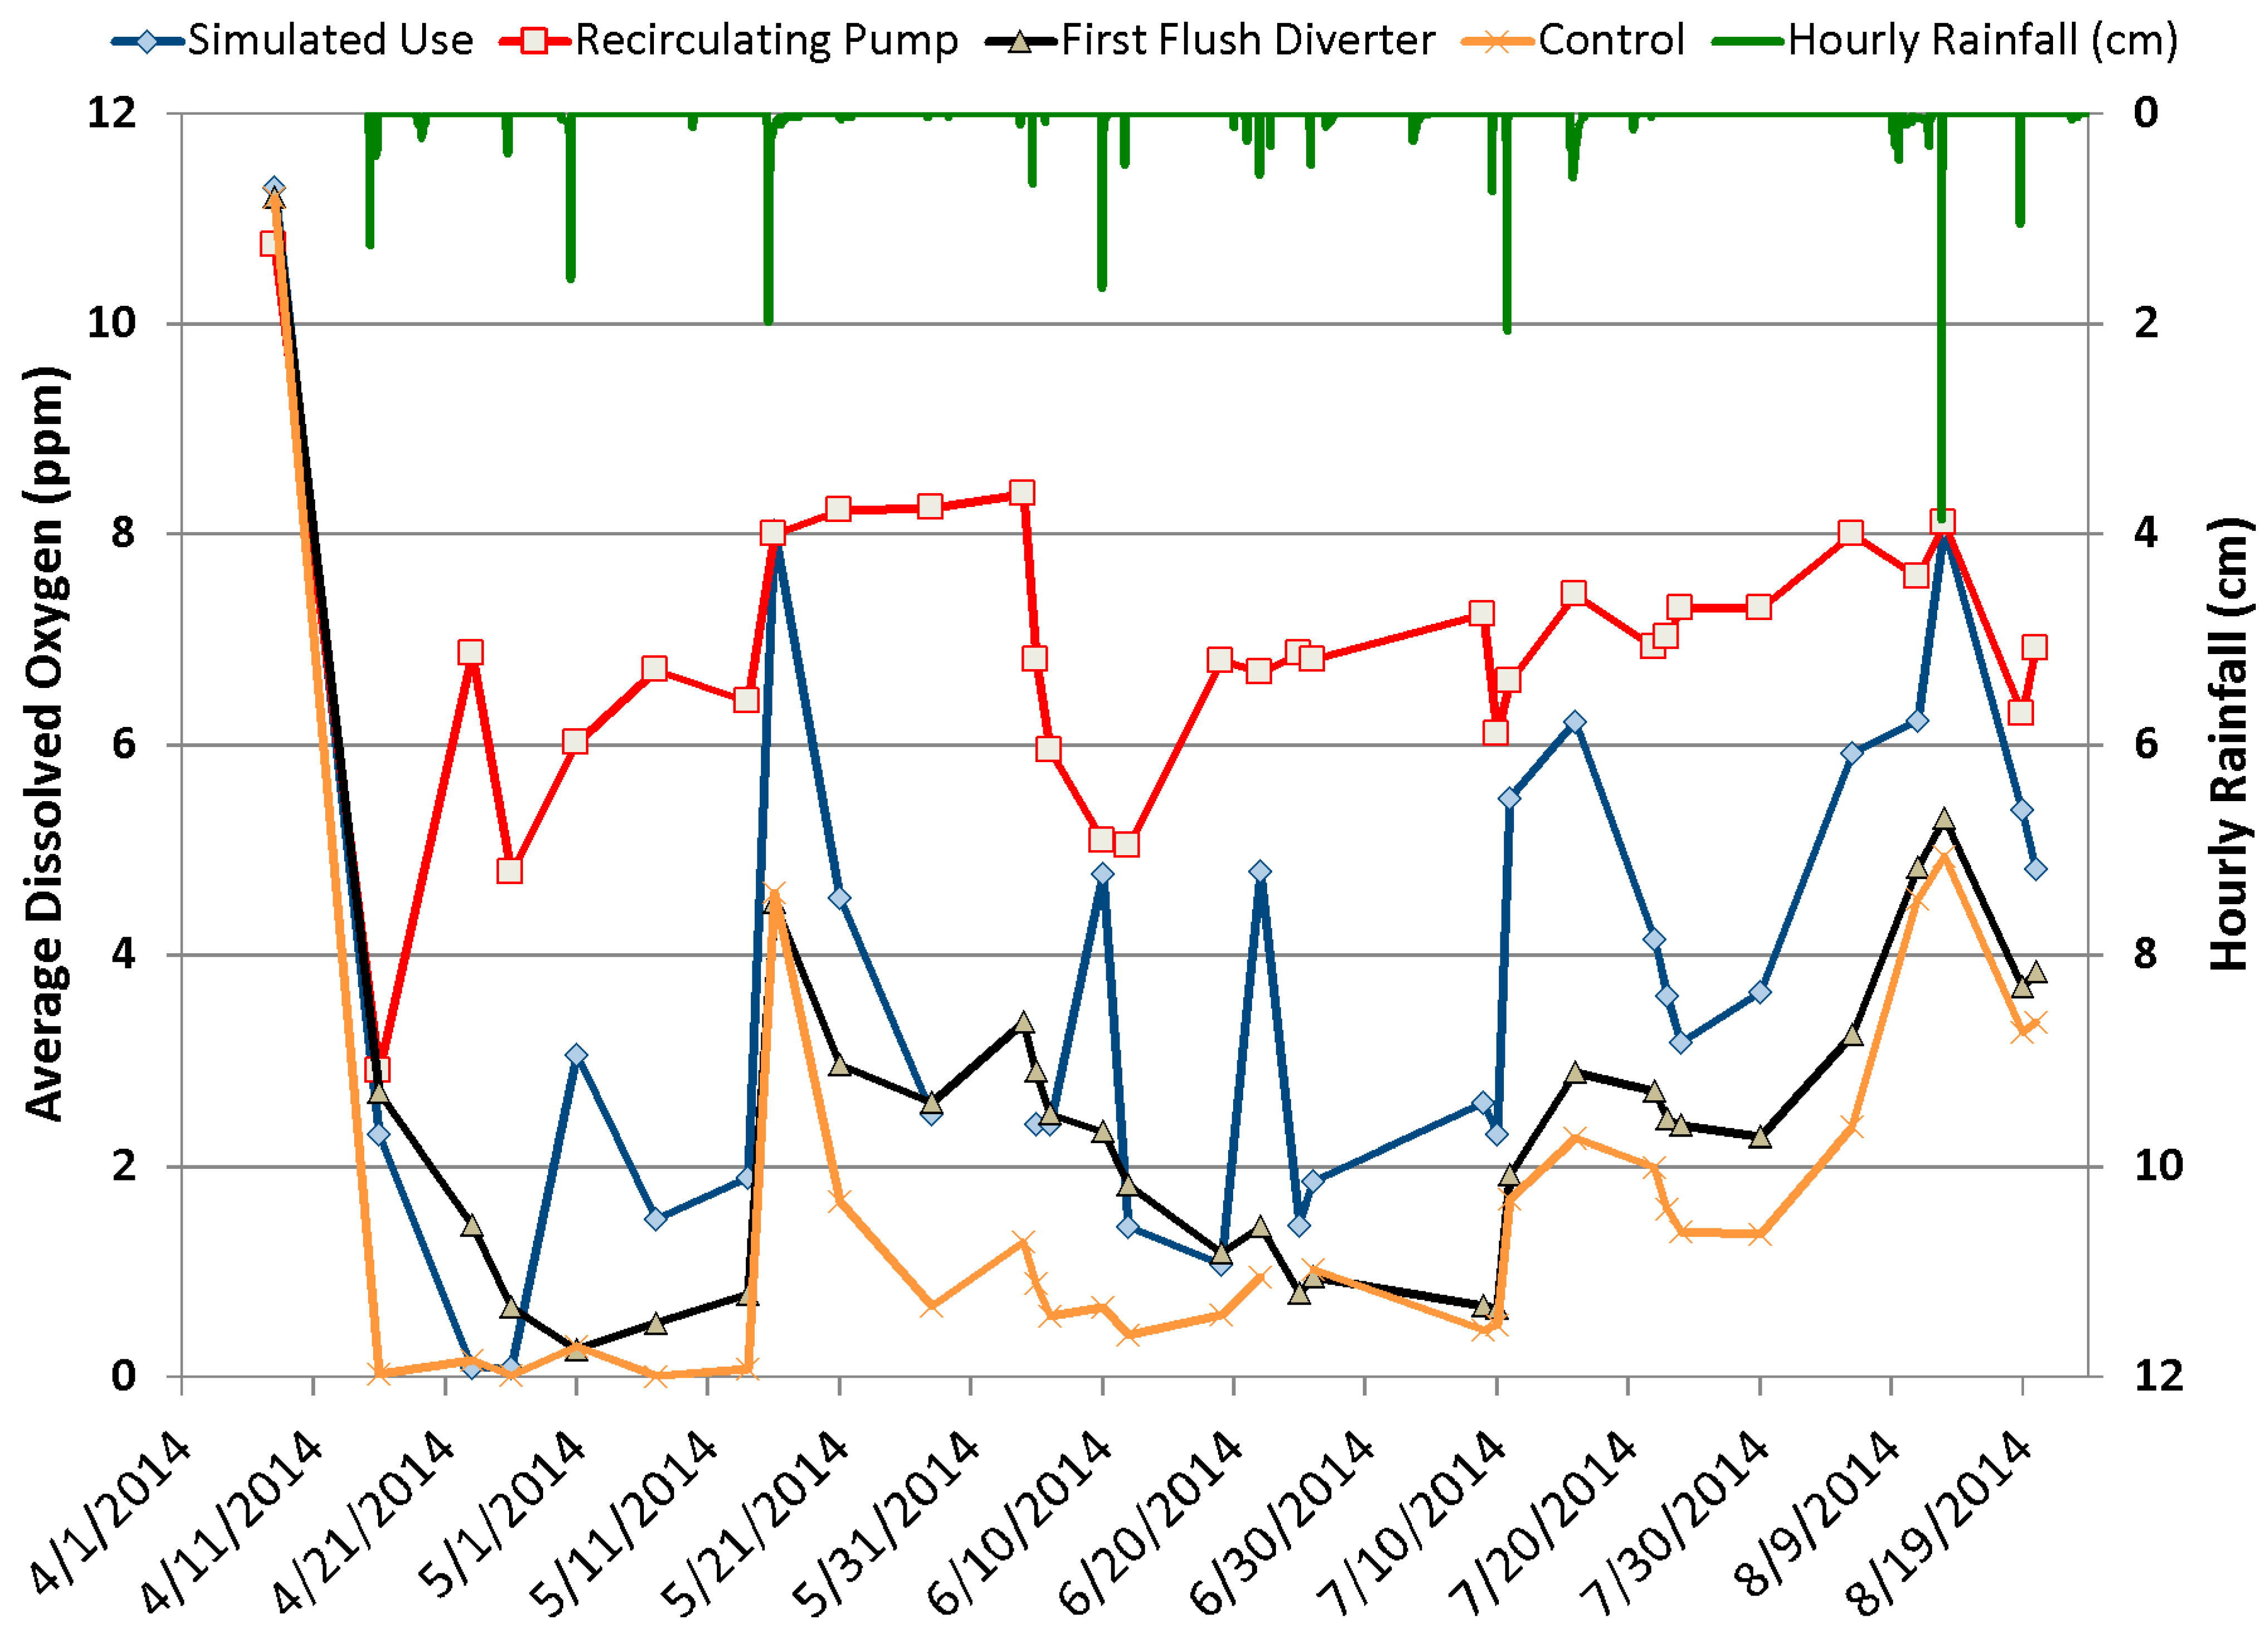
Average DO concentrations were lowest at the beginning of the study period and increased gradually as the study period progressed, as indicated in Figure 4. Kendall’s τ correlation tests were performed to determine if storm characteristics (storm depth, storm duration, antecedent dry period length, average rainfall intensity, or maximum rainfall intensity) were correlated with average DO concentrations. Average DO concentrations in the Simulated Use tank were significantly, positively correlated with rainfall depth, duration, and maximum intensity; however, no other tanks exhibited significant correlations between storm event characteristics and DO concentrations. The correlation between rainfall depth and DO for the Simulated Use tank is likely due to the fact that the tank was partially empty for many of the rainfall events, as water was being released regularly. Thus, when rainfall occurred, it had a greater distance to fall from the tank inlet to the water surface, thereby mixing the water column and introducing oxygen. All other tanks remained full for the entire study period, minimizing the disturbance and subsequent introduction of oxygen via tank inflow.
3.3. Water Quality
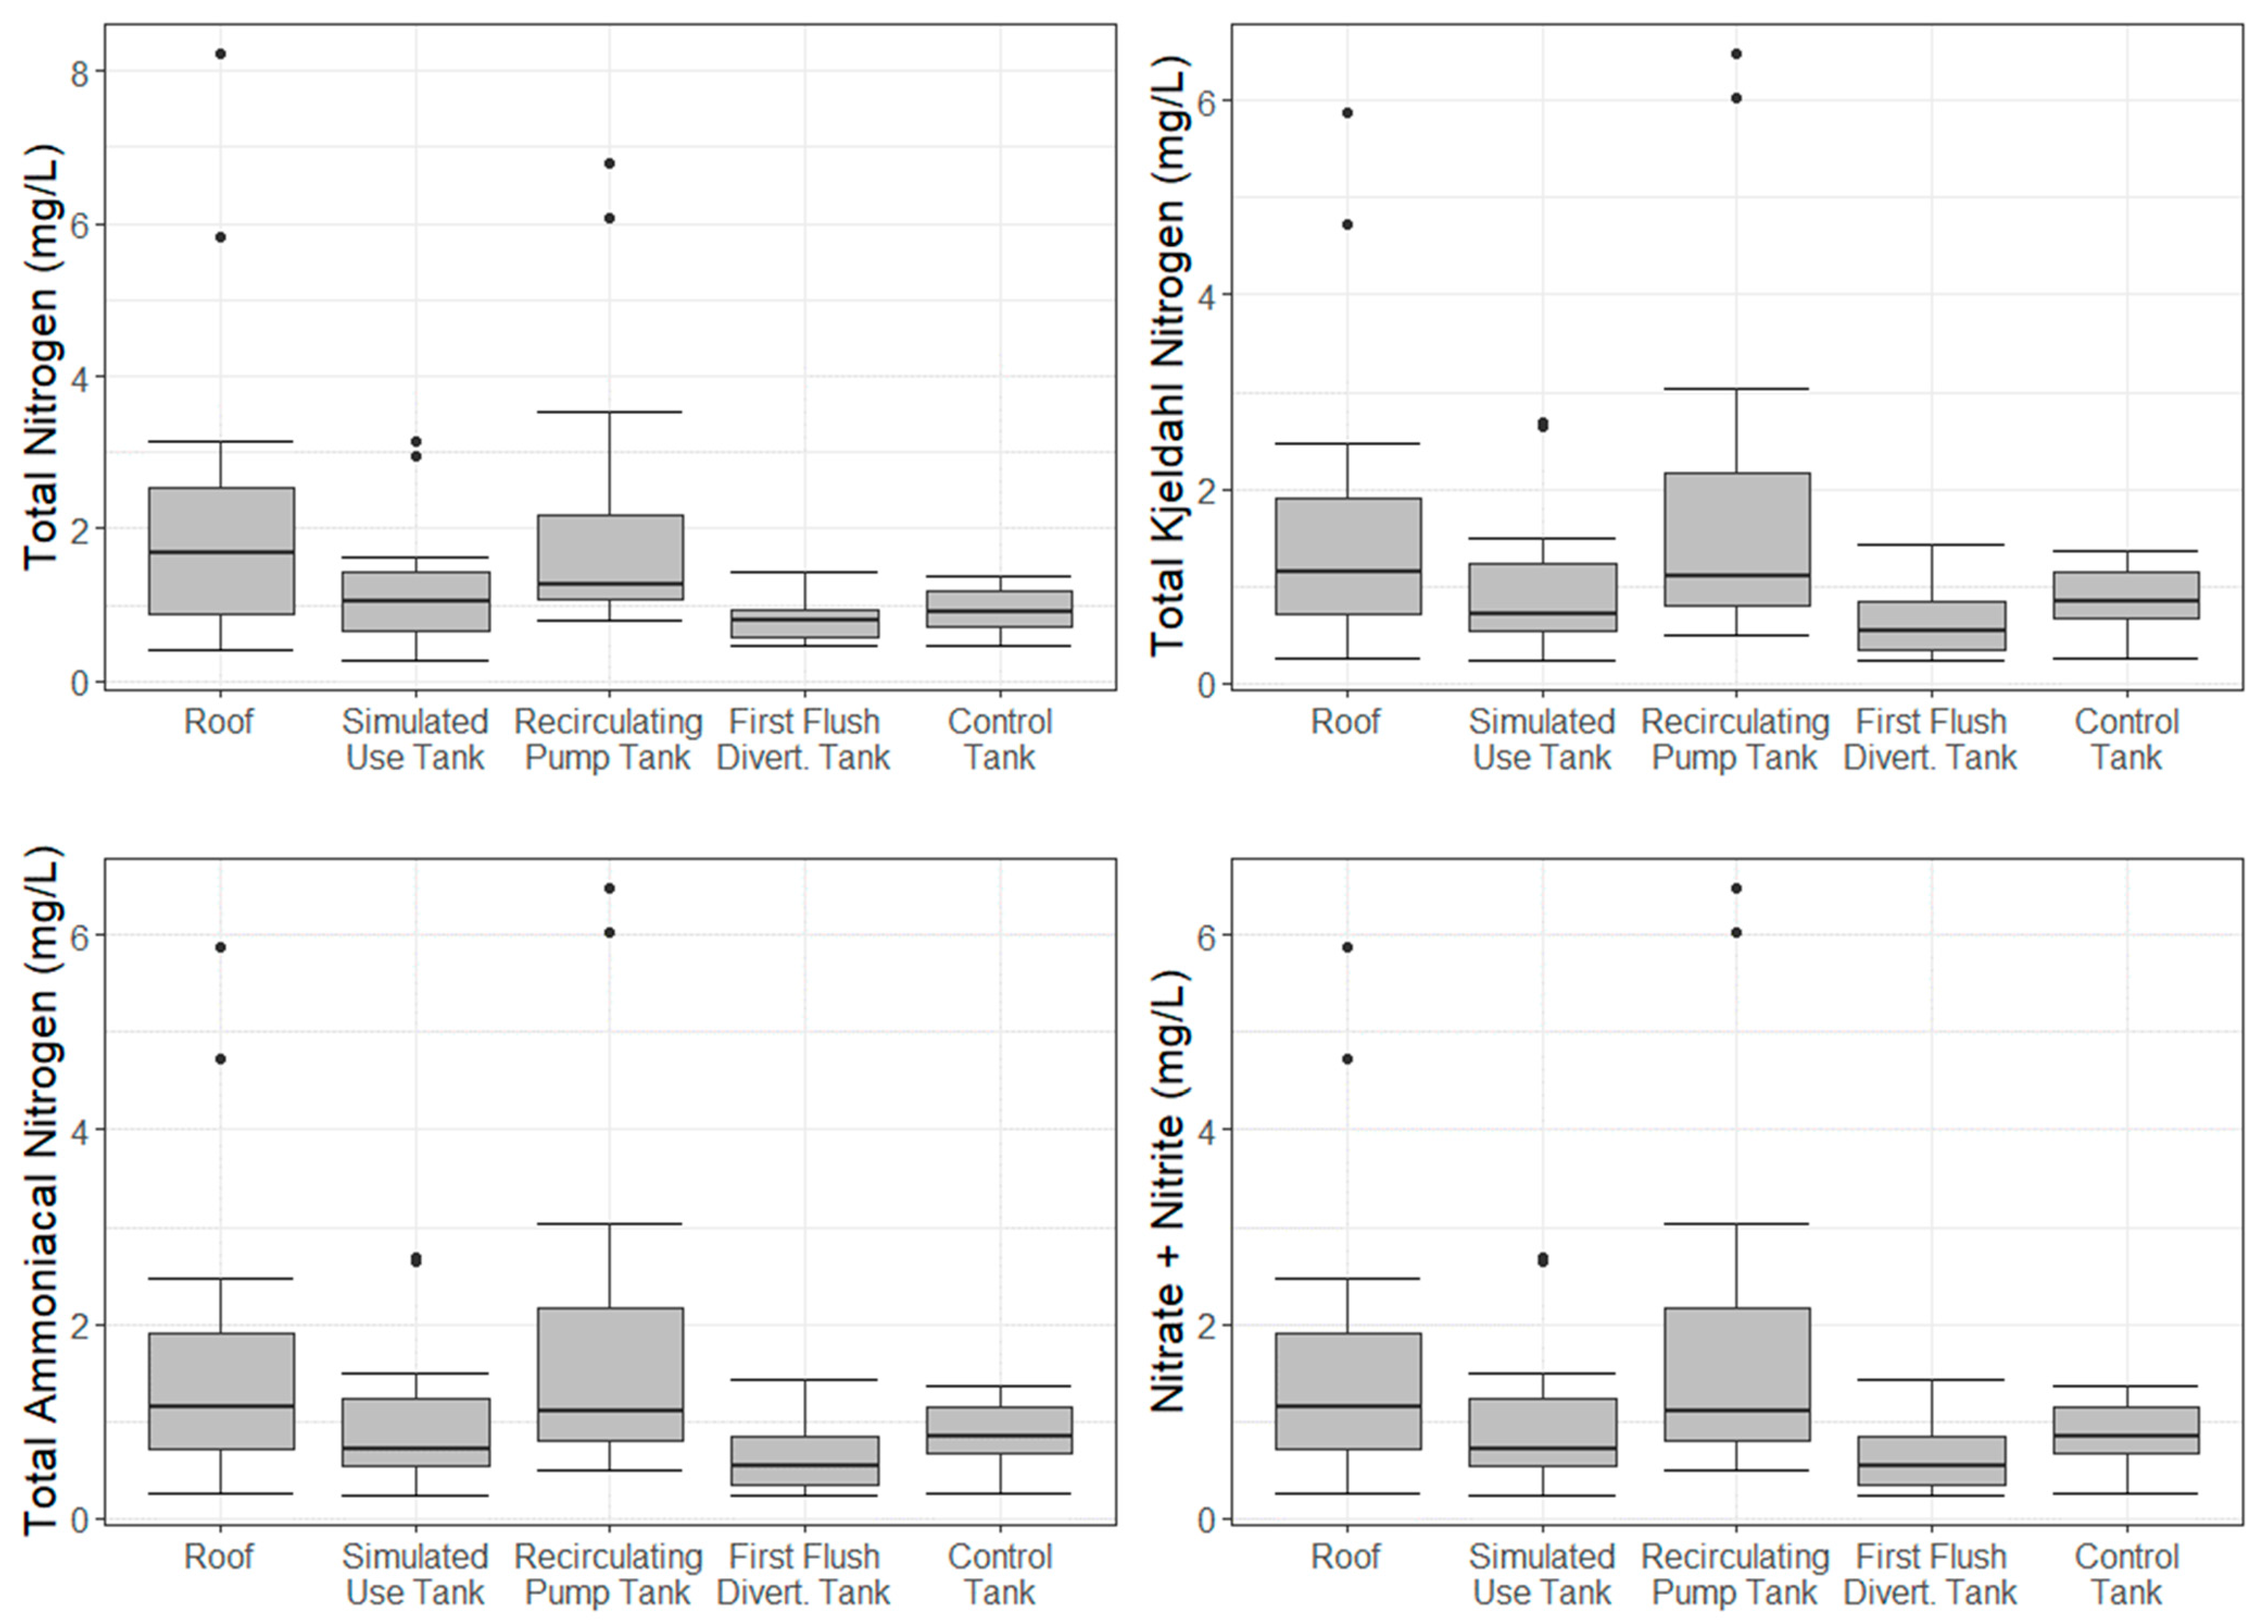
Table 1 displays the results of water quality analyses for roof runoff and rainwater storage tank samples. With respect to stormwater quality mitigation, the First Flush Diverter tank performed the best, producing significantly lower concentrations of TKN, NO2/NO3 and TN compared to those of roof runoff (Figure 5). The Control tank also produced significantly lower NO2/NO3 concentrations than roof runoff, but other nitrogen species were not significantly different. None of the tanks significantly reduced TAN concentrations.
When compared to the other treatment mechanisms, there were no significant differences between the Control tank and the treatment tanks with respect to TKN orTN concentrations. The Simulated Use and Recirculating Pump tanks produced significantly higher NO2 + NO3 concentrations than the Control tank, likely due to the introduction of oxygen to the water column via inflow and recirculation, respectively. The Control tank produced higher TAN concentrations and lower NO2 + NO3 concentrations relative to the other treatment tanks, which resembles the findings from DeBusk and Hunt (2014) and indicates the prevalence of anaerobic conditions. TN concentrations in the Recirculating Pump tank were significantly higher than those in the First Flush Diverter tank but were not significantly different from concentrations in the other three tanks.
DO concentrations correlated negatively with TKN concentrations for all tanks and at all measured depths, as well as with the averaged DO concentrations (all comparisons yielded τ < −0.37). For the Recirculating Pump tank only, DO concentrations correlated negatively with NO2 + NO3 concentrations for all depths and the average. The Simulated Use and Control tanks exhibited significant negative correlations between NO2 + NO3 concentrations and DO concentrations, but only at depths of 24′ (τ = −0.429) and 30′ (τ = −0.455), and 24′ (τ = −0.393), 30′ (τ = −0.367), and 36′ (τ = −0.409), respectively. Average DO concentrations for these two tanks were not significantly correlated with NO2 + NO3 concentrations. Additionally, there were no significant correlations between TAN concentrations and DO concentrations for any of the tanks.
These findings indicate that as DO concentrations decrease within the Simulated Use tank, TKN and NO2 + NO3 concentrations increase, likely due to the nitrogen transformations occurring within the storage tank. The pollen sample collected at the study site yielded 2.42% total nitrogen and 56.55% total carbon on a dry weight basis, thus producing a C:N ratio of 23.4:1. This is almost identical to the required C:N ratio of 23.5 for aerobic heterotroph bacteria, but much less than the C:N ratio of 80 required for anaerobic heterotrophs [37]. Thus, when dissolved oxygen levels decrease and anaerobic conditions form within the tank, anaerobic heterotrophs must consume more organic matter to satisfy their carbon needs and the extra nitrogen is released in the form of ammonium. This explains an increase in TKN concentrations with decreasing DO concentrations. The correlating increase in NO2 + NO3 concentration for the Recirculating Pump tank is likely a result of nitrification, which occurs because the recirculating pump is continually adding some oxygen to the water, which is quickly used up by aerobic bacteria. The reasoning is the same for the select depths within the Simulated Use and Control tanks that exhibit this correlation as well, except the oxygen is likely introduced via the inflow of water during rain events. The influence of the disturbance and delivery of oxygen does not extend below the top portion of the water column, thus preventing a correlation at lower depths.
Accumulated pollen totals (APTs) were computed using total pollen count data and compared to water quality and DO concentrations. APTs were significantly correlated with TKN (τ = 0.446) and TAN (τ = 0.507) concentrations in the Recirculating Pump tank only. As the recirculating pump continuously mixed the water within the tank, the pollen entering the tank likely remained suspended (as opposed to settling to the bottom of the tank) and thus contributed to higher TKN and TAN concentrations in the samples taken from the tank. APTs in the Control tank were significantly correlated with DO concentrations only at depths of 24′ (τ = −0.277), 30′ (τ = −0.304), and 36′ (τ = −0.303). This is likely due to the lack of measures to reduce the introduction of pollen into the tank (e.g., first flush diverter) coupled with a stagnant water column that never changed in depth and was not mixed. As the pollen entered the system, it became a food source for aerobic bacteria that also consumed dissolved oxygen; thus, higher amounts of pollen led to lower dissolved oxygen concentrations. The inflow of runoff during rain events sufficiently disturbed just the upper layers of water in the storage tank enough to introduce oxygen, thus allowing the aerobic bacteria to thrive. No other significant correlations existed between APTs and DO concentrations or water quality parameters for any other tanks.
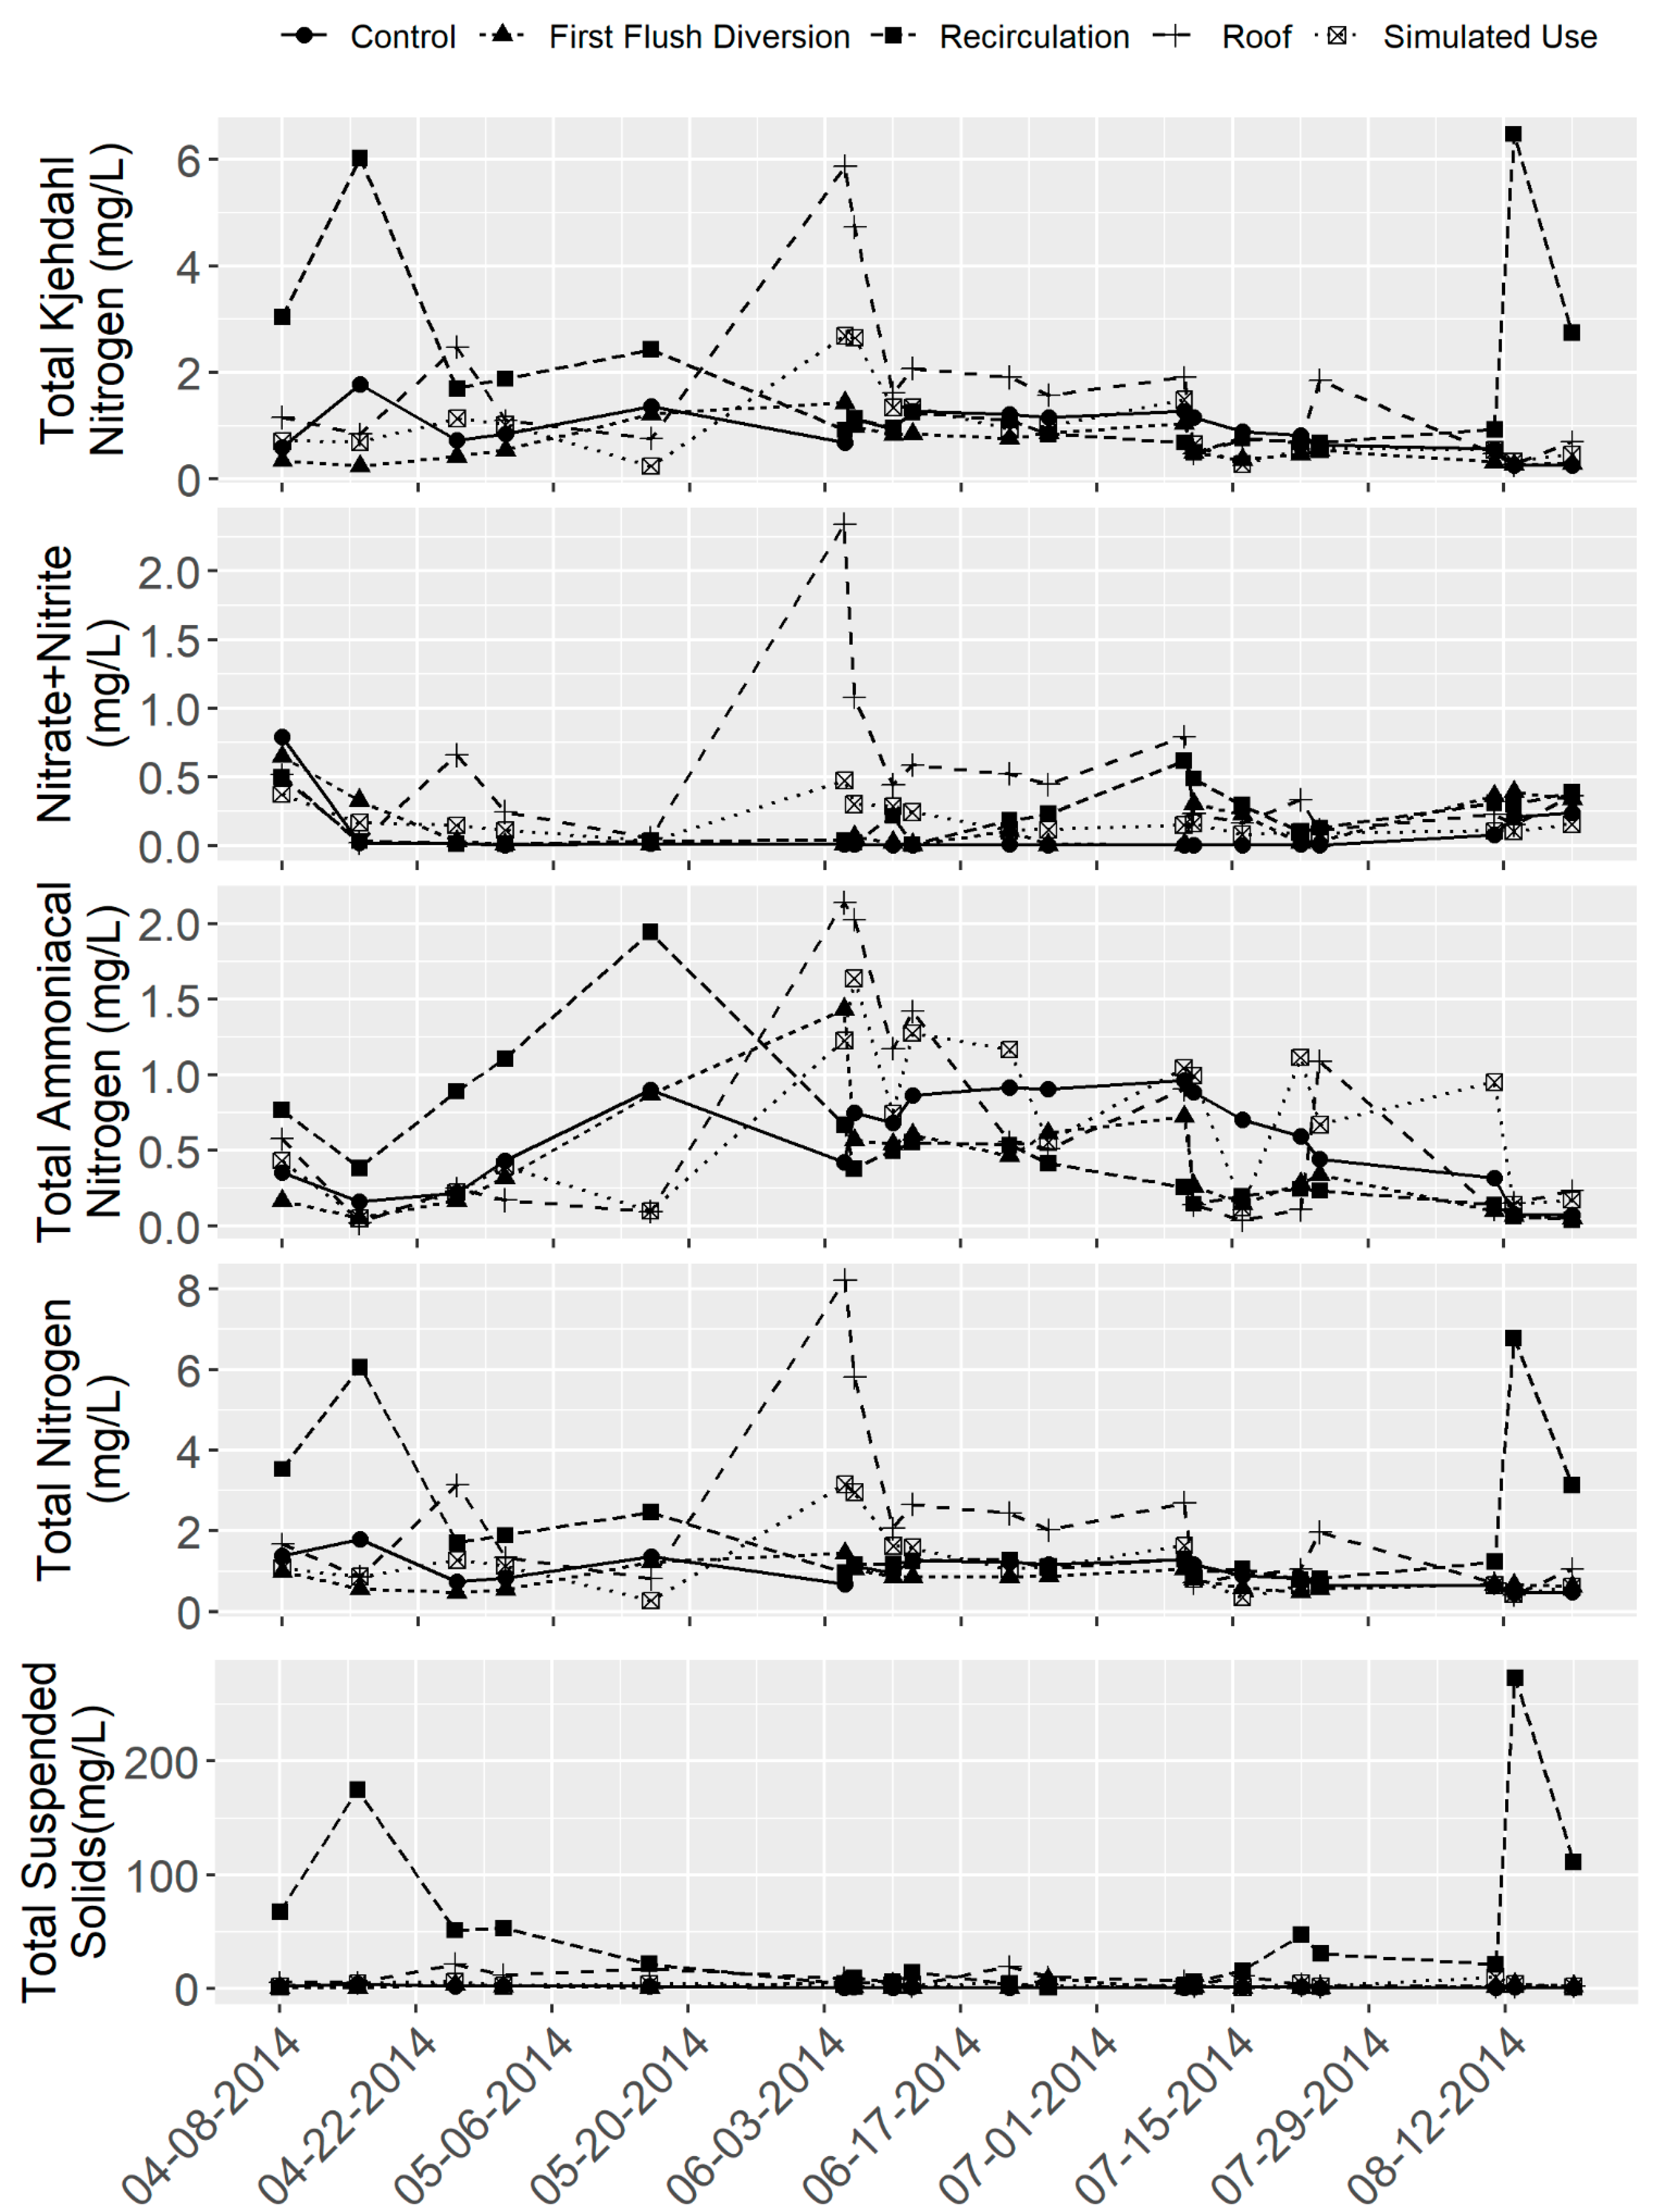
As shown in Figure 6, concentrations of the measured constituents varied—sometimes substantially—throughout the study period. There were notable spikes in all nitrogen species concentrations in the incoming roof runoff in early June 2014, likely due to a relatively long antecedent dry period (19 days) prior to the 4 June precipitation event, which allowed organic matter to accumulate on the contributing roof surface. Another spike in TSS and nitrogen species concentrations in roof runoff occurred with the 11 August precipitation event, which had a preceding dry period of 17 days, and is apparent in the TKN, TN, and TSS concentrations shown in Figure 6. The Recirculating Pump tank exhibited unique patterns regarding nitrogen and TSS concentrations when compared to the Control and other treatment tanks, for reasons discussed previously (i.e., the continuous introduction of oxygen, preventing the development of anaerobic conditions). The TAN concentrations shown in Figure 6 perhaps paint a clearer picture of the nitrogen transformations occurring within the RWH tanks. In the Recirculating Pump tank, TAN concentrations are highest during the beginning of the study period when there is ample pollen within the tank to serve as a food source for aerobic heterotroph bacteria. Because the C:N ratio of the pollen is slightly below the ideal 23.5:1 ratio for aerobic autotrophs, there may be some export of ammonia occurring. TAN concentrations for this tank peak around mid-May, perhaps when the bacteria present within the tank deplete the pollen serving as their primary food source. Once this occurs, TAN is no longer being exported; however, due to the continuous presence of oxygen, nitrification is likely still occurring which converts ammonia to NOx, thus resulting in a steady but slight decrease in overall TAN concentration within the tank. In the other tanks, all of which exhibited anerobic conditions, TAN concentrations were low at the beginning of the study and gradually increased until approximately the middle of the study period—likely due to anaerobic digestion and the corresponding export in ammonia—where they remained relatively stable. Substantial dips in TAN concentrations in some tanks can be linked to large, intense rainfall events or precipitation events with relatively long antecedent dry periods, indicating the introduction of oxygen via disturbance of the water column that temporarily slows down anaerobic bacterial processes.
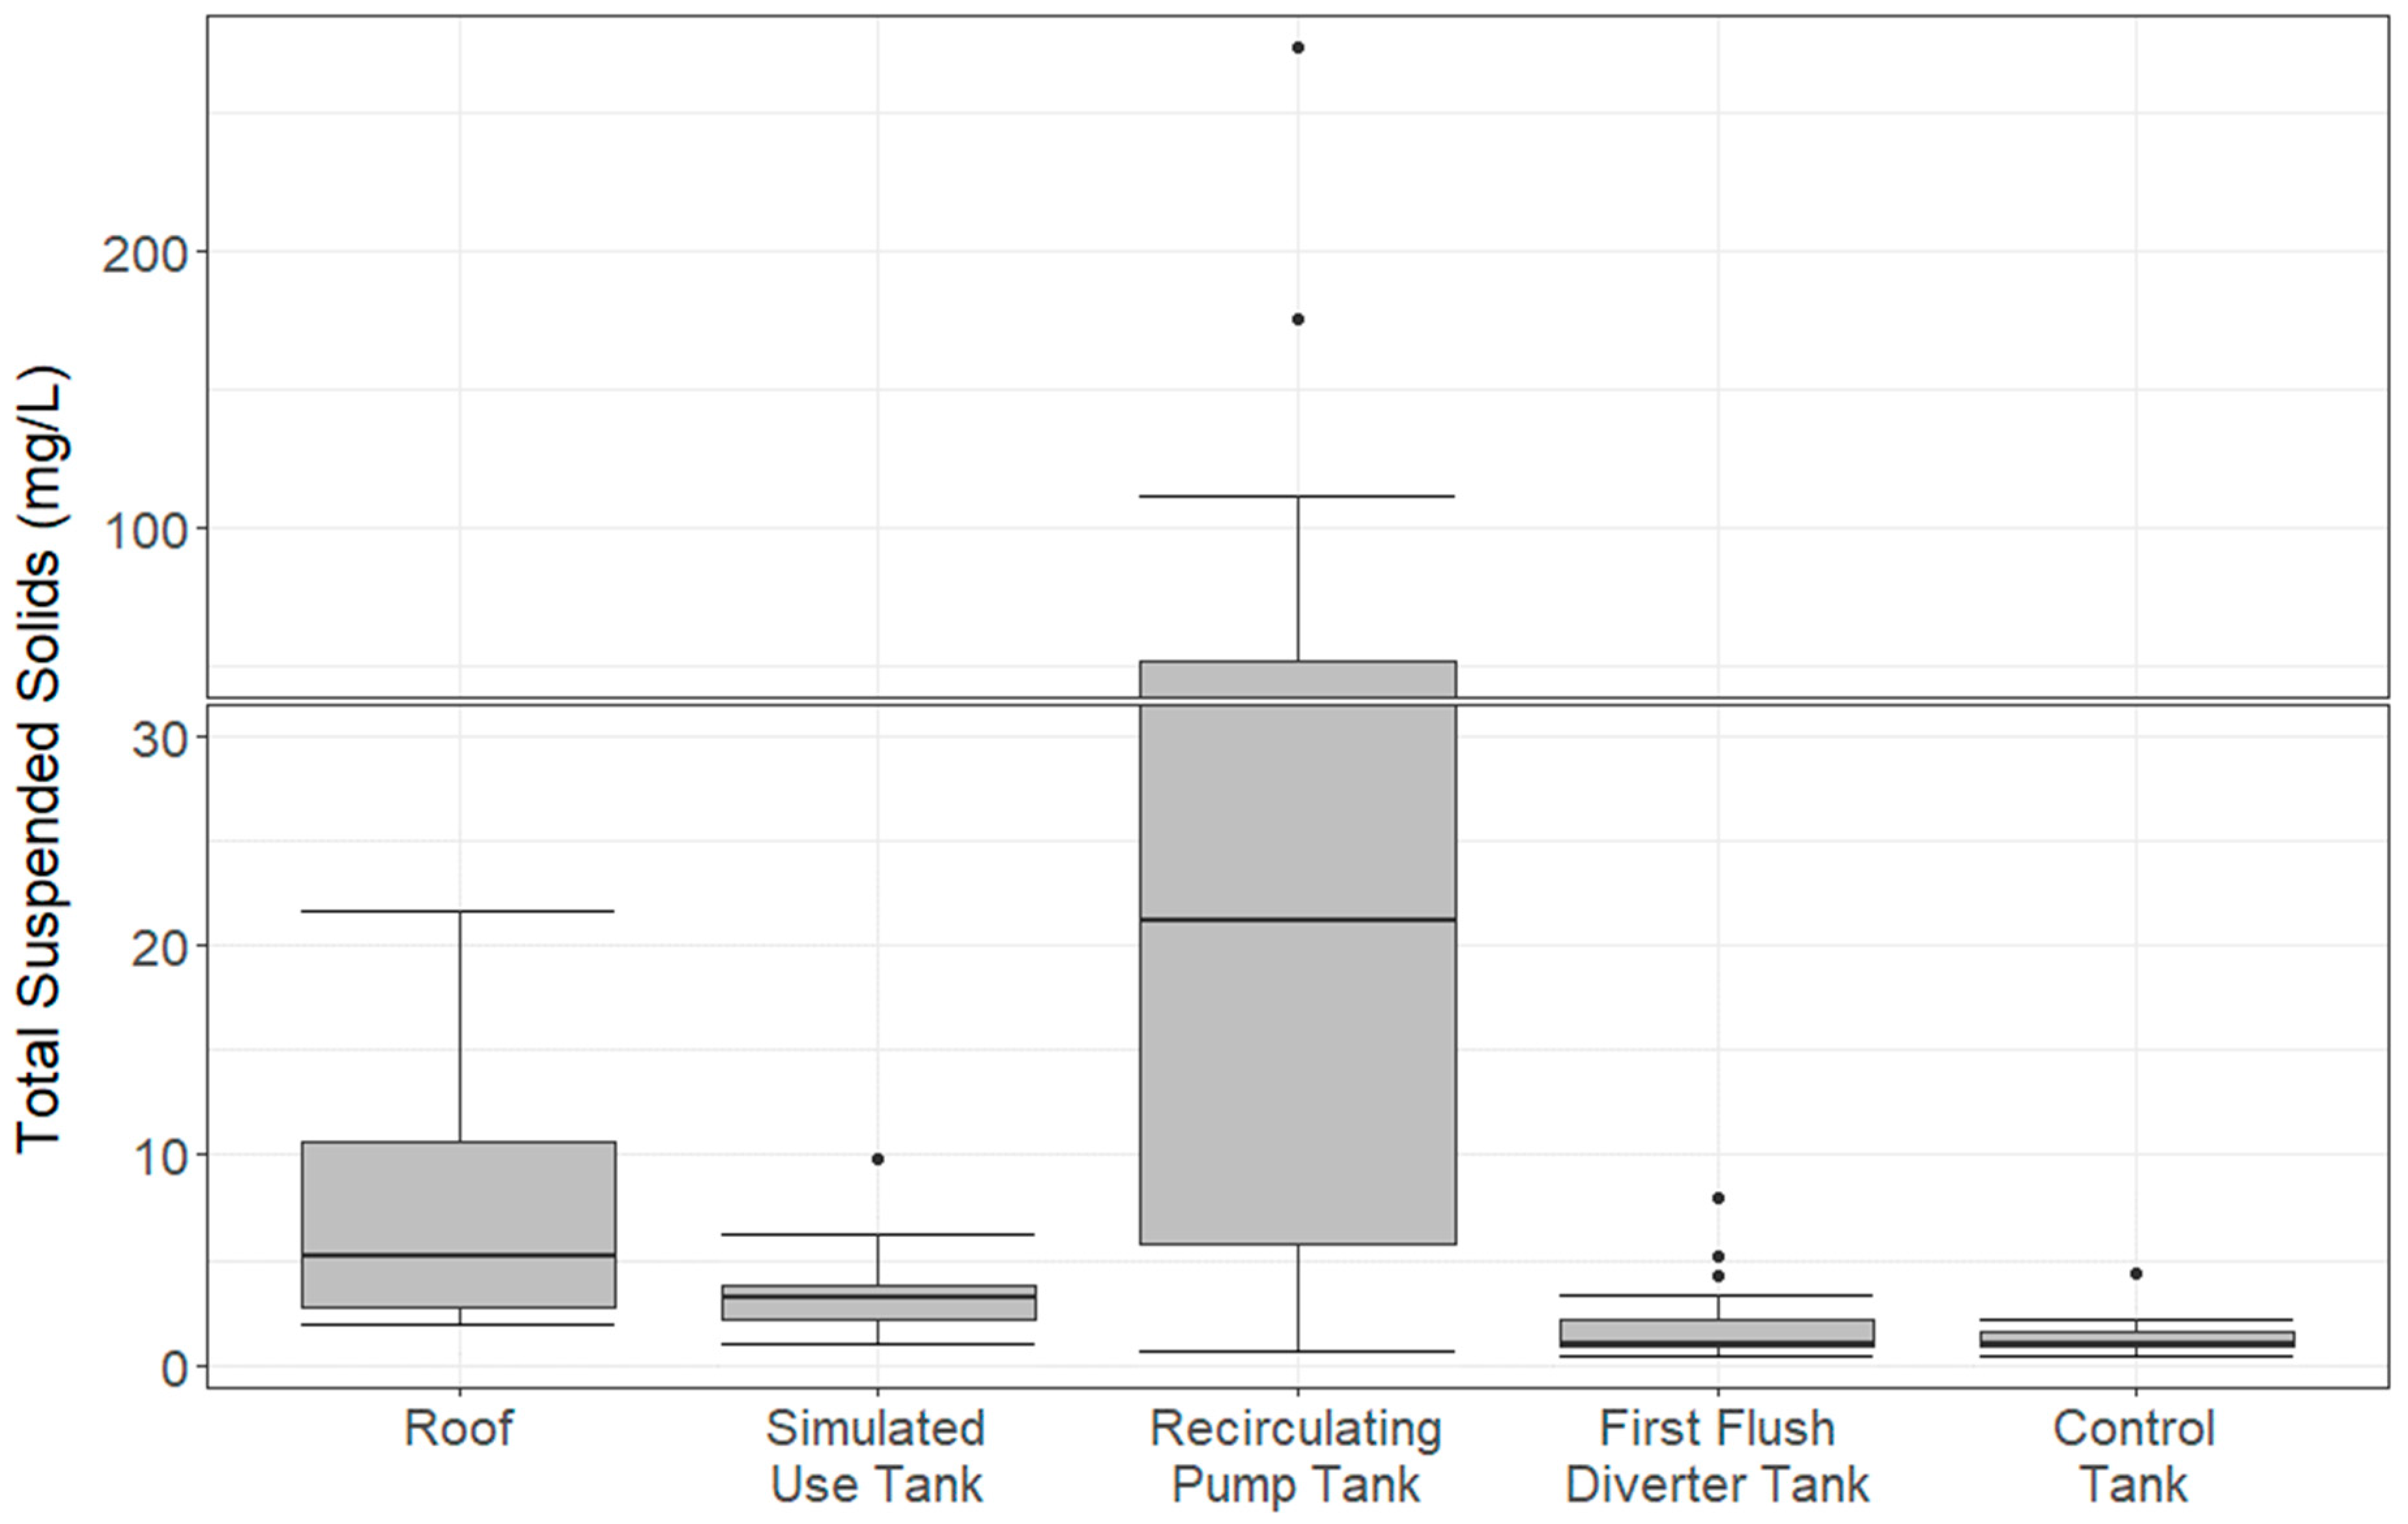
Only the First Flush Diverter tank and the Control tank yielded TSS concentrations that were significantly lower than those in roof runoff (Figure 7). The Recirculating Pump tank produced significantly higher TSS concentrations than any of the other tanks, including the control. It appears that the circulation of stored water kept sediment particles suspended throughout the water column and, in many instances, contributed to the export of TSS from the system. TSS concentrations from the Simulated Use tank were also significantly greater than those of the Control tank. It is hypothesized that roof runoff entering the tank when the water level was low (due to the release of water to simulate use) disturbed sediment and organic matter that had settled on the bottom of the tank, thus contributing to higher TSS concentrations within the water column.
3.4. Aesthetics
Despite employing methods to address anaerobic conditions, all tanks displayed aesthetic issues, including foul odor and discoloration of the water, during the study period. The issues were first documented in early May and persisted until mid-August and were hypothesized to be due to the increased amount of pollen during this time of the year. The Recirculating Pump tank exhibited the poorest aesthetic water quality, including a strong “swampy” odor and brownish-colored water. The aesthetic issues peaked during early- to mid-May (just after the peak in pollen amounts) and began to recede towards the end of May in all tanks except the Recirculating Pump tank. All tanks were clear with no yellow tinge by mid-August except for the Recirculating Pump tank, in which the issues of odor and discoloration continued after August.
3.5. Implications for Stormwater Management
The tanks that produced the highest DO concentrations throughout the study period (the Simulated Use and Recirculating Pump tanks) yielded the poorest water quality, as they both produced significantly higher NO2 + NO3 and TSS concentrations than the Control tank. Despite higher overall DO concentrations, these tanks still exhibited noxious odors and discoloration of the stored water which, in the case of the Recirculating Pump tank, lasted throughout the summer months.
In this study the most effective treatment for minimizing aesthetic issues while preserving water quality benefits was the first flush diverter. The First Flush Diverter tank did not produce DO concentrations that were significantly different from the control; however, it yielded significantly lower TN, TKN, NO2 + NO3 and TSS concentrations than those found in roof runoff. While the First Flush Diverter tank still experienced aesthetic issues, they occurred only during the peak of pollen season and receded shortly thereafter. This mechanism prevented some pollen from initially entering the system and minimized disturbance to the water column, allowing the particulate matter to settle to the bottom of the tank. This reduction in incoming organic matter (compared to all other tanks, including the Control) coupled with the lack of water column disturbance and corresponding addition of oxygen (as with the Recirculating Pump and Simulated Use tanks) resulted in the best outcome with respect to water quality and aesthetics.
The benefits of a first flush diverter evidenced herein corroborate with findings from previous studies. Numerous studies have found that bypassing the first flush improved the concentrations of TSS, some nitrogen species, heavy metals, and microbes within a storage tank [1,38,39,40]. Thus, first flush diverters are recommended to preserve water quality and prevent odor and color issues within the tank [3,41,42,43]. While the benefits of first flush diversion are apparent, it is important to note that their benefits depend solely on their ability to function as designed, which requires routine maintenance to ensure the full first flush volume can be captured and diverted.
In addition to a first flush diverter, this study indicates that employing a calming inlet design that minimizes the resuspension of settled particulate matter within the storage tank would likely improve the quality of extracted water. Abbasi and Abbasi (2011) described a design in which the inlet pipe extends to the bottom of the tank and a break ring surrounding the inlet opening directs flow in a horizontal direction, leaving settled material undisturbed [44]. Other studies depict a “J”-shaped inlet pipe that extends to the bottom of the tank and then directs incoming water back up towards the water surface [45,46]. Both of these designs accomplish the same goal by preventing the disturbance of debris that has settled on the tank bottom. Positioning the inlet in the center of the tank, as opposed to along the sides may also prevent the disturbance of settled material [47,48].
It should be noted that the Simulated Use tank was not fitted with a calming inlet, which could have prevented the disturbance of the water column during rainfall events and perhaps resulted in lower nitrogen and TSS concentrations. It is possible that this tank would have produced similar water quality results as the First Flush Diverter tank if a calming inlet been installed; however, the cost and complexity of the automated drain valve far exceed that of the first flush diverter, ultimately making the first flush diverter treatment more appealing.
Numerous studies of RWH systems in humid regions have noted an overall lack of use compared to systems installed in (semi-)arid regions [25,27,49]; thus, there is great potential for these systems to develop color and odor issues as a result of anaerobic conditions. These offensive water characteristics further discourage use of the system, thereby facilitating a perpetual cycle of neglect and declining water quality. To facilitate use and public acceptance, harvested rainwater should be of a quality conducive to its designated use and a RWH system should function in a manner that meets its initial objectives (e.g., stormwater mitigation). While many studies have evaluated the water quality benefits of a first flush diverter, this novel study assessed the effectiveness of this element as a means of mitigating the aesthetic issues associated with anaerobic conditions in a RWH storage tank. It was found that inclusion of a first flush diverter in the design of a RWH system can minimize the period of time in the summer during which stored water exhibits less-than-ideal aesthetic qualities due to anaerobic conditions while simultaneously preserving water quality within the storage tank, contributing to reductions in numerous pollutants to meet stormwater mitigation objectives/requirements, and allowing the system to serve as an alternative water source.
4. Conclusions
These designs tested herein did not prevent anaerobic conditions from forming, despite the purposeful introduction of dissolved oxygen. Aesthetic problems persisted within rainwater storage tanks and, in fact, water quality worsened in the two tanks which fostered oxygen introduction. The process of introducing oxygen involves mixing and disturbance throughout the water column, which can re-suspend particulate matter that has settled to the bottom of the tank. The preferred approach herein was preventing the introduction of pollen and particulate matter to the storage tank via a first flush diverter and minimizing disturbance of settled material in the tank via a calming inlet. This approach effectively addressed the aesthetic problems (odor and visual appearance) associated with anaerobic conditions. While odors and water discoloration may still occur during peak pollen season, these issues dissipated shortly thereafter. Moreover, based upon the findings in this study, this combined approach likely yields lower TSS and nutrient concentrations than the other treatments presented.
Author Contributions
Conceptualization, K.D.G.; data curation, B.T.C. and M.D.W.; formal analysis, K.D.G. and D.S.; methodology, M.D.W.; project administration, K.D.G.; resources, W.F.H.; supervision, K.D.G.; writing—original draft, K.D.G. and D.S.; writing—review and editing, K.D.G., M.D.W. and W.F.H. All authors have read and agreed to the published version of the manuscript.
Funding
This research received no external funding.
Data Availability Statement
All data collected as part of this project are available from the corresponding author by request.
Acknowledgments
The authors would like to thank Kevin Boyer and the City of Raleigh, North Carolina, for supporting this project and allowing us to use the rainwater harvesting systems for this study.
Conflicts of Interest
The authors declare no conflict of interest.
References
- Kus, B.; Kandasamy, J.; Vigneswaran, S.; Shon, H.K. Analysis of first flush to improve the water quality in rainwater tanks. Water Sci. Technol. 2010, 61, 421–428. [Google Scholar] [CrossRef]
- Gikas, G.D.; Tsihrintzis, V.A. Effect of first-flush device, roofing material, and antecedent dry days on water quality of harvested rainwater. Environ. Sci. Pollut. Res. 2017, 24, 21997–22006. [Google Scholar] [CrossRef] [PubMed]
- Campisano, A.; Butler, D.; Ward, S.; Burns, M.J.; Friedler, E.; DeBusk, K.; Fisher-Jeffes, L.N.; Ghisi, E.; Rahman, A.; Furumai, H.; et al. Urban rainwater harvesting systems: Research, implementation and future perspectives. Water Res. 2017, 115, 195–209. [Google Scholar] [CrossRef] [PubMed]
- Phoca, I.; Valavanis, P. Rediscovering Ancient Greece Architecture and City Planning; Kedros Books: Athens, Greece, 1999; 126p. [Google Scholar]
- Crasta, F.M.; Fasso, C.A.; Patta, F.; Putzu, G. Carthaginian–roman cisterns in Sardinia. In Proceedings of the International Conference on Rainwater Cistern Systems; University of Hawaii: Honolulu, HI, USA, 1982; pp. 37–45. [Google Scholar]
- Radhakrishna, B.P. Rainwater harvesting, a time-honoured practice: Need for revival. Curr. Sci. 2003, 85, 1259–1261. [Google Scholar]
- Abdulla, F.A.; Al-Shareef, A.W. Roof rainwater harvesting systems for household water supply in Jordan. Desalination 2009, 243, 195–207. [Google Scholar] [CrossRef]
- Gianighian, G. Venice and fresh water: Reintroduction of the use of ancient systems through rehabilitation of traditional cisterns” in parancola. In L’Acqua Salvata: Utilizzo Integrato in una Prospettiva di Biofitodepurazione; IUAV-DAEST: Venice, Italy, 1996; p. 57. [Google Scholar]
- Lee, K.T.; Lee, C.D.; Yang, M.S.; Yu, C.C. SW—Soil and water: Probabilistic design of storage capacity for rainwater cistern systems. J. Agric. Eng. Res. 2000, 77, 343–348. [Google Scholar] [CrossRef]
- Field, C.B.; Barros, V.R.; Dokken, D.J.; Mach, K.J.; Mastrandrea, M.D.; Bilir, T.E.; Chatterjee, M.; Ebi, K.L.; Estrada, Y.O.; Genova, R.C.; et al. Impacts, Adaptation, and Vulnerability. Part A: Global and Sectoral Aspects; Contribution of Working Group II to the Fifth Assessment Report of the Intergovernmental Panel on Climate Change; Cambridge University Press: Cambridge, UK; New York, NY, USA, 2014; p. 1132. [Google Scholar]
- Coombes, P.J.; Barry, M.E. The effect of selection of time steps and average assumptions on the continuous simulation of rainwater harvesting strategies. Water Sci. Technol. 2007, 55, 125–133. [Google Scholar] [CrossRef]
- Herrmann, T.; Hasse, K. Ways to get water: Rainwater utilization or long-distance water supply? A holistic assessment. Water Sci. Technol. 1997, 36, 313–318. [Google Scholar] [CrossRef]
- Zhang, D.; Gersberg, R.M.; Wilhelm, C.; Voigt, M. Decentralized water management: Rainwater harvesting and greywater reuse in an urban area of Beijing, China. Urban Water J. 2009, 6, 375–385. [Google Scholar] [CrossRef]
- Mendez, C.B.; Klenzendorf, J.B.; Afshar, B.R.; Simmons, M.T.; Barrett, M.E.; Kinney, K.A.; Kirisits, M.J. The effect of roofing material on the quality of harvested rainwater. Water Res. 2011, 45, 2049–2059. [Google Scholar] [CrossRef] [PubMed]
- ABS. Water Account, Australia, 2014–2015. 2016. Available online: https://www.abs.gov.au/AUSSTATS/[email protected]/DetailsPage/4610.02014-15?OpenDocument (accessed on 28 July 2021).
- Gould, J.; Qiang, Z.; Yuanhong, L. Using every last drop: Rainwater harvesting and utilization in Gansu Province, China. Waterlines 2014, 33, 107–119. [Google Scholar] [CrossRef]
- Gee, K.D.; Sojka, S. Maximizing the benefits of rainwater harvesting systems: Review and analysis of selected case study examples. In Resilient Water Management Strategies in Urban Settings: Innovations in Decentralized Water Infrastructure Systems: Global Case Studies, Prospects, and Challenges; Younos, T., Lee, J., Parece, T.E., Eds.; Springer Water: New York, NY, USA, 2021; In press. [Google Scholar]
- United Nations. World Population Prospects: The 2012 Revision: Highlights and Advance Tables; Department of Economic and Social Affairs, Population Division, United Nations: New York, NY, USA, 2013. [Google Scholar]
- Musayev, S.; Burgess, E.; Mellor, J. A global performance assessment of rainwater harvesting under climate change. Resour. Conserv. Recycl. 2018, 132, 62–70. [Google Scholar] [CrossRef]
- Kahinda, J.M.; Taigbenu, A.E.; Boroto, R.J. Domestic rainwater harvesting as an adaptation measure to climate change in South Africa. Phys. Chem. Earth 2010, 35, 742–751. [Google Scholar] [CrossRef]
- Vargas-Parra, M.V.; Rovira-Val, M.R.; Gabarrell, X.; Villalba, G. Rainwater harvesting systems reduce detergent use. Int. J. Life Cycle Assess. 2019, 24, 809. [Google Scholar] [CrossRef]
- Zhang, F.; Polyakov, M.; Fogarty, J.; Pannell, D.J. The capitalized value of rainwater tanks in the property market of Perth, Australia. J. Hydrol. 2015, 522, 317–325. [Google Scholar] [CrossRef]
- Jamali, B.; Bach, P.M.; Deletic, A. Rainwater harvesting for urban flood management—An integrated modelling framework. Water Res. 2020, 171, 115372. [Google Scholar] [CrossRef]
- Braga, A.; O’Grady, H.; Dabak, T.; Lane, C. Performance of Two Advanced Rainwater Harvesting Systems in Washington DC. Water 2018, 10, 667. [Google Scholar] [CrossRef] [Green Version]
- Gee, K.D.; Hunt, W.F. Enhancing Stormwater Management Benefits of Rainwater Harvesting via Innovative Technologies. J. Environ. Eng. 2016, 142, 04016039. [Google Scholar] [CrossRef]
- Teston, A.; Teixeira, C.A.; Ghisi, E.; Cardoso, E.B. Impact of Rainwater Harvesting on the Drainage System: Case Study of a Condominium of Houses in Curitiba, Southern Brazil. Water 2018, 10, 1100. [Google Scholar] [CrossRef] [Green Version]
- DeBusk, K.M.; Hunt, W.F.; Wright, J.D. Characterization of Rainwater Harvesting Performance in Humid Regions of the United States. JAWRA J. Am. Water Resour. Assoc. 2013, 49, 1398–1411. [Google Scholar] [CrossRef]
- DeBusk, K.M.; Hunt, W.F. Impact of rainwater harvesting systems on nutrient and sediment concentrations in roof runoff. Water Sci. Technol. Water Supply 2014, 14, 220–229. [Google Scholar] [CrossRef]
- Wilson, C.E.; Hunt, W.F.; Winston, R.J.; Smith, P. Assessment of a rainwater harvesting system for pollutant mitigation at a commercial location in Raleigh, NC, USA. Water Sci. Technol. Water Supply 2014, 14, 283–290. [Google Scholar] [CrossRef]
- Khastagir, A.; Jayasuriya, L.N.N. Impacts of using rainwater tanks on stormwater harvesting and runoff quality. Water Sci. Technol. 2010, 62, 324–329. [Google Scholar] [CrossRef]
- Ward, S.; Memon, F.A.; Butler, D. Harvested rainwater quality: The importance of appropriate design. Water Sci. Technol. 2010, 61, 1707–1714. [Google Scholar] [CrossRef]
- North Carolina Department of Transportation (NCDOT). Traffic Volume Maps. 2009. Available online: http://ncdot.gov/travel/statemapping/trafficvolumemaps/ (accessed on 14 January 2012).
- Howley, S.T.; Hohman, S.P.; Reisinger, A.J. Stormwater Pond Management: What You Need to Know about Aeration; University of Florida IFAS Extension: Gainesville, FL, USA, 2021. [Google Scholar]
- North Carolina Department of Environmental Quality Division of Air Quality, North Carolina Department of Environmental Quality (NCDEQ). Pollen Monitoring. 2015. Available online: http://deq.nc.gov/about/divisions/air-quality/air-quality-data/nata-epa-national-air-toxics-assessment-for-north-carolina/pollen-monitoring (accessed on 15 October 2016).
- APHA; AWWA; WPCF. Standard Methods for the Examination of Water and Wastewater, 22nd ed.; American Public Health Association: Washington, DC, USA, 2012. [Google Scholar]
- Downing, A.L.; Truesdale, G.A. Some factors affecting the rate of solution of oxygen in water. J. Appl. Chem. 1955, 5, 570–581. [Google Scholar] [CrossRef]
- Parnas, H. Model for decomposition of organic material by microorganisms. Soil Biol. Biochem. 1975, 7, 161–169. [Google Scholar] [CrossRef]
- Sanjeeva, A.; Puttaswamaiah, S.G. Influence of Atmospheric Deposition and Roof Materials on Harvested Rainwater Quality. J. Environ. Eng.-ASCE 2018, 144, 04018121. [Google Scholar] [CrossRef]
- Mao, J.; Xia, B.; Zhou, Y.; Bi, F.; Zhang, X.; Zhang, W.; Xia, S. Effect of roof materials and weather patterns on the quality of harvested rainwater in Shanghai, China. J. Clean Prod. 2021, 279, 123419. [Google Scholar] [CrossRef]
- John, C.K.; Pu, J.H.; Moruzzi, R.; Pandey, M.; Azamathulla, H.M. Reusable rainwater quality at the Ikorodu area of Lagos, Nigeria: Impact of first-flush and household treatment techniques. J. Wate Sanit. Hyg. Dev. 2021, 11, 732–745. [Google Scholar] [CrossRef]
- Lee, J.Y.; Yang, J.-S.; Han, M.; Choi, J. Comparison of the microbiological and chemical characterization of harvested rainwater and reservoir water as alternative water resources. Sci. Total Environ. 2010, 408, 896–905. [Google Scholar] [CrossRef]
- Meera, V.; Ahammed, M.M. Water quality of rooftop rainwater harvesting systems: A review. J. Water Supply Res. Technol. 2006, 55, 257–268. [Google Scholar] [CrossRef]
- Sazakli, E.; Alexopoulos, A.; Leotsinidis, M. Rainwater harvesting, quality assessment and utilization in Kefalonia Island, Greece. Water Res. 2007, 41, 2039–2047. [Google Scholar] [CrossRef]
- Abbasi, T.; Abbasi, S.A. Sources of pollution in rooftop rainwater harvesting systems and their control. Crit. Rev. Environ. Sci. Technol. 2011, 41, 2097–2167. [Google Scholar] [CrossRef]
- Dissanayake, J.; Han, M. Effect of Inlet/Outlet Configuration on Water Quality in a Rainwater Harvesting Tank. Water 2020, 12, 1970. [Google Scholar] [CrossRef]
- Won, Y.; Han, M.; Park, H.; Kim, M. Optimal rainwater tank design for control of particulate contaminants. Water Supply 2019, 19, 574–579. [Google Scholar] [CrossRef]
- Herrmann, T.; Schmida, U. Rainwater utilisation in Germany: Efficiency, dimensioning, hydraulic and environmental aspects. Urban Water J. 2000, 1, 307–316. [Google Scholar] [CrossRef]
- Magyar, M.I.; Mitchell, V.G.; Ladson, A.R.; Diaper, C. An investigation of rainwater tanks quality and sediment dynamics. Water Sci. Technol. 2007, 56, 21–28. [Google Scholar] [CrossRef]
- Jones, M.P.; Hunt, W.F. Performance of rainwater harvesting systems in the southeastern United States. Resour. Conserv. Recycl. 2010, 54, 623–629. [Google Scholar] [CrossRef]
Figure 1.
An aerial view of the RWH system layout at Fire Station #8, including the rainwater storage tanks, pressure transducer locations, and sampler port locations (top) and photos of the three treatment mechanisms implemented at each storage tank (bottom). Tank 4 served as the control and did not employ a treatment mechanism.

Figure 2.
Daily total pollen count for Raleigh, NC and the relative contribution of weeds, grasses, and trees to the total pollen count during the peak pollen period (inset).
Figure 2.
Daily total pollen count for Raleigh, NC and the relative contribution of weeds, grasses, and trees to the total pollen count during the peak pollen period (inset).

Figure 3.
Average dissolved oxygen (DO) concentrations for each rainwater harvesting tank. Black dots represent outliers (defined as values greater than or less than 1.5 * inner quartile range).
Figure 3.
Average dissolved oxygen (DO) concentrations for each rainwater harvesting tank. Black dots represent outliers (defined as values greater than or less than 1.5 * inner quartile range).

Figure 4.
Average DO concentrations within each tank as compared to rainfall observed at the study site.
Figure 4.
Average DO concentrations within each tank as compared to rainfall observed at the study site.

Figure 5.
Total nitrogen, total Kjeldahl nitrogen, total ammoniacal nitrogen, and nitrate + nitrite nitrogen concentrations for roof runoff and rainwater tank samples. Black dots represent outliers (defined as values greater than or less than 1.5 * inner quartile range).
Figure 5.
Total nitrogen, total Kjeldahl nitrogen, total ammoniacal nitrogen, and nitrate + nitrite nitrogen concentrations for roof runoff and rainwater tank samples. Black dots represent outliers (defined as values greater than or less than 1.5 * inner quartile range).

Figure 6.
Total Kjeldahl nitrogen, nitrate + nitrite, total ammoniacal nitrogen, total nitrogen, and total suspended solids concentrations measured in roof runoff and rainwater tank samples during the study period.
Figure 6.
Total Kjeldahl nitrogen, nitrate + nitrite, total ammoniacal nitrogen, total nitrogen, and total suspended solids concentrations measured in roof runoff and rainwater tank samples during the study period.

Figure 7.
TSS concentrations for roof runoff and rainwater tank samples (note the y-axis break at 35 mg/L). Black dots represent outliers (defined as values greater than or less than 1.5 * inner quartile range).
Figure 7.
TSS concentrations for roof runoff and rainwater tank samples (note the y-axis break at 35 mg/L). Black dots represent outliers (defined as values greater than or less than 1.5 * inner quartile range).


Table 1.
Sample analysis results (minimum, maximum, and median) for roof runoff and rainwater storage tanks.
Table 1.
Sample analysis results (minimum, maximum, and median) for roof runoff and rainwater storage tanks.
| TN (mg/L) | TKN (mg/L) | NO2 + NO3 (mg/L) | TAN (mg/L) | TSS (mg/L) | ||
|---|---|---|---|---|---|---|
| ROOF (n = 19) | Minimum | 0.42 | 0.27 | 0.02 | 0.02 | 1.95 |
| Maximum | 8.22 | 5.88 | 2.34 | 2.14 | 21.7 | |
| Median | 1.67 | 1.16 | 0.36 | 0.25 | 5.18 | |
| SIMULATED USE TANK (n = 19) | Minimum | 0.27 | 0.24 | 0.03 | 0.10 | 0.95 |
| Maximum | 3.16 | 2.69 | 0.47 | 1.64 | 9.86 | |
| Median | 1.04 | 0.71 | 0.15 | 0.67 | 3.19 | |
| RECIRCULATING PUMP TANK (n = 19) | Minimum | 0.79 | 0.49 | 0.01 | 0.04 | 0.61 |
| Maximum | 6.78 | 6.48 | 0.62 | 1.95 | 274 | |
| Median | 1.26 | 1.10 | 0.18 | 0.38 | 21.2 | |
| FIRST FLUSH DIVERTER TANK (n = 19) | Minimum | 0.46 | 0.24 | 0.01 | 0.05 | 0.4 |
| Maximum | 1.44 | 1.43 | 0.65 | 1.43 | 7.96 | |
| Median | 0.79 | 0.54 | 0.04 | 0.32 | 1.01 | |
| CONTROL TANK (n = 19) | Minimum | 0.47 | 0.25 | 0.00 | 0.07 | 0.46 |
| Maximum | 1.39 | 1.36 | 0.79 | 0.97 | 4.37 | |
| Median | 0.90 | 0.84 | 0.01 | 0.59 | 1.01 | |
Publisher’s Note: MDPI stays neutral with regard to jurisdictional claims in published maps and institutional affiliations. |
© 2021 by the authors. Licensee MDPI, Basel, Switzerland. This article is an open access article distributed under the terms and conditions of the Creative Commons Attribution (CC BY) license (https://creativecommons.org/licenses/by/4.0/).
Share and Cite
MDPI and ACS Style
Gee, K.D.; Schimoler, D.; Charron, B.T.; Woodward, M.D.; Hunt, W.F. A Comparison of Methods to Address Anaerobic Conditions in Rainwater Harvesting Systems. Water 2021, 13, 3419. https://0-doi-org.brum.beds.ac.uk/10.3390/w13233419
AMA Style
Gee KD, Schimoler D, Charron BT, Woodward MD, Hunt WF. A Comparison of Methods to Address Anaerobic Conditions in Rainwater Harvesting Systems. Water. 2021; 13(23):3419. https://0-doi-org.brum.beds.ac.uk/10.3390/w13233419
Chicago/Turabian StyleGee, Kathy DeBusk, Daniel Schimoler, Bree T. Charron, Mitch D. Woodward, and William F. Hunt. 2021. "A Comparison of Methods to Address Anaerobic Conditions in Rainwater Harvesting Systems" Water 13, no. 23: 3419. https://0-doi-org.brum.beds.ac.uk/10.3390/w13233419
Note that from the first issue of 2016, this journal uses article numbers instead of page numbers. See further details here.