Article

The Effect of the Effluent from a Small-Scale Conventional Wastewater Treatment Plant Treating Municipal Wastewater on the Composition and Abundance of the Microbial Community, Antibiotic Resistome, and Pathogens in the Sediment and Water of a Receiving Stream

1
Institute of Ecology and Earth Sciences, University of Tartu, 51003 Tartu, Estonia
2
Institute of Molecular and Cell Biology, University of Tartu, 51010 Tartu, Estonia
*
Author to whom correspondence should be addressed.
Submission received: 2 February 2021 / Revised: 19 March 2021 / Accepted: 19 March 2021 / Published: 23 March 2021

Abstract

:
The effluents of wastewater treatment plants (WWTPs) are major contributors of nutrients, microbes—including those carrying antibiotic resistance genes (ARGs)—and pathogens to receiving waterbodies. The effect of the effluent of a small-scale activated sludge WWTP treating municipal wastewater on the composition and abundance of the microbial community as well as the antibiotic resistome and pathogens in the sediment and water of the receiving stream and river was studied using metagenome sequencing and a quantitative approach. Elevated Bacteroidetes proportions in the prokaryotic community, heightened sulfonamide and aminoglycoside resistance determinants proportions, and an increase of up to three orders of magnitude of sul1–sul2–aadA–blaOXA2 gene cluster abundances were recorded in stream water and sediments 0.3 km downstream of a WWTP discharge point. Further downstream, a gradual recovery of affected microbial communities along a distance gradient from WWTP was recorded, culminating in the mostly comparable state of river water and sediment parameters 3.7 km downstream of WWTP and stream water and sediments upstream of the WWTP discharge point. Archaea, especially Methanosarcina, Methanothrix, and Methanoregula, formed a substantial proportion of the microbial community of WWTP effluent as well as receiving stream water and sediment, and were linked to the spread of ARGs. Opportunistic environmental-origin pathogens were predominant in WWTP effluent and receiving stream bacterial communities, with Citrobacter freundii proportion being especially elevated in the close vicinity downstream of the WWTP discharge point.

1. Introduction

Bacterial infections have once again become a threat in modern medicine [1], owing to the rise of resistance to all currently developed antibiotics [2]. Every year, over 33,000 people in the European Union (EU) and 700,000 globally die due to infections caused by antibiotic-resistant bacteria (ARB) [3,4]. Increasing antibiotic resistance is a problem not restricted to hospital environments. Via waste streams, the diverse inherent antibiotic resistome in natural environments [5] becomes combined with the resistance caused by high consumption of antibiotics in outpatient healthcare as well as in agriculture [6]. This might cause further resistance recombinations among both harmless and pathogenic bacteria in human-impacted natural environments that could be transferred back to hospital environments [7].
Conventional wastewater treatment plants (WWTPs) have been recognized as collectors of ARB and antibiotic resistance genes (ARGs), as well as horizontal gene transfer and resistance determinants dissemination stations [8,9]. WWTPs vary in their size and treatment capacity, from small WWTPs treating up to 2000 population equivalent (PE) to large WWTPs treating 10,000 to over 100,000 PE of wastewater [10]. Most research so far has focused on large WWTPs, but it has, alarmingly, been suggested recently that the highest abundances of ARGs are found in effluents of small (discharge ≤ 300 m3/day) WWTPs [10], which are the most numerous WWTP type, accounting in some regions for over 85% of the treatment facilities [11]. Treated wastewater is most often discharged to streams and rivers, where increased abundances of ARB and ARGs in downstream water, streambed biofilms, and sediments in the close vicinity of WWTP outflow have been recorded [10,12,13,14]. Another important aspect is that the WWTP effluents shape the chemical and biological composition of the receiving waterbody by providing additional nutrients, settleable and suspended organic matter, and allochthonous microbes, including pathogens [15]. This effect is especially pronounced in small streams and rivers, where the nutrient-rich effluent is less diluted compared to bigger waterbodies [13].
The knowledge of the magnitude and distance range of the effect of WWTP effluents on the intricate intertwined system of receiving waterbodies from the perspective of antibiotic resistance is still insufficient. It has been shown that the WWTP effluent affects the diversity and structure of the downstream planktonic community of the receiving waterbody [16]; however, at least partial recovery of stream water bacterial community structure with increasing distance from the WWTP discharge has been reported [15]. It has also been suggested that a lot of ARGs carrying bacteria and pathogens reside in the particulate fraction of WWTP effluent that settles into the riverbed sediment and becomes an inherent antibiotic resistance reservoir [14]. Consequently, the fate and spread of ARGs in receiving waterbodies can depend on their hosts’ lifestyle and can be very different in water and sediment phases. Still, the information about the effect of WWTP effluents on the antibiotic resistome quantity and structure, and its relationships with chemical conditions, bacterial and archaeal community abundance, and structure, as well as pathogen prevalence in the receiving waterbodies, is still insufficient.
The objective of this study was to assess the impact of the effluent of a small-scale WWTP treating municipal wastewater on the abundance and composition of the bacterial and archaeal community, antibiotic resistome, and pathogens in the water and sediments of the receiving stream and river downstream from the effluent discharge point along a 3.7 km distance gradient.

2. Materials and Methods

2.1. Site Descriptions and Sampling Method

The effect of effluent originating from a small-scale activated sludge WWTP treating municipal wastewater from Nõo borough, Estonia, was under investigation in this study. Nõo borough is the center of a parish with a permanent population of about 1500 people, a primary school, and a high school. The WWTP was established in 2002 and treats domestic municipal wastewater combined with the effluents of small-scale dairy and meat industries with a maximum capacity of 2100–2300 population equivalent and mean effluent discharge rate of 290 m3/day. The WWTP has no disinfection step for its purified wastewater effluent, which is discharged to the middle section of Nõo stream, a 9 km long waterbody (flow rate: 0.017–0.2 m3/s, flow speed: 0.2–0.5 m/s, average depth: 0.3 m), which flows into the Elva River (average flow rate: 2.2 m3/s) approximately 3.4 km downstream of the WWTP (Figure S1).
The main sampling of WWTP effluent, sediments, and water from the stream and river was conducted in September 2013. In total, six stream and river water samples (marked as SW and RW, respectively) and six sediment samples (marked as SS and RS, respectively) were collected along the 3.7 km long distance gradient of the Nõo stream and Elva River. The weather during sampling was partly cloudy, and there was no precipitation during the sampling nor preceding day; constant flow rates of stream and river as well as invariable intensity of WWTP were assumed during the sampling campaign. The WWTP effluent samples (E) were collected four times: at the main sampling event and three more times over an 11 month period (December 2012, June 2013, and November 2013). In addition, three samples from the influent of WWTP (WWTP IN) were collected at the same time with the additional effluent sampling.
The stream water and stream sediment samples were taken from upstream (~20 m distance) of the WWTP discharge point (marked as SWU and SSU, respectively), and downstream at 0.3 km, 2.7 km, and 3.2 km (SW0.3 and SS0.3, SW2.7 and SS2.7, SW3.2 and SS3.2, respectively) of the WWTP discharge point. The two river water (RW) and two river sediment (RS) samples were taken from the Elva River, upstream (~10 m) of the Nõo stream inflow (RWU and RSU) and downstream of the Nõo stream inflow, 3.7 km from the WWTP (RW3.7 and RS3.7) (Figure S1). The water samples were collected as grab samples into sterile glass bottles (1L). The stream and river sediment samples (200 g) were taken from the top 5 cm layer with a sterile shovel and placed into plastic boxes.
The collected samples were stored in cool conditions during transport. In the lab, the samples were immediately divided into subparts for DNA extraction and chemical analysis. On the sampling day, 50 mL of each effluent and water sample was centrifuged (15 min at 4000 rpm) and the supernatant was removed. The centrifuged biomass of effluent and water samples, as well as the subsamples of sediments (~30 g), were stored at −20 °C until DNA extraction. Subsamples for chemical analyses were held at +4 °C until further analysis.

2.2. Chemical Analyses

The temperature, pH, dissolved O2 concentration, and redox potential (ORP) of the influent, effluent, and water samples were measured in situ, and concentrations of NH4–N and NO3–N were measured immediately after the arrival to the lab with the YSI Professional Plus Handheld Multiparameter Water Quality Meter (YSI Inc., Yellow Springs, OH, USA). The total nitrogen (Ntot), total organic carbon (TOC), and dissolved organic carbon (DOC) content in the effluent and water samples were measured using Vario TOC equipped with TNb detector (Elementar GmbH, Langenselbold, Germany). The concentrations of total phosphorous (Ptot), PO43−–P, and SO42− in the water samples and pH, dry weight, Ntot, Ptot, and TOC % of the sediment samples were determined by the Tartu laboratory of the Estonian Environmental Research Centre using standard methods.

2.3. DNA Extraction

DNA was extracted from the sediment and the biomass of centrifuged effluent and water samples using a PowerSoil DNA Isolation kit (MoBio Laboratories Inc., Carlsbad, CA, USA). The manufacturer’s protocol was modified by replacing 10 min of vortex treatment with the homogenization of the samples using Precellys® 24 (Bertin Technologies, Montigny-le-Bretonneux, France) at 5000 rpm for 20 s. The quality and quantity of the DNA extracts were assessed by spectrophotometry (Infinite M200, Tecan AG, Grödig, Austria). The extracted DNA was stored at −20 °C until further analysis.

2.4. Quantitative PCR Conditions and Analysis

Quantitative PCR (qPCR) was used to measure the gene copy numbers in the studied sediment (n = 6) as well as water, influent, and effluent samples (n = 13). Bacterial and archaeal community abundances (B16S and A16S, respectively) were evaluated by quantifying specific 16S rRNA genes; the total prokaryotic community abundance (16Stot) was estimated by summing B16S and A16S abundances. Fourteen ARGs, representing major antibiotic resistance types and mechanisms, were quantified using gene-specific primer sets (Table S1): aminoglycoside-resistance-encoding aadA (inactivation), β-lactamase-resistance-encoding blaCTX-M, blaTEM1 and blaOXA2 (inactivation), chloramphenicol-resistance-encoding catQ (inactivation), fluoroquinolone-resistance-encoding qnrS (target protection), sulfonamide-resistance-encoding sul1 and sul2 (target replacement), tetracycline-resistance-encoding tetA and tetB (major facilitator superfamily (MFS)-type efflux) as well as tetQ and tetW (target protection), and multi-resistance-encoding acrB and mexF (resistance–nodulation–division (RND)-type efflux). Primers for mexF amplification were designed manually based on the sequences obtained from the metagenomic data of the Nõo wastewater treatment study (Table S1).
The qPCR assays were performed on the real-time PCR system Rotor-Gene® Q (Qiagen, Foster City, CA, USA). Stock solutions of target sequence containing plasmids (Eurofins MWG Operon, Ebersberg, Germany) were used to create a serially diluted standard curve, ranging from 6 to 108 copies for each target gene. The reaction mixture contained 5 μL of Maxima SYBR Green qPCR Master Mix (Thermo Fisher Scientific Inc., Waltham, MA, USA), an optimized concentration of forward and reverse primers (Table S1), 1 μL of template DNA, and sterile distilled water for a total volume of 10 μL. The gene-specific primer sets, optimized primers concentrations, qPCR programs, and amplification efficiencies are described in Table S1. Immediately after the qPCR assay, a melting curve analysis was performed by increasing the temperature from 70 °C to 90 °C (0.35 °C/3 s) with continuous fluorescence recording. All samples were run in triplicate, and negative controls were included in every qPCR run. The specificity of each target gene amplification was examined using D1000 ScreenTape kit and 2200 TapeStation system (Agilent Technologies, Inc., Santa Clara, CA, USA). Amplification inhibition was assessed by comparing amplifications of dilution series from the targeted samples. No inhibition was detected for stream water and sediment samples, while ten-fold dilutions of wastewater samples were used for amplification to negate inhibition.
For qPCR data analyses, RotorGene Series Software, v.2.3.5 (Qiagen) and the LinRegPCR program, v.2020.1 [17] were used. The latter was used to evaluate the amplification efficiencies of each sample and standard point, and these efficiencies were taken into account in the further calculations. Calculation of target gene copy numbers was performed through the estimation of fold difference between a sample and multiple data points from the standard curve, as described by Nõlvak et al. [18], and presented as gene copy numbers per milliliter (copies/mL) for effluent and water samples and gene copy numbers per gram of dry sediment weight (copies/g dw) for sediment samples. All the targeted ARGs were normalized against 16Stot (B16S + A16S) to represent the relative abundances of ARGs in the prokaryotic community. Additionally, the relative abundance of archaea (arc%) in the prokaryotic community was calculated.

2.5. Metagenome Sequencing and Analysis

DNA libraries were prepared from all collected sediment samples and three water samples (E collected during the main sampling event, SWU and SW0.3). The DNA concentration of the other water samples was too low for metagenomic sequencing. DNA samples were purified with Genomic DNA Clean and Concentrator kit (Zymo Research, Irvine, CA, USA) using the modified manufacturer’s protocol, where the elution buffer provided by the kit was replaced with 10 mM Tris-Cl (pH 8.5, Qiagen). Paired-end sequencing libraries (2 × 150 bp) were constructed using the TruSeq DNA PCR-Free Library Preparation kit (Illumina, San Diego, CA, USA) and sequenced using the NextSeq 500 system (Illumina).
The quality of raw metagenomic reads was evaluated using FastQC program v.0.11.7 [19]. Poly-G tails and reads shorter than 35 bp were removed, and bases with quality score lower than 20 were trimmed with Cutadapt v.1.16 [20]. Coverage and diversity metrics of the quality-controlled metagenomic sequences were estimated using Nonpareil v.3.3.3 [21]. The composition of the bacterial and archaeal community was classified down to species level using Kaiju v.1.7.3 [22]. Megahit v.1.1.2 [23] was used to assemble quality checked reads into contigs (minimum length of 300 bp). Characteristics of the metagenomic data of water and sediment samples are presented in Table S2.
For antibiotic resistome profiling, the metagenomes were analyzed with the ARGs-OAP v.2.2 [24]; the proportion of resistome in the bacterial community was presented per number of 16S rRNA reads. Classification of ARGs to resistance mechanism types was based on the annotations of the respective genes in the CARD database (v.3.0.8). The pathogens’ profiling (classified to species level) was based on the list of 90 important pathogens in the CARD database v.3.0.8.
The metagenomic sequence reads are accessible in online repositories. The names of the repository/repositories and accession number(s) can be found below: https://ebi.ac.uk/ena, PRJEB42480.

2.6. Statistical Analysis

Pearson correlation coefficient was calculated to relate the target gene abundances (log-transformed) and relative abundances in stream and river water and sediment to the physicochemical parameters of the studied materials using R v.4.0.3 package psych [25]. Pearson was also used to find correlations between target gene relative abundances in stream and river water and sediment. In parallel, partial correlation coefficients, calculated in MedCalc® v.19, were used to relate the target ARGs abundances (log-transformed) and relative abundances in water and sediment to the physicochemical parameters of the studied materials using 16Stot as covariable in case of ARG abundances and B16S relative abundance in prokaryotic community as covariable for ARGs relative abundances partial correlations. Additionally, partial correlation coefficients, using B16S and A16S abundances as covariables, were utilized to find correlations between ARG abundances. In case of partial correlation analysis between A16S and ARG abundances, B16S abundance was used as a covariable.
The proportions of major bacterial and archaeal genera (>1% and >3% in at least one sample, respectively) in respective communities, as well as the proportions of top 25 pathogens in bacterial communities of the analyzed samples were visualized as heat maps (Ward-linkage method and Euclidean distance) using R v.4.0.3 package pheatmap [26]. The proportions of pathogens in bacterial communities of stream and river water and sediment samples were subjected to principal component analysis (PCA) in R v.4.0.3 package factoextra [27].
Multiple co-inertia analysis (MCIA) was applied to integrate data from six sediment-specific datasets (microbial genera and pathogen proportions in prokaryotic community, antibiotic resistance type and ARG subtype proportions, ARG abundances, and sediment physicochemical parameters) using the R v.4.0.3 package omicade4 [28].

3. Results

3.1. Chemical Properties of WWTP Effluent, and Water and Sediment of the Stream and River

The repeated measurements of the physicochemical characteristics in WWTP IN and E showed that the quality of both the raw wastewater and E varied during the monitored period (Table S3). The chemical properties of E at the sampling time are shown in Table 1. E had a considerably higher temperature and concentrations of TOC, DOC, SO42−, Ntot, and Ptot, as well as lower pH than was measured in any of the stream and river water samples.
The measurements during the main sampling event showed big differences in water characteristics between SWU and downstream water samples (Table 1). This effect was especially pronounced in the case of SW0.3, where the water temperature, ORP, and concentrations of SO42− and Ptot were considerably higher (difference of 1.1 °C, 25 mV, 9 mg/L, and 0.49 mg/L, respectively) than in the SWU.
The Ntot and NO3–N concentrations were highest in SW2.7 and SW3.2, while all other nutrient concentrations were lower further downstream of SW0.3 sampling point. The chemical characteristics of both river water samples were in a similar range and differed from the stream water samples (Table 1). The ORP was slightly (3–4 mV) higher in RWU than in the downstream point and more than 30 mV higher than in SWU, while the TOC, DOC, Ntot, and Ptot were lower in the river water compared with the stream.
Similar to the stream water, the chemical composition of the sediment was different between sampling points located upstream and downstream of the WWTP discharge point. The TOC proportion, and concentrations of Ntot and Ptot were 2.5-, 4-, and 9-fold higher in SS0.3 compared with SSU, while SS2.7 stood out for having the highest pH value and considerably lower Ntot, Ptot, and TOC values than were measured in the other sampling points of the stream and river (Table 1). The nutrient contents in RSU were 1.6- to 2.0-fold lower compared with SSU. In river sediment samples, the pH was 0.3 units lower and the nutrient concentrations were considerably higher in RS3.7 compared with RSU.

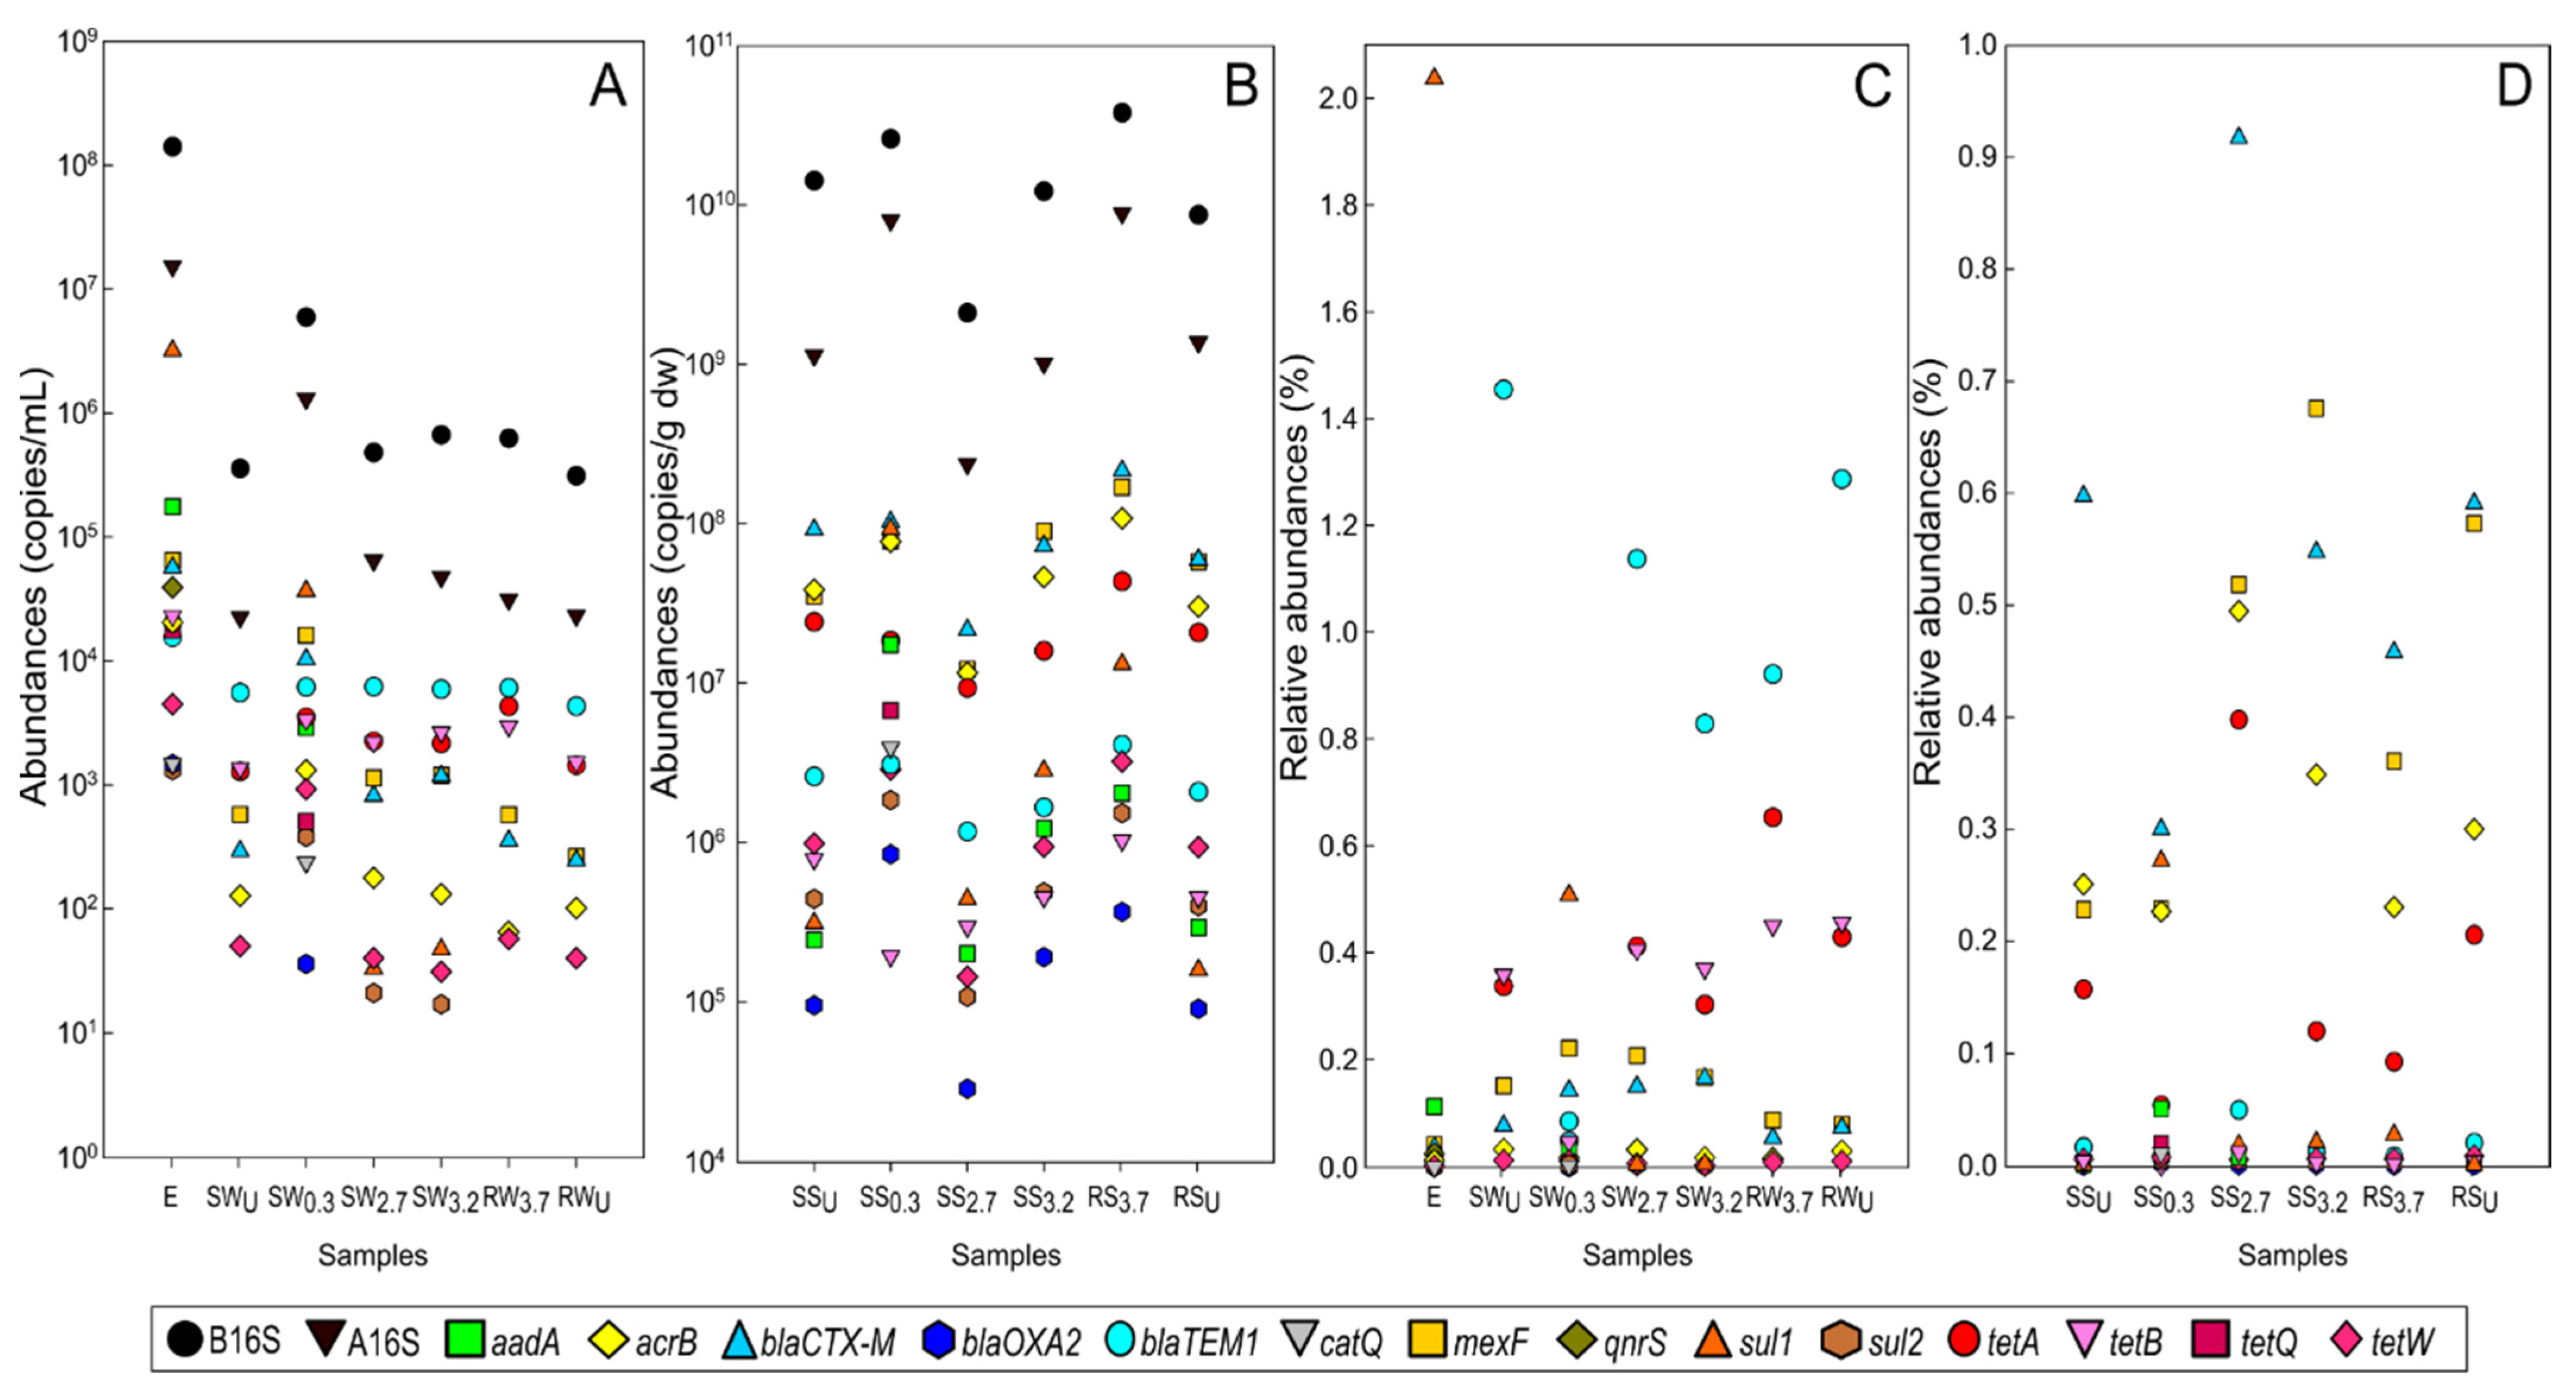
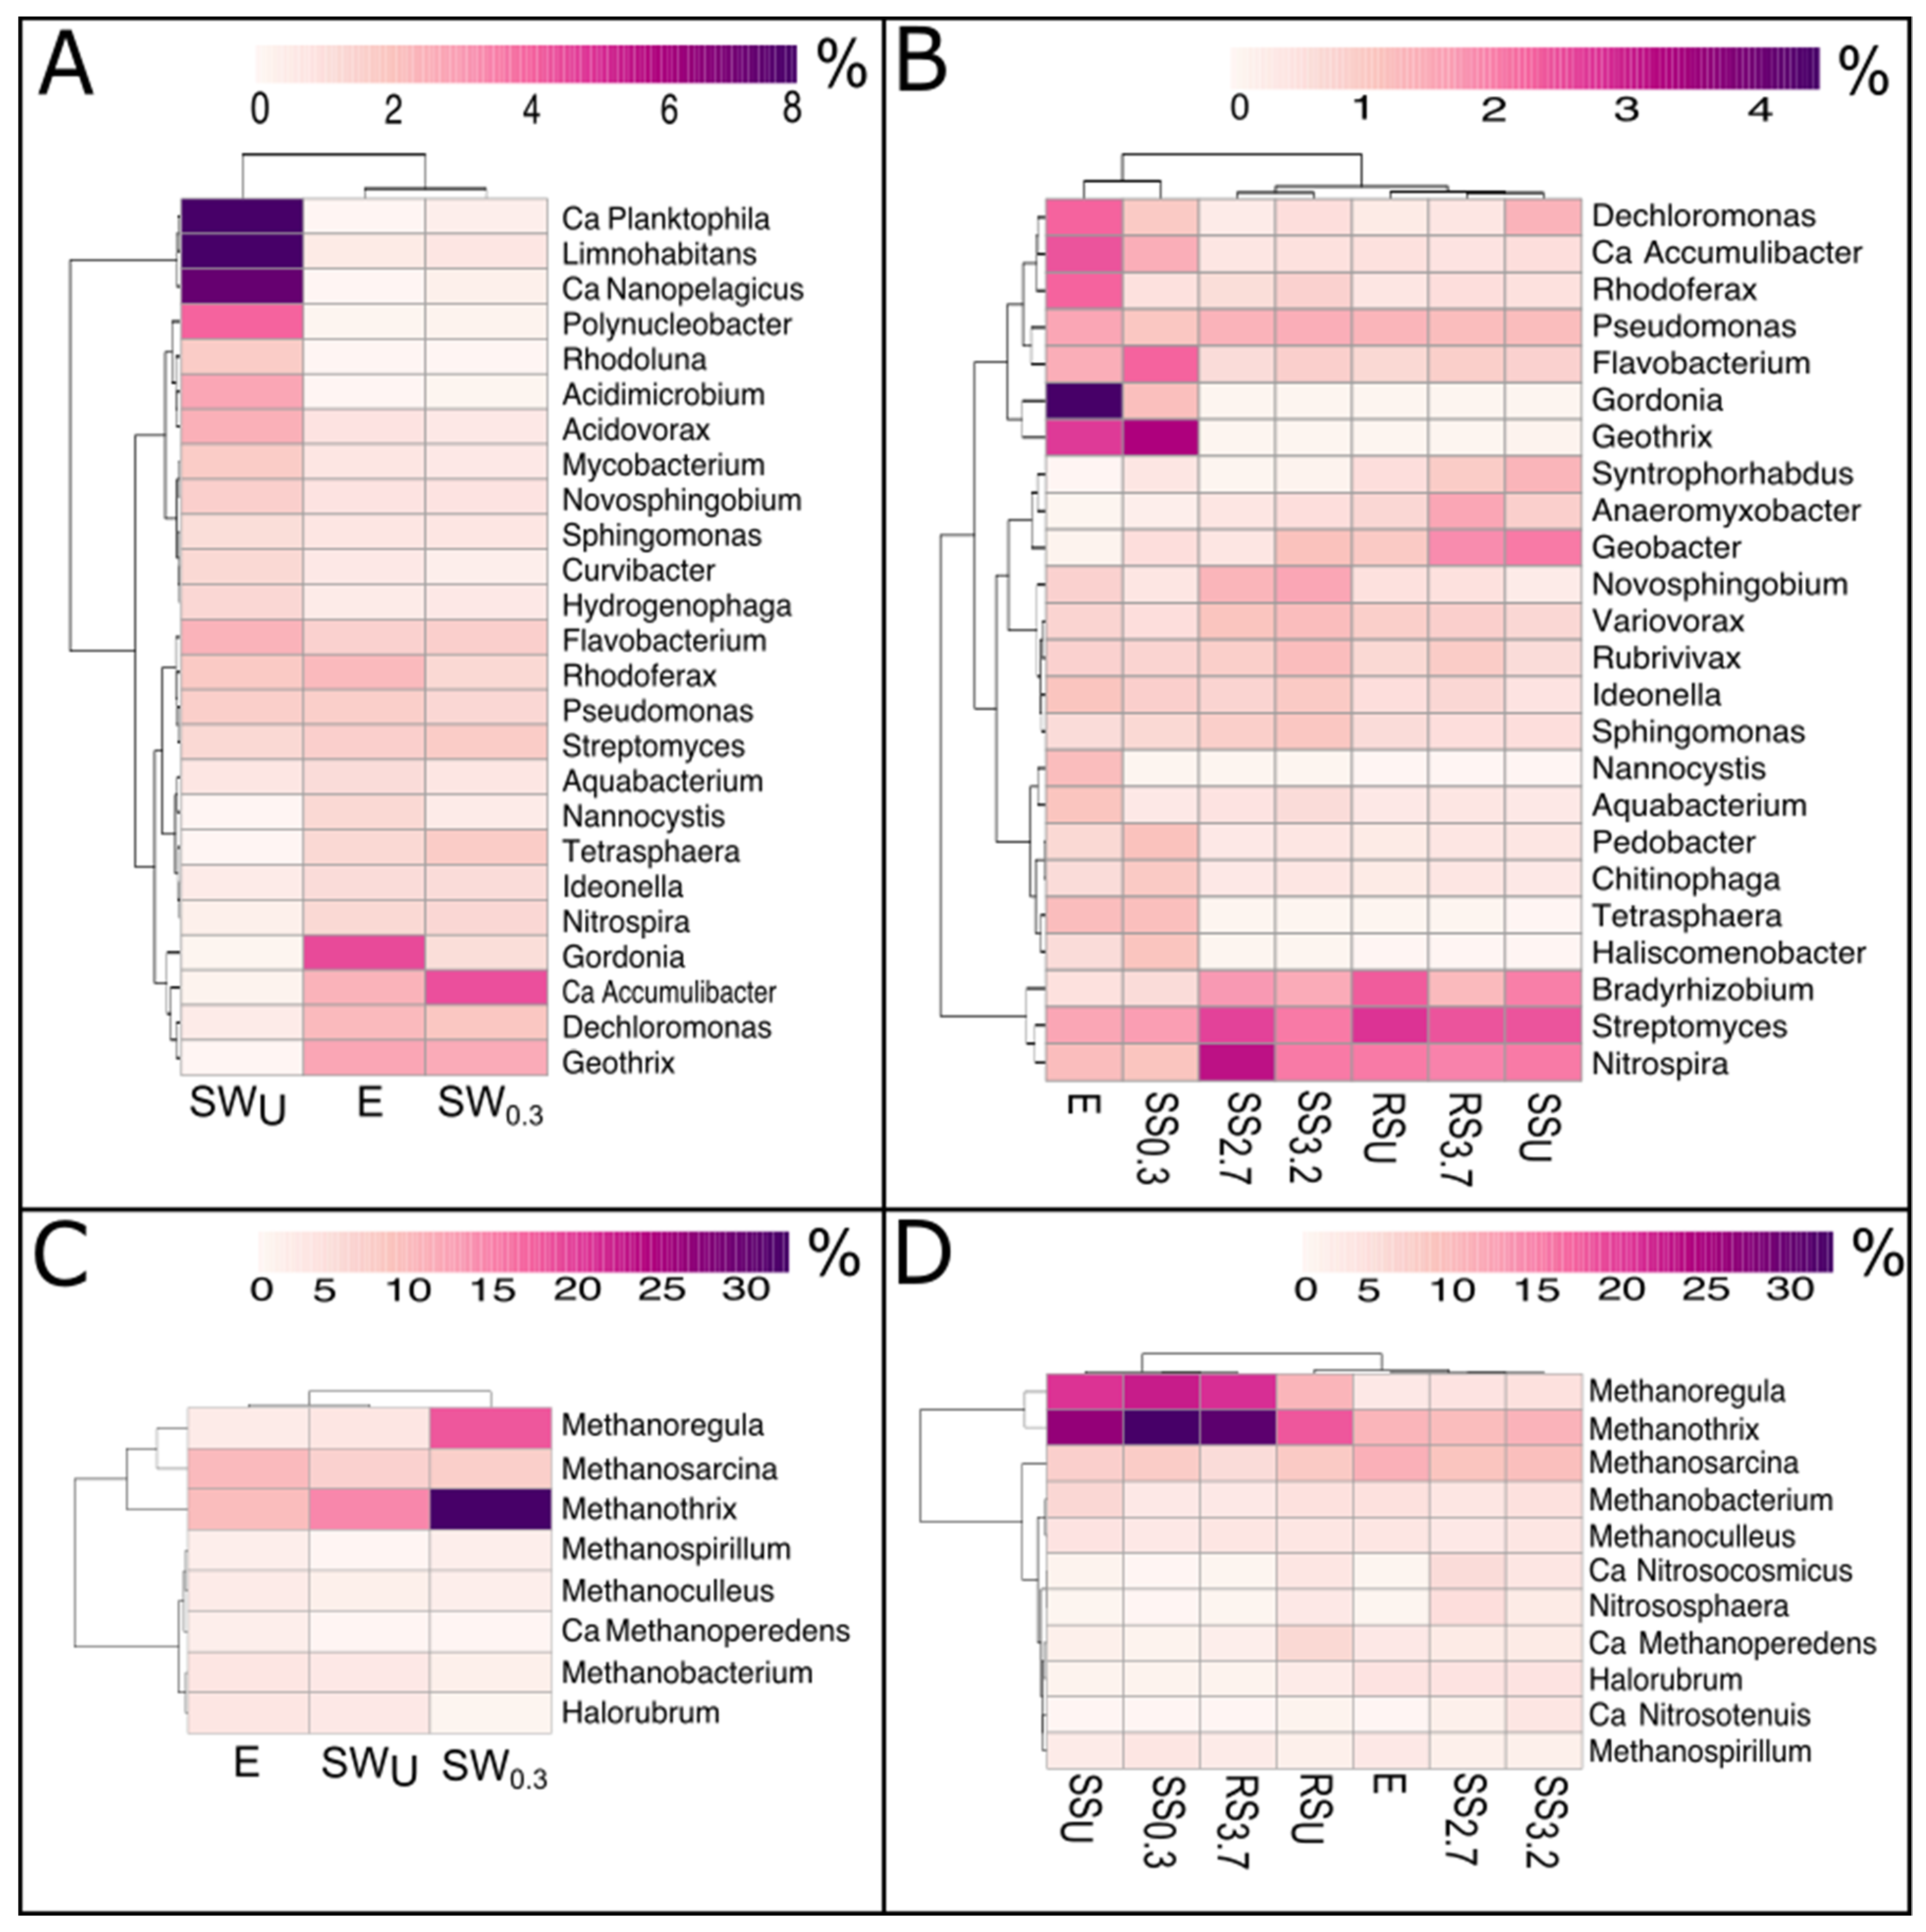
3.2. The Bacterial and Archaeal Community Abundance and Structure

3.2.1. WWTP Effluent

The abundance of total 16S rRNA genes (16Stot) in the E ranged from 1.9 × 10⁷ to 1.6 × 10⁸ copies/mL during the monitored period (Table S4). At the main sampling time, it was 1.6 × 10⁸ copies/mL and archaea formed 9.8% of the prokaryotic community (Figure 1A,C).
At the phylum level, the bacterial community of E was dominated by Proteobacteria and Bacteroidetes (Figure S2A). The most prevalent bacterial genera were Gordonia (Actinobacteria) and Geothrix (Acidobacteria), forming 4.4% and 2.7% of the bacterial community, respectively, followed by Betaproteobacterial genera Ca. Accumulibacter, Dechloromonas and Rhodoferax with proportions of 2.3–2.4% (Figure 2A; Table S5). In the case of archaea, the members of the phylum Euryarchaeota formed two-thirds of the community (Figure S2B) and, at a genus level, Methanosarcina (10.0%) and Methanotrix (9.6%) dominated, while the proportion of all other archaeal genera remained below 3.8% (Figure 2B; Table S6).

3.2.2. Stream and River Water

In the stream water, the 16Stot was in the range of 3.8–7.1 × 10⁵ copies/mL across the distance gradient. The only exception was SW0.3 where 16Stot abundance was 7.3 × 10⁶ copies/mL (Figure 1A). In SW0.3, the B16S and A16S were approximately 16.6- and 58-fold higher, respectively, compared with SWU. The relative abundance of archaea (arc%) in the stream water prokaryotic community was 5.9% in SWU, peaked at 18% in SW0.3, and then gradually decreased along the distance gradient further downstream in the stream (Figure 1C). The 16Stot in RWU was comparable to 16Stot in SWU, while in RW3.7 it was almost doubled (Table S7) and the arc% was 1.5-fold lower than in RWU (Table S8). The statistical analysis revealed that 16Stot, B16S, A16S, and arc% were strongly related to the chemical content (Ptot, PO43−–P, and NH4–N) of the water (Table 2).
The metagenomic analysis revealed that the bacterial community structure of SW0.3 was more similar to E than to the SWU, where Actinobacteria (36.8%) and Proteobacteria (44.2%) dominated (Figure S2A), and the most prevalent genera (31% of the bacterial community) were Actinobacterial Ca. Nanopelagicus, Ca. Planktophila, Acidimicrobium, and Rhodoluna, as well as the Betaproteobacterial genera Limnohabitans and Polynucleobacter (Figure 2A, Table S5). While Proteobacteria (46.5%) was still a dominant phylum in SW0.3, the proportion of Actinobacteria was 4-fold lower and the proportions of Bacteroidetes and Chloroflexi 2.5- and 2.1-fold higher, respectively. As indicated by a clustering analysis, the bacterial community structure on a genus level was more similar between SW0.3 and E than between two stream samples (Figure 2A). The bacterial community in SW0.3 was dominated by bacteria also abundantly present in E (i.e., Ca. Accumulibacter, Geothrix, and Dechloromonas), and the proportion of genera dominating in SWU was only 1.7% in SW0.3 (Figure 2A; Table S5).
The archaeal community in SWU was diverse, dominated by the phylum Euryarchaeota, and differed from the SW0.3 community (Figure S2B). The SW0.3 community was clearly dominated by two genera, namely Methanothrix and Methanoregula, belonging to the class Methanomicrobia of the phylum Euryarchaeota, and accounting for 50.4% of the whole archaeal community (Figure 2B; Table S6). Contrary to the bacterial community, the archaeal community structure on a genus level was more similar in SWU and E than between the two stream water samples (Figure 2C).

3.2.3. Stream and River Sediments

The 16Stot in the stream and river sediments was 1.0–4.7 × 10¹⁰ copies/g dw, except for in SS2.7, where an order of magnitude lower abundance was recorded at the sampling time (Figure 1B, Table S7). The B16S and A16S were highest in SS0.3 and RS3.7. The arc% was 23.5% in SS0.3, which was considerably higher than in SSU (7.4%). The arc% gradually decreased along the distance gradient in the stream to a similar level as was in SSU (Table S8). In the river sediments, the 16Stot was in a similar range with the stream sediments (Table S7). The B16S and A16S were higher in RS3.7 compared with the RSU (Figure 1B), while in RS3.7, the arc% (19.0%) was lower only from the SS0.3 value (Table S8). The statistical analysis revealed a strong negative relationship between all three measured abundances (16Stot, B16S, and A16S) and sediment pH, while A16S had an additional strong positive relationship with TOC (Table 2).
The bacterial communities of stream and river sediments were dominated by Proteobacteria (44.1–52.2%); however, in SS0.3, 2.8-fold higher Bacteroidetes proportions as well as 2-fold lower Deltaproteobacteria proportions compared with SSU were recorded (Figure S2A). The effect of WWTP proximity was evident on a genus level as the SS0.3 community clustered together with the E community (Figure 2C). Only in SS0.3, the Actinobacterial genera Gordonia and Tetrasphaera, Acidobacterial genus Geothrix, Betaproteobacterial genus Ca. Accumulibacter, as well as Flavobacterium, Haliscomenobacter, Chitinophaga, and Pedobacter from the phylum Bacteroidetes, were represented in high proportions, while the genera Bradyrhizobium, Nitrospira, and Streptomyces had the lowest proportion values compared with the other sampling points of the studied distance gradient (Figure 2A; Table S5). Further downstream from SS0.3, the stream sediments clustered together, while river sediments formed a cluster with SSU (Figure 2B).
The archaeal phylum Euryarchaeota (especially class Methanomicrobia) dominated in all sediment samples, and the highest proportion was recorded in the SS0.3 (Figure S2B). The gradual (more than 3-fold) decrease in the proportion of Methanomicrobia (especially genera Methanothrix and Methanoregula) along the downstream distance gradient up to the SS3.2 sampling point was recorded (Figure S2B; Figure 2B). Upon a clustering analysis of the archaeal communities of sediments on genus level, the two more distant sampling points of the stream (SS2.7 and SS3.2) clustered together and had the most diverse archaeal communities, with a lack of drastically dominant genera (Table S6), although the highest proportions of Thaumarchaeota and Halobacteria were recorded for the sediments of these two sampling points.
The bacterial and archaeal communities of the river sediments were remarkably similar at the phylum level (Figure S2A). At the genus level, the RS3.7 formed a cluster with SSU and SS0.3, while RSU clustered together with E and the two most distant stream sediment samples (Figure 2D).

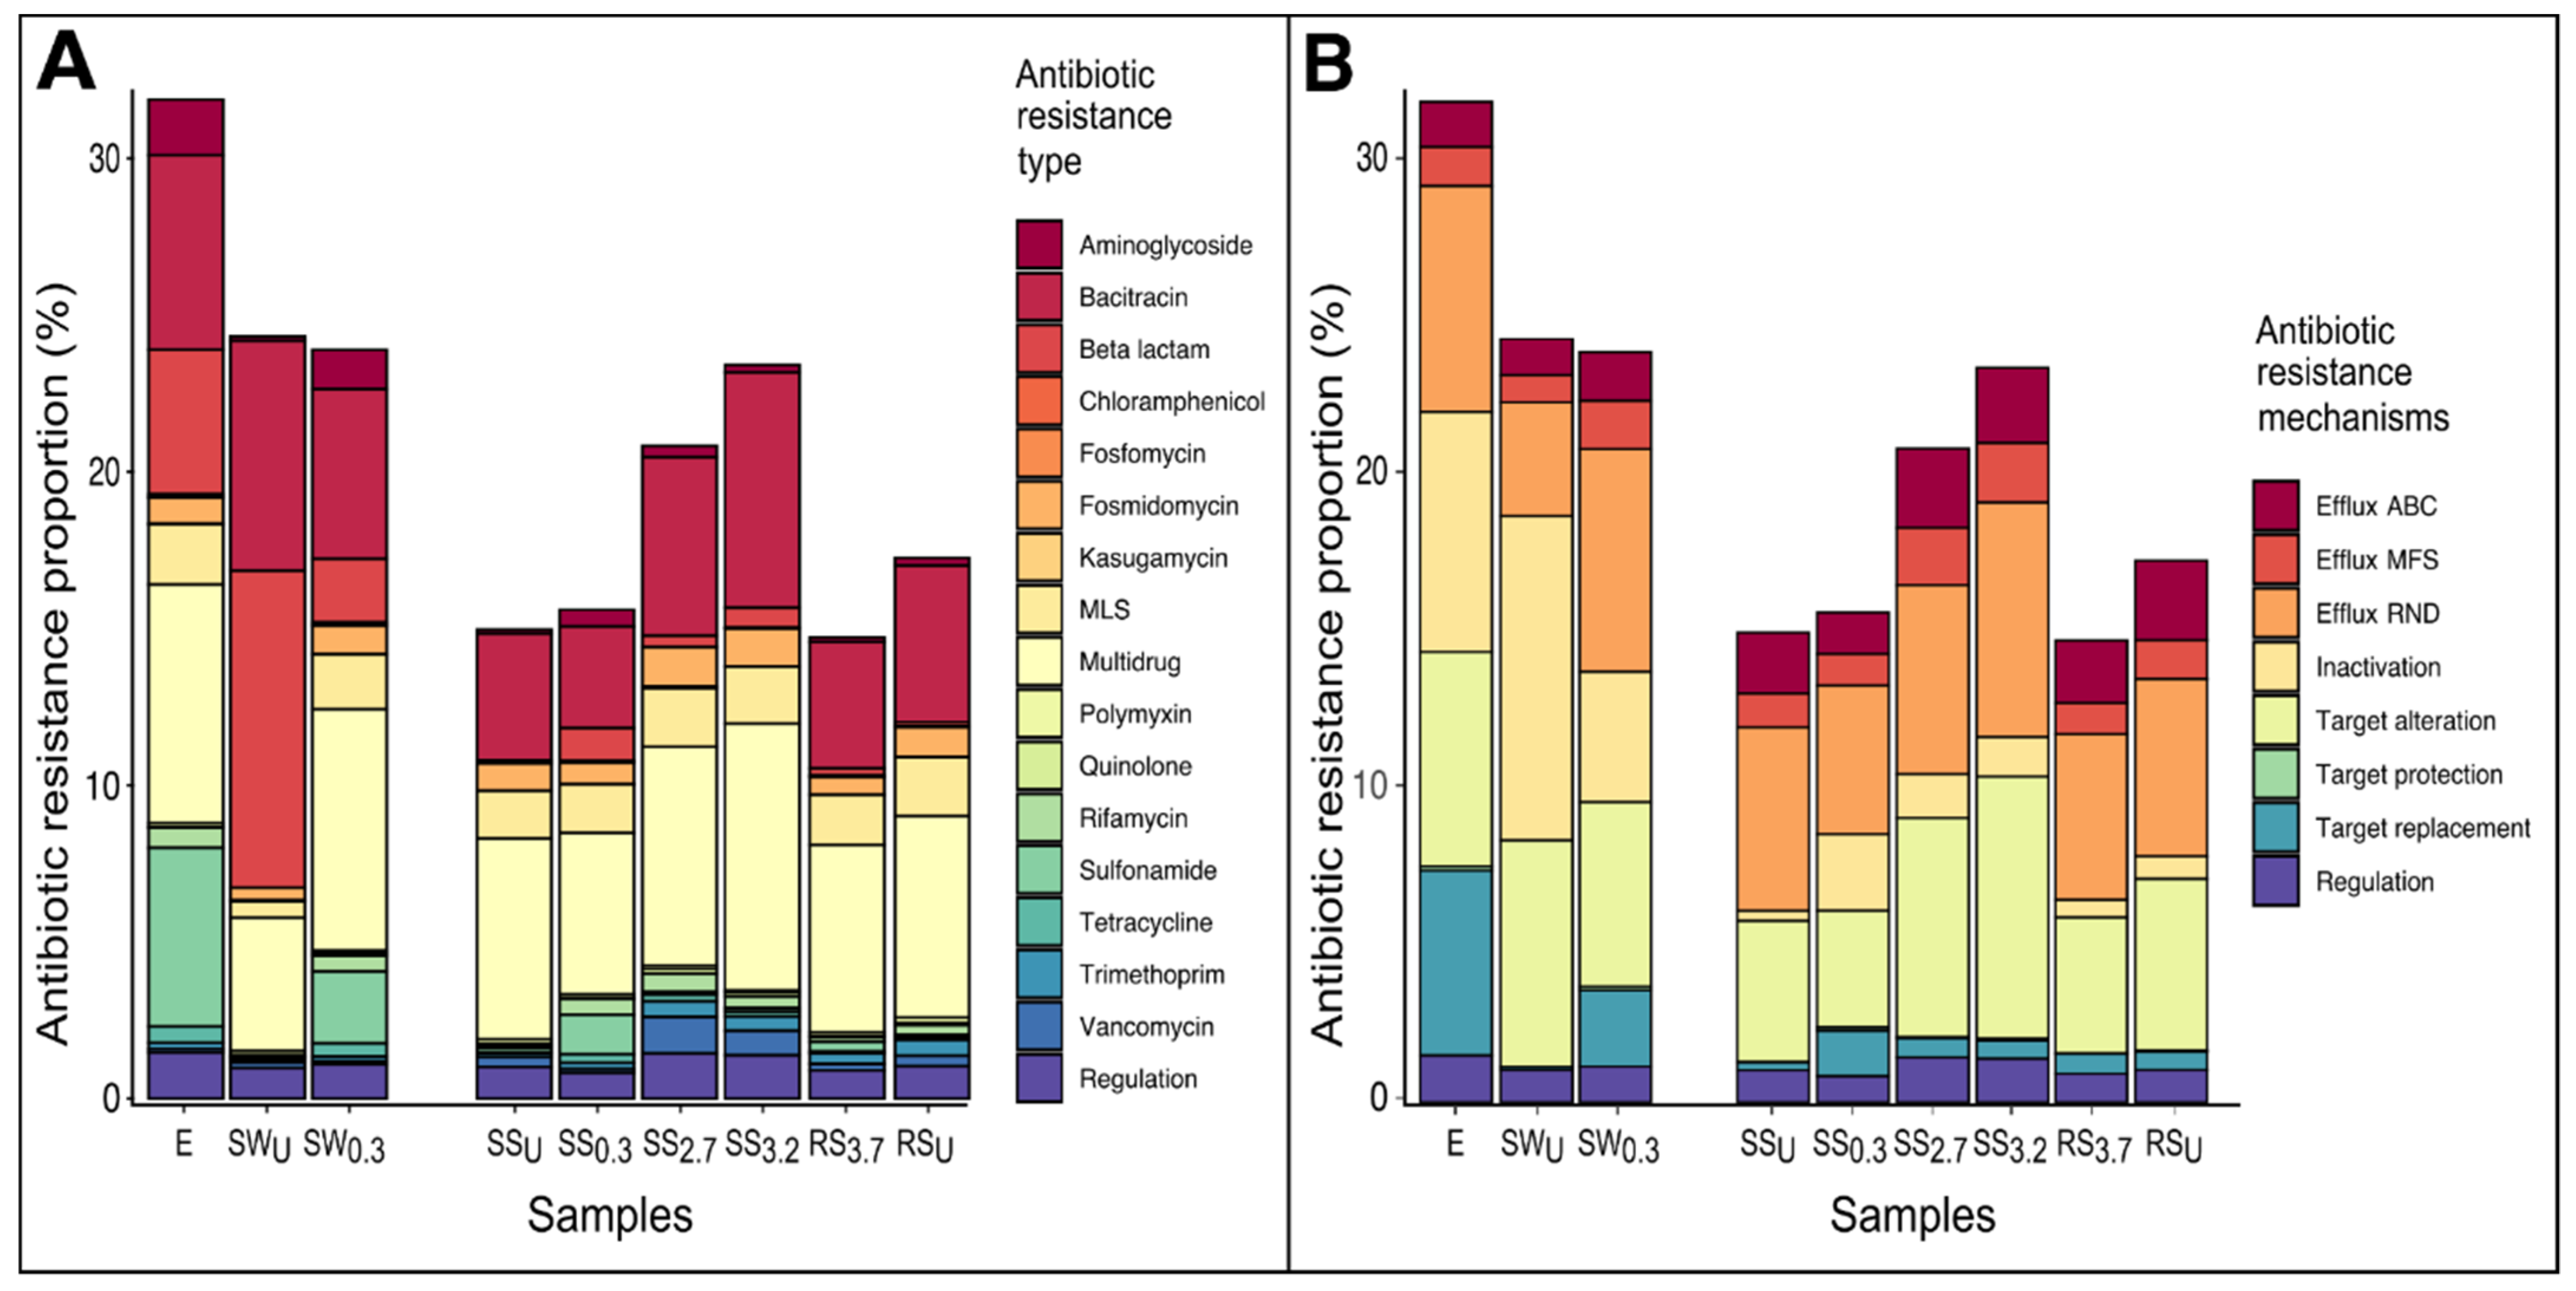
3.3. The Abundance and Composition of Antibiotic Resistome

3.3.1. WWTP Effluent

Based on the metagenomic data, the proportion of the antibiotic resistome per reads of 16S rRNA genes in the prokaryotic community of E was 31.9%. The resistome was dominated by bacitracin, multidrug, and sulfonamide resistance-type determinants (Figure 3A) and RND-type efflux, inactivation, target alteration, and target replacement resistance mechanisms (Figure 3B). In total, 160 ARG subtypes were recorded from the E metagenome, with bacA, sul1, and aadA (6.20%, 5.38%, and 1.17%, respectively) being the most prevalent (Table S9). The quantified ARG abundances and their relative abundances in the prokaryotic community were in the range of 103–106 copies/mL and 0.0008–2.04%, respectively, where the sul2 was the least and sul1 the most abundant ARG in the E resistome at the main sampling time and corresponded to the long-term average in E (Figure 1A,C; Tables S4, S7, and S8).

3.3.2. Stream and River Water

Although the proportion of resistome was similar in the stream water samples preceding and following the WWTP discharge point (23.9% and 24.3%, respectively), there were significant differences in resistome structure between waters collected from these two stream points (Figure 3). The SWU was dominated by inactivation mechanism utilizing beta-lactam resistance-type determinants (especially blaTEM subtypes), while SW0.3 was dominated by multi-resistance (especially of the RND-efflux type) determinants and had a higher proportion of sulfonamide resistance (target replacement mechanism) and a lower proportion of beta-lactam resistance determinants than SWU. The proportion of aminoglycoside, MLS (macrolide–lincosamide–streptogramin), rifamycin, and tetracycline resistance types was also higher in SW0.3 (Figure 3A). The number of detected ARG subtypes was higher downstream of WWTP (130 in SWU and 147 in SW0.3), mostly owing to subtypes originating from WWTP effluent, which became prevalent in SW0.3 (such as sul1, sul2, and aadA, with proportions of 1.80%, 0.44%, and 0.60%, respectively).
Based on the ARGs quantification data, in SWU, the abundances of aadA, blaOXA2, catQ, qnrS, sul1, sul2, and tetQ remained below the limits of quantification (LOQ) and the abundances and relative abundances of the detected ARGs were in the range of 50–5530 copies/mL and 0.013–1.45%, being the lowest in the case of tetW and the highest in the case of blaTEM1 (Figure 1A,C; Tables S7 and S8). In SW0.3, all targeted ARGs (except qnrS) were detected, while aadA, blaOXA2, catQ, and tetQ were not detected in any other water samples (Table S7). The abundances of almost all ARGs (except for blaTEM1) were higher in SW0.3 compared with the rest of the stream water samples and were in the range of 36 (blaOXA2) to 104 (sul1, blaCTX-M, and mexF) copies/mL (Figure 1A). The ARG abundances decreased (especially sul genes) downstream along with the distance gradient further downstream, and the abundances in RW3.7 were mostly comparable to those in SWU but higher than in RSU (Figure 1A).
The relative abundances of blaTEM1, tetA, and tetB were higher (in the range of 0.30–1.45%) than other ARGs in all stream and river water samples except for SW0.3, where their relative abundance was 10-fold lower and where considerably higher relative abundances of sul1, mexF, and blaCTX-M were measured compared with the other water samples (Figure 1C). In SW2.7, most relative abundances of ARGs were close to SWU level. The exceptions were blaCTX-M and mexF, whose relative abundances were high also in SW2.7 and SW3.2 (Figure 1C).
AcrB, tetW, sul1, sul2, blaCTX-M, and mexF genes showed positive correlations with both B16S (R = 0.88–0.96, p < 0.05) and A16S (R = 0.93–0.98, p < 0.01). When these relationships were taken into account in the partial correlation approach, it was found that both the abundances and relative abundances of sul2 and A16S in prokaryotic community were positively related (Figure 4A,C). A negative relationship between blaTEM1 and sul1 abundances and relative abundances in water was confirmed (Figure 4A,C). Several Pearson correlations were found between the contents of Ptot and NH4–N, and abundances as well as relative abundances of ARGs in the water samples (Table S10). Since a strong correlation between B16S as well as A16S and several ARGs was revealed in the studied water, a partial correlation approach was applied, where B16S and A16S were used as covariables (Table 2A). When B16S was used as a covariable, significant relationships between the concentrations of Ptot and NH4–N and abundances of two ARGs (blaCTX-M and sul2) were found; however, these correlations did not reveal when A16S was used as the covariable in further analysis. A similar trend was also recorded in the cases of relative abundances of ARGs (Table 2B). A positive partial correlation not dependent on the choice of covariables was revealed between the relative abundance of tetW and water temperature, and a negative relationship with O2 concentration was found, while the relative abundance of blaCTX-M was positively related to the NO3–N concentration in the water (Table 2B).

3.3.3. Sediments of Stream and River

The analysis of metagenomes of the stream sediments showed that the proportion of antibiotic resistome was 14.7–23.4% of the reads of 16S rRNA genes and generally dominated by multidrug and bacitracin resistance types and efflux (especially of RND-type), as well as target alteration resistance mechanisms (Figure 3). The proportion of the resistome was similar for SSU and SS0.3 (15.0% and 15.6%, respectively), but the structure of the resistome differed considerably. In SS0.3, a higher number of ARG subtypes and higher proportion of sulfonamide, aminoglycoside, and beta-lactam (especially the LRA and OXA gene families) resistance types (target replacement and inactivation mechanisms) were detected at the expense of generally dominant ones (Table S9, Figure 3). Likewise to the water samples, the sul1, sul2, and aadA subtypes that were among the prominent subtypes in SS0.3 (0.82%, 0.40%, and 0.25%, respectively) were not detected in SSU (Table S9). While the proportion of the resistome was the highest further downstream of the WWTP discharge point (at 20.8% and 23.4% in SS2.7 and SS3.2, respectively), the number of detected subtypes decreased and the structure of the resistome was more similar to the SSU. The proportions of sul1, sul2, and aadA genes, originating mainly from the WWTP effluent, were already marginal in SS2.7 (Table S9). In the river sediments, the proportion of the resistome was higher in RSU (17.3%) compared with RS3.7 (14.7%). In general, the structure of the resistomes of both river sediments was very similar, but more ARG subtypes were found in RS3.7 (Figure 3, Table S9).
The abundances and relative abundances of quantified ARGs in SS0.3 were in the range of 8 × 10⁵–1 × 10⁸ copies/g dw (being lowest for blaOXA2 and highest for blaCTX-M) and 0.0025–0.30%, respectively (Figure 1B,D). Two orders of magnitude higher abundances of sul1 and aadA and 134- and 32-fold higher relative abundances of these ARGs, respectively, were recorded in SS0.3 compared with SSU. The abundances and relative abundances of sul2 and blaOXA2 were also higher in SS0.3 compared with SSU (Tables S7 and S8). In addition, SS0.3 was the only sediment sample where catQ and tetQ genes could be detected (Figure 1B). SS2.7 showed the smallest ARG abundances of all sediment samples, and in SS3.2 the ARG abundances were also generally lower (except for tetB and mexF) compared with SS0.3. The aadA and sul1 abundances showed the biggest difference of all ARGs from SS0.3, showcasing 14- and 33-fold smaller abundances, respectively, at SS3.2. RS3.7 showed the highest abundances of ARGs of all sediment samples except for the aadA, sul1, sul2, and blaOXA2 genes, while the ARG abundances in RSU were in a comparable range to those of SSU (Figure 1B).
The results of a statistical analysis indicated that the abundance of B16S was strongly related to acrB, tetW, and blaCTX-M abundance (R = 0.98–0.99, p < 0.001) and less strongly to tetA, sul2, blaTEM1, and mexF abundance (R = 0.84–0.96, p < 0.05) in sediments. A16S, on the other hand, was strongly related to acrB, tetW, and sul2 abundance (R = 0.98–0.99, p < 0.001) and less to tetA, blaCTX-M, blaTEM1, and mexF abundance (R = 0.84–0.94, p < 0.05). The correlation analysis of ARG abundances as well as relative abundances revealed that aadA, blaOXA2, sul2, and sul1 were positively related to each other (Figure 4B,D). The relative abundances of tetA, tetB, acrB, blaTEM1, and blaCTX-M formed another positively related gene cluster (Figure 4D). In addition, the abundance of tetA showed a negative relationship to aadA, blaOXA, and sul2 abundances, while the latter was also negatively related to tetB and blaCTX-M abundances.
Many significant negative Pearson correlations between abundances of ARGs and pH, as well as positive relationships between abundances of aadA, blaOXA2, sul1, and TOC, were revealed in the sediments (Table S10). However, when B16S and A16S were taken into account as covariables, only a weak positive correlation between aadA and Ptot was revealed (Table 2A). In the case of relative abundances, several ARGs showed significant positive Pearson correlations with sediment pH or contents of nutrients (aadA and sul1) in the sediments, but the number of correlations decreased substantially after the application of the partial correlation approach (Table 2B). However, the relative abundances of aadA and sul1 still showed a positive relationship with Ptot and blaCTX-M with the sediment pH (Table 2B).

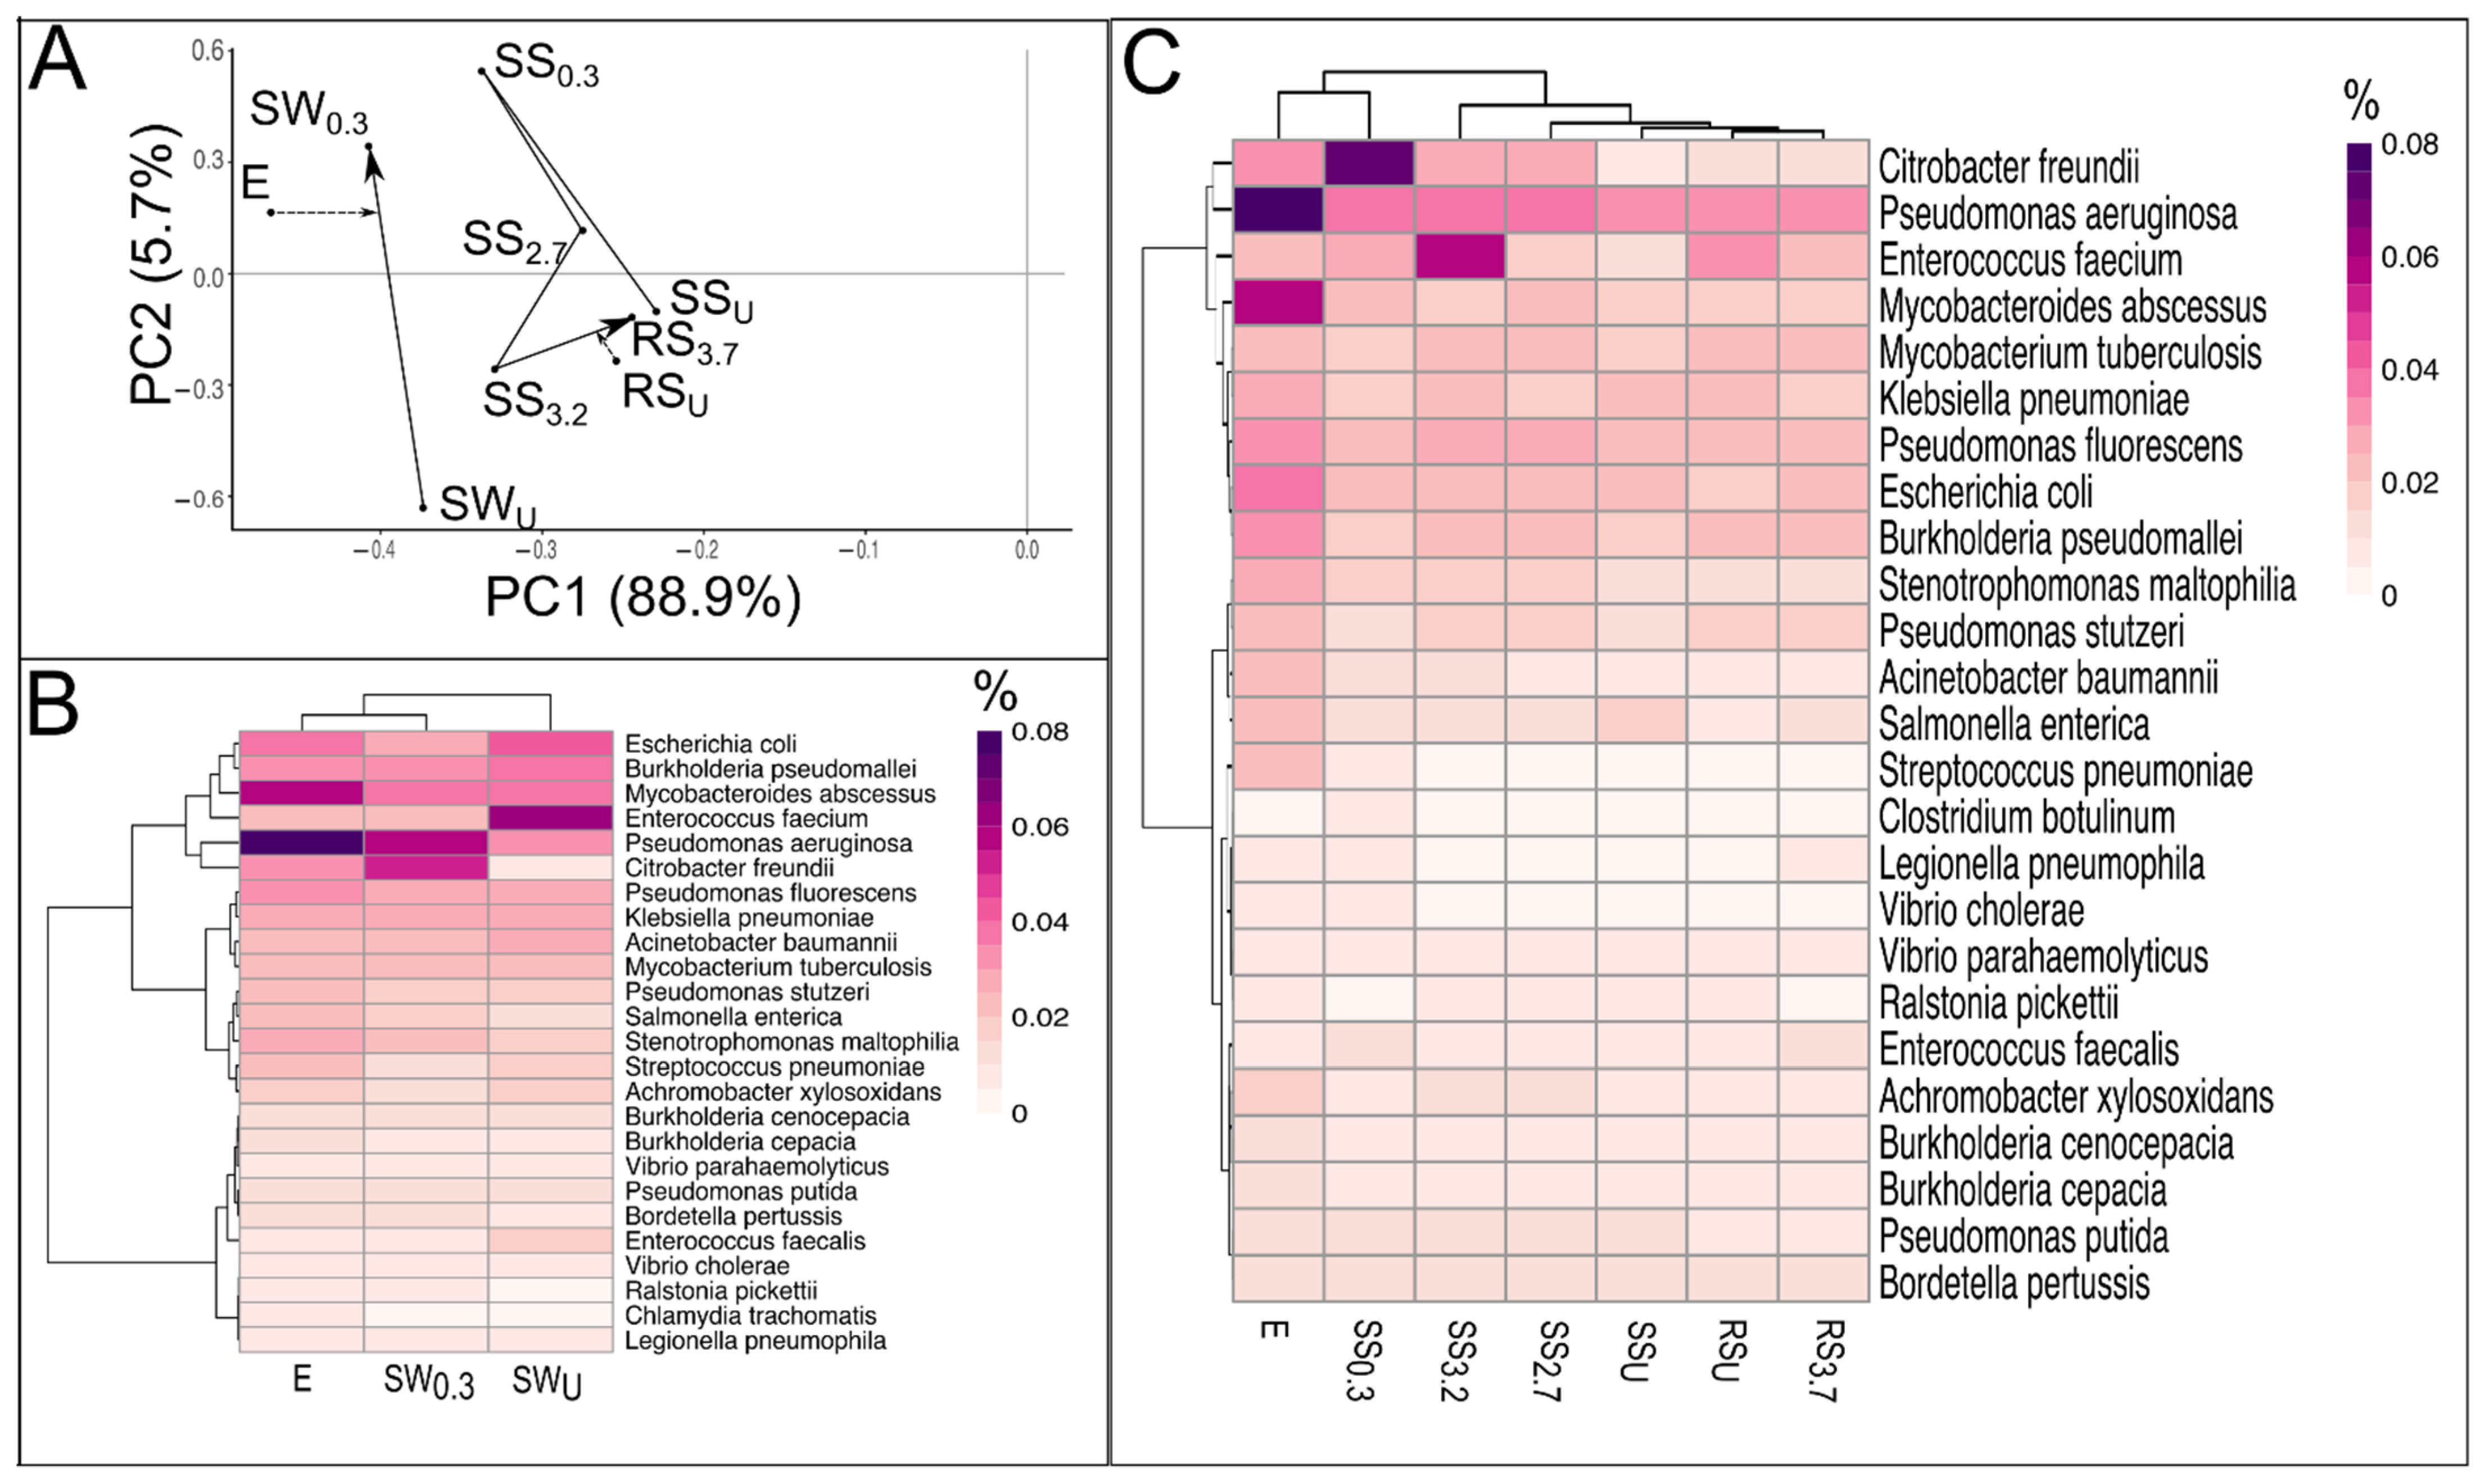
3.4. Pathogens in WWTP Effluent, Stream and River Water, and Sediment

All pathogens appearing in the list of important pathogens of the CARD database were detected from the metagenomes of E, as well as from all the water and most of the sediment samples (Table S11). The exception was Staphylococcus lugdunensis, which was not detected from the metagenomes of SS2.7 and SS3.2. The proportion of pathogens in the bacterial community was highest in E (0.69%), followed by stream water samples (0.61% in SWU and 0.59% in SW0.3). The results of the PCA analysis revealed that, despite the similar proportions of pathogens, there was a difference in the structure of pathogenic communities between SW0.3 and SWU (Figure 5A). A higher similarity in the pathogenic community structure was found between E and SW0.3 than between the two stream water samples upon a clustering analysis (Figure 5B). For instance, much lower proportions of Pseudomonas aeruginosa and Citrobacter freundii and higher Enterococcus faecium proportion were recorded in SWU compared with E and SW0.3 (Table S11).
In the sediment samples, the proportion of pathogens was in the range of 0.37–0.39% in SSU, RSU, and RS3.7, while higher pathogen proportions (0.41–0.49%) were recorded in bacterial communities of stream sediments downstream of the WWTP discharge point (SS0.3–SS3.2). In all of these samples, the most dominant pathogens were Pseudomonas aeruginosa, Enterococcus faecium, Mycobacteroides abscessus, Citrobacter freundii, Escherichia coli, and Pseudomonas fluorescens (Table S11).
As was indicated by the samples’ ordination on the PCA plot, the structure of the pathogenic community in sediments also differed along the studied distance gradient (Figure 5A). A clustering analysis indicated the highest similarity between the E and SS0.3 pathogenic community, as these samples formed a distinct separate cluster from the other samples (Figure 5C). The two river sediments clustered together and showed bigger similarities with the SSU.
The proportion of Citrobacter freundii (0.07%) was especially high, and peak proportions of Mycobacteroides abscessus, Vibrio cholerae, Clostridium botulinum, Clostridioides difficile, and Streptococcus pneumoniae were recorded in SS0.3. In general, the proportion of pathogens gradually decreased further downstream.

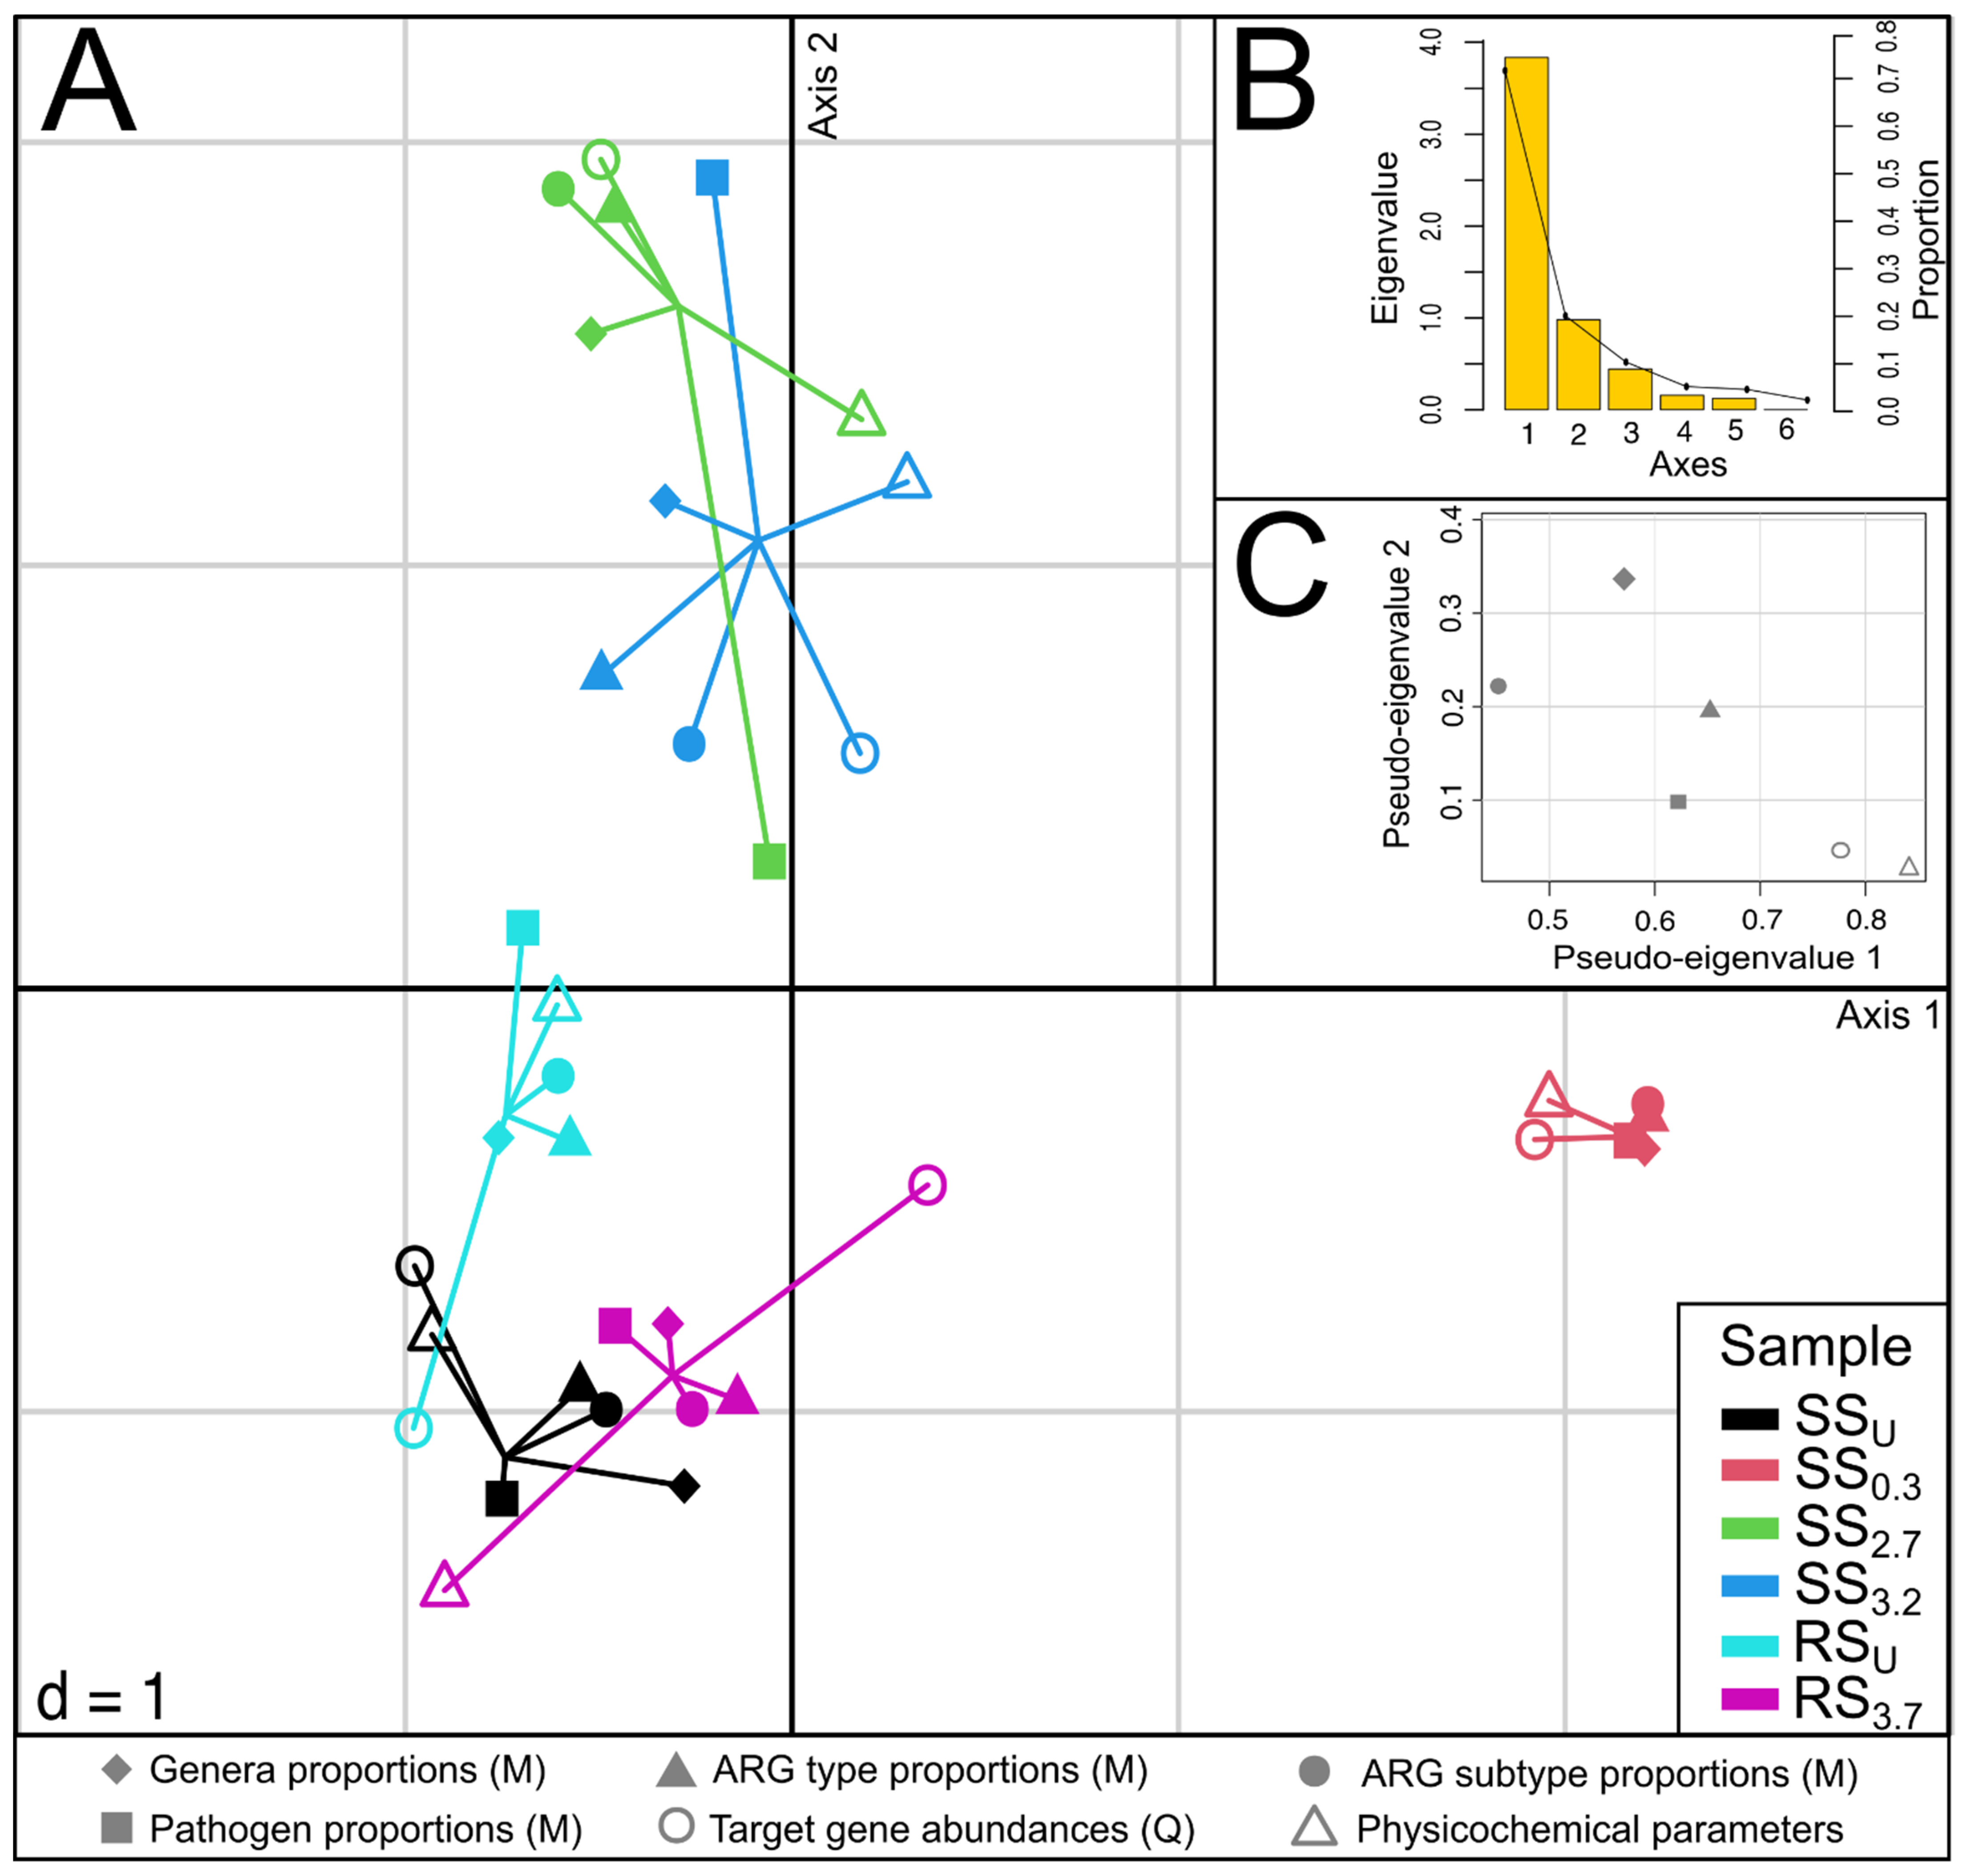
3.5. The Relationships between Community Composition, Resistome, Pathogens, and Physicochemical Parameters in Sediments

MCIA was applied to analyze six datasets (microbial genera and pathogen proportions in prokaryotic community, ARG type and subtype proportions, ARG abundances, and sediment physicochemical parameters). The graphical outputs from this analysis are shown in Figure 6 and Figure S3. The MCIA first axis captures the most variance (73.6%) in the datasets and separates SS0.3 from the rest of the samples (Figure 6A). The MCIA second axis (16.9%) emphasizes the difference between SS2.7 and SS3.2 and upstream sediment samples from stream and river. The pseudo-eigenvalue space of six datasets (Figure 6C) indicates that two datasets (quantitative ARG data from qPCR and sediment chemistry) contribute the most variance on the MCIA first axis, while the contribution of the ARG type and pathogen proportion data is smaller. Microbial genera proportions data highly contribute to the MCIA second axis. The correlation between datasets was highest in the case of ARG subtype, pathogens, microbial community structure, and chemistry data (multivariate generalization of the Pearson correlation coefficient (RV) = 0.88–0.93) and lowest in the case of ARG type, qPCR, and pathogen datasets (RV = 0.58–0.68). Projections of all variables into the MCIA first two axes’ space indicates that SS0.3 is associated with higher values of certain bacterial genera (Haliscomenobacter, Ca. Microthrix, Geotrix, Tetrasphaera, and Gordonia), pathogens (Citrobacter freundii, Brucella canis, Streptococcus anginosus, and Staphylococcus intermedius), antibiotic resistance types (sulfonamide, chloramphenicol, tetracycline, and aminoglycoside), and ARG abundances (sul1, aadA, and blaOXA2) (Figure S3). Sediment samples not affected by WWTP effluent are mainly associated with the higher values of bacterial genera Syntropus and Syntrophorhabdus and archaeal genera Methanoregula and Methanothrix.

4. Discussion

4.1. The Characteristics of WWTP Effluent and Its Effect on the Physicochemical Conditions in the Water and Sediments of a Receiving Stream

Even though the level of antibiotic consumption in Estonia during the decade of Nõo WWTP operation prior to this study (on average 14 Defined Daily Dose (DDD) per 1000 inhabitants/day, dominated by beta-lactam antibiotics and tetracyclines) was below the European average [29], the Nõo WWTP proved to be a typical small-size WWTP as its effluent was characterized by similar nutrient content [10], as well as similar bacterial and ARG abundances [6] to what have been reported in effluents of other small-sized WWTPs in Europe. In addition, the composition of the bacterial community on both phylum and genus levels coincides with previous characterizations of WWTP effluents in Europe [30]. Notably, a diverse archaeal community forming almost one-tenth of the prokaryotic community was present in the effluent of this WWTP. The WWTP effluent proved to be a significant source of the Euryarchaeotal genera Methanosarcina and Methanothrix, which have been found in cold-climate WWTPs [31] as well as anaerobic industrial WWTPs [32]. The WWTP effluent also boasted a diverse pathogenic community, which, unlike large-scale WWTPs [30], was dominated by environmental bacteria that include nosocomial pathogens (i.e., Pseudomonas aeruginosa).
As was indicated by the considerable changes of the water and sediment chemical characteristics downstream of the WWTP discharge point compared to the upstream point, the WWTP effluent considerably affected the conditions in the stream water and sediments. This effect was highest 0.3 km downstream of the effluent discharge point, where the water temperature and redox potential were increased, the O2 content was lower, and the contents of nutrients, SO43−, and TOC were considerably higher than was recorded upstream of the WWTP discharge point. A significant increase in the concentrations of TOC and nutrients in this sampling point (SS0.3) compared to the upstream point was also recorded. It has been shown that the effluents of WWTPs affect the physicochemical characteristics of water and sediments of the receiving waterbodies [13,33,34]; however, the effect on water and sediments is different. The state of the water characteristics and planktonic microbial communities in the receiving stream and river reflects a short-term (hours or days) effect of WWTP effluent mixing with stream water and can vary depending on the WWTP load or season [6]. The physiochemical conditions and benthic microbial communities in the sediments evidence the long-term (in this case >10 years) effect of WWTP activity [35].

4.2. The Effect of WWTP Effluent on Microbial Community Abundance and Structure in the Water and Sediments of a Stream and River

Along with excess nutrients, the effluent introduced microbes and affected the abundance and structure of the prokaryotic community in stream water and sediment downstream of WWTP. The abundances of bacteria and archaea were highest in water and sediments 0.3 km downstream of the WWTP discharge point. Further downstream, the community abundance in water gradually decreased along the distance gradient from WWTP, while in sediments a different dynamic, culminating in the highest abundances in river sediment 3.7 km downstream of WWTP, was recorded. A similar effect on the bacterial communities of water and sediments downstream of WWTPs [12] and a decrease along the distance gradient from WWTP have been reported [15]. It has been suggested that a high number of particles are present in the effluents, which contain numerous microbes [35], and settle to the streambed close to WWTPs, contributing to their microbial community abundance [14].
The results of this study showed that, in general, the changes in the microbial communities caused by effluent inflow were surprisingly similar in the water and sediments. For example, the proportion of organisms from the phylum Bacteroidetes, a taxon shown to be a common member of the wastewater communities [15,36,37], was elevated in water and sediments 0.3 km downstream of the WWTP discharge point. While the proportion of Bacteroidetes increased, the proportion of Actinobacteria decreased in the stream water and Deltaproteobacteria in sediment. At the genus level, the bacterial communities of water and sediment 0.3 km downstream of the WWTP discharge point shared a higher similarity with the effluent communities than with the upstream water and sediment. The genera Ca. Accumulibacter, Dechloromonas, and Geothrix, shown to be common in WWTP effluents [30], became prominent in both water and sediment at this location. In water, these taxa replaced genera such as Limnohabitans, Ca. Planktophila, and Ca. Nanopelagicus that typically dominate in freshwater bacterioplankton communities. In addition to the high microbial load from WWTP effluent, this shift in the bacterial community structure in water is probably partly a result of the lower competitiveness of the aforementioned bacterioplankton genera under elevated nutrient conditions [38]. Similar to the findings of Price et al. [15], the proportions of taxa associated with WWTP effluent significantly decreased further downstream of the 0.3 km sampling point, and organisms from nitrogen-cycling-associated genera Nitrospira and Bradyrhizobium, as well as Streptomyces, regained their position as prevalent taxa in sediments further downstream of the WWTP.
The abundance of archaea was several-fold more elevated than that of bacteria in both stream water and sediments in close vicinity downstream of the WWTP discharge point, where they accounted for over one-fifth of the prokaryotic community in stream sediment. Apart from the direct input of archaea from WWTP effluent, the correlation analysis indicated that the elevated archaeal abundance was probably also caused by the high concentration of nutrients (especially NH4–N and phosphorous) 0.3 km downstream of the WWTP. The archaeal communities of the stream and river water and sediments downstream of WWTP were dominated by Methanothrix and Methanoregula, reported to be widespread in terrestrial habitats including oxic soils [39,40].

4.3. The Effect of WWTP Effluent on the Antibiotic Resistome in Water and Sediments of Stream and River

The strong effect of WWTP effluent on receiving stream water and sediment antibiotic resistome was also evident in close vicinity downstream of WWTP. Yu et al. [35] found that the particles brought by the effluent into the stream settle downstream close to the WWTP discharge point, thus also affecting the distribution of ARGs in the streambed. In this study, further downstream, the ARG abundances in water generally decreased and the resistome structure in sediments shifted gradually along a distance gradient towards its upstream state.
Even though the proportion of antibiotic resistome in the microbial communities of water and sediments preceding and following the WWTP discharge point remained virtually unchanged, shifts in resistome structure towards an increase in resistance types prevalent in WWTP effluent, as well as a higher number of detected ARG subtypes and generally increased ARG abundances 0.3 km downstream in water and sediment were recorded. In this location, elevated proportions of sulfonamide and aminoglycoside resistance types, and more specifically, sul1, sul2, and aadA, as well as, to a lesser extent, beta-lactam-resistance-encoding blaOXA genes, reported as characteristic of heavily impacted waterbodies [41,42], were recorded in the water and sediment. Upstream of WWTP, as well as in the river upstream of stream inflow, the abundances of these ARGs were low in the sediments and nondetectable in water, indicating a low anthropogenic impact in these locations and suggesting that the WWTP effluent can be a predominant source of ARGs. The correlation analysis confirmed that these anthropogenic impact marker genes indeed formed one behavioral cluster. A difference in the proportion and structure of the beta-lactam resistance type between water and sediment communities 0.3 km downstream of WWTP was also recorded. In the stream water, a substantial decrease in the proportion of beta-lactam resistance, specifically of blaTEM, which has previously been shown to be characteristic of freshwater bodies [41], was noted. The quantitative data suggested that this effect could arise from the excess input of microbes (including ARG-carriers) introduced by WWTP effluent rather than from an actual change in the abundance of blaTEM genes in this study. Still, the negative relationship recorded between sul1 and blaTEM1 genes in water suggests that indigenous carriers of blaTEM-type resistance can be outcompeted in highly impacted freshwater environments [33]. On the other hand, in sediments, the proportion of beta-lactam resistance increased downstream of the WWTP discharge point, mostly owing to blaOXA and blaLRA gene families, which so far have been documented from river sediments as minor beta-lactam resistance determinants [43].
In general, the ARG abundances in water decreased along the distance gradient further downstream, and the WWTP effluent-associated sul1–sul2–aadA–blaOXA2 cluster became virtually undetectable (except for a minute amount of sul1 genes) from the 2.7 km location onward. The decrease of ARGs in stream water across a distance gradient from WWTP discharge has also been reported by other studies [33,37,42]. In the sediments, the changes in the structure of the resistome along a distance gradient indicated recovery from the impact of WWTP effluent as the proportions of sulfonamide, aminoglycoside, and beta-lactam resistance, as well as the of sul1–sul2–aadA–blaOXA2 cluster, gradually decreased, and in the river sediments 3.7 km downstream of WWTP, the resistome was remarkably similar to the resistome of the stream sediments upstream of the WWTP. This confirms previous suggestions of at least partial recovery of impacted communities controlled by distance from the effluent source [15]. The abundance of the tetA–tetB–blaCTX-M–-blaTEM1–acrB cluster, composed of highly correlated genes, was dominant in all sediments, suggesting the mostly autochthonous nature of these ARGs in stream sediments. However, the stream water still proved to be a significant source of ARGs, as the abundances of ARGs in river water and sediment were substantially higher following its tributary inflow compared with the upstream river location.
As in several previous studies, numerous ARG abundances showed correlations with bacterial 16S rRNA gene abundances as well as physicochemical parameters (especially NH4–N and phosphorus content) in stream water and sediments [6,10,34] in this study. That suggests that the abundances and proportions of most ARGs varied along with the variation of whole bacterial community abundance in the water and sediments of this study. The variation in the abundances of a few ARGs, namely, blaCTX-M and sul2 in water and aadA in sediment, as well as the proportions of tetW and blaCTX-M in water and sul1 and blaCTX-M in sediments, was related to other factors rather than being affected by the whole-community abundance variation.
Our results also suggest that archaea might contribute to the spread of antibiotic resistance determinants, as archaeal abundances showed positive relationships with acrB, blaCTX-M, mexF, tetW, sul1, and sul2 abundances. The partial correlations approach suggested that especially the sulfonamide-resistance-encoding sul2 gene might be prominently related to the archaeal community. This coincides with previous findings of positive correlations between Methanothrix and the sul1 and sul2 genes [44].

4.4. The Effect of WWTP Effluent on the Pathogenic Community of the Receiving Stream

The WWTP effluent proved to be a source of very diverse pathogenic community, where enteric and environmental-origin opportunistic pathogens dominated over waterborne/-transmitted [30] types. The effluent strongly affected the pathogenic community structure in both receiving stream water and sediment 0.3 km downstream of WWTP discharge point. The increase in abundance of opportunistic pathogens like Pseudomonas aeruginosa and Acinetobacter baumannii as well as enterococci in receiving waterbody water and sediments downstream of the WWTP discharge has been reported [14]. In this case, these multidrug-resistance-prone species [30] were among the dominant ones in the pathogenic community and also showed elevated proportions in the bacterial community of the sediment 0.3 km downstream of the WWTP discharge. The most substantial increase in both water and sediments in this location was recorded for Citrobacter freundii, an opportunistic pathogen in healthcare settings, which can carry beta-lactam, aminoglycoside, and quinolone resistance genes [45,46]. The proportions of the aforementioned species, especially the proportion of Citrobacter freundii in sediments, decreased considerably further downstream, while the core pathogenic community proportions remained somewhat elevated along the stream distance gradient compared with the sediment sampled upstream of the WWTP discharge. The proportion and structure of the pathogenic community in river sediments downstream of the stream inflow and 3.7 km downstream of the WWTP discharge were rather similar to the those of two upstream sediments (SSU and RSU), indicating no impact of WWTP effluent on the pathogenic community at this point.

4.5. Integration of Different Datasets for Assessing the Effect of WWTP Effluent on Sediment

We applied MCIA to jointly analyze datasets of microbial genera and pathogen proportions in prokaryotic community, ARG type and subtype proportions, ARG abundances, and sediment physicochemical parameters. This multivariate analysis approach provided integration and comparison of multiple layers of information from sediment microbial and physicochemical datasets and resulted in the unified assessment of WWTP effluent impact on sediment across all studied datasets. Based on the MCIA results, the WWTP effluent has a strong impact on stream sediment in close vicinity downstream of the WWTP discharge point, which is mainly related to changes in sediment physicochemical properties and ARG abundances assessed by qPCR. The impact of WWTP effluent on stream sediment more distant from the WWTP outlet is better captured by changes in the sediment microbial community composition. Interestingly, the ARG subtype proportions data had the lowest discriminative power in the MCIA, while the ARG type and pathogen proportions in the prokaryotic community provided additional information for assessing the effect of the WWTP effluent on the stream sediment.

5. Conclusions

The effluents of WWTPs are major contributors of nutrients as well as microbes, including ARG-carrying bacteria, archaea, and pathogens, to receiving streams’ ecosystems. In both stream water and sediments, the WWTP effluent’s impact on the microbial community abundance and structure, its antibiotic resistome composition and abundance, as well as the pathogenic community structure, was highest at a close vicinity location (0.3 km) downstream of the WWTP discharge point. Further downstream, gradual recovery of impacted communities along the distance gradient from WWTP was recorded, culminating in the mostly comparable state of river water and sediment parameters 3.7 km downstream of WWTP to the stream water and sediments upstream of the WWTP discharge point. Our results also suggest that archaea form a substantial proportion of the microbial community of WWTP effluent and receiving stream and contribute to the spread of antibiotic resistance determinants. The role of archaea as well as the state and abundance of pathogenic communities in WWTP effluent-receiving waterbodies merits further in-depth research with combined community analysis and quantitative methods approach.
Modelling of the dissemination of antibiotic-resistance-carrying microbes along the riverine system would be another important issue to study. A recent analytical approach modelling the impact of a WWTP on water quality in a stream using microbial indicators [47] could be extended to study the fate of ARG-carrying microbes in streams and rivers. However, to perform such kind of study, larger datasets (more sampling points and sampling occasions as well as measurements of hydrological and catchment area parameters) than in the current study are needed.

Supplementary Materials

The following are available online at https://0-www-mdpi-com.brum.beds.ac.uk/2073-4441/13/6/865/s1, Table S1: Characteristics of qPCR primer pairs and programs; Table S2: The numbers of total reads and reads after quality trimming, coverage and diversity metrics, the proportions of classified reads (%), and the numbers of contigs in metagenomes of studied samples; Table S3: The means and standard deviations (in parentheses) of physicochemical parameters in influent (IN) and effluent (E) of wastewater treatment plant (A), as well as values of individual measurements of physicochemical parameters of IN and E (B) over the 11 month period; Table S4A: The means and standard deviations (in parentheses) of the target gene abundances and relative abundances in prokaryotic community of wastewater treatment plant influent (IN; n = 3) and effluent (E; n = 4) over a 11 month period; Table S4B: The target gene abundances (copies/mL) and relative abundances in prokaryotic community (%, given in parentheses) of individual samples of wastewater treatment plant influent (IN) and effluent (E) over a 11 month period; Table S5: The proportions of the most abundant bacterial genera (≥1% at least in one sample) in the bacterial communities of studied samples; Table S6: The proportions of the most abundant archaeal genera (≥1% at least in one sample) in the archaeal communities of studied samples; Table S7: The abundances of bacterial and archaeal 16S rRNA genes (B16S and A16S, respectively) and antibiotic resistance genes (ARGs) in the studied water and sediment samples; Table S8: The relative abundances of archaea (arc%) and antibiotic resistance genes (ARGs) in prokaryotic communities of water and sediment samples; Table S9: Proportions of antibiotic resistance genes (ARGs, per 16S rRNA reads) in the metagenomes of studied samples; Table S10. Statistically significant Pearson correlations (R) between physicochemical parameters in water as well as sediment and (A) target gene abundances, and (B) target gene relative abundances in prokaryotic community; Table S11: Proportions of pathogens in the bacterial communities of studied samples; Figure S1: A map showing the locations of the wastewater treatment plant (WWTP) of Nõo and sampling points on the Nõo steam and Elva river; Figure S2: The bacterial (A) and archaeal (B) community taxonomy of wastewater treatment plant (WWTP) effluent (E), stream water upstream (SWU), and downstream (SW0.3) of WWTP discharge, as well as stream sediment upstream (SSU) and downstream (SS0.3–SS3.2) of WWTP discharge and river sediment upstream (RSU) and downstream (RS3.7) of stream inflow at phylum level; Figure S3: Multiple co-inertia analysis results based on six sediment-specific datasets.

Author Contributions

Conceptualization, J.T.; methodology, H.N., M.T. and J.T.; formal analysis, A.P., K.T. and H.N.; investigation, K.T. and H.N.; data curation, A.P.; writing—original draft preparation, K.T. and H.N.; writing—review and editing, M.T., M.K.-V. and J.T.; visualization, H.N. and K.T.; supervision, J.T.; Project administration, J.T.; funding acquisition, J.T. and M.K.-V. All authors have read and agreed to the published version of the manuscript.

Funding

This study was supported by the Estonian Research Council grants PRG548 and PUT1125.

Institutional Review Board Statement

Not applicable.

Informed Consent Statement

Not applicable.

Data Availability Statement

The data presented in this study are openly available in https://ebi.ac.uk/ena, PRJEB42480.

Acknowledgments

We thank Mae Uri for the chemical analysis of the collected samples.

Conflicts of Interest

The authors declare no conflict of interest.

References

  1. Guitor, A.K.; Raphenya, A.R.; Klunk, J.; Kuch, M.; Alcock, B.; Surette, M.G.; McArthur, A.G.; Poinar, H.N.; Wright, G.D. Capturing the Resistome: A Targeted Capture Method to Reveal Antibiotic Resistance Determinants in Metagenomes. Antimicrob. Agents Chemother. 2019, 64, e01324-19. [Google Scholar] [CrossRef] [Green Version]
  2. Ventola, C.L. Antibiotic Resistance Crisis Part 1: Causes and Threats. Pharm. Ther. 2015, 40, 277–283. [Google Scholar]
  3. Antimicrobial Resistance. Tackling the Burden in the European Union. Available online: https://www.oecd.org/health/health-systems/AMR-Tackling-the-Burden-in-the-EU-OECD-ECDC-Briefing-Note-2019.pdf (accessed on 1 February 2021).
  4. No Time to Wait: Securing the Future from Drug Resistant Infections. Available online: https://www.who.int/docs/default-source/documents/no-time-to-wait-securing-the-future-from-drug-resistant-infections-en.pdf?sfvrsn=5b424d7_6 (accessed on 1 February 2021).
  5. Sengupta, S.; Chattopadhyay, M.K.; Grossart, H.P. The multifaceted roles of antibiotics and antibiotic resistance in nature. Front. Microbiol. 2013, 4, 47. [Google Scholar] [CrossRef] [PubMed] [Green Version]
  6. Osińska, A.; Korzeniewska, E.; Harnisz, M.; Felis, E.; Bajkacz, S.; Jachimowicz, P.; Niestępski, S.; Konopka, I. Small-scale wastewater treatment plants as a source of the dissemination of antibiotic resistance genes in the aquatic environment. J. Hazard. Mater. 2020, 381, 121221. [Google Scholar] [CrossRef]
  7. Almakki, A.; Jumas-Bilak, E.; Marchandin, H.; Licznar-Fajardo, P. Antibiotic resistance in urban runoff. Sci. Total Environ. 2019, 667, 64–76. [Google Scholar] [CrossRef]
  8. Fang, H.; Zhang, Q.; Nie, X.; Chen, B.; Xiao, Y.; Zhou, Q.; Liao, W.; Liang, X. Occurrence and elimination of antibiotic resistance genes in a long-term operation integrated surface flow constructed wetland. Chemosphere 2017, 173, 99–106. [Google Scholar] [CrossRef]
  9. Karkman, A.; Do, T.T.; Walsh, F.; Virta, M.P.J. Antibiotic resistance genes in waste water. Trends Microbiol. 2018, 26, 220–228. [Google Scholar] [CrossRef] [Green Version]
  10. Harnisz, M.; Kiedrzynska, E.; Kiedrzynska, M.; Korzeniewska, E.; Czatzkowska, M.; Koniuszewska, I.; Jozwik, A.; Szklarek, S.; Niestepski, S.; Zalewski, M. The impact of WWTP size and sampling season on the prevalence of antibiotic resistance genes in wastewater and the river system. Sci. Total Environ. 2020, 741, 140446. [Google Scholar] [CrossRef]
  11. Estonian Environmental Information, Wastewater Treatment. Available online: http://register.keskkonnainfo.ee/envreg/main?list=KOGA&mount=view (accessed on 1 February 2021).
  12. Berglund, B.; Fick, J.; Lindgren, P.-E. Urban wastewater effluent increases antibiotic resistance gene concentrations in a receiving Northern European river. Environ. Toxicol. Chem. 2015, 34, 192–196. [Google Scholar] [CrossRef] [Green Version]
  13. Proia, L.; von Schiller, D.; Sanchez-Melsio, A.; Sabater, S.; Borrego, C.M.; Rodriguez-Mozaz, S.; Balcazar, J.L. Occurrence and persistence of antibiotic resistance genes in river biofilms after wastewater inputs in small rivers. Environ. Pollut. 2016, 210, 121–128. [Google Scholar] [CrossRef]
  14. Brown, P.C.; Borowska, E.; Schwartz, T.; Horn, H. Impact of the particulate matter from wastewater discharge on the abundance of the antibiotic resistance genes and facultative pathogenic bacteria in downstream river sediments. Sci. Total Environ. 2019, 649, 1171–1178. [Google Scholar] [CrossRef]
  15. Price, J.R.; Ledford, S.H.; Ryan, M.O.; Toran, L.; Sales, C.M. Wastewater treatment plant effluent introduces recoverable shifts in microbial community composition in receiving streams. Sci. Total Environ. 2018, 613–614, 1104–1116. [Google Scholar] [CrossRef]
  16. Mansfeldt, C.; Deiner, K.; Mächler, E.; Fenner, K.; Eggen, R.I.L.; Stamm, C.; Schönenberger, U.; Walser, J.-C.; Altermatt, F. Microbial community shifts in streams receiving treated wastewater effluent. Sci. Total Environ. 2020, 709, 135727. [Google Scholar] [CrossRef]
  17. Ruijter, J.M.; Ramakers, C.; Hoogaars, W.M.H.; Karlen, Y.; Bakker, O.; van den Hoff, M.J.B.; Moorman, A.F.M. Amplification efficiency: Linking baseline and bias in the analysis of quantitative PCR data. Nucleic Acids Res. 2009, 37, e45. [Google Scholar] [CrossRef] [Green Version]
  18. Nõlvak, H.; Truu, M.; Kanger, K.; Tampere, M.; Espenberg, M.; Loit, E.; Raave, H.; Truu, J. Inorganic and organic fertilizers impact the abundance and proportion of antibiotic resistance and integron-integrase genes in agricultural grassland soil. Sci. Total Environ. 2016, 562, 678–689. [Google Scholar] [CrossRef]
  19. Andrews, S. FastQC: A Quality Control Tool for High Throughput Sequence Data. Available online: http://www.bioinformatics.babraham.ac.uk/projects/fastqc (accessed on 1 February 2021).
  20. Martin, M. Cutadapt removes adapter sequences from high-throughput sequencing reads. EMBnet J. 2011, 17, 10. [Google Scholar] [CrossRef]
  21. Rodriguez, L.M.; Gunturu, S.; Tiedje, J.M.; Cole, J.R.; Konstantinidis, K.T. Nonpareil 3: Fast estimation of metagenomic coverage and sequence diversity. mSystems 2018, 3, e00039. [Google Scholar] [CrossRef] [PubMed] [Green Version]
  22. Menzel, P.; Ng, K.L.; Krogh, A. Fast and sensitive taxonomic classification for metagenomics with Kaiju. Nat. Commun. 2016, 7, 11257. [Google Scholar] [CrossRef] [Green Version]
  23. Li, D.; Luo, R.; Liu, C.-M.; Leung, C.-M.; Ting, H.-F.; Sadakane, K.; Yamashita, H.; Lam, T.W. MEGAHIT W1.0: A fast and scalable metagenome assembler driven by advanced methodologies and community practices. Methods 2016, 102, 3–11. [Google Scholar] [CrossRef]
  24. Yin, X.; Jiang, X.-T.; Chai, B.; Li, L.; Yang, Y.; Cole, J.R.; Tiedje, J.M.; Zhang, T. ARGs-OAP W2.0 with an expanded SARG database ad Hidden Markov Models for enhancement characterization and quantification of antibiotic resistance genes in environmental metagenomes. Bioinformatics 2018, 34, 2263–2270. [Google Scholar] [CrossRef] [Green Version]
  25. Revelle, W. Psych: Procedures for Psychological, Psychometric, and Personality Research; R Package Version 2.0.12; Northwestern University: Evanston, IL, USA, 2020; Available online: https://CRAN.R-project.org/package=psych (accessed on 1 February 2021).
  26. Kolde, R. Pheatmap: Pretty Heatmaps. R Package Version 1.0.12. Available online: https://CRAN.R-project.org/package=pheatmap (accessed on 1 February 2021).
  27. Kassambara, A. Factoextra: Extract and Visualize the Results of Multivariate Data Analyses. R Package Version 1.0.7. Available online: https://CRAN.R-project.org/package=factoextra (accessed on 1 February 2021).
  28. Meng, C.; Kuster, B.; Culhane, A.C.; Gholami, A.M. A multivariate approach to the integration of multi-omics datasets. BMC Bioinform. 2014, 15, 162. [Google Scholar] [CrossRef] [PubMed] [Green Version]
  29. Naaber, P.; Mitt, P. The Use of Antibiotics in Estonia and its Effect on the Spread of Drug-resistant Microbials. In 20 Years of Estonian Statistics on Medicines; Republic of Estonia Agency of Medicines: Tartu, Estonia, 2015; pp. 57–63. [Google Scholar]
  30. Numberger, D.; Ganzert, L.; Zoccarato, L.; Mühldorfer, K.; Sauer, S.; Grossart, H.P.; Greenwood, A.D. Characterization of bacterial communities in wastewater with enhanced taxonomic resolution by full-length 16S rRNA sequencing. Sci. Rep. 2019, 9, 9673. [Google Scholar] [CrossRef] [PubMed] [Green Version]
  31. Gonzalez-Martinez, A.; Sihvonen, M.; Muñoz-Palazon, B.; Rodriguez-Sanchez, A.; Mikola, A.; Vahala, R. Microbial ecology of full-scale wastewater treatment systems in the Polar Arctic Circle: Archaea, Bacteria and Fungi. Sci. Rep. 2018, 8, 2208. [Google Scholar] [CrossRef] [Green Version]
  32. Vítězová, M.; Kohoutová, A.; Vítěz, T.; Hanišáková, N.; Kushkevych, I. Methanogenic microorganisms in industrial wastewater anaerobic treatment. Processes 2020, 8, 1546. [Google Scholar] [CrossRef]
  33. Proia, L.; Anzil, A.; Subirats, J.; Borrego, C.; Farrè, M.; Llorca, M.; Balcázar, J.L.; Servais, P. Antibiotic resistance along an urban river impacted by treated wastewaters. Sci. Total Environ. 2018, 628–629, 453–466. [Google Scholar] [CrossRef] [PubMed]
  34. Sabri, N.A.; Schmitt, H.; van der Zaan, B.; Gerritsen, H.W.; Zuidema, T.; Rijnaarts, H.H.M.; Langenhoff, A.A.M. Prevalence of antibiotics and antibiotic resistance genes in a wastewater effluent-receiving river in the Netherlands. J. Environ. Chem. Eng. 2020, 8, 102245. [Google Scholar] [CrossRef]
  35. Yu, K.; Li, P.; He, Y.; Zhang, B.; Chen, Y.; Yang, J. Unveiling dynamics of size-dependent antibiotic resistome associated with microbial communities in full-scale wastewater treatment plants. Water Res. 2020, 187, 116450. [Google Scholar] [CrossRef]
  36. Ibekwe, A.M.; Ma, J.; Murinda, S.E. Bacterial community composition and structure in an Urban River impacted by different pollutant sources. Sci. Total Environ. 2016, 566–567, 1176–1185. [Google Scholar] [CrossRef] [Green Version]
  37. Pascual-Benito, M.; Ballesté, E.; Monleón-Getino, T.; Urmeneta, J.; Blanch, A.R.; García-Aljaro, C.; Lucena, F. Impact of treated sewage effluent on the bacterial community composition in an intermittent mediterranean stream. Environ. Pollut. 2020, 266, 115254. [Google Scholar] [CrossRef]
  38. Neuenschwander, S.M.; Ghai, R.; Pernthaler, J.; Salcher, M.M. Microdiversification in genome-streamlined ubiquitous freshwater Actinobacteria. ISME J. 2018, 12, 185–198. [Google Scholar] [CrossRef] [Green Version]
  39. Yang, S.; Liebner, S.; Winkel, M.; Alawi, M.; Horn, F.; Dörfer, C.; Ollivier, J.; He, J.-S.; Jin, H.; Kühn, P.; et al. In-depth analysis of core methanogenic communities from high elevation permafrost-affected wetlands. Soil Biol. Biochem. 2017, 111, 66–77. [Google Scholar] [CrossRef]
  40. Angle, J.C.; Morin, T.H.; Solden, L.M.; Narrowe, A.B.; Smith, G.J.; Borton, M.A.; Rey-Sanchez, C.; Daly, R.A.; Mirfenderesgi, G.; Hoyt, D.W.; et al. Methanogenesis in oxygenated soils is a substantial fraction of wetland methane emissions. Nat. Commun. 2017, 8, 1567. [Google Scholar] [CrossRef] [PubMed] [Green Version]
  41. Corno, G.; Yang, Y.; Eckert, E.M.; Fontaneto, D.; Fiorentino, A.; Galafassi, S.; Zhang, T.; Di Cesare, A. Effluents of wastewater treatment plants promote the rapid stabilization of the antibiotic resistome in receiving freshwater bodies. Water Res. 2019, 158, 72–81. [Google Scholar] [CrossRef] [PubMed]
  42. Hu, A.; Wang, H.; Li, J.; Mulla, S.I.; Qiu, Q.; Tang, L.; Rashid, A.; Wu, Y.; Sun, Q.; Yu, C.P. Homogeneous selection drives antibiotic resistome in two adjacent sub-watersheds, China. J. Hazard. Mater. 2020, 398, 122820. [Google Scholar] [CrossRef] [PubMed]
  43. Jiang, H.; Zhou, R.; Zhang, M.; Cheng, Z.; Li, J.; Zhang, G.; Chen, B.; Zou, S.; Yang, Y. Exploring the differences of antibiotic resistance genes profiles between river surface water and sediments using metagenomic approach. Ecotoxicol. Environ. Saf. 2018, 161, 64–69. [Google Scholar] [CrossRef] [PubMed]
  44. Yang, S.; Wen, Q.; Chen, Z. Impacts of Cu and Zn on the performance, microbial community dynamics and resistance genes variations during mesophilic and thermophilic anaerobic digestion of swine manure. Bioresour. Technol. 2020, 312, 123554. [Google Scholar] [CrossRef] [PubMed]
  45. Anderson, M.T.; Mitchell, L.A.; Zhao, L.; Mobley, H.L.T. Citrobacter freundii fitness during bloodstream infection. Sci. Rep. 2018, 8, 11792. [Google Scholar] [CrossRef]
  46. Liu, L.; Chen, D.; Liu, L.; Lan, R.; Hao, S.; Jin, W.; Sun, H.; Wang, Y.; Liang, Y.; Xu, J. Genetic diversity, multidrug resistance, and virulence of citrobacter freundii from diarrheal patients and healthy individuals. Front. Cell. Infect. Microbiol. 2018, 8, 233. [Google Scholar] [CrossRef] [Green Version]
  47. Pascual-Benito, M.; Nadal-Sala, D.; Tobella, M.; Ballesté, E.; García-Aljaro, C.; Sabaté, S.; Sabater, F.; Martí, E.; Gracia, C.A.; Blanch, A.R.; et al. Modelling the seasonal impacts of a wastewater treatment plant on water quality in a Mediterranean stream using microbial indicators. J. Environ. Manag. 2020, 261, 110220. [Google Scholar] [CrossRef]
Figure 1. The abundances of bacterial and archaeal 16S rRNA genes (B16S and A16S, respectively) and antibiotic resistance genes (ARGs) and relative abundances of ARGs in the water (A,C) and sediment samples (B,D). E is the effluent of the wastewater treatment plant (WWTP), SW and RW are water samples and SS and RS are sediment samples of the stream and river, respectively. SWU and SSU are the samples taken upstream of the WWTP discharge point, and RWU and RSU are the samples taken from the river upstream of the stream inflow point. The number in the subscript of the sample code shows the distance (km) of the sampling point downstream from the WWTP discharge point.
Water 13 00865 g001
Figure 2. Heatmaps showing the proportions of major bacterial (A,B) and archaeal (C,D) genera (>1% and >3% in at least one sample, respectively) in the bacterial and archaeal communities of water (A,C) and sediment (B,D) samples. E is the effluent of the wastewater treatment plant (WWTP), SW and RW are the water samples and SS and RS are the sediment samples of the stream and river, respectively. SWU and SSU are the samples taken upstream of the WWTP discharge point, and RWU and RSU are the samples taken from the river upstream of the stream inflow point. The number in the subscript of the sample code shows the distance (km) of the sampling point downstream from the WWTP discharge point.
Water 13 00865 g002
Figure 3. The structure of the resistome presented as the proportions of antibiotic resistance types (A) and as proportions of antibiotic resistance mechanisms (B) in the studied samples. E is the effluent of the wastewater treatment plant (WWTP), SW and RW are water samples and SS and RS are sediment samples of the stream and river, respectively. SWU and SSU are the samples taken upstream of the WWTP discharge point, and RWU and RSU are the samples taken from the river upstream of the stream inflow point. The number in the subscript of the sample code shows the distance (km) of the sampling point downstream from the WWTP discharge point. MLS—macrolide–lincosamide–streptogramin; ABC—ATP-binding cassette-type efflux complex; MFS—major facilitator superfamily efflux complex; RND—resistance–nodulation–division superfamily efflux complex.
Water 13 00865 g003
Figure 4. Statistically significant partial correlations of quantified abundances of antibiotic resistance genes (ARG) in the stream and river water (A) and stream and river sediments (B). The abundances of bacterial- and archaeal-specific 16S rRNA genes (B16S and A16S, respectively) are used as covariables. In case of A16S, the correlations with ARGs are shown and B16S is used as a covariable. The statistically significant Pearson correlations between relative abundances of ARGs (and A16S) in prokaryotic communities of the stream and river water (C) and sediments (D) are shown. * p < 0.05; ** p < 0.01; *** p < 0.001.
Water 13 00865 g004
Figure 5. A plot based on a principal component analysis (A) showing ordination of the samples according to the proportions of pathogens in the bacterial communities. Solid lines connect samples along the distance gradient, and dashed lines depict the effect of E and RSU. Heatmaps showing clustering of the water and sediment samples (B,C, respectively) according to their proportions (%) of the top 25 pathogens in the bacterial communities. E is the effluent of the wastewater treatment plant (WWTP), SW and RW are the water samples and SS and RS are the sediment samples of the stream and river, respectively. SWU and SSU are the sediment samples taken upstream of the WWTP discharge point, and RWU and RSU are the samples taken from the river upstream of the stream inflow point. The number in the subscript of the sample code shows the distance (km) of the sampling point downstream from the WWTP discharge point.
Water 13 00865 g005
Figure 6. Multiple co-inertia analysis results based on six sediment-specific datasets (microbial genera and pathogen proportions in prokaryotic community, antibiotic resistance type and ARG subtype proportions, ARG gene abundances, and sediment physicochemical parameters). (A) A plot of the first two components in sample space. Each sample is represented by a shape where the six datasets for each sample are connected by lines to a center point (global score). (B) A scree plot of absolute eigenvalues (bars) and the proportions of variance for the eigenvectors (line). (C) A plot of data weighting space that shows the pseudo-eigenvalues space of all datasets indicating how much variance of an eigenvalue is contributed by each dataset.
Water 13 00865 g006
Table 1. The physicochemical parameters of the studied water and sediment samples on the main sampling day. E is the effluent of the wastewater treatment plant (WWTP), SW and RW are water samples, and SS and RS are sediment samples of the stream and river, respectively. SWU and SSU are the samples taken upstream of the WWTP discharge point, and RWU and RSU are the samples taken from the river upstream of the stream inflow point. The number in the subscript of the sample code shows the distance (km) of the sampling point downstream from the WWTP discharge point. ORP—oxidation reduction potential; Ntot—total nitrogen; Ptot—total phosphorus; TOC—total organic carbon; DOC—dissolved organic carbon.
Physicochemical Parameter
Water Samples
SampleTemp. (°C)O2 (mg/L)pHORP (mV)Ntot (mg/L)NH4–N (mg/L)NO3–N (mg/L)Ptot (mg/L)PO43−–P (mg/L)SO42− (mg/L)TOC (mg/L)DOC (mg/L)
E18.06.47.5590.54.61.423.092.702.600711713
SWU8.77.77.7861.01.50.030.910.0490.0241210.310.1
SW0.39.86.87.7585.82.00.161.330.540.3102110.510.3
SW2.76.611.77.8888.42.60.102.340.180.160267.87.6
SW3.26.411.67.8688.12.60.072.550.180.150247.37.2
RWU8.69.47.8991.11.10.030.680.020.008115.45.3
RW3.77.89.67.8892.41.20.030.650.030.018155.65.5
Sediment Samples
SamplepHNtot (mg/kg dw)Ptot (mg/kg dw)TOC (%)
SSU7.441009506.8
SS0.36.816,600840017.0
SS2.78.1210270<1.0
SS3.27.513008103.2
RSU7.723004804.2
RS3.77.4710022009.7
Table 2. Statistically significant Pearson correlations and partial correlations (given in bold italic) between physicochemical parameters and abundances of the target genes (A), as well as relative abundances of the target genes in prokaryotic communities (B) of the water and sediment samples. In the case of abundances of ARGs, the partial correlations 16Stot were used as covariables, and in the case of relative abundances of ARGs, the relative abundance of bacterial 16S rRNA gene in the total prokaryotic community was used as a covariable. Temp—temperature; Ntot—total nitrogen; Ptot—total phosphorus; TOC—total organic carbon; B16S—bacteria-specific 16S rRNA gene; A16S—archaea-specific 16S rRNA gene.
Target GenePhysicochemical Parameter
WaterSediment
Temp.O2NtotNH4–NNO3–NPtotPO43−–PpHPtot
A
B16S 0.86 * 0.95 **0.87 *−0.83 *
A16S 0.95 ** 0.99 ***0.93 **−0.83 *
aadA 0.88 *
blaCTX-M 0.90 *0.97 **
sul2 0.92 * 0.95 *0.90 *
B
B16S −0.96 ** −0.93 **−0.91 * −0.83 *
A16S 0.96 ** 0.93**0.91 * 0.83 *
aadA 0.93 *
blaCTX-M 0.96 * 0.98 ** 0.90 *
sul1 0.96 **
tetW0.93 *−0.89 *
* p < 0.05; ** p < 0.01; *** p < 0.001.
Publisher’s Note: MDPI stays neutral with regard to jurisdictional claims in published maps and institutional affiliations.

