
Culex Mosquitoes at Stormwater Control Measures and Combined Sewer Overflow Outfalls after Heavy Rainfall


1
Department of Chemical and Environmental Engineering, School of Engineering and Applied Science, Yale University, New Haven, CT 06511, USA
2
School of the Environment, Yale University, New Haven, CT 06511, USA
*
Author to whom correspondence should be addressed.
Water 2022, 14(1), 31; https://0-doi-org.brum.beds.ac.uk/10.3390/w14010031
Submission received: 18 November 2021
/
Revised: 13 December 2021
/
Accepted: 20 December 2021
/
Published: 23 December 2021
(This article belongs to the Special Issue Urban Green and Blue Infrastructure: Current Issues, Challenges, and Opportunities)
Abstract
:Mosquito borne diseases are increasingly problematic as climate change continues to alter patterns of precipitation, flooding, and temperatures that may favor mosquito habitats. Stormwater control measures (SCMs), ecologically sustainable methods of stormwater management, may have varying impacts on Culex mosquitoes, such as in areas with combined sewer overflows (CSOs). We studied spatial and temporal associations of SCMs and Culex mosquito counts surrounding the SCMs, stratifying our examination amongst those that do/do not use pooling and/or vegetation, as well as surrounding CSO outfalls after heavy rainfall (≥95th percentile) during summer 2018. Results indicate Culex mosquito counts after heavy rainfall were not significantly different at SCMs that use vegetation and/or ponding from at those that do not. We also found a 35.5% reduction in the increase of Culex mosquitoes the day of, and 77.0% reduction 7–8 days after, heavy rainfall at CSO outfalls treated with medium SCM density compared to those without SCMs. Our results suggest that SCMs may be associated with a reduction in the increase of Culex mosquitoes at the CSO outfalls after heavy rainfall. More research is needed to study how the impacts of SCMs on mosquito populations may affect human health.
1. Introduction
Mosquito borne diseases, such as West Nile virus and Zika, are increasingly problematic in the United States due to climate change [1,2,3]. West Nile virus infects an average of approximately 2500 people and kills an average of 116 people in the United States each year [4]. Climate change is expected to continue to alter patterns of precipitation, flooding, and temperatures that may favor mosquito habitats [5].
Stormwater control measures (SCMs), also known as stormwater Best Management Practices [6], capture, retain, and/or treat stormwater runoff using ecologically sustainable methods such as infiltration and bioremediation [7]. Examples of SCMs include the use of green infrastructure and low impact development. SCMs function by increasing storage, promoting groundwater recharge, lowering peak flow rates, and/or decreasing volumes of runoff on-site [8,9]. As a result, SCMs may decrease biochemical oxygen demands and improve the water quality of nearby waterbodies [10,11].
Though multiple studies have explored the ecological and stormwater benefits of SCMs [8,9,10,11], limited studies have been conducted about their impact on mosquitoes. SCMs that utilize pooling, such as rain barrels, may provide standing water for mosquitoes to lay eggs in and to mature [12,13,14,15]. SCMs that utilize vegetation, such as green roofs and rain gardens, may provide mosquitoes with shelter from the elements along with decaying vegetation as a larvae food source [12,15,16,17]. To the best of our knowledge, a very limited number of studies have been conducted on SCMs and mosquitoes. One study on the role of urban wet environments as habitats for Culex mosquitoes included some forms of stormwater control measures (i.e., retention ponds, detention ponds) [18]. Based on previously learned knowledge mentioned above, this referenced study hypothesized positive samples of Culex larvae. However, the majority of the sites yielded no mosquito larvae [18], revealing the complexity of this research topic and the need for additional studies.
A combined sewer system (CSS) transports stormwater and sewer water to a wastewater treatment plant in the same pipes [19,20]. Combined sewer overflows (CSOs) occur in areas with CSSs during large storm events where high volumes of stormwater runoff are collected from within the sewer-shed, flow into the pipes, exceed their capacity, and result in the release of untreated or undertreated sewer water mixed with stormwater into nearby waterbodies [21]. The United States Environmental Protection Agency (EPA) estimates that sewer overflows release 850 billion gallons of untreated sewer and stormwater into the environment annually [19,20]. Standing side-pools along waterbodies contaminated with CSOs are often desirable oviposition habitats for Culex mosquitoes due to the high biochemical oxygen demand, signifying an organically rich food supply for larvae and an unfavorable environment for large predators with higher oxygen demands [22]. Waterbodies that have been affected by CSOs may contribute to mosquito borne diseases [23,24,25]. By decreasing the peak flow rates and biochemical oxygen demands of runoff [10,11], SCMs may reduce the impact, frequency, and severity of CSOs [26,27,28,29].
Previous studies have revealed the importance of considering precipitation and temperature when studying Culex mosquitoes. Not only can heavy precipitation lead to CSOs, which may increase the numbers of Culex mosquitoes [22,30]. But variations in precipitation may lead to differences in formation of ideal habitats for oviposition [31,32,33,34]. Likewise, multiple studies have revealed a significant relationship between temperature and mosquito abundance [31,32,34,35].
While some studies have been conducted on the impact of SCMs on CSOs [26,27,28] and on the impact of CSOs on mosquitos or mosquito borne diseases [22,23,24], to the best of our knowledge only a very limited number of studies have directly assessed the influence of SCMs on the number of mosquitoes at both the SCM and the CSO outfalls. In this paper, we studied whether the number of Culex mosquitoes is associated with the presence of nearby SCMs and whether the number of Culex mosquitoes is associated with the treatment on the CSO outfall by SCMs within their respective subsewersheds. We also studied how the occurrence of heavy rainfall, which may likely lead to a CSO occurrence, would affect these relationships. Based on previous literature, we hypothesize that SCMs that use pooling and/or vegetation may increase the number of mosquitoes surrounding the SCM. In turn, we also hypothesize that CSO outfalls that are treated with more SCMs may have fewer surrounding mosquitoes. We hypothesize that SCMs may have this effect by helping to reduce the formation of the standing side pools that are polluted with organic matter from CSOs, decrease oviposition habitats for Culex mosquitoes, and therefore reduce the number of Culex mosquitoes surrounding the CSO outfalls.
2. Materials & Methods
2.1. Conceptual Representation
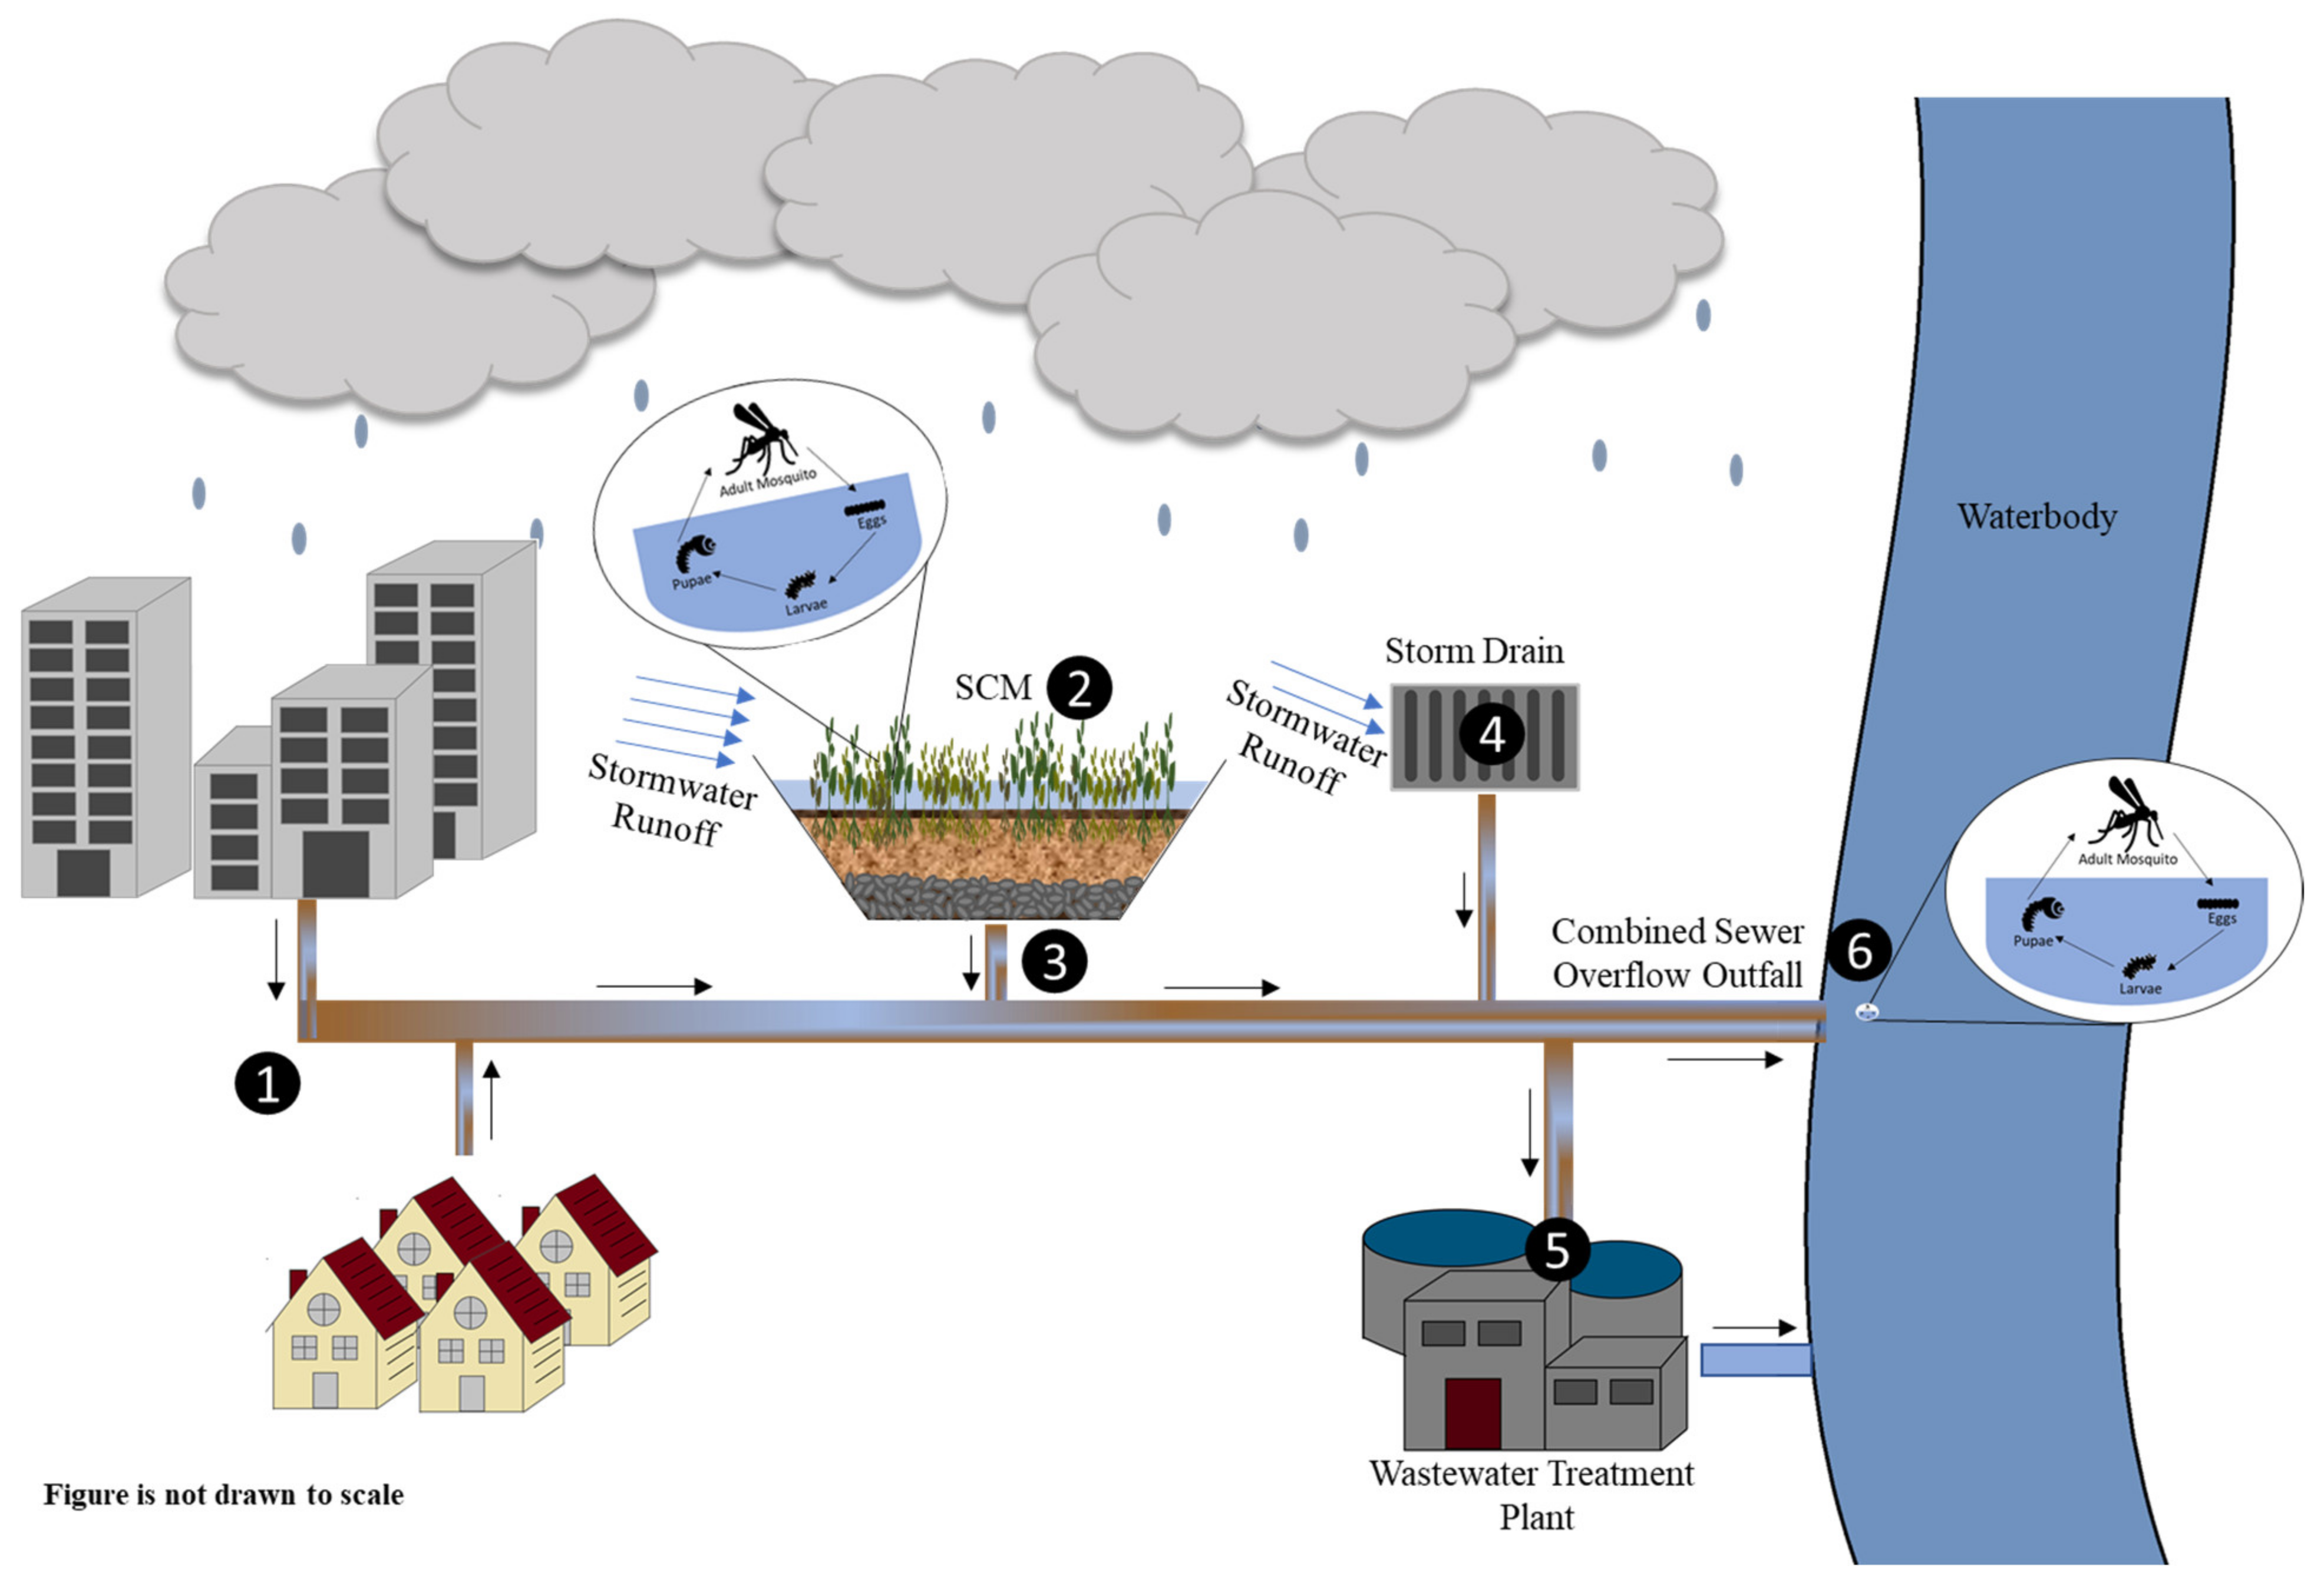
Though the general concept of a CSS may seem straightforward, (i.e., to transport wastewater and stormwater to a wastewater treatment plant), heavy rainfall, SCMs, and CSOs add to their complexity. Below, each point is described, and presented conceptually in Figure 1.
![Water 14 00031 g001]()
Figure 1.
Conceptual representation of combined sewer system (CSS) along with a stormwater control measure (SCM) at point 2 as well as a combined sewer overflow (CSO) outfall at point 6. The Culex mosquito life cycle is represented by the ovular diagrams at points 2 and 6 [36].
Figure 1.
Conceptual representation of combined sewer system (CSS) along with a stormwater control measure (SCM) at point 2 as well as a combined sewer overflow (CSO) outfall at point 6. The Culex mosquito life cycle is represented by the ovular diagrams at points 2 and 6 [36].

| The CSS collects wastewater and domestic sewage from factories, commercial and residential areas. This wastewater has not yet been treated and contains human and industrial waste [19,20]. | |
| SCMs capture stormwater runoff and rainfall, and decreases the peak flow rate and the volume of stormwater entering the piping system [8,9]. As runoff travels through the SCM, impurities may be filtered out and/or bioremediated [10,11]. Depending on the SCM type, stormwater may pool within the SCM allowing for retention, evaporation, and infiltration. Some SCMs may also contain vegetation that may use stormwater for transpiration [7,8,9,10,11]. SCMs that utilize pooling and/or contain decaying vegetation may be favorable oviposition sites for Culex mosquitoes [12,13,14,15,16,17]. | |
| Many types of SCMs, such as rain gardens, are directly connected to the combined sewer system in case the SCM overflows. Though some SCMs may trap mosquito eggs, larvae, and pupae within their substrates and vegetation and prevent them from entering the pipes, we also consider in our conceptual diagram that stormwater that overflows from SCMs and into the piping system may contain eggs and/or pre-mature mosquitoes. As such, these eggs and pre-mature mosquitoes might exit the system at either point 5, where they may be removed at the wastewater treatment plant, or point 6, where they may exit at a CSO outfall. | |
| Stormwater runoff is collected into storm drains. SCMs upslope may help decrease the amount of stormwater that flows directly into the storm drains [8,9]. Stormwater runoff that flows directly into the storm drains will flow into the CSS pipes at unhindered speeds [19,20]. | |
| The wastewater mixed with stormwater enters a wastewater treatment plant that will remove organic matter, pathogens, and toxic materials [19,20]. Once the water is treated, it is released back into the environment. | |
| During heavy rainfall, CSOs may occur. Untreated to barely treated storm and sewer water exits at the outfalls, at point 6, during CSO events [21]. These CSOs contain high amounts of organic matter [19,20]. Due to this, nearby standing side pools may provide mosquitoes with favorable oviposition habitats [22]. |
Counts of mosquitos can be taken at different points in the system of Figure 1, such as within the subsewershed where SCMs are located, indicated as circle 2, or at the outfall that drains into the subsewershed, indicated as circle 6. Residential and commercial buildings (point 1), SCMs (point 2), and storm drains (point 4) are located within the subsewershed that drains to a unique CSO outfall (point 6) during heavy rainfall. In our particular study, subsewersheds are defined as the land area that collects runoff into the piping system and is connected to a unique CSO outfall. We studied Culex mosquitoes surrounding point 2 at the SCMs, as well as surrounding point 6, at the CSO outfalls. We believe Culex mosquitoes may benefit from both points due to potential favorable oviposition habitats. We hypothesized that SCMs may have a decreasing impact on the Culex mosquito counts at point 6, the CSO outfalls, while SCMs may have an increasing impact on Culex mosquitoes at point 2, the SCMs themselves.
In this study, we investigated how the number of Culex mosquitoes varied by SCM proximity. We considered factors such as whether SCMs use pooling or vegetation. We also studied how treatment using SCMS may impact the number of Culex mosquitoes at the respective CSO outfalls. We investigated these first two research objectives by analyzing spatial associations of the number of Culex mosquitoes at the subsewersheds as well as at the CSO outfalls in relation to SCM count, accounting for subsewershed size. We also studied the effect of heavy rainfall, or a likely CSO occurrence, and how this would impact our relationships. We evaluated this by studying the temporal associations between the number of Culex mosquitoes at the SCMs as well as at the CSO outfalls after heavy rainfall using distributed lagged models. Temperature was included as a confounder.
2.2. Study Site
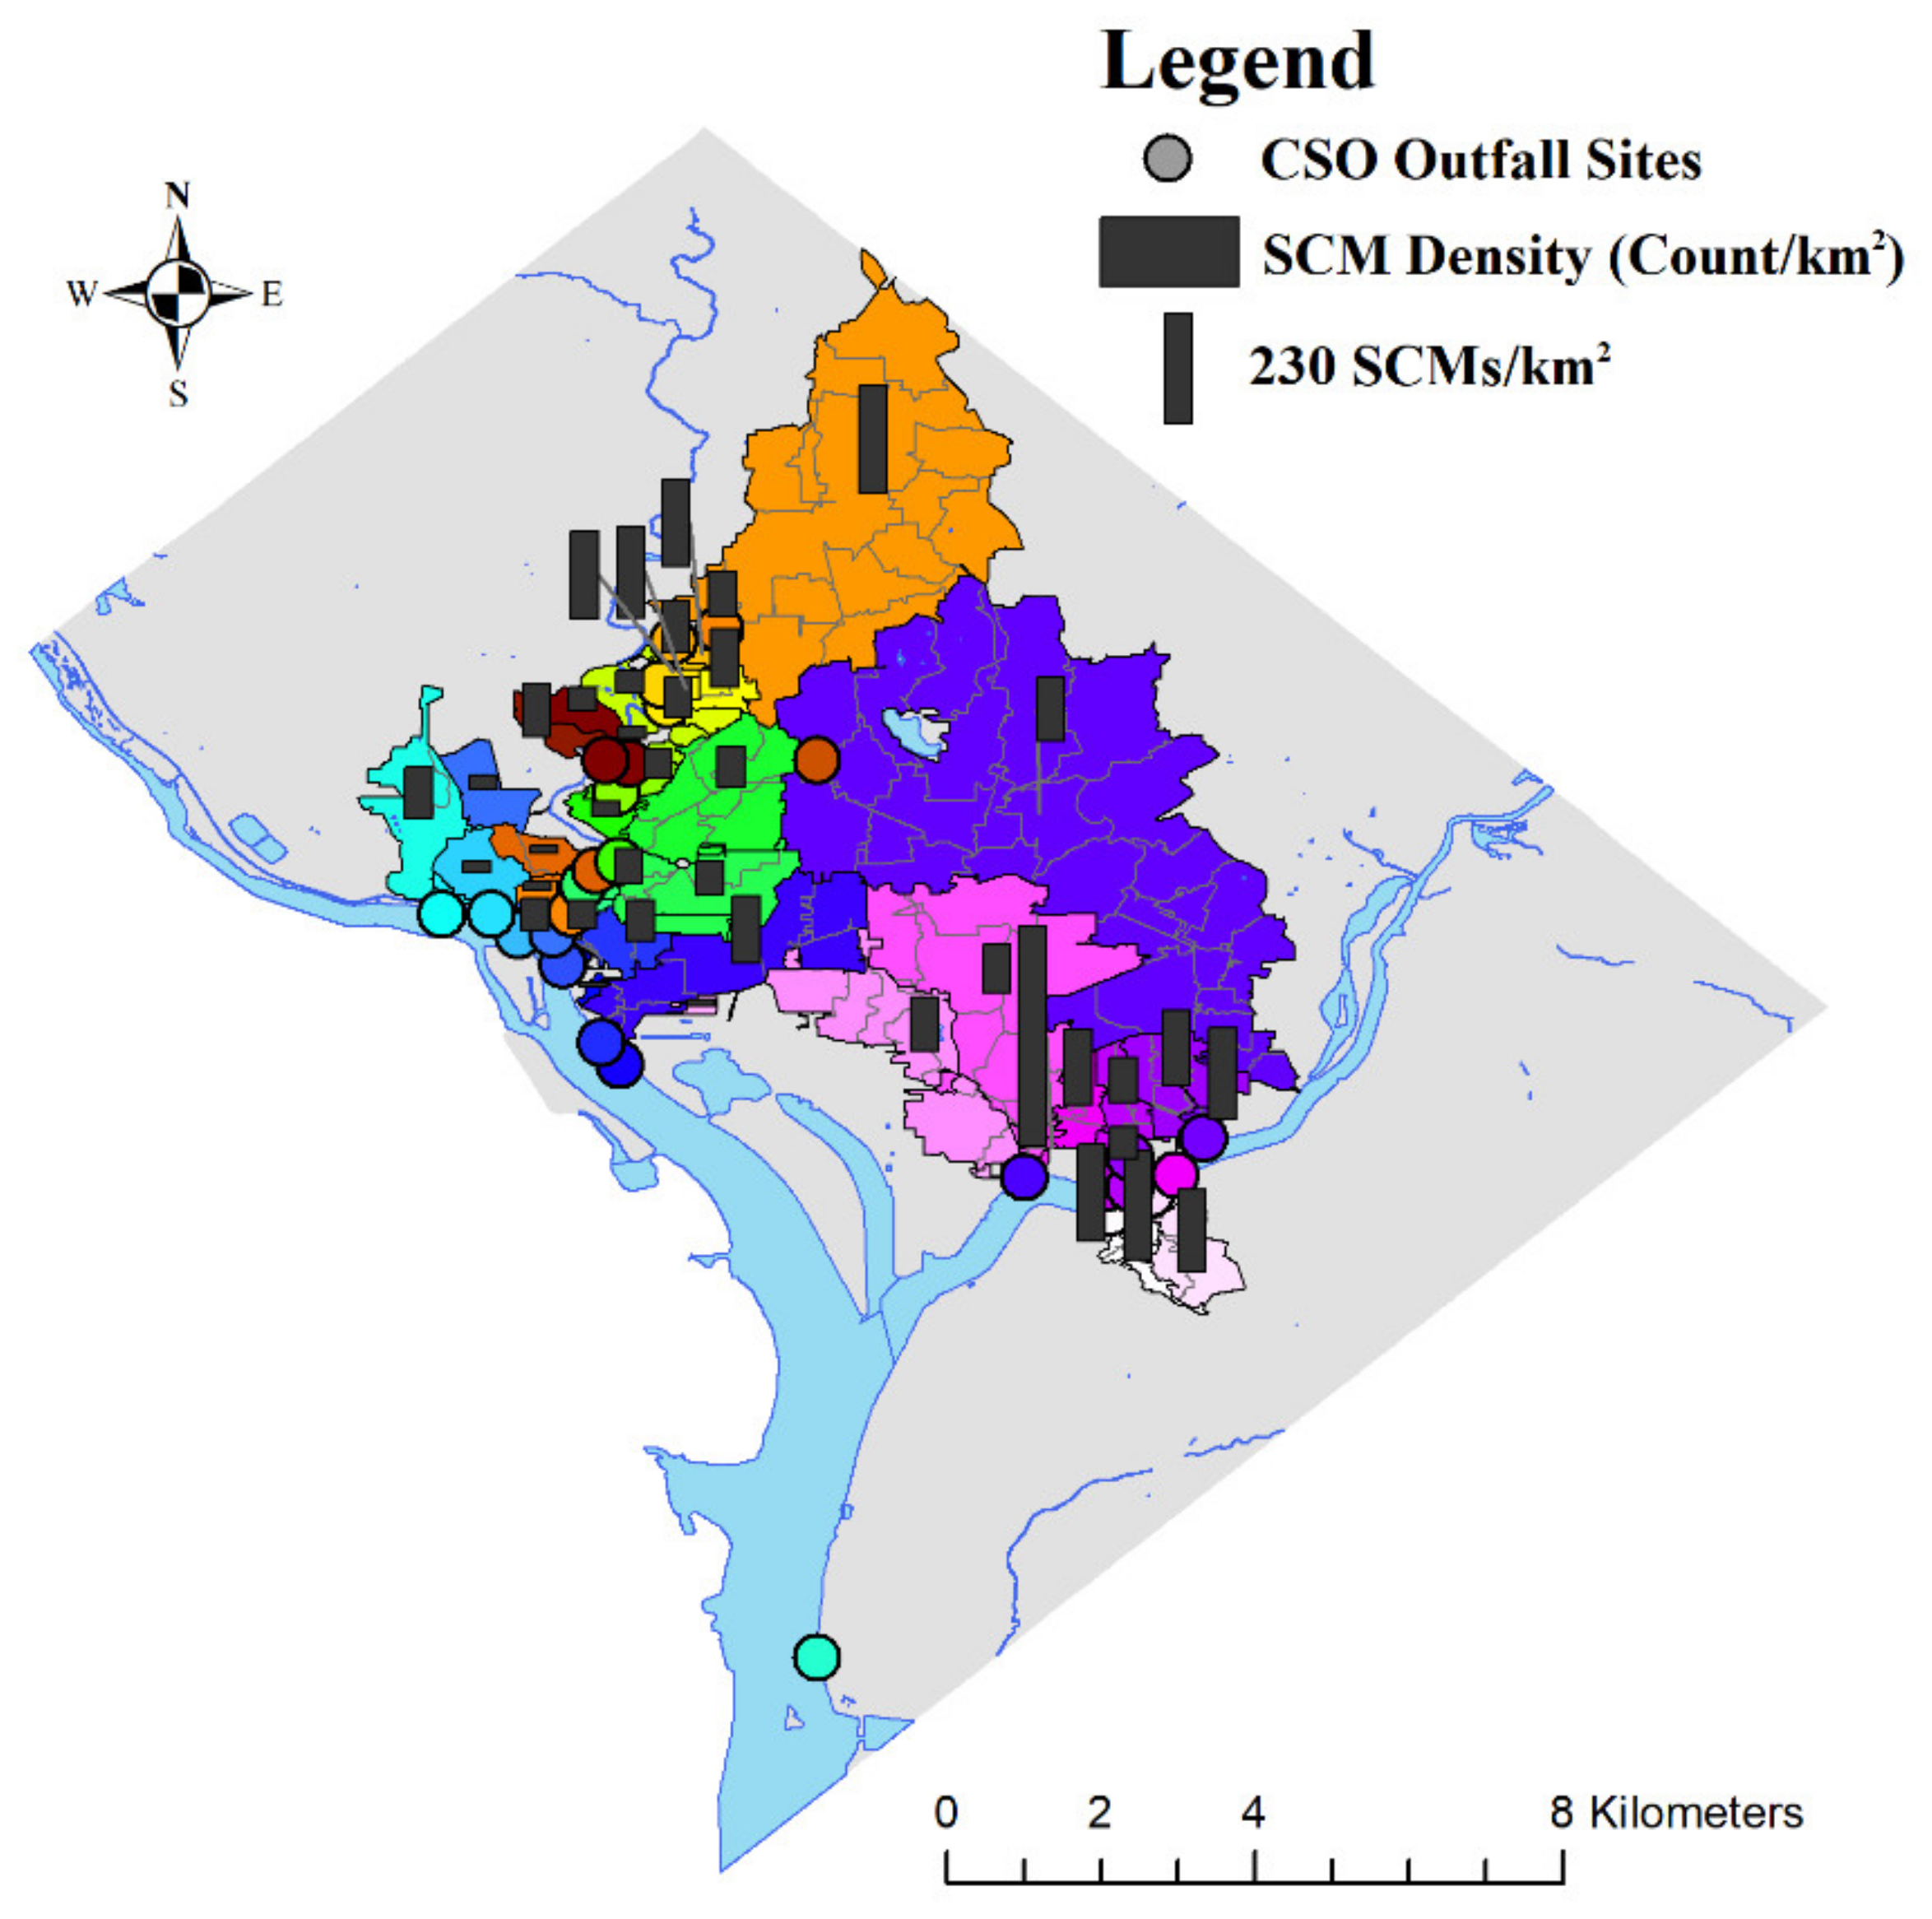
Our study site, Washington DC, has a dense population of 4463 people/km2 and 38.5% impervious area [37,38]. The district uses a CSS to manage 29.3% of its total area and has common CSO occurrences during heavy rain events [39]. The locations of CSO outfalls are sometimes separate from the locations of the subsewersheds that drain to them during large storm events, with corresponding colors (Figure 2). Mosquito counts are taken at the outfall of a subsewershed, shown as circles in Figure 2, or elsewhere within the subsewershed. DC was chosen as an appropriate study site because of its high level of urbanization, population density, and abundance and diversity of SCMs [39]. DC also had the highest number per area of West Nile virus cases, the most common mosquito borne disease contracted within the United States, in 2018 compared to any state within the continental United States [4].
2.3. Data
Locations of SCMs were obtained from the DC Department of Energy and the Environment. The dataset included SCM characteristics such as, name, installation date, and coordinate location. Subsewershed divisions and their ID numbers were obtained from DC’s Geographic Information System. Locations of SCMs were overlaid onto areas of subsewersheds and joined using ArcMap [40] to acquire the number of SCMs within each subsewershed. Examples of SCMs from Washington DC include green roofs, which bioremediate and decrease peak flow rates of stormwater from rooftops [8,9] and rain barrels, which are often placed at the bottom of downspouts to catch and store stormwater for later use [41,42]. A list and descriptions of SCMs that use pooling and/or vegetation in DC are shown in the Supplementary Materials (Table S1). Our study period was May–October 2018. SCMs that were installed before the start of the study period, May 2018, were used for our analyses.
Mosquito survey data from May-October 2018 in DC were acquired from the US Department of Health and Human Services [43]. We studied a female Culex mosquito count, the sex and genus that commonly spreads West Nile virus in the DC area and that commonly lays eggs in waters high in organic matter such as those contaminated with CSOs [44]. Culex mosquito counts were obtained using 24-h gravid traps, which mimic this favorable oviposition environment. Although we used the best available data, we acknowledge that adult female mosquitoes caught in gravid traps placed throughout Washington DC may not fully represent the actual mosquito population at the CSO outfall or the SCM. As we found limited Culex mosquito populations data for Washington DC and this is the first known study of its kind, we opted to use this dataset, albeit with limitations, to obtain important fundamental and exploratory results and to encourage and inform the acquisition of more refined data for future studies on this topic.
Locations of 53 CSO outfalls were obtained from the US EPA. Outfall ID numbers were matched with ID numbers of the subsewershed into which they drain (Figure 2). A total of 47 outfalls corresponded with subsewersheds located within DC’s combined sewershed. Data were unavailable for overflow occurrence, frequency, and/or volume from each CSO outfall. We assumed a heavy rainfall event to be 95th percentile or 1 inch of daily rainfall or greater. Jagai et al. 2015 used a similar rainfall percentile for their study of CSOs and gastrointestinal illness [45]. Daily precipitation and maximum daily temperature were obtained from the National Oceanic and Atmospheric Administration’s National Centers for Environmental Information [46,47]. Stations had approximately a 24-h reading delay, so each day’s reading was considered to be the weather of the previous day.
Culex mosquito count at gravid trap sites located within 3 km of an outfall were used to calculate the average number of Culex mosquitoes at the outfall using inverse distance weighting. The buffer distance of 3 km was chosen because a previous study indicated that an estimated 90% of female Culex mosquitoes stay within 3 km of their hatch site [48]. The distance between trap sites had limited us to using a smaller buffer distance of 1.15 km, the average flight distance of Culex mosquitoes [48], in the main analysis. However, the inverse distance weighting method allows us to place more importance on the trap sites that were closer to the outfall and less importance on the trap sites that were further, away, up to 3 km. An additional sensitivity analysis was performed using a 1.15 km buffer.
2.4. Statistical Analysis
2.4.1. Spatial Associations
We used a Poisson regression model with a random intercept to assess the spatial association between SCM density at the subsewersheds and the Culex mosquito count at the subsewersheds in which the SCMs are located. In this section of our analysis, we did not consider long-term average of temperature and precipitation because they are spatially homogeneous over a long period of time. They are only spatio-temporally different in a short-term time scale, which is not the time scale of interest in this section of our analysis. This model is shown by Equation (1),
where Mosqsubsewershed n represents the Culex mosquito count at the centroid of the subsewershed n. SSArean is the subsewershed area that drains to outfall n, and SCMn is the SCM count in the subsewershed corresponding to outfall n. Due to the abundance of low SCM counts, this predictor was normalized.
We used a similar Poisson regression model with a random intercept to assess the spatial association between SCM density at the subsewersheds and Culex mosquito count at the outfalls into which they drain. This model is shown by Equation (2),
where Mosqoutfall n represents the Culex mosquito count at the CSO outfall n rather than at the subsewershed where the SCMs are located, as in Equation (1). During this particular section of analysis, labeled Spatial Associations, time was not included as a variable in the models because we used cross sectional study methods for this section. The results of the Moran I test for spatial autocorrelation of residuals for both models, Equations (1) and (2), can be found in the Supplementary Materials (Table S2).
2.4.2. Temporal Associations
We used a distributed lag Poisson regression model to assess the associations between heavy precipitation and daily rate of Culex mosquito count surrounding the SCMs. The models (Equations (3) and (4)) were adapted from Jagai et al. 2015 [45].
where represents the time series of Culex mosquito counts at the SCMs on day t. Precipt−i is a binary variable indicating days with precipitation of at least 1 inch (≥ 95th percentile for DC) for precipitation i days previous. tempt is the time series for daily maximum temperature on day t and ns(t,df) represents the natural cubic spline function for time used to control for unmeasured time-variant covariates. The degrees of freedom, df, were determined based on the minimum residual autocorrelation [49]. We stratified our results by SCMs that utilize (1) only pooling, (2) only vegetation, (3) both pooling and vegetation, and (4) no pooling or vegetation (Table S1).
We used a similar distributed lag Poisson regression model to assess the associations between heavy precipitation and daily precipitation and daily rate of Culex mosquito count surrounding the CSO outfalls.
We estimated this association for CSO outfalls treated with tertiles of no, low, medium, and high SCM densities to assess the impact of SCM density on the effect of rainfall on Culex mosquito count. SCM densities were grouped as follows. Tertiles were calculated based on non-zero observations to ensure similar group sizes. The categories of SCM density are: zero (0 SCM count/m2), low (>0, <67.6 SCM count/m2), medium >67.6, <141.1 SCM count/m2), and high (≥141.1 SCM count/m2). The model is shown in Equation (4),
where represents the time series of Culex mosquito counts at the CSO outfalls on day t.
A 0 to 10 day lag was chosen because Culex mosquito eggs take approximately 7–10 days to reach adulthood and exit the water [36]. We used a finite distributed lag model assuming heavy precipitation had a negligible impact on Culex mosquito count beyond the 0 to 10 day lag analysis period. The lagged model was analyzed using Culex mosquito data for May to October 2018.
3. Results
3.1. Descriptive Results
By the beginning of our study period, 8001 SCMs were installed in Washington DC. During our study period, a total of 2650 female Culex mosquitoes were caught in the gravid traps. Over 95% of the trapped female Culex mosquitoes were sp. pipiens. During our 184-day study period, 16 days had rainfall that exceeded the 95th percentile (≥1 inch). 3.2. Spatial Associations
A Poisson regression with a random intercept revealed that Culex mosquito count whether at the outfalls or within the subsewershed are inversely associated with SCM count (Table 1). For example, a standard deviation increase in SCM counts within subsewersheds was associated with a 67.0% [95%CI: 50.3%, 78.1%] decrease in Culex mosquito counts within the subsewershed and a 67.2% (95%CI: 50.9%, 78.0%) decrease in Culex mosquito counts within the CSO outfalls.
Thus, results suggest that subsewersheds with more SCMs had less Culex mosquitoes at both the subsewersheds and the outfalls in which they drain during CSOs (Table 1). There was no significant difference between the association of SCM count and Culex mosquito count at the outfalls and that at the subsewersheds. Additionally, a sensitivity analysis revealing spatial associations when using a 1.15 km buffer, instead of a 3 km buffer, shown in the Supplementary Materials (Table S3) revealed that there was no significant difference between the results of Table 1 and the sensitivity analysis results of Table S3.
3.2. Temporal Associations
3.2.1. Associations with Precipitation and Temperature
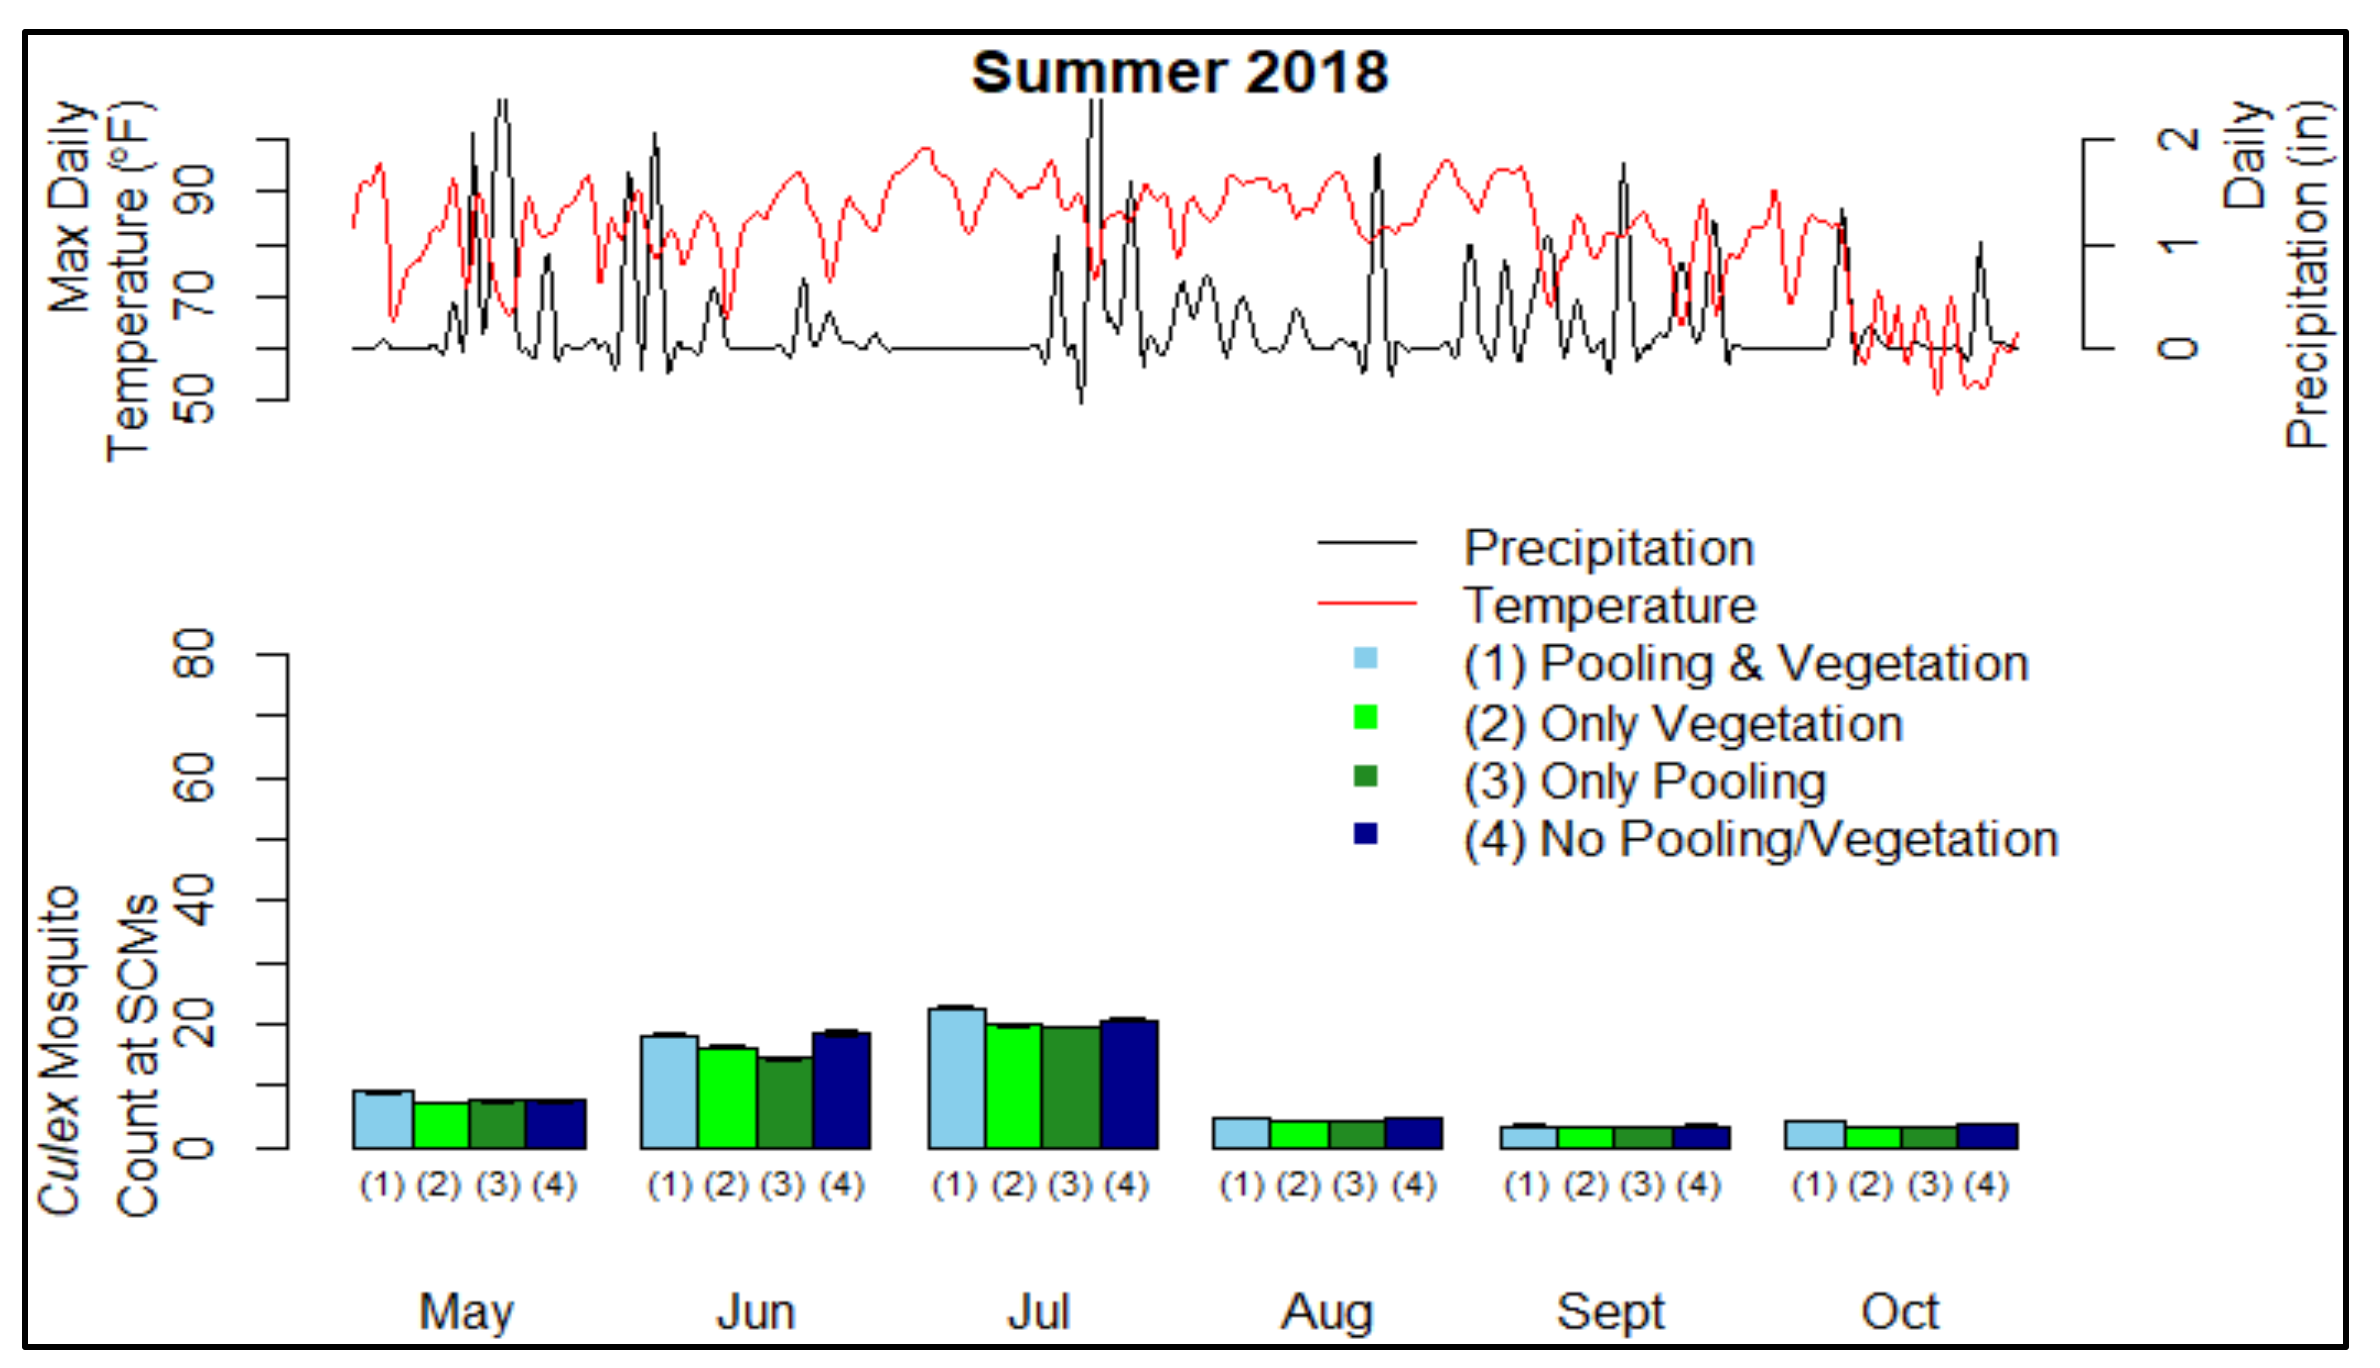
SCMs that use pooling and vegetation, only vegetation, only pooling, and no pooling or vegetation had similar Culex mosquito counts during the summer of 2018 (Figure 3). Culex mosquito counts at the different types of SCMs may have been similar because of the proximity among SCMs within DC. The maximum number of Culex mosquitoes at the SCMs occurred in June and July 2018.
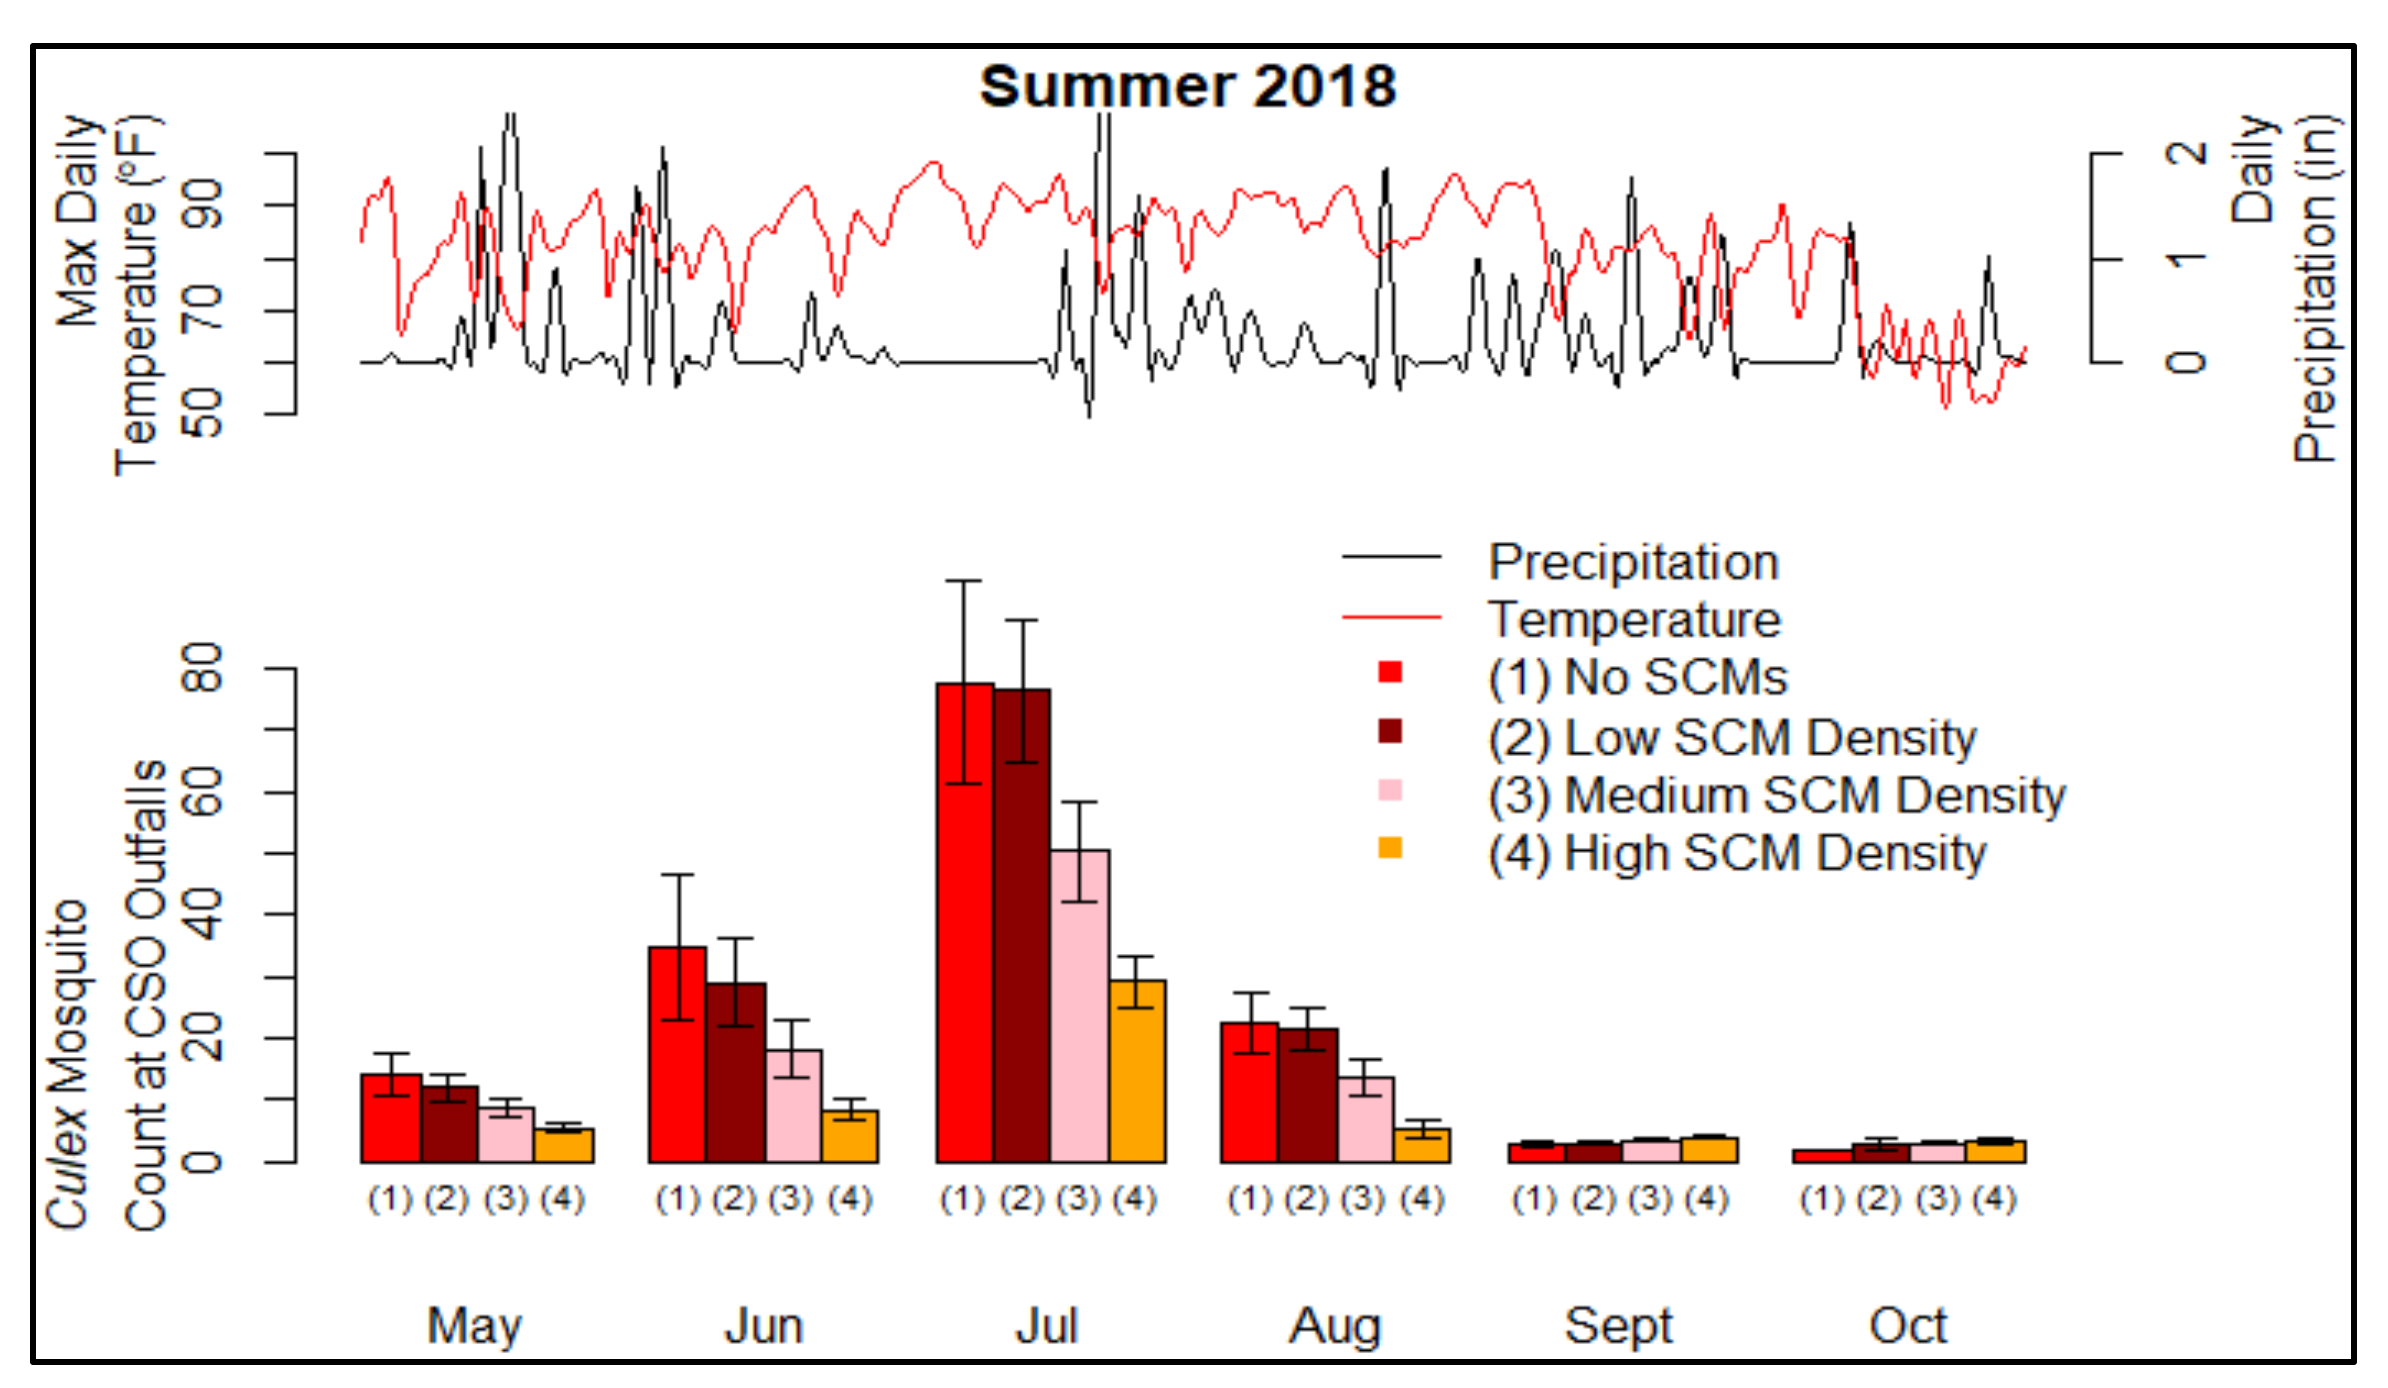
Culex mosquito counts at the outfalls were highest in July 2018 (Figure 4). Outfalls that were treated with higher densities of SCMs had fewer mosquitoes during May, June, July, and August 2018. However, during the cooler summer months, such as September and October, SCM density had the opposite or minimal estimated effect on mosquito count at the outfalls. Figure 3 and Figure 4 are displayed on the same y-axis. The peak monthly Culex mosquito counts at the CSO outfalls were higher than the peak monthly Culex mosquito counts at the SCMs.
3.2.2. Lagged Effect of SCMs on Culex Mosquitoes after Heavy Rainfall
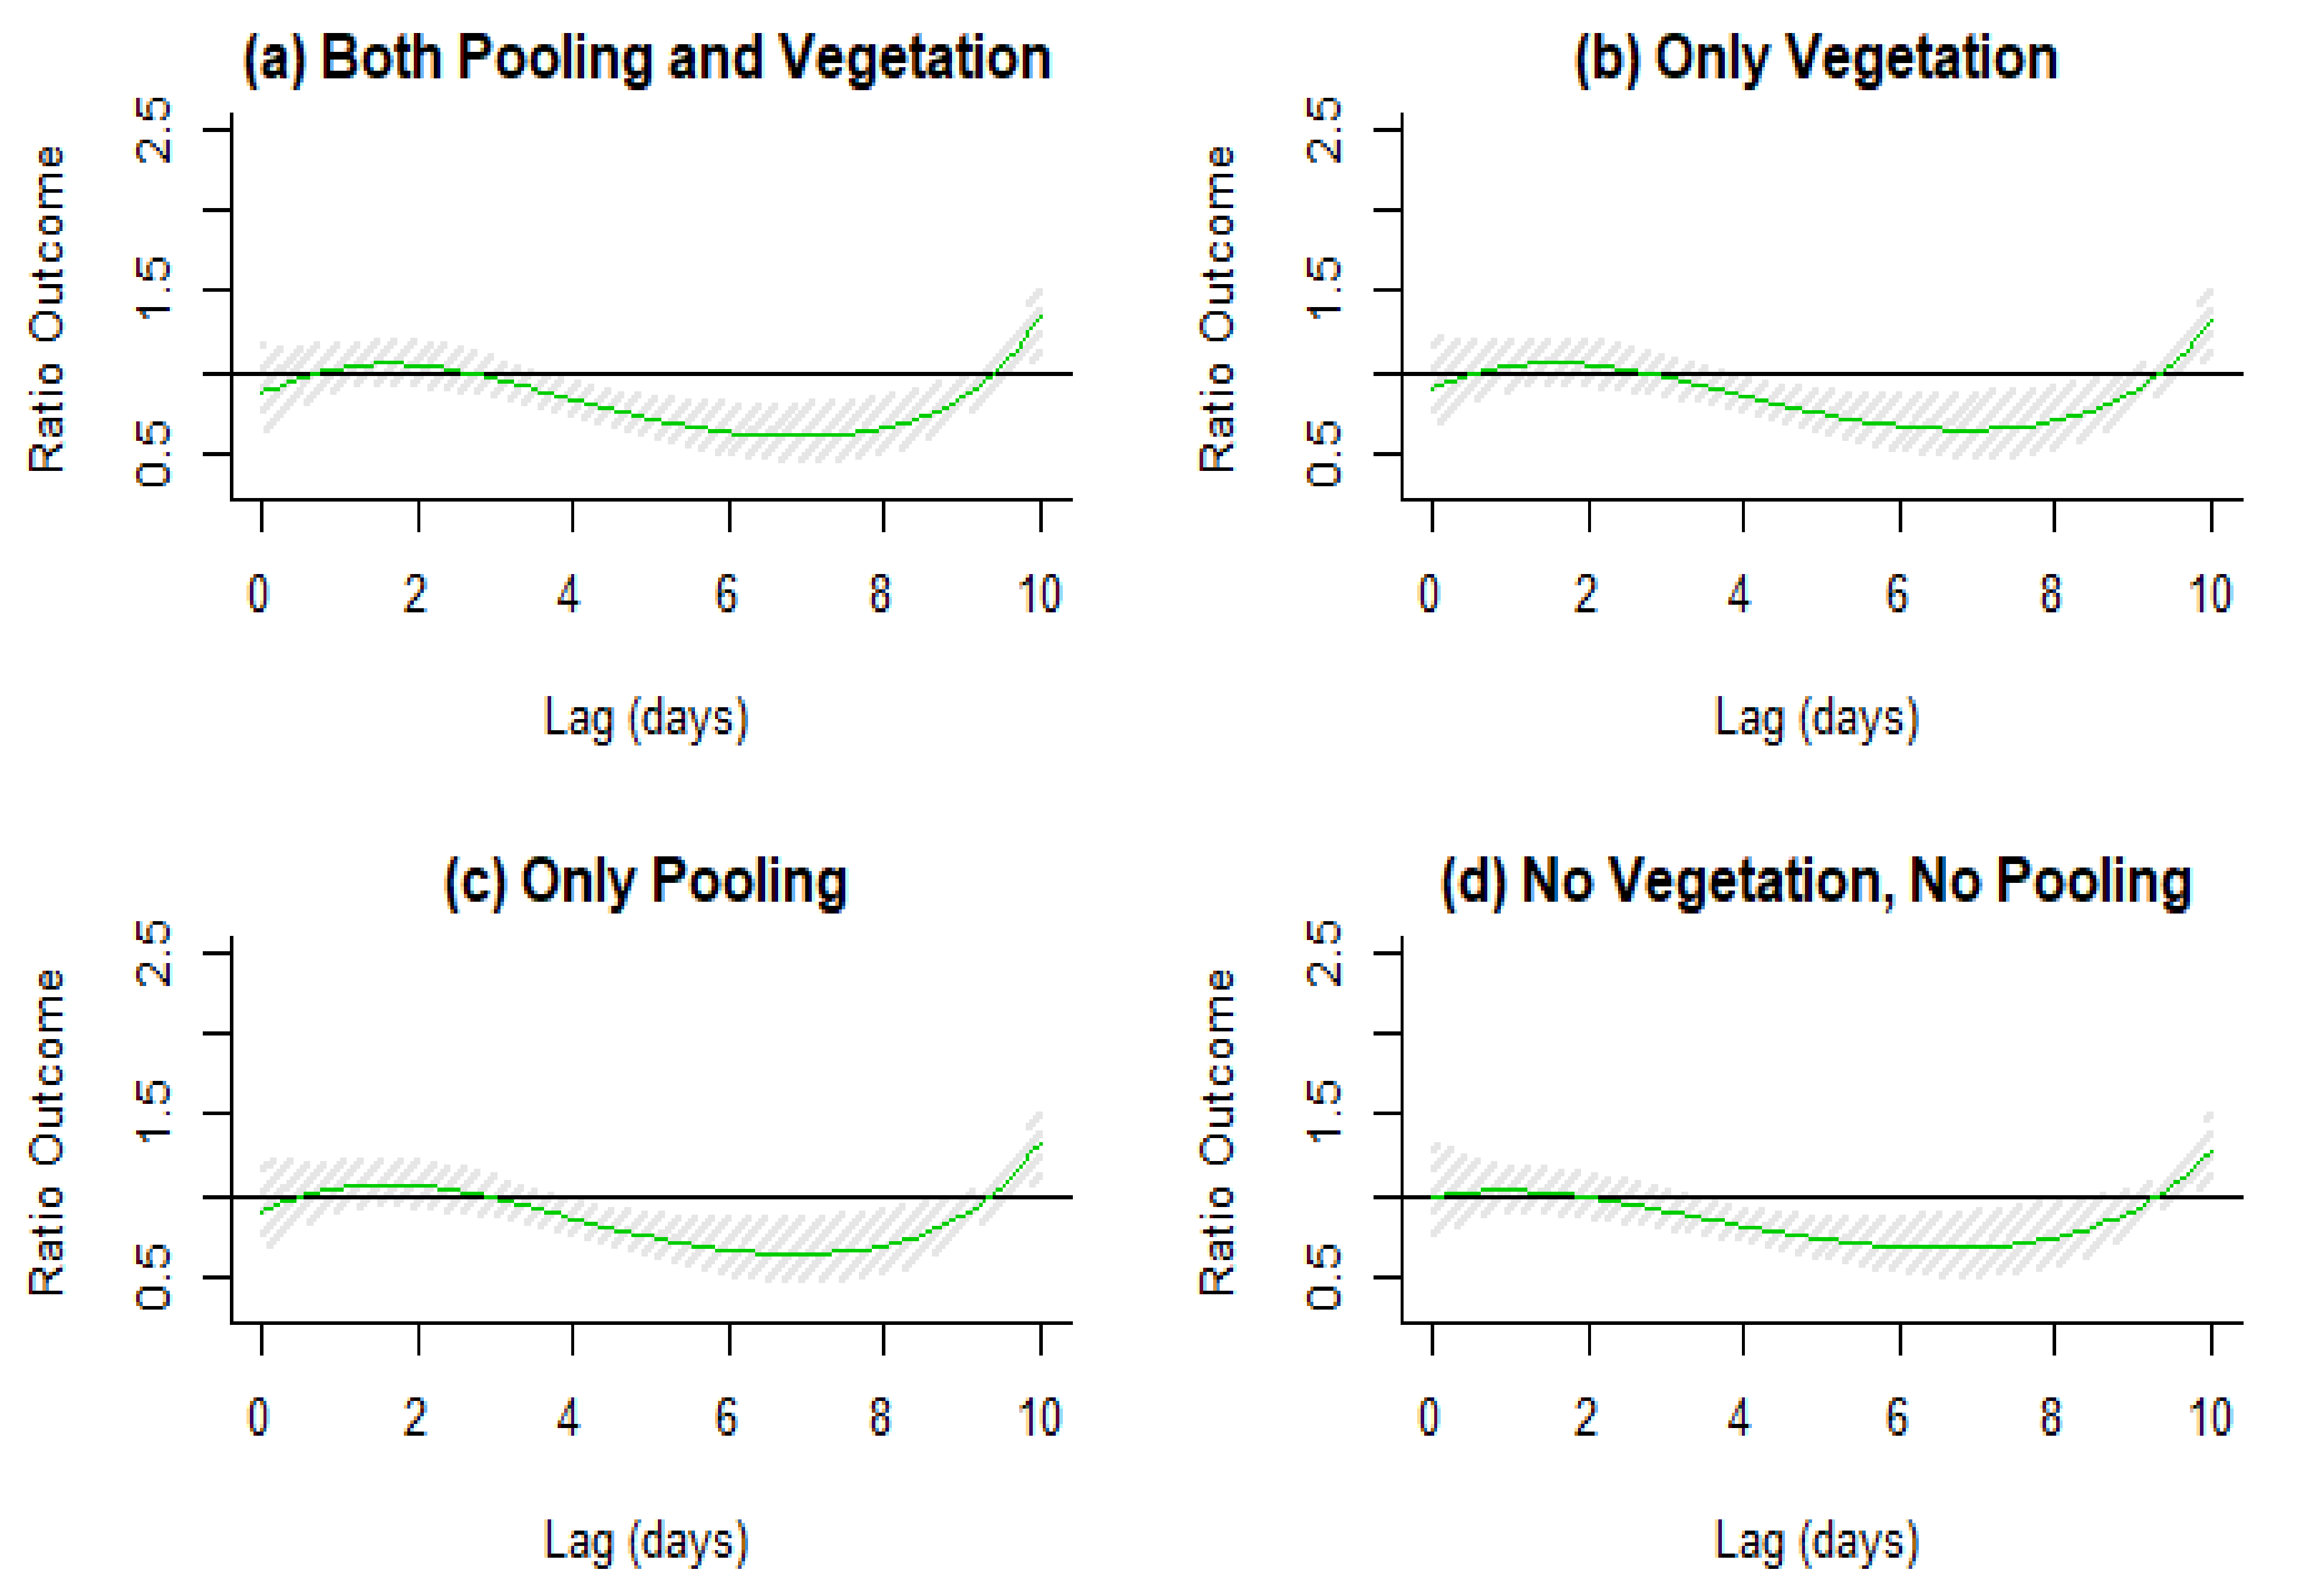
Results using a distributed lagged model, Equation (3), revealed that the effect of heavy rainfall on Culex mosquito count was similar at SCMs that use pooling and vegetation, only vegetation, only pooling, and neither vegetation nor pooling (Figure 5). The local maxima between lags 0–2 days shown in Figure 5 was highest for SCMs that use only pooling. At these local maxima, Culex mosquito counts increased by 5.2% (95%CI: −7.8%, 18.2%), 5.7% (95%CI: −7.7%, 19.1%), 7.1% (95%CI: −6.5%, 20.6%), 3.1% (95%CI: −11.8%, 18.1%) at SCMs that use both pooling and vegetation, only vegetation, only pooling, and neither vegetation nor pooling, respectively (Figure 5). Culex mosquito counts increase again after lag 9–10. Values for the change in Culex mosquito counts after heavy rainfall non-integer lags were extrapolated using the curves in Figure 5. An additional analysis accounting for confounding effects of temperature lags up to 10 days is shown in the Supplementary Materials (Figure S1).
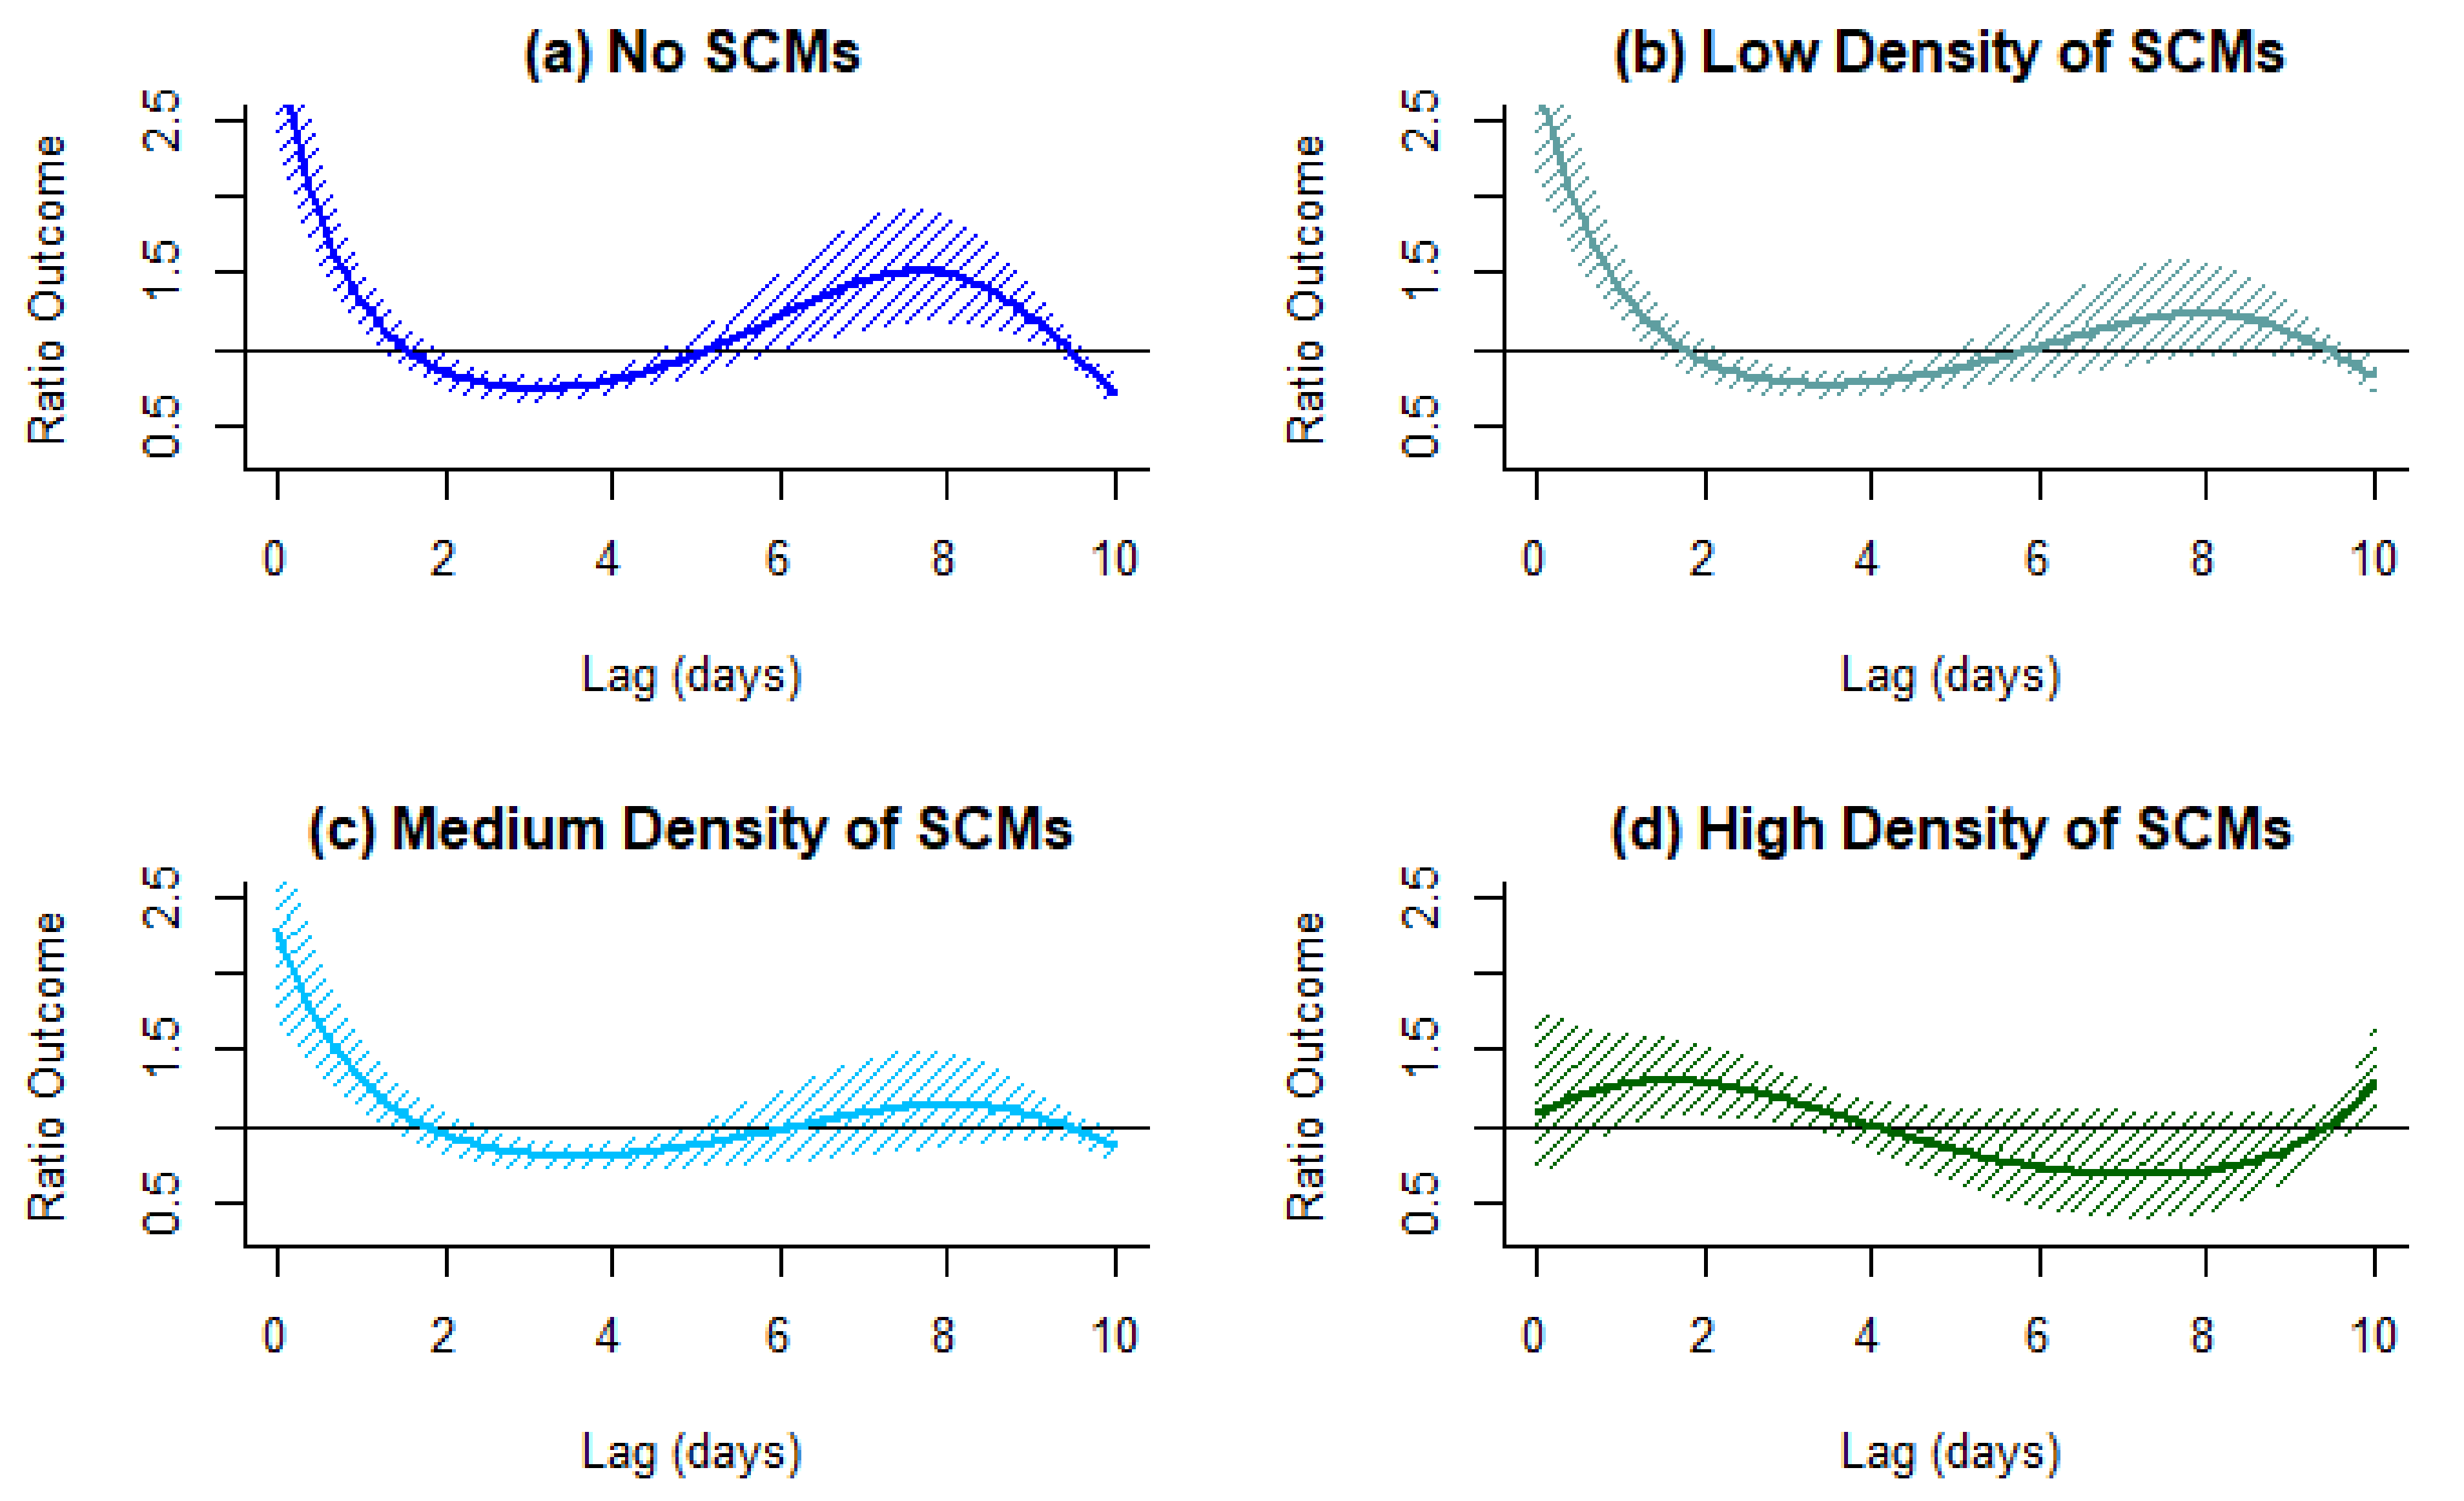
Results from the distributed lagged model, Equation (4), revealed an association between heavy rainfall (≥ 95th percentile or 1 inch) on Culex mosquito counts at the outfalls (Figure 6). Positive associations were observed during the majority of the 0 to 10-day lag period between Culex mosquito count and heavy rainfall at outfalls. Higher increases in Culex mosquito counts occurred at the outfalls immediately after the rain event (lag 0). However, the association between heavy rainfall events and Culex mosquito counts at the outfall differed by the density of SCMs within the respective subsewershed (Figure 6). This increase in mosquitoes after heavy rainfall was moderated when outfalls were treated with higher densities of SCMs. Immediately after heavy rainfall (lag 0), Culex mosquito counts at outfalls treated by no SCMs, a low density of SCMs, and a medium density of SCMs increased by 200.0% (95%CI: 175.8%, 223.7%), 183.2% (95%CI: 157.1%, 209.2%), and 129.0% (95%CI: 100.3%, 157.7%) respectively, compared to without heavy rainfall (Figure 6). Outfalls treated with a high density of SCMs had a peak increase in mosquito count (29.4% (95%CI: 10.6%, 48.2%)) at lag 1.6 (Figure 6).
After a heavy rain event, Culex mosquitoes at the outfall increased again between lags 7–8 days (Figure 6). After heavy rainfall there was approximately a 60.5% (95%CI: 27.0%, 74.1%) increase in Culex mosquitoes at lag 7.7 days at outfalls that were not treated with SCMs, a 22.8% (95%CI: −1.6%, 47.2%) increase at lag 7.9 days at outfalls treated with a low density of SCMs, and a 13.9% (95%CI: −11.7%, 39.6%) increase at lag 8 days at outfalls treated with a medium density of SCMs, compared to without heavy rainfall (Figure 6). Percentages were calculated based on the local maxima (peak) seen between lag 7–8 days, as shown in Figure 6. Values for the change in Culex mosquito counts at non-integer lags were extrapolated using the curves in Figure 6. Model results indicate that Culex mosquito count at outfalls treated by a high density of SCMs did not increase between lags 7–8 as did the outfalls with lower densities of SCMs. Plots in Figure 6 are shown on the same y-axis scale as Figure 5. An additional analysis accounting for confounding effects of temperature lags up to 10 days is shown in the Supplementary Materials (Figure S2).
4. Discussion
Results revealed that there was an inverse spatial association between SCMs and the number of Culex mosquitoes at the subsewersheds and at the outfalls (Table 1). The association of SCM count and Culex mosquito count at the outfalls was not statically different from that at the subsewersheds (Table 1). However, differences in association were identified after the occurrence of heavy precipitation, revealing the importance of not only studying these associations spatially, but also temporally. Results from this study reveal that heavy rainfall has similar effects on Culex mosquito counts at SCMs that do or not use pooling and/or vegetation (Figure 5). However, SCMs appeared to have a greater impact on Culex mosquitoes at the CSO outfalls than at the SCMs themselves. Subsewersheds with a higher density of SCM had lower increases in Culex mosquitoes at the CSO outfalls into which they drained after heavy rainfall (Figure 6).
We originally hypothesized that the SCMs that utilize ponding and/or vegetation may attract Culex mosquitoes due to the increase in favorable oviposition habitats [54]. This is particularly important because many SCMs are in populated areas within the city. SCMs that primarily utilized pooling had slightly higher increases in Culex mosquitoes after a heavy rain event than did the other types of SCM, but this difference was not significant (Figure 5). A previous study on Culex mosquitoes in an urban wet environment, including forms of stormwater control measures, found that natural and retention ponds did not generate significant numbers of samples positive for Culex mosquitoes [18]. A possible explanation for this, as well as our findings, is that these urban wet environments frequently dry out, disrupting the growth of premature mosquitoes unlike in more permanent waters [33], such as waterbodies that often receive CSOs.
In our original hypothesis, we suspected that CSO outfalls treated with more SCMs may have less Culex mosquitoes. Our results revealed that outfalls treated with a higher density of SCMs had lower increases in Culex mosquitoes after heavy rainfall compared to outfalls with less SCMs (Figure 5). We suspect the initial increase in Culex mosquitoes at the outfall at lag 0 occurs because heavy rain events that result in CSOs may attract Culex mosquitoes to lay eggs [22]. Outfalls that were treated with higher densities of SCMs had a lower initial increase at lag 0, possibly because the SCMs had decreased the severity or prevented the occurrence of CSOs (Figure 6). Most CSO outfalls had an increase in Culex mosquitoes between lag 7–8 days except for outfalls treated by high densities of SCMs. As it takes approximately 7–10 days for Culex mosquitoes to mature into adults [36], we postulate that this peak reflects a new generation of adult mosquitoes exiting the water. The local peak of the increase in Culex mosquito counts after heavy rainfall during this period (lag 7–10 days) at outfalls treated with a low density of SCMs was 62.3% lower and 0.2 days later than the local peak at the outfalls that were treated with no SCMs. Likewise, the local peak of the increase in Culex mosquito counts after heavy rainfall during the same period at outfalls treated with a medium density of SCMs was 77.0% lower and 0.3 days later than that of outfalls treated with no SCMs. These results suggest that SCM within the subsewershed may help prevent large increases in Culex mosquito count at the CSO outfall immediately after a heavy rain event (lag 0) and between lags 7–10.
To the best of our knowledge, this study is the first to assess SCMs in relation to mosquitoes at CSO outfalls, providing insight into these relationships and setting a foundation for future studies. Despite our efforts, additional adjustment for potential confounders for the models in future studies such as maintenance levels of SCMs and land use characteristics may further improve our models. A limitation we faced during this study was availability of complete data. For instance, mosquito traps were not set in each location for every day, acquired data on SCM size and volume was incomplete, the maintenance statuses of SCMs were unknown, and we did not have access to CSO frequency, occurrence, and volume data in DC. Additionally, gravid traps were used to estimate mosquito populations. Though our ideal dataset would have included daily Culex mosquito egg, larvae, and pupae populations over time at each SCM and CSO outfall or at least collections of adult Culex mosquitoes using gravid traps at each CSO outfall or SCM. Furthermore, since the gravid trap collects female mosquitos that have taken a blood meal 48–72 h prior and have spent several days growing, the use of the gravid trap in this area of research may not fully represent mosquito population related to heavy rainfall and CSOs. Nevertheless, mosquito eggs may be laid at locations linked to the CSS (e.g., the points 1–3 in Figure 1) before reaching the CSO outfall with adequate time for eggs to hatch, larvae to mature, pupate, and emerge as adults, then acquire a blood meal close to CSO outfall. However, we cannot rule out the possibility that mosquito counts estimated by using the gravid trap may include mosquitos laid before heavy rainfall or unrelated to heavy rainfall and CSOs. As such, differences in counts across CSO outfalls may be seen as residual confounding that we could not adjust for in our study settings. In addition, since many SCMs were located in close proximity to other SCMs, many Culex mosquitoes recorded may have been counted towards multiple SCMs, and the unique effects of the different types of SCM may not have been fully captured. Therefore, the current dataset we used had allowed us to provide fundamental exploratory findings that should be carefully interpreted. Data of daily mosquito populations and detailed SCM and CSO characteristics may help provide a more accurate depiction of SCMs’ impact on mosquitoes. Future studies may benefit from further isolating and analyzing the effects of specific types of SCMs, especially those that utilize pooling and vegetation. Additionally, mosquitoes should be studied along multiple points of the flowing waterbody that the CSOs are discharged in. Finally, research is needed on the impacts of how these changes in mosquito populations impact human health to provide a fuller characterization of the impact of SCMs. The authors wish to point out that, based on the current mosquito data, there were significant gaps and uncertainties when performing our analysis. Thus, conclusive trends were difficult to make. However, in this paper, we provide preliminary results and encourage future studies on this topic of interest with the collection of more appropriate mosquito abundance data.
Our results suggest that SCMs may impact the Culex mosquito count surrounding CSO outfalls after heavy rainfall in different ways. Though results suggest that SCMs may be a promising method for reducing the increase in Culex mosquitoes at CSO outfalls after heavy rain events, future research is needed to better understand the impacts of SCMs on mosquitoes throughout the entire study site. As areas surrounding SCMs are often more populated than areas surrounding CSO outfalls, more research needs to be performed to study the cost-benefit of the potential impact of heavy rainfall on Culex mosquito counts surrounding SCMs at the subsewershed (Figure 5), along with the reduction of Culex mosquitoes surrounding the CSO outfalls (Figure 6).
5. Conclusions
In conclusion, results revealed that there was an inverse spatial association between SCMs and the number of Culex mosquitoes at the subsewersheds and at the outfalls. Results also reveal that heavy rainfall has similar effects on Culex mosquito counts at SCMs that do or not use pooling and/or vegetation. However, subsewersheds with a higher density of SCM had lower increases in Culex mosquitoes at the CSO outfalls into which they drained after heavy rainfall.
Though this study has some limitations, the novel results can inform policy makers and communities regarding the impact of SCMs. Additionally, findings of this study support the theory that areas with CSOs and high mosquito count would benefit from exploring the effectiveness of untraditional mitigation options. As climate change is expected to alter heavy rainfall patterns and temperature that may favor mosquito habitats, exploring sustainable management techniques, such as SCMs, is crucial to alleviate potential health burdens.
Supplementary Materials
The following supporting information can be downloaded at: https://0-www-mdpi-com.brum.beds.ac.uk/article/10.3390/w14010031/s1, Table S1: Select list and descriptions of SCMs that use pooling and/or vegetation commonly installed in DC, Table S2: Moran I test for spatial autocorrelation of residuals, Table S3: Spatial associations revealing the decrease in Culex mosquitoes at the CSO outfalls as well as at the subsewersheds for each increase in standard deviation of SCM within the subsewershed using a 1.15 km buffer radius surrounding traps sites, Figure S1: Lagged effect of days with at least one inch of rainfall (≥95th percentile) on Culex mosquito count at SCMs that use/do not use pooling and/or vegetation. Results account for the confounding effects of temperature lags of up to 10 days, and Figure S2: Lagged effect of days with at least one inch of rainfall (≥95th percentile) on Culex mosquito count CSO outfalls treated by varying densities of SCMs. Results account for the confounding effects of temperature lags of up to 10 days.
Author Contributions
A.Y.C.: Conceptualization, Data curation, Formal analysis, Investigation, Methodology, Project administration, Software, Visualization, Writing—original draft; H.K.: Conceptualization, Formal analysis, Methodology, Software, Validation, Writing—review and editing; M.L.B.: Conceptualization, Funding acquisition, Project administration, Supervision, Writing—review and editing. All authors have read and agreed to the published version of the manuscript.
Funding
We thank the US EPA SEARCH Center for funding this research under Assistance Agreement No. RD835871. This paper has not been formally reviewed by the EPA and views expressed are solely those of the SEARCH Center and do not necessarily reflect those of the Agency.
Institutional Review Board Statement
Not applicable.
Informed Consent Statement
Not applicable.
Data Availability Statement
The mosquito trap sites and 24-h mosquito counts that were used for this study are available from the United States Health and Human Services at Open Data DC, https://opendata.dc.gov/datasets/mosquito-trap-sites (accessed on 16 September 2019). The locations of stormwater control measures, also known as stormwater best management practices, that were used in this study are available from the Department of Energy and the Environment at Open Data DC, https://opendata.dc.gov/datasets/best-management-practices (accessed on 9 October 2020). The daily precipitation and maximum daily temperature data that were used in this study are available by request at the National Centers for Environmental Information by the National Oceanic and Atmospheric administration at Location: FIPS:11, Dates: 1 January 2016–31 December 2018, Data Types: PRCP and TMAX, https://0-doi-org.brum.beds.ac.uk/10.1175/JTECH-D-11-00103.1 (accessed on 9 October 2021). DC’s subsewershed areas and identification numbers that were used in this study are available from the DC Geographic Information System at Open Data DC, https://opendata.dc.gov/datasets/storm-sewer-system (accessed on 9 October 2021). Combined sewer overflow locations and identification numbers are available upon request from the United States Environmental Protection Agency. Combined sewer overflow data are also available upon request from the corresponding author with permission from the United States Environmental Protection Agency.
Acknowledgments
We thank the funding and data sources, without which this manuscript would not have been created. We also gratefully acknowledge the editor and referees who helped improve this manuscript.
Conflicts of Interest
The authors declare no conflict of interest.
References
- Kraemer, M.U.G.; Reiner, R.C.; Brady, O.J.; Messina, J.P.; Gilbert, M.; Pigott, D.M.; Yi, D.; Johnson, K.; Earl, L.; Marczak, L.B.; et al. Past and Future Spread of the Arbovirus Vectors Aedes Aegypti and Aedes Albopictus. Nat. Microbiol. 2019, 4, 854–863. [Google Scholar] [CrossRef] [PubMed]
- Ryan, S.J.; Carlson, C.J.; Mordecai, E.A.; Johnson, L.R. Global Expansion and Redistribution of Aedes-Borne Virus Transmission Risk with Climate Change. PLoS Negl. Trop. Dis. 2019, 13, e0007213. [Google Scholar] [CrossRef] [Green Version]
- Samy, A.M.; Elaagip, A.H.; Kenawy, M.A.; Ayres, C.F.J.; Peterson, A.T.; Soliman, D.E. Climate Change Influences on the Global Potential Distribution of the Mosquito Culex Quinquefasciatus, Vector of West Nile Virus and Lymphatic Filariasis. PLoS ONE 2016, 11, e0163863. [Google Scholar] [CrossRef] [PubMed]
- CDC Final Cumulative Maps and Data for West Nile Virus. Available online: https://www.cdc.gov/westnile/statsmaps/cumMapsData.html (accessed on 20 October 2020).
- United States Environmental Protection Agency. Climate Change Indicators: Weather and Climate. Available online: https://www.epa.gov/climate-indicators/weather-climate (accessed on 8 September 2020).
- National Research Council. Urban Stormwater Management in the United States; National Research Council: Washington, DC, USA, 2008. [Google Scholar]
- Sadeghi, K.M.; Loáiciga, H.A.; Kharaghani, S. Stormwater Control Measures for Runoff and Water Quality Management in Urban Landscapes. J. Am. Water Resour. Assoc. 2018, 54, 124–133. [Google Scholar] [CrossRef]
- Davis, A.P. Field Performance of Bioretention: Water Quality. Environ. Eng. Sci. 2007, 24, 1048–1064. [Google Scholar] [CrossRef]
- United States Environmental Protection Agency. Best Management Practices (BMPs) Siting Tool. Available online: https://www.epa.gov/water-research/best-management-practices-bmps-siting-tool (accessed on 23 September 2019).
- Davis, A.P.; Shokouhian, M.; Sharma, H.; Minami, C. Laboratory Study of Biological Retention for Urban Stormwater Management. Water Environ. Res. 2001, 73, 5–14. [Google Scholar] [CrossRef] [PubMed]
- Mallin, M.A.; Johnson, V.L.; Ensign, S.H. Comparative Impacts of Stormwater Runoff on Water Quality of an Urban, a Suburban, and a Rural Stream. Environ. Monit. Assess. 2009, 159, 475–491. [Google Scholar] [CrossRef]
- Gingrich, J.B.; Anderson, R.D.; Williams, G.M.; O’connor, L.; Harkins, K. Stormwater ponds, constructed wetlands, and other best management practices as potential breeding sites for west nile virus vectors in delaware during 2004. Moco 2006, 22, 282–291. [Google Scholar] [CrossRef]
- Kwan, J.A.; Riggs-Nagy, J.M.; Fritz, C.L.; Shindelbower, M.; Castro, P.A.; Kramer, V.L.; Metzger, M.E. Mosquito Production in Stormwater Treatment Devices in the Lake Tahoe Basin, California. Moco 2008, 24, 82–89. [Google Scholar] [CrossRef]
- United States Environmental Protection Agency. Stormwater Structures & Mosquitoes; Office of Water: Washington, DC, USA, 2005. [Google Scholar]
- Walton, W.E. Constructed Wetlands Still Produce Mosquitoes. Proc. Pap. Mosq. Vector Control. Assoc. Calif. Mon. 2019, 87, 1–5. [Google Scholar]
- Wong, G.K.L.; Jim, C.Y. Abundance of Urban Male Mosquitoes by Green Infrastructure Types: Implications for Landscape Design and Vector Management. Landsc. Ecol. 2018, 33, 475–489. [Google Scholar] [CrossRef]
- Zhao, J.; Tang, T.; Wang, X. Effects of Landscape Composition on Mosquito Population in Urban Green Spaces. Urban For. Urban Green. 2020, 49, 126626. [Google Scholar] [CrossRef]
- Irwin, P.; Arcari, C.; Hausbeck, J.; Paskewitz, S. Urban Wet Environment as Mosquito Habitat in the Upper Midwest. EcoHealth 2008, 5, 49. [Google Scholar] [CrossRef] [PubMed]
- Tibbetts, J. Combined Sewer Systems: Down, Dirty, and Out of Date. Environ. Health Perspect. 2005, 113, A464–A467. [Google Scholar] [CrossRef] [Green Version]
- United States Environmental Protection Agency. Report to Congress on Impacts and Control of Combined Sewer Overflows and Sanitary Sewer Overflows; United States Environmental Protection Agency, Office of Water: Washington, DC, USA, 2004.
- United States Environmental Protection Agency. Combined Sewer Overflows (CSOs). Available online: https://www.epa.gov/npdes/combined-sewer-overflows-csos (accessed on 23 September 2019).
- Calhoun, L.M.; Avery, M.; Jones, L.; Gunarto, K.; King, R.; Roberts, J.; Burkot, T.R. Combined Sewage Overflows (CSO) Are Major Urban Breeding Sites for Culex Quinquefasciatus in Atlanta, Georgia. Am. J. Trop. Med. Hyg. 2007, 77, 478–484. [Google Scholar] [CrossRef]
- Chaves, L.F.; Keogh, C.L.; Nguyen, A.M.; Decker, G.M.; Vazquez-Prokopec, G.M.; Kitron, U.D. Combined Sewage Overflow Accelerates Immature Development and Increases Body Size in the Urban Mosquito Culex Quinquefasciatus. J. Appl. Entomol. 2011, 135, 611–620. [Google Scholar] [CrossRef]
- Lund, A.; McMillan, J.; Kelly, R.; Jabbarzadeh, S.; Mead, D.G.; Burkot, T.R.; Kitron, U.; Vazquez-Prokopec, G.M. Long Term Impacts of Combined Sewer Overflow Remediation on Water Quality and Population Dynamics of Culex Quinquefasciatus, the Main Urban West Nile Virus Vector in Atlanta, GA. Environ. Res. 2014, 129, 20–26. [Google Scholar] [CrossRef]
- Vazquez-Prokopec, G.M.; Vanden Eng, J.L.; Kelly, R.; Mead, D.G.; Kolhe, P.; Howgate, J.; Kitron, U.; Burkot, T.R. The Risk of West Nile Virus Infection Is Associated with Combined Sewer Overflow Streams in Urban Atlanta, Georgia, USA. Environ. Health Perspect. 2010, 118, 1382–1388. [Google Scholar] [CrossRef] [Green Version]
- Lucas, W.C.; Sample, D.J. Reducing Combined Sewer Overflows by Using Outlet Controls for Green Stormwater Infrastructure: Case Study in Richmond, Virginia. J. Hydrol. 2015, 520, 473–488. [Google Scholar] [CrossRef]
- Pennino, M.J.; McDonald, R.I.; Jaffe, P.R. Watershed-Scale Impacts of Stormwater Green Infrastructure on Hydrology, Nutrient Fluxes, and Combined Sewer Overflows in the Mid-Atlantic Region. Sci. Total. Environ. 2016, 565, 1044–1053. [Google Scholar] [CrossRef] [Green Version]
- Tao, J.; Li, Z.; Peng, X.; Ying, G. Quantitative Analysis of Impact of Green Stormwater Infrastructures on Combined Sewer Overflow Control and Urban Flooding Control. Front. Environ. Sci. Eng. 2017, 11, 11. [Google Scholar] [CrossRef]
- United States Environmental Protection Agency. Reducing Combined Sewer Overflows with Green Infrastructure: Willow Street Green Infrastructure Design; United States Environmental Protection Agency: Bath, ME, USA, 2017.
- Chaves, L.F.; Keogh, C.L.; Vazquez-Prokopec, G.M.; Kitron, U.D. Combined Sewage Overflow Enhances Oviposition of Culex Quinquefasciatus (Diptera: Culicidae) in Urban Areas. J. Med. Entomol. 2009, 46, 220–226. [Google Scholar] [CrossRef] [PubMed] [Green Version]
- Servadio, J.L.; Rosenthal, S.R.; Carlson, L.; Bauer, C. Climate Patterns and Mosquito-Borne Disease Outbreaks in South and Southeast Asia. J. Infect. Public Health 2018, 11, 566–571. [Google Scholar] [CrossRef] [PubMed]
- Ruiz, M.O.; Chaves, L.F.; Hamer, G.L.; Sun, T.; Brown, W.M.; Walker, E.D.; Haramis, L.; Goldberg, T.L.; Kitron, U.D. Local Impact of Temperature and Precipitation on West Nile Virus Infection in Culex Species Mosquitoes in Northeast Illinois, USA. Parasites Vectors 2010, 3, 19. [Google Scholar] [CrossRef] [Green Version]
- Chase, J.M.; Knight, T.M. Drought-Induced Mosquito Outbreaks in Wetlands. Ecol. Lett. 2003, 6, 1017–1024. [Google Scholar] [CrossRef] [Green Version]
- Soh, S.; Aik, J. The Abundance of Culex Mosquito Vectors for West Nile Virus and Other Flaviviruses: A Time-Series Analysis of Rainfall and Temperature Dependence in Singapore. Sci. Total. Environ. 2021, 754, 142420. [Google Scholar] [CrossRef] [PubMed]
- Ciota, A.T.; Matacchiero, A.C.; Kilpatrick, A.M.; Kramer, L.D. The Effect of Temperature on Life History Traits of Culex Mosquitoes. J. Med. Entomol. 2014, 51, 55–62. [Google Scholar] [CrossRef]
- CDC Culex Mosquito Life Cycle. Available online: https://www.cdc.gov/mosquitoes/about/life-cycles/culex.html (accessed on 8 September 2020).
- U.S. Census Bureau. U.S. Census Bureau QuickFacts: District of Columbia. Available online: https://www.census.gov/quickfacts/DC (accessed on 8 September 2020).
- USGS Multi-Resolution Land Characteristics (MRLC) Consortium. Available online: https://www.mrlc.gov/ (accessed on 8 September 2020).
- DDOE. Stormwater Management Guidebook; District Department of the Environment, Watershed Protection Division: Washington DC, USA, 2013.
- ESRI. ArcMap 10.7.1 [Computer Software]; ESRI: Redlands, CA, USA, 2019. [Google Scholar]
- United States Environmental Protection Agency. Soak Up the Rain: Rain Gardens. Available online: https://www.epa.gov/soakuptherain/soak-rain-rain-gardens (accessed on 25 February 2020).
- United States Environmental Protection Agency. Soak Up the Rain: Green Roofs. Available online: https://www.epa.gov/soakuptherain/soak-rain-green-roofs (accessed on 20 October 2020).
- U.S. HHS Mosquito Trap Sites. Available online: https://opendata.dc.gov/datasets/mosquito-trap-sites?geometry=-81.088,38.151,-72.941,39.647 (accessed on 8 September 2020).
- Miller, N.; Mettelman, R.C.; Baker, S.C.; Harbison, J.E. Use of Centers for Disease Control and Prevention Gravid Trap in Catch Basins: Proof-Of-Concept Trials. J. Am. Mosq. Control. Assoc. 2015, 31, 196–199. [Google Scholar] [CrossRef]
- Jagai, J.S.; Li, Q.; Wang, S.; Messier, K.P.; Wade, T.J.; Hilborn, E.D. Extreme Precipitation and Emergency Room Visits for Gastrointestinal Illness in Areas with and without Combined Sewer Systems: An Analysis of Massachusetts Data, 2003–2007. Environ. Health Perspect. 2015, 123, 873–879. [Google Scholar] [CrossRef]
- Menne, M.J.; Durre, I.; McNeal, S.; Thomas, K.; Yin, X.; Anthony, S.; Ray, R.; Vose, R.S.; Gleason, B.E.; Houston, T.G. Global Historical Climatology Network-Daily (GHCN-Daily), Version 3. 2012. Available online: https://www.ncei.noaa.gov/products/land-based-station/global-historical-climatology-network-daily (accessed on 4 August 2020).
- Menne, M.J.; Durre, I.; Vose, R.S.; Gleason, B.E.; Houston, T.G. An Overview of the Global Historical Climatology Network-Daily Database. J. Atmosph. Ocean. Technol. 2012, 29, 897–910. [Google Scholar] [CrossRef]
- Hamer, G.L.; Anderson, T.K.; Donovan, D.J.; Brawn, J.D.; Krebs, B.L.; Gardner, A.M.; Ruiz, M.O.; Brown, W.M.; Kitron, U.D.; Newman, C.M.; et al. Dispersal of Adult Culex Mosquitoes in an Urban West Nile Virus Hotspot: A Mark-Capture Study Incorporating Stable Isotope Enrichment of Natural Larval Habitats. PLOS Negl. Trop. Dis. 2014, 8, e2768. [Google Scholar] [CrossRef]
- Peng, R.D.; Dominici, F.; Louis, T.A. Model Choice in Time Series Studies of Air Pollution and Mortality. J. R. Stat. Soc. Ser. A (Stat. Soc.) 2006, 169, 179–203. [Google Scholar] [CrossRef] [Green Version]
- RStudio Team. RStudio: Integrated Development for R; RStudio Team: Boston, MA, USA, 2020. [Google Scholar]
- Bates, D.; Maechler, M.; Bolker, B.; Walker, S.; Bojesen Christensen, R.H.; Singmann, H.; Dai, B.; Scheipl, F. Linear Mixed-Effects Models Using “Eigen” and S4: The R Package “Lme4”. Available online: https://cran.r-project.org/web/packages/lme4/index.html (accessed on 20 October 2020).
- Gasparrini, A.; Armstrong, B.; Kenward, M.G. Distributed Lag Non-Linear Models. Stat. Med. 2010, 29, 2224–2234. [Google Scholar] [CrossRef] [PubMed] [Green Version]
- Gasparrini, A. Distributed Lag Linear and Non-Linear Models: The R Package Dlnm. J. Stat. Softw. 2011, 43, 1–20. [Google Scholar] [CrossRef] [Green Version]
- CDC (Centers for Disease Control and Prevention). NIOSH Mosquito-Borne Diseases. Available online: https://www.cdc.gov/niosh/topics/outdoor/mosquito-borne/default.html (accessed on 8 September 2020).
Figure 2.
Map of CSO outfall sites, shown as circles, subsewersheds, shown as colored polygons, and SCM density, shown as black bars, in Washington DC. Subsewersheds are color-coded to match outfalls into which they drain to during a CSO.
Figure 2.
Map of CSO outfall sites, shown as circles, subsewersheds, shown as colored polygons, and SCM density, shown as black bars, in Washington DC. Subsewersheds are color-coded to match outfalls into which they drain to during a CSO.

Figure 3.
Daily precipitation, maximum daily temperature, and monthly Culex mosquito count at the SCMs that use both pooling and vegetation, only vegetation, only pooling, or no pooling or vegetation. Error bars represent standard error. NCSO Outfalls = 47.
Figure 3.
Daily precipitation, maximum daily temperature, and monthly Culex mosquito count at the SCMs that use both pooling and vegetation, only vegetation, only pooling, or no pooling or vegetation. Error bars represent standard error. NCSO Outfalls = 47.

Figure 4.
Daily precipitation, maximum daily temperature, and monthly Culex mosquito count at the CSO outfalls. Culex mosquito counts are separated by the density of SCM treatment at the respective subsewershed: no, low, medium, or high SCM density. Error bars represent standard error. NCSO Outfalls = 47.

Figure 5.
Lagged effect of days with at least one inch of rainfall (≥95th percentile) on Culex mosquito count at SCMs that (a) use both pooling and vegetation, (b) use only vegetation, (c) use only pooling, and (d) use no vegetation or pooling. Time period was 1 May 2018 to 31 October 2018. NCSO Outfalls = 47. NSCM-Pool&Veg= 3018. NSCM-Veg = 7355. NSCM-Pool = 5675. NSCM-NoPoolNoVeg= 2322. N≥1 inch rainfall: 16 days. Ratio Outcome is represented by: . The 95% confidence intervals are shown in gray cross hatching.

Figure 6.
Lagged effect of days with at least one inch of rainfall (≥ 95th percentile) on Culex mosquito count CSO outfalls treated by (a) no SCMs, (b) a low density of SCMs, (c) a medium density of SCMs, and (d) a high density of SCMs. Time period was 1 May 2018 to 31 October 2018. NCSO Outfalls = 47. NNo SCM = 6 subsewersheds. NLow Density SCM = 14 subsewersheds. NMedium Density SCM = 13 subsewersheds. NHigh Density SCM = 14 subsewersheds. N≥1 inch rainfall: 16 days. Ratio Outcome is represented by: . The 95% confidence intervals are shown in cross hatching.


Table 1.
Spatial associations revealing the decrease in Culex mosquitoes at the CSO outfalls as well as at the subsewersheds for each increase in standard deviation (STDEV) of SCM within the subsewershed.
Table 1.
Spatial associations revealing the decrease in Culex mosquitoes at the CSO outfalls as well as at the subsewersheds for each increase in standard deviation (STDEV) of SCM within the subsewershed.
| Location Type | Decrease in Culex Mosquitoes at Location Type per STDEV Increase in SCM Count | [95% Confidence Intervals] |
|---|---|---|
| Subsewersheds | 67.0% | [50.3%, 78.1%] |
| Outfalls | 67.2% | [50.9%, 78.0%] |
Publisher’s Note: MDPI stays neutral with regard to jurisdictional claims in published maps and institutional affiliations. |
© 2021 by the authors. Licensee MDPI, Basel, Switzerland. This article is an open access article distributed under the terms and conditions of the Creative Commons Attribution (CC BY) license (https://creativecommons.org/licenses/by/4.0/).
Share and Cite
MDPI and ACS Style
Chan, A.Y.; Kim, H.; Bell, M.L. Culex Mosquitoes at Stormwater Control Measures and Combined Sewer Overflow Outfalls after Heavy Rainfall. Water 2022, 14, 31. https://0-doi-org.brum.beds.ac.uk/10.3390/w14010031
AMA Style
Chan AY, Kim H, Bell ML. Culex Mosquitoes at Stormwater Control Measures and Combined Sewer Overflow Outfalls after Heavy Rainfall. Water. 2022; 14(1):31. https://0-doi-org.brum.beds.ac.uk/10.3390/w14010031
Chicago/Turabian StyleChan, Alisha Yee, Honghyok Kim, and Michelle L. Bell. 2022. "Culex Mosquitoes at Stormwater Control Measures and Combined Sewer Overflow Outfalls after Heavy Rainfall" Water 14, no. 1: 31. https://0-doi-org.brum.beds.ac.uk/10.3390/w14010031
Note that from the first issue of 2016, this journal uses article numbers instead of page numbers. See further details here.