Article

Effects of Different Irrigation Modes on the Growth, Physiology, Farmland Microclimate Characteristics, and Yield of Cotton in an Oasis

1
College of Water and Architectural Engineering, Shihezi University, Shihezi 832000, China
2
College of Civil Engineering, Kashi University, Kashi 844006, China
3
College of Hydraulic and Civil Engineering, Xinjiang Agricultural University, Urumqi 830000, China
4
Xinjiang Academy of Agricultural Reclamation, Shihezi 832000, China
*
Authors to whom correspondence should be addressed.
Submission received: 24 April 2022 / Revised: 11 May 2022 / Accepted: 12 May 2022 / Published: 15 May 2022

Abstract

:
In order to determine the effects of different water-saving irrigation techniques on physiological growth, farmland microclimate, and yield of cotton (Gossypium Spp.), a two-year field experiment was carried out in an oasis area of Northwest China, and three irrigation methods were tested, including on-film irrigation (T1), under-film drip irrigation (T2), and automatic irrigation (T3). The results showed that the relative humidity, plant height, leaf area, stem thick, and photosynthetic index with the T3 treatment were significantly higher than those with T2 and T1. The air and soil temperature with T3 (except seedling stage) were considerably lower than those with T2 and T1. According to the fitting and statistical analysis of each index and yield, except for air and soil temperature, the other indices were positively correlated with yield. Based on the analysis of each index, the T3 treatment had the most significant regulatory effect on cotton’s physiological growth and farmland microclimate. Compared with T1, the irrigation amounts of T2 and T3 decreased by 16.43% and 25.90%, but the yield increased by 38.96% and 46.28%, respectively. The automatic irrigation strategy showed significant advantages in water saving and yield increase, which could provide some reference for cotton drip irrigation in similarly arid areas.

Graphical Abstract

1. Introduction

Cotton fiber has ideal length, good texture, strong moisture absorption, air permeability, and dye affinity [1,2]. Therefore, cotton (Gossypium Spp.) is an important textile material, as one of the principal economic crops in China [3]. At present, cotton accounts for more than 40% of all textile raw materials, and this proportion continues to increase [
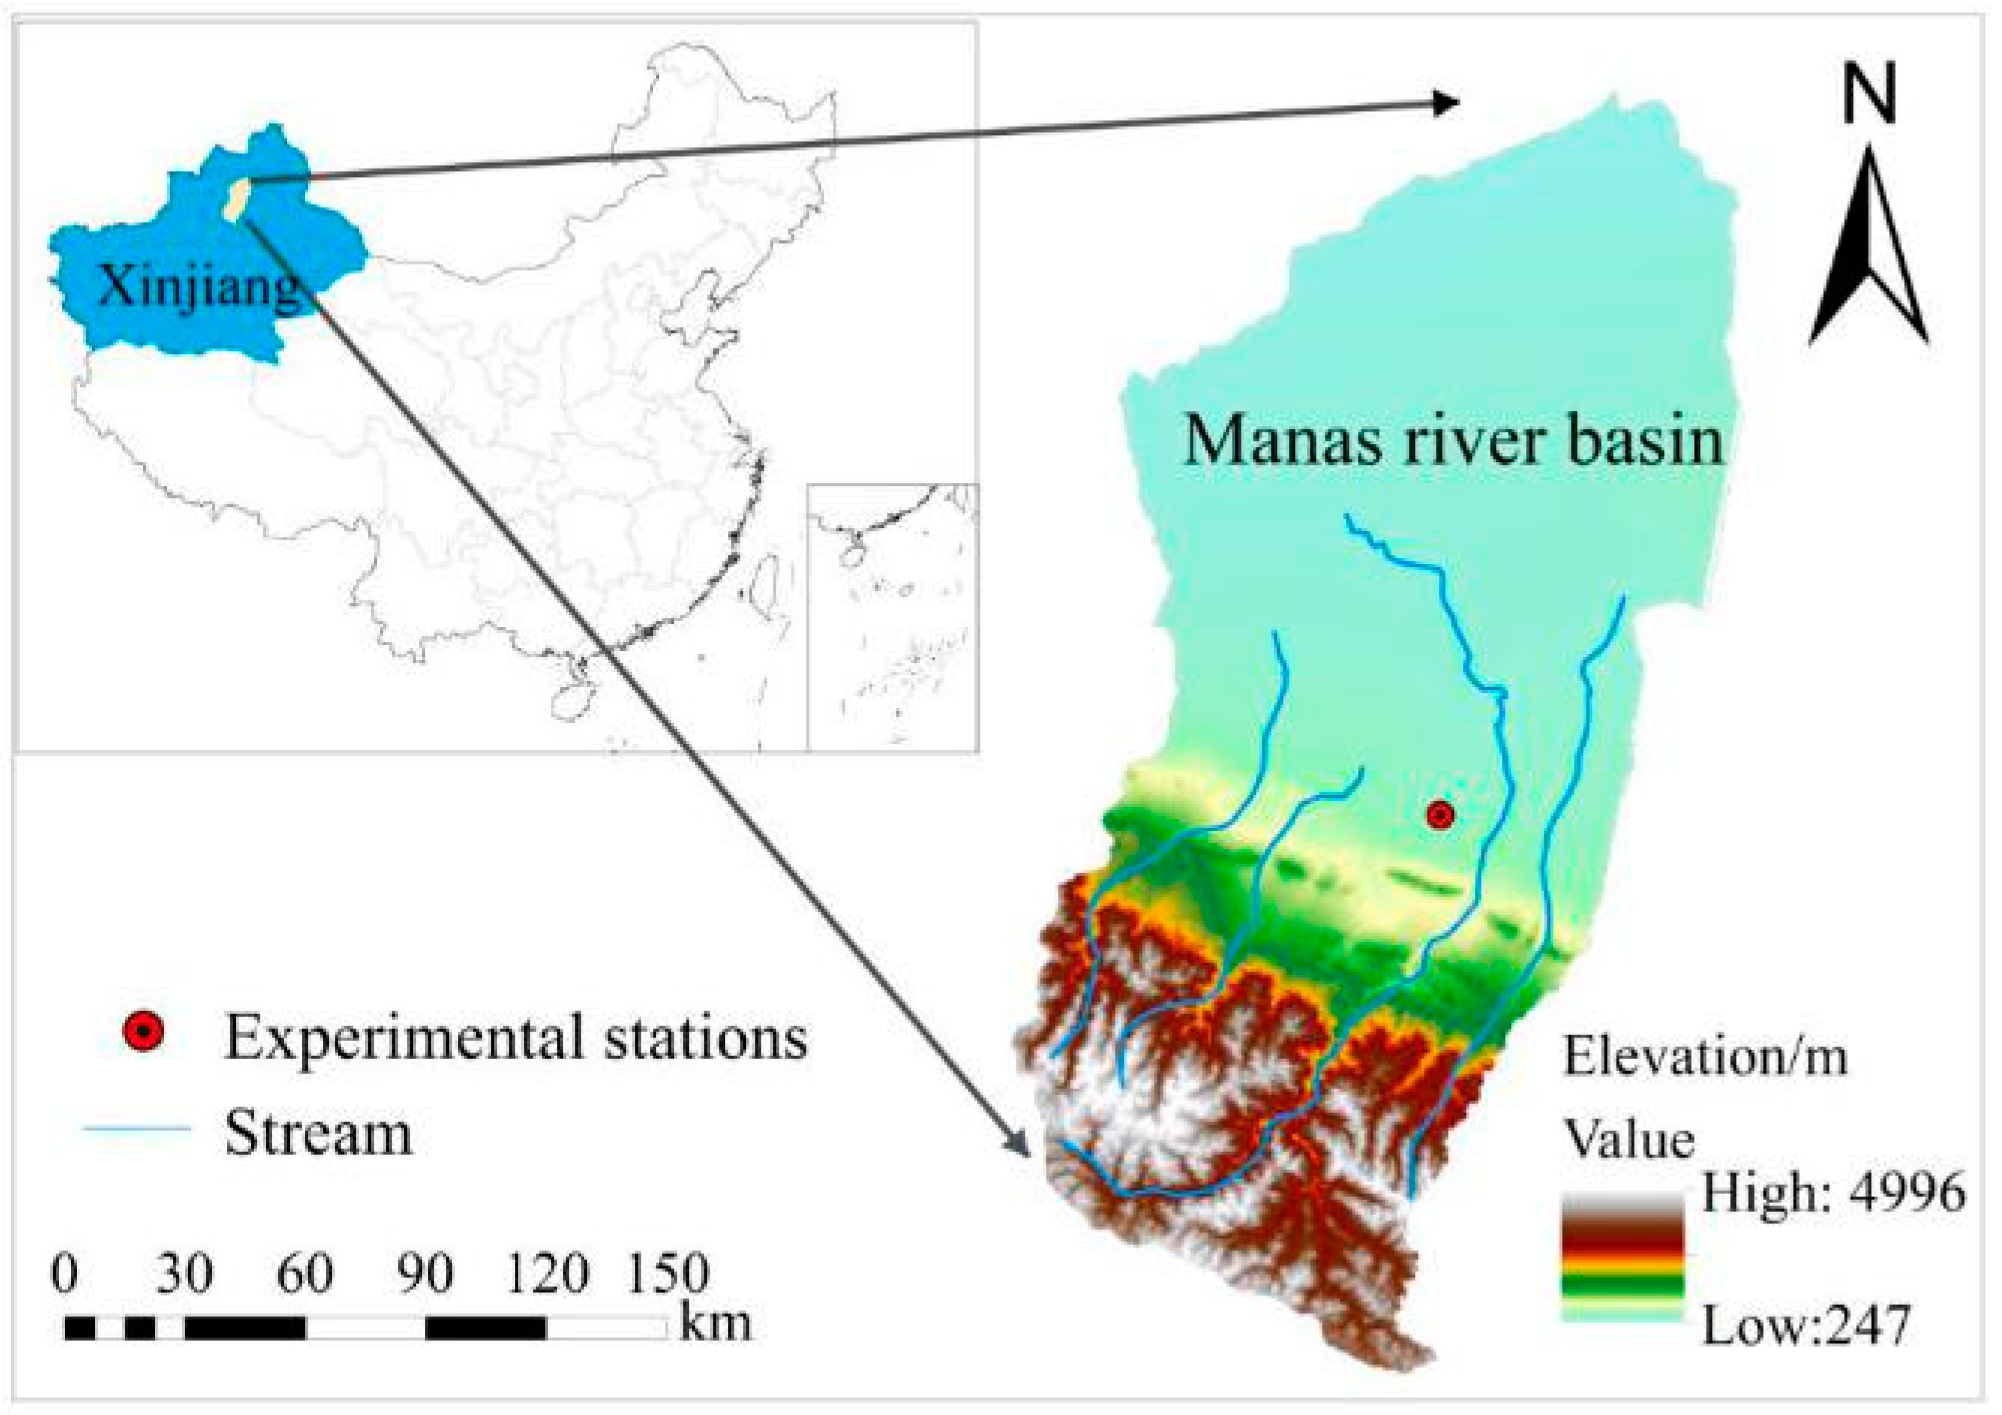
4]. Xinjiang is the main region of origin of cotton in China, as a result of its unique climatic conditions and vast land resources making it very suitable for the growth of cotton [5]. Since under-film drip-irrigation technology has been widely implemented in Xinjiang, high-yield cotton cultivation techniques have gradually matured. According to the National Bureau of Statistics, as of 2019, the cotton planting area in Xinjiang was 2.54 × 10⁶ hm2 and the yield was 5.00 × 10⁶ t, accounting for 76.08% of the national cotton planting area and 84.94% of the total cotton yield [6,7]. However, with the increase in under-film drip irrigation over time, its disadvantages of excessive consumption of soil water and soil resources have become more obvious, and the cotton yield has decreased year by year [8,9]. In recent years, in order to increase yield, cotton farmers have continuously increased irrigation water consumption, even exceeding the demand for cotton growth [10]. Problems such as rampant plant growth, yield and quality decline, low water-use efficiency, and premature senescence of cotton have become increasingly intense, and have become prominent problems affecting the further yield increase of cotton [11,12]. Therefore, it is urgent to advance the high-yield cultivation techniques of cotton in Xinjiang to improve the utilization rate of water resources and increase the cotton yield.
Automatic irrigation control systems combine water-saving irrigation technology, computer technology, sensors, and communication technology, enabling monitoring and prediction of soil moisture in real time, depending on the characteristics of crop water demand, and can achieve on-demand irrigation and precision irrigation [13,14]. The crisis of water resources in Xinjiang is prominent, and serves as a good foundation for automatic irrigation. The Xinjiang Production and Construction Corps vigorously promote automatic drip-irrigation technology, where the eighth division’s 148 regiments oversee 45 hm2 of cotton using automatic drip-irrigation technology. Automatic drip-irrigation technology mainly uses soil moisture sensors to control irrigation, which also plays a certain role in improving crop water-use efficiency and yield [15,16]. Jones [17] and Van [18] considered capacitance- or frequency-domain reflection measurement sensors to be suitable soil moisture sensors for automated irrigation systems in nursery and greenhouse production, due to ease of maintenance, low cost, and reliability. Bacci used tension gauges to detect water potential in flowerpots to adapt water supply to plants’ actual needs, reducing consumption without having a negative impact on plants [19]. Riber and Yoder used soil water sensors and a weather forecasting device to monitor soil moisture and predict crop transpiration in a real-time fuzzy control irrigation system. The system used changes in climate and soil moisture to control irrigation [20]. Devitt [21] developed an intelligent irrigation automation system based on changes in plant transpiration, and achieved good water-saving and yield-increasing effects after local practical application. Nielson [22] and Yuan [23] used different water shortage indices of crop canopy temperature as feedback indices to judge the water shortage status of crops, so as to accurately find the threshold of irrigation time and achieve more accurate irrigation. Yuan [24] designed an intelligent irrigation system based on GPRS + ZigBee wireless networking technology, which could adjust and control the amount of irrigation according to the changes in light intensity, environmental humidity, and soil temperature, so as to ensure the balance and stability of the irrigated ecological environment. Scholars have studied large-scale farmland irrigation computer control systems with multiple communication forms and remote control irrigation and fertilization, which can be commonly used in farmland, orchards, and other green spaces [25,26]. Advanced irrigation technology can improve the irrigation water-use efficiency and the yield of cotton, and achieve the efficient utilization of water resources, which is the inevitable trend of the development of high-yield cultivation techniques in Xinjiang.
It is well known that crop growth is affected not only by the soil environment, but also by the farmland microclimate environment. Farmland microclimate is derived from the balance of matter and energy between soil–crop–atmosphere systems [27]. A reasonable farmland microclimate can regulate the temperature and humidity of the environment, improve light-use efficiency, and prevent wind and sand [28]. It can also effectively regulate crop photosynthesis and material conversion, and has a positive impact on crops’ physiological growth and yield improvement [29]. As for influencing factors of the farmland microclimate, previous studies have mainly focused on crop planting density, intercropping mode, planting mode, and coating film types; however, there have been relatively few studies on irrigation methods [30,
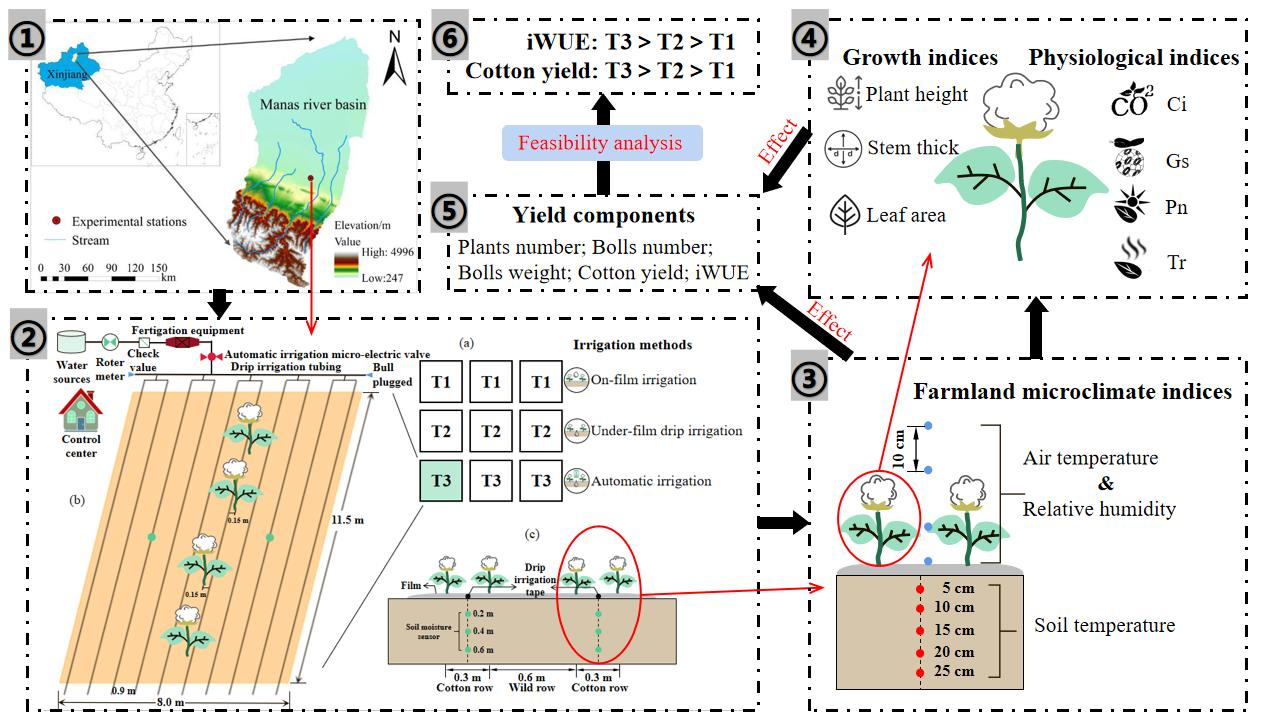
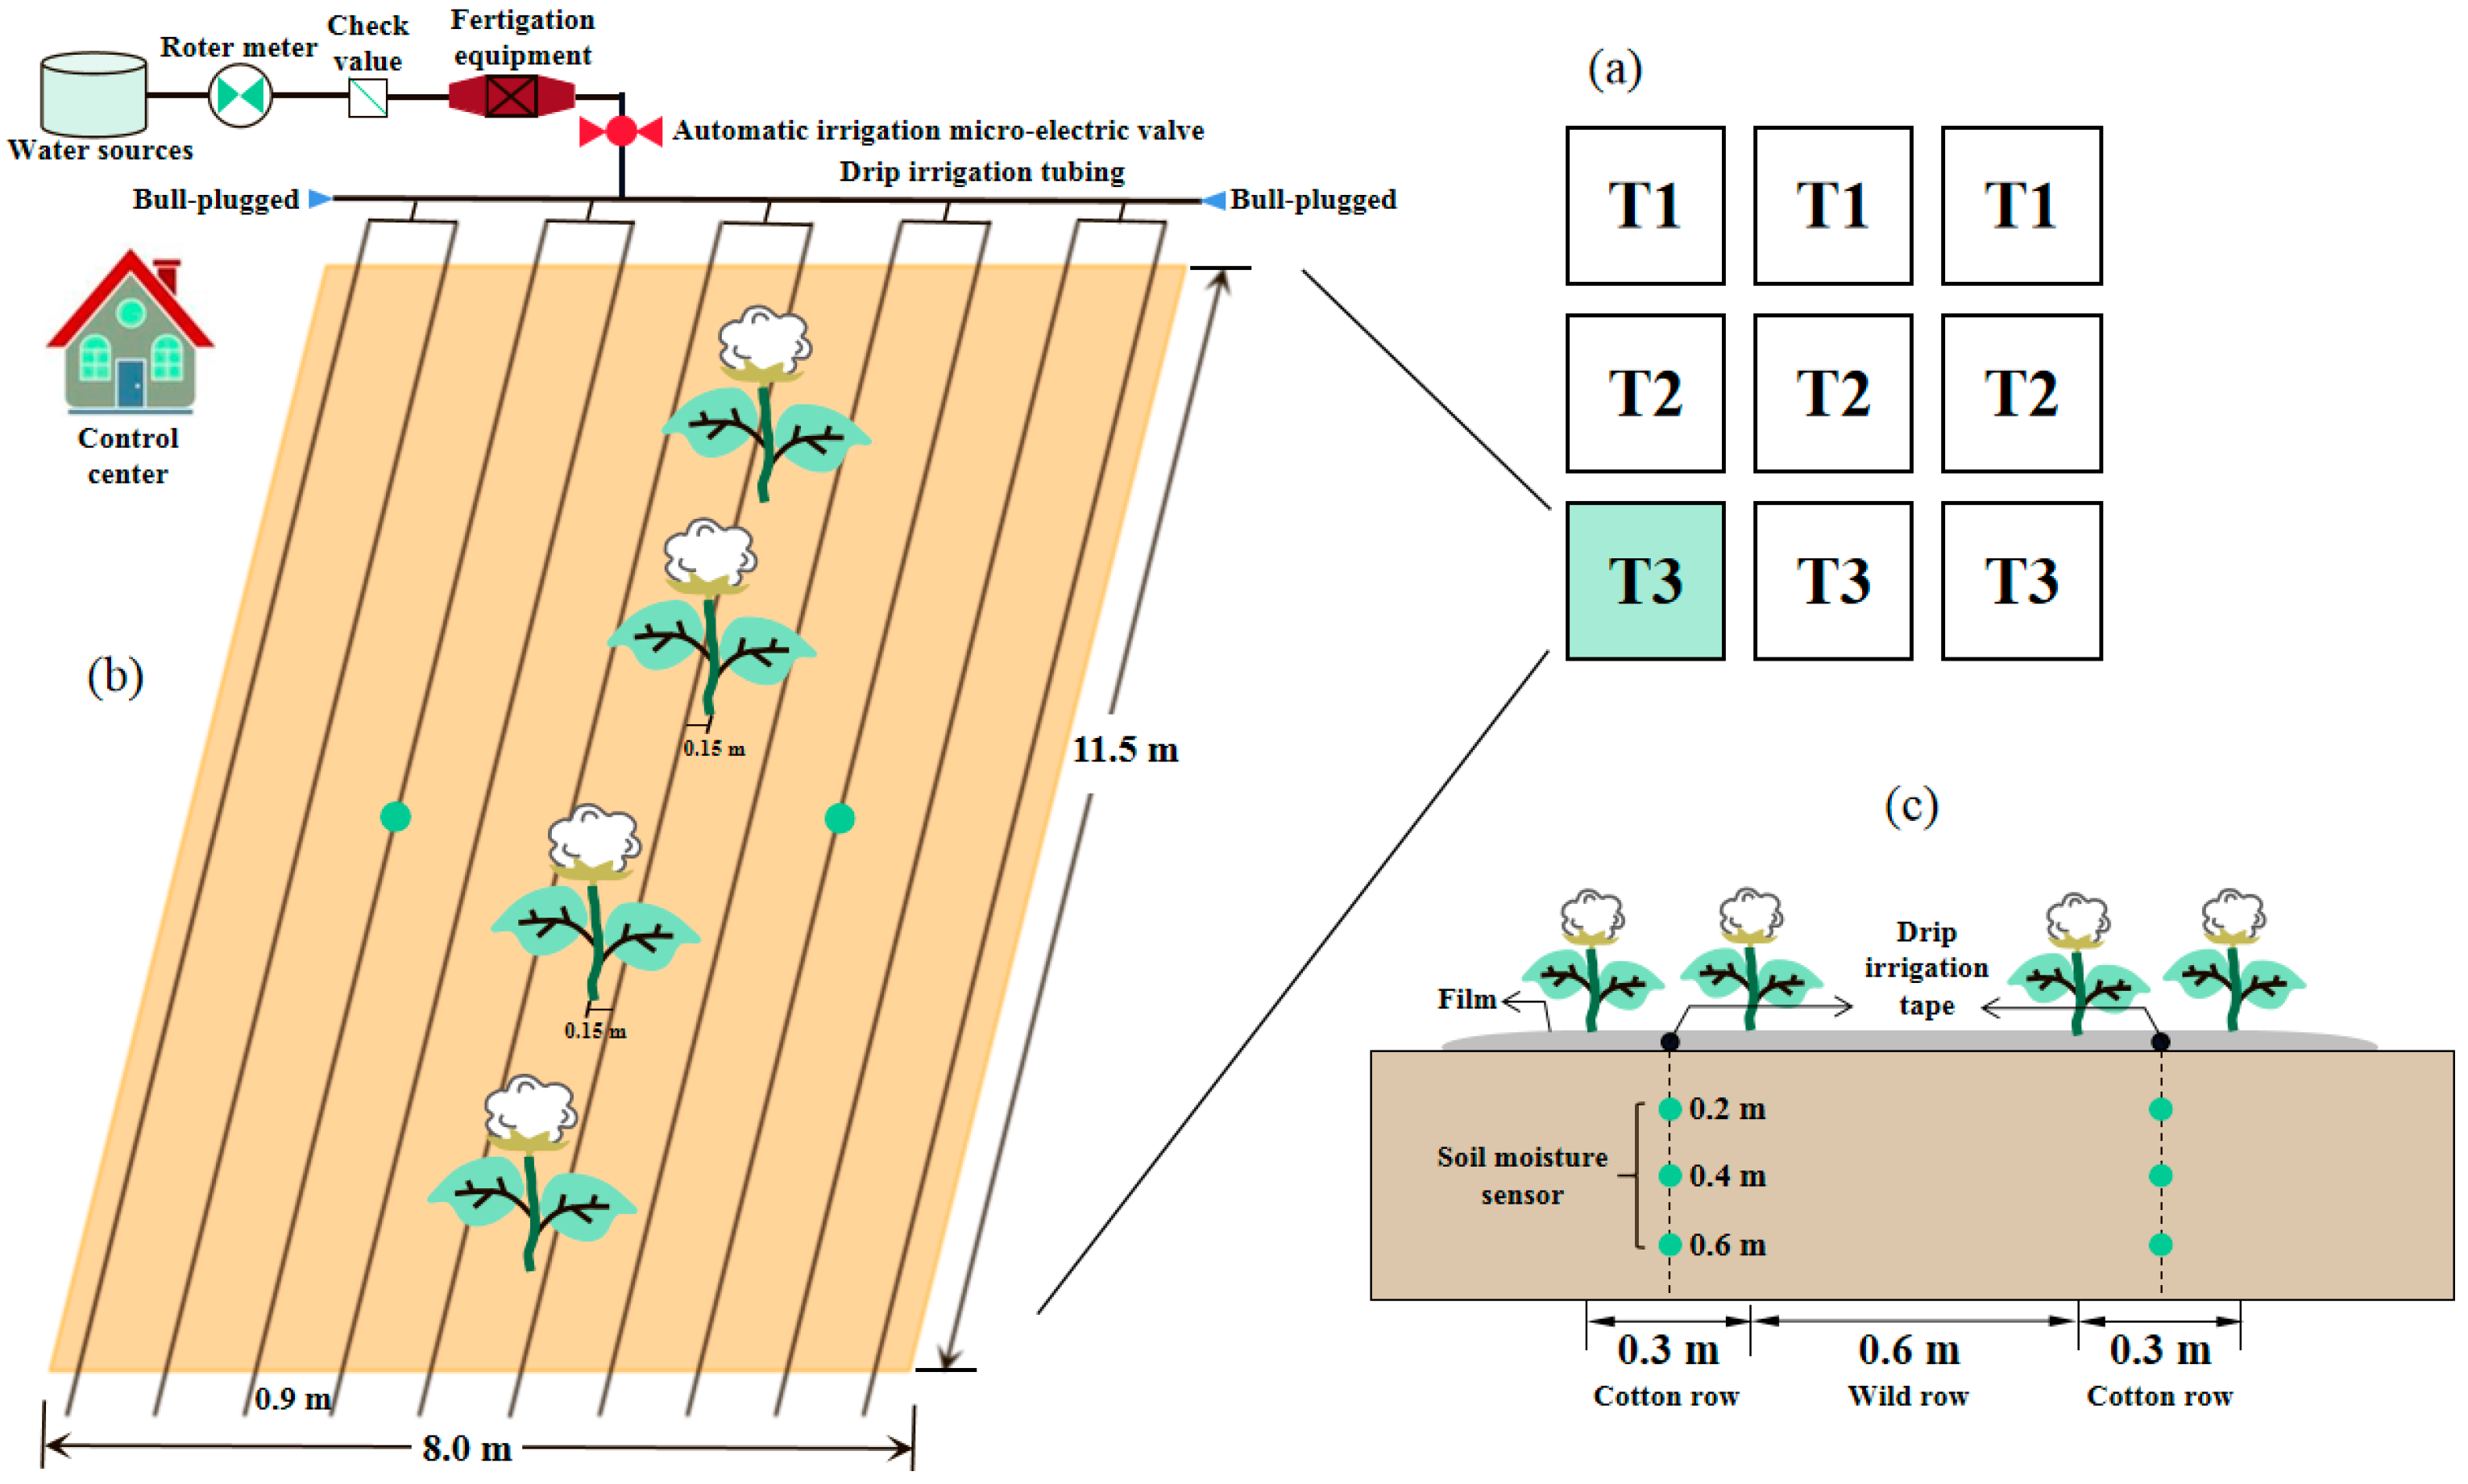
31]. Irrigation is an important part of agricultural production; it changes the soil environment and, thus, the farmland microclimate environment. Therefore, this study discusses the effects of different irrigation methods on cotton’s physiological and growth indices, yield, and farmland microclimate, thus providing valuable information to boost yields by selecting appropriate irrigation techniques in similar areas.

2. Materials and Methods

2.1. Experiment Site

A field experiment was conducted over two crop growth periods from 2018 to 2019 in the Key Laboratory of Modern Water-Saving Irrigation (85°57′49″ E, 44°19′28″ N), Shihezi, Xinjiang Province, Northwest China (Figure 1). The test station is located in the western suburbs of Shihezi, with an elevation of 452 m and an average slope of 5.6‰. The region has a temperate continental climate, with an annual average sunshine time of about 2868 h. The accumulated temperature above 10 °C is 3472.3 °C, and the accumulated temperature above 15 °C is 2958.4 °C. The average annual rainfall is 209 mm, and the average annual evaporation is 1658 mm. The soil conditions of each soil layer in the test station are shown in Table 1. The meteorological data of the experimental area during the cotton growth periods are shown in Figure 2.

2.2. Experimental Design

The field was established in a randomized block design with 3 replicates. The plot (92 m2) was 11.5 m long and 8 m wide. A common local cotton variety, “Nongfeng No.133”, was raised in both years. The sowing dates were 22 April 2018 and 24 April 2019, and the harvest dates were 3 October 2018 and 1 October 2019. According to the habits of local farmers when planting cotton, cotton farmers have weak water-saving awareness and engage in excessive fertilization. This generally leads to waste of water and fertilizer. To find the most suitable irrigation strategy and improve the utilization efficiency of water, three irrigation methods based on previous research and local habits were designed: On-film irrigation (T1)—ridges were made around the film, and seedling holes were opened in the film. Irrigation took place 5 times in both years, and the irrigation quota was 718 mm. The planting method of one film and four rows was adopted, and the film width was 140 cm; Under-film drip irrigation (T2)—the planting mode was one film, two tubes, and four rows, and the film width was 140 cm. In this mode, the narrow row length was 30 cm, the wide row length was 60 cm, and the plant spacing was 15 cm. There were 14 instances of irrigation and 600 mm irrigation quotas in the whole growth period, including 2 times and 25 mm at the seedling stage, 10 times and 50 mm at the budding and flowering stages, and 2 times and 25 mm at the boll-opening stage; Automatic irrigation (T3)—the planting pattern was the same as in T2. In this mode, three soil moisture sensors were buried in the center of the left and right parts of the plot, and each group of sensors was buried at 20 cm, 40 cm, and 60 cm directly below the dropper.
The irrigation threshold of each growth period (the percentage of soil moisture content to soil field capacity; threshold 3%) is shown in Table 2. When the soil moisture content reached the lower limit of the set irrigation threshold, the irrigation was started, and was stopped when the irrigation threshold reached the upper limit. Each time, urea (CO(NH2)2) and potassium phosphate amine (KH2PO4) were applied at a ratio of 2:1. The chemical control, topping, spraying, weeding, and other agronomic measures of all treatments were consistent. The automatic irrigation system, automatic irrigation-decision system, soil moisture sensors, automatic fertilization devices, and field automatic irrigation controllers used in the experiment were produced by Guizhou Aerospace Smart Agriculture Co., Ltd. (Guiyang, China). The type of drip-irrigation belt was a single-wing labyrinth drip-irrigation belt (WDF16/2.6-100) produced by Xinjiang Tianye Company (Urumqi, China). The wall thickness was 0.18 mm, the inner diameter was 16 mm, the drip hole spacing was 300 mm, the rated flow was 2.6 L·h−1, and the working pressure was 0.05–0.1 MPa. A schematic representation of the experimental setup is illustrated in Figure 3.

2.3. Sampling and Measurements

2.3.1. Farmland Microclimate Indices

A metallic mercury geothermometer was used to measure the soil temperature at 5, 10, 15, 20, and 25 cm below the cotton plants in each treatment, and the average value was taken as the soil temperature at this point. The monitoring time was 08:00–20:00 at the seedling stage, budding stage, flowering stage, and boll-opening stage. Each treatment was repeated three times, and the average value was taken.
The air temperature and relative humidity at the seedling stage, budding stage, flowering stage, and boll-opening stage were measured with a handheld meteorological instrument (Kestrel5200, Berlin, Germany). The measuring positions were the lower, the middle, the canopy and 10 cm above the canopy of the cotton. The measuring range was a cotton row with uniform growth except for the boundary. Each treatment was replicated three times.

2.3.2. Cotton Physiological Indices

Cotton physiological indices under natural atmospheric conditions were measured every 10 days between 08:00 and 20:00 (local time) using a handheld photosynthesis apparatus (CID CI-340, San Francisco, CA, USA). These indices included net photosynthetic rate (Pn) and transpiration rate (Tr), intercellular CO2 concentration (Ci), and stomatal conductance (Gs), as well as environmental factors such as photosynthetically active radiation (PAR), air temperature (Ta), and CO2 concentration in the air. The basic environmental parameters during the experiment were as follows: the air temperature was 29.5–37.4 °C, the light intensity was 1695–2148 µmol·m−2·s−1, and the CO2 concentration was 308–710 μmol·mol−1. On the basis of these measurements, WUEins was calculated as follows [32]:
W U E i n s = P n / T r

2.3.3. Cotton Growth Indices

Cotton growth indices were measured within 46~164 d after sowing, including plant height (PH), stem thickness (ST), and leaf area (LA). Three random plants per treatment were sampled at 7–10-day intervals to measure cotton growth indices during the different cotton growth stages (seedling, budding, flowering, and boll-opening stages). Plant height (height from the cotyledon node to the top leaf) was measured with a ruler. Stem thickness was measured with a Vernier caliper. The length (L) and width (W) of all green leaves were measured with a ruler, and leaf area was calculated as follows:
L A = L × W × 0.84

2.3.4. Yield and Irrigation Water-Utilization Efficiency

Three 2 m × 1.4 m plots were selected for each treatment to measure the number of plants (P), number of bolls (S), weight of 30 bolls (M) and single boll weight (G). The yield-related indicators were averaged. Finally, the yield (Y) (kg·hm−2) was calculated as follows:
G = M / 30
Y = S × G × 30
The irrigation water-utilization efficiency (iWUE) (kg·m−3) was calculated as follows [33]:
i W U E = Y / I
where I is the amount of irrigation water (m3·hm−2).

2.3.5. Data Normalization

The data normalization was carried out to scale the data proportionally and make them fall into a small specific interval. Data normalization can remove the unit limitations of data and convert them into dimensionless pure values, so that the indices of different units or orders of magnitude can be compared and weighted. This study used the Z-score method to standardize the data, and the transformation formula was as follows:
x * = x i μ σ
σ = 1 n ( x i μ ) 2 n
where x* represents standardized values, μ is the mean value, and σ is the standard deviation.

2.4. Statistical Analysis

The value of each indicator was subjected to the Shapiro–Wilk normality test and the homogeneity of variance test, and there were no significant differences between the two years (p > 0.05). The value of each indicator is the average of the data for 2018 and 2019. Statistical analysis was performed using IBM SPSS Version 26.0 (IBM, San Francisco, CA, USA). All data presented are the means of three replicates. Differences between means were tested by analysis of variance (ANOVA). Duncan’s test was performed to conduct multiple comparisons to identify significant differences between the means of different treatments. Differences were considered statistically significant when p < 0.05.

3. Results

3.1. Effects of Irrigation Methods on Farmland Microclimate

3.1.1. Effects of Irrigation Methods on Air Temperature

As shown in Figure 4, the differences in air temperature at different growth stages and different locations were significant (p < 0.05). Throughout the whole growth period, the air temperature at different locations was T1 > T2 > T3. Compared with T1, the air temperature in the lower, middle, canopy, and 10 cm above the of T2 and T3 decreased by 0.25, 0.3, 0.25, and 0.57 °C; and 0.84, 0.89, 0.37, and 0.77 °C, respectively. Within the growth period, the air temperature of each treatment showed the following trend: budding stage > seedling stage > flowering stage > boll-opening stage. The air temperature at different locations of each treatment showed the law of being high in the middle and low on both sides, which may have been due to the concentration of leaves in the middle, poor permeability, and relatively blocked heat exchange.

3.1.2. Effects of Irrigation Methods on Relative Air Humidity

As shown in Figure 5, the relative air humidity of T3 and T2 was significantly higher than that of T1 throughout the whole growth period, and that of T3 was significantly higher than that of T2. The relative air humidity of the surface, middle, canopy, and above in T3 was on average 2.2%, 1.9%, 3%, and 1.5% higher than that of T1, and 0.9%, 0.4%, 0.2%, 0.1% higher than that of T2. All treatments showed a decreasing trend from bottom to top, and the relative air humidity increased throughout the growth period. This was due to the continuous improvement of vegetation coverage, reducing the amount of solar radiation, and causing the relative humidity to increase. In addition, after the flowering and boll-opening stages, the air temperature decreased significantly, resulting in a decrease in atmospheric evaporation and a further increase in relative air humidity. T3 adjusted the soil moisture content to a reasonable threshold via irrigation, which promoted the good growth of crops and effectively increased the relative humidity.

3.1.3. Effects of Irrigation Methods on Soil Temperature

As shown in Table 3, the diurnal variation trend of soil temperature in each treatment throughout the whole growth period was consistent, where it began to rise slowly from 08:00 and began to decline slowly from 16:00. The soil temperature differences between the T1, T2, and T3 treatments at different growth stages were significant, and the soil temperature generally followed the trend T1 > T2 > T3. The T2 and T3 treatments significantly reduced the soil temperature, which may be attributable to differences in crop growth and soil moisture levels. The T1 treatment had poor crop growth, low vegetation coverage, high solar radiation on the soil surface, and a slow increase in soil temperature. The T2 and T3 treatments showed the opposite trend. Irrigation in the T2 and T3 treatments was more frequent, and the soil moisture content was maintained at a high level, resulting in large soil heat capacity, and a significant decrease in soil temperature, making this difference more obvious.

3.2. Effects of Different Irrigation Methods on Physiological Indices, Growth Indices, and Yield

3.2.1. Effects of Different Irrigation Methods on Plant Height, Stem Thickness, and Leaf Area

Throughout the growth period, the plant height, stem thickness, and leaf area of T1 were at the lowest levels, and the growth with this treatment was the worst. Compared with T1, the plant heights of T2 and T3 were 30.51% and 35.59% higher at the seedling stage, 65.52% and 68.96% higher at the budding stage, 42.62% and 56.90% higher at the flowering stage, and 39.20% and 71.21% higher at the boll-opening stage, respectively. During the boll-opening stage, the plant height of T2 and T3 began to show significant differences. This shows that the irrigation threshold set by T3 is more sensitive and frequent, allowing the soil moisture content to be maintained within a reasonable range. Throughout the whole growth period, the stem thickness of T2 and T3 was significantly different from that of T1, while there were no significant differences between T2 and T3. Compared with T1, the stem thickness of T2 and T3 was 25.00% and 30.56% higher at the seedling stage, 30.56% and 38.29% higher at the budding stage, 44.62% and 84.61% higher at the flowering stage, and 28.12% and 46.88% higher at the boll-opening stage, respectively. It can be seen from Figure 6 that the leaf area of T1, T2, and T3 had no meaningful differences at the seedling stage. After the budding stage, the leaf area of T2 and T3 was significantly higher than that of the T1 treatment, and the difference was significant. Compared with T1, the leaf area of T2 and T3 was 23.85% and 61.28% higher at the budding stage, 144.16% and 191.35% higher at the flowering stage, and 101.94% and 162.91% higher at the boll-opening stage, respectively. T3 used real-time monitoring of soil moisture to determine irrigation, so the cotton root system maintained a suitable state of soil moisture, which ensured the safe growth of the cotton.

3.2.2. Effects of Irrigation on Photosynthesis and Transpiration of Cotton

During the seedling stage, Pn was relatively low, with an average value of 13.51 μmol·m−2·s−1 across the different treatments (Table 4), but then peaked during budding stage, reaching an average value of 27.81 μmol·m−2·s−1 across the different treatments. Then, Pn decreased rapidly during the flowering and boll-opening stages, reaching its lowest values at the boll-opening stage, with an average of 12.81 μmol·m−2·s−1. Patterns in Tr were similar to those in Pn across the different treatments throughout the cotton-growing season. From the seedling stage to the budding stage, Tr values increased from 3.30 μmol·m−2·s−1 to the maximum value 4.88 μmol·m−2·s−1. However, from the budding stage to the boll-opening stage, Tr reduced to 3.93 μmol·m−2·s−1. WUEins at different treatments increased first, then decreased, and then rebounded slightly. In the budding stage, all treatments reached the maximum value of WUEins. The maximum value of T3 was 5.98, which was 3.46% and 10.95% higher than the maximum values of T2 and T1, respectively. With the progress of the growth period, Gs showed a downward trend, while Ci showed the opposite. From the seedling stage to the boll-opening stage, the Gs values of T1, T2, and T3 decreased by 74.77%, 68.96%, and 63.83%, respectively, while their Ci values increased by 27.90%, 22.65%, and 17.54%, respectively.
Multiple analyses showed that there were significant differences in Pn between T3 and T2, and between T3 and T1, throughout the whole growth period. However, there were no significant differences in Pn between T2 and T1 at the budding stage and the boll-opening stage. With the development of the growth period, the difference in Tr between T1, T2, and T3 gradually narrowed. There were no significant differences in Tr between T1, T2, and T3 in the boll-opening period. With the development of the growth period, the differences in WUEins values between T1, T2, and T3 gradually became obvious, and there were significant differences between the three treatments in the boll-opening period. Throughout the whole growth period, the Gs and Ci of the T1, T2, and T3 treatments showed significant differences.

3.3. Cotton Yield Components

Table 5 shows the yield components of cotton. The numbers of plants between T2 and T1, and between T3 and T1, were significantly different, but there were no significant differences between T2 and T3. This indicates that T2 and T3 met the requirements of plant survival, while T1 reduced the plant survival rate due to low water-use efficiency. The number bolls, weight of 30 bolls, yield, and iWUE of T1, T2, and T3 showed significant differences. The yield and iWUE of T3 were significantly higher than those of T1 and T2. T3 had obvious advantages in water saving and yield increase.
In order to understand the effect of each index on yield, the factors of yield improvement had to be made clear. The farmland microclimate index was fitted and analyzed with the crop yield and crop growth physiological indices (Table 6). Air temperature, stem diameter, net photosynthetic rate, transpiration rate, stomatal conductance, and yield have specific functional relationships. The relative humidity, plant height, leaf area, and yield had a high degree of fitting. This shows that the farmland microclimate and cotton growth index have great influence on cotton yield. The correlation between soil temperature and yield was weak, and the fitting degree was only 0.32. Other than air temperature and soil temperature, other indices were positively correlated with yield.
The physiological growth and development of plants and the microclimate characteristics of the farmland throughout the whole growth period of each treatment were standardized, and the heat change map was constructed. From the heat map, the differences between each treatment could be seen more intuitively. It can be observed in Figure 7 that according to the chromatographic stratification standard, the overall effect of the T3 treatment is significantly better than that of T2 and T1 in the two indicators of crop relative humidity and air temperature. In other words, the T3 treatment maintained a lower temperature and higher relative humidity throughout the whole growth period, compared with T2 and T1. This is more conducive to cotton growth. In terms of physiological growth indices of crops, the indices of the T3 treatment were significantly better than those of the T2 and T1 treatments, and the indices of the T2 treatment were also better than those of T1. As a whole, the T3 treatment was preferable to the other two treatments for regulating the farmland microclimate and promoting cotton growth and development.

4. Discussion

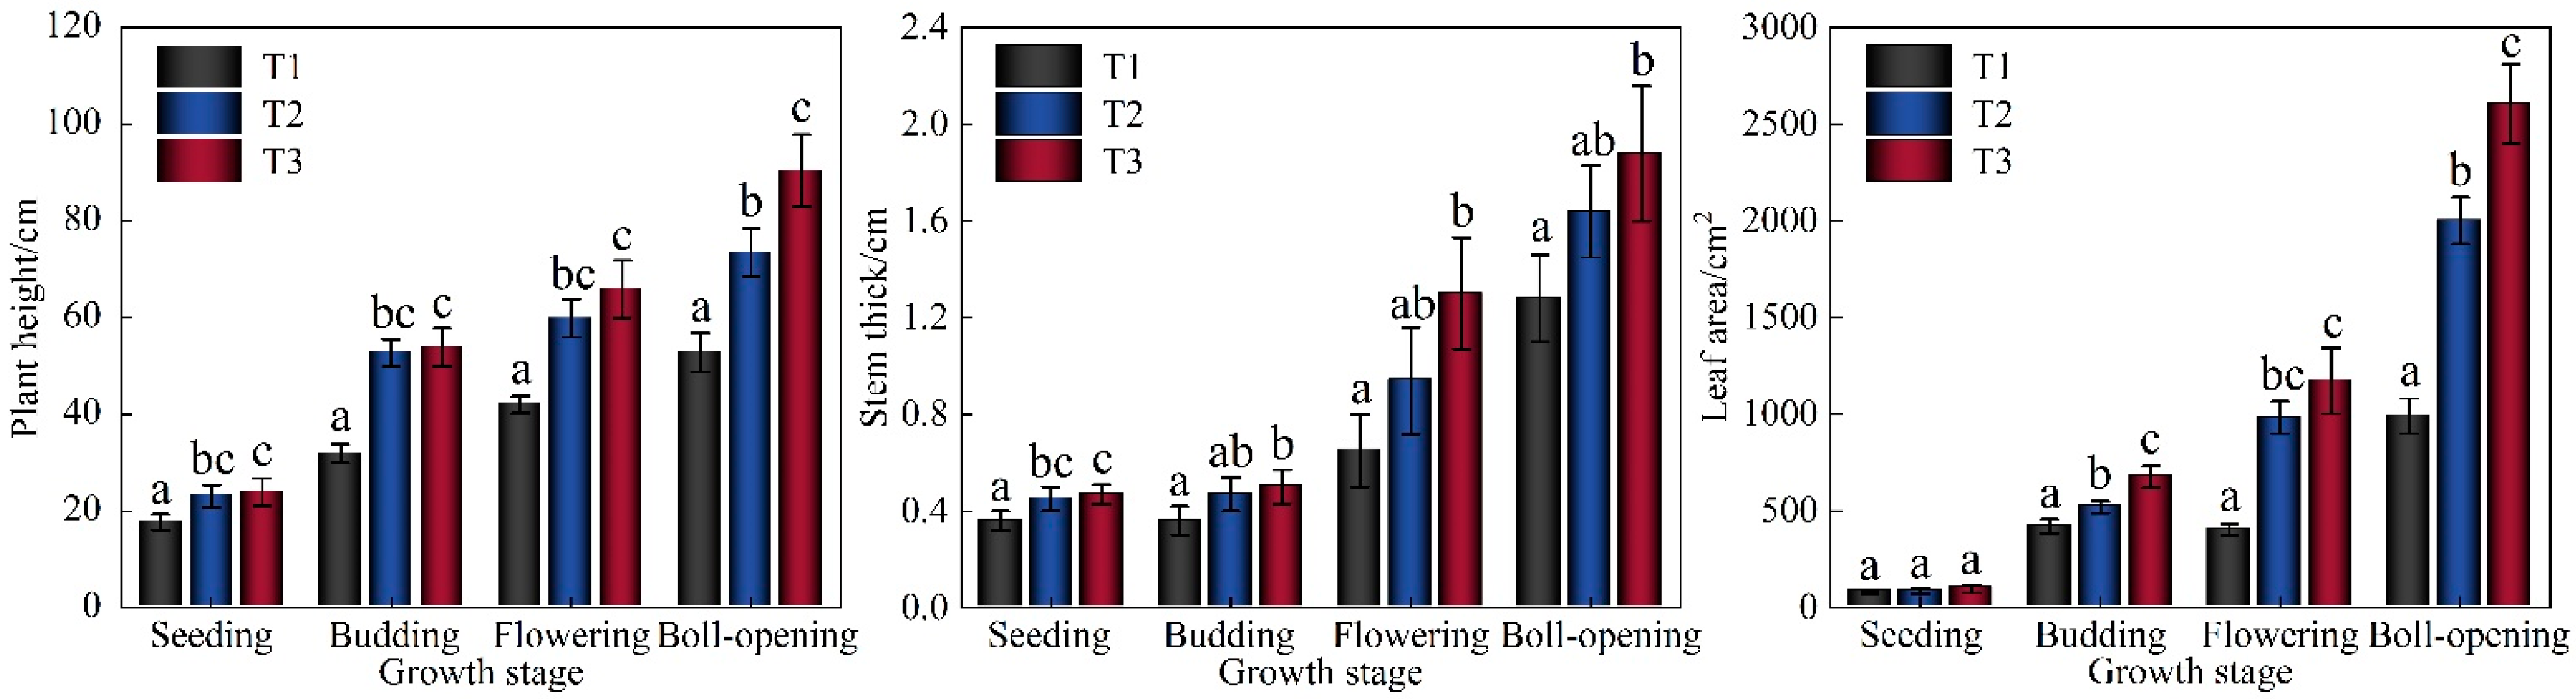
Plant height, leaf area, and stem thickness are important traits of crop growth and important indicators for evaluating crop growth [34,35]. Cotton plant height directly affects cotton density and light utilization. Cotton stem thickness has an important impact on crop nutrient absorption and migration [36]. The effect of cotton leaf area on green leaf coverage and light-use efficiency is significant, and it is also one of the important indices to measure early onset of cotton [37]. With the rapid decrease in water supply and the increase in crop water demand, people are more and more interested in precise irrigation technology to improve water productivity [38,39]. Wang [40] pointed out that a reasonable irrigation threshold can improve the growth of cotton, which is similar to the conclusion of this study. The soil environment and climate are constantly changing, and irrigation systems that can meet crops’ water demand should also be available, and more accurate information irrigation is needed to achieve this purpose. Automatic drip irrigation as a technology to obtain irrigation information is more precise than the general artificial irrigation technology, and the differences in each growth index between the three treatments were most obvious in the flowering stage. The flowering period is a sensitive period for cotton with respect to watering [41]. The amount of irrigation must be kept within a reasonable range. Insufficient irrigation will lead to the decrease in the number of cotton bolls and a decrease in cotton yield. Excessive irrigation will also lead to delays to the cotton growth period, and the cotton bolls will not produce cotton, which will also reduce its yield [42]. This study showed that the plant height, leaf area, and stem diameter of T3 at the flowering and boll-opening stages were significantly higher than those of the T2 and T1 treatments due to advanced water and fertilizer management techniques, and the cotton yield was significantly increased. It can be seen that automatic drip irrigation under mulch can make reasonable irrigation decisions in the irrigation-sensitive period of cotton by collecting information on the soil and atmospheric environment, so as to improve crop growth and yield.
The photosynthesis, growth, and development of crops depend on their genetic characteristics to a large extent, but the external environment also has a significant impact on them [43]. The construction of a reasonable farmland microclimate environment can promote the growth of crops and the improvement of photosynthetic capacity [44], which is also one of the important factors for the improvement of cotton yield. Academics [45,
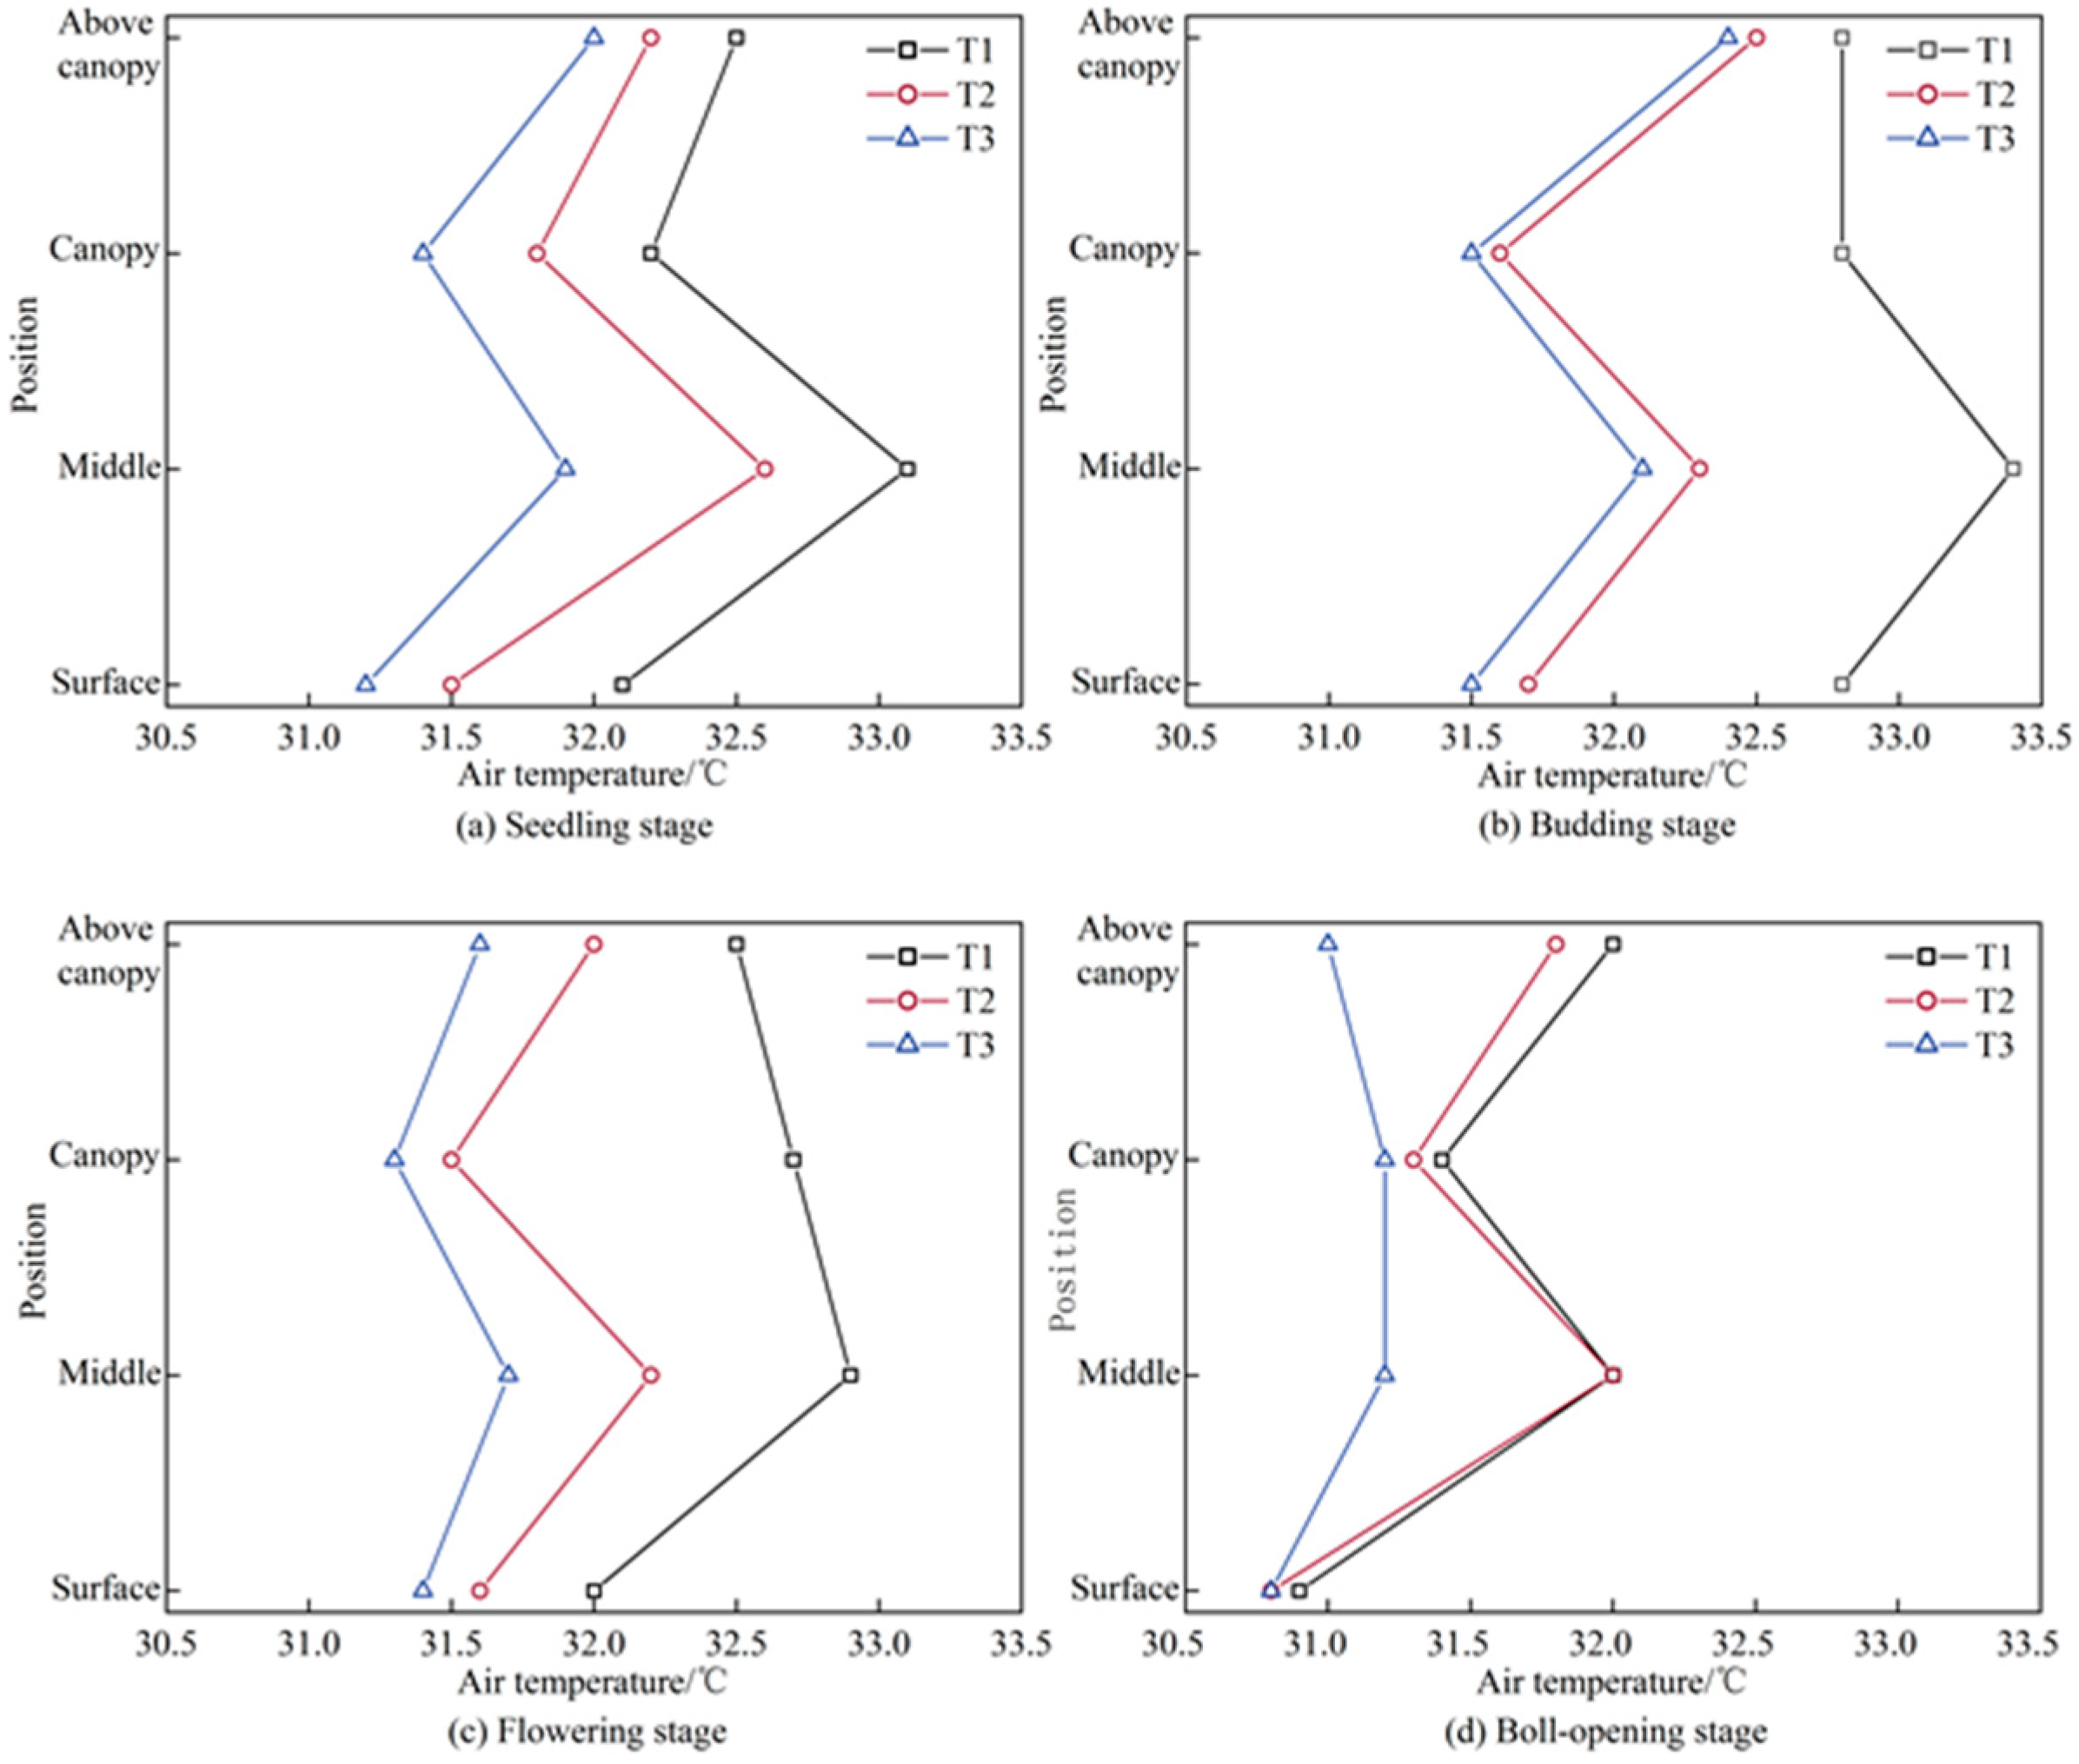
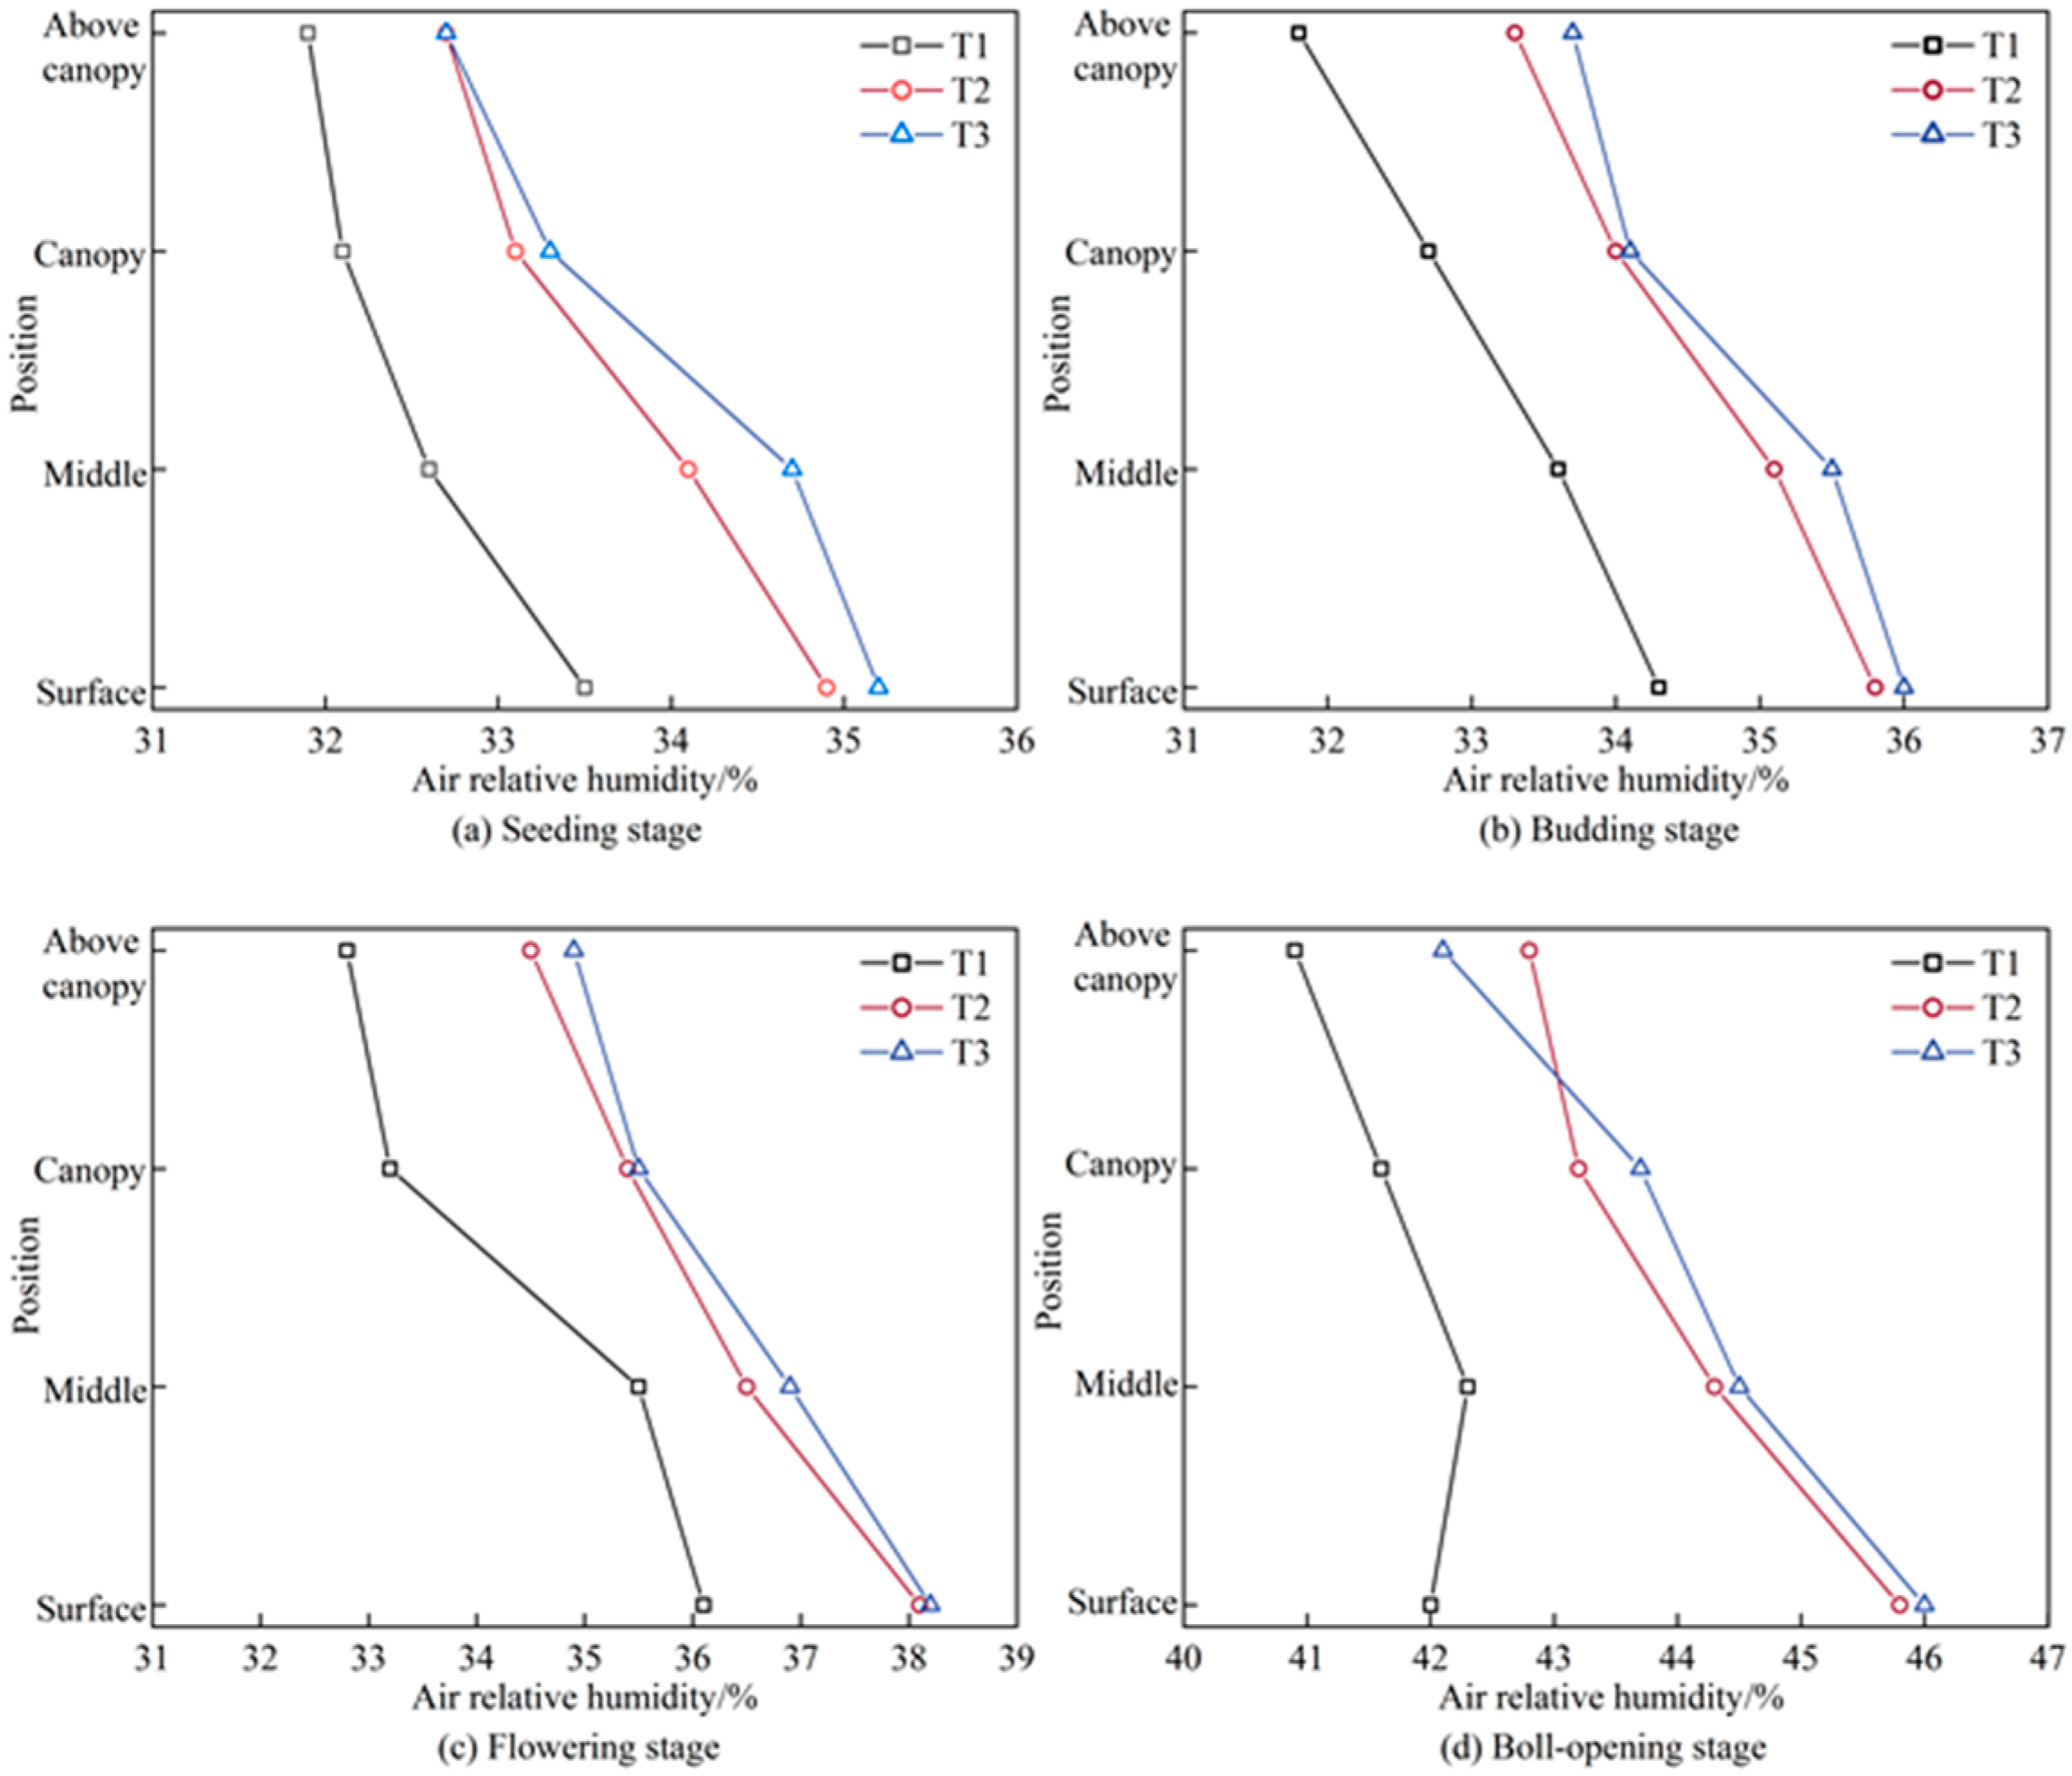
46] found that the fertilizer level of rice was inversely proportional to the air temperature within the population, but positively associated with the relative humidity. This is consistent with the results of this study. The air temperature of the T3 treatment was significantly lower than that of the T2 and T1 treatments (p < 0.05), while the relative humidity of the T3 treatment was significantly higher than that of the T2 and T1 treatments (
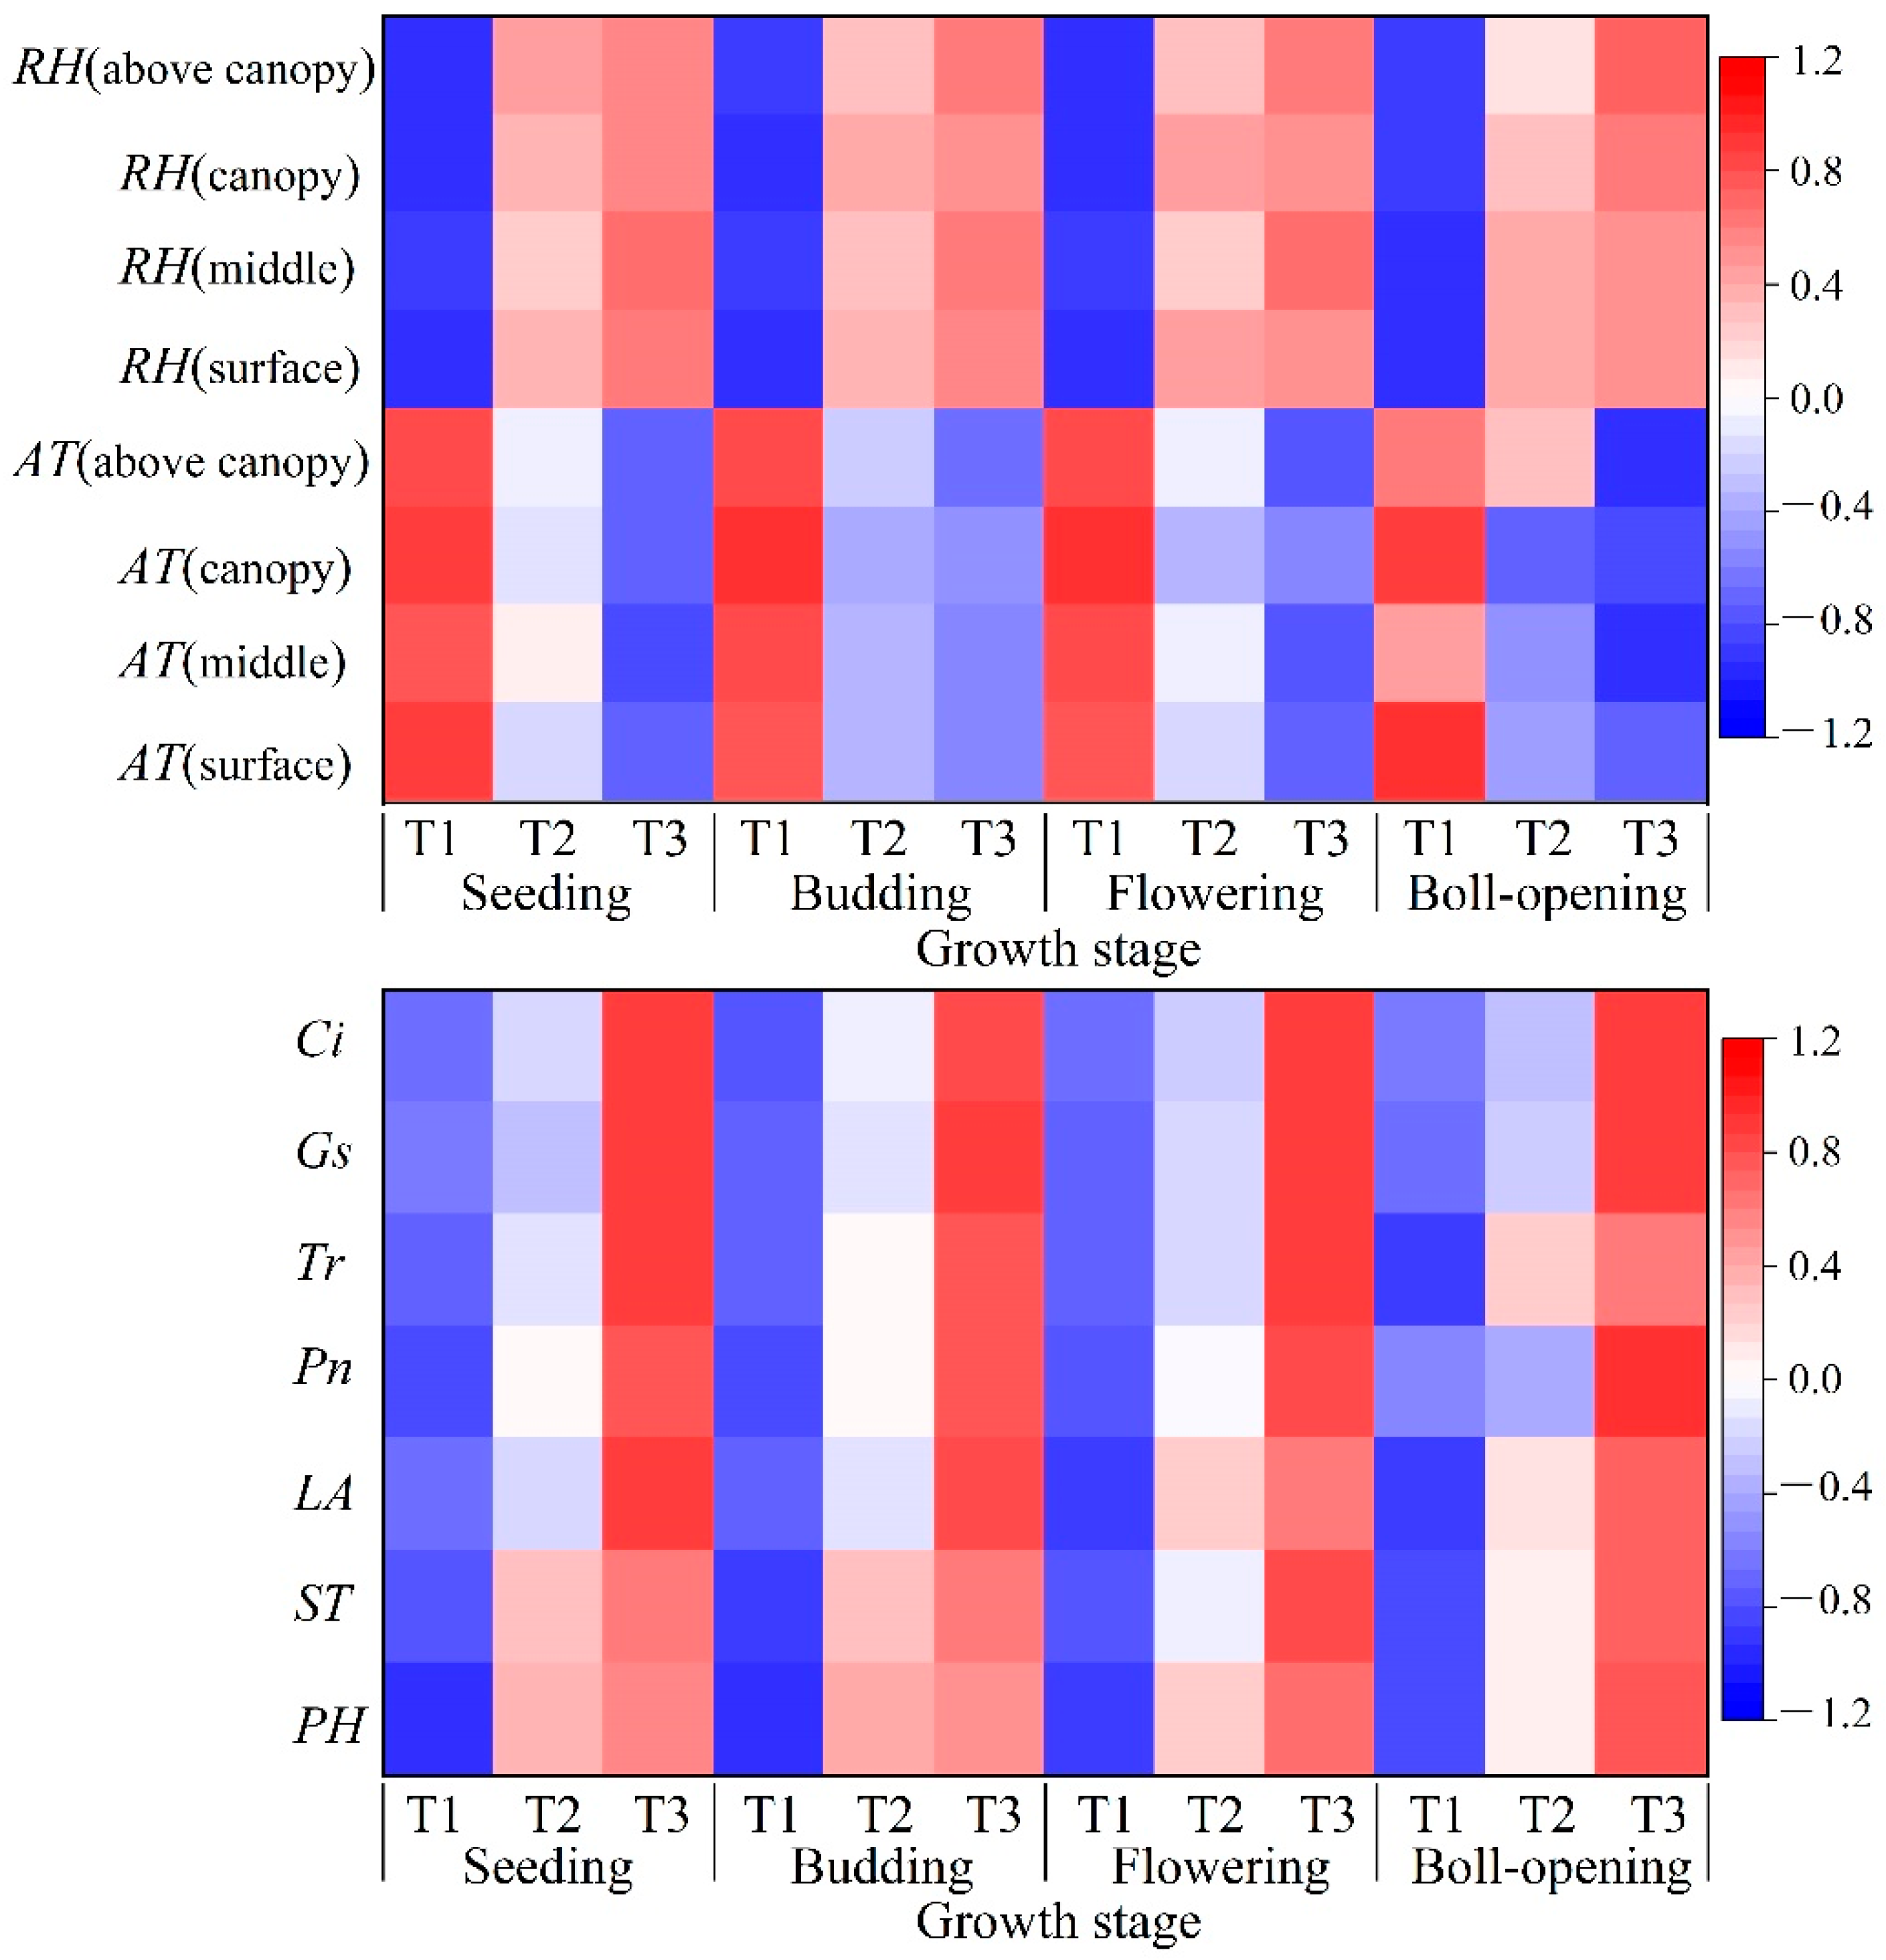
p < 0.05). After the seedling stage, the soil temperature and air temperature were both negatively correlated with yield, although relative humidity was not. This demonstrates that the technology of automatic drip irrigation under mulch can provide a colder and wetter environment for crops. Under automatic irrigation, the growth and the vegetation coverage rate of crops are better than those attained when using on-film irrigation or under-film drip irrigation. Thus, the automatic irrigation method has a good shielding effect against the light radiation, which not only improves the light-utilization efficiency, but also protects the soil from direct light. In addition, with frequent irrigation at the beginning of the flowering period, the soil moisture content is always higher, the soil heat capacity is increased, and the soil temperature is noticeably decreased. In this study, the on-film irrigation had the lowest planting density and the worst growth potential. Although the planting density of the under-film drip irrigation was the same as that with automation, the growth potential was not as good as that of automation. Therefore, different irrigation technologies regulate the farmland microclimate through their planting density, and affect the growth potential of crops. This shows that the physiological growth of crops and the microclimate of farmland are mutually connected.
Photosynthesis is the basis of all life activities of crops, and the improvement of cotton yield is also based on the improvement of photosynthetic products. The strength of photosynthetic capacity is affected by the external climatic conditions and the growth conditions of crops [47]; suitable growth environment and conditions can improve the photosynthetic capacity of crops [48]. The results showed that the net photosynthetic rate, transpiration rate, stomatal conductance, and intercellular CO2 concentration of drip irrigation were significantly higher than those of the other two treatments (p < 0.05). The physiological indices of each treatment were positively correlated with the yield. This study further shows that farmland microclimate, crop physiological growth characteristics, and yield are mutually connected, and that these factors are affected by factors such as fertility, irrigation, and soil. This experiment further highlighted that the effect of T3 on these factors was significantly better than that of T2 and T1.
The crop yield is the point of greatest concern for farmers. If we take the increase in yield as the main basis of our evaluation, the yield-increasing effect of T3 was the most obvious. In arid areas such as Xinjiang, water resources are very scarce [49]. When increasing cotton production, the shortage of water resources in northern Xinjiang should also be considered. Therefore, it is necessary to consider irrigation strategies more comprehensively. This study found that the yield and iWUE of T3 were significantly higher than those of T1 and T2. T3 is the optimal irrigation strategy to achieve water savings and yield increase.
In order to save water and optimize agronomic factors, international modifications have been introduced that improve the production of perennial tropical crops [50]. Today, for the irrigation of cotton, bananas, and other crops, farmers mainly use sprinklers (under foliage) and drip irrigation; with respect to the latter, there are crops such as bananas that grow in an inconsistent and random way, deviating from the original planting line, and after several years the plants will no longer be aligned with the drip line, reducing the irrigation efficiency. Additionally, drip irrigation in tropical territories has been found to be a method that saves water and reduces runoff, allowing water to trickle slowly towards plant roots, and improving productivity under certain physical or morphological soil properties [51,52]. Today, the global water crisis has seriously affected the development of agriculture [53]. Drip irrigation is recognized as the most advanced irrigation technology in the world, and has a very wide range of application—especially in Xinjiang, China, where water resources are seriously short, and the drip-irrigation area has reached 3.53 × 10⁶ hm2 [54]. This provides basic conditions for the implementation of automatic drip irrigation. In addition, the rapid development of the Internet, computer technology, and automation has further promoted the development of smart agriculture and agricultural informatization [55,56]. Combined with the findings of this study, automatic drip irrigation has obvious advantages in water saving and yield increase, and is an important measure to achieve the sustainable development of agriculture, with very optimistic prospects for future development.

5. Conclusions

(1) Automatic drip irrigation technology significantly increased relative humidity, and reduced soil and air temperature, providing a good farmland microclimate environment for crop growth.
(2) The growth and photosynthetic capacity of cotton under automatic drip-irrigation technology were significantly higher than under the other two treatments, improving the yield of cotton. The yield of automatic drip irrigation was 5.8% and 73.2% higher than that of drip irrigation and film irrigation, respectively.
(3) The physiological growth indices of cotton under different irrigation methods, along with the farmland microclimate indices, were positively correlated with cotton yield, except for soil and air temperature. Based on the analysis of each index, automatic drip irrigation under mulch is the optimal way to regulate physiological and farmland microclimate indices of cotton growth.
(4) Continuous implementation of automatic irrigation in drip-irrigation application areas is an important measure to achieve water saving and yield increase, and has very broad development prospects.

Author Contributions

K.S. worked on data analysis and writing—original draft; J.N. completed the experiments and provided data; C.W. and F.L. conceived the study; Q.F., G.Y. and Y.W. helped in interpretation and write-up of the results. All authors have read and agreed to the published version of the manuscript.

Funding

This work was supported by the National Natural Science Foundation of China (U1803244) and the National key R&D Program of China (2017YFC0404304).

Institutional Review Board Statement

Not applicable.

Informed Consent Statement

Not applicable.

Data Availability Statement

Not applicable to this article, as no data were generated.

Acknowledgments

The authors thank the Key Laboratory of Modern Water-Saving Irrigation for providing experimental sites and technical support. We thank the anonymous reviewers and the editors of the journal for their constructive comments, suggestions, and edits to the manuscript.

Conflicts of Interest

The authors declare no conflict of interest.

References

  1. Hu, W.R.; Yang, Y.; Li, B.; Hao, X.Y.; Zhao, Z.; Shao, W.K.; Huang, Q.S. Analysis of components of cotton fiber cell wall by chemical pretreatment and fourier transform infrared spectroscopy (FTIR). Xinjiang Agric. Sci. 2022, 59, 261–268. (In Chinese) [Google Scholar]
  2. Wang, X.H.; Chen, L.J.; Zhao, R.L.; Chen, H.L.; Zhang, Y.P.; Wang, Q.L.; Lv, L.M.; Song, G.L.; Zuo, D.Y. Cloning and functional analysis of GhCRPK1, a gene preferentially expressed during fiber initiation in upland cotton. Cotton Sci. 2021, 33, 459–468. (In Chinese) [Google Scholar]
  3. Janat, M. Response of cotton to irrigation methods and nitrogen fertilization: Yield components, water-use efficiency, nitrogen uptake, and recovery. Commun. Soil Sci. Plant Anal. 2008, 39, 2282–2302. [Google Scholar] [CrossRef]
  4. Shu, F.H. Prediction of cotton planting area and yield in China based on VAR. Cotton Sci. 2022, 44, 46–53. (In Chinese) [Google Scholar]
  5. Aujla, M.S.; Thind, H.S.; Buttar, G.S. Cotton yield and water use efficiency at various levels of water and N through drip irrigation under two methods of planting. Agric. Water Manag. 2005, 71, 167–179. [Google Scholar] [CrossRef]
  6. Wu, L.F.; Zhang, F.C.; Zhou, H.M.; Suo, Y.S.; Xue, F.D.; Zhou, J.W.; Liang, F. Effect of drip irrigation and fertilizer application on water use efficiency and cotton yield in North of Xinjiang. Trans. Chin. Soc. Agric. Eng. 2014, 30, 137–146. (In Chinese) [Google Scholar]
  7. Ma, K.; Wang, Z.H.; Wang, T.Y.; Zong, R. Interactive effects of nitrogen and salt on yield and quality of cotton in condition of under film drip irrigation. J. Arid. Land Resour. Environ. 2021, 11, 165–171. (In Chinese) [Google Scholar]
  8. Xu, F.P.; Li, Y.K.; Ren, S.M. Investigation and discuss ion of drip irrigation under mulch in Xinjiang Uygur Autonomous Region. Trans. Chin. Soc. Agric. Eng. 2003, 19, 25–27. (In Chinese) [Google Scholar]
  9. Wang, Z.H.; Yang, P.L.; Zheng, X.R.; He, X.L.; Zhang, J.Z.; Li, W.H. Soil salt dynamics in cotton fields with mulched drip irrigation under the existing irrigation system in Xinjiang. Trans. Chin. Soc. Agric. Mach. 2014, 45, 149–159. (In Chinese) [Google Scholar]
  10. Wang, Z.M.; Jin, M.; Šimůnek, J.; Genuchten, M.T. Evaluation of mulched drip irrigation for cotton in arid Northwest China. Irrig. Sci. 2014, 32, 15–27. [Google Scholar] [CrossRef] [Green Version]
  11. Wu, L.F.; Zhang, F.C.; Fan, J.L.; Zhou, H.M.; Liang, F.; Gao, Z.J. Effects of water and fertilizer coupling on cotton Yield, net benefits and water use efficiency. Trans. Chin. Soc. Agric. Mach. 2015, 46, 164–172. (In Chinese) [Google Scholar]
  12. Wang, J.; Li, J.S.; Guan, H.J. Modeling response of cotton yield and water productivity to irrigation amount under mulched drip irrigation in North Xinjiang. Trans. Chin. Soc. Agric. Eng. 2016, 32, 62–68. (In Chinese) [Google Scholar]
  13. Vera-Repullo, J.A.; Ruiz-Penalver, L.; Jiménez-Buendía, M.; Rosillo, J.J.; Molina-Martínez, J.M. Software for the automatic control of irrigation using weighing-drainage lysimeters. Agric. Water Manag. 2015, 151, 4–12. [Google Scholar] [CrossRef]
  14. Mittelbach, H.; Lehner, I.; Seneviratne, S.I. Comparison of four soil moisture sensor types under field conditions in Switzerland. J. Hydrol. 2012, S430, 39–49. [Google Scholar] [CrossRef]
  15. An, S.K.; Lee, H.B.; Kim, J.; Kim, K.S. Soil moisture sensor-based automated irrigation of Cymbidium under various substrate conditions. Sci. Hortic. 2021, 286, 110133. [Google Scholar] [CrossRef]
  16. Conesa, M.R.; Conejero, W.; Vera, J.; Ruiz-Sánchez, M. Soil-based automated irrigation for a nectarine orchard in two water availability scenarios. Irrig. Sci. 2021, 39, 421–439. [Google Scholar] [CrossRef]
  17. Jones, H.M. Irrigation scheduling: Advantages and pitfalls of plant-based methods. J. Exp. Bot. 2004, 55, 2427–2436. [Google Scholar] [CrossRef] [Green Version]
  18. Van Iersel, M.W.; Chappell, M.; Lea-Cox, J.D. Sensors for improved efficiency of irrigation in greenhouse and nursery production. Hort Technol. 2013, 23, 735–746. [Google Scholar] [CrossRef] [Green Version]
  19. Niu, J.R. Study on the Law of Soil Water and Salt Transport and Crop Growth in the Field of Automatic Drip Irrigation; ShiHezi University: ShiHezi, China, 2017. [Google Scholar]
  20. Zhao, B. Study on Control Indicator of Automatic Irrigation about Cotton under Film Drip Irrigation; ShiHezi University: ShiHezi, China, 2017. [Google Scholar]
  21. Devitt, D.A.; Carstensen, K.; Morris, R.L. Residential water savings associated with satellite-based ET irrigation controllers. J. Irrig. Drain. Eng. 2008, 134, 74–82. [Google Scholar] [CrossRef]
  22. Nielson, D.C. Scheduling irrigation for soybeans with the crop water stress Index (CWSI). Field Crops Res. 1990, 23, 103–116. [Google Scholar] [CrossRef]
  23. Yuan, G.F.; Luo, Y.; Sun, X.M.; Tang, D.Y. Winter wheat water stress detection based on canopy surface temperature. Trans. Chin. Soc. Agric. Eng. 2002, 18, 13–17. (In Chinese) [Google Scholar]
  24. Yuan, J.Y.; Zhao, J.H.; Liu, Y.T.; Lin, X. Design of intelligent irrigation system in urban parks based on GPRS + ZigBee wireless network technology. Mod. Agric. Res. 2022, 28, 89–91. (In Chinese) [Google Scholar]
  25. Kia, P.J.; Far, A.T.; Omid, M.; Alimardani, R.; Naderloo, L. Intelligent control based fuzzy logic for automation of greenhouse irrigation system and evaluation in relation to conventional systems. World Appl. Sci. J. 2009, 6, 16–23. [Google Scholar]
  26. Lu, X.T.; Zhang, L.N.; Lin, H.; Zhi, C.Q.; Li, J. Design of the networked precision irrigation system for paddy field crops in intelligent agriculture. Trans. Chin. Soc. Agric. Eng. 2021, 37, 71–81. (In Chinese) [Google Scholar]
  27. Zhang, P.P.; Zhou, Y.; Song, H.; Qiao, Z.J.; Wang, H.G.; Zheng, D.F.; Feng, B.L. Comparison of growth and field microclimate characteristics of broomcorn millet under different fertilization conditions. Chin. J. Appl. Ecol. 2015, 26, 473–480. (In Chinese) [Google Scholar]
  28. Gong, X.W.; Li, J.; Ma, H.C.; Chen, G.H.; Wang, M.; Yang, P.; Gao, J.F.; Feng, B.L. Field microclimate and yield for proso millet intercropping with mung bean in the dryland of Loess Plateau, Northwest China. Chin. J. Appl. Ecol. 2018, 29, 3256–3266. (In Chinese) [Google Scholar]
  29. Sun, S.J.; Zhou, X.B.; Chen, Y.H.; Yang, G.M.; Xu, D.L.; Yang, R.G. Effects of different distribution patterns of winter wheat’s population on farmland micro-climate and yield. Trans. Chin. Soc. Agric. Eng. 2008, 24, 28–31. (In Chinese) [Google Scholar]
  30. Wang, X.Y.; Zhou, X.B.; Zhong, W.W.; Chen, Y.H.; Han, K. Planting pattern and nitrogen rate on farmland microclimate and yield of winter wheat. Agric. Res. Arid. Areas 2017, 35, 14–21. (In Chinese) [Google Scholar]
  31. Zhou, X.B.; Sun, S.J.; Yang, G.M.; Chen, Y.H.; Liu, P. Farmland microclimate and yield of winter wheat under different row spacing. Tarim Bilimleri Dergisi. 2012, 18, 1–8. [Google Scholar]
  32. Wang, T.Y.; Wang, Z.H.; Wu, Q.; Zhang, J.Z.; Quan, L.S.; Fan, B.H.; Guo, L. Coupling effects of water and nitrogen on photosynthetic characteristics, nitrogen uptake, and yield of sunflower under drip irrigation in an oasis. Int J. Agric. Biol. Eng. 2021, 14, 130–141. [Google Scholar] [CrossRef]
  33. Guizani, M.; Dabbou, S.; Maatallah, S.; Montevecchi, G.; Hajlaoui, H.; Rezig, M.; Helal, A.N.; Kilani-Jaziri, S. Physiological responses and fruit quality of four peach cultivars under sustained and cyclic deficit irrigation in center-west of Tunisia. Agric. Water Manag. 2019, 217, 81–97. [Google Scholar] [CrossRef]
  34. Hafsi, M.; Mechmeche, W.; Bouamama, L.; Djekoune, A.; Zaharieva, M.; Monneveux, P. Flag leaf senescence, as evaluated by numerical image analysis, and its relationship with yield under drought in durum wheat. J. Agron. Crop Sci. 2000, 185, 275–280. [Google Scholar] [CrossRef]
  35. Verma, V.; Foulkes, M.J.; Worland, A.J.; Sylvester-Bradley, R.; Caligari, P.D.S.; Snape, J.W. Mapping quantitative trait loci for flag leaf senescence as a yield determinant in winter wheat under optimal and drought-stressed environments. Euphytic 2004, 135, 255–263. [Google Scholar] [CrossRef]
  36. Ding, A.M.; Cui, F.; Li, J.; Zhao, C.H.; Wang, X.Q.; Wang, H.G. QTL analysis on grain yield per plant and plant height in wheat. Sci. Agric. Sin. 2011, 44, 2857–2867. [Google Scholar]
  37. Yao, H.S.; Zhang, Y.L.; Yi, X.P.; Zhang, X.J.; Zhang, W.F. Cotton responds to different plant population densities by adjusting specific leaf area to optimize canopy photosynthetic use efficiency of light and nitrogen. Field Crops Res. 2016, 188, 10–16. [Google Scholar] [CrossRef]
  38. Anguraj, D.K.; Mandhala, V.N.; Bhattacharyya, D.; Kim, T. Hybrid neural network classification for irrigation control in WSN based precision agriculture. J. Ambient. Intell. Humaniz. Comput. 2021, 10, 1–12. [Google Scholar] [CrossRef]
  39. Zhang, J.; Guan, K.; Peng, B.; Jiang, C.Y.; Zhou, W.; Yang, Y.; Pan, M.; Franz, T.E.; Heeren, D.M.; Rudnick, D.R.; et al. Challenges and opportunities in precision irrigation decision-support systems for center pivots. Environ. Res. Lett. 2021, 16, 1–16. [Google Scholar] [CrossRef]
  40. Wang, F.J.; Wang, Z.H.; Zhang, J.Z.; Li, W.H. Effect of moisture sensor location and irrigation threshold on physiological index and yield of cotton under mulch drip irrigation. Water Sav. Irrigation. 2018, 5, 14–19. (In Chinese) [Google Scholar]
  41. Zhao, B.; Wang, Z.H.; Li, W.H. Effects of winter drip irrigation mode and quota on water and salt distribution in cotton field soil and cotton growth next year in northern Xinjiang. Trans. Chin. Soc. Agric. EnCineering 2016, 32, 139–148. (In Chinese) [Google Scholar]
  42. Wang, X.B. Experimental Research on Water Consumption and Irrigation System of the Cotton under High-Frequency Drip Irrigation Mulched with Plastic Films; ShiHezi University: ShiHezi, China, 2008. [Google Scholar]
  43. Li, D.X.; Li, C.D.; Sun, H.C.; Liu, L.T.; Zhang, Y.J. Photosynthetic and chlorophyll fluorescence regulation of upland cotton (Gossiypium hirsutum L.) under drought conditions. Plant Omics J. 2012, 5, 432–437. [Google Scholar]
  44. Stanhill, M.; Fuchs, M. The climate of the cotton crop: Physical characteristics and microclimate relationships. Agric. Meteorol. 1968, 5, 183–202. [Google Scholar] [CrossRef]
  45. Prasad, P.V.V.; Boote, K.J.; Allen, L.H.; Sheehy, J.E.; Thomas, J.M.G. Species, ecotype and cultivar differences in spikelet fertility and harvest index of rice in response to high temperature stress. Field Crops Res. 2006, 95, 398–411. [Google Scholar] [CrossRef]
  46. Yan, C.; Ding, Y.F.; Wang, Q.S.; Li, G.H.; Liu, Z.H.; Liao, X.J.; Zheng, Y.M.; Wei, G.B.; Wang, S.H. Effect of panicle fertilizer application rate on morphological, ecological characteristics, and organ temperature of rice. Acta Agron. Sin. 2008, 34, 2176–2183. (In Chinese) [Google Scholar] [CrossRef]
  47. Bjorn, M.; Kebede, H.; Rilling, C. Photosynthetic differences among Lycopersicon species and Triticum aestivum cultivars. Crop Sci. 1994, 34, 113–118. [Google Scholar]
  48. Shi, Y.Z.; Cui, Y.L.; Wang, L.; Cai, S.; Yu, S.; Liu, L.G. Regulation of nitrogen-phosphorus and Chinese milk vetch improve canopy characteristics and yield of early season rice. Trans. Chin. Soc. Agric. Eng. 2014, 30, 89–97. (In Chinese) [Google Scholar]
  49. Fan, M.T.; Xu, J.H.; Chen, Y.N.; Li, D.H.; Tian, S.S. How to sustainably use water resources-A case study for decision support on the water utilization of Xinjiang, China. Water 2020, 12, 3564. [Google Scholar] [CrossRef]
  50. Campos, B.; Paredes, F.; Rey, J.; Lobo, D.; Galvis-Causil, S. The relationship between the normalized difference vegetation index, rainfall, and potential evapotranspiration in a banana plantation of Venezuela. STJSSA 2021, 18, 58–64. [Google Scholar] [CrossRef]
  51. Himanshu, S.K.; Srinivasulu, A.; James, P.; Bordovsky, J.K.; Sayantan, N.O.; Barnes, E.M. Assessing the impacts of irrigation termination periods on cotton productivity under strategic deficit irrigation regimes. Sci. Rep. 2021, 11, 20102. [Google Scholar] [CrossRef]
  52. Olivares, B.O.; Calero, J.; Rey, J.C.; Lobo, D.; Landa, B.B.; Gómez, J.A. Correlation of banana productivity levels and soil morphological properties using regularized optimal scaling regression. Catena 2022, 208, 105718. [Google Scholar] [CrossRef]
  53. Chen, Y.N.; Li, Y.P.; Li, Z.; Lin, Y.C.; Huang, W.J.; Liu, X.G.; Feng, M.Q. Analysis of the impact of global climate change on dryland areas. Adv. Earth Sci. 2022, 37, 111–119. (In Chinese) [Google Scholar]
  54. Wang, Z.H.; Chen, X.G.; Zheng, X.R.; Fan, W.B.; Li, W.H.; Zong, R. Discussion of the future development of field drip irrigation in China. Agric. Res. Arid. Areas 2020, 38, 1–9. (In Chinese) [Google Scholar]
  55. Qin, A.Z.; Ning, D.F.; Liu, Z.D.; Sun, B.; Zhao, B.; Xiao, J.F.; Duan, A.W. Insentek sensor: An alternative to estimate daily crop evapotranspiration for maize plants. Water 2018, 11, 25. [Google Scholar] [CrossRef] [Green Version]
  56. Tolomio, M.; Casa, R. Dynamic crop models and remote sensing irrigation decision support systems: A review of water stress concepts for improved estimation of water requirement. Remote Sens. 2020, 12, 3945. [Google Scholar] [CrossRef]
Figure 1. The experimental station’s location.
Water 14 01579 g001
Figure 2. Daily meteorological variation during cotton growth periods (1 April to 30 October) in 2018 and 2019.
Water 14 01579 g002
Figure 3. Depiction of the filed experimental design: (a) the experimental plot distribution under three irrigation methods (T1, T2, and T3), with three replicates; (b) a diagram of the T3 treatment, showing the system and its size; (c) a profile view of the cultivation pattern of the drip-irrigated cotton used in this study, with sensor locations depicted.
Water 14 01579 g003
Figure 4. The air temperature changes at different growth stages and locations under different irrigation methods: (a) is the variation of seeding stage; (b) is the variation of budding stage; (c) is the variation of flowering stage; (d) is the variation of Boll-opening stage.
Water 14 01579 g004
Figure 5. The relative humidity changes at different growth stages and locations under different irrigation methods: (a) is the variation of seeding stage; (b) is the variation of budding stage; (c) is the variation of flowering stage; (d) is the variation of Boll-opening stage.
Water 14 01579 g005
Figure 6. Dynamic changes in cotton plant height, stem thickness, and leaf area throughout the whole growth period.
Water 14 01579 g006
Figure 7. Thermal map of variation of parameters related to different irrigation methods.
Water 14 01579 g007
Table 1. Physical and chemical properties of soil at the test site.
Soil Depth (cm)Soil Particle Composition (g·kg−1)TextureBulk Density (g·cm−3)Water-Holding Capacity (%)pH
<0.002 mm0.002–0.02 mm0.02–2 mm
0–20113683212Silty loam1.5433.917.71
20–40126716186Silty loam1.6933.117.96
40–6019358153Silty loam1.7133.107.83
60–8022065350Silty loam1.7635.117.18
80–10020770551Silty loam1.7632.217.74
Table 2. Irrigation thresholds of automatic drip irrigation under mulch.
Soil Depth (cm)Threshold Value (%)
Seedling StageBudding StageFlowering StageBoll-Opening Stage
2060–6565–7075–8065–70
4060–6565–7075–8065–70
6060–6565–7075–8065–70
Table 3. Effects of different irrigation methods on soil temperature.
TreatmentGrowth StageTime Frame
08:00–10:0010:00–12:0012:00–16:0016:00–20:00
T1Seedling stage22.7 ± 0.2 Ab23.1 ± 0.2 BCb30.1 ± 0.5 Cbc28.8 ± 0.4 Bc
Budding stage23.9 ± 0.3 Ccd24.1 ± 0.1 Cc34.0 ± 0.7 Cd32.0 ± 0.6 Bd
Flowering stage24.2 ± 0.2 Cd26.0 ± 0.4 Cd31.0 ± 0.8 Cc28.0 ± 0.3 Bbc
Boll-opening stage18.8 ± 0.2 Ba20.0 ± 0.2 Ba24.0 ± 0.4 Ca21.7 ± 0.7 Ba
T2Seedling stage23.1 ± 0.1 Ab22.7 ± 0.2 Ab30.0 ± 0.7 Bbc28.2 ± 0.2 ABc
Budding stage23.7 ± 0.3 BCcd24.0 ± 0.5 Bc33.7 ± 0.7 Bd30.0 ± 0.4 Ad
Flowering stage24.0 ± 0.5 Bd25.1 ± 0.5 BCd30.8 ± 0.8 Bc27.6 ± 0.5 Bbc
Boll-opening stage18.1 ± 0.1 Aa19.0 ± 0.5 Aa23.6 ± 0.6 Ba21.4 ± 0.4 Aa
T3Seedling stage22.8 ± 0.2 ABbc23.2 ± 0.1 Cb29.8 ± 0.8 Abc28.0 ± 0.5 Ac
Budding stage23.5 ± 0.1 Ac23.8 ± 0.3 Acd33.5 ± 0.5 Ad29.7 ± 0.7 Ad
Flowering stage23.8 ± 0.2 Ad24.0 ± 0.4 Cd30.0 ± 0.6 Ac27.3 ± 0.3 Abc
Boll-opening stage18.0 ± 0.3 Aa18.7 ± 0.2 Aa23.6 ± 0.6 Aa21.6 ± 0.6 Ba
Note: different capital letters indicate significant differences between different treatments at the same growth stage; different lowercase letters indicate significant differences between different growth stages of the same treatment.
Table 4. Effects of different irrigation methods on net photosynthetic rate (Pn), transpiration rate (Tr), intercellular CO2 concentration (Ci), stomatal conductance (Gs), and WUEins.
Growth Stage TreatmentAverage
T1T2T3
Pn11.36 ± 0.31 a13.53 ± 0.19 b15.65 ± 0.53 c13.51
Tr2.87 ± 0.18 a3.22 ± 0.26 a3.81 ± 0.27 b3.30
Seedling stageWUEins3.62 ± 0.28 a3.91 ± 0.27 a3.85 ± 0.19 a3.79
Gs362.11 ± 3.79 a386.37 ± 5.17 b480.21 ± 5.42 c409.56
Ci286.74 ± 3.62 a311.51 ± 5.30 b368.17 ± 4.79 c322.14
Pn23.59 ± 0.77 a27.88 ± 0.80 a31.95 ± 0.68 c27.81
Tr4.38 ± 0.30 a4.88 ± 0.59 ab5.38 ± 0.51 b4.88
Budding stageWUEins5.39 ± 0.19 a5.78 ± 0.87 a5.98 ± 0.70 a5.72
Gs343.61 ± 4.61 a377.56 ± 4.22 b432.11 ± 5.63 c384.43
Ci322.91 ± 6.11 a355.91 ± 5.93 b402.97 ± 6.33 c360.60
Pn13.44 ± 0.24 a17.43 ± 0.13 b21.44 ± 0.20 c17.44
Tr3.98 ± 0.30 a4.31 ± 0.31 a4.98 ± 0.36 b4.42
Flowering stageWUEins3.39 ± 0.20 a4.06 ± 0.26 bc4.36 ± 0.36 c2.60
Gs256.99 ± 5.77 a289.77 ± 6.97 b352.88 ± 5.66 c299.88
Ci332.17 ± 7.17 a356.77 ± 6.17 b417.77 ± 8.35 c368.90
Pn11.91 ± 0.44 a12.19 ± 0.39 a14.34 ± 0.52 b12.81
Tr3.67 ± 0.50 a4.01 ± 0.30 a4.12 ± 0.40 a3.93
Boll-opening stageWUEins3.19 ± 0.30 b3.06 ± 0.33 a3.52 ± 0.46 c3.26
Gs207.19 ± 8.76 a228.67 ± 5.37 b293.12 ± 1.42 c242.99
Ci366.71 ± 6.63 a382.07 ± 7.77 b432.76 ± 8.96 c393.85
Note: different lowercase letters indicate significant differences between different treatments at the same growth stage.
Table 5. Cotton yield components under different irrigation methods.
TreatmentNumber of PlantsNumber of BollsWeight of 30 BollsYieldiWUE
T138 ± 3.6 a183 ± 6.03 a149.05 ± 7.01 a3489.75 ± 91.80 a0.49 ± 0.02 a
T246 ± 1.5 b264 ± 12.59 b183.23 ± 5.38 b5717.40 ± 77.25 b0.95 ± 0.01 b
T348 ± 2.5 b282 ± 15.1 c196.58 ± 5.53 c6496.70 ± 101.40 c1.22 ± 0.02 c
Note: different lowercase letters indicate significant differences among different treatments of the same indicator.
Table 6. Fitting analysis of physiological growth indices and farmland microclimate indices with yield.
IndexFitting EquationR2p Value
Air temperaturey = −210.38x + 6972.900.80<0.01
Relative humidityy = 28.89x − 795.330.87<0.01
Soil temperaturey = −89.57x + 6993.100.32<0.05
Plant heighty = 8.36x − 65.550.86<0.01
Leaf areay = 0.26x + 126.260.84<0.01
Stem thicky = 531.50x − 47.070.64<0.01
Pny = 28.57x − 121.200.76<0.01
Try = 166.58x − 401.360.70<0.01
Gsy = 1.74x − 204.780.75<0.01
Ciy = 1.90x − 380.810.72<0.01
Publisher’s Note: MDPI stays neutral with regard to jurisdictional claims in published maps and institutional affiliations.

