
A Unified Hydrogeological Conceptual Model of the Mexico Basin Aquifer after a Century of Groundwater Exploitation


1
Instituto de Ingeniería, Universidad Nacional Autonoma de México, Mexico City 04510, Mexico
2
Institut National de la Recherche Scientifique (INRS-ETE), 490 de la Couronne, Québec, QC G1K 9A9, Canada
3
IAH-Transboundary Aquifers Commission, Québec, QC G1K 9A9, Canada
*
Author to whom correspondence should be addressed.
Water 2022, 14(10), 1584; https://0-doi-org.brum.beds.ac.uk/10.3390/w14101584
Submission received: 8 April 2022
/
Revised: 7 May 2022
/
Accepted: 10 May 2022
/
Published: 16 May 2022
(This article belongs to the Topic Advances in Well and Borehole Hydraulics and Hydrogeology)
Abstract
:The Mexico City Metropolitan Area, located within the Mexico Basin, is the most important economic center in Mexico. An ever-growing population, currently at 22 million with increasing water demands, has resulted in the overexploitation of groundwater with associated impacts to hydrological conditions for a century. Land subsidence due to chronic groundwater level declines has damaged infrastructure and increased water delivery and flood control challenges, causing loss of aquifer storage. An additional associated problem is groundwater quality deterioration, which reduces potable supplies due to increasing anthropogenic pollution and salinization. A new integrated conceptual model of the Mexico Basin Aquifer has been constructed based on a comprehensive compilation of existing and new hydrogeological knowledge. As a result, this conceptual model updates and improves the understanding of the characteristics of the aquifer and current hydrodynamic behavior of groundwater. Four hydrogeological units were identified, their heads and related flow system interdependencies were evaluated and their hydraulic properties associated; this allowed identifying local, intermediate and regional flow systems, aquifer transition from confined to unconfined conditions, changes to land subsidence and groundwater quality deterioration. This conceptual model could be the basis in building a numerical model, and as a powerful tool to test different management scenarios for decision-making.
1. Introduction
Managing groundwater resources represents a major challenge, fast becoming one of humanity’s foremost priorities. Surface water resources are typically well understood and relatively well managed; groundwater resources, however, are often hidden and more difficult to conceptualize [1]. The Mexico Basin contains the nation’s capital, Mexico City, being one of the most important areas in the country in terms of national economy, culture and history. This is the fifth largest urban area in the world, with a current population of circa 23 million, and constantly growing.
The water use of the extended metropolitan area (urban, agriculture and industry) depends on imported water, rivers, springs and groundwater resources. Most of the runoff and wastewater is taken out of the basin for flood control with a rather small reuse of recycled water. Groundwater levels are constantly lowering over time, with associated increasing costs of pumping and some wells going dry. Thus, the security of the city’s economy, social stability and hydraulic supply strongly depend on groundwater. Increasing water demands have resulted in overexploitation of the groundwater resources in the city over several decades, a classic tragedy of the commons.
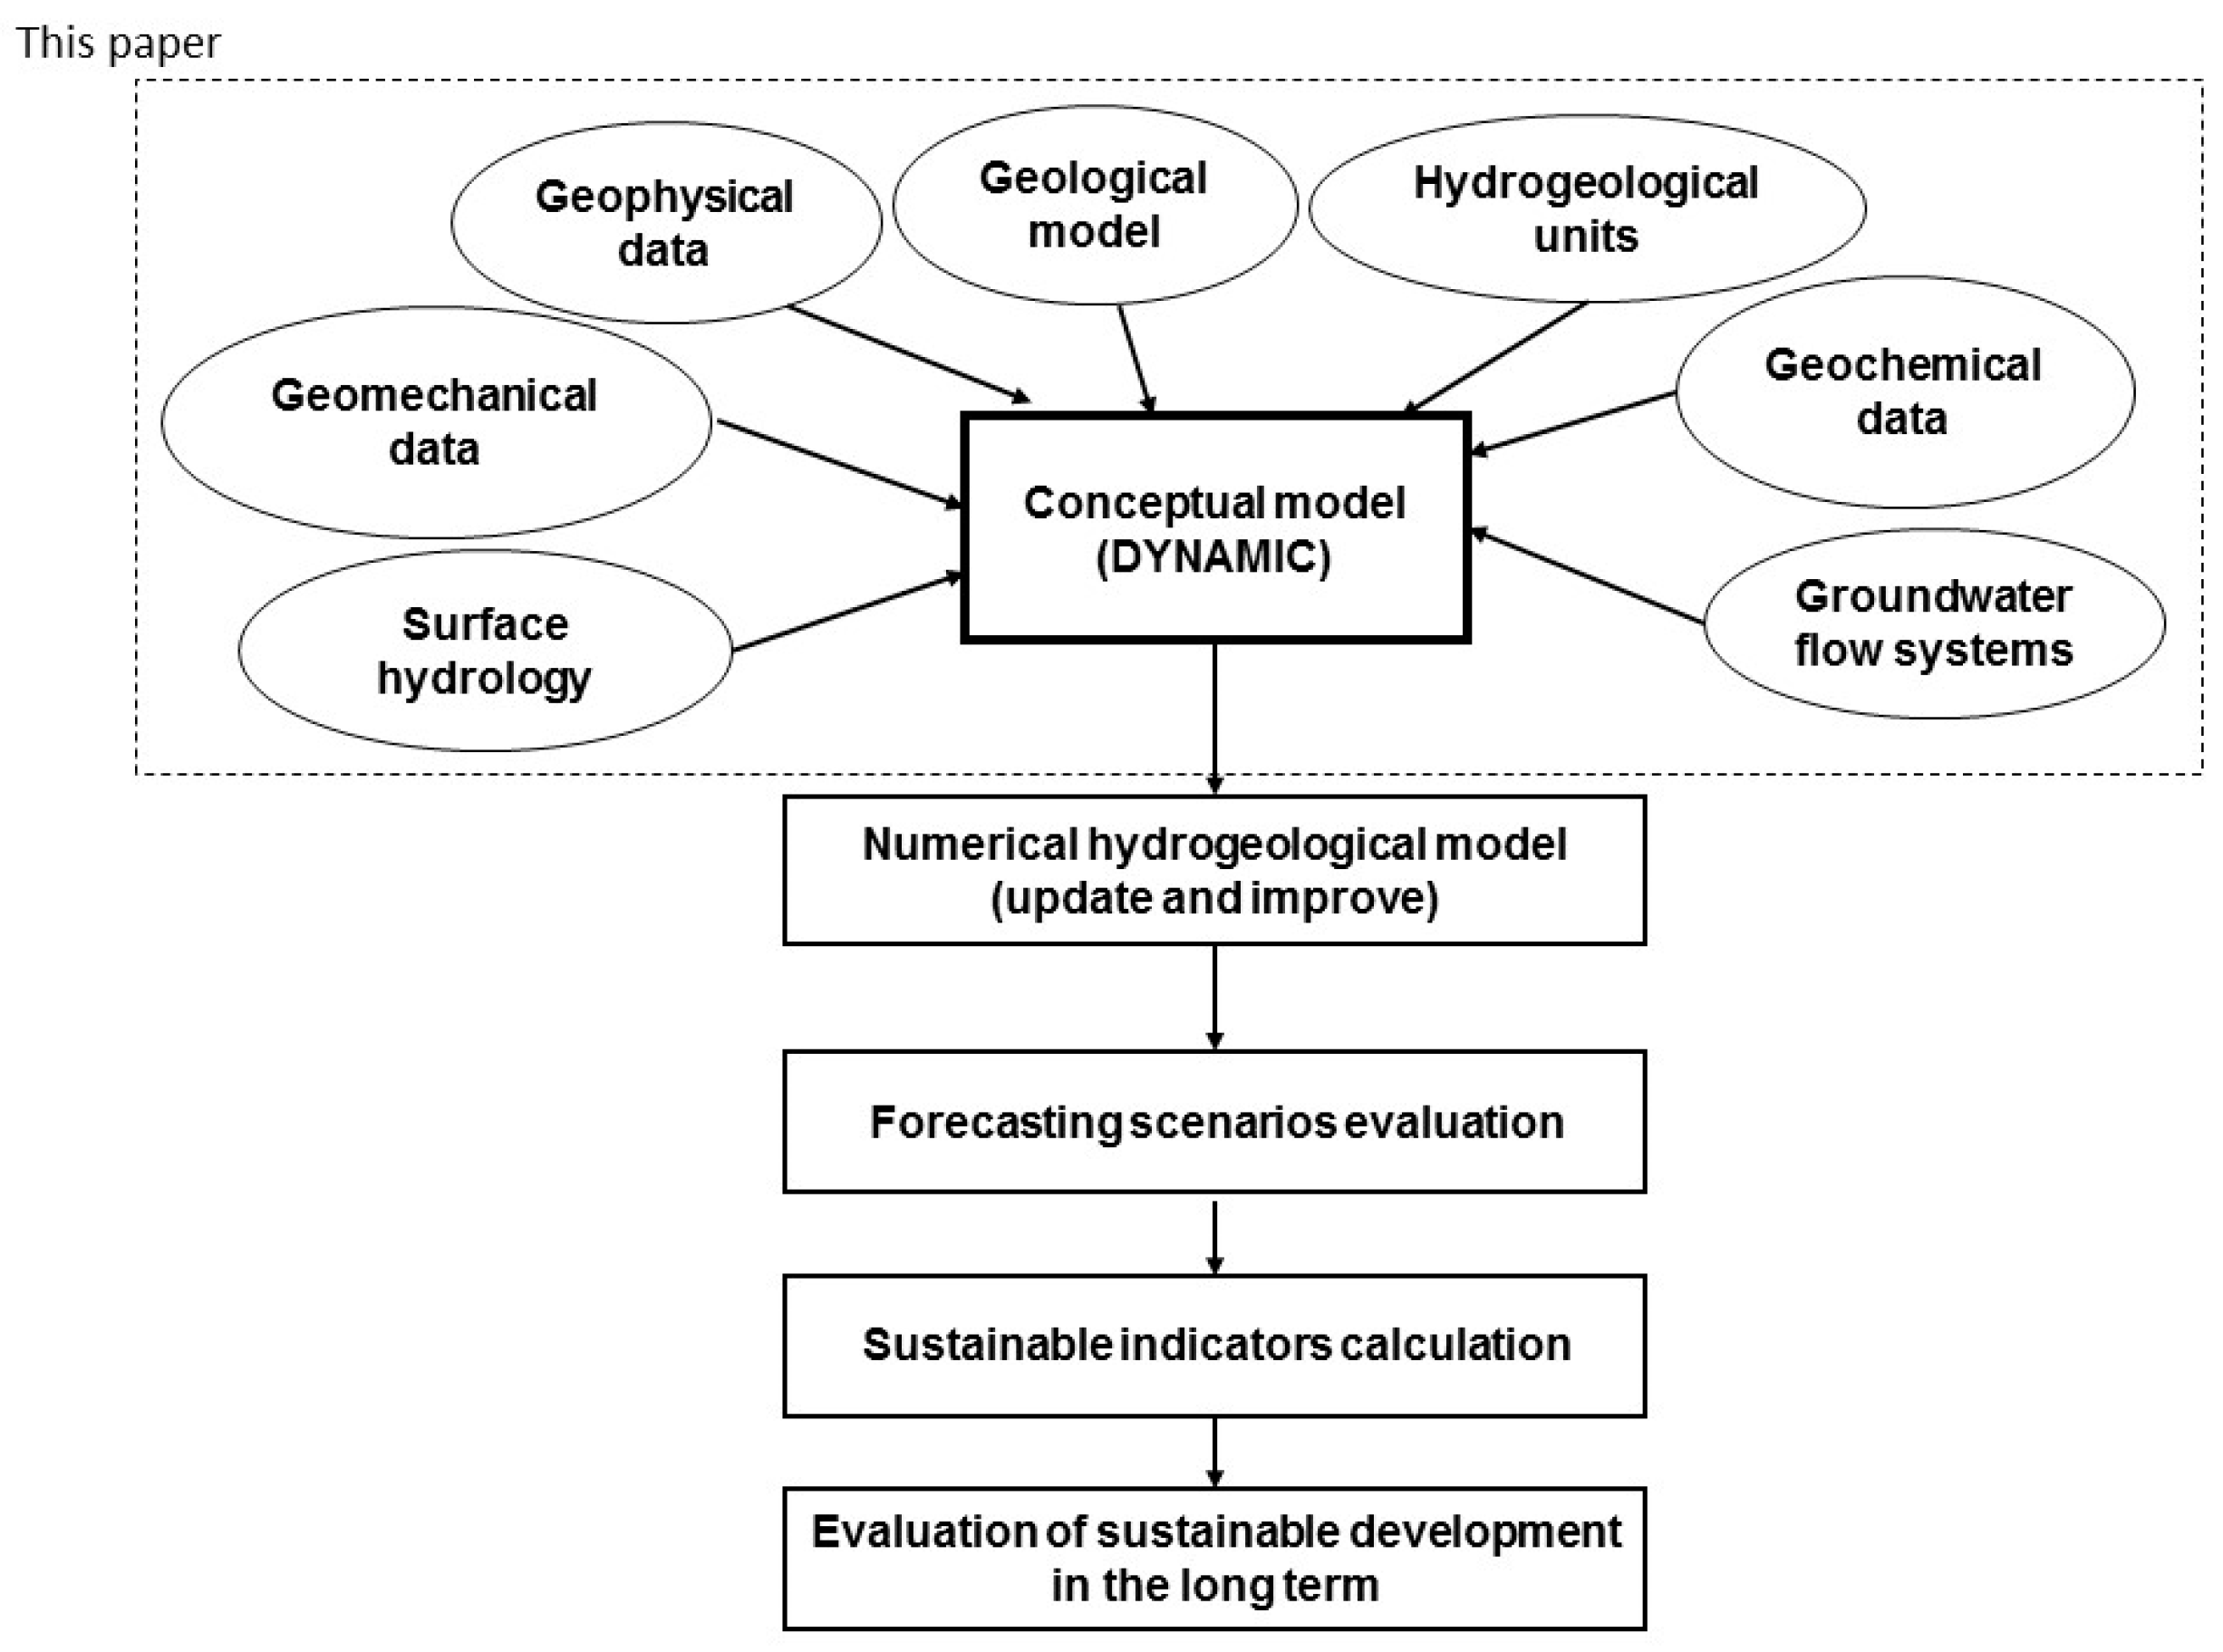
Management and evaluation of this resource requires a detailed understanding of the aquifer dynamics along its natural boundaries. In this study, we developed a conceptual model with the integration and analyzes of numerous studies, including our own, as well as publications with information related to the fields of geology, hydrogeology, geotechnical engineering, surface hydrology, geochemistry, geophysics and groundwater flow systems, with changes over time. Figure 1 shows the stages we propose to assess the Mexico Basin Aquifer for long-term sustainable use and this paper describes the components shown in the dashed box.
In addition to this complexity, when discussing sustainability, it may be necessary to stipulate the period of time during which the water use is planned and any assumptions about the future of water supply [2]. In this work, we speculate that due to the current Mexico Basin conditions, a long-term period of observations is needed in order to evaluate changes. A century of increasing pumping in Mexico City has elapsed and the observations are undisputable: groundwater storage and groundwater quality in the Mexico Basin Aquifer have diminished, raising the question of whether this practice is sustainable.
Thus, the objective of this study was to develop a hydrogeological conceptual model of the Mexico Basin. This is the first time that a unified hydrogeological conceptual model is integrated for the complete Mexico Basin Aquifer after a century of groundwater exploitation. This conceptual model is a dynamic model, which can and should be updated over the years as more data become available.
We describe our study area and applied methodology, and present detailed settings of its hydrogeology with new input on its geology and the hydrostratigraphy. In the results section, we present changes over time of the most important properties of the aquifer, including groundwater level conditions, hydrogeochemical conditions, isotopes and the groundwater budget. In the last two sections, we present our proposed conceptual model and a discussion on its limitations, as well as a comparison with other studies.
We evaluated and tried to answer the following issues with an integrated model over time, for at least one century. What is the evolution of the hydrogeological and hydrogeochemical conditions over time? Has the conceptual model of the aquifer changed? What are the changes in local- to regional-scale groundwater-pressure conditions? What are the main issues associated with the scales of time and space? Are the water balances (recharge, discharge, cross-formational flow) changing? What are the impacts of land changes and groundwater storage changes? What is the evolution and eventual fate of land subsidence?
This integrated approach might be applicable to other regional-scale aquifer assessments in quantifying the sustainability evaluation of regional aquifers going through similar stresses.
2. Materials and Methods
2.1. Study Area
The Mexico Basin (MB) is located in the central part of the Mexican Neovolcanic Axis, with an average elevation of 2400 m above sea level and an approximate area of 10,000 square kilometers (Figure 2).
In the last 35 years, the sprawl in the MB has increased the urban area by 300%, and the population has grown from 13.7 million in 1980 to 22.8 million in 2020. The area’s current population represents 19% of the total population of the country and produces 26% of the gross national product of Mexico, whereas its surface area represents only 0.93% of the country.
The jurisdictional complexity of the MB adds pressure to this situation; the MB comprises five political jurisdictions: Mexico City, the State of Mexico, Hidalgo, Puebla and Tlaxcala (Figure 2). Accordingly, different governmental agencies are in charge of water supply and sanitization.
The climate in the Mexico Basin is subtropical; located at tropical latitude and high altitude, the summers are hot and winters are mild. Average annual temperature minimums range from 6 to 12 °C and maximums from 21 to 27 °C. The average annual precipitation for the period of 1961–1988 was 723 mm; rainfall is concentrated in the summer months, from June to September when it exceeds 100 mm, with moderate rainfall in May and October.
The basin is bounded to the south by the Chichinautzin mountain range, to the north by the Pachuca mountain range, to the southeast by the Sierra Nevada, and to the west by the Sierra de Las Cruces mountain range (Figure 2).
For several centuries, the changing pattern of land and water was of great significance in man’s occupation of the MB. Since the very first settlements in the Mexico Basin, inhabitants struggled against water on two fronts: the lack of drinking water and constant flooding by the overflow of the existing lakes of the time [3].
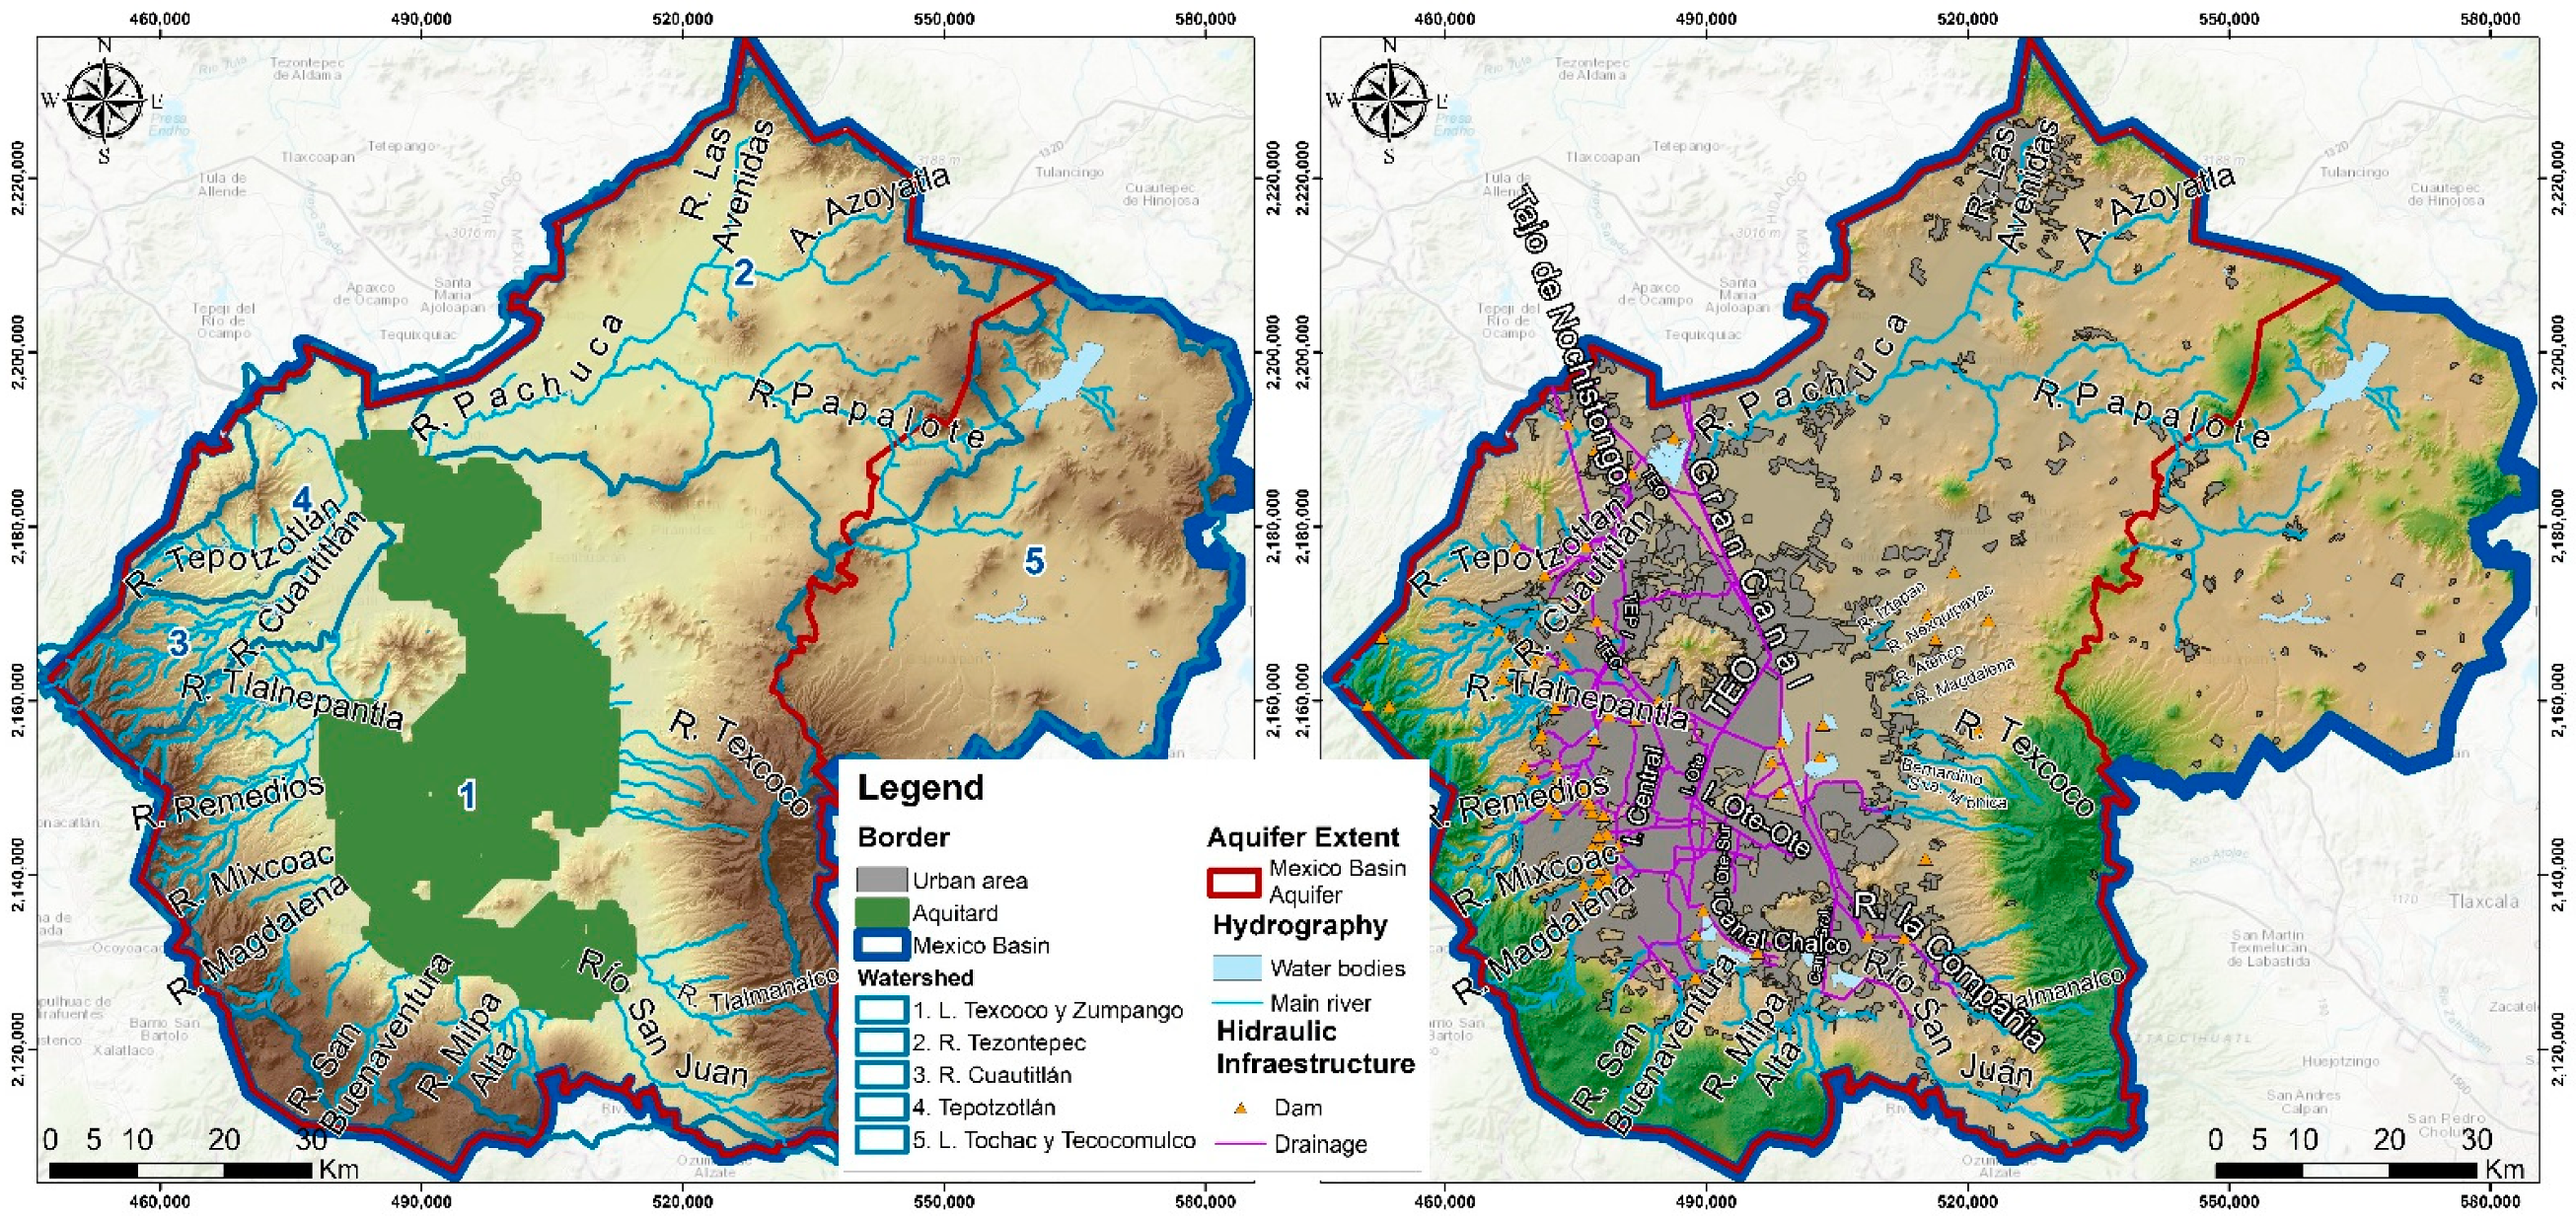
This significant pattern has persisted and changes in historical times have been remarkable, inducing large changes in the hydrology of the closed basin. Figure 3 compares the changes in development of artificial drainage and lake areas, which still remain within the former larger lake that existed in the Pleistocene, indicated as the aquitard.
There are five watersheds in the area: Texcoco and Zumpango, Tepotztlán, Tochac and Tecocomulco, Cuautitlán and Tezontepec. As shown in Figure 3, urban areas have no rivers; as mentioned before, the rivers have been artificially diverted to the north.
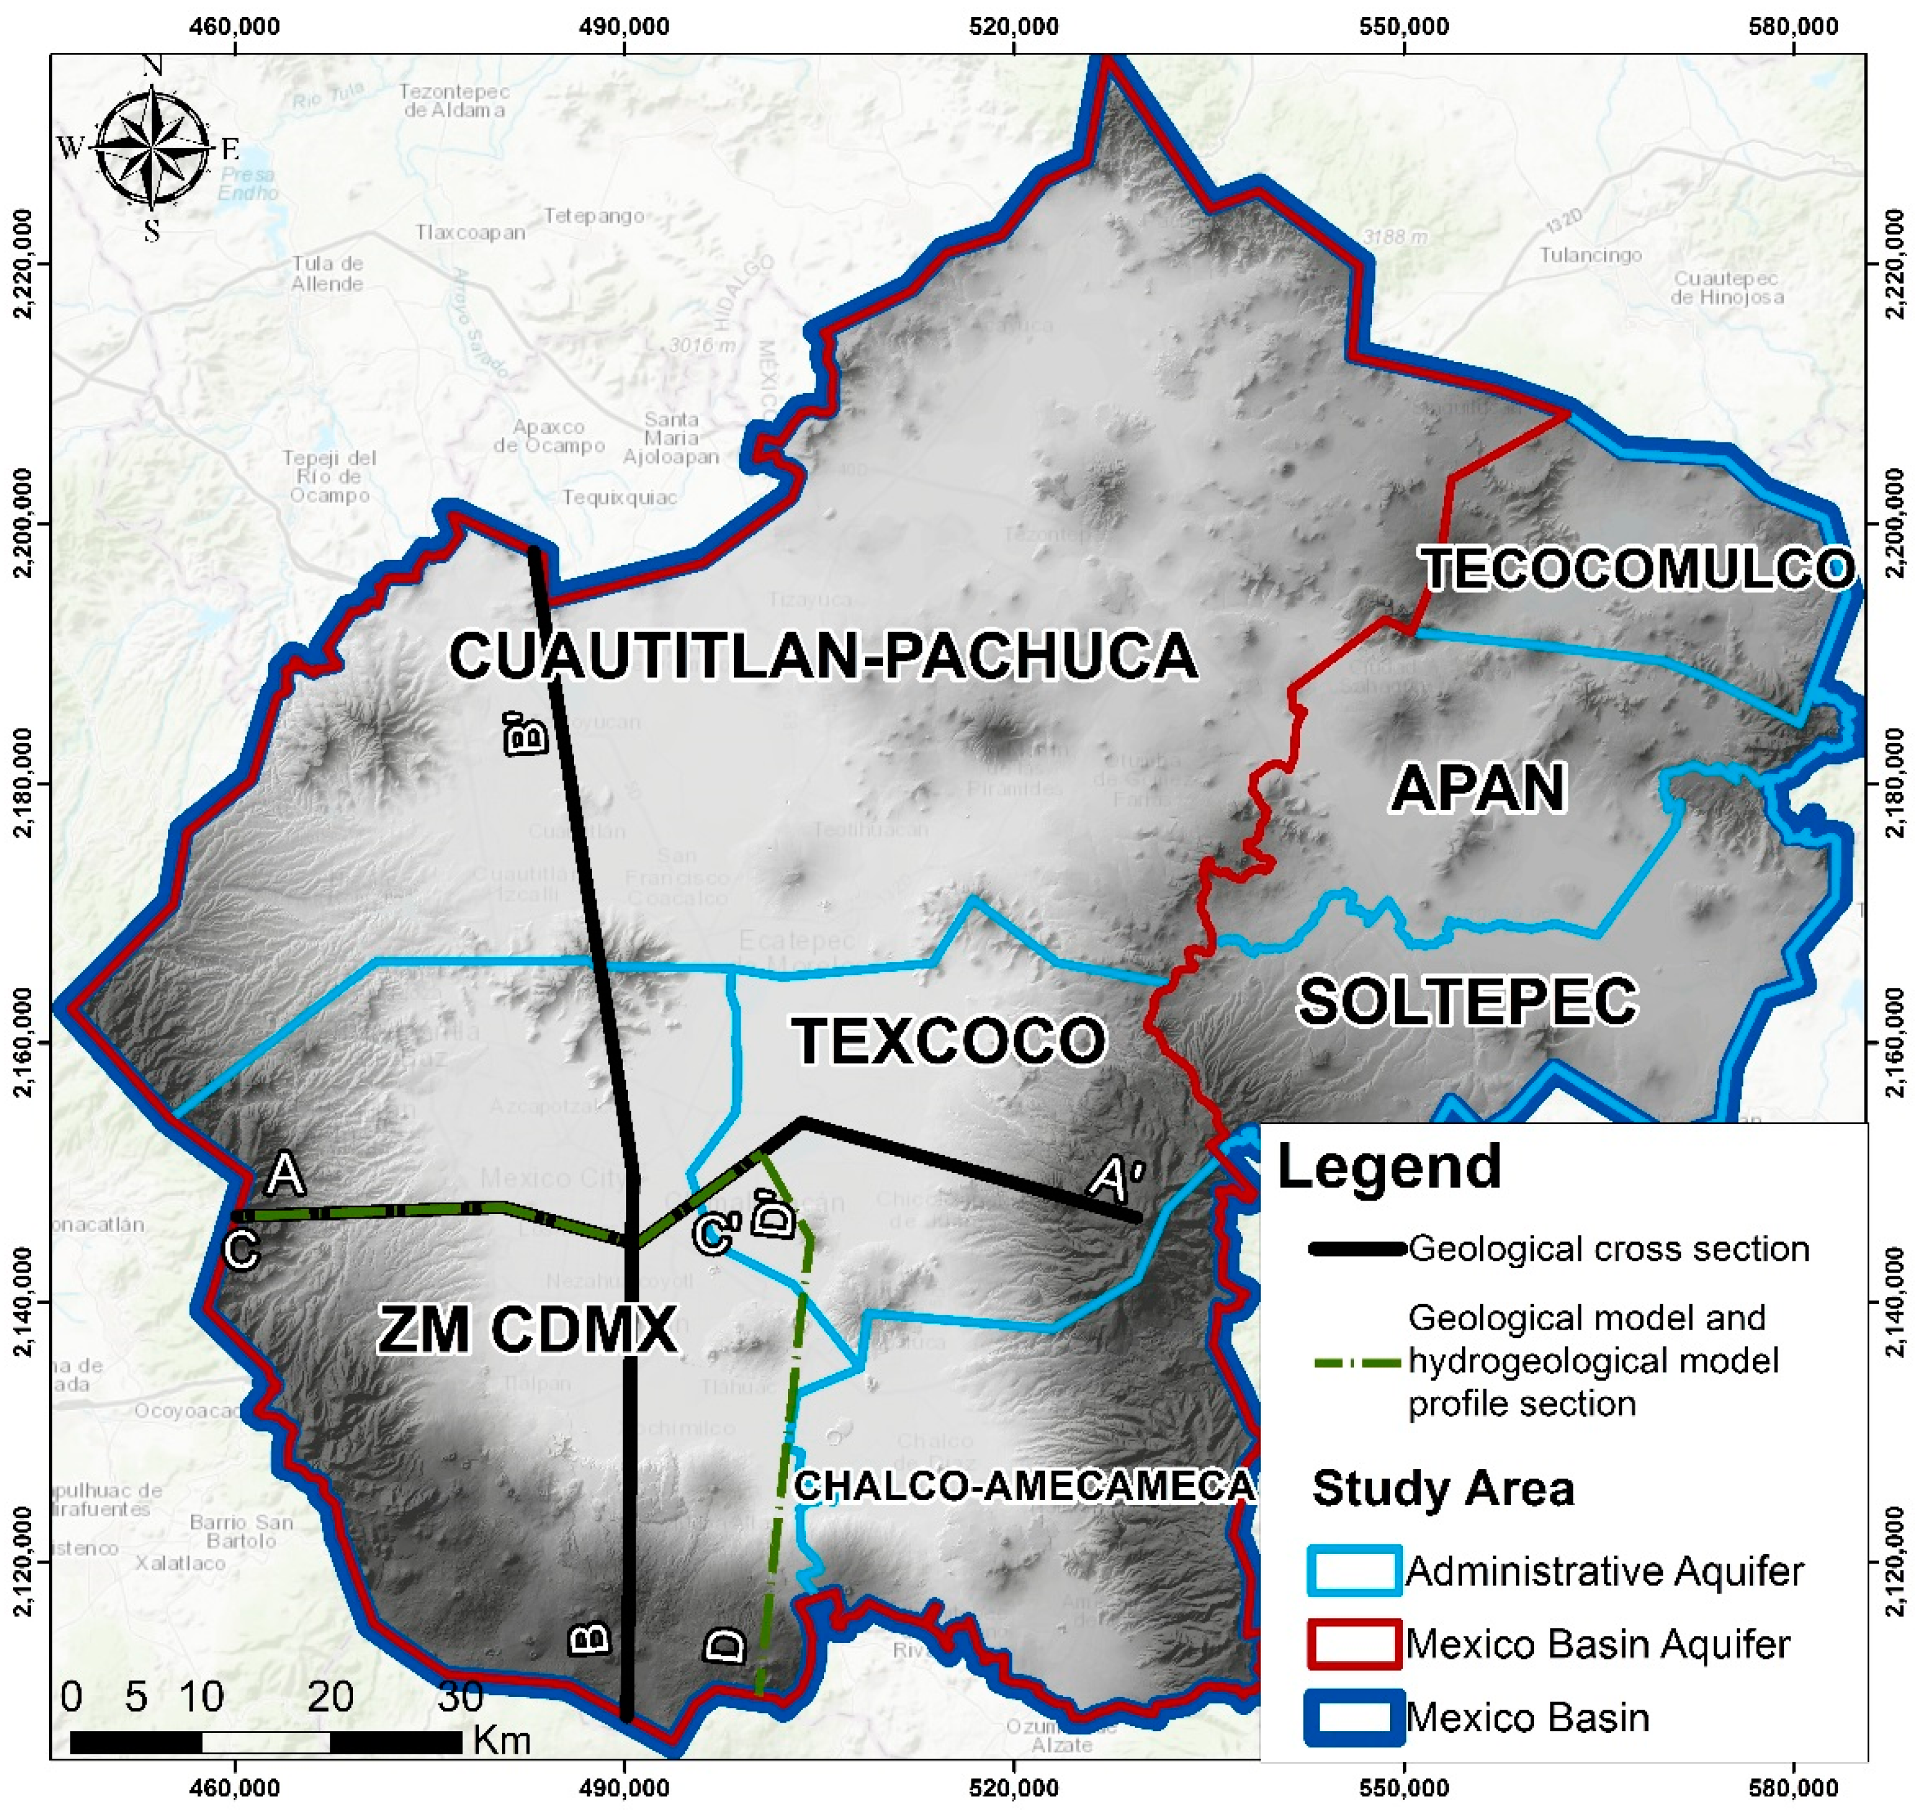
The boundaries of the Mexico Basin Aquifer follow the natural hydrogeological extent of the MB (Figure 4). The hydrogeological limits of the Mexico Basin Aquifer include the four administrative aquifers delimited by the National Water Commission: the Metropolitan Mexico City Area, Chalco, Texcoco and Cuautitlán-Pachuca [4]. There are three other administrative aquifers that are not connected in terms of regional flow (Figure 4); their assessment and contributions are beyond the scope of this study: the Soltepec, Tecocomulco and Apan Aquifers.
An aspect that complicates the management of the groundwater resource within the Mexico Basin Aquifer is the land subsidence associated mainly with the exploitation of groundwater, which is of a great magnitude due to the increase of effective stresses in the main aquifer-aquitard system, leading to its compaction [5].
2.2. Methods and Data
Data related to groundwater and the Mexico Basin Aquifer exist in a number of studies by government offices, research projects, theses and scientific articles. Geology, hydrostratigraphy, system parameterization, flow system analysis, groundwater quality, land subsidence and hydrogeological boundary conditions were used stepwise in developing a method to integrate data at various scales and times to set up the unified hydrogeological conceptual model of the Mexico Basin multi-layered aquifer system.
2.2.1. Hydrostratigraphy and Geology
The data used in this study consisted of published geologic information of the Mexico Basin with maps and cross sections based on [6,7,8,9,10,11,12,13]. Data from hydrogeological studies from [3,10,14,15,16,17,18] were compiled, analyzed and unified to define aquifers and aquitards in the Mexico Basin. About 419 lithological descriptions from groundwater wells (average depth of ~280 m), and 7 deep groundwater wells (depth ~2500 m) were compiled from different reports containing 13 lithological categories.
The spatial distribution of those wells was not uniform, as some areas had a coarse resolution, whereas others had a finer resolution with a nominal resolution scale of 1 km; the existing information had various formats and several spatial and stratigraphic references. Data processing was needed to obtain a consistent file containing the coordinates of well lithological records and the associated elevations of each geological formation. The various sets of geological data are now homogeneous (same format, same spatial reference and same units), making the data more reliable.
2.2.2. Groundwater Flow System and Natural Recharge
The hydrologic data were used in conjunction with the geologic data to define the boundary of natural recharge estimation over space-time and boundary conditions of groundwater flow. The natural recharge rate analysis was taken from [19], who used the APLIS methodology combined with a GIS platform with the following variables: altitude, slope, lithology, preferential infiltration layers and soil.
Groundwater levels in the Mexico Basin, as measured by the Water National Commission and the Mexico City Water Supply System’s monitoring networks of observation wells and pumping wells, were collected from 1968 to 2019 (yearly water level measurements). A preliminary analysis of the database was made, finding data from 1002 wells; however, the coordinates of 41 wells were not presented. In total there were 16,969 water level data for the period of 1984 to 2019, with the most data for a single well covering 48 years (only 3 wells). The year with the greatest amount of information found was 2005 (562 measurements).
Data processing was developed to filter this database and exclude any well observation sets with erratic behavior as compared to nearby wells. To set the hydraulic head throughout the area over time, the observations from each year were interpolated using ordinary kriging with a spherical variogram model. The initial head values and the rest of the head values over time were used as drawdown observations to perform error introduced by uncertainties associated with well elevation and well position. Wells that exhibited a difference in water levels of ±10 m from one year to the next were reviewed to see if the fluctuation was persistent and/or representative related to the behavior in nearby wells and in some cases to pumping rates.
2.2.3. Land Subsidence
Data from 2017 on the benchmarking leveling from the Mexico City Water Supply System and historical data from Auvinet et al. [20] were analyzed to assess the evolution of land subsidence over time. The area covered by this analysis included parts of the zones where very scattered information was available to estimate subsidence rates in the Texcoco Lake region. Geotechnical data was collected from the analysis of Auvinet et al. [20].
2.2.4. Groundwater Quality
The database from the monitoring program of the Water National Commission and Mexico City Water Supply System was analyzed for groundwater quality. The monitoring program in those agencies includes water-quality data collected for over 50 years, mostly to comply with the Mexican regulatory standards for potable freshwater supply. The parameters considered in this study were major and minor ions, trace elements and other physicochemical parameters.
However, of the 35 years analyzed in detail for the period of 1985–2019, there was not information for every year and sampling was not always performed in the same well. A preliminary analysis of the database found data from 611 wells: in total, there were 15,811 quality groundwater data containing parameters for permissible limits of water quality for human use and consumption according to Mexican regulations. Geochemical and isotope information was obtained from the scientific literature, including publications from [15,18,21,22,23,24].
Data processing was needed to obtain a consistent file containing the coordinates and dates of each groundwater sampling. The various sets of groundwater quality data are now homogeneous (same format, same spatial reference and same units). Only water analyses with a charge balance error less than ±10% were used. This resulted in a dataset of 151 samples. The resulting dataset adds value to the existing information, making the data more reliable and of better quality.
New data were added from a recent field study by the authors, carried out as part of a new hydrogeochemical project. The field campaigns took place in November 2018. The objectives of these field studies were to collect groundwater samples for isotopic analyses (δ2H, δ18O and 14C), as well as groundwater samples for major and minor ions, trace elements and other physicochemical parameters.
2.3. The Water Budget of the Mexico Basin as per 2019
A very important step in building a conceptual model is the preparation of a water budget. Quantifying the spatial and temporal variations of a water budget is essential for improving our understanding of the availability of water resources, the risk of hydrologic extremes such as floods and droughts and the implications of climate change. The water budget of the complete Mexico Basin was constructed from the available data up to 2019.
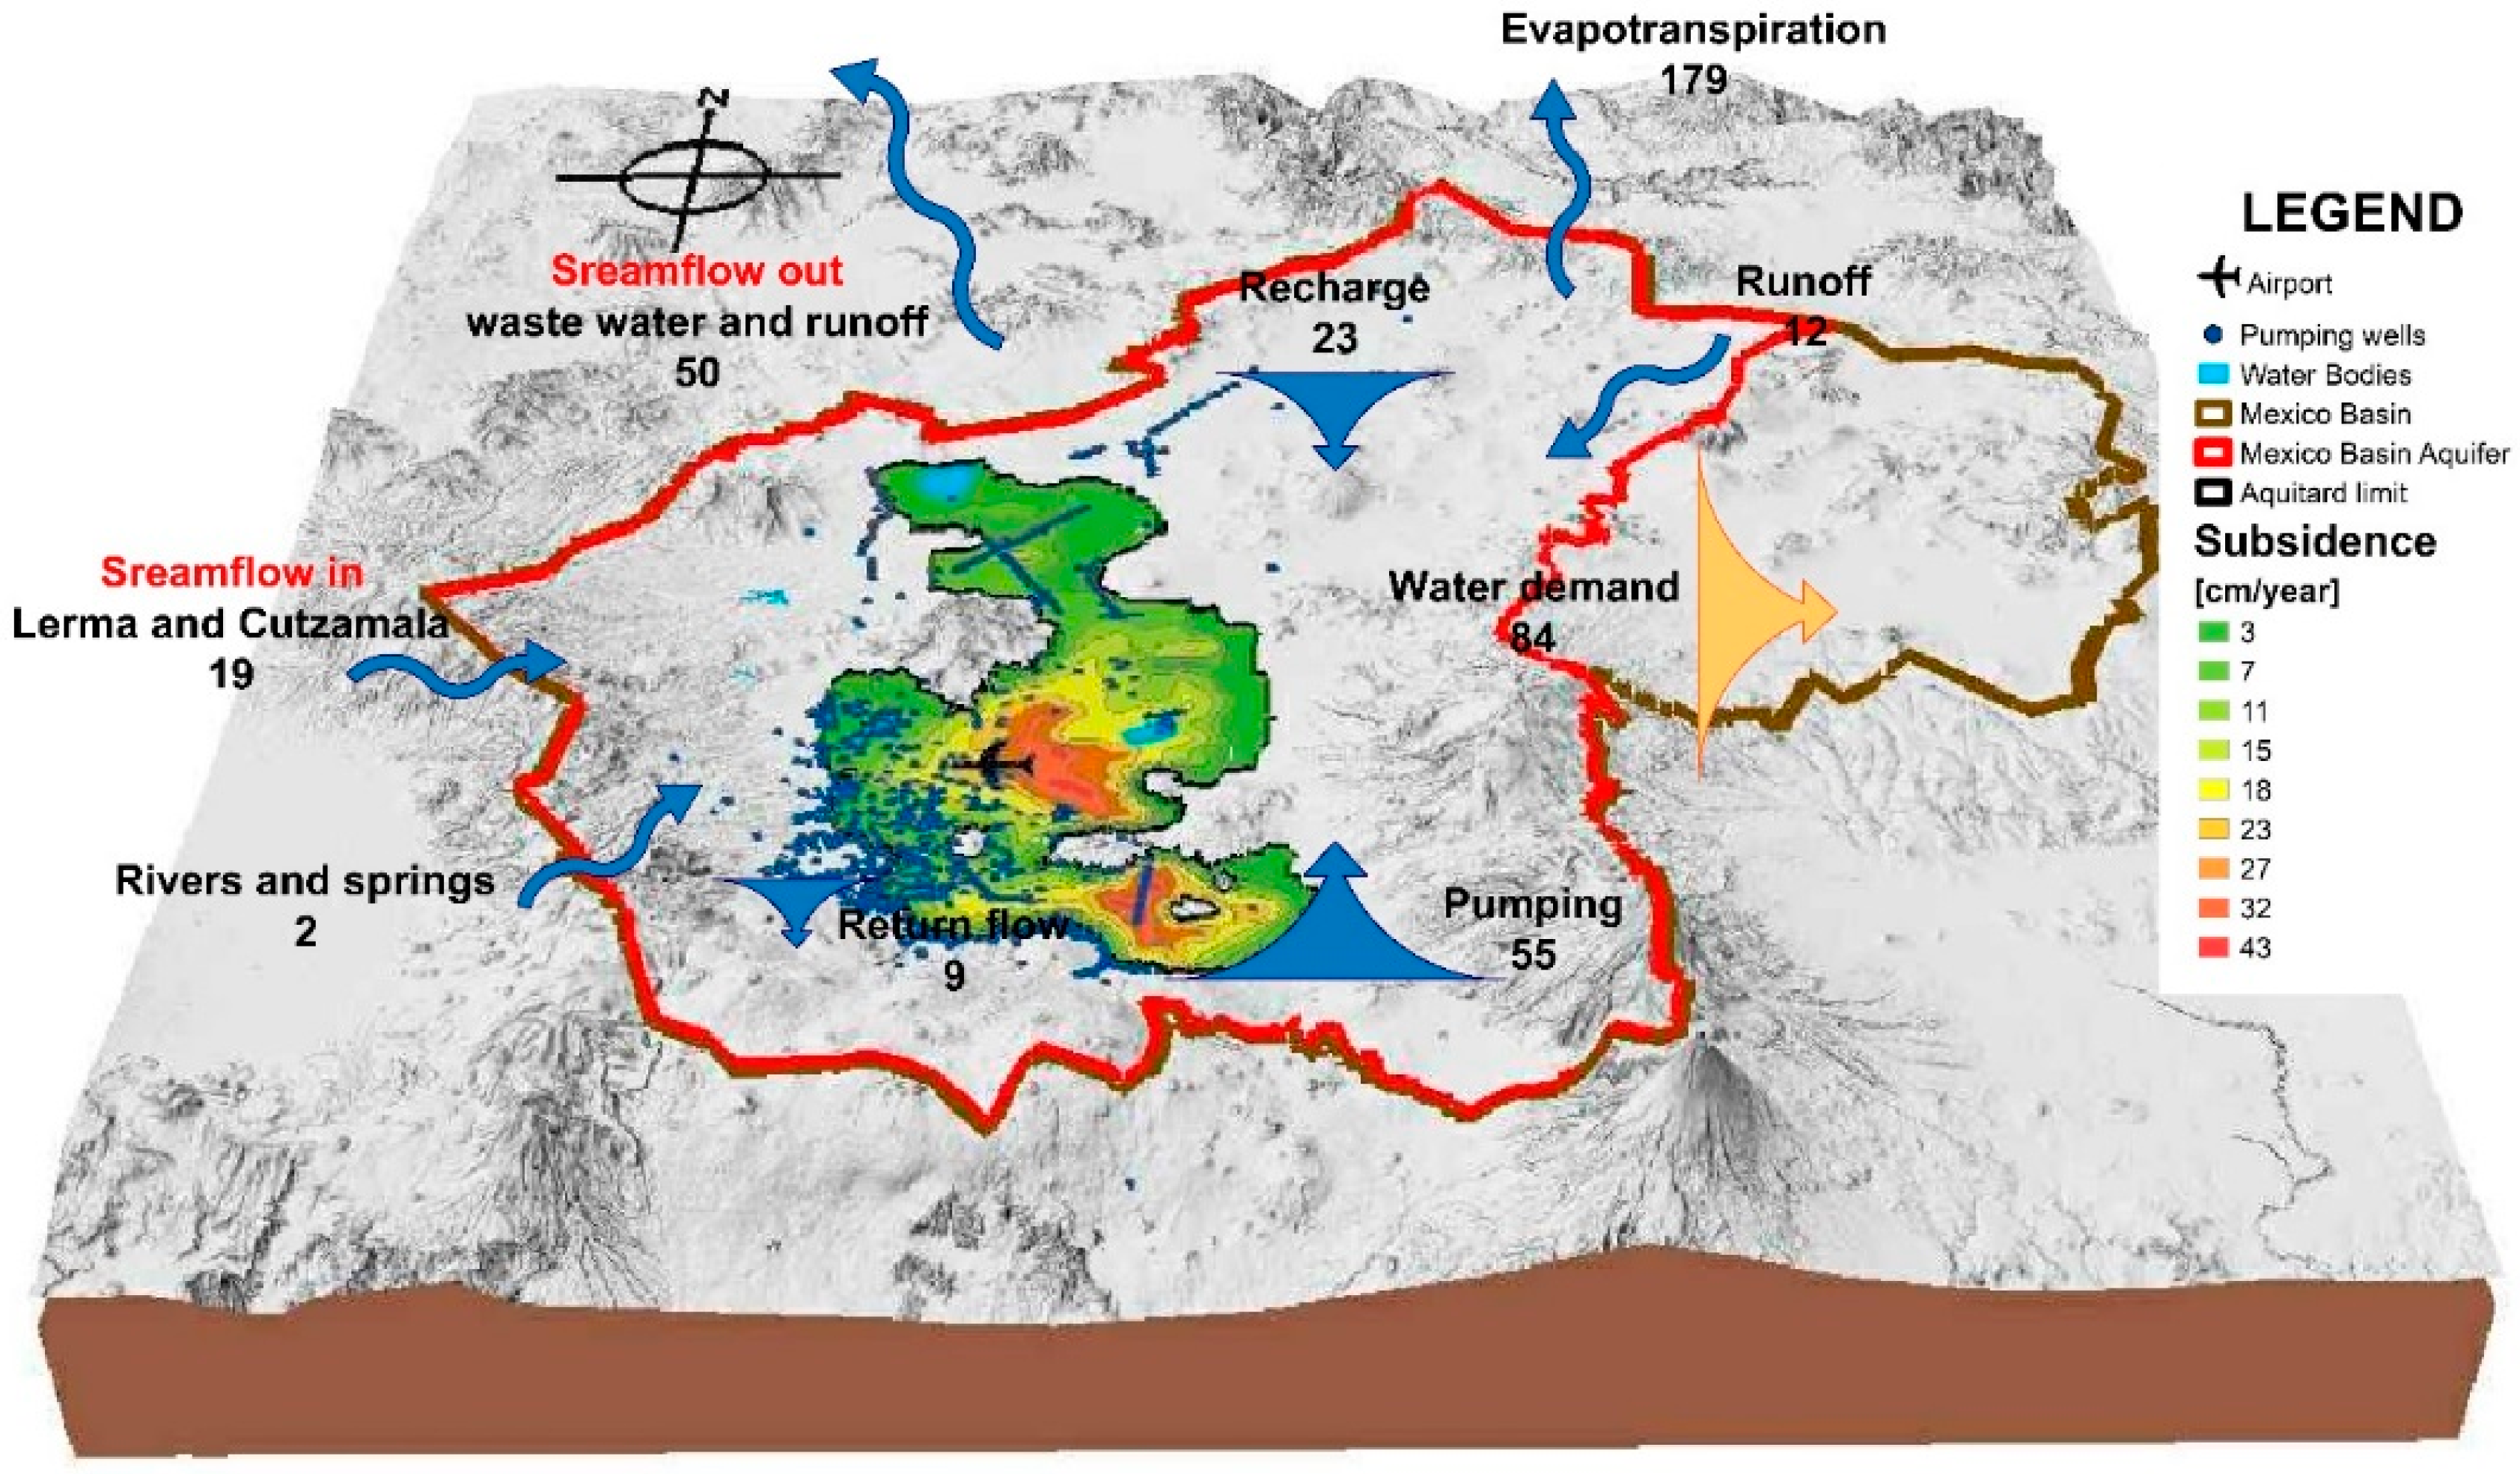
The Mexico Basin receives an estimated 214 cubic meters per second (cms) of annual precipitation, of which approximately 179 cms are lost to evapotranspiration and 12 cms of runoff are transported out of the watershed for flood management and protection (2018 annual average). An additional 38 cms of wastewater and storm water leave the basin, with the remaining 23 cms of inflow recharging the Mexico Basin Aquifer through infiltration (Figure 5).
The total water demand for the Mexico Basin is 84 cms and is provided by groundwater (66%), imported water (23%) and recycled water (10%). Imported water includes surface water 140 km away that comes from the Cutzamala in the Balsas River watershed, and groundwater 57 km away from the Lerma aquifer system. Recycled water includes secondary treated and untreated wastewater. Local rivers and springs provide a very small portion (1%) of the Mexico Basin water supply (Figure 5).
Return flow was estimated by summarizing irrigation return flow (4 cms) in the area plus the vertical cross-formational flow (5 cms) from aquitard to aquifer. Vertical cross-formational flow from the clays overlaying the main aquifer was calculated with a numerical model of the aquifer [25].
This water budget shows that the Mexico Basin is in an unsustainable state, marked by an imbalance with the water demand (84 cms). The pumping rate (55 cms) exceeds the natural aquifer recharge plus return flow (32 cms) by 23 cms, which represents approximately the overexploitation rate. Another important issue in the water budget is the low rate of water reuse and the management of surface runoff from the surrounding mountains, which is captured and transported outside the basin.
The effect of differential consolidation affecting infrastructure, such as drainage, is leakage from water networks, representing 40% of the water supply. Figure 5 shows the total consolidated area in the aquitard central region of the basin, as estimated by Auvinet et al. [20], with a volume of approximately 4500 × 106 m3 of land subsidence from 1898 to 2008. Another method of estimating soil consolidation was presented by Santoyo et al. [3]: these authors estimated a total land subsidence volume of 1498 × 106 m3 from 1930 to 2000.
2.4. Hydrogeological Settings
2.4.1. Geology
In recent years, many studies have contributed to increased knowledge of the geology of the Basin; we cite some of the most relevant here [3,10,11,12]. Furthermore, in this research, we use the results obtained from the drilling of the very deep San Lorenzo and Santa Catarina wells (~2000 m), which were drilled by the Mexico City Water Supply System [26,27,28,29].
The ancient basin was formed following the faulting of the underlying Cretaceous rocks, which do not appear in the basin but have been found at depths between 1600 and 2000 m in drilling carried out by Mexican Petroleum and the Mexico City Water Supply System. The Cretaceous carbonate rock formation has been recently identified as an important water-bearing formation and now it is being exploited by two deep wells with a combined production of about 80 lps [29].
On top of this formation, there are rocks with low-grade metamorphism and carbonate rocks from the Upper Cretaceous and Lower Tertiary, generally impervious to underground flow. The Mexico Basin was an open basin that had a surficial drain to the south through two principal rivers, and was limited to the east and west by mountain ranges of volcanic origin. The rivers produced large deposits of alluvial material at the bottom of the valley.
This flow condition was closed during the Pleistocene because of a series of volcanic activities [9]. This magmatic activity resulted in extensive lava flows that formed the Sierra Chichinautzin to the south of the basin. The extrusive events lasted a sufficient time until around 7000 years BP, allowing a substantial layer of ash, inter-bedded with alluvial and lacustrine deposits, to accumulate in the various lakes formed after the closure of the basin [30].
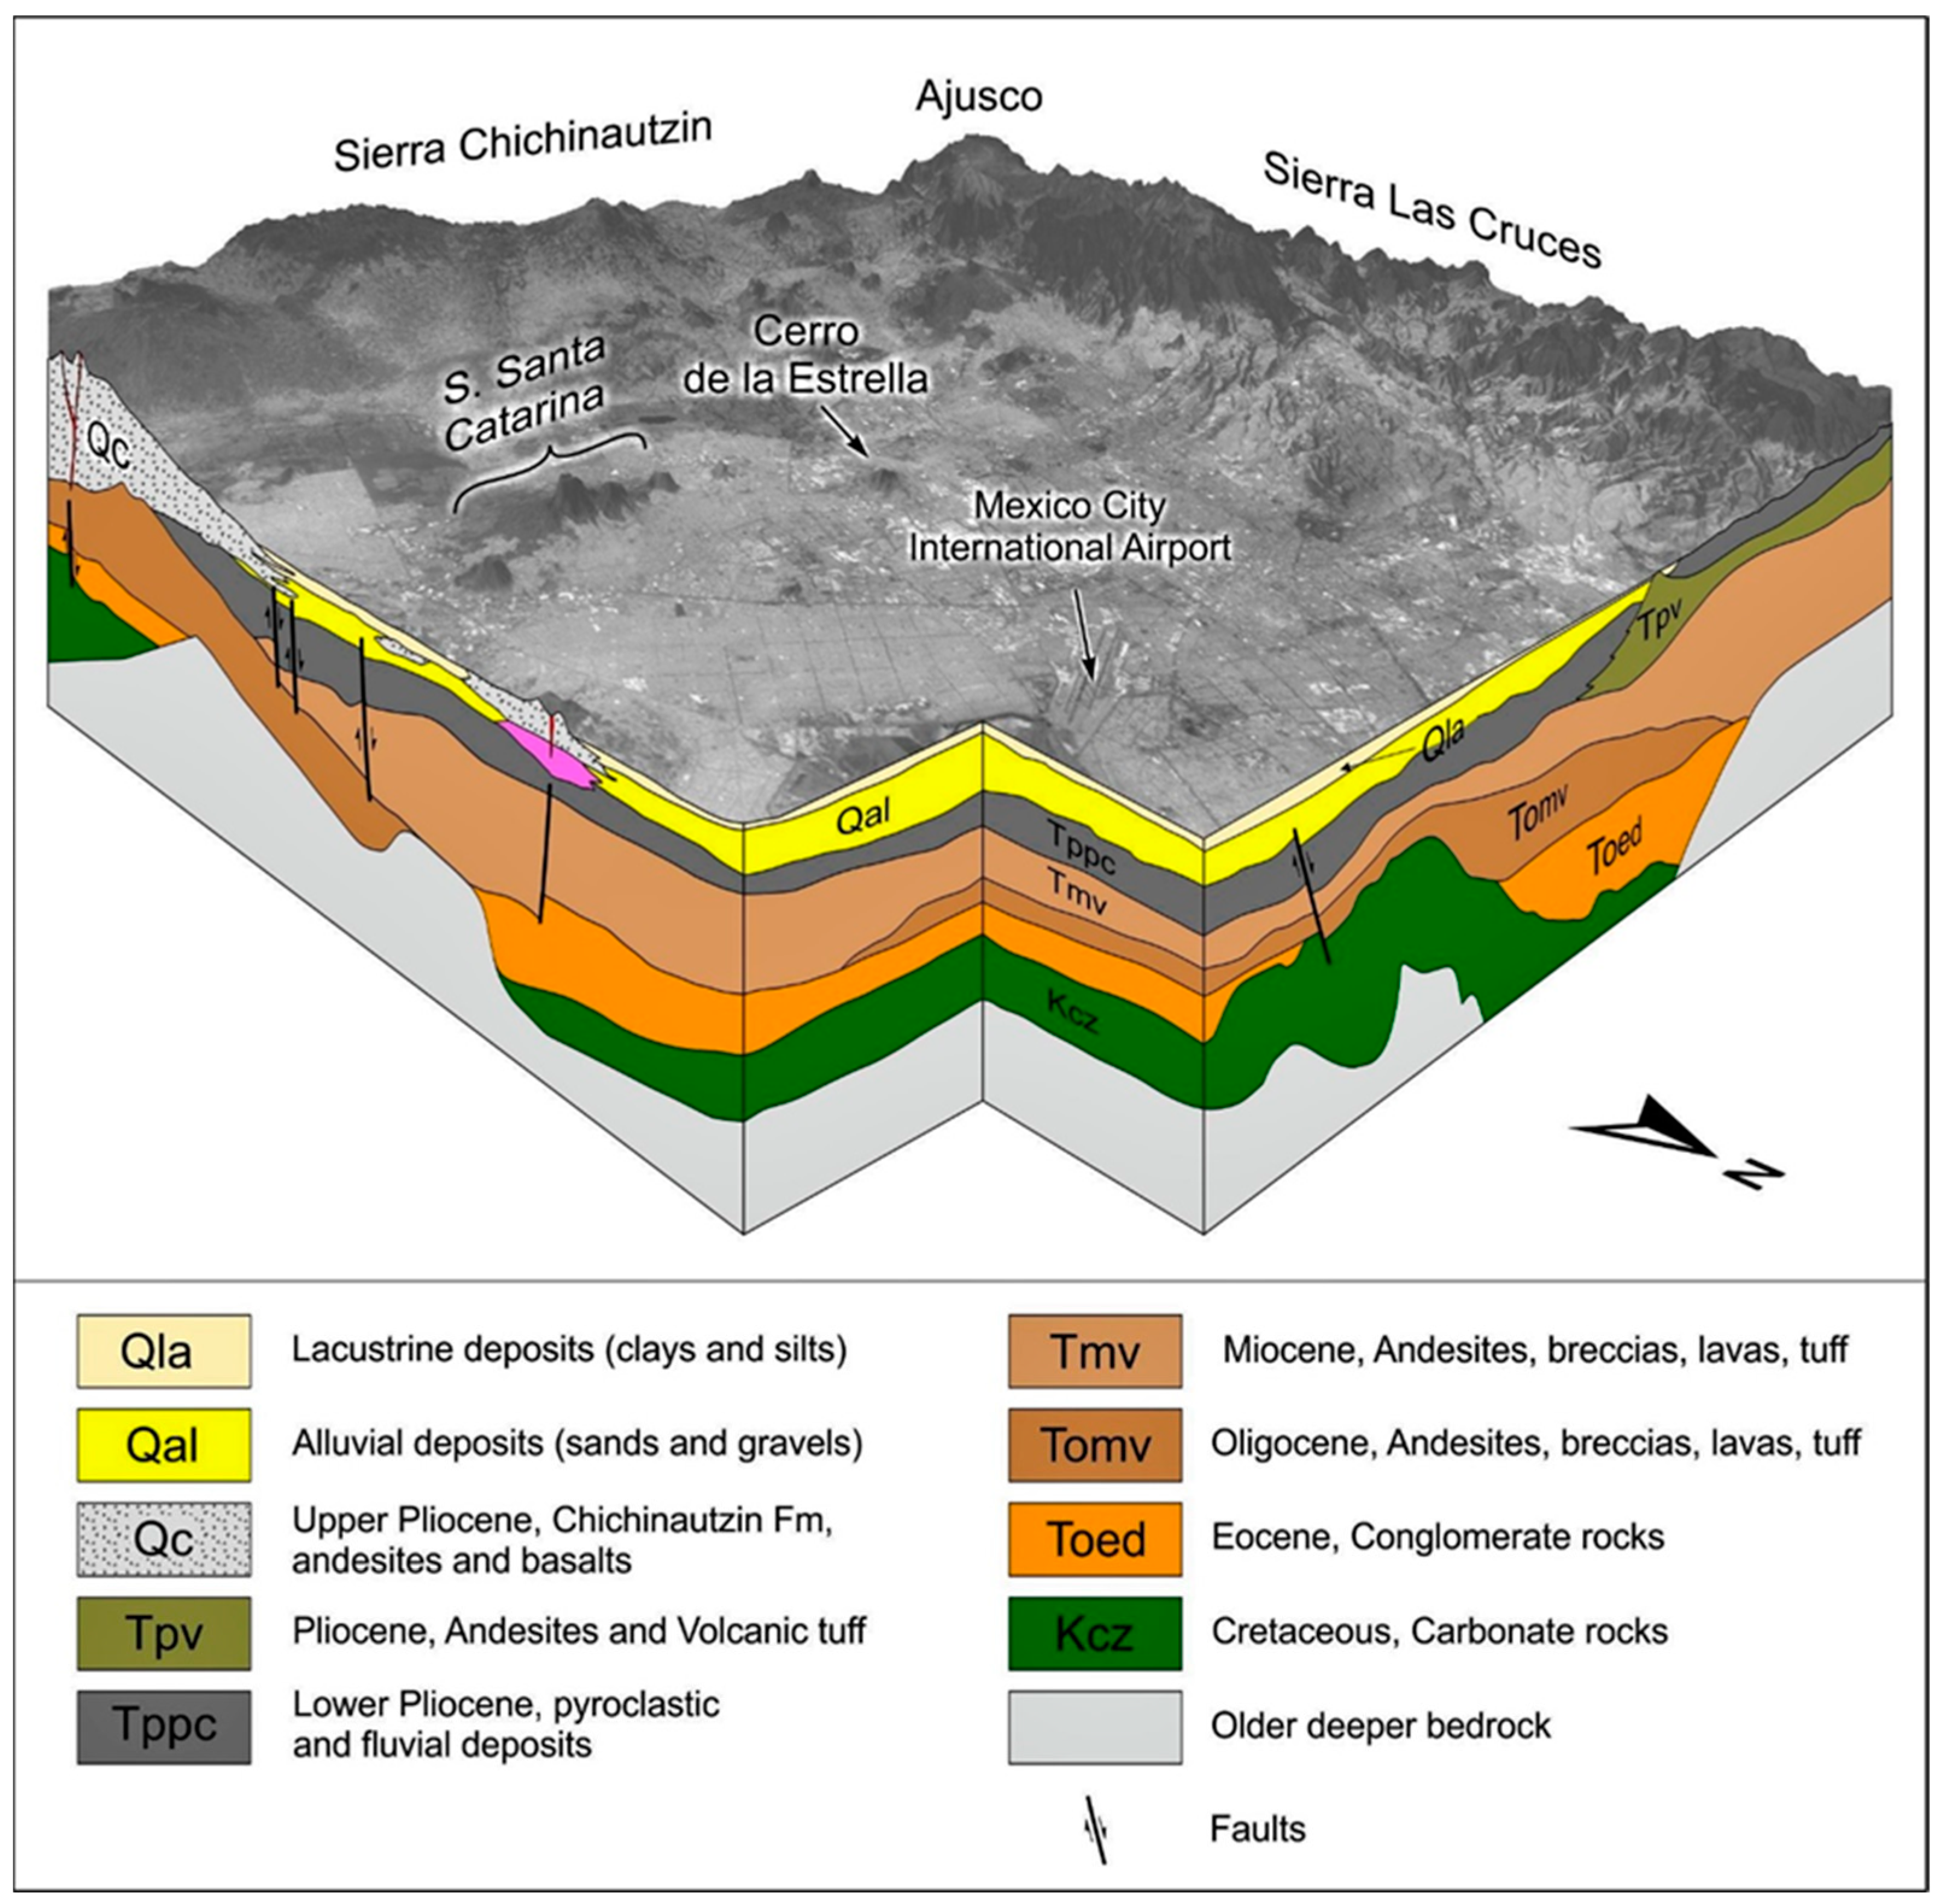
Figure 6 shows a schematic three-dimensional depiction of the basin’s geological model derived from those studies, as seen from the northeastern part of the basin.
The Mexico Basin mostly overlies lacustrine deposits and partly overlies Tertiary volcanic rocks to the west and basalts to the south. The Tertiary conglomerate and evaporate unit is a deep (>1500 m below the plain) and isolated formation. The fractured Tertiary volcanic formation is considered an aquitard [17]. This unit crops out to the east and west, where it has some fractures and represents zones of recharge. The main groundwater exploitation is in the alluvial deposits, in the Quaternary fractured basalts to the south and in the fractured Tertiary volcanic rocks that outcrop to the west.
2.4.2. Hydrostratigraphy
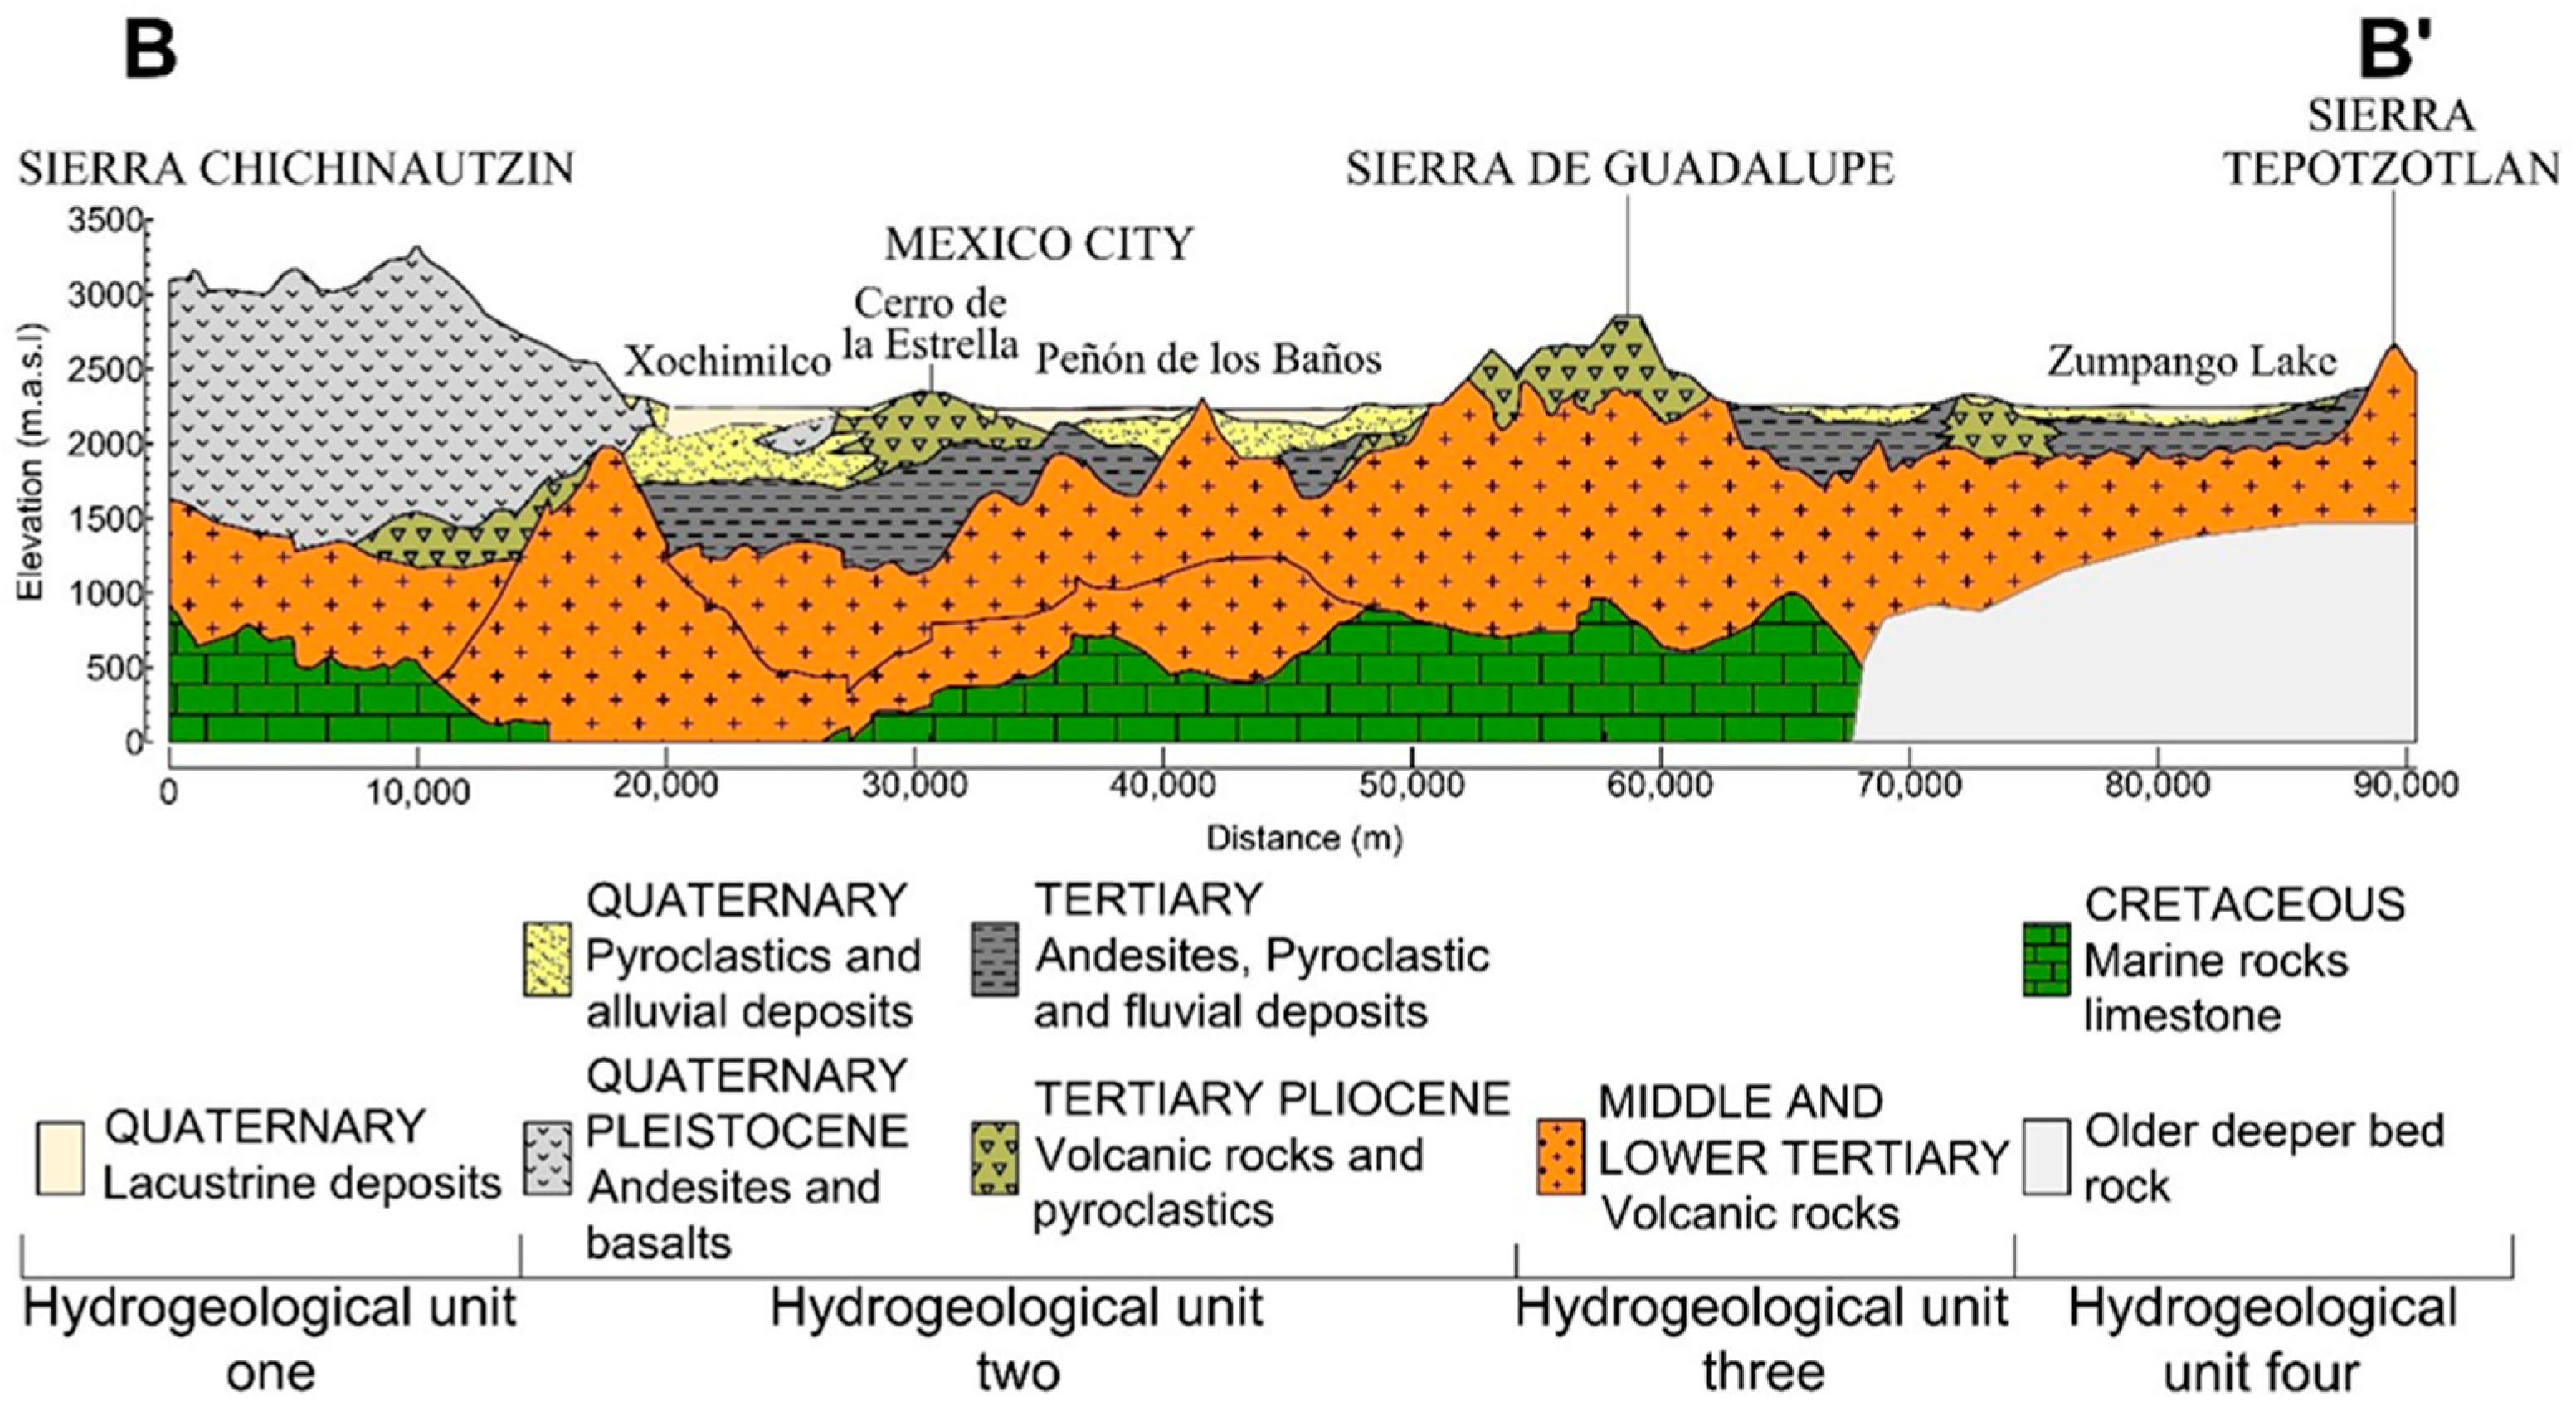
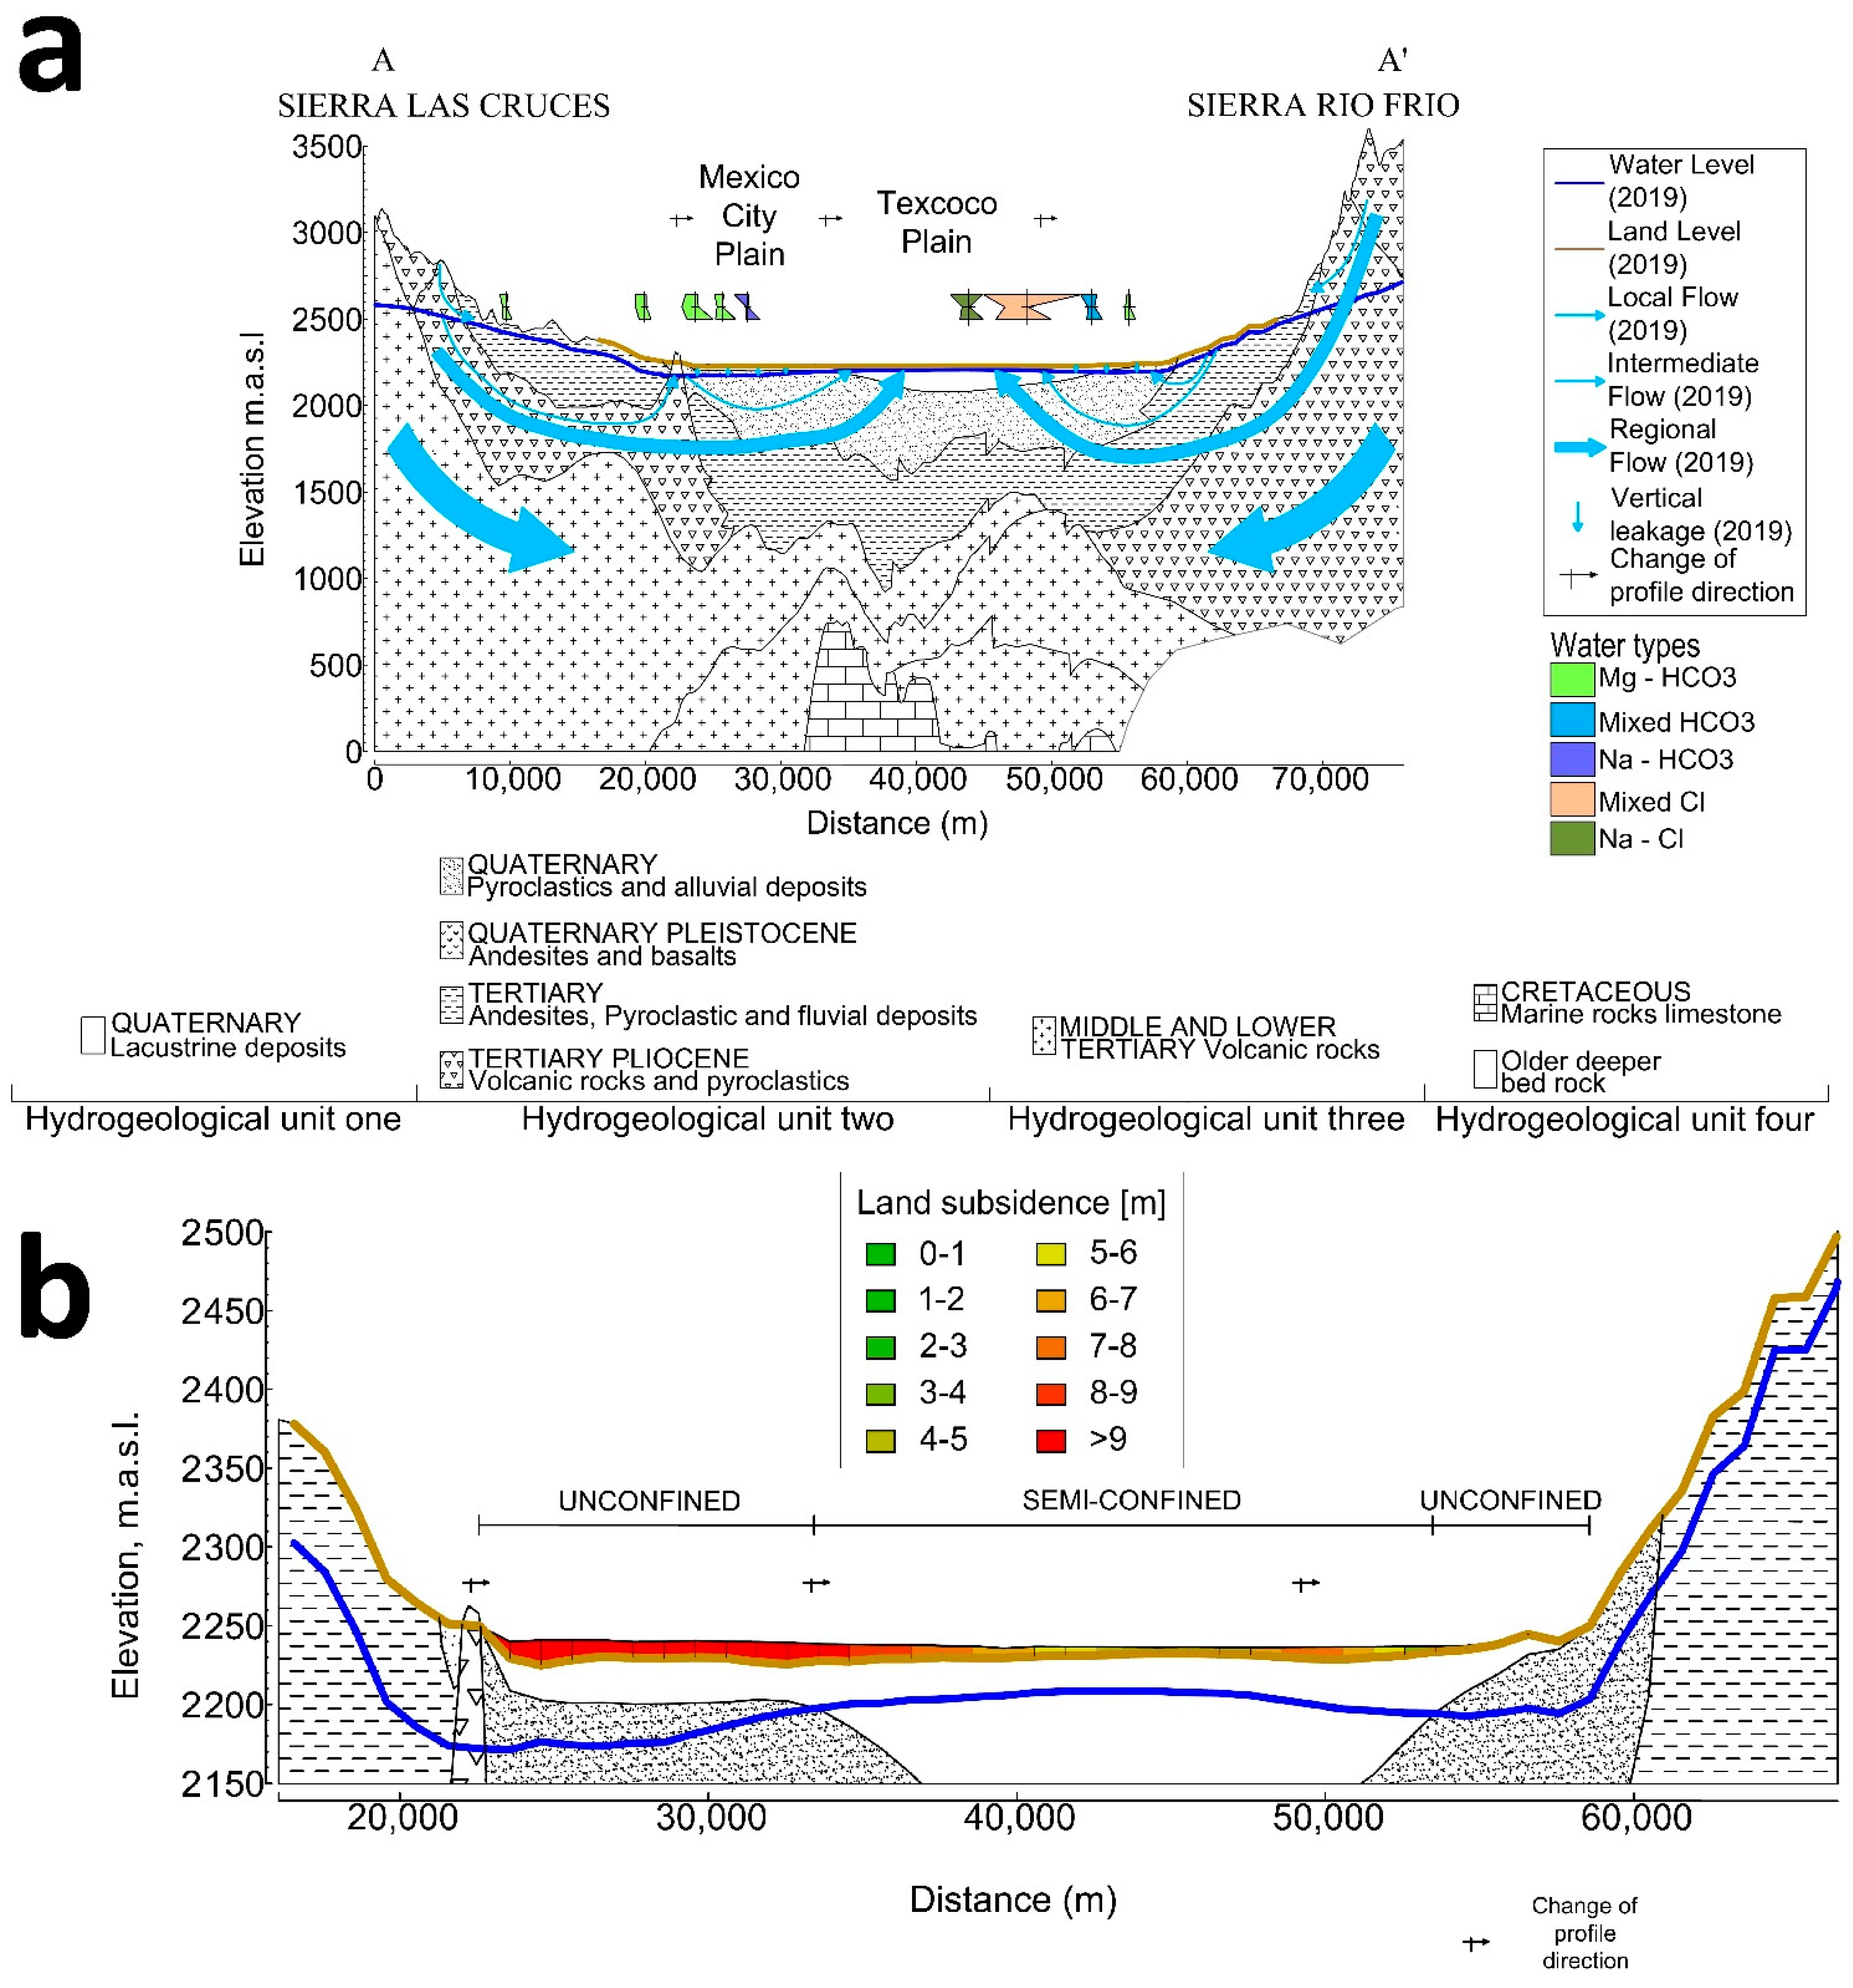
Based on this geological model, we developed a hydrostratigraphic system by grouping diverse formations with similar properties and hydraulic behavior into hydrogeological units; the grouping of these four units is shown at the bottom of the cross section in Figure 7. We divided the uppermost unconsolidated and consolidated rocks and deposits in the MBA model into the four main hydrogeological units listed in Table 1.
With these groupings, we built the 3D conceptual hydrogeological model for the basin (the Mexico Basin Aquifer), as seen from its northeastern-part in Figure 8. This model is based on the concepts of hydrologic continuity between formations and the hierarchical and dynamic organization of water circulation in groundwater flow systems [31].
2.4.3. Aquifer Properties
The Mexico Basin Aquifer has been the subject of several studies over the years; most of them began with very detailed, local-scale characterization of the Mexico City clays in the earlies 1900s. Thus, data on clay porosity, void ratio, compressibility, the specific storage coefficient, permeability and others abound. Various researchers used that precious dataset to evaluate a coupled hydromechanical process from local to regional scales in an effort to better understand and predict land subsidence as a result of groundwater pumping [17,32,33,34]. Table S1 (in Supplementary Materials) is a summary of hydrogeologic parameters for hydrogeological units 1 and 2 presented in Table 1.
With the exception of Rivera [32], all the hydrogeological parameters in Table S1 are from pumping tests, well logs or laboratory cores samples, and in situ tests. Others are from one-dimensional [34] or two-dimensional local-scale modeling [17,35] and regional-scale quasi-3D or fully 3D modeling [33,34]. The values from Rivera [36] in Table S1 are parameters obtained from the calibration of a regional-scale numerical model of the MBA.
The third unit, the Lower Aquitard, is a deep, isolated unit (>1500 m below the plain), whose characteristics are not very well known. The fourth unit, the Lower Aquifer, is even deeper, but a few studies during the drilling of deep exploratory wells (~2000 m) evidenced a rather high permeability, mostly due to fracturing observed in cores extracted from the formation [13].
3. Results
Based on the geology and hydrogeology defined above, we analyzed and evaluated changes in groundwater flow paths, recharge and discharge areas, hydromechanical properties of the aquifer and aquitard, water pressure conditions, aquifer-aquitard inter-layered fluxes and hydrogeochemical conditions to validate the conceptual model and examine the effects of 120 years of groundwater withdrawals.
The hydrological processes of the basin have been modified by humans for over a century. In this section, we analyze three stages over the last 120 years where those changes have been the most significant within the hydrological framework of the basin.
3.1. Changes in Groundwater and Aquifer Properties with Time: Year 1950, the Growth of the City Sustained by Groundwater
In the middle of the twentieth century, aquifer recharge was dominated by infiltration of precipitation in the mountains. The main geological formations allowing recharge were the Sierra de Chichinautzin to the south-southwest, in Sierra de Las Cruces to the east and in the northern part, the Sierras Nevada and Río Frío.
There is limited quantitative information concerning the recharge rate of the Mexico Basin Aquifer. An estimate of the effective recharge rate was obtained applying the APLIS methodology [19,37]. APLIS uses a GIS platform with the following variables: altitude, slope, lithology, preferential infiltration layers and soil. The estimated effective recharge represents 11% of total precipitation and the total recharge estimated during this period was about 38 m3/s (Table 2); at that time, the urban area was located essentially at the center of the Mexico City Plain, having an area of 159 km2 (Figure 9a).
Discharge occurred as the flow of the springs at the edge of the plain responded rapidly and strongly to precipitation in the mountains; these hydraulic conditions can also be used to explain the accounts of the appearance of springs in the streets of Mexico City during floods [3].
Diffuse discharge occurred over much of the lake’s bottom by evaporation, mainly in the Texcoco Lake. Saline groundwater and hot springs were restricted to this area, again fitting the pattern of flow for a near-ideal system. Thermal springs were permanently discharged during historic times within the area along fractures, for example, the spring “Peñón de los Baños” [3,18].
Artesian wells were another source of discharge, with approximately 5 m3/s, and were used for urban water use. Molina-Berbeyer [38] reported levels in unpumped 80 m deep wells at Lake Texcoco to be 3–7 m above the land surface. The aquifer condition in the plains was mostly confined along the full aquitard extension, and the groundwater flow direction was essentially horizontal and towards the plains (Figure 9a). Another form of discharge from the basin was wastewater and runoff exports to the Tula Basin, as during that period the Grand Canal and the Tequixquiac tunnel were already operating, dislodging 11 m3/s as an annual average [39].
It is interesting to learn that the upward hydraulic gradient may have been the cause of the extremely high-water content (average = 400%) of the lacustrine clays, as suggested by Mazari [40]. An upward gradient would reduce the effective stress and perhaps allow a relatively stable condition with very low compaction following deposition of the sediments [39].
The total land subsidence registered in the Mexico City Cathedral for 1950 was almost 4 m (Figure 9b), with a consolidation velocity of 16 cm/year [3]. The loss of hydrostatic pressure in the aquifer in the central zone of the city was approximately 5 m [41].
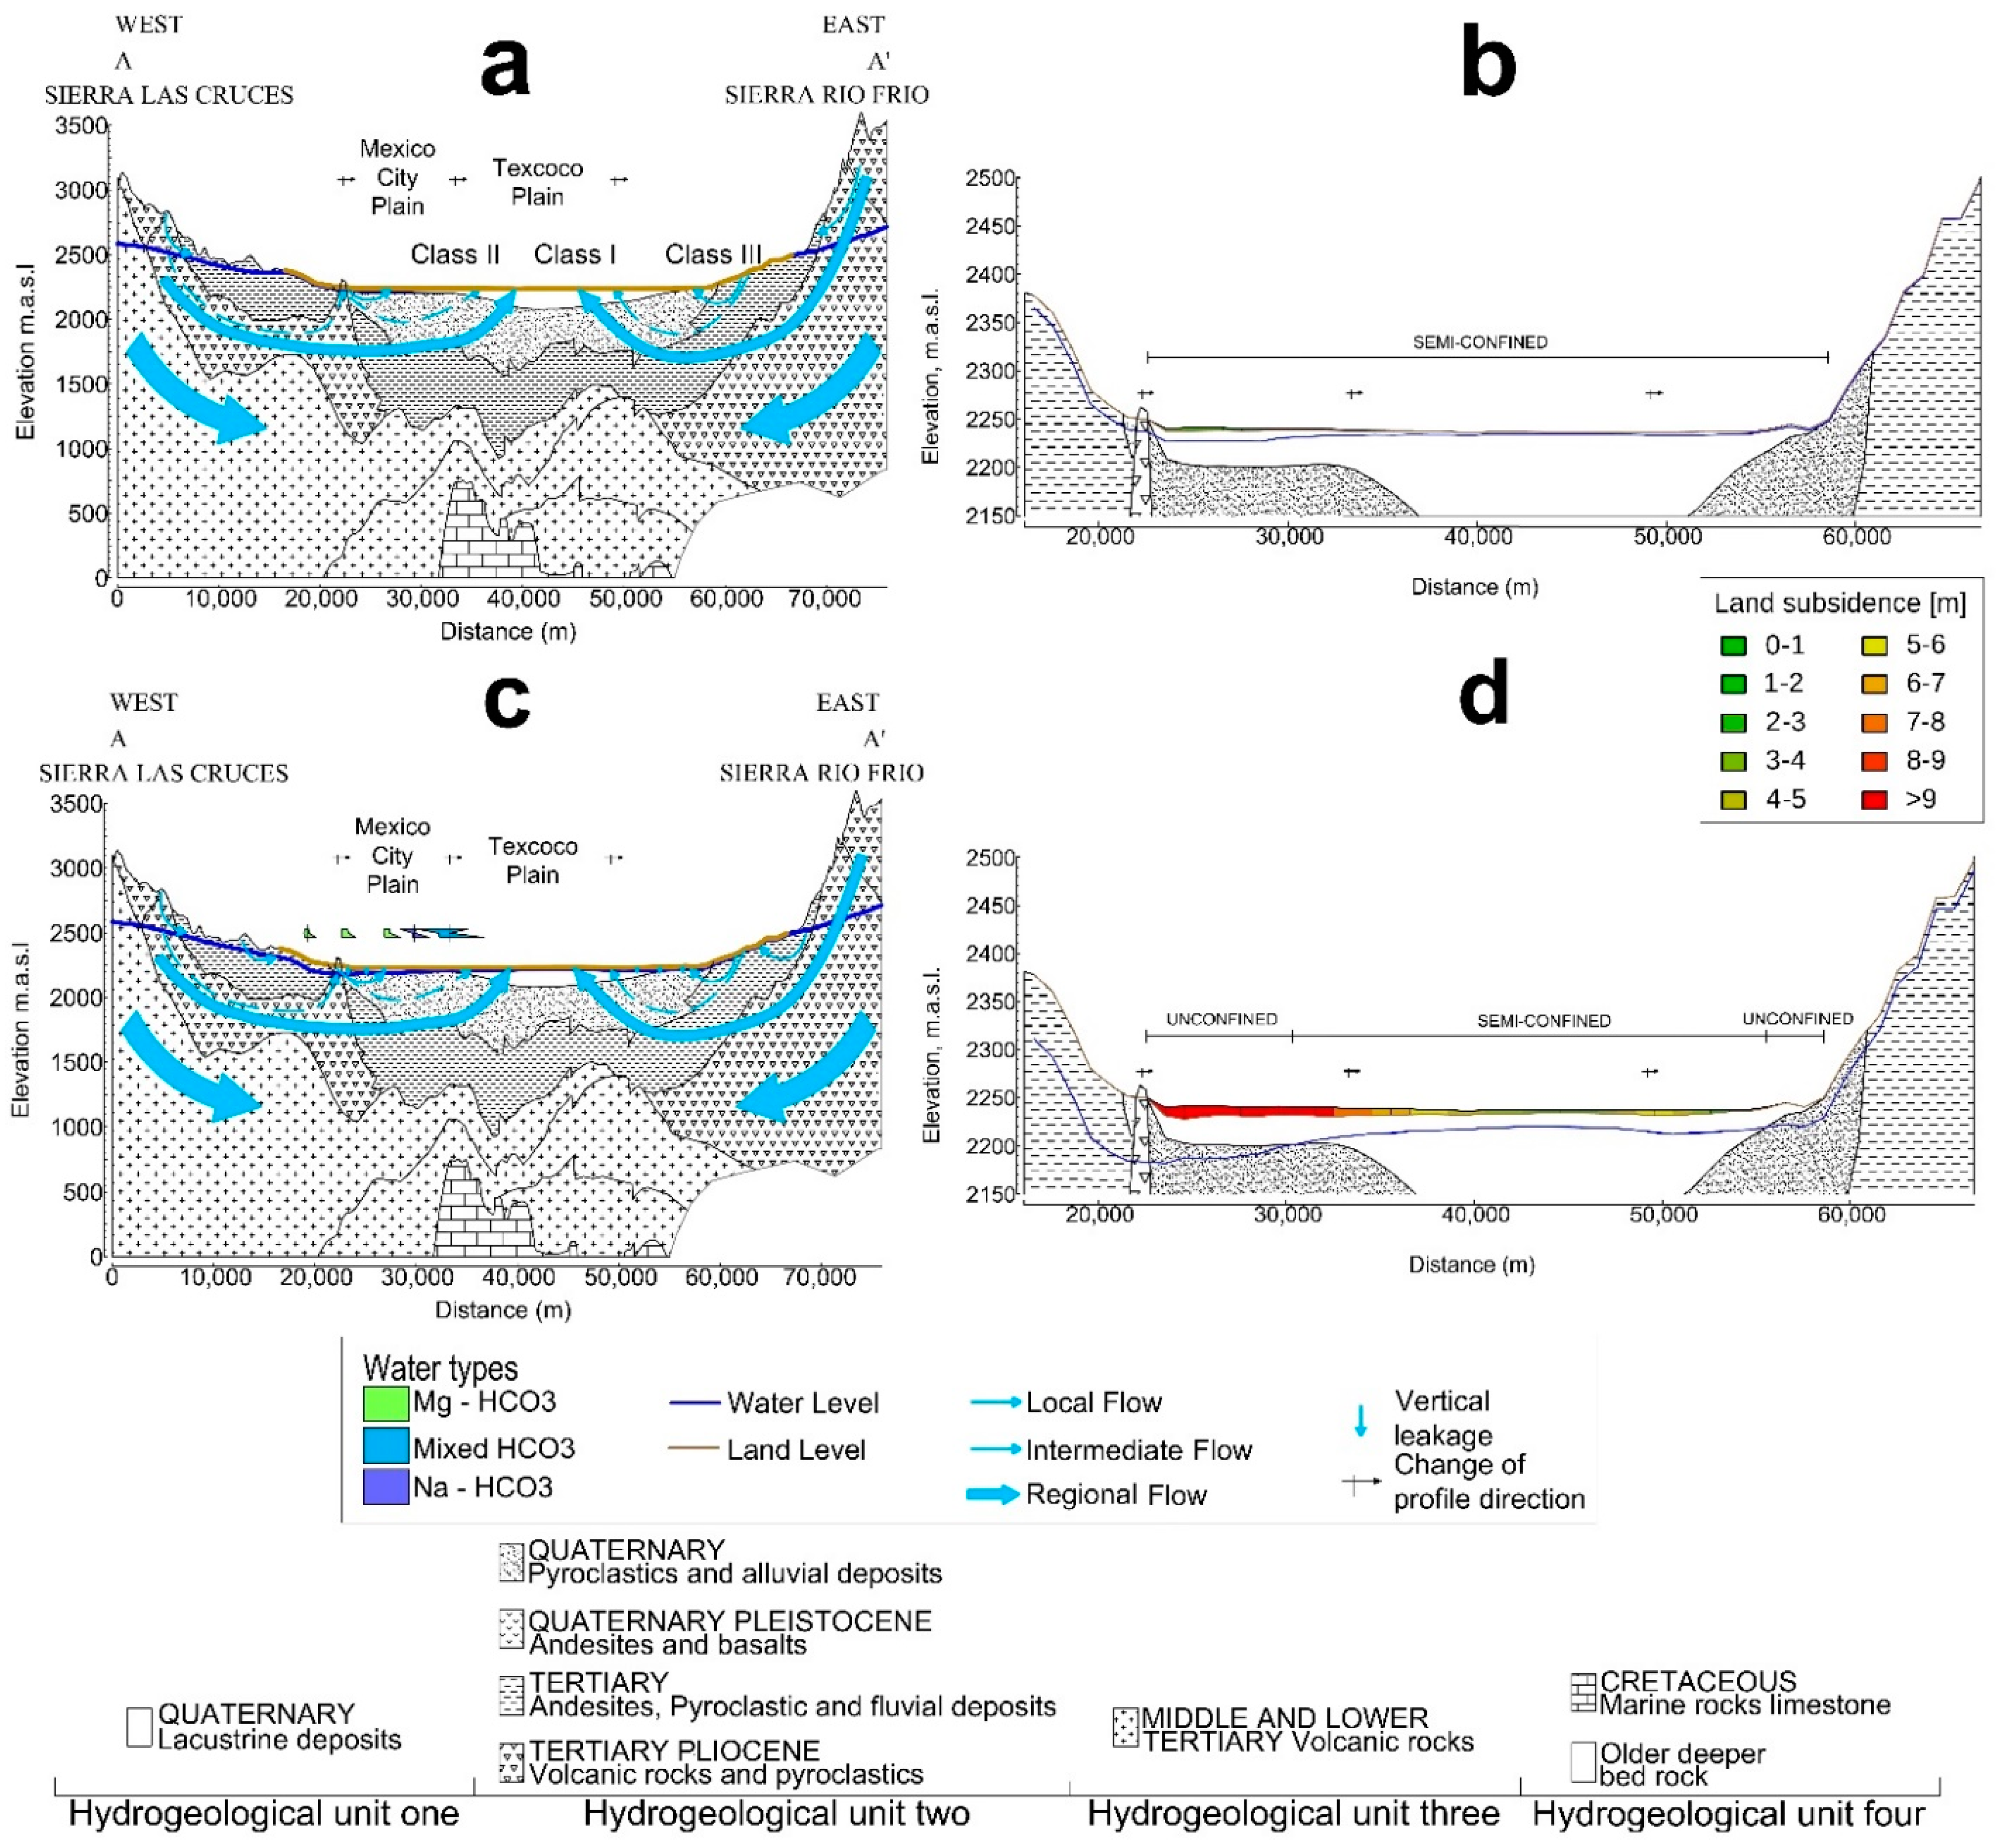
In relation to hydrogeochemical data, Molina published results from a groundwater sampling in 1954 [42]. In this report, he classified different classes of water in the Texcoco and Chalco Plains. For Texcoco, he identified the presence of three classes of water: class I, II and III [43]. This classification allows evaluating short or long residence times of water in the aquifer. We assume here that class I corresponds to the long-term residence of water in the soil [44], class II is mixed water and class III is short-term residence water, that is, recent infiltration from precipitation (Figure 9a).
3.2. Year 1990, the Metropolitan Area in a Condition of Groundwater Overexploitation
By the beginning of the 1990s, Mexico City and suburban areas had reached 15 million inhabitants and became a large metropolitan zone. Natural groundwater recharge at that time was estimated at about 35 m3/s and the urban zones expanded to the Mexico State, with an area of 622 km2 [19] (Table 2).
The total water demand in the metropolitan area was 60 m3/s, the Lerma and Cutzamala systems were already working and supplying 15 m3/s and pumping was estimated to be 43 m3/s. Groundwater discharge occurred in some springs with a flow of about 1 m3/s [45].
At this stage, the horizontal hydraulic gradients were modified by the exploitation of groundwater. Total water level depletion was on average 40 m with a rate of 1 m/year. Almost one-third part of the original confined aquifer area became unconfined and the rest semiconfined, draining an estimated flow rate of 4.7 m3/s [45,46].
Total land subsidence at the Mexico City Cathedral was 7 m [3], and land subsidence problems began appearing in other areas of the city; for example, in Chalco, Tlahuac and at the International Airport, the measured subsidence from 1986–1991 was 46 cm (Figure 9d) with an average subsidence velocity of 9.2 cm/year [16,45].
The artificial discharge of the basin was composed of the surface runoff and wastewater exports to the Tula Basin. It is estimated that outflow from the basin was about 44 m3/s [45]. In 1990, the deep drainage system, the Emission Oriente (a discharge pipe), as well as the Central Tunnel Emission, were constructed to increase and improve the operation of the drainage system to avoid floods.
For this year, a few studies on hydrogeochemical characterization were available, basically carried out in Mexico City to investigate contamination sources of the aquifer [16,23,24,34]. These studies tried to identify the dominant geochemical processes in the hydrogeological context that give rise to the chemical composition of water. Cardona and Hernández [24] suggested the mixture of waters and the ion exchange as the most relevant processes; however, the oxidation-reduction process was also mentioned in certain areas of the city (i.e., Sta. Catarina, Iztapalapa). The water types are represented in Figure 9c.
In relation to the mixing processes, these authors found the mixture of waters relevant as downward vertical flow from the aquifer and/or lateral flow from the area of Texcoco. It was also mentioned that ion exchange occurred mainly in the granular portions of the aquifer and dissolution process along the trajectories of flow, evidenced by the increase of chlorides. This process is masked by the mixture of waters induced by the increase of pumping; there are areas where the increase in salinity can be explained by a longer residence time in the aquifer and/or by flowing through a different geological environment.
3.3. Year 2019, the Metropolitan Area in a Critical Groundwater Condition
Currently, natural recharge is estimated at 23 m3/s and the extent of the urban area is 1829 km2. An estimate of the effective recharge rate was obtained by APLIS [19]; with the mean annual precipitation in the outcrop/subcrop areas at 214 m3/s, the effective recharge represents only 10% of total precipitation.
The distribution of the estimated natural recharge is shown in Table 2 for the three periods of our analysis. In addition, unintentional recharge is valuated at 9 m3/s and is associated to leakage from drainage and irrigation return flows.
By 2019, groundwater discharge by springs was only 0.7 m3/s, and artificial discharge continued with the runoff and wastewater exports of about 50 m3/s. This entire engineering infrastructure, constructed over a century, has diminished the reuse of water at the basin scale. Currently, only 10% of water is reused by a very large wastewater treatment plant, the “Atotonilco Waste Water Treatment Plant”, that improves water quality, and is sent to the Tula Basin after treatment. This WWTP has a secondary treatment and a design flow of 35 m3/s, the largest of its kind in the world.
3.3.1. Groundwater Level Conditions
Recharge and discharge areas can be inferred from the equipotential surface of the aquifer as shown in the groundwater flow directions in the Mexico Basin in Figure 10. A dataset of 184 recent water level measurements (2018) collected by the National Water Commission was used to validate the map and confirm the inferred regional groundwater flow patterns (Figure 10).
The highest piezometric heads were measured in the east and the west. These corresponded to recharge areas where the Mexico Basin Aquifer outcrops. The lowest piezometric heads were measured at the north of the basin, basically at the Cuautitlán-Pachuca Aquifer (Figure 4), with a value of 2140 m.
Total drawdown in water levels has reached an average of 71 m with a rate of 1.5 m/year, with the highest drawdown being 6 m from 2017 to 2018 in the Cuautitlán-Pachuca Aquifer. Groundwater flow also converges locally in heavily pumped areas, mostly in the allocated battery of wells, called the Immediate Action Plan System. This system was constructed in 1974 by the Comisión de Aguas del Valle de México and consists of well batteries to extract groundwater from areas surrounding the metropolis, mainly to the north and to the south.
Subsidence due to regional consolidation persists with cumulative effects causing considerable total and differential settlements through time. In 2017, the total cumulative land subsidence in some points had exceeded 14 m with respect to the original ground surface configuration [20]. Total land subsidence at the Mexico City Cathedral is now more than 10 m; at the International Airport, measurements from 1994–2017 indicated an average subsidence velocity rate of 28 cm/year [47].
3.3.2. Hydrogeochemical Conditions
Groundwater chemical analyses for the Mexico Basin Aquifer were obtained from a recent field study (2018) by the authors, carried out as part of a new hydrogeochemical project. Only water analyses with a charge balance error less than ±10% were used. This resulted in a dataset of 52 well samples, 1 spring sample, 1 deep well sample and 1 thermal spring sample. Major cations were used to determine the groundwater types. The proportions of major ions were presented on Stiff and Piper diagrams [48] and were generated using EasyquimV5 [49], with which five water types were defined; their spatial distribution and Piper diagram are presented in Figure S1 (Supplementary Materials).
Mg-HCO3 water is located on the periphery of the basin, mainly in the mountains and identified recharge areas; this water type represents 51% of the samples. The family in second in order of percentage (20%) is a mixed-bicarbonate and Na-HCO3 type located in the piedmont and alluvial areas. The rest are the mixed-Cl and Na-Cl water types and are located in the central part of the basin, in the lacustrine area and in the less transmissive parts.
Based on the general flow paths defined in Figure 10, the inferred evolution of the MBA water types is essentially from group 1 to groups 2 and 3, then to 4 and 5. The hydrogeochemistry of water in the aquifer is the result of natural flow from the recharge areas to the center of the basin, acquiring a chemical footprint that is dominated by the lithological characteristics of each formation in the Sierras and the center of the basin.
The andesites and dacites of the Sierras Pachuca, Las Cruces and Nevada locally produce water of a similar chemical composition, that is, calcium-sodium bicarbonate. These elements are derived from the dissolution of minerals from these rocks (feldspars and amphibole). The basalts and basaltic andesites of the Sierra Chichinautzin are predominantly the ions bicarbonate, calcium and magnesium [18], products of the dissolution of plagioclase and pyroxenes.
In contrast, in the center of the basin groundwater is chlorinated-sodium, which suggests significant residence time in the aquifer, effects of evaporation and high salinity relative to the convective flow in the shallow part of the aquifer.
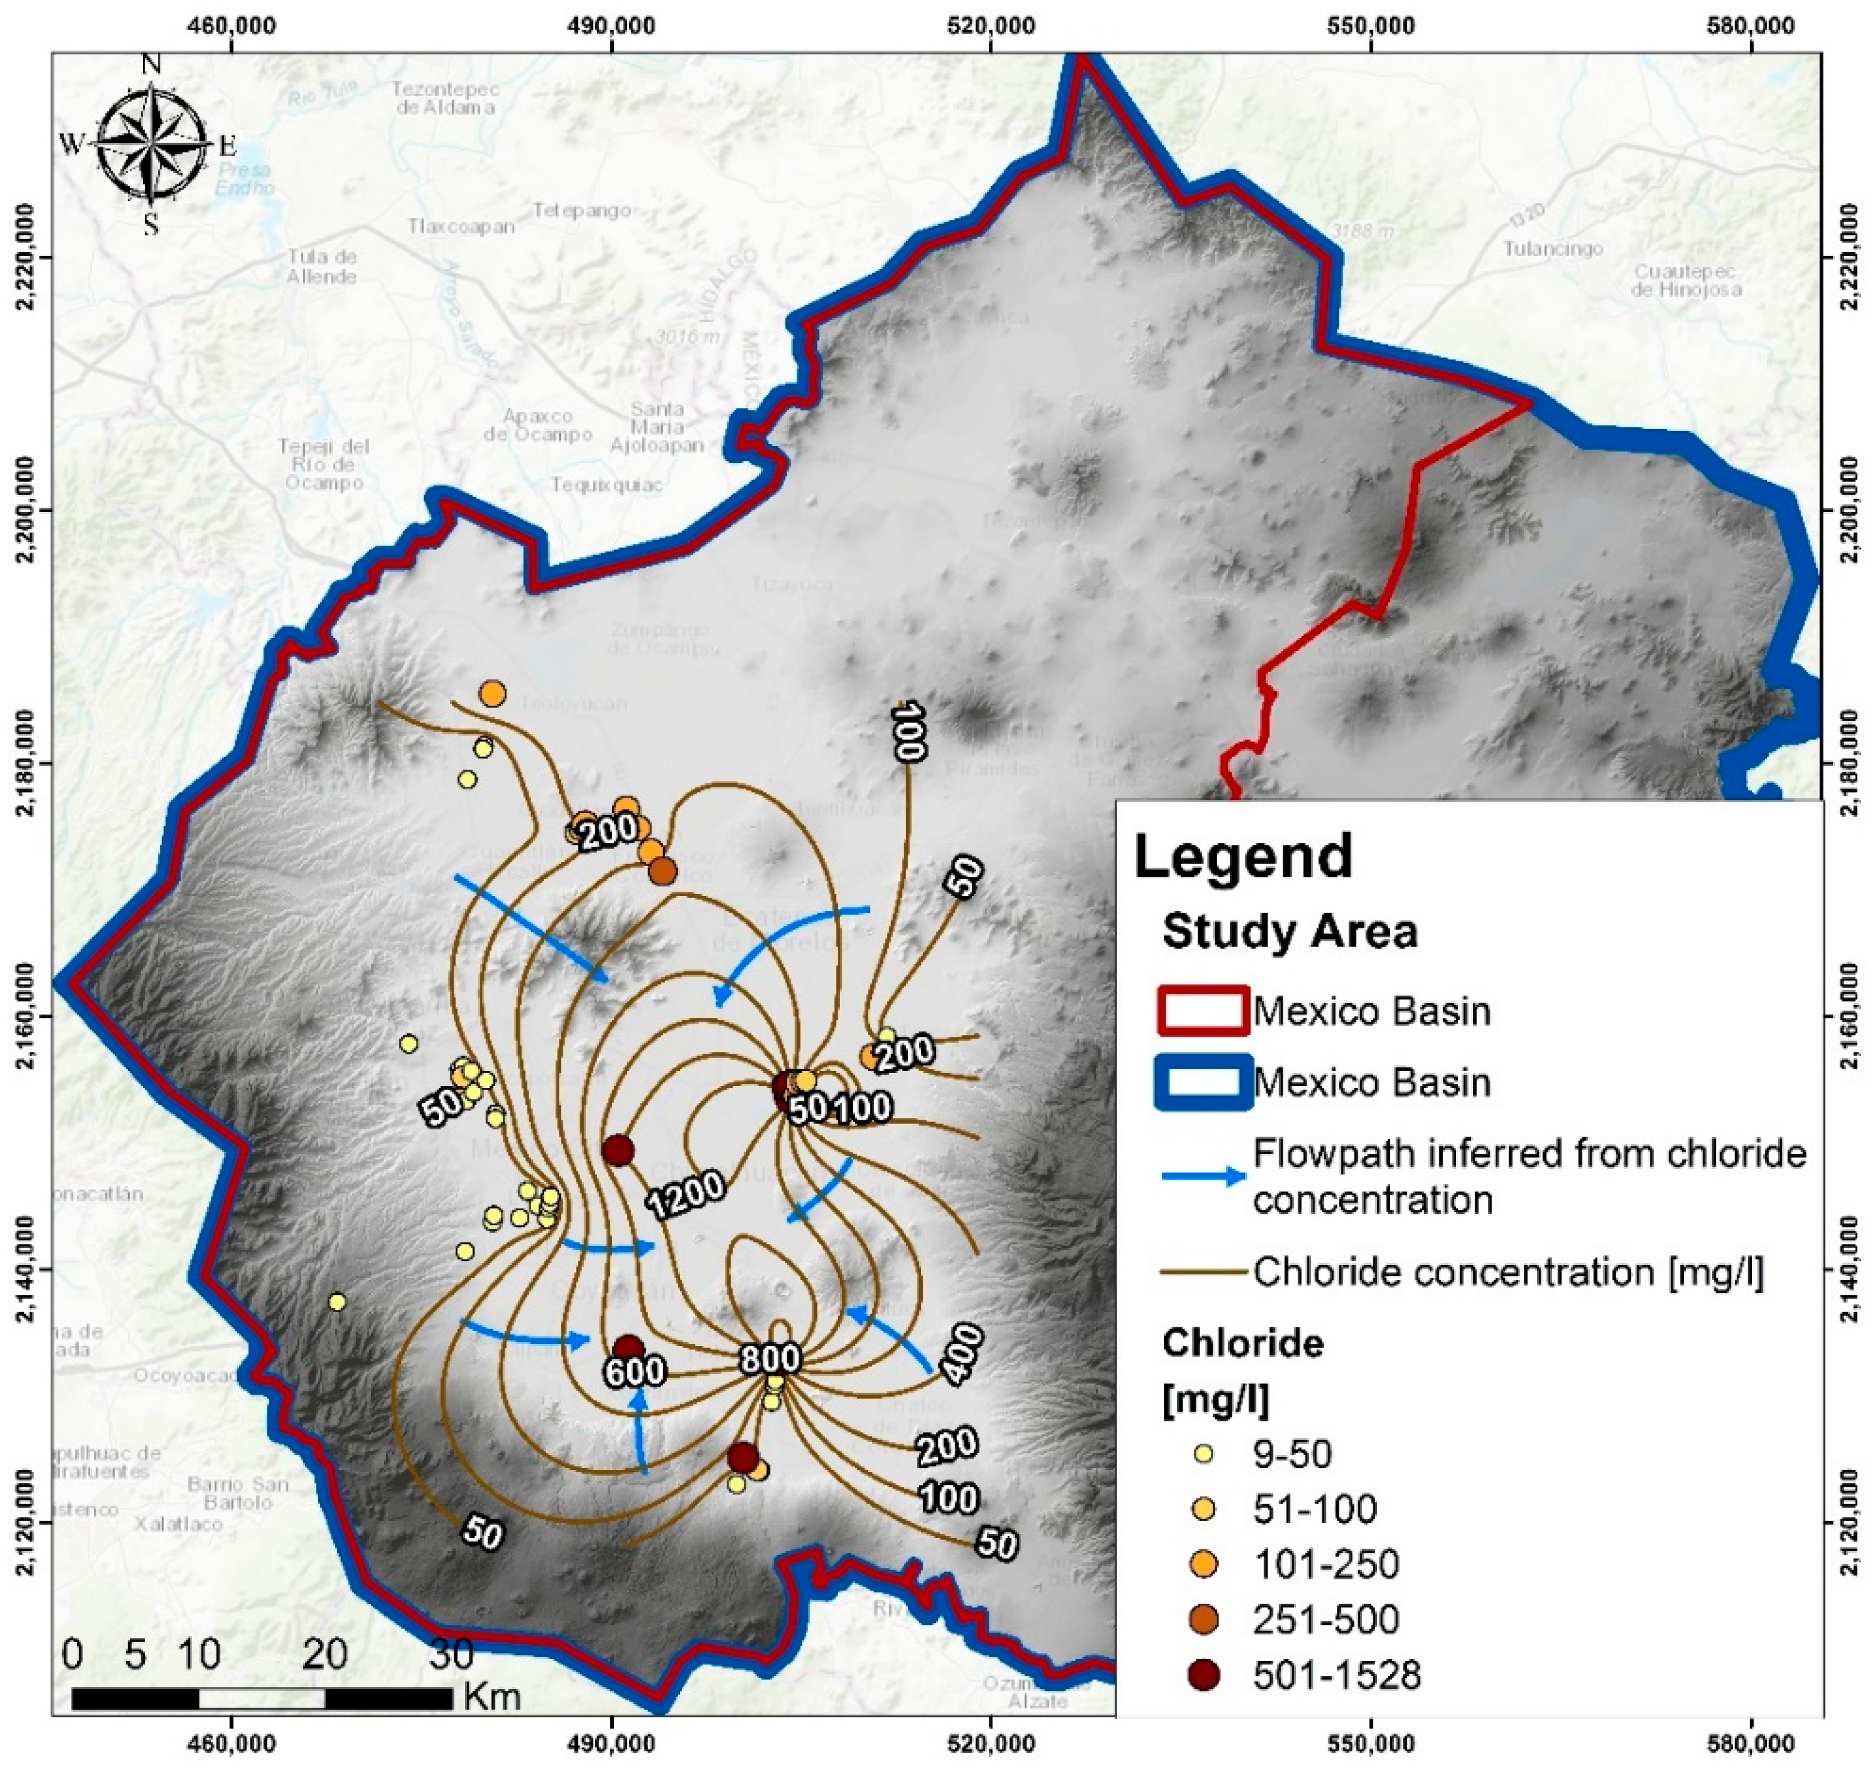
The spatial distribution of Cl− concentrations in the Mexico Basin is shown in Figure 11. Cl− concentrations increase from the recharge areas to the central area of the basin, similar to the water type groups. This increase follows the general groundwater flow paths presented in Figure 10. However, although the Cl− concentration for thermal springs and deep wells were placed on the map, they are not included in these flow paths’ inferred Cl− concentration because it is assumed that they belong to the deeper aquifer.
3.3.3. Stable and Radiogenic Isotopes
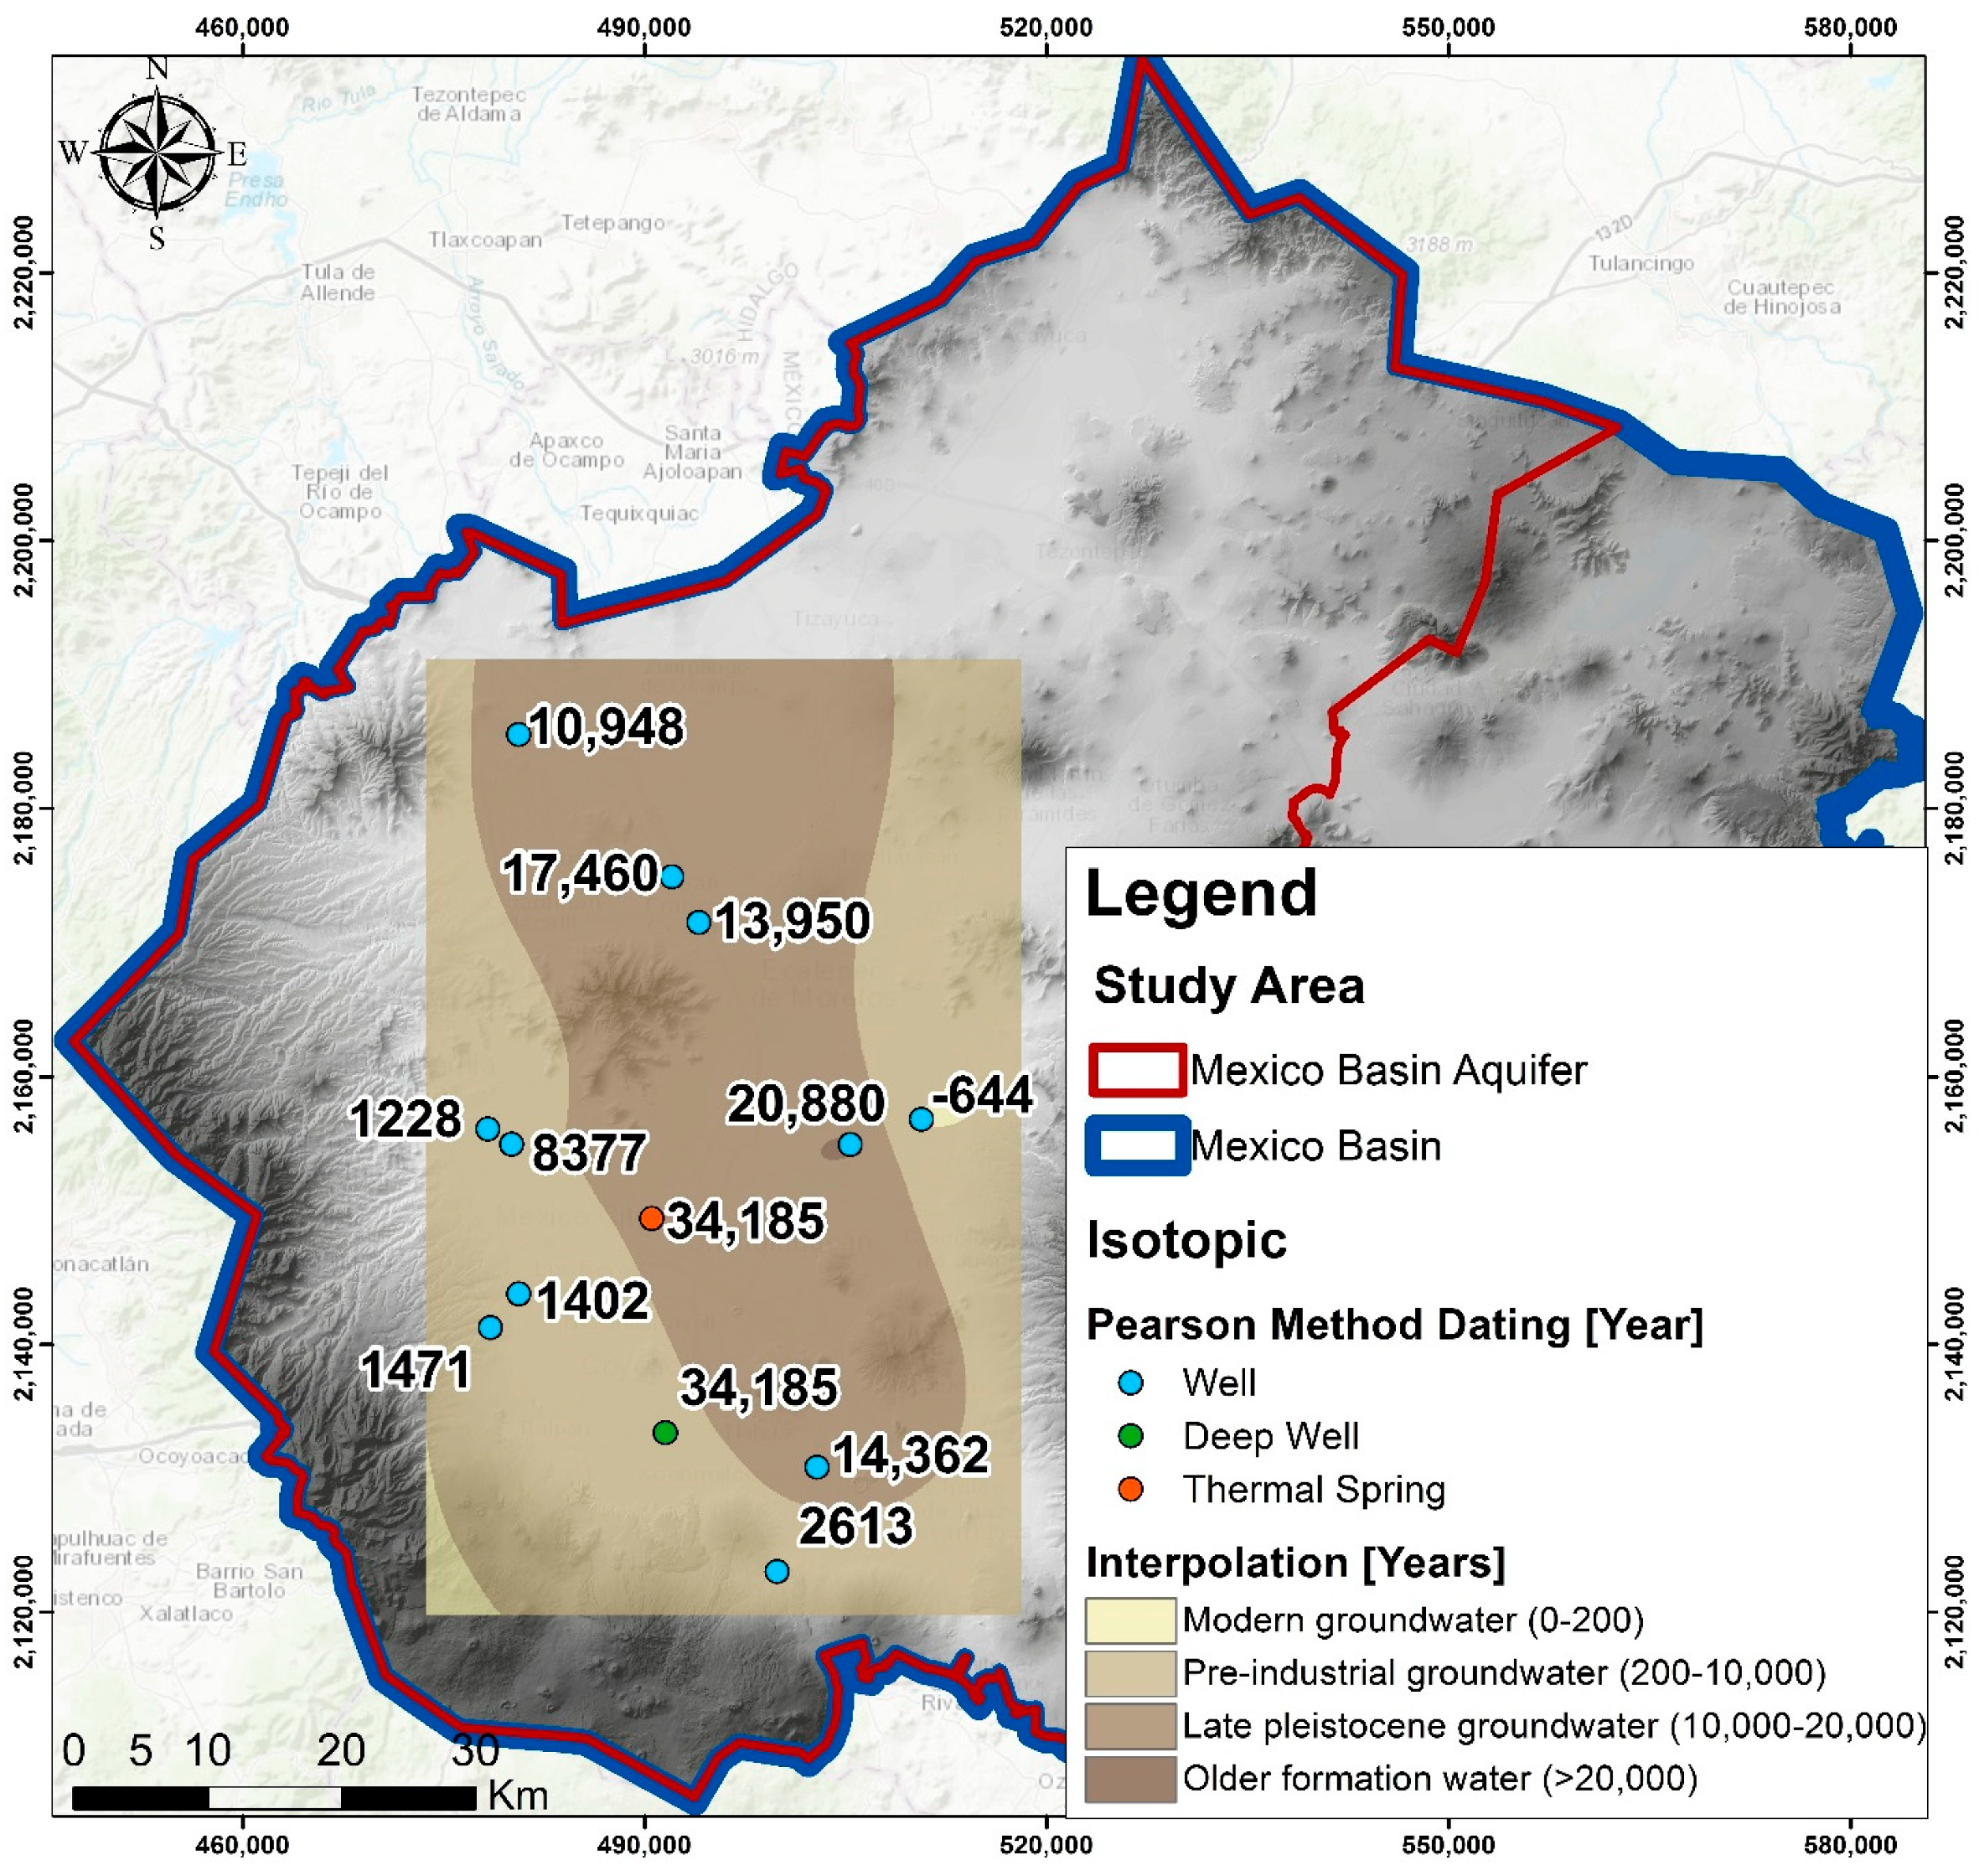
To provide a more complete hydrogeochemical framework, we collected groundwater samples to provide new isotopic analyses (14C and 13Cl) in several sites of the Mexico Basin Aquifer and added them to the historical dataset. Radioactive isotope 14C was used for groundwater dating. Tracer model ages can often help from the perspective of an effective management of groundwater resources to improve understanding of the groundwater flow aquifer systems, as old waters generally indicate that the resource may not be renewed [50].
Isotopic data for 14C (half-life of 5730 years) and 13C are shown in Figure S2 (Supplementary Materials). They are reported in dissolved inorganic carbon (DIC) as the percent modern carbon (pMC), as defined by Stuiver and Polach [51]). The 14C values range from 8–108.1 (pMC) for the wells, and 1.6 (pMC) for both the deep well and the thermal spring sampled. The distribution of the δ13C values is from −14.3 to −4.1 (‰) for the wells; additionally, the deep well is −7.4‰ and the thermal spring −2.1‰. Both radioisotopes show a clear evolution to the basin center following the groundwater flow main directions (Figure 10).
Water ages derived from isotopic data are presented in Figure 12. The estimation of this edge was analyzed by the decay formula and the Pearson method to compare results with Edmunds et al. [18]. With this study, it was found that the average water age increased 3000 years considering the pumping wells of the upper aquifers. Compared to Peñon de Los Baños (the thermal spring), there is no significant difference between the results of those authors (14C = 1.9) and our results (14C = 1.6).
3.3.4. Groundwater Budget
Given the endorheic nature of the Mexico Basin Aquifer (MBA), its original water budget was balanced in steady-state conditions since the Pleistocene, with a very simple water budget where precipitation was equal to evaporation. The endorheic drainage basin retained water and allowed no outflow to other external bodies of water; it converged instead into lakes or swamps, permanent or seasonal, which equilibrated through evaporation.
The components of the groundwater budget are shown on a typical cross section (Figure 14) representing the annual averaged water budget in the MBA for the year 2019, the last year of data available.
These components correspond to the inflows defined by the groundwater effective recharge from precipitation, leakage from the upper aquitard and return flow from irrigation. The outflows include pumping wells and springs.
These were estimated representing the annual water budget in the whole MBA with an approximate surface area of 10,000 km2. The groundwater budget components are expressed as a water thickness equivalent (mm) uniformly distributed on the total surface of the MBA (Figure 14).
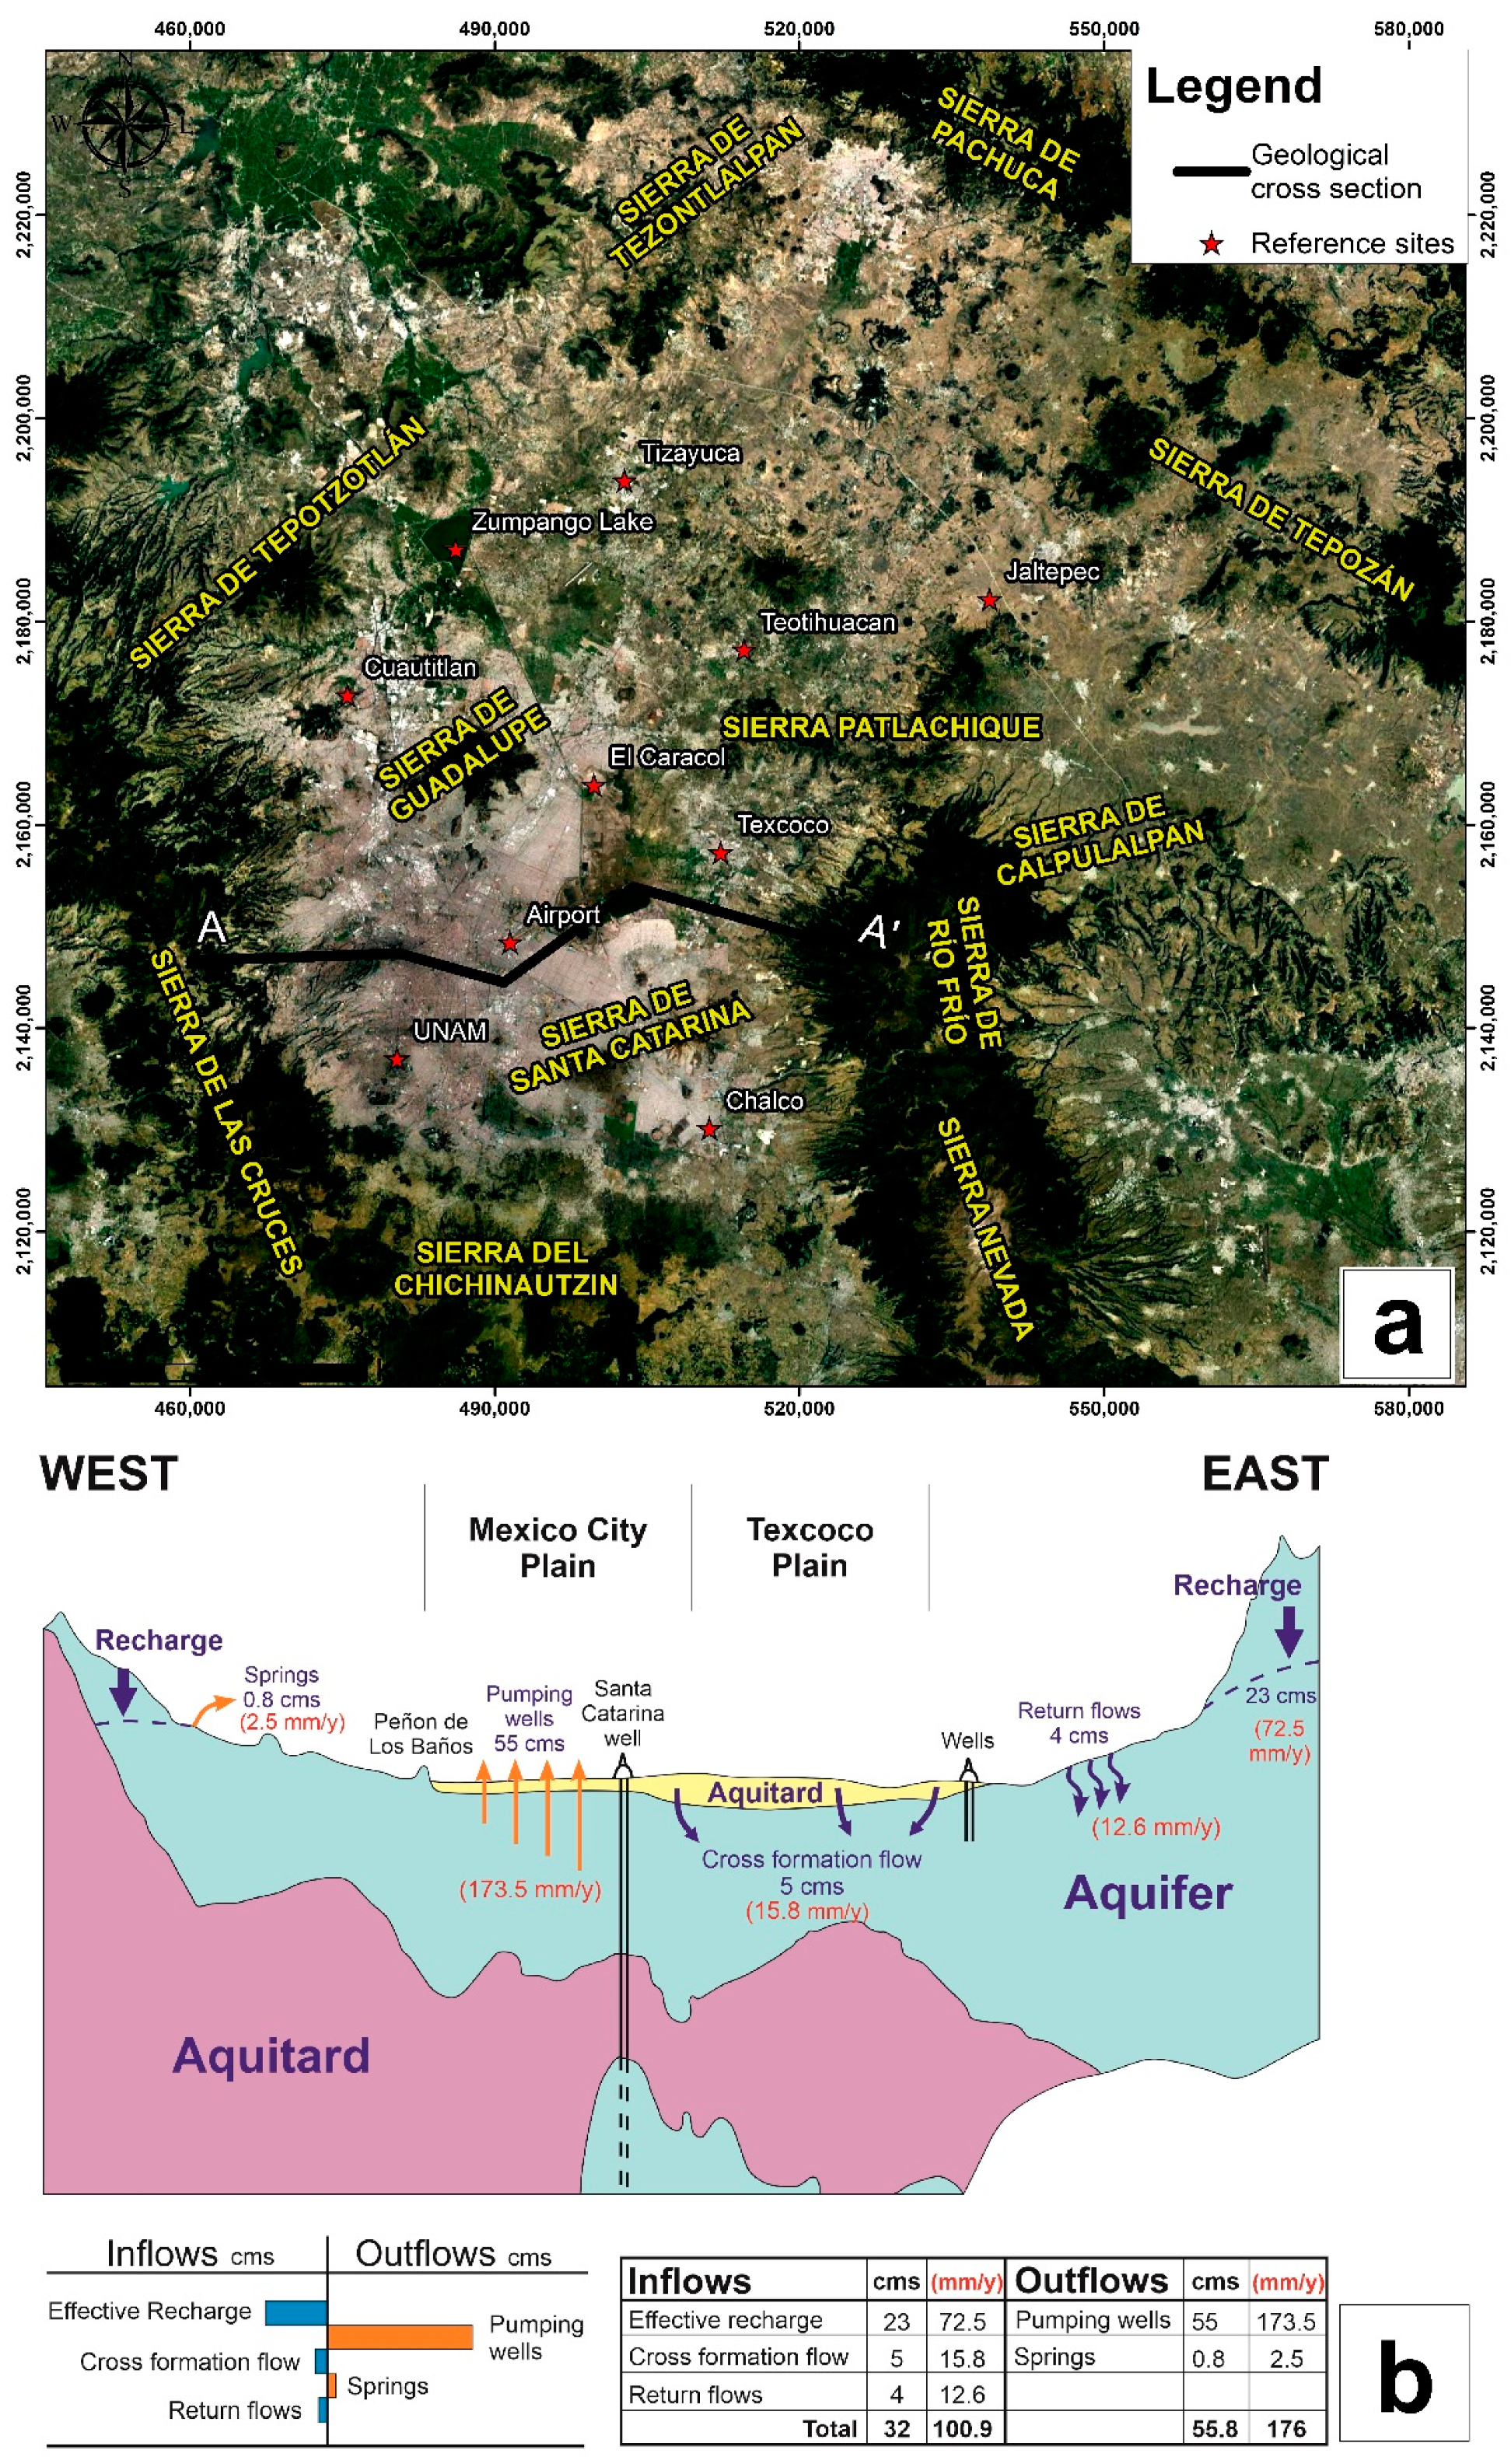
For the inflows, the natural recharge was estimated as 23 cms (72.5 mm/y); however, an additional 9 cms (28.4 mm/y) unintentionally recharges from combined return flows, including 4 cms from agriculture (12.6 mm/y) and 5 cms of vertical leakage (15.8 mm/y). The total inflow to the MBA aquifer system is 32 cms (100.9 mm/y); these estimates are the direct result of this study.
For the outflows, pumping represents the total extraction of 55 cms (173.5 mm/y) and springs 0.8 cms (2.5 mm/y). The values for the springs were obtained from periodic flow gauges. The total outflow to the MBA aquifer system is 55.8 cms (176 mm/y); these estimates are the direct result of this study. Cleary, the aquifer system is imbalanced by −23.8 cms which represents approximately the overexploitation rate.
3.4. Conceptual Model
A comprehensive conceptual model of the MBA was developed based on the hydrogeological and hydrogeochemical evidence presented in the previous sections. This conceptual model represents the state of the knowledge of the MBA updated after a century of groundwater exploitation.
Basically, this updated conceptual model provides new insight into the natural recharge and discharge conditions, groundwater flow conditions and groundwater flow systems following one hundred years of groundwater exploitation.
3.4.1. Natural Recharge and Discharge Conditions
Groundwater movement within the study area typically occurs from high-elevation mountains that limit the basin receiving recharge towards low-elevation discharge areas.
According to the hydrodynamic model, water flows from the basin edges to the lower parts of the valley, which is typical of endorheic basins: in the upper parts, the recharge generates down flow, whereas in the lower parts of the system the water rises looking for its natural outlet or by pumping. In upstream areas the hydraulic load increases with depth, which explains the sprouting artesian pressure of the first wells built in the middle of the last century, and which still occurs to a lesser extent in the area of Lake Texcoco where it has semiconfined conditions.
The contrast between the low permeability of the lacustrine deposits and the medium-to-high permeability of the underlying alluvium also influences the groundwater flow network. Water preferably circulates through the strata of greatest permeability and tends to cross where it is less permeable along the shortest track; therefore, in deeper layers under the valley, water tends to circulate through the deep alluvium until it is forced to cross the lake deposits to reach its base level of discharge, basically in the area of the Texcoco Plains (Figure 15).
The upper aquitard, composed of very porous low-permeable lacustrine deposits, contains large amounts of groundwater in storage [34,52,53]. At the regional level, it provides very important volumes of water to adjacent aquifers, naturally or under the effects of pumping, which is considered an indirect recharge to the aquifer [54].
The natural discharge of the aquifer, which was mostly caused by evapotranspiration in the lakes area, gradually declined as the exploitation caused groundwater levels to fall most everywhere in the aquifer. The only region where these conditions still prevail is in the Lake Texcoco area.
For the last several decades, the main discharge of the aquifer has been through wells, although evapotranspiration still persists in areas where the groundwater levels are shallow.
At least two discharge mechanisms have been identified in the central portion of the basin. One consisting of the topmost recent deposits (first tens of meters), which are recharged by leaks in hydraulic networks and local runoff infiltration, contributions that keep the groundwater surface very shallow despite over-exploitation and are discharged by evapotranspiration and pumping of shallow wells. The second discharge mechanism, mainly composed of the alluvium deposits underlying the lacustrine deposits, it is the main groundwater source captured by most of the wells that supply the city and receives the recharge originated in the upper parts of the basin. The piezometric levels in the alluvium have remarkably declined by over-exploitation. Between the two subsystems is the lacustrine clay layer, an aquitard with great thickness and low permeability, which yields huge amounts of water to the underlying aquifer, and whose consolidation has resulted in land subsidence.
Thus, in general, the Mexico Basin Aquifer is under unconfined or semiconfined conditions with only a 236 km2 area in semiconfined conditions, representing 18% of the original lacustrine area.
3.4.2. Groundwater Flow Systems
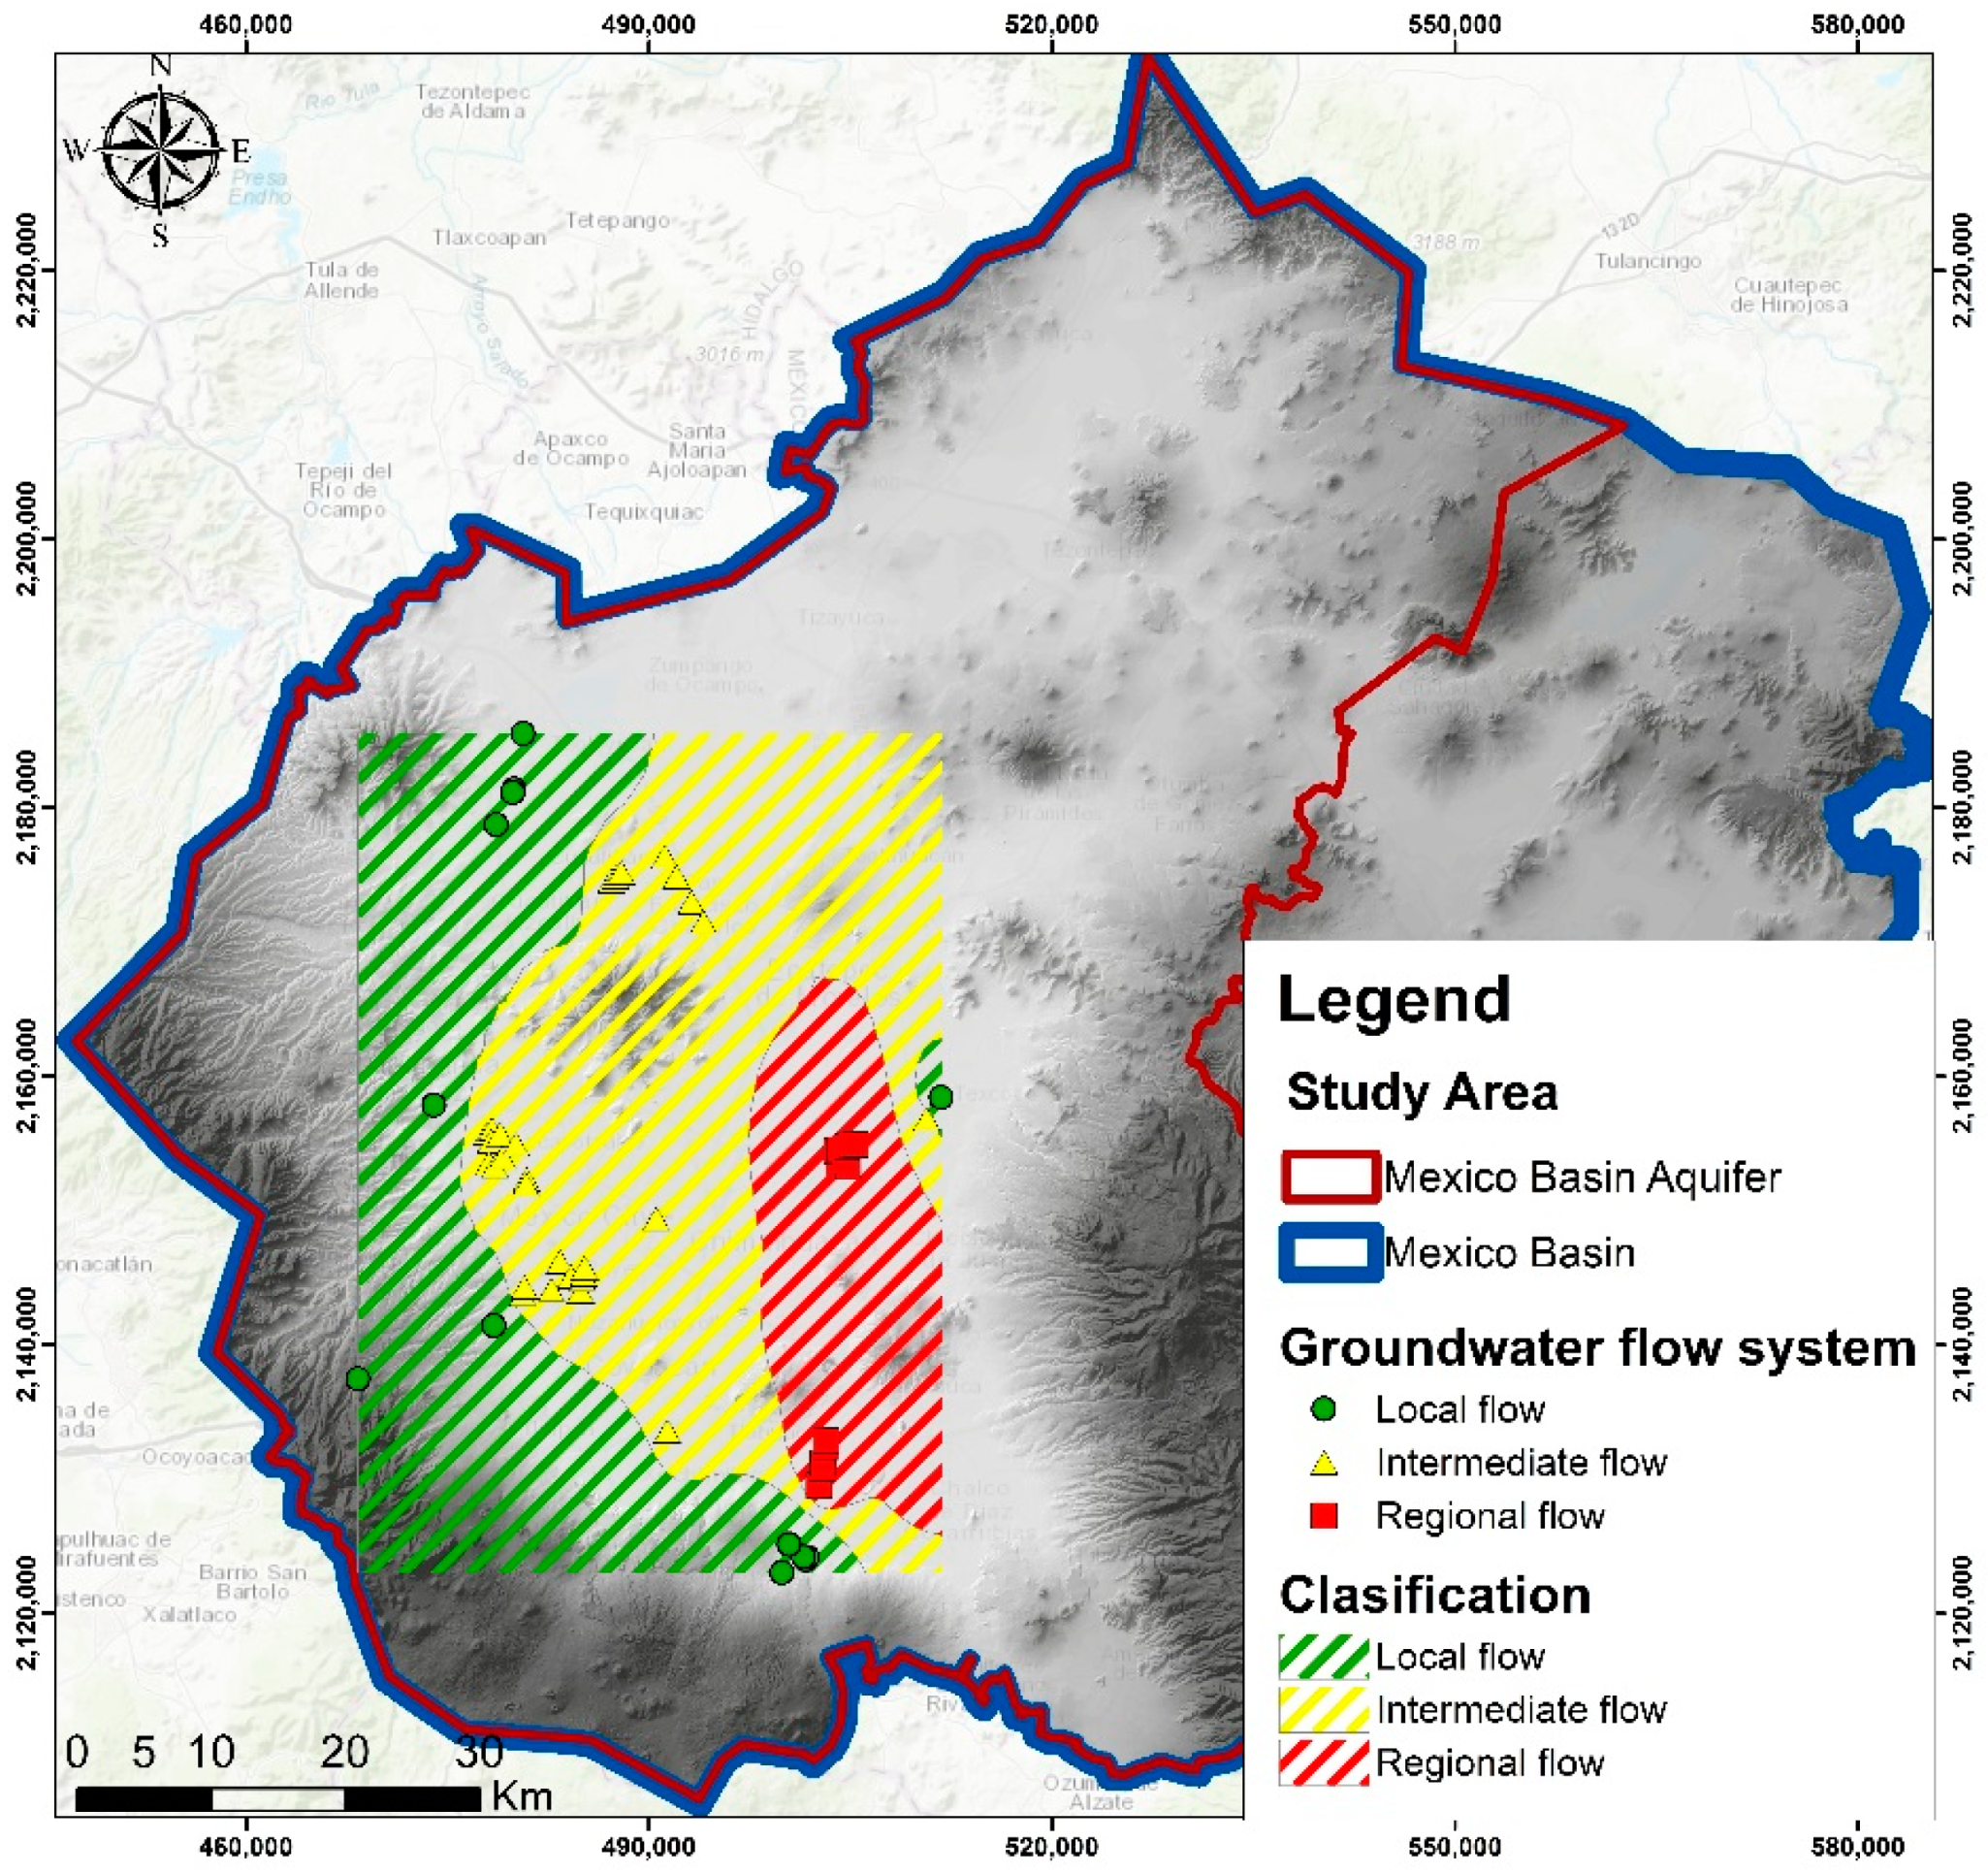
On the basis of groundwater divides inferred from the potentiometric map, groundwater ages and the conceptual model (Figure 10, Figure 12 and Figure 16), the Mexico Basin Aquifer (MBA) can be divided into three natural subsystems (local, intermediate and regional flow), in which groundwater flows in different directions and to different discharge zones.
At the local scale, groundwater moves along shallow and short flow paths; these flow paths are topographically located in higher-elevation zones or in transition zones, sometimes manifesting as springs.
For the most part, wells at this scale are drilled to an average depth of 200 m; the flow is relatively shallow with temperatures ranging from 17 to 21 °C, approximately, and sodium and chloride concentrations range between 28–77 mg/L and 10–29 mg/L, respectively.
The intermediate flow is presented in the middle- to lower-parts of the basin, representing the intermediate and local discharge, or else is captured through wells. In this group, the water has a temperature of 22–28 °C, has low concentrations of Cl (9–35 mg/L), Na (24–54 mg/L) and SO4 (30–67 mg/L) and has regular salinity concentrations (200–600 mg/L TDS). The average depth of the wells is 250 m.
Groundwater from the regional-scale flow is extracted by deep wells with, sometimes, a mixture of water families. The depths of those wells are, on average, 300 m and in some cases, reaching down to 400 m. The water extracted in these areas was recharged more than 9000 years ago.
A particularly deep well belonging to this group is the Santa Catarina well, which has different conditions compared to the rest of the group, as it extracts water from the strata to depths of 2500 m below ground. At those depths, there is a much deeper limestone aquifer in limestone from the Cretaceous, although its groundwater age has not been determined.
Likewise, the thermal spring Peñón de los Baños intercepts the discharge of the regional flow system, also reported by [22]; these authors further reported that the high temperature measured in that spring may be affected by the thermal flow of a deep heat source. They also hinted at the possibility that parts of these waters may come from the deep Cretaceous limestone rocks. Vázquez and Jaimes [10] proposed that this is the same formation from which water is extracted from the deep Santa Catarina well.
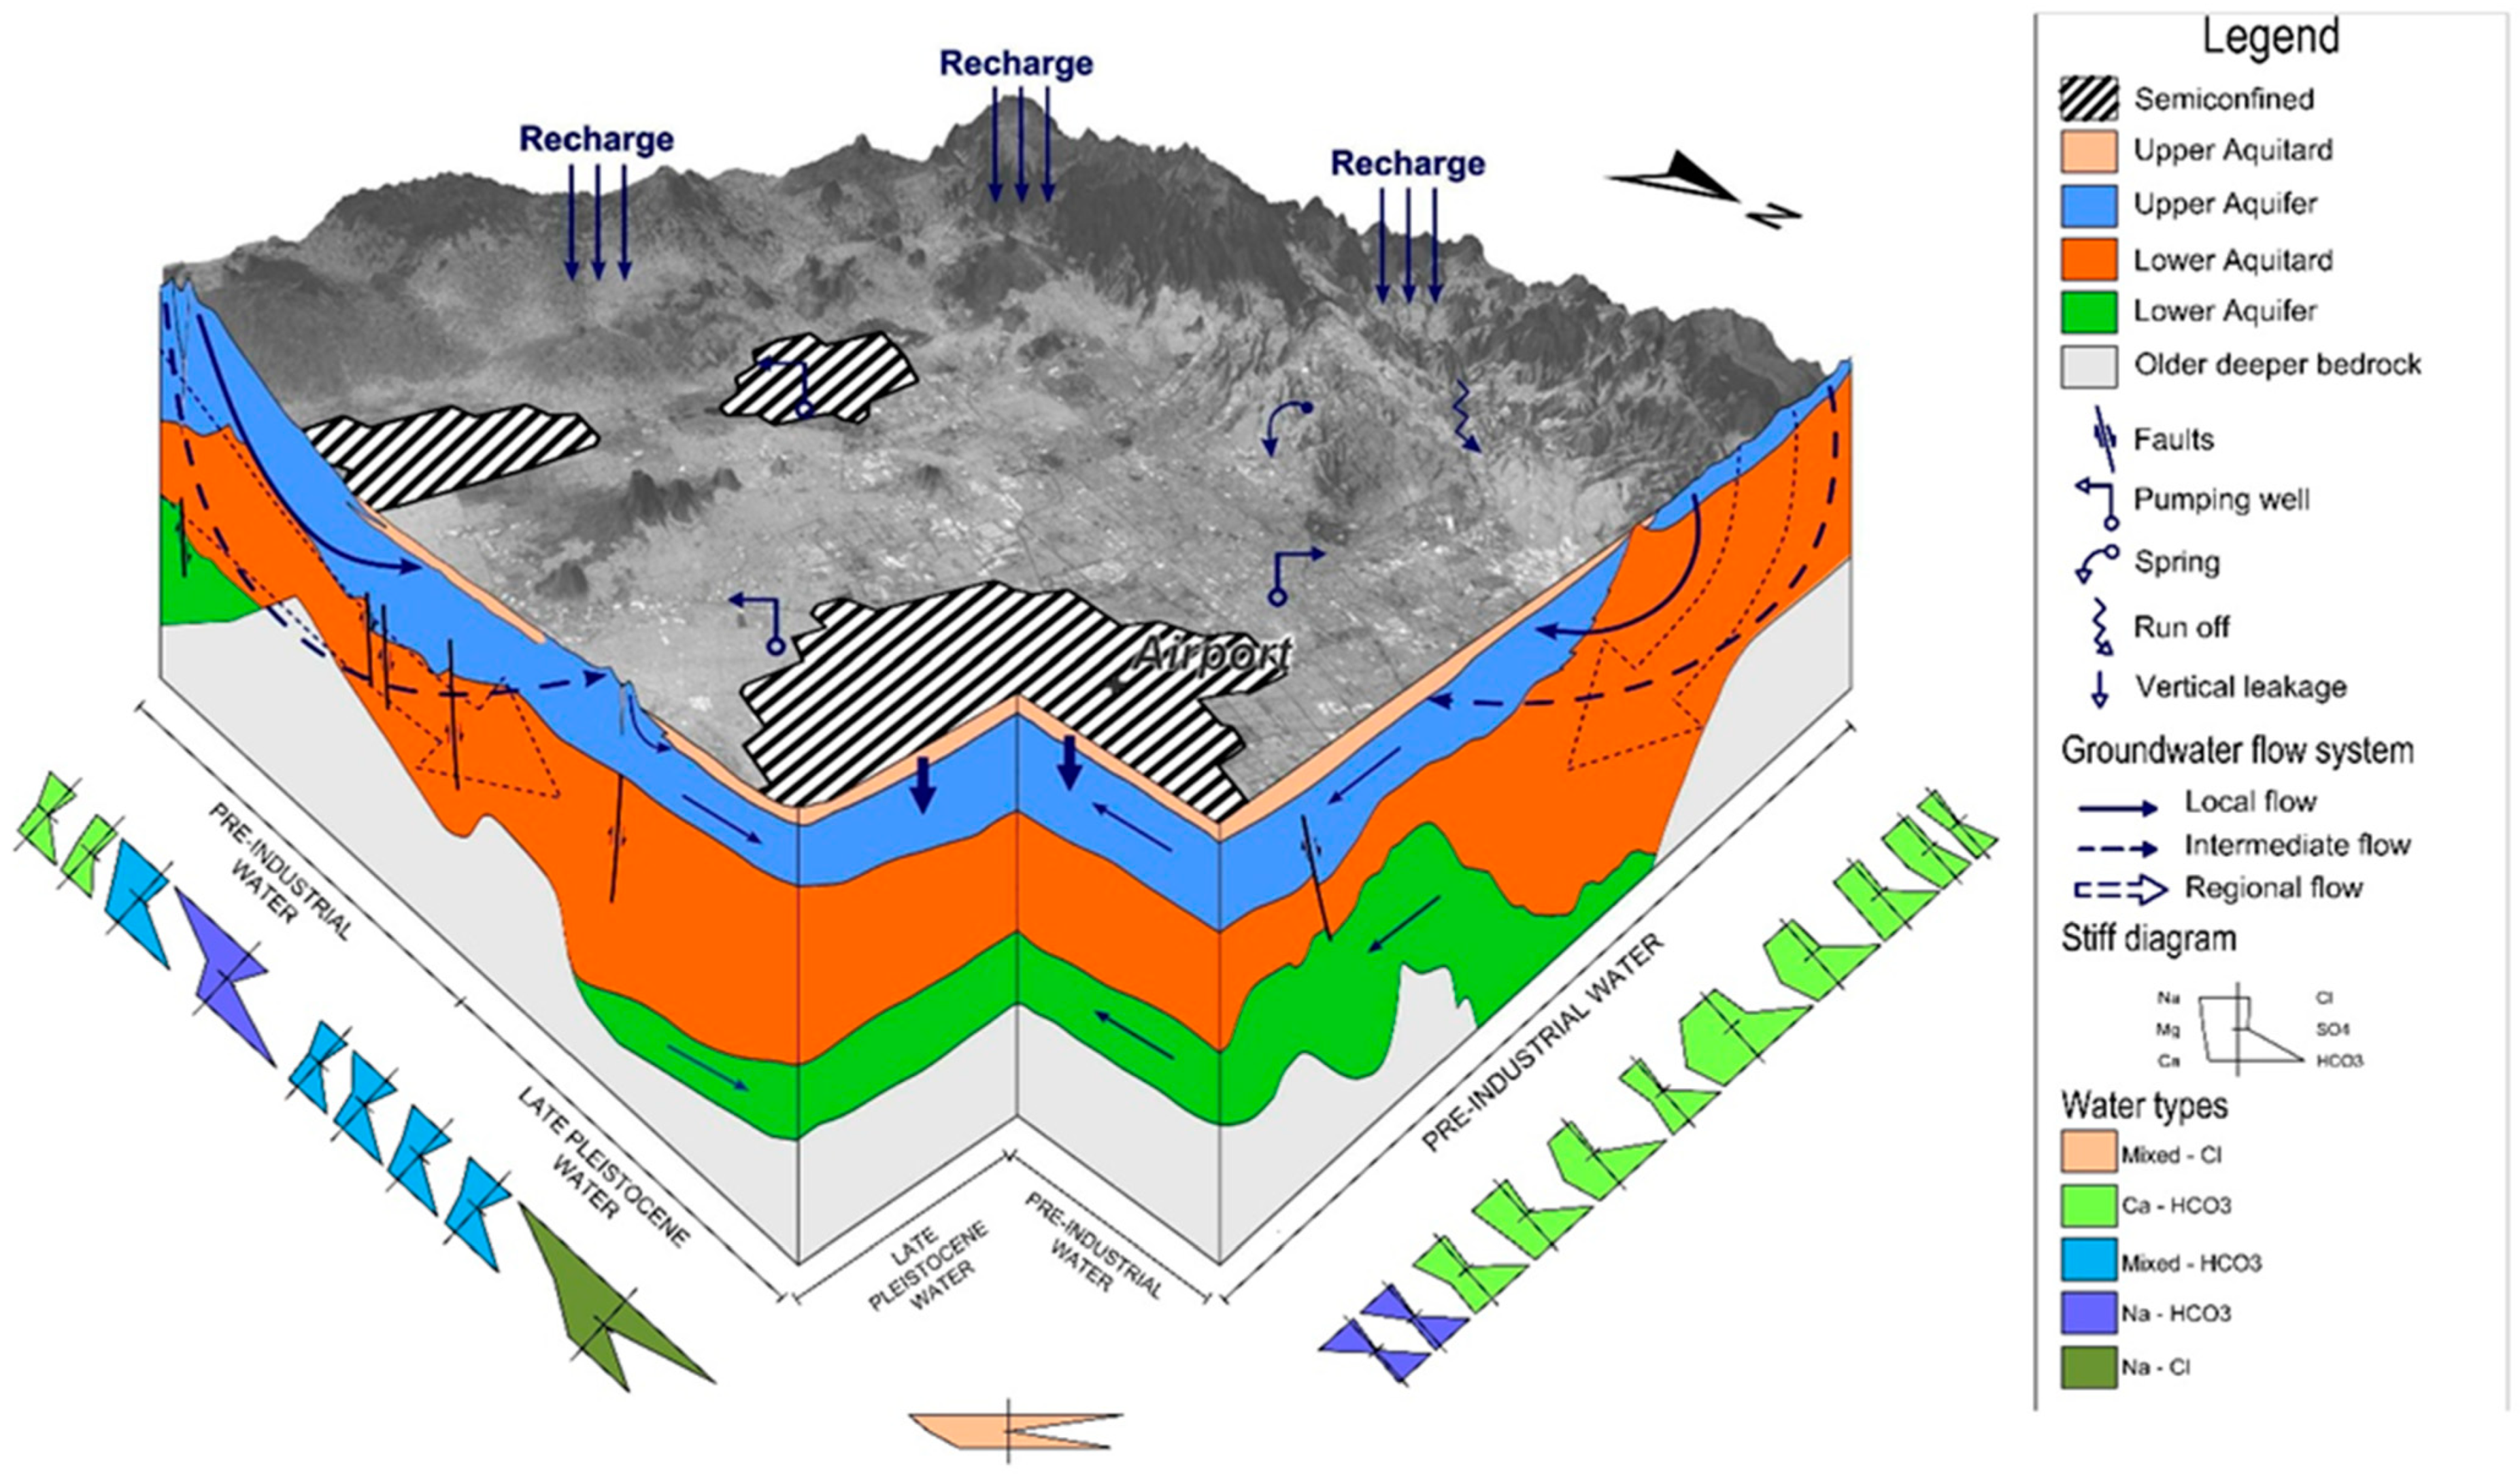
Figure 15 presents a plan view of the adopted conceptual model of the MBA in our study, in which flow systems are delineated within the natural extent of the MBA. The area of active recharge corresponds to the presence of waters enriched with 18O and 2H and is limited to the outcrop areas of the MBA. The area of regional flow corresponds to the presence of 14C located in the Texcoco Plain area. The area of intermediate flow is present in the major part of the study area and is defined by the absence of 14C. The vertical leakage is enhanced most everywhere in the lacustrine area. Figure 16 presents a three-dimensional view and schematic diagram showing conceptualized groundwater flows in the MBA.
3.4.3. Hydrogeological Constrains
The integration of existing data and data collected in this study, combined with detailed analysis of previous knowledge on the multi-aquifer system and groundwater flow conditions in the Mexico Basin Aquifer, has allowed a new assessment of the current, very substantial hydrogeological conditions and quantitative conceptual understanding of the groundwater conditions in the basin. After a century of groundwater exploitation, the unified hydrogeological conceptual model allows the portioning of systems and constrains within the Mexico Basin Aquifer in the form of limiting boundaries and groundwater flow systems, which could be extremely useful in building a tool for groundwater management with a numerical model.
The most important outcomes of this study are that changes in the hydrogeological conditions are mainly due to anthropogenic effects, to very few changes in climate over 100 years and to the local-scale geomorphological changes that affect the flow of groundwater.
The main observations are:
- There were effects of anthropogenic groundwater extraction and urbanization.
- Water balances have changed.
- Infiltration has been dramatically reduced, or completely disappeared in some places, changing the yearly recharge rate to aquifers.
- Groundwater discharge has changed substantially as springs and lakes slowly disappeared.
- Steady-state conditions no longer exist and a transient effect has been created, which might take very long (hundreds of years) to re-equilibrate to a new steady-state condition.
- Soft layers located in the uppermost 150 m have been compacting for more than 75 years, generating a regional-scale subsidence of the land.
- There were changes from confined to semiconfined conditions (see Figure 16).
Based on these observations, the most important constraints that should be imposed in any new numerical model simulation are:
- Groundwater movement from high-elevation mountains towards low-elevation discharge areas remain the main mechanism for the recharge in the basin, but with a diminished capacity for infiltration recharge. This effect should be included with a reduced recharge boundary condition in any numerical simulation.
- Transient effects on the lower parts of the basin, where most of the land subsidence takes place, should be included as a time-dependent boundary condition in any numerical simulation to account for vertical flow and inter-aquifer flow exchanges.
- The changes from the original (100 years ago) confined aquifer conditions to semiconfined or even phreatic conditions need to be included as full three-dimensional transient boundary conditions in any new numerical simulation.
Finally, a numerical model built based on this integrated hydrogeological conceptual model should be built in a transient state with a full three-dimensional discretization to coupled hydro-mechanical processes (compaction); it should start with the steady-state condition from the beginning of the 20th century and include the shifting of the transient effects. Such a model should be calibrated to match constraints as described with this conceptual model. In particular, a well-calibrated numerical model should be able to reproduce the scales of the groundwater flow systems as shown in Figure 15, and approximately reproduce the groundwater budget depicted in Figure 14.
4. Discussion
Compilation of historical studies and new field data (Figure 1) were gathered and integrated in this study; these expand and update the knowledge of the aquifer and groundwater conditions and produce the first integrated conceptual model of the Mexico Basin Aquifer, as per 2019. Two important steps were carried out in this study: a substantial update of the geological model, as shown schematically in Figure 6, and a revamped three-dimensional hydrogeological conceptual model as shown in Figure 8. Both updates include recent information and detailed analysis of compiled information over time. Hydrogeological systems were classified into four units (Figure 7) by grouping diverse formations with similar properties and hydraulic behavior (Table 1).
The hydrogeological conceptual model reflects spatial heterogeneity of hydraulic properties, leakage of the aquitard and aquifer groundwater flows. As proposed in this study of successive stages (Figure 1), those parameters will be further used in a numerical model, which will be tested and eventually adjusted to calibrate the numerical model.
After a century of groundwater exploitation, the unified hydrogeological conceptual model allows the portioning of systems and constraints within the Mexico Basin Aquifer (MBA) in the form of limiting boundaries and groundwater flow systems, which could be extremely useful in building a tool for groundwater management with a numerical model. The most important outcomes of this study are that changes in the hydrogeological conditions are mainly due to anthropogenic effects, to very few changes in climate over 100 years and to the local-scale geomorphological changes that affect the flow of groundwater.
There is a clear delineation of the hydrogeological extent of the Mexico Basin Aquifer and its three-constituting subsystems (local, intermediate and regional), following the natural boundaries and the groundwater flow system concept as defined by Tóth [55], which is typical for sedimentary basins such as the Mexico Basin Aquifer. The isotopic data (18O, 2H and 14C) showed that the mountains surrounding the basin correspond to areas of recharge in the Mexico Basin Aquifer. This analysis defined areas and groundwater-age types of pre-industrial, late Pleistocene and older formations. Despite similar patterns of the three flow systems, there are substantial differences between their hydraulic heads. Such differences represent driving forces of vertical leakage from the upper aquitard to the upper aquifer.
The discharge mechanism of the aquifer through central basin zones was highlighted. The study also assessed historic and current groundwater uses in the Mexico Basin Aquifer and proposed an aquifer-scale water budget. Natural recharge has decreased significantly due to urbanization and increased the impervious landscape on the land surface in the MBA; for example, in 1990, the total natural recharge was estimated at 35 cms; by 2019, the total natural recharge had decreased by 34% to 23 cms.
Land subsidence related to groundwater extraction ranges from 10 to 35 cm per year [56]. In turn, this is affecting the main water distribution and drainage systems and the metropolitan transportation system, due to differential subsidence. There is also significant damage occurring to roads, buildings and other public services due to differential land subsidence.
5. Conclusions
The effects of groundwater overexploitation in the Mexico Basin are and will continue being the main drivers for refining and developing new policies, with informed-based management decisions to make groundwater resources more sustainable. Clearly, the growth of this megalopolis over the last 100 years has been possible due to the presence of large quantities of good-quality groundwater located in the city’s aquifer. However, changes in groundwater storage and quality over the last few decades suggest that the current groundwater exploitation is unsustainable.
The unified conceptual model developed in this study provides an unprecedented insight into groundwater conditions in the Mexico Basin Aquifer, which if used with ad-hoc numerical models would form a comprehensive framework for forecasting long-term groundwater sustainability.
The new data and detailed analyses in this study, integrated with existing quantitative information, allowed the development of a unique conceptual model of the complete Mexico Basin. New input on its geology and hydrostratigraphy, as well as analyses of the changes over time of the most important properties of the aquifer and its hydrogeochemical conditions, allowed a clear visualization of the current groundwater and aquifer conditions as an ensemble.
It is expected that the core of this integrated conceptual model forms the basis for future development and calibration of a numerical 3D groundwater flow model of the multi-aquifer system. The conceptual model could be used to test the numerical model and, once calibrated by matching the constraints in the conceptual model, it could simulate the best possible management scenarios of the groundwater resource in the greater Mexico City area. Together with the numerical model, we could anticipate that the integrated conceptual model will provide the knowledge and the tools for a better understanding of the groundwater resources in the whole Mexico Basin Aquifer as a function of space and time and as resource-management tools.
Supplementary Materials
The following supporting information can be downloaded at: https://0-www-mdpi-com.brum.beds.ac.uk/article/10.3390/w14101584/s1, Table S1: Summary of hydrogeologic parameters for hydrogeological units 1 and 2 described in Table 1, Figure S1: (a) Piper diagram showing the five water types identified in the MBA (after Piper, 1944, EasyQuimV5, 2012); (b) Spatial distribution of groundwater types, Figure S2: Concentrations of 13C and 14C in the MB.
Author Contributions
Conceptualization, A.P. and A.R.; methodology, A.P.; formal analysis, A.P., A.R. and R.C.; investigation, A.P.; writing—original draft preparation, A.P. and A.R.; writing—review and editing, A.P., A.R. and R.C. All authors have read and agreed to the published version of the manuscript.
Funding
This work was supported by Universidad Autónoma de México.
Data Availability Statement
The data produced by this study are available upon request to the authors.
Conflicts of Interest
The authors declare no conflict of interest.
References
- Jakeman, A.J.; Barreteau, O.; Hunt, R.J.; Rinaudo, J.D.; Ross, A.; Arshad, M.; Hamilton, S. Integrated Groundwater Management: An Overview of Concepts and Challenges. In Integrated Groundwater Management, 1st ed.; Jakeman, A.J., Barreteau, O., Hunt, R.J., Rinaudo, J.D., Ross, A., Eds.; Springer: Cham, Switzerland, 2016. [Google Scholar] [CrossRef] [Green Version]
- Hiscock, K.M.; Rivett, M.O.; Davison, R.M. Sustainable Groundwater Development. Geol. Soc. Spec. Publ. 2002, 193, 1–14. [Google Scholar] [CrossRef]
- Santoyo, E.; Ovando, E.; Mooser, F.; León, E. Síntesis Geotécnica de la Cuenca del Valle de México: México, D.F. TGC Geotecnia S.A. de C.V. 171. SDG6, 2016. Clean Water and Sanitation. 2005. Available online: https://www.un.org/sustainabledevelopment/water-and-sanitation/ (accessed on 1 September 2021).
- Comisión Nacional del Agua (CONAGUA). Determinación de la Disponibilidad de Agua en el Acuífero Zona Metropolitana de la Ciudad de México; Comisión Nacional del Agua: Mexico City, Mexico, 2015.
- Gambolati, G.; Teatini, P. Geomechanics of subsurface water withdrawal and injection. Water Resour. Res. 2015, 51, 3922–3955. [Google Scholar] [CrossRef]
- Mooser, F. Bosquejo Geológico del Extremo sur de la Cuenca de México; Memorias del XX Congreso Geológico Internacional, Guía de Excursion; Boletín de la Asociación Mexicana de Geólogos Petroleros: México, Mexico, 1956; p. 154. [Google Scholar]
- Mooser, F. Los ciclos del Vulcanismo que Formaron la Cuenca de México; Memorias del XX Congreso Geológico Internacional, Vulcanología del Cenozoico; Boletín de la Asociación Mexicana de Geólogos Petroleros: México, México, 1957; Volume 2, pp. 337–348. [Google Scholar]
- Mooser, F. Historia Geológica de la Cuenca de México; Memorias de las obras del Sistema de drenaje profundo del Distrito Federal; Departamento del Distrito Federal: Mexico City, Mexico, 1975; Volume 1, pp. 7–38. [Google Scholar]
- De Cserna, Z.; De la Fuente-Duch, M.; Palacios-Nieto, M.; Triay, L.; Mitre-Salazar, L.M.; Mota-Palomino, R. Estructura geológica-gravimetría, sismicidad y relaciones neotectónicas regionales de la Cuenca de México. Boletín Inst. Geol. 1987, 104, 71. [Google Scholar]
- Vázquez, S.E.; Jaimes, P.R. Geología de la Cuenca de México. Geofísica Int. 1989, 28, 133–190. [Google Scholar] [CrossRef]
- Enciso-De la Vega, S. Propuesta de nomenclatura estratigráfica para la cuenca de México: México. Rev. Inst. Geol. 1992, 10, 26–36. [Google Scholar]
- Mooser, F.; Montiel, A.; Zúñiga, Á. Nuevo Mapa Geológico de las Cuencas de México, Toluca y Puebla; Subdirección de Construcción, Comisión Federal de Electricidad México: Mexico City, Mexico, 1996; p. 63. [Google Scholar]
- Morales-Casique, E.; Escolero, O.A.; Arce, J.L. Resultados del pozo San Lorenzo Tezonco y sus implicaciones en el entendimiento de la hidrogeología regional de la cuenca de México. Rev. Mex. Cienc. Geol. 2014, 31, 64–75. [Google Scholar]
- Lesser-Carrillo, L.E.; Lesser-Illades, J.M.; Arellano-Islas, S.; González, D. Estudio Isotópico del Acuífero del Valle de México; Dirección General de Construcción y Operación Hidráulica (DGCOH): Mexico City, Mexico, 1985. [Google Scholar]
- Lesser y Asociados S.A. de C.V. Actividades Geohidrológicas en el Valle de México; DGCOH-DDF, Contrato No. 5-33-I-497; Lesser y Asociados S.A. de C.V.: Santiago de Queretaro, Mexico, 1985. [Google Scholar]
- Lesser, J.M.; Sánchez, D.F.; González, P.D. Aspectos Geohidrológicos de la Ciudad de México. Ing. Hidráulica México 1990, 5, 52–60. [Google Scholar]
- Ortega, G.A.; Farvolden, R.N. Computer analysis of regional groundwater flow and boundary conditions in the Basin of Mexico. J. Hydrol. 1989, 110, 271–294. [Google Scholar]
- Edmunds, W.M.; Carrillo-Rivera, J.J.; Cardona, B.A. Geochemical evolution of groundwater beneath México City. J. Hydrol. 2002, 258, 1–24. [Google Scholar] [CrossRef]
- Palma-Nava, A.; Pavón-Ibarra, I.; Domínguez-Mora, R.; Carmona-Paredes, R.B. Estimación de la recarga natural en la Cuenca de México mediante la aplicación del método APLIS. Ing. Investig. Tecnol. 2022, 23, 1–10. [Google Scholar] [CrossRef]
- Auvinet, G.; Méndez, E.; Juárez, M. El subsuelo de la Ciudad de México/The Subsoil of Mexico City, 3rd ed.; Instituto de Ingeniería, UNAM: Mexico City, Mexico, 2017; p. 3. [Google Scholar]
- Issar, J.L.; Quijano, J.R.; Castro, M. The isotope hydrology of the groundwater of central México. J. Hydrol. 1984, 71, 201–224. [Google Scholar] [CrossRef]
- Cortés, A.; Farvolden, R.N. Isotope studies of precipitation and groundwater in the Sierra de las Cruces, Mexico. J. Hydrol. 1989, 107, 147–153. [Google Scholar] [CrossRef]
- Ryan, M.C. An investigation of inorganic nitrogen compounds in the Valley of Mexico. Geofísica Int. 1989, 28, 417–434. [Google Scholar] [CrossRef]
- Cardona, B.A.; Hernández, N. Modelo geoquímico conceptual de la evolución del agua subterránea en el valle de México. Ing. Hidráulica México 1995, 10, 71–90. [Google Scholar]
- Cruickshank, V.C.; Palma-Nava, A. The Numerical Modelling of the Mexico City Aquifer. International Workshop. Geotechnical Engineering in Urban Areas Affected by Land Subsidence, Mexico City. 2008. Available online: https://www.issmge.org/uploads/publications/1/45/06-technical-committee-24-tc305-02.pdf (accessed on 3 April 2022).
- Birkle, P.; Torres, R.V.; González-Partida, E. Evaluación preliminar del potencial de acuíferos profundos en la Cuenca del Valle de México. Ing. Hidráulica México 1995, 10, 47–53. [Google Scholar]
- Lezama-Campos, J.L.; Morales-Casique, E.; Castrejón-Pineda, R.; Arce, J.L.; Escolero, O. Interpretación del registro geofísico del pozo profundo San Lorenzo Tezonco y su correlación litológica en la cuenca de México. Rev. Mex. Cien. Geol. 2016, 33, 198–208. [Google Scholar]
- Morales-Casique, E.; Escolero, O.A.; Arce, J.L. Estimación de parámetros mediante inversión y análisis de las pérdidas hidráulicas lineales y no-lineales durante el desarrollo y aforo del pozo San Lorenzo Tezonco. Boletín Soc. Geol. Mex. 2015, 67, 203–214. [Google Scholar] [CrossRef]
- Morales-Casique, E.; Arce, J.L.; Lezama, J.L.; Escolero, O.A. Análisis de la estratigrafía y las características hidrogeológicas de los estratos profundos que conforman el subsuelo de la cuenca de México a partir de la perforación de dos pozos profundos, uno a 2000 m y otro a 1570 m denominados Agrícola Oriental no. 2B y 2C. Boletín Inst. Geol. 2018, 121, 113. [Google Scholar]
- Edmunds, W.M.; Smedley, P.L. Residence time indicators in groundwater: The East Midlands Triassic sandstone aquifer. Appl. Geochem. 2000, 15, 737–752. [Google Scholar] [CrossRef]
- Tóth, J. Gravitational Systems of Groundwater Flow; Cambridge University Press: Cambridge, UK, 2009; ISBN 978-0-521-88638-3. [Google Scholar]
- Rivera, A. Modelé Hydrogéologique Quasi-Tridimensionnel Non-Linéaire Pour Simuler la Subsidence dans les Systèmes Aquifères Multicouches: Cas de Mexico. Ph.D. Thesis, École Nationale Supérieure de Mines, Paris, France, 1990. [Google Scholar]
- Cruickshank, C. El sistema hidráulico del Distrito Federal. Modelos matemáticos para el acuífero del Valle de México. Chapter 6; DDF: Santiago de Querétaro, Mexico, 1982; p. 23. [Google Scholar]
- Rudolph, D.I.; Herrera, I.; Yates, R. Groundwater flow and solute transport in the industrial well fields of the Texcoco saline aquifer system near Mexico City. Geofísica Int. 1989, 28, 363–408. [Google Scholar] [CrossRef]
- Herrera, I.; Martínez, R.; Hernández, G. Contribución para la administración científica del agua subterránea de la cuenca de México. Simposio: “El sistema Acuífero de la Cuenca de México”. Geofísica Int. 1989, 28, 297–334. [Google Scholar] [CrossRef]
- Rivera, A.; Ledoux, E.; Marsily, G. Non-linear modelling of groundwater flow and total subsidence in the Mexico City aquifer-aquitard system. In Proceedings of the Fourth International Symposium on Land Subsidence IAHS, Houston, TX, USA, 12–17 May 1991; pp. 45–58. [Google Scholar]
- Andreo, B.; Vías, J.; López-Geta, J.A.; Carrasco, F.; Durán, J.J.; Jiménez, P. Propuesta metodológica para la estimación de la recarga en acuíferos carbonáticos. Boletín Geol. Min. 2004, 115, 177–186. [Google Scholar]
- Molina-Berbeyer, R. Hundimiento de la ciudad de México y su relación con los estudios de mecánica de suelos, geoquímicos, geofísicos y geológicos de las aguas del subsuelo de la Cuenca del Valle de México. Boletín Soc. Geol. Mex. 1957, 20, 3–28. [Google Scholar] [CrossRef]
- Durazo, L.J.; Farvolden, R.N. The groundwater regime of the valley of Mexico from historical evidence and field observations. J. Hydrol. 1989, 112, 171–190. [Google Scholar] [CrossRef]
- Mazari, M. Agua vs. Población; El Colegio Nacional: Mexico City, Mexico, 1996. [Google Scholar]
- Llanas, R. Evolución de la Ingeniería Sanitaria y Ambiental en México; DGCOH, Secretaría General de Obras, Departamento del Distrito Federal: Mexico City, Mexico, 1994. [Google Scholar]
- Molina-Berbeyer, R. Contribución geoquímica en el estudio de las aguas subterráneas de la Cuenca del Valle de México. Boletín Soc. Geol. Mex. 1954, 17, 53–72. [Google Scholar] [CrossRef]
- Palmer, C. The Geochemical Interpretation of Water Analyses; USGS: Washington, DC, USA, 1911; p. 479.
- Cardona-Benavides, A. Caracterización físico-química y origen de los sólidos disueltos en el agua subterránea en el Valle de San Luis Potosí: Su relación con el sistema de flujo. Master’s Thesis, Universidad Autónoma de Nuevo León, Monterrey, México, 1990; 97p. [Google Scholar]
- Academia de la Investigación Científica (AIC). El agua y la Ciudad de México, Abastecimiento y Drenaje, Calidad, Salud Pública, uso Eficiente, Marco Jurídico e Institucional; Academia de la Investigación Científica, National academy of Sciences, through the USA National Research Council: Washington, DC, USA, 1995. [Google Scholar]
- Instituto de Geofísica (IGF)—UNAM. Diagnóstico del Estado Presente de las Aguas Subterráneas de la Ciudad de México y Determinación de sus Condiciones Futuras; Contrato Núm. 3–33–1–0689; Departamento del Distrito Federal: Mexico City, Mexico, 1994; p. 110. [Google Scholar]
- Sistema de Aguas de la Ciudad de México (SACMEX). Mapa de Hundimientos 1994–2017. 2017. Available online: https://www.fondosdeagua.org/content/dam/tnc/nature/en/documents/latin-america/aguas.pdf (accessed on 3 April 2022).
- Piper, A.M. A Graphic Procedure in the Geochemical Interpretation of Water-Analyses. Eos Trans. Am. Geophys. Union 1944, 25, 914–928. [Google Scholar] [CrossRef]
- Vásquez, S.E. Easy_Quim V 5.0. Grupo de Hidrología Subterránea, [en línea], Inst. Grupo de Hidrología Subterránea 2012, UPC, España. Available online: https://h2ogeo.upc.edu/es/softwarehidrologia-subterrania/11-software-hidrologiasubterrania/42-easy-quim (accessed on 5 October 2021).
- Clark, I.; Fritz, P. Environmental Isotopes in Hydrogeology; Lewis Publisher: Totnes, UK, 1997; ISBN-13:978-1566702492. [Google Scholar]
- Stuiver, M.; Polach, H.A. Discussion: Reporting of C-14 data. Radiocarbon 1977, 19, 355–363. [Google Scholar] [CrossRef] [Green Version]
- Marsal, M. The Lacustrine Clay of the Valley of Mexico: International Clay Conference, Mexico; Instituto de Ingeniería: Mexico City, Mexico, 1975. [Google Scholar]
- Juárez-Camarena, M.; Auvinet-Guichard, G.; Méndez-Sánchez, E. Geotechnical Zoning of Mexico Valley Subsoil. Ing. Investig. Tecnol. 2016, 17, 297–308. Available online: http://www.scielo.org.mx/scielo.php?script=sci_arttext&pid=S1405-7432016000300297&lng=es&tlng=en (accessed on 15 July 2021). [CrossRef] [Green Version]
- Cruickshank, C.; Herrera, I.; Yates, R.; Hennart, J.P.; Balarezo, D.; Magaña, R. Modelos de Predicción del Hundimiento del Subsuelo del Valle de México; Proyecto 9138; Instituto de Ingeniería, UNAM: Mexico City, Mexico, 1979. [Google Scholar]
- Tóth, J. Theoretical analysis of groundwater in small drainage basins. J. Geophys. Res. 1963, 68, 4791–4812. [Google Scholar] [CrossRef]
- Juárez, M. Análisis geoestadístico del subsuelo de la zona lacustre del Valle de México Caracterización geoestadística del subsuelo del Valle de México. Ph.D. Thesis, UNAM, Mexico City, México, 2015. [Google Scholar]
Figure 1.
Successive stages for a sustainable evaluation of the Mexico Basin Aquifer in the long term; the dashed box shows the components of this study.
Figure 1.
Successive stages for a sustainable evaluation of the Mexico Basin Aquifer in the long term; the dashed box shows the components of this study.

Figure 2.
Study area, topography elevation and extent of Mexico Basin.

Figure 3.
River watersheds, drainage and delimitation of the aquitard.

Figure 4.
Administrative aquifers and geological cross sections used to display the geological and hydrogeological models.
Figure 4.
Administrative aquifers and geological cross sections used to display the geological and hydrogeological models.

Figure 5.
Water budget of the Mexico Basin in cubic meters per second in 2019. Land subsidence rates on aquitard, from 1999–2008, modified from [20].
Figure 5.
Water budget of the Mexico Basin in cubic meters per second in 2019. Land subsidence rates on aquitard, from 1999–2008, modified from [20].

Figure 6.
Schematic geological model of the Mexico Basin; its location is shown in Figure 4 as CC’-DD’.
Figure 6.
Schematic geological model of the Mexico Basin; its location is shown in Figure 4 as CC’-DD’.

Figure 7.
South-north geological cross section of the MB modified after [3,10]; its location is shown in Figure 4 as B-B’.

Figure 8.
Hydrogeological conceptual model of the Mexico Basin Aquifer based on cross sections C-C’ and D-D’ as shown in Figure 4.
Figure 8.
Hydrogeological conceptual model of the Mexico Basin Aquifer based on cross sections C-C’ and D-D’ as shown in Figure 4.

Figure 9.
Hydrogeological cross section; location is shown in Figure 4 as CC’-AA’. (a) General groundwater flow direction and groundwater level; geochemical water Chase Palmer classification, 1950. (b) Land subsidence in the zoomed area (between 20,000 and 60,000 m of distance), water level and land level, 1950. (c) General groundwater flow direction and groundwater level; geochemical water types, 1990. (d) Land subsidence in the zoomed area (between 20,000 and 60,000 m of distance), water level and land level, 1990.

Figure 10.
Equipotential surface map of the MB. Contour intervals are 20 m.

Figure 11.
Cl− concentrations in the MB.

Figure 12.
Groundwater age and classification.

Figure 13.
Hydrogeological cross section; location is shown in Figure 4 as CC’-AA’. (a) General groundwater flow direction and groundwater level; geochemical water types; (b) land subsidence in the zoomed area (between 20,000 and 60,000 m of distance), water level and land level, 2019.
Figure 13.
Hydrogeological cross section; location is shown in Figure 4 as CC’-AA’. (a) General groundwater flow direction and groundwater level; geochemical water types; (b) land subsidence in the zoomed area (between 20,000 and 60,000 m of distance), water level and land level, 2019.

Figure 14.
Detailed groundwater budget of the MBA in 2019: (a) satellite view of the Mexico City Metropolitan Area; (b) representative west-east cross section through the Plains of Mexico City and Texcoco. Values are representative of the whole MBA.
Figure 14.
Detailed groundwater budget of the MBA in 2019: (a) satellite view of the Mexico City Metropolitan Area; (b) representative west-east cross section through the Plains of Mexico City and Texcoco. Values are representative of the whole MBA.

Figure 15.
Plan view of the conceptual model of the MBA.

Figure 16.
Three-dimensional conceptual model of the MBA combining results of the proposed 3D hydrogeological model (Figure 8) with the hydrogeochemical analysis based on cross sections C-C’ and D-D’ as shown in Figure 4.


Table 1.
Hydrogeological units.
| Unit | Classification | Properties |
|---|---|---|
| 1 | Upper aquitard | Very porous lacustrine clay of low permeability. |
| 2 | Upper aquifer | Hydraulically connected alluvial deposits, Quaternary fractured basalts and fractured Tertiary volcanic rocks grouped as a single aquifer of high permeability. |
| 3 | Lower aquitard | Tertiary conglomerate and evaporites; an isolated formation whose characteristics are not very well known. It is considered as an aquitard underlying the main upper aquifer. |
| 4 | Lower aquifer | A deep limestone and dolomite aquifer with high permeability due to fracturing and dissolution. |
Table 2.
Effective recharge rate and urban area.
| YEAR | 1950 | 1990 | 2019 |
|---|---|---|---|
| Basin natural recharge (m3/s) | 38 | 35 | 23 |
| Basin urban area (km2) | 159 | 622 | 1829 |
Publisher’s Note: MDPI stays neutral with regard to jurisdictional claims in published maps and institutional affiliations. |
© 2022 by the authors. Licensee MDPI, Basel, Switzerland. This article is an open access article distributed under the terms and conditions of the Creative Commons Attribution (CC BY) license (https://creativecommons.org/licenses/by/4.0/).
Share and Cite
MDPI and ACS Style
Palma, A.; Rivera, A.; Carmona, R. A Unified Hydrogeological Conceptual Model of the Mexico Basin Aquifer after a Century of Groundwater Exploitation. Water 2022, 14, 1584. https://0-doi-org.brum.beds.ac.uk/10.3390/w14101584
AMA Style
Palma A, Rivera A, Carmona R. A Unified Hydrogeological Conceptual Model of the Mexico Basin Aquifer after a Century of Groundwater Exploitation. Water. 2022; 14(10):1584. https://0-doi-org.brum.beds.ac.uk/10.3390/w14101584
Chicago/Turabian StylePalma, Adriana, Alfonso Rivera, and Rafael Carmona. 2022. "A Unified Hydrogeological Conceptual Model of the Mexico Basin Aquifer after a Century of Groundwater Exploitation" Water 14, no. 10: 1584. https://0-doi-org.brum.beds.ac.uk/10.3390/w14101584
Note that from the first issue of 2016, this journal uses article numbers instead of page numbers. See further details here.