
Flood Risk Modeling under Uncertainties: The Case Study of Croatia


Faculty of Civil Engineering, Architecture and Geodesy, University of Split, Matice Hrvatske 15, 21000 Split, Croatia
*
Author to whom correspondence should be addressed.
Water 2022, 14(10), 1585; https://0-doi-org.brum.beds.ac.uk/10.3390/w14101585
Submission received: 13 April 2022
/
Revised: 6 May 2022
/
Accepted: 12 May 2022
/
Published: 16 May 2022
(This article belongs to the Section Hydrology)
Abstract
:This study presents an approach for assessing the flood risk using the fully probabilistic description of the annual damage using the derived higher-order statistical moments of the annual damage random variable. The annual damage distribution is used to analyze the impact on the macro-scale agglomeration described with the unified damage function in the case study of the river Kupa, Croatia. The agglomeration damage function is derived through the unit damage function and estimated distribution of building thresholds within the studied agglomeration. The unit damage is described with the shape function, which can easily accommodate different forms of damage assessment depending on the available information. The estimated distribution of annual maximum flood levels is propagated through the agglomeration damage function into the annual damage distribution derived using higher-order statistical moments and presented with the exceedance probability, indicating the likelihood that a certain annual maximum damage can be exceeded. Besides the aleatory uncertainty of annual maximum flood levels, we analyzed the impact of the uncertainty in estimating the unit damage function upon the annual damage distribution. This uncertainty shows a significant impact on the shape of the annual damage distribution, particularly in the region of extreme flood events. Analyzing the annual damage distribution range, resulting from the uncertainty in damage functions, provides more information to policymakers in assessing the potential consequences on the future spatial planning programs, particularly from the strategic environmental assessment point of view.
1. Introduction
Many river basins around the world are facing frequent severe flood events due to climate change and constant anthropogenic pressures with continuing urbanization. A river basin is an open system receiving energy through different climate conditions and converting it to kinetic energy firstly and then, through the turbulent flow, it is dissipated into heat along the channel margins and inundations creating the so-called, dynamic equilibrium in geomorphology [1]. Anthropogenic activities along the river banks (similar to a coastline) are decreasing natural retention volume, sealing the adjacent land with urbanization, and introducing hydro morphological changes in the river itself. The result is a disturbance of a river dynamic equilibrium and frequent flooding events can be seen as a rate of internal production of entropy, created by the increased rate of energy loss, to compensate for exerted pressures on the river system.
Devastating floods around the world and particularly in Europe are raising public awareness and causing a major portion of insured losses among all catastrophes [2]. European Flood Directive (EFD) requires flood risk management to consider flooding events with a low probability or under extreme event scenarios [3]. In the environment, events described with extreme value statistics are often causing the impact either to human health [4,5,6,7,8,9,10] and/or to economic assets [11,12,13,14,15,16,17,18,19,20,21]. What is common to all these different fields of the impact assessment application is the need to estimate the probability density function (PDF) of a threatening phenomenon and estimate the corresponding human health adverse effect or consequences to economic assets, subject to different aleatory and/or epistemic uncertainty.
In the process of spatial planning, a program of measures needs to address the flood risk management objectives, which focus more on the risk-informed decision-making concepts [2,22]. Flood risk management strategies include both structural and non-structural measures depending on the flood damage estimation for the spatial planning area under the forecasted future flooding events and associated risks. The combination of both, climate change and the continued development of flood-prone areas, will significantly increase consequences by the end of the century [19].
Commonly used, flood damage models estimate damage based on the water depth or flow with the uncertainty in damage predictions indicating the need for flexible damage functions that could address the area-specific characteristics in terms of tangible and intangible damages [12,13,23]. Different probabilistic approaches in flood risk assessment were focused on addressing uncertainties in damage models and cost analysis [17,24,25,26,27]. The most common approach to assessing the flood risk is based on calculating the expected annual damage (EAD) using different hydrological and hydraulic tools corresponding to different flood return periods and related damages in the studied area through exposure and vulnerability assessments [15,16,18,28,29]. Furthermore, decision-makers investing in flood protection measures and insurance companies often use EAD estimates to perform the cost-benefit analysis and to assess premiums. However, the concept of EAD, or any averaged variable in the risk assessment, results in a risk-neutral solution that maximizes economic efficiency [30].
This paper presents an approach for flood risk assessment under uncertainty of possible future flood events by developing a semi-analytical model based on a probabilistic framework. The increased frequency and magnitude of flood levels due to climate change requires an assessment of damages caused by individual flood events. In this study, we employ the agglomeration damage functions as averaged over the individual unit damage functions. The unit damage begins when the building threshold has been exceeded, yielding the building threshold described with a distribution in the considered agglomeration. Instead of generating a sufficient number of potential flood events (using hydrological and hydraulic modeling) to obtain the damage-probability curves and the corresponding EAD, we directly evaluate the annual damage distribution using derived higher-order statistical moments resulting from the conjunction of the probability of occurrence of flood events with the agglomeration damage function. The annual damage distribution accounts for the entire probability space of possible flood events and related damages. The annual damage statistical moments indicate the variability and high skewness of the distribution indicating the importance of low probability/high damage flood events. Besides the uncertainty present in the evaluation of the probability of flood events, this study is analyzing the impact of the uncertainty in the damage function upon the annual damage distribution for the study area. The results indicate that the sharper increase in the damage function for lower inundation depth results in a larger exceedance probability of low probability/high damage flood events.
This presented approach is demonstrated by assessing the flood risk for possible future flooding events in the selected area of the river Kupa, Croatia, which experienced severe flooding events several times in the last decade. Because of no actual empirical data and insurance loss claims from previous floods, the only damage category considered is related to the buildings and inventory, which presents by far the major loss in the selected area. Besides many different sources of uncertainty affecting the flood risk estimate, we select the possible changes in the flood damage functions for the analysis of their impact on the annual damage distribution, particularly from low probability/high damage events.
2. Materials and Methods
2.1. Case Study Description
The selected case study area is located on the right riverside of the river Kupa just before entering the City of Karlovac (Figure 1). The river Kupa originates in Croatia, flows through Slovenia, and finally returns to Croatia flowing towards the City of Karlovac, which is situated at the confluence of four rivers: Kupa, Korana, Dobra, and Mrežnica. The river Kupa is the largest tributary of the Sava river and forms a natural border between northwest Croatia and southeast Slovenia. Due to the warming climate in the past several decades, temperatures and precipitations increased, especially when combined with heavy snowfall and warmer spring temperatures. This is making the river Kupa alluvial lowlands one of the most flood-prone areas [31].
The flood events recently recorded in the Kupa alluvial lowlands (in 2010, 2013, 2014, and 2015) demonstrated the potential for substantial damage to households and inventories in the flooded area. The observed increase in flood damages has been a result of new urban development in the area with an increase in the population and assets in the flood-prone area, which was the main reason for selecting this region for demonstration of the flood risk assessment.
2.2. Flood Frequency Analysis
The most commonly used, and directly measurable variable in all river basins is the river water level, which will be an input variable into the flood risk model and described with a PDF. In this study, the river water level is defined in meters above the sea level (m.a.s.l.) measured at the Karlovac gauging station, whose historical record is used for the flood frequency analysis. We select the longest complete available series of daily water levels from 1985 to 2020.
The climate change impact is presenting itself with changes in frequency, severity, and duration of flooding events in the considered region, causing severe damage to people and goods. Recorded flood events are the combination of local extreme precipitation and/or snow melting in the upper parts of the Kupa river basin [32].
Our focus is on estimating the annual damages caused by river flood events and we assume there is one extreme flood per year in the study area. The annual maximum flood events for the available period 1985–2020 are analyzed to estimate the water level PDF, which provides a way of describing the flood event magnitude with a given probability of occurrence or a specific return period. This distribution of water levels is propagated through a damage function into the distribution of annual damages, whose estimation is the main focus of this study. Extreme flood events are commonly characterized by employing either the Block Maxima or the peak-over-threshold (POT) approach. Since our focus is on assessing the annual damage distribution resulting from the annual maximum flood, we employ the Block Maxima approach.
The mathematical computations and probabilistic analysis of input data, as well as the visualization of presented results, are performed using Mathematica (Wolfram Research, Ltd., Champaign, IL, USA, Version 12.3.1) and digital terrain modeling in a GIS environment.
In the case of the river Kupa, the gauging station is located in the City of Karlovac (Figure 1) and has been recording continuous daily water depth since 1985. The extracted annual maximum water levels were presented in Figure 2 with the fitted Generalized Extreme Value (GEV) distribution characterized by parameters (location), (scale), and (shape). The GEV parameters (, and ) were estimated within the Mathematica package using the maximum likelihood parameter estimation method and having p-value=0.9 for the Anderson Darling goodness-of-fit test.
3. Results
3.1. Flood Damage Estimates for Risk Characterization
Risk is commonly defined as a combination of exposure probability to hazardous events, within a given time, in combination with possible consequences caused by those events. When referring to floods, the risk includes the probability of flood occurrence indicating the probability of water depth exceeding the asset threshold, in combination with the potential damage caused by flooding. The flood annual damage is the key variable in the flood risk assessment and results from the analysis of exposure and vulnerability of the selected area to hazards from different flood events. The flood risk indicator depends on the pdf of the floodwater level and the relation between the water level and the damage indicator in the flooded area. By this definition, the risk indicator has the same units as the damage indicator, which is estimated on the annual basis as a result of annual maximum water levels derived from the flood frequency analysis.
Damage estimates provide the link between the hazard, defined by the flood level, and the resulting damage to assets. Damage functions are commonly presented in relative and absolute terms. The relative term relates to what fraction of a structure is damaged while the absolute term is focused on a potential monetary loss. In the presented case study we follow the relative damage concept, which could be transformed into a monetary loss depending on the reference choice based on the current value. There is a complex relationship between the flood level and related damage processes, which are highly dependent on local conditions. Damages are primarily related to the inundation depth, which needs to be derived from the probability of flood hazard.
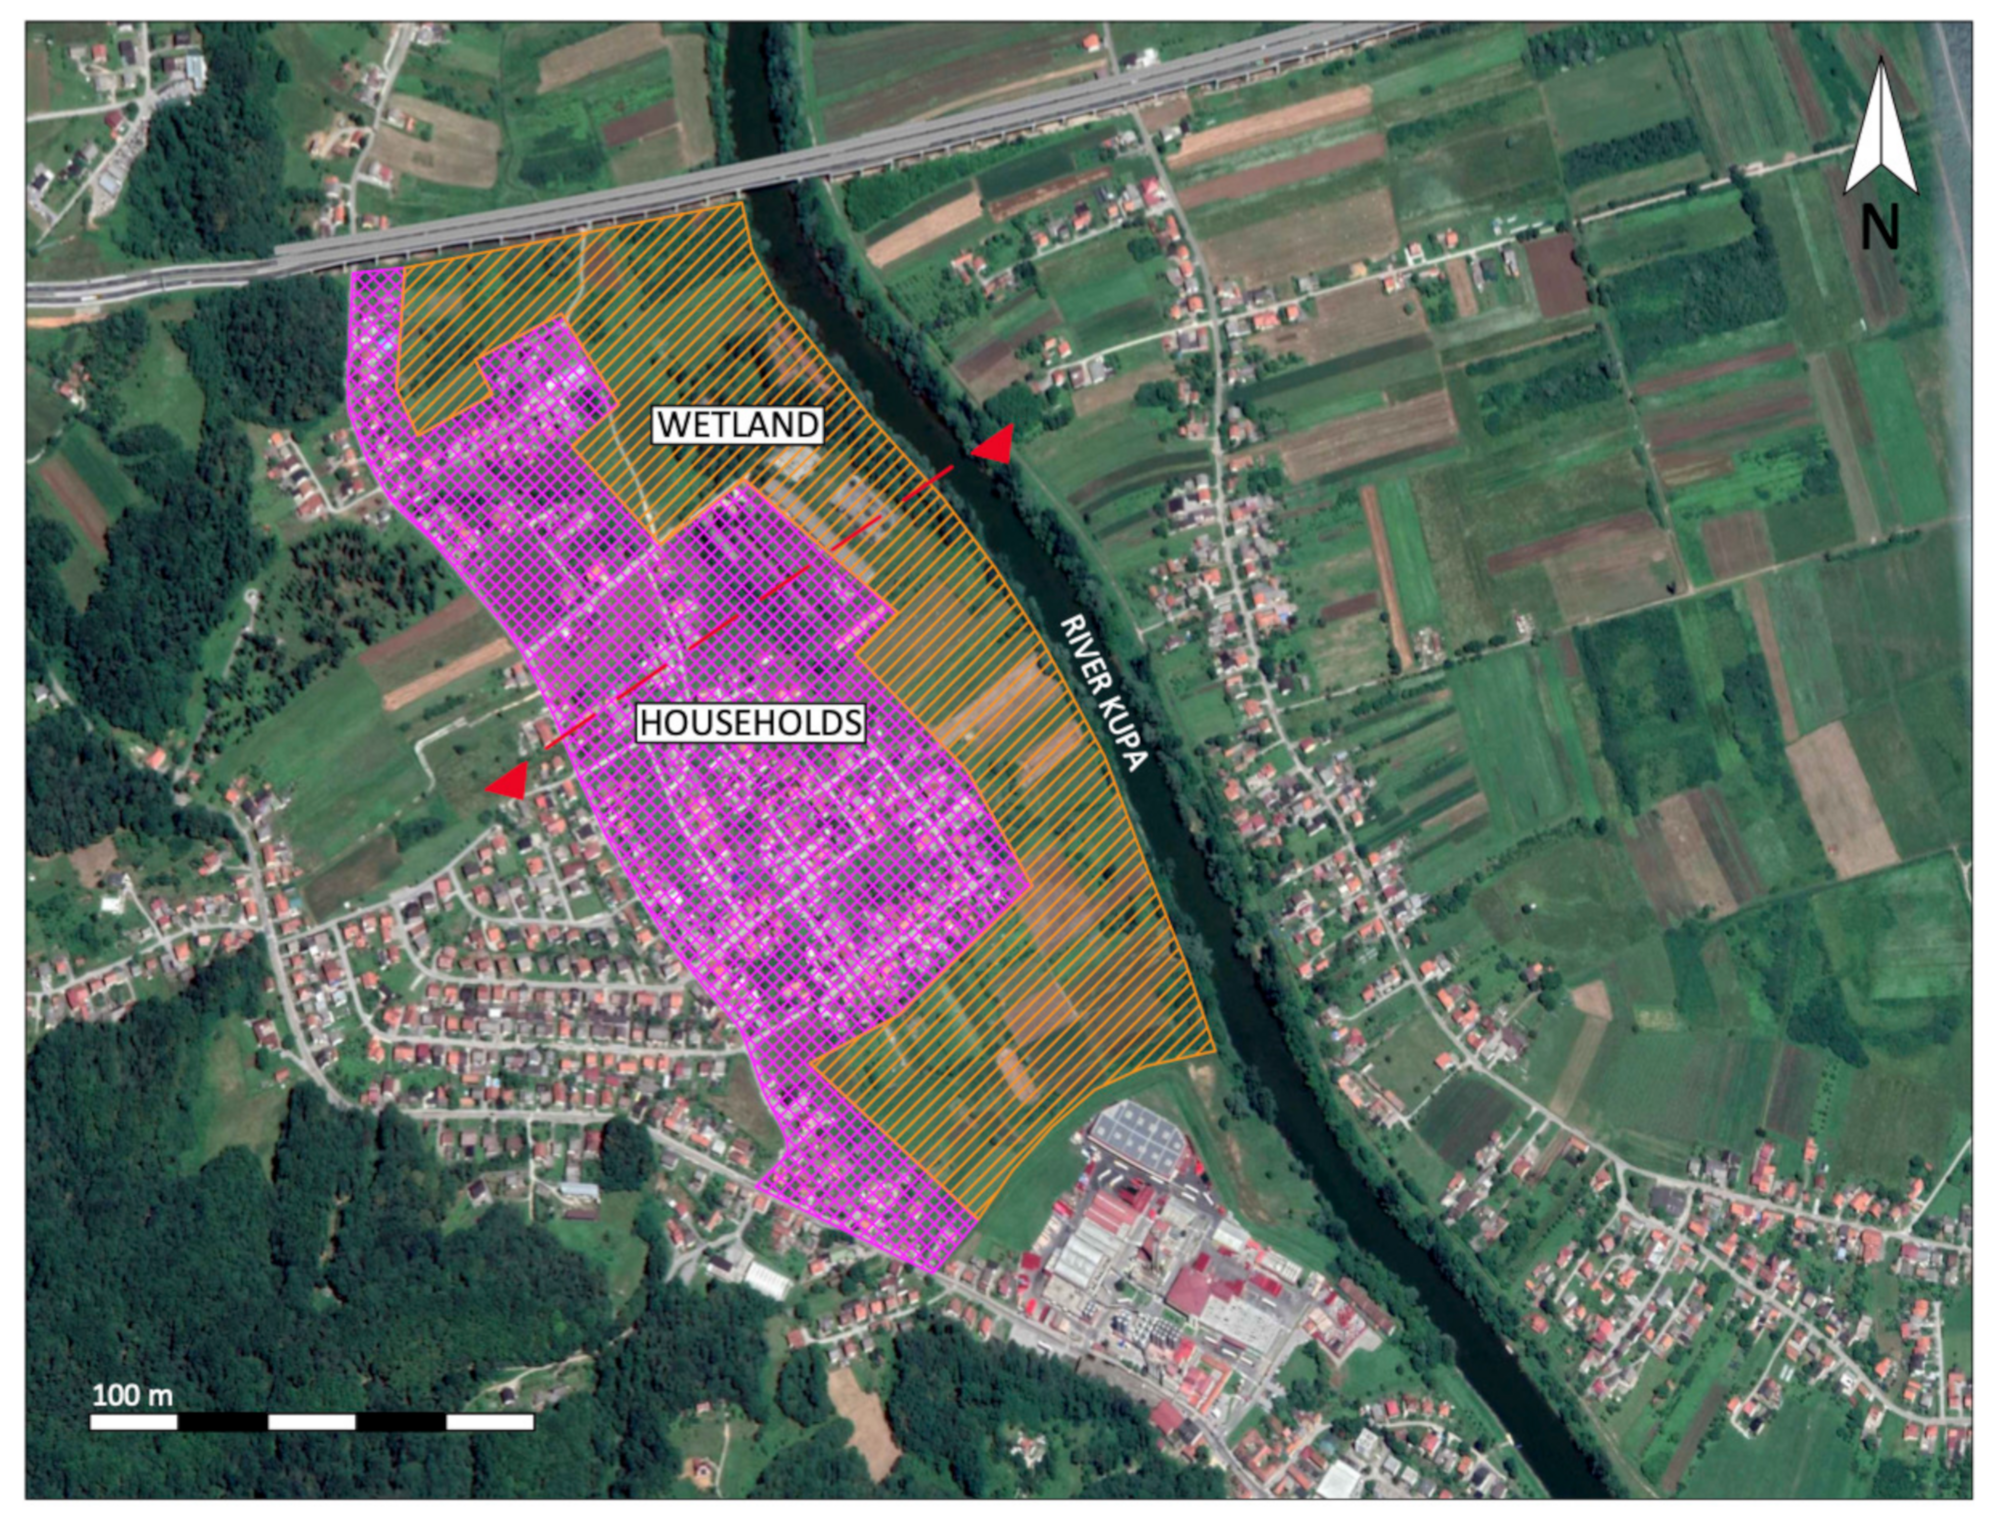
The selected area for the analysis is shown in Figure 3 and presents the micro-location of the right riverside of the river Kupa in the vicinity of the City of Karlovac. The study area is the most vulnerable zone because there is no flood defense infrastructure at the site. The external border of the selected area on the western side is the local road which is placed on a higher level compared to the household area, and the terrain elevation outside of the selected area (western side) is significantly higher. South of the selected area there is an industrial zone already protected by a dike. This is a rural area consisting of family households and surrounded predominantly by agricultural land with some areas also assigned for future development.
The limited post-flooding information on damage relations to hazard events presents a major obstacle, hindering developments, and verification of damage functions. In Croatia, the availability of damage functions is very limited and there are no recorded losses, making the characterization of damage functions very difficult. Thus, in this study, we follow the global flood depth-damage functions for Europe reported in [33], where a consistent database of depth-damage curves has been developed. The data set contains depth-damage curves spanning from zero (no damage) to one (maximum damage). To translate the flood water level to the monetary loss, damage curves need a national maximum damage value for the considered category. Table 1 shows the average maximum damage value for a building structure including inventory at 6 m inundation depth for Croatia as estimated in [33].
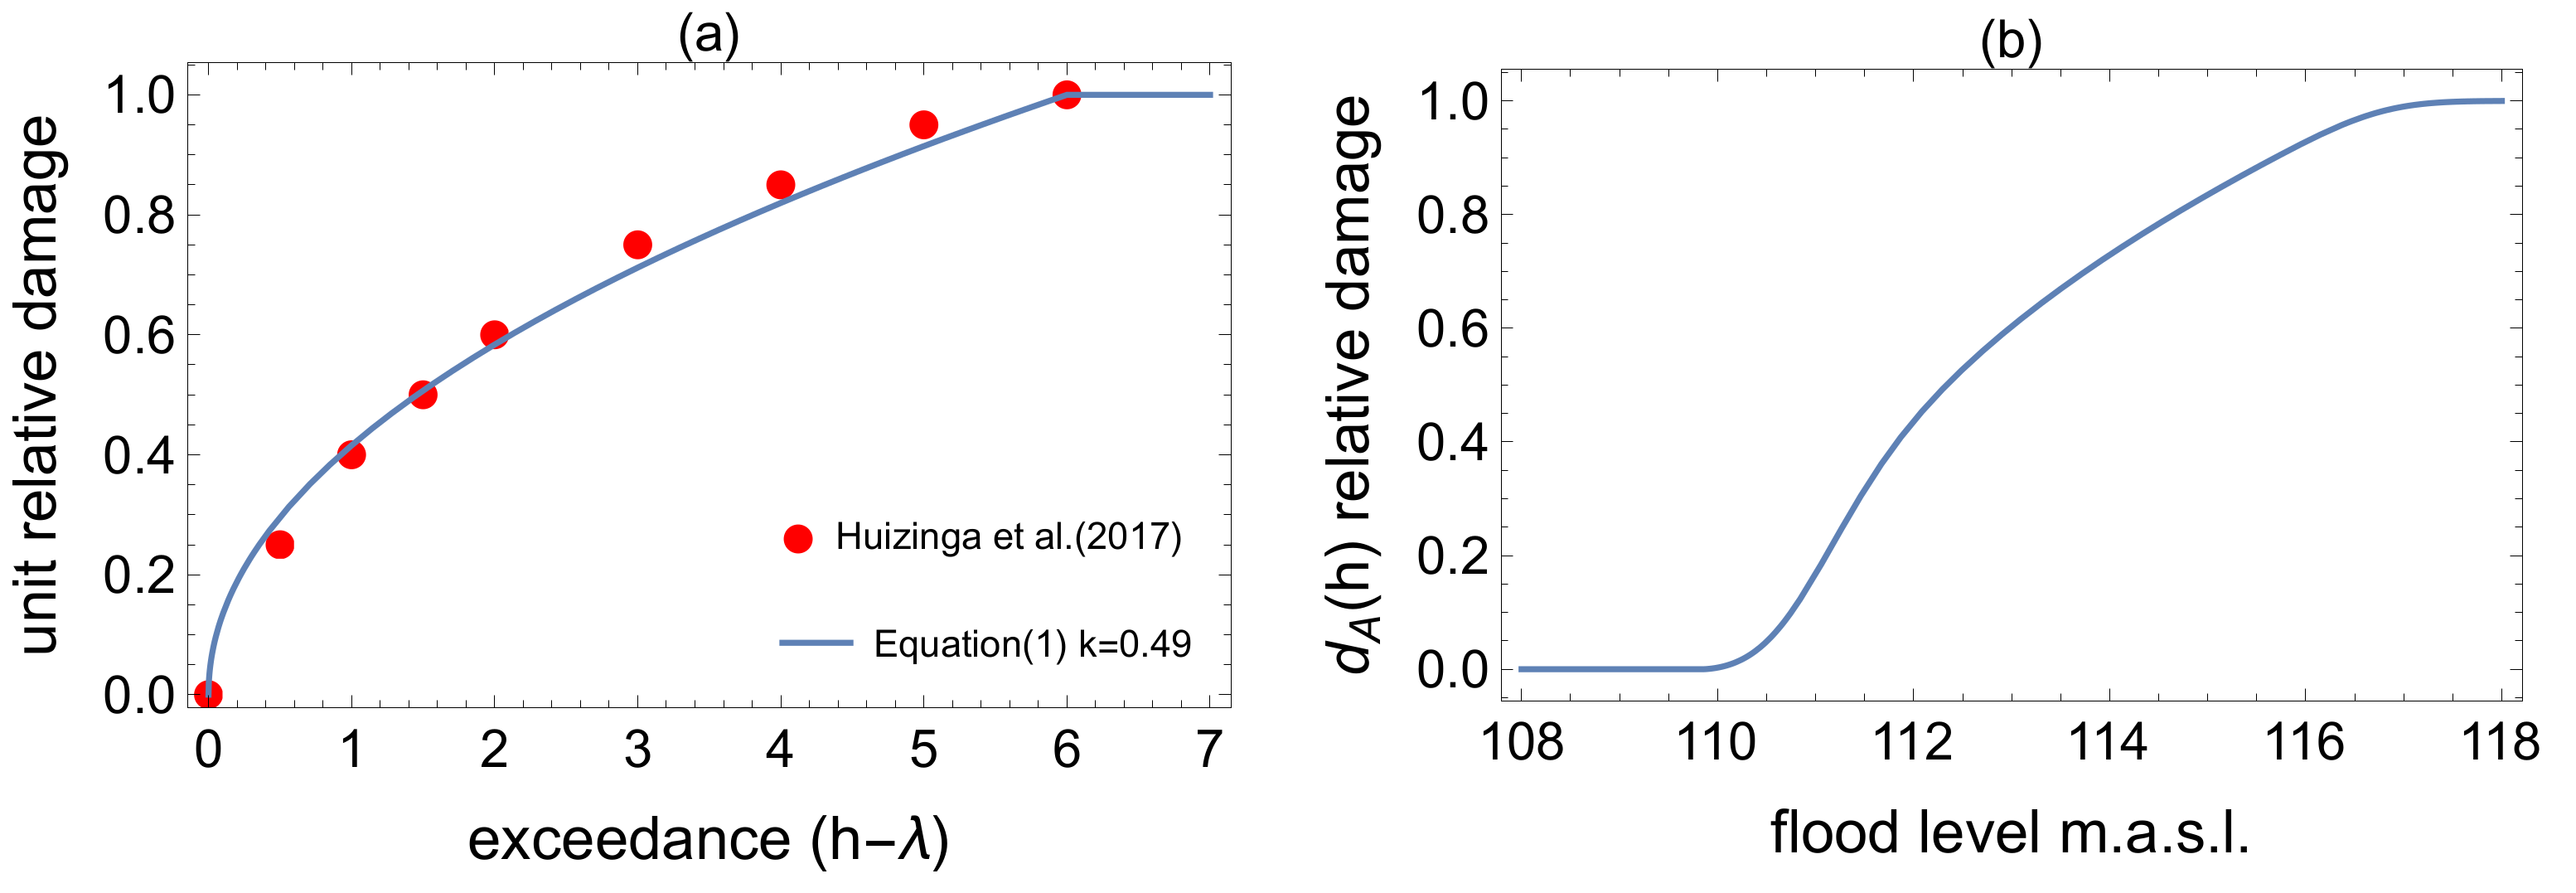
The unit damage function is related to a single unit (in our case a building), which retains damage only upon the exceedance of a unit-specific flood threshold (e.g., the ground floor elevation). Neglecting auxiliary damage factors, such as flow velocity, floating debris, and flooding duration, the damage to a single building result from the flood event exceeding the flood threshold. The unit-scale damage fraction of a single unit is defined with the exceedance level, where h is the annual maximum flood level and is the individual building flood threshold [20]. This implies that a single building will suffer damage if its flood threshold is exceeded. The unit-scale damage function is a monotonically increasing function from zero to one and follows the average values proposed in [33] for Europe. We describe the unit damage function with the following expression:
where is a maximum exceedance level and k is the power coefficient, which defines the shape (convex, concave or linear) of the damage function and could be estimated if depth-damage data from historical floods are available. The average unit depth-damage function for Europe in [33] corresponds to the power coefficient and m in Equation (1). Based on the area topography, the individual buildings will be differently affected depending on their geographic location. Thus, the relative flood damage for the considered agglomeration in Figure 3 is obtained as the average relative damage to individual buildings. The agglomeration relative damage at some flood level h is described with [20]:
where is used to model the PDF of the building flood threshold. A direct delineation of flood thresholds for current and, particularly, future development is not feasible in the considered area. Thus, the probabilistic description of flood thresholds is used for the selected agglomeration. Using the topographic maps and DTM of the considered agglomeration in Figure 3, the flood threshold level is described with a Normal distribution, , with mean value m.a.s.l. and standard deviation . The distribution is truncated between 109.85 and 114.25 m.a.s.l., which corresponds to the lower possible development limit and the upper line of current buildings in the agglomeration, respectively.
Figure 4a displays the unit damage function modeled with the shape parameter in Equation (1) compared to data from [33]. Figure 4b shows the resulting agglomeration relative damage function from Equation (2). The agglomeration scale damage function represents a macro domain of interest with unified damage function based on a direct monetary loss.
3.2. Flood Risk Indicators
The flood risk indicator is defined by the probability that the flood event of a given intensity and given loss will occur in the selected agglomeration annually. The annual flood risk is a product of relative damage function and probability of a flood event and provides information on the contribution from different flood events to the expected annual damage indicating events of high importance [30,34]. The EAD is the first statistical moment () of the random variable of annual damage given with:
where is the PDF of maximum annual flood levels estimated with the GEV distribution. The EAD for the considered agglomeration is 0.074 or € in monetary loss.
In Figure 5a the flood risk curve based on the EAD is presented and in Figure 5b the flood risk indicator cumulative distribution function (CDF) provides the information on how quickly the EAD can be reached from flood events up to some river depth or return period. For example, in the river Kupa case study, the contribution of flood events up to 111.5 m.a.s.l. (or 25-year flood) amounts to 80% accumulation of the EAD for households and inventory.
When using the EAD concept for assessing the flood risk, the extreme events do not contribute significantly to the expected annual damage, yielding that reducing the most frequent events may provide the largest benefit [34]. This should not be unexpected, since the EAD concept evaluates the average damage over time and essentially represents the risk-neutral estimate [30].
3.3. Annual Damage Distribution
The widely used concept of the EAD, as the flood risk indicator, not only minimizes the influence of low probability/high damage flood events but also its extrapolation into the future for assessing the benefits of new flood protection systems and new future development of the considered area could be questioned. The public perception of a low probability/high damage is often considered with great fear and flood protection measures are often initiated from the public reaction to those extreme floods. Merz et al. [30] discussed the significance of extreme flood events and used the risk aversion model to penalize events with high damage instead of minimizing the EAD to demonstrate, for example, how the positive effects of the dike system can be decreased by increasing the benefits of the early warning system. The early warning was also found important in analyzing system uncertainty during the near-response phase of flood risk management [35]. However, in the majority of flood risk applications, the EAD concept is still in use.
The importance of uncertainty in the annual damage was investigated for coastal flooding problems in [21] by evaluating the standard deviation of the annual damage. In this study, we provide an extended analysis of the annual damage distribution by deriving higher-order statistical moments for the river Kupa case study to examine the likelihood of annual damage resulting from possible extreme flood events. Following the expression for the mean of annual damage given in Equation (3), the higher statistical moments of the annual damage random variable are [36]:
where and are third and fourth statistical moment of the annual damage, respectively. The annual damage skewness and kurtosis are, then, evaluated as and . Table 2 displays the first four statistical moments for annual damage in the river Kupa case study.
The standard deviation quantifies the propagated aleatory uncertainty resulting from the natural river flow variability. The skewness value of 1.75 shows that the annual damage is positively skewed, indicating possible extremes of the annual damage variable. Furthermore, the kurtosis value of 5.55 indicates the leptokurtic annual damage distribution shape with large outliers, resulting in the annual damage being prone to extreme values. This information is particularly important in flood risk management and designing the flood protection measures, which usually protect lower probability flood events.
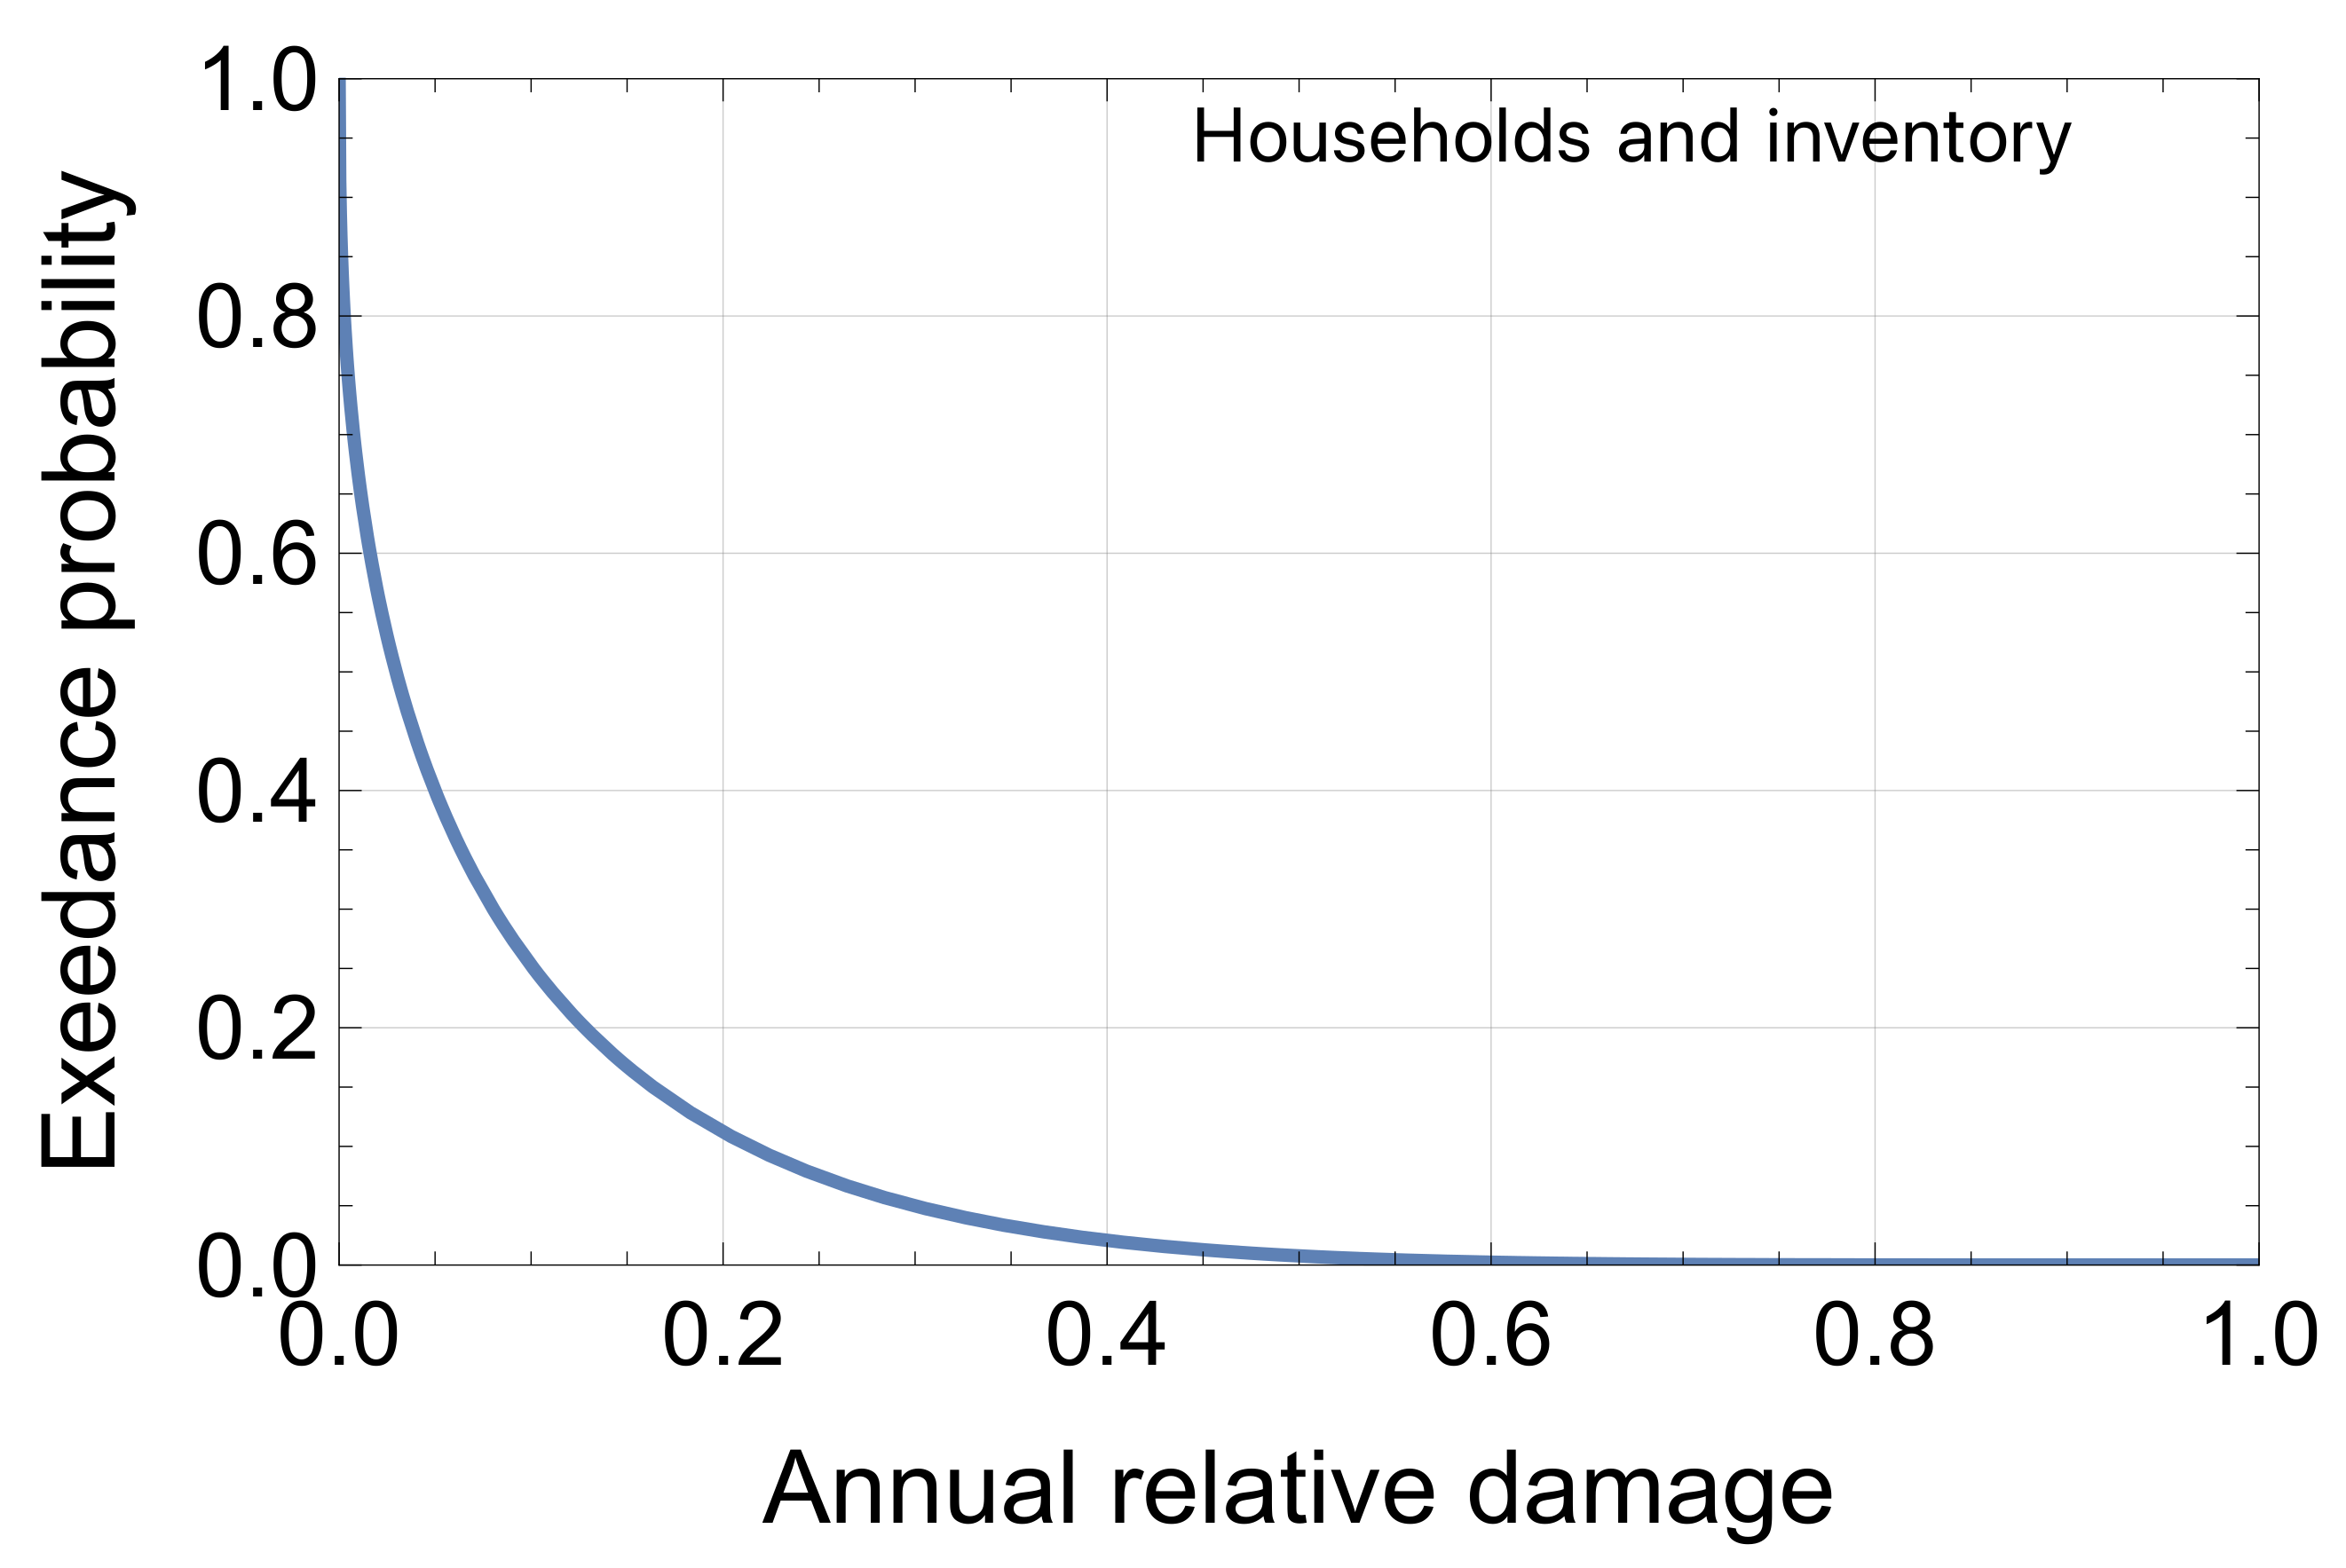
Since the annual damage random variable is given in relative units and bounded between 0 and 1, the Beta distribution is a logical choice for describing the annual damage distribution. Using Equations (3) and (4) for calculating Beta distribution parameters, the annual damage distribution (ADD) for the river Kupa case study is presented in Figure 6. The Beta distribution preserves the calculated skewness due to the high coefficient of variation equal to 1.35, and the mean value close to the zero domain bound.
The annual damage distribution in Figure 6 is presented in the form of exceedance probability. The exceedance probability is the most commonly used metric in catastrophic modeling [37] and presents the probability that an annual damage random variable exceeds a certain amount of damage. The ADD shows the significant skewness providing additional information on the possible impact coming from low probability/high damage flood events.
Thus, instead of using a common approach of generating a sufficient number of potential flood events through hydrodynamic modeling and assessing corresponding damages, to estimate damage-probability curves, we directly derive the ADD accounting for the entire probability space of possible flood events. Figure 6 shows that the EAD of 0.074 in the relative damage has a probability of being exceeded in any year due to the high skewness and kurtosis, which is often overlooked when using only the EAD estimate for the flood risk assessment.
Considering that during a given year only one flood event occurs, Table 3 depicts the exceedance probability for selected flood events of return periods 10, 25, 50, 100, 500, 1000 years, and the expected loss for each flood level.
For example, Table 3 shows that the 500-year flood event with the probability of occurrence of 0.2% (resulting in monetary loss of 8.4 €), has an exceedance probability of 1.4% or seven times more chance to be exceeded compared to the 500-year flood event. Thus, the exceedance probability provides information on the likelihood of annual damage exceedance for some extreme flood events for the considered case study.
3.4. Uncertainty in the Damage Function
Besides the considered uncertainty from the natural variability of the river flow, the other sources of uncertainty affecting the ADD are coming from the damage function description. The average unit damage function in (1), has the embedded epistemic type uncertainty depending on the asset values of affected items. The detailed damaging processes are not well understood and are dependent on construction types, employed materials, and present inventory. Often data limitations permit no more than a stratification to a few predefined asset classes [38], and the resulting average depth damage curve for Europe is obtained through the regression analysis [33].
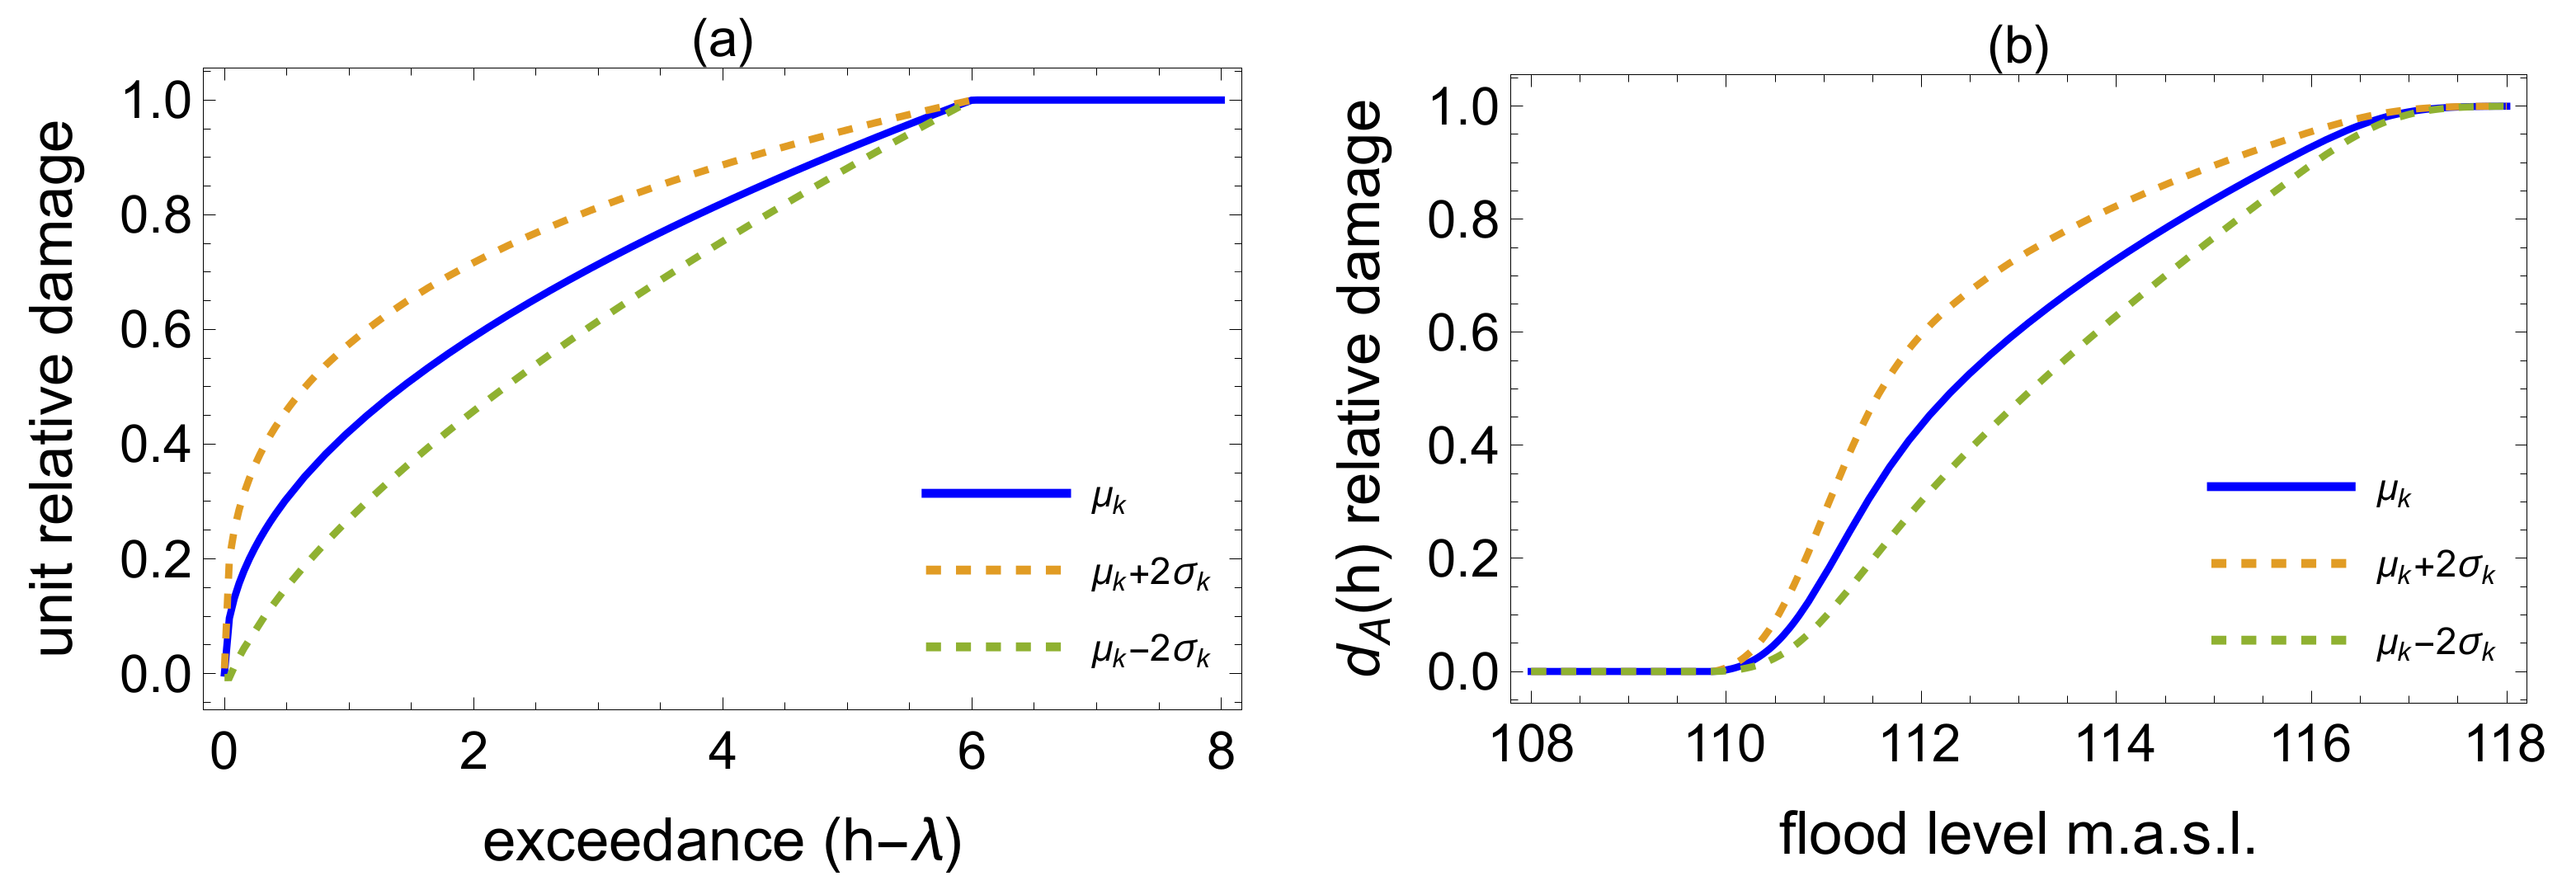
To analyze the impact of this uncertainty on the damage function, in the considered case study, we introduce the shape paremeter in Equation (1) to be a random variable following the Normal distribution , with mean value (corresponding to the average unit damage function in Equation (1) and standard deviation reflecting the uncertainty estimates reported in [33]. The first two moments of the unit damage function follow from:
where is the pdf of the shape parameter k. The unit relative damage function with corresponding uncertainty, quantified with bounds of ±two standard deviations of the shape parameter, are presented in Figure 7a. The uncertainty in the unit damage function is propagated to the agglomeration damage function (Figure 7b) showing the span up to 0.2 in relative damage between two bounds.
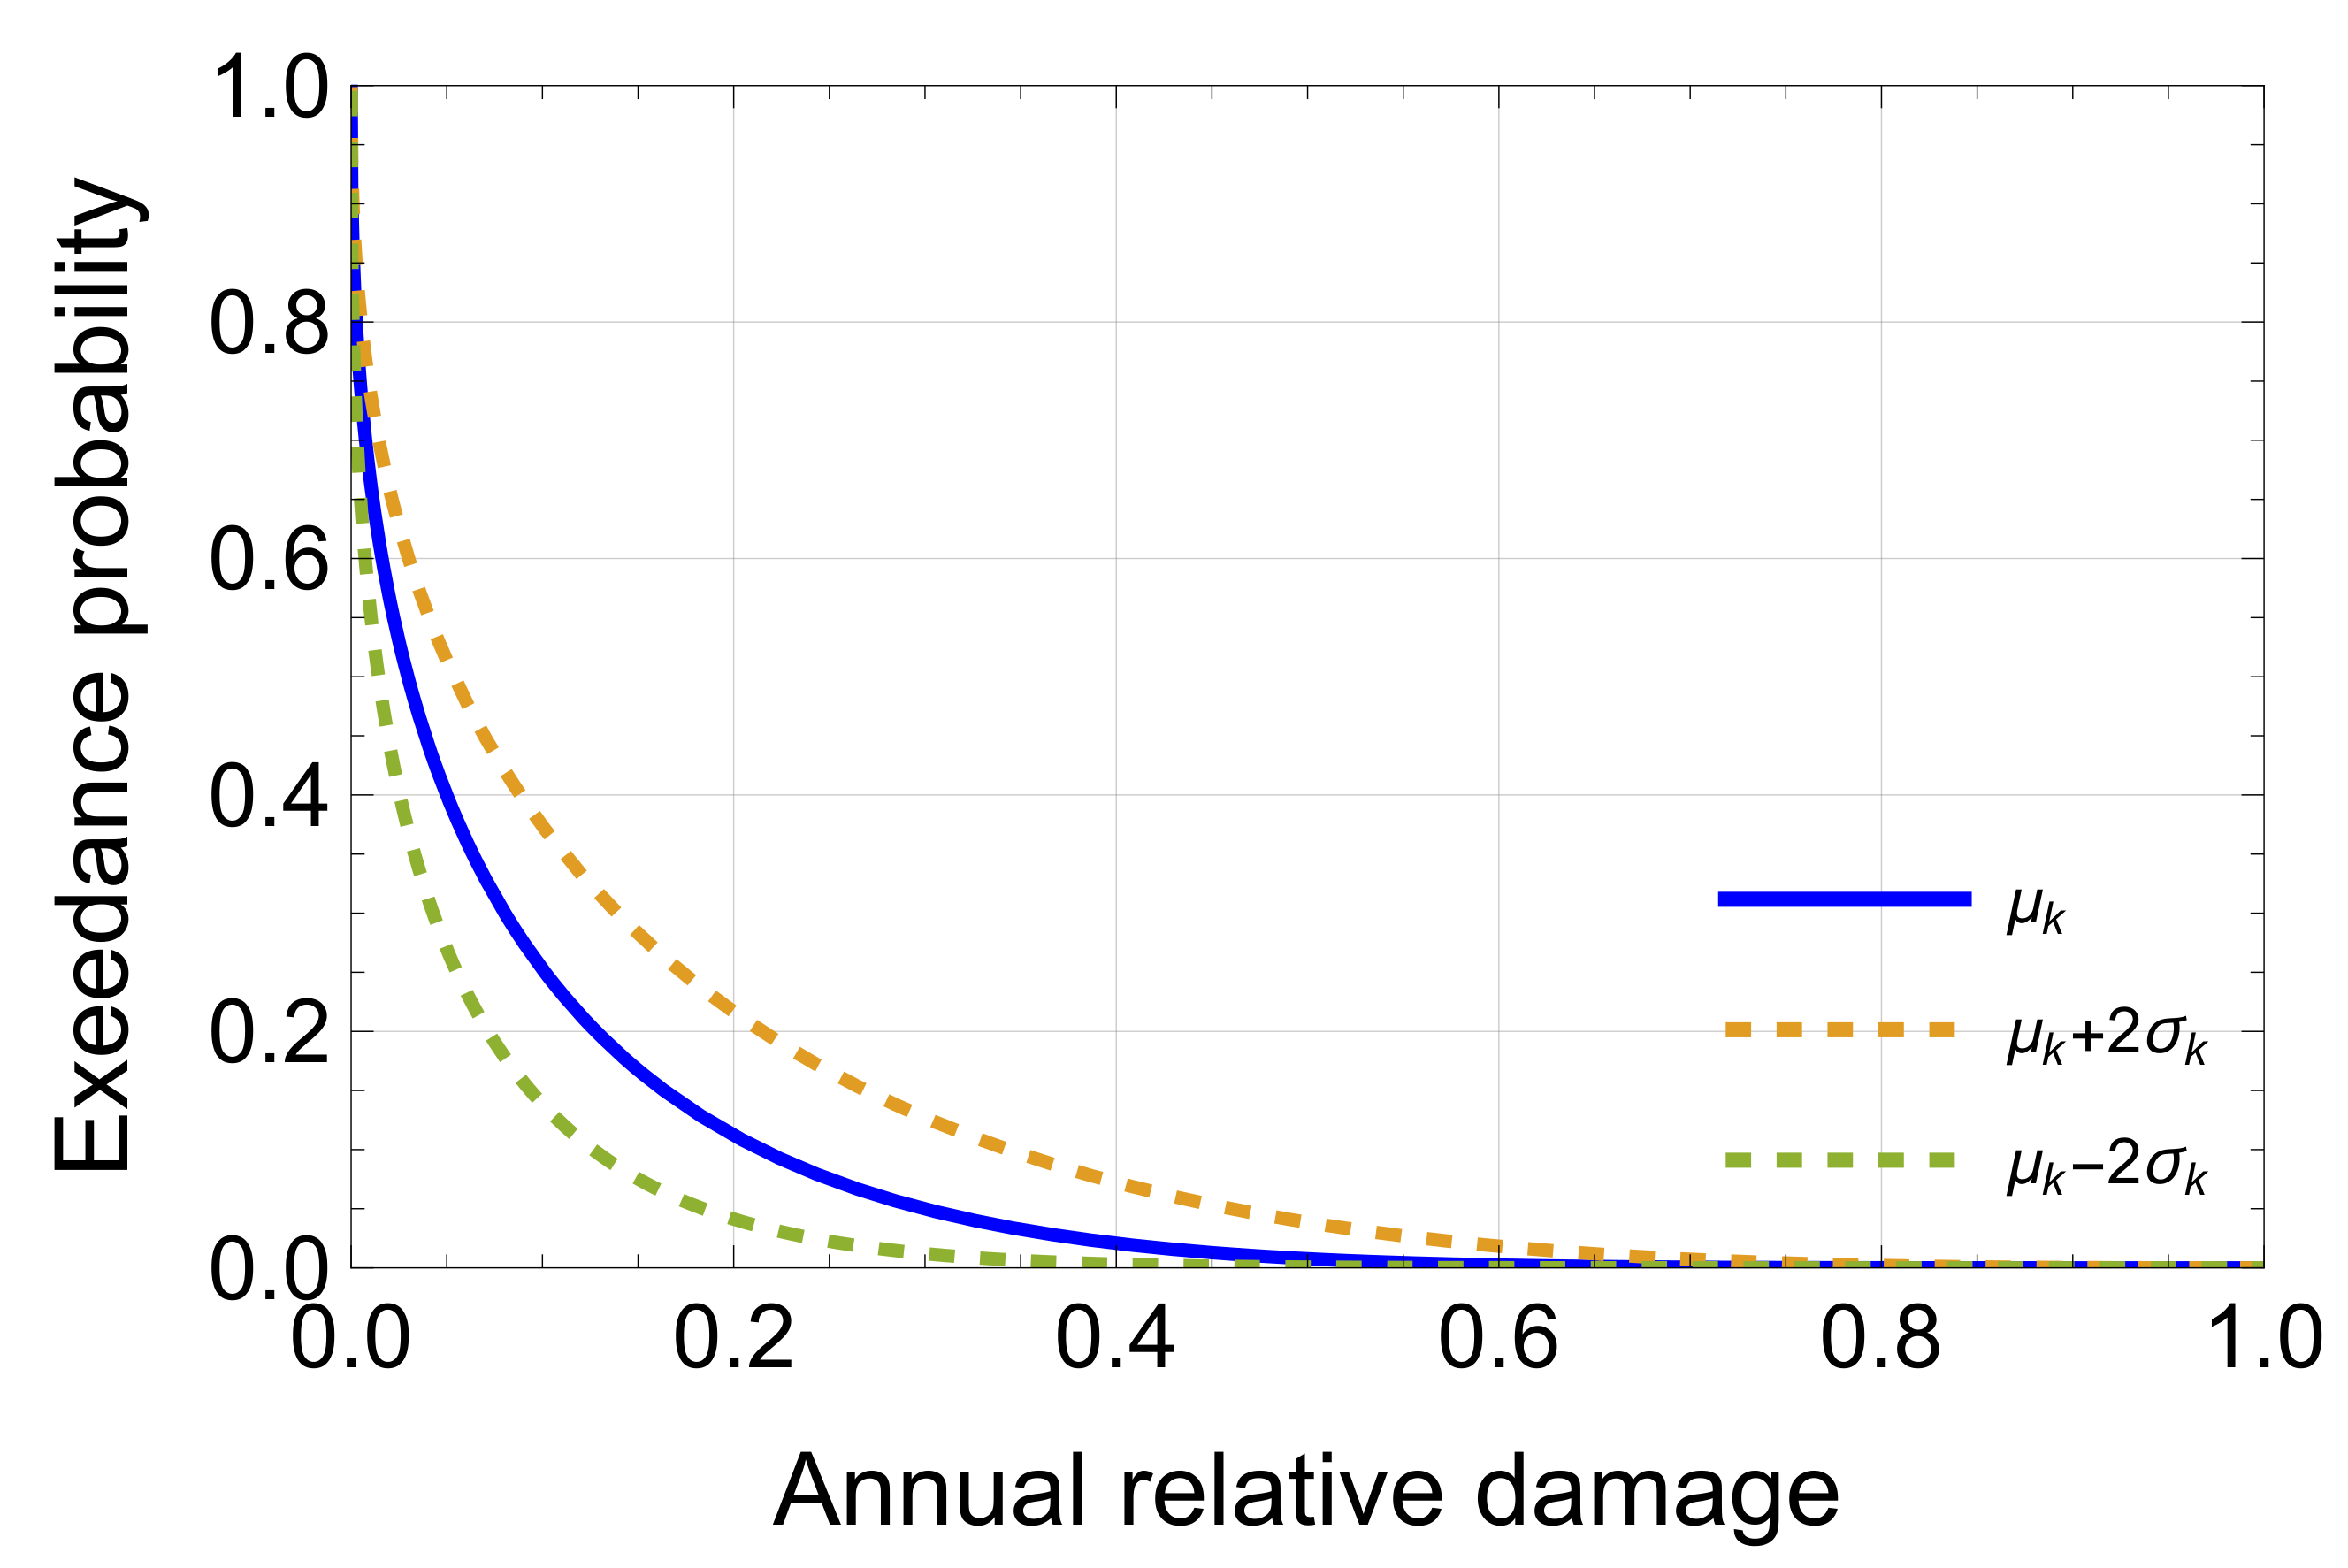
The resulting exceedance probability—annual damage distributions are shown in Figure 8. The uncertainty in the shape parameter k has a substantial impact on the annual damage distributions for two considered bounds. For the annual relative damage of 0.23 (corresponding to 10-year flood event) the uncertainty range of 95 % () indicates the likelihood that this damage could be exceeded between 2.2 and 18 %. Even the 100-year flood, having 0.35 annual relative damage, has a chance of being exceeded by 7.3 % in the case of the upper bound in Figure 8.
In the case of plus , the damage function exhibits a faster increase for lower exceedance levels and results in a larger probability of exceedance for extreme flood events. This finding demonstrates the importance of assessing possible uncertainty in damage functions, particularly for cases where there are not enough real historical damage data supporting the damage function estimates.
4. Discussion and Conclusions
This study presents an approach for assessing the flood risk using the fully probabilistic description of the annual damage as a random variable and deriving its first four statistical moments for the annual damage distribution description. The distribution of annual maximum flood levels is propagated through the agglomeration damage function into the annual damage distribution, presented with the exceedance probability indicating the likelihood that a certain annual maximum damage can be exceeded. The agglomeration damage function is derived through the unit damage function and estimated distribution of building thresholds within the studied agglomeration. The unit damage is described with the shape function, which can easily accommodate different forms of damage assessment depending on the available information. Besides the direct tangible damage, the unified agglomeration damage function can also present the intangible damage categories particularly related to the business interruption or pollution consequences after the flood event.
Our study shows that direct evaluation of the annual damage distribution, derived from the first four statistical moments, enables accounting for the entire probability space of possible flood events. The exceedance probability of annual damage indicates the likelihood of low probability/high damage flood events in the studied area. Besides the EAD, as a common flood risk indicator, the annual damage variability range and skewness can provide additional insight into designing the type of measures for preventing flood risk for different damage categories resulting from extreme floods.
In the presented case study of the river Kupa, the likelihood of extreme future annual damages is not a negligible scenario under the observed increase in flood frequency events in the last two decades. It is shown, for the household and inventory, that almost three times higher annual damage than EAD still has an 8.7% chance of being exceeded in the future. This is a direct result of the ADD skewness and can be called a flood skewness risk reflecting the likelihood of flooding events with a low probability or under extreme event scenarios as required by the EFD. Therefore, the single usage of the EAD for prioritizing flood protection measures could underestimate skewness risk in predicting possible flood damages that might happen in the future, which is a direct consequence of the EAD being the risk-neutral concept, in which measures of central tendencies are equal. The more skewed the annual damage distribution, the less accurate the EAD risk indicator will be.
Uncertainties are present in every step of a flood risk assessment, through modeling of flood frequency based on historical data through the estimation of unit and agglomeration damage functions. The impact of the natural variability of flood events is demonstrated in the evaluation of the first four statistical moments of the annual damage variable demonstrating the significant skewness and leptokurtic shape of the ADD. Besides this aleatory uncertainty, we have analyzed the impact coming from the uncertainty in estimating the unit damage function, which usually comes from limited data on actual damages and different construction types and used materials. Once propagated, this uncertainty shows a significant impact on the shape of the annual damage distribution, particularly in the region of extreme flood events. Analyzing the annual damage distribution range, resulting from the uncertainty in damage functions, provides more information to policymakers in assessing the potential consequences on the future spatial planning programs, particularly from the strategic environmental assessment point of view. In addition, this may also have a strong impact on the cost–benefit analysis for different types of flood management measures planned within the river basin.
Author Contributions
Conceptualization, T.K. and R.A.; methodology, T.K. and R.A.; validation, T.K., R.A. and S.K.; investigation, T.K.; writing—original draft preparation, T.K. All authors have read and agreed to the published version of the manuscript.
Funding
This research received no external funding.
Data Availability Statement
Not applicable.
Acknowledgments
The work of student Toni Kekez has been fully supported by the Croatian Science Foundation (Grant number DOK-2014-06-6635). Additionally, the research was supported by the following projects: STIM-REI (Center of Excellence for Science and Technology–Integration of Mediterranean Region (STIM), funded by European Union from European Structural and Investment Funds 2014–2020, Contract Number: KK.01.1.1.01.0003, CAAT (Coastal Autopurification Assessment Technology), funded by European Union from European Structural and Investment Funds 2014–2020, Contract Number: KK.01.1.1.04.0064, COMON (COastal zone MONitoring using multi-scaling methods), funded by European Union from European Structural and Investment Funds 2014–2020, Contract Number: KK.01.1.07.0033, and project KK.01.1.1.02.0027, co-financed by the Croatian Government and the European Union through the European Regional Development Fund–the Competitiveness and Cohesion Operational Programme.
Conflicts of Interest
The authors declare no conflict of interest.
References
- Leopold, L.B.; Langbein, L.B. The Concept of Entropy in Landscape Evolution. Geology 1962, 500, A1–A20. [Google Scholar] [CrossRef]
- Wagenaar, D.J.; Dahm, R.J.; Diermanse, F.L.M.; Dias, W.P.S.; Dissanayake, D.M.S.S.; Vajja, H.P.; Gehrels, J.C.; Bouwer, L.M. Evaluating adaptation measures for reducing flood risk: A case study in the city of Colombo, Sri Lanka. Int. J. Disaster Risk Reduct. 2019, 37, 101162. [Google Scholar] [CrossRef]
- European Commission. Directive 2007/60/EC on the Assessment and Management of Flood Risks; European Palament: Brussels, Belgium, 2007; Available online: https://eur-lex.europa.eu/eli/dir/2007/60/oj (accessed on 15 January 2022).
- Boso, F.; de Barros, F.P.J.; Fiori, A.; Bellin, A. Performance analysis of statistical spatial measures for contaminant plume characterization toward risk-based decision making. Water Resour. Res. 2013, 49, 3119–3132. [Google Scholar] [CrossRef]
- De Barros, F.P.J.; Bellin, A.; Cvetkovic, V.; Dagan, G.; Fiori, A. Aquifer heterogeneity controls on adverse human health effects and the concept of the hazard attenuation factor. Water Resour. Res. 2016, 52, 5911–5922. [Google Scholar] [CrossRef] [Green Version]
- Enzenhoefer, R.; Nowak, W.; Helmig, R. Probabilistic exposure risk assessment with advective–dispersive well vulnerability criteria. Adv. Water Resour. 2012, 36, 121–132. [Google Scholar] [CrossRef]
- Tartakovsky, D.M.; Dentz, M.; Lichtner, P. Probability density functions for advective-reactive transport with uncertain reaction rates. Water Resour. Res. 2009, 45, W07414. [Google Scholar] [CrossRef]
- Andričević, R.; Galešić, M. Contaminant dilution measure for the solute transport in an estuary. Adv. Water Resour. 2018, 117, 65–74. [Google Scholar] [CrossRef]
- Andričević, R.; Srzić, V.; Gotovac, H. Risk characterization for toxic chemicals transported in aquifers. Adv. Water Resour. 2012, 36, 86–97. [Google Scholar] [CrossRef]
- Di Dato, M.; Galešić, M.; Šimundić, P.; Andričević, R. A novel screening tool for the health risk in recreational waters near estuary: The Carrying Capacity indicator. Sci. Total Environ. 2019, 694, 133584. [Google Scholar] [CrossRef]
- Merz, B.; Kreibich, H.; Schwarze, R.; Thieken, A. Review article assessment of economic flood damage. Nat. Hazards Earth Syst. Sci. 2010, 10, 1697–1724. [Google Scholar] [CrossRef]
- Wagenaar, D.; de Jong, J.; Bouwer, L.M. Multi-variable flood damage modeling with limited data using supervised learning approaches. Nat. Hazards Earth Syst. Sci. 2017, 17, 1683–1696. [Google Scholar] [CrossRef] [Green Version]
- Wagenaar, D.; Lüdtke, S.; Schröter, K.; Bouwer, L.M.; Kreibich, H. Regional and temporal transferability of multivariable flood damage models. Water Resour. Res. 2018, 54, 3688–3703. [Google Scholar] [CrossRef] [Green Version]
- Jonkman, S.N.; Vrijling, J.K.; Vrouwenvelder, A.C.W.M. Methods for the estimation of loss of life due to floods: A literature review and a proposal for a new method. Nat. Hazards 2008, 46, 353–389. [Google Scholar] [CrossRef] [Green Version]
- Olsen, A.; Zhou, Q.; Linde, J.; Arnbjerg-Nielsen, K. Comparing Methods of Calculating Expected Annual Damage in Urban Pluvial Flood Risk Assessments. Water 2015, 7, 255–270. [Google Scholar] [CrossRef] [Green Version]
- Ward, P.J.; van Pelt, S.; de Keizer, O.; Aerts, J.C.J.H.; Beersma, J.; van den Hurk, B.; te Linde, A. Including climate change projections in probabilistic flood risk assessment. J. Flood Risk Manag. 2014, 7, 141–151. [Google Scholar] [CrossRef]
- Dottori, F.; Figueiredo, R.; Martina, M.L.V.; Molinari, D.; Scorzini, A.R. INSYDE: A synthetic, probabilistic flood damage model based on explicit cost analysis. Nat. Hazards Earth Syst. Sci. 2016, 16, 2577–2591. [Google Scholar] [CrossRef] [Green Version]
- Foudi, S.; Osés-Eraso, N.; Tamayo, I. Integrated spatial flood risk assessment: The case of Zaragoza. Land Use Policy 2015, 42, 278–292. [Google Scholar] [CrossRef]
- Wing, O.E.J.; Pinter, N.; Bates, P.D.; Kousky, C. New insights into US flood vulnerability revealed from flood insurance big data. Nat. Commun. 2020, 11, 1444. [Google Scholar] [CrossRef] [Green Version]
- Prahl, B.F.; Rybski, D.; Boettle, M.; Kropp, J.P. Damage functions for climate-related hazards: Unification and uncertainty analysis. Nat. Hazards Earth Syst. Sci. 2016, 16, 1189–1203. [Google Scholar] [CrossRef] [Green Version]
- Boettle, M.; Rybski, D.; Kropp, J.P. How changing sea level extremes and protection measures alter coastal flood damages. Water Resour. Res. 2013, 49, 1199–1210. [Google Scholar] [CrossRef]
- Merz, B.; Hall, J.; Disse, M.; Schumann, A. Fluvial flood risk management in a changing world. Nat. Hazards Earth Syst. Sci. 2010, 10, 509–527. [Google Scholar] [CrossRef] [Green Version]
- Boettle, M.; Kropp, J.P.; Reiber, L.; Roithmeier, O.; Rybski, D.; Walther, C. About the influence of elevation model quality and small-scale damage functions on flood damage estimation. Nat. Hazards Earth Syst. Sci. 2011, 11, 3327–3334. [Google Scholar] [CrossRef]
- Morita, M.; Tung, Y.-K. Uncertainty quantification of flood damage estimation for urban drainage risk management. Water Sci. Technol. 2019, 80, 478–486. [Google Scholar] [CrossRef] [PubMed] [Green Version]
- Hall, J.; Solomatine, D. A framework for uncertainty analysis in flood risk management decisions. Int. J. River Basin Manag. 2008, 2, 85–98. [Google Scholar] [CrossRef] [Green Version]
- De Moel, H.; Aerts, J.C.C.H. Effect of uncertainty in land use, damage models and inundation depth on flood damage estimates. Nat. Hazards 2011, 58, 407–425. [Google Scholar] [CrossRef] [Green Version]
- Azarnivand, A.; Malekian, A. Analysis of flood risk management strategies based on a group decision making process via Interval-valued intuitionistic fuzzy numbers. Water Resour. Manag. 2016, 30, 1903–1921. [Google Scholar] [CrossRef]
- Rojas, R.; Feyen, L.; Watkiss, P. Climate change and river loods in the European Union: Socio-economic consequences and the costs and benefits of adaptation. Glob. Environ. Chang. 2013, 23, 1737–1751. [Google Scholar] [CrossRef]
- Ward, P.J.; de Moel, H.; Aerts, J.C.J.H. How are flood risk estimates affected by the choice of return-periods? Nat. Hazards Earth Syst. Sci. 2011, 11, 3181–3195. [Google Scholar] [CrossRef] [Green Version]
- Merz, B.; Elmer, F.; Thieken, A.H. Significance of high probability/low damage versus low probability/high damage flood events. Nat. Hazards Earth Syst. Sci. 2009, 9, 1033–1046. [Google Scholar] [CrossRef]
- Croatian Meteorological and Hydrological Service. Climate Monitoring. 2019. Available online: https://meteo.hr/ (accessed on 25 October 2020).
- Jurković, R.S. Water balance components during recent floods in Croatia. Croat. Meteorol. J. 2016, 51, 61–70. [Google Scholar]
- Huizinga, J.; de Moel, H.; Szewczyk, W. Global Flood Depth-Damage Functions. Methodology and the Database with Guidelines; EUR 28552 EN; Publications Office of the European Union: Luxembourg, 2017. [Google Scholar]
- Zhou, Q.; Mikkelsen, P.S.; Halsnæs, K.; Arnbjerg-Nielsen, K. Framework for economic pluvial flood risk assessment considering climate change effects and adaptation benefits. J. Hydrol. 2012, 414, 539–549. [Google Scholar] [CrossRef]
- Kekez, T.; Knezić, S.; Andričević, R. Incorporating Uncertainty of the System Behavior in Flood Risk Assessment—Sava River Case Study. Water 2020, 12, 2676. [Google Scholar] [CrossRef]
- Athanasios Papoulis, S. Probability, Random Variables, and Stochastic Processes, 2nd ed.; McGrow-Hill: New York, NY, USA, 1984. [Google Scholar]
- Humphreys, N. Exceedance probability in catastrophic modeling. Casualty Actuar. Soc. E-Forum 2021, 1–61. [Google Scholar]
- Hammond, M.J.; Chen, A.S.; Djordjević, S.; Butler, D.; Mark, O. Urban flood impact assessment: A state-of-the-art review. Urban Water J. 2015, 12, 14–29. [Google Scholar] [CrossRef] [Green Version]
Figure 1.
The wider area of the city of Karlovac and selected agglomeration for the flood risk assessment.
Figure 1.
The wider area of the city of Karlovac and selected agglomeration for the flood risk assessment.

Figure 2.
Observed annual maximum river water depth data (1985–2020) evaluated with the GEV probability distribution for the Karlovac gauging station.
Figure 2.
Observed annual maximum river water depth data (1985–2020) evaluated with the GEV probability distribution for the Karlovac gauging station.

Figure 3.
The selected area of the river Kupa for flood risk assessment.

Figure 4.
(a) The unit-scale damage function based on the estimate in [33] and modeled with Equation (1) and (b) the corresponding agglomeration damage function evaluated with Equation (2) using the selected distribution for flood thresholds for the study area.

Figure 5.
Flood risk curve for the study area (a) and the flood risk indicator CDF (b).

Figure 6.
Exceedance probability—annual agglomeration relative damage for households and inventory.

Figure 7.
Uncertainty in the shape parameter k displayed (a) for the unit damage function and (b) for the agglomeration damage functions.
Figure 7.
Uncertainty in the shape parameter k displayed (a) for the unit damage function and (b) for the agglomeration damage functions.

Figure 8.
Exceedance probability—annual damage distributions resulting from uncertainty in the shape parameter k for households and inventory.
Figure 8.
Exceedance probability—annual damage distributions resulting from uncertainty in the shape parameter k for households and inventory.


Table 1.
Estimated total damage of households and inventory at the study area.
| Type of Asset | Quantity at Risk | Unit Value | Total Damage |
|---|---|---|---|
| Households and inventory | households footprint area 34,000 m | 507 €/m | 17.238 € |
Table 2.
First four statistical moments of the annual damage distribution for the study area.
| EAD | Standard Deviation | Skewness | Kurtosis |
|---|---|---|---|
| 0.074 | 0.1 | 1.75 | 5.55 |
Table 3.
Exceedance probability and expected loss for several flood return periods.
| Flood Event (Years) | Annual Probability of Occurrence [] | Annual Relative Damage | Monetary Loss () € | Expected Monetary Loss [] | Exceedance Probability % |
|---|---|---|---|---|---|
| 10 | 0.1 | 0.23 | 3.96 | 0.396 | 8.7 |
| 25 | 0.04 | 0.33 | 5.7 | 0.22 | 4 |
| 50 | 0.02 | 0.39 | 6.7 | 0.13 | 2.8 |
| 100 | 0.01 | 0.43 | 7.4 | 0.074 | 2 |
| 500 | 0.002 | 0.49 | 8.4 | 0.017 | 1.4 |
| 1000 | 0.001 | 0.51 | 7.24 | 0.00724 | 0.97 |
Publisher’s Note: MDPI stays neutral with regard to jurisdictional claims in published maps and institutional affiliations. |
© 2022 by the authors. Licensee MDPI, Basel, Switzerland. This article is an open access article distributed under the terms and conditions of the Creative Commons Attribution (CC BY) license (https://creativecommons.org/licenses/by/4.0/).
Share and Cite
MDPI and ACS Style
Kekez, T.; Andricevic, R.; Knezic, S. Flood Risk Modeling under Uncertainties: The Case Study of Croatia. Water 2022, 14, 1585. https://0-doi-org.brum.beds.ac.uk/10.3390/w14101585
AMA Style
Kekez T, Andricevic R, Knezic S. Flood Risk Modeling under Uncertainties: The Case Study of Croatia. Water. 2022; 14(10):1585. https://0-doi-org.brum.beds.ac.uk/10.3390/w14101585
Chicago/Turabian StyleKekez, Toni, Roko Andricevic, and Snjezana Knezic. 2022. "Flood Risk Modeling under Uncertainties: The Case Study of Croatia" Water 14, no. 10: 1585. https://0-doi-org.brum.beds.ac.uk/10.3390/w14101585
Note that from the first issue of 2016, this journal uses article numbers instead of page numbers. See further details here.