Article

Potential for Natural Attenuation of Domestic and Agricultural Pollution in Karst Groundwater Environments

1
Emil Racoviță Institute of Speleology, 400006 Cluj-Napoca, Romania
2
Romanian Institute of Science and Technology, 400022 Cluj-Napoca, Romania
3
Leibniz Institute for Freshwater Ecology and Inland Fisheries, IGB, Dep 3, Plankton and Microbial Ecology, 16775 Stechlin, Germany
4
Institute of Biological Research, 400015 Cluj-Napoca, Romania
5
Department of Aquatic Microbial Ecology, Institute of Hydrobiology, Biology Centre of the Academy of Sciences of the Czech Republic, 37005 České Budějovice, Czech Republic
6
Faculty of Environmental Science and Engineering, Babes-Bolyai University, 400294 Cluj-Napoca, Romania
7
Someş-Tisa River Basin Administration, 400213 Cluj-Napoca, Romania
8
Emil Racoviţă Institute of Speleology, Center for Geochronology and Paleoclimate, 010986 Bucharest, Romania
*
Authors to whom correspondence should be addressed.
These authors contributed equally to this work.
Submission received: 31 March 2022 / Revised: 27 April 2022 / Accepted: 11 May 2022 / Published: 16 May 2022
(This article belongs to the Special Issue Research on Karst Eco-Hydrology and Sediment)

Abstract

:
In karst areas, anthropogenic contaminants reach the subsurface with detrimental effects on the groundwater ecosystem and downstream springs, which often serve as drinking water sources for the local human communities. We analyzed the water chemistry and microbial community composition in upstream and downstream locations of five hydrokarst systems (HKS) during four seasons. Conductivity and nitrates were higher in the downstream springs than in the pre-karst waters, whereas the concentration of organic matter, considered here as a pollution indicator, was lower. The microbial community composition varied largely between upstream and downstream locations, with multiple species of potentially pathogenic bacteria decreasing in the HKS. Bacteria indicative of pollution decreased as well when passing through the HKS, but potential biodegraders increased. This suggests that the HKS can filter out part of the polluting organic matter and, with it, part of the associated microorganisms. Nevertheless, the water quality, including the presence of pathogens in downstream springs, must be further monitored to control whether the water is appropriate for consumption. In parallel, the human populations located upstream must be advised of the risks resulting from their daily activities, improper stocking of their various wastes and dumping of their refuse in surface streams.

1. Introduction

Pollution is intensifying with increasing human presence and density. In rural and remote areas, the local communities are sometimes persuaded by governmental measures and subsidies not to leave their households in favor of cities and continue living on the basis of the few activities they can perform, such as agriculture and livestock farming. Unfortunately, in most of these areas, public water supply and wastewater treatment facilities are absent. Therefore, the local communities use natural sources, such as springs and wells, for their drinking water supply, and discard their wastes directly into the environment. In karst areas, the above soil layers are usually not very thick, and the limestone bedrock is heavily fractured or crossed by caves of various sizes. Thus, wastes stored in leaking septic tanks, manure deposits, or various household refuse that are dumped directly and intentionally into surface streams ultimately reach the subsurface. The same happens with all fertilizers and other agrochemicals [1] that are dissolved and mobilized by meteoric water into the subsurface. Here, the contaminating wastes travel underground gravitationally with the groundwater flow towards downstream locations, where they emerge back at the surface in the form of springs. The water may reside underground for a shorter or longer period depending on the slope, the length of the subterranean course, discharge of the main stream, and subsurface tributaries. In some cases, the water may be captured underground in large karst reservoirs. Eventually, the emerging springs are often used by local communities as drinking water sources. These springs, contaminated from the above anthropogenic activity, represent an important threat to human health.
The aim of this study was to investigate the fate of contaminants passing through karst systems and to compare the microbial communities from upstream locations, before the streams enter underground, to those in downstream springs. Despite the potential hazard introduced by the upstream water, human populations located downstream have not reported excessive health issues related to water quality. Therefore, we hypothesized that (I) at least part of the contaminants is retained underground by various means, such as dilution with cleaner water provided by underground tributaries, sorption to sediment particles or decantation to the bottom of larger karst reservoirs; and (II) microorganisms that enter the HKS upstream together with polluted water are partially retained underground and thus contribute to continuous degradation of organic contaminants.
In a previous pilot study [2] based on single timepoint samplings, we observed a decrease in the concentration of most chemical compounds from upstream to downstream locations in ten HKS alongside a decrease in microbial diversity. For the present study, we sampled the five most representative HKS seasonally for one year. We performed in situ physico-chemical measurements and collected parallel samples for chemical and microbial community analysis.

2. Materials and Methods

Upstream and downstream locations in five hydrokarst systems (HKS) were sampled four times in different seasons during one year. The upstream locations (also called ‘ponors’) are places in the HKS where a surface river (or smaller stream) enters underground after it passes through areas with different human activities (Figure 1). These waters then pass through the limestone massif and emerge in karst springs, the downstream locations in our study.
Three HKS (I, II and III) were located in the Pădurea Craiului Mountains and two HKS (IV and V) in the Bihor Mountains (NW Romania). The physical characteristics, such as the length of the HKS, residence time of water underground, altitudinal difference between ponors and springs, as well as information on the presence of underground tributaries, are summarized in Table 1. For each HKS, a surface stream passed through areas where the residents carried out various activities, such as agriculture, cattle farming, or the usual household-related necessities. In all cases, there was no sewer system meant to collect all wastewater and eventually direct it towards a treatment plant. As a consequence, all wastes were deposited in septic tanks, usually improper and leaking, or directly discarded into the environment. Additionally, leachates originating from manure deposits and agricultural fields either percolate to the underground, or were washed by nearby surface streams and transported towards the ponors, where they entered the HKS.
Chemical characterization. With every sampling event, we measured the physico-chemical parameters in situ using a Hanna Multiparameter HI9829 (Hanna Instruments Inc., Woonsocket, RI, USA) and we sampled water for chemical and microbiological analysis. For determining the water chemistry, samples for ion analysis were collected in 250 mL pre-cleaned polyethylene bottles. The samples were filtered in the field by using a syringe and 0.45 µm MilliporeTM filters, and then transported in cool boxes to the laboratory, where they were stored at 4 °C in a refrigerator and processed within 48 h. The samples were diluted with ultrapure water (18 MΩ·cm) and leveled to an electrical conductivity of about 100 µS cm−1. A Dionex 1500 IC ion chromatography system was used for the dissolved ions analysis (F, Cl, NO3, SO42−, Li+, Na+, K+, NH4+, Mg2+, and Ca2+). The IC system was equipped with IonPac AS23 and CS12A columns (4 × 250 mm), IonPac A23G and CG12A pre-columns (4 × 50 mm) and a self-regenerating suppressor (ASRS ultra II, 4 mm, with a suppressor current of 25 mA/CSRS ultra II, 4 mm, with a suppressor current of 59 mA). After the eluent and sample ions leave the suppressor, they flow through a conductivity detector (microprocessor-controlled digital signal processor type) and a flow cell. The detector has a range of 0 to 15,000 µS (digital output), a temperature compensation of 1.7% per °C, a cell drive of 8 kH square wave, a linearity correlation >0.999 and %RSD < 5% to 800 µS. The conductivity cell consists of passivated 316 stainless steel electrodes, with an active volume of 1.0 µL, an operating temperature of 30 to 55 °C and a maximum pressure of 2 MPa (300 psi). For both anion and cation analysis, the detector was set at a data rate of 5.0 Hz with an operating temperature for the conductivity cell of 35 °C. The eluents used were 4.5 mM Na2CO3/0.8 mM NaHCO3 (for anions) and 20 mM methanesulfonic acid (99.0%) (for cations) at a flow rate of 1 mL/min. The quantifications were based on the external standard method using calibration curves plotted for six standard solutions prepared by serial dilution of the stock solutions: Dionex™ Combined Seven Anion Standard II/057590 and Dionex™ Combined Six Cation Standard-II/046070. The method had a good linearity (R2 > 0.999) and low detection limits. The limits of detection (LOD) were: 10.3 µg/L (Li+), 12.2 µg/L (Na+), 11.9 µg/L (NH4+), 12.7 µg/L (K+), 11.8 µg/L (Mg2+), 17.1 µg/L (Ca2+), 10.1 µg/L (F), 21.2 µg/L (Cl), 12.0 µg/L (NO3), 15.8 (PO43−), and 12.7 µg/L (SO42−). The organic matter concentration, used as a proxy for pollution, was determined as chemical oxygen demand (COD) and it was analyzed volumetrically by the Small-Scale Tube Dichromate method (ISO 15705:2002).
Microbial community composition. The microbial communities were determined for all five systems from both upstream and downstream locations during four seasons using 16S rRNA-based metabarcoding techniques. DNA was extracted from the water samples using the ZR Soil Microbe DNA kit (Zymo Research, Irvine, CA, USA) according to the manufacturer’s instructions. The V3-V4 regions of the 16S rRNA were sequenced by a commercial company (Macrogen, The Netherlands) using MiSeq Reagent Kit v3 Illumina, the Nextera XT Index Kit for library preparation and an Illumina MiSeq platform. The 341F (5′-CCTACGGGNGGCWGCAG-3′) and 805R (5′-GACTACHVGGGTATCTAATCC-3′) PCR primers were used in the PCR reaction for amplifying the hypervariable regions following the protocol: 95 °C for 3 min, 25 cycles of 95 °C for 30 s, 55 °C for 30 s, 72 °C for 30 s and 72 °C for 5 min.
The paired-end reads were than quality trimmed, merged and analyzed for chimeras using DADA2 [4]. The resulting amplicon-sequence variants were annotated using the classify option of the SINA aligner V 1.7 [5] using the SILVA NR V138.1 [6] database as a reference.
Statistical methods. Alpha diversity indices were calculated from the ASV tables as Hill numbers of order 1 and 2, and therefore, the sequence data was not rarefied [7]. Additionally, we have calculated Pielou’s evenness. Diversity calculations were performed using the Primer6 (V 6.1.1) + Permanova Package (V 1.0.1, Primer-E, Quest Research Limited, Auckland, New Zealand). Due to variability between sites and time points for the measured physicochemical parameters as well as the diversity measures, comparisons were made between the out/in ratio of each parameter per site per time point. To check whether parameters or community composition changed significantly between upstream and downstream sites, the data to be tested was normalized between 0 and 1 per site per time point. Subsequently, significance was tested for each parameter between all upstream and all downstream samples using Mann–Whitney and Dunn’s tests. For water chemistry where the parameters were in the same range, no normalization was carried out and the t-test was used to compare all upstream to all downstream samples.
The explanatory power of the physico-chemical parameters on microbial community structure was tested using distance-based linear models with redundancy analysis (DBLM-RDA, [8]). Due to missing values in multiple parameters, this analysis was conducted on a subset of 24 samples (out of 38), and chemical oxygen demand was removed from the analysis as well, due to missing data in samples other than those already removed. Due to autocorrelation between electrical conductivity, salinity and total dissolved solids, electrical conductivity was used for the analysis.
Data availability. Raw sequencing reads were deposited in the European Nucleotide Archive (ENA) under the project number PRJEB51648.

3. Results

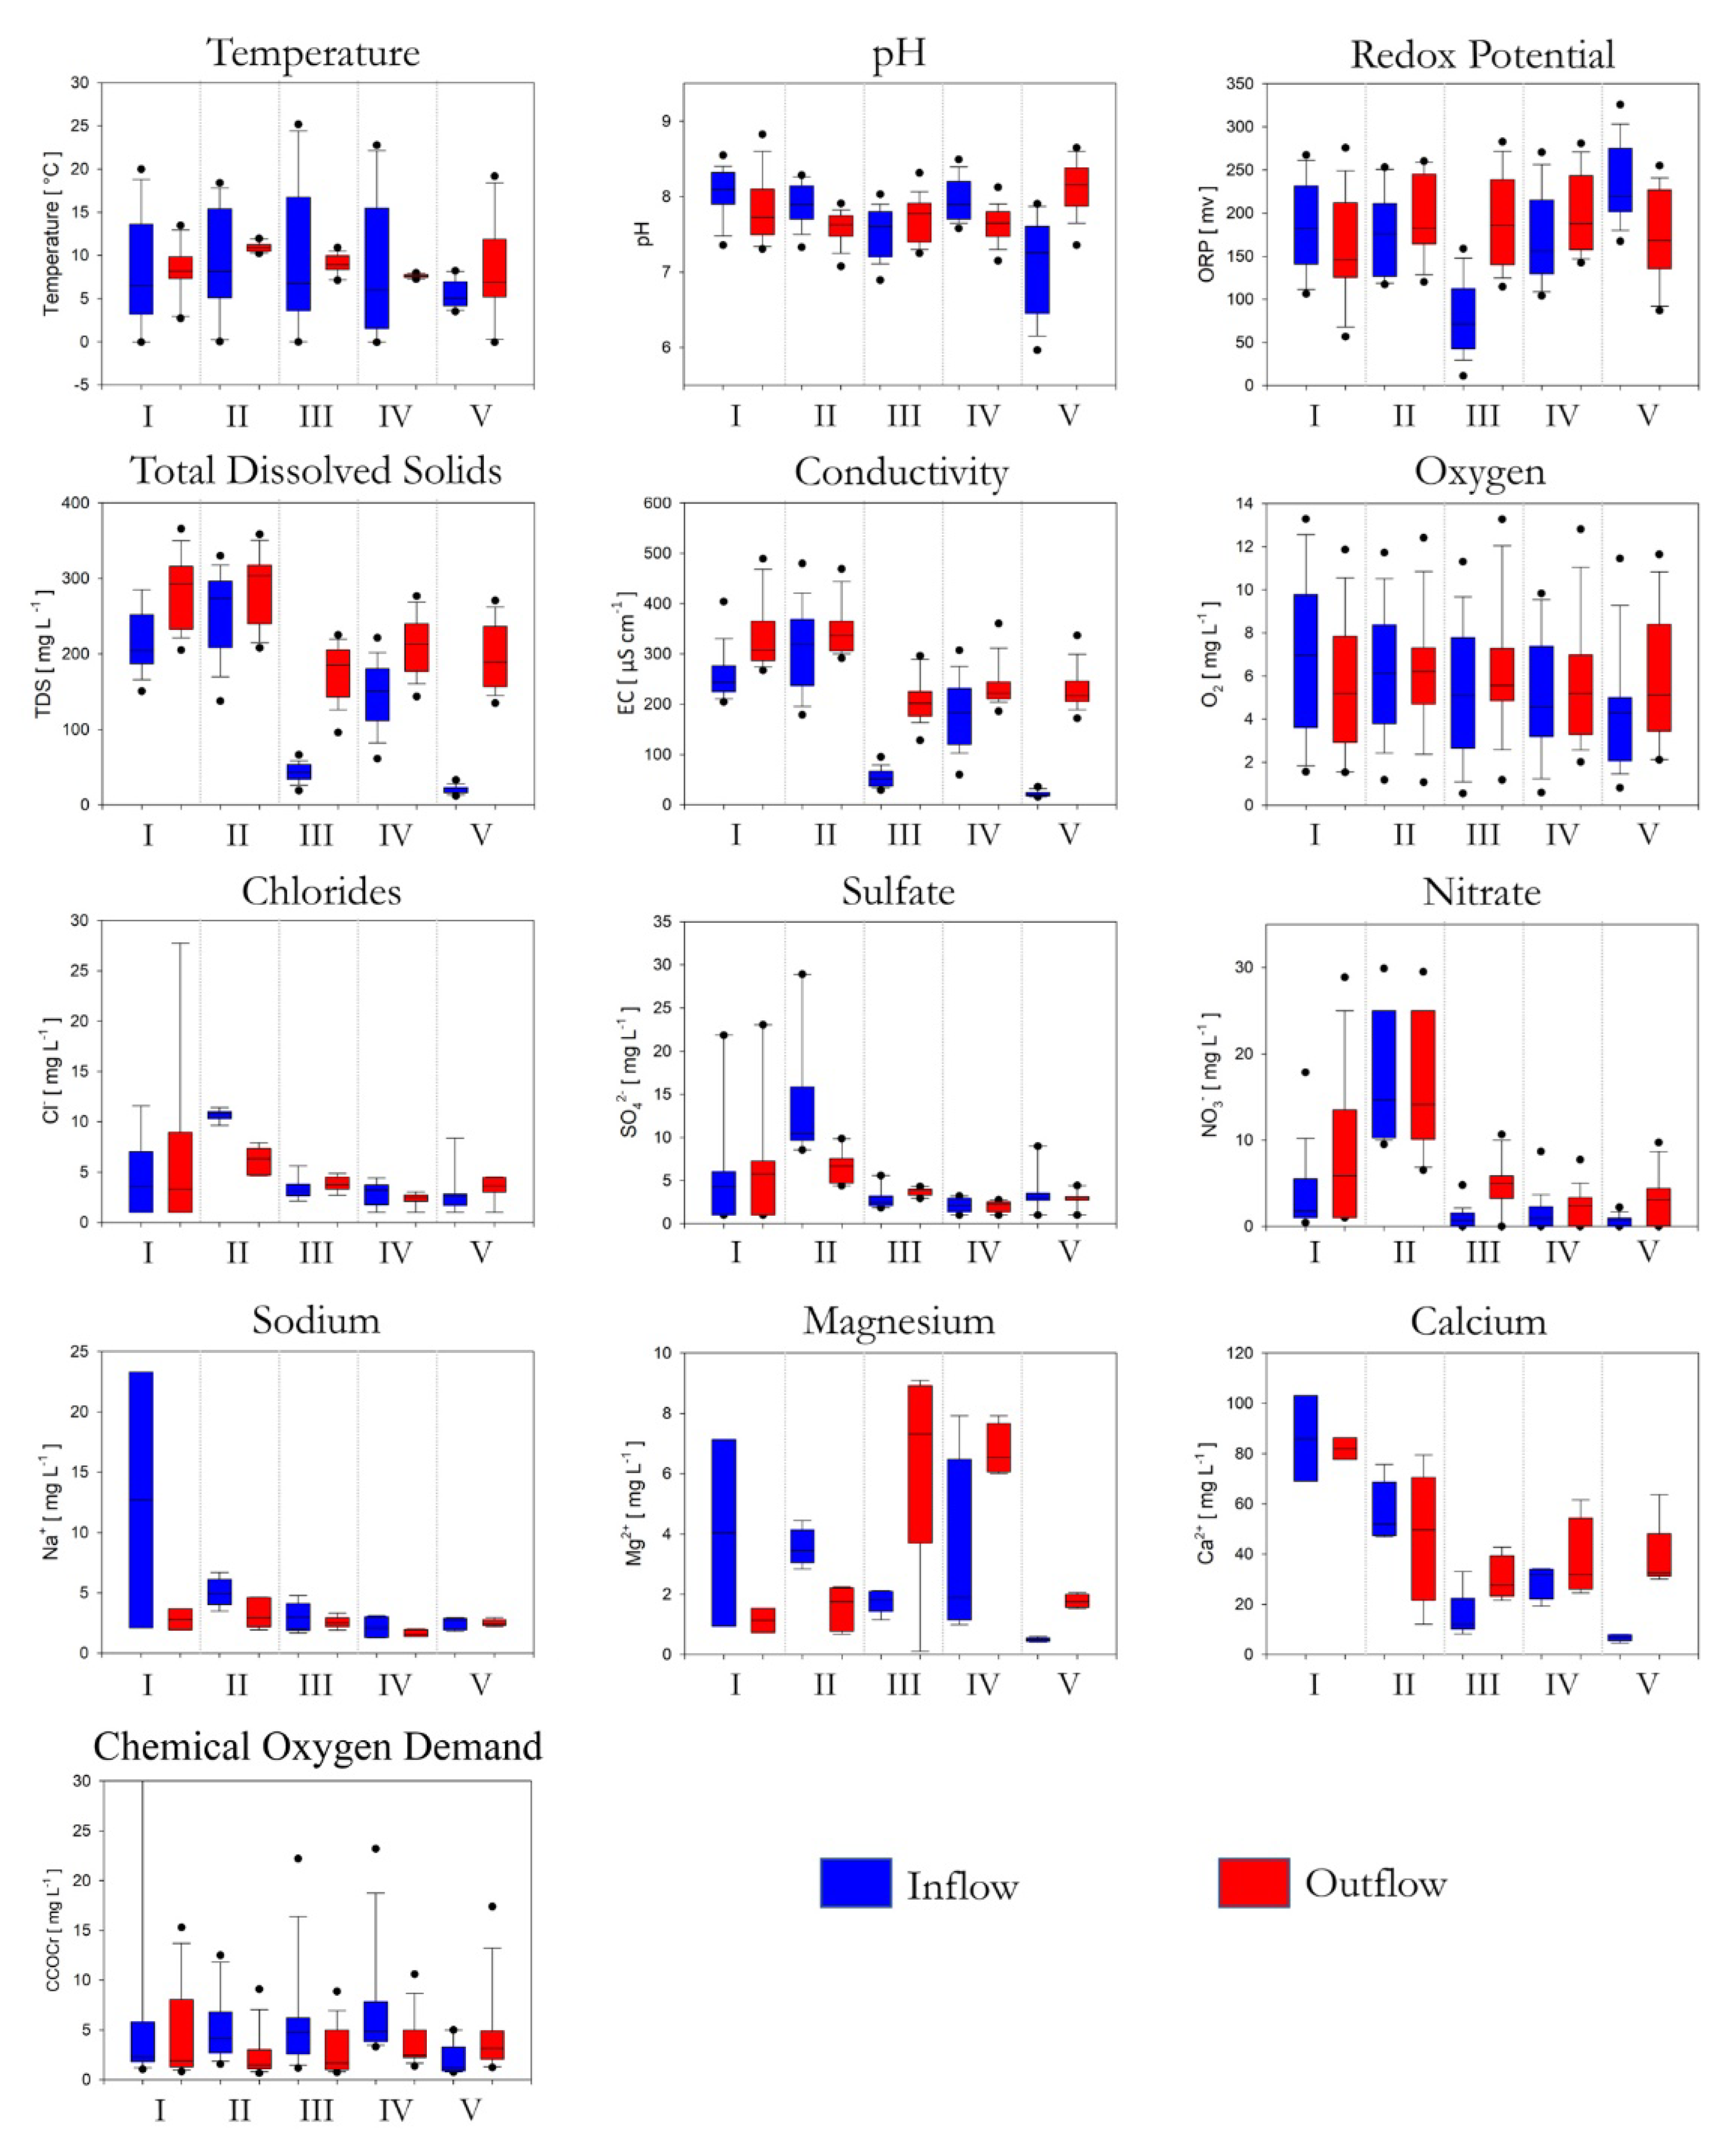
3.1. Environmental Characteristics

Temperature measurements revealed that for sites I-IV, the downstream temperature was relatively constant, regardless of the upstream water temperature. However, the downstream temperature was not fixed between sites, with averages ranging between 7 °C and 12 °C. The pH values were higher in upstream samples for HKS I, II and IV, and higher in downstream samples for HKS III and V. The total dissolved solids (TDS, t = −16.49, p < 0.001) and electrical conductivity (EC, t = −14.35, p < 0.001) values were higher in all downstream locations compared to those measured in samples collected from upstream locations (Figure 2). The mean TDS values were 134.64 ± 104.4 ppm for samples collected upstream and 227.25 ± 62.85 ppm for downstream samples. The EC values were 166.08 ± 135.54 µS cm−1 upstream and 270.19 ± 77.15 µS cm−1 downstream. There were also changes in the salinity and resistivity values measured in situ at upstream and downstream locations in the five prospected HKS. The salinity values increased (t = −8.29, p < 0.001) along the subterranean water course, whereas the resistivity (an inverse measure of water electrical conductivity) decreased (t = 4.933, p < 0.001). Upstream, the mean salinity value was 0.116 ± 0.102 mg/L, whereas downstream this value was 0.188 ± 0.051 mg/L.
The mean water resistivity values were 0.012 ± 0.015 mΩ·cm upstream and 0.003 ± 0.003 mΩ·cm downstream of the prospected HKS. All sites had a higher concentration of total dissolved solids downstream, but the measurements for individual ions exhibited mixed trends. Accordingly, Ca and Mg were always higher downstream in sites III, IV, and V when compared to upstream, and vice versa for sites I and II. Similarly mixed trends were seen for the oxidation-reduction potentials (Figure 2), with sites II, III, and IV having a higher redox potential downstream as compared to upstream. Interestingly, these trends in redox potential were not fully in line with the observed changes for oxygen concentration, since sites III, IV, and V had higher concentrations downstream.
The nitrate concentration (Figure 2) in downstream samples (7.02 ± 7.43 mg/L) was significantly higher (t = −4.209, p < 0.001) compared to the nitrate concentration in samples collected from locations upstream in the selected hydrokarst systems (4.87 ± 7.42 mg/L). On the contrary, the organic matter (Figure 2), estimated here as chemical oxygen demand (COD), was lower downstream for all but site V. The concentration values for chlorides remained relatively unchanged (t = 0.42, p = 0.677) over the subterranean course of water through the five prospected HKS (Figure 2). The mean chlorides concentration was 5.55 ± 3.56 mg/L in upstream samples and 5.19 ± 4.62 mg/L in samples collected from downstream locations. A slight decrease in sulfates concentration (Figure 2) was noted between upstream (6.41 ± 6.37 mg/L) and downstream (4.89 ± 3.95 mg/L) locations. Sodium concentration (Figure 2) decreased (t = 2.226, p = 0.037) from upstream (3.136 ± 1.416 mg/L) to downstream (2.574 ± 0.864 mg/L) locations.
A PERMANOVA analysis conducted to test whether the time of sampling or site could account for the variation in physico-chemical parameters revealed that the latter independently accounted for less than 2% of the variability between sites.

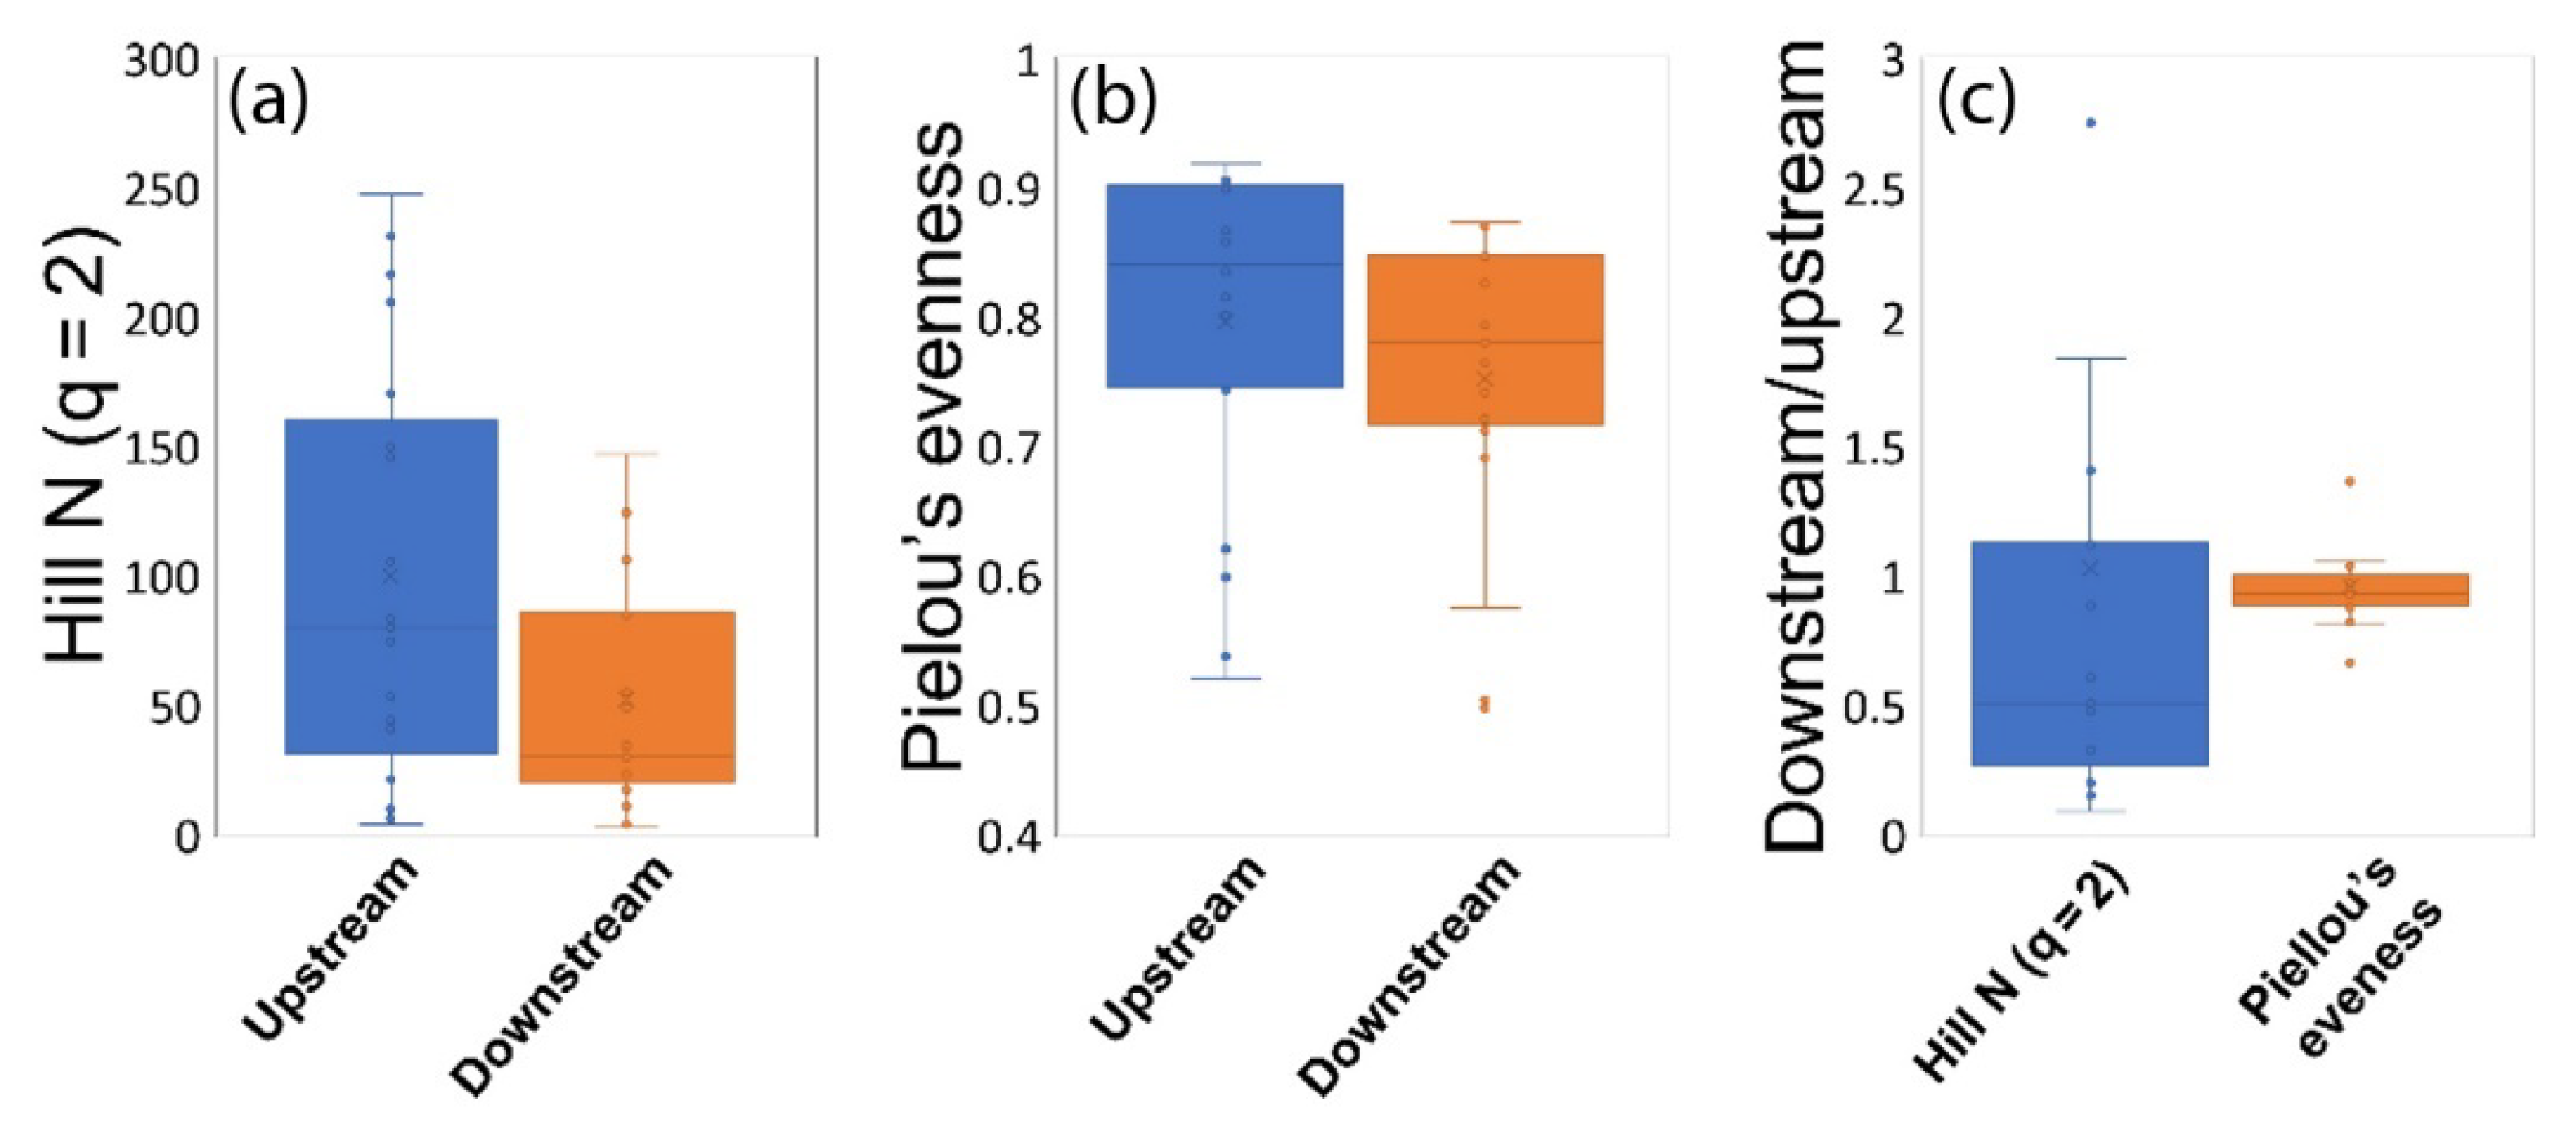
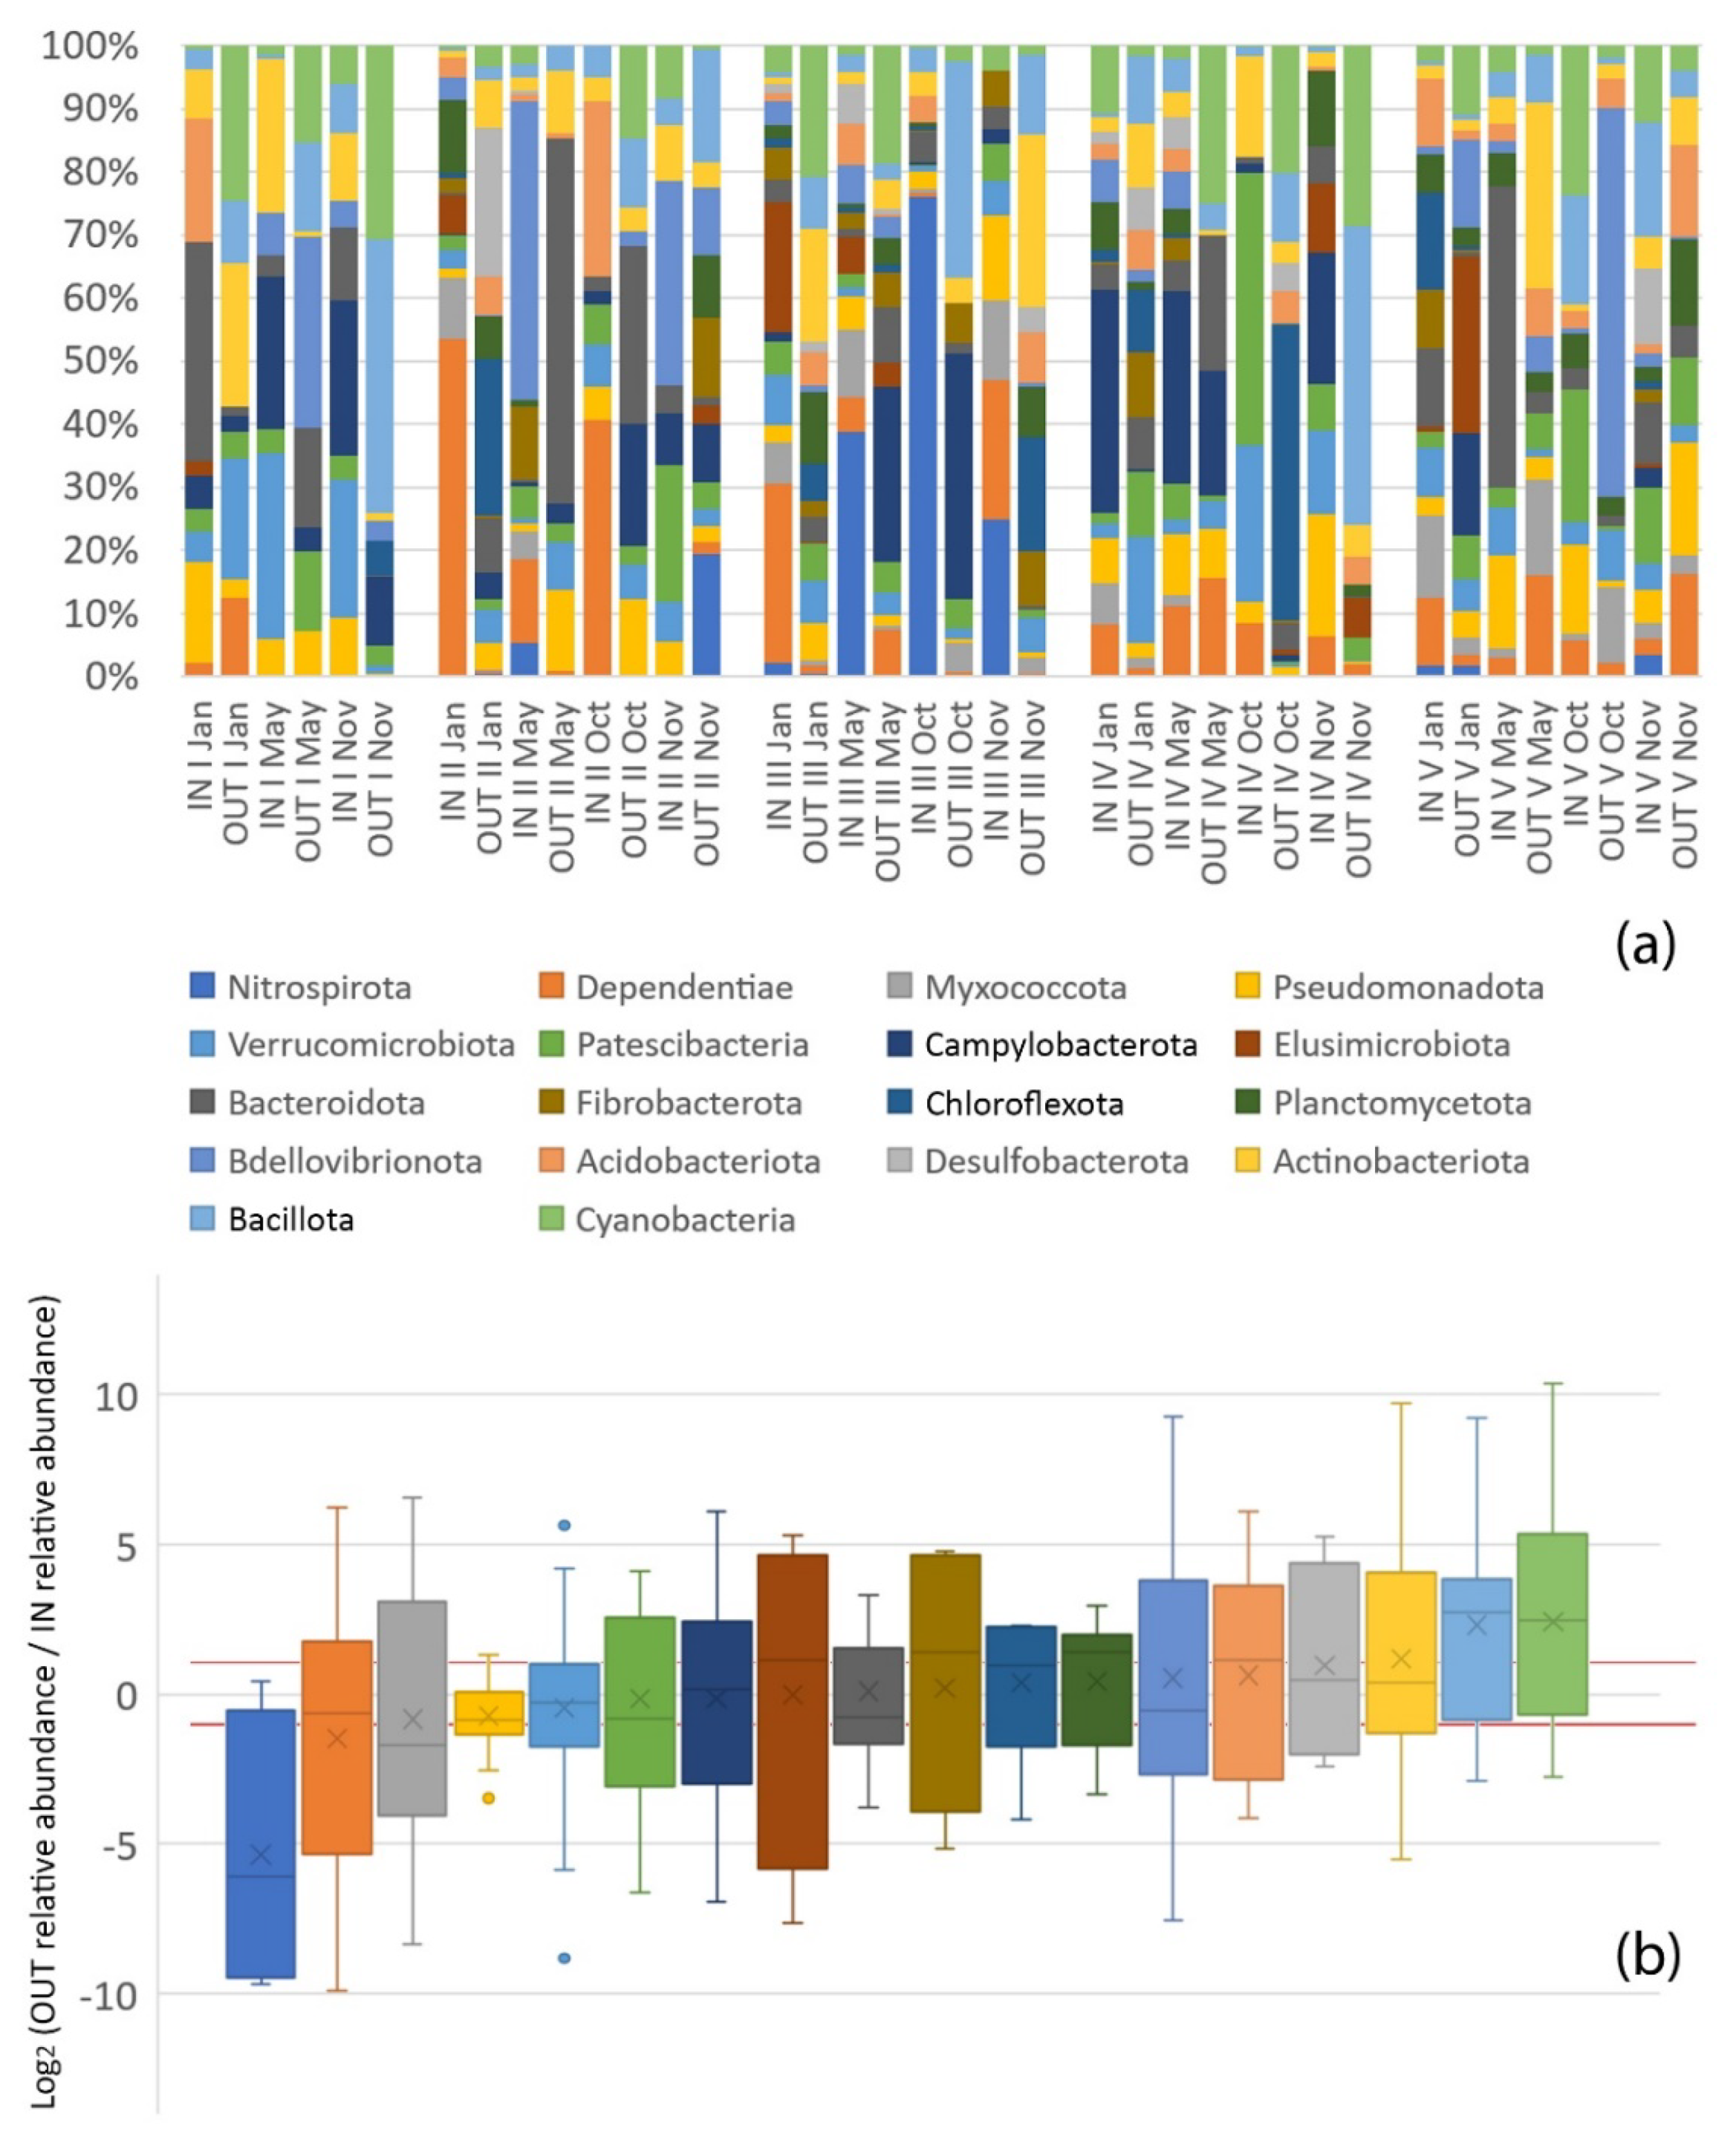
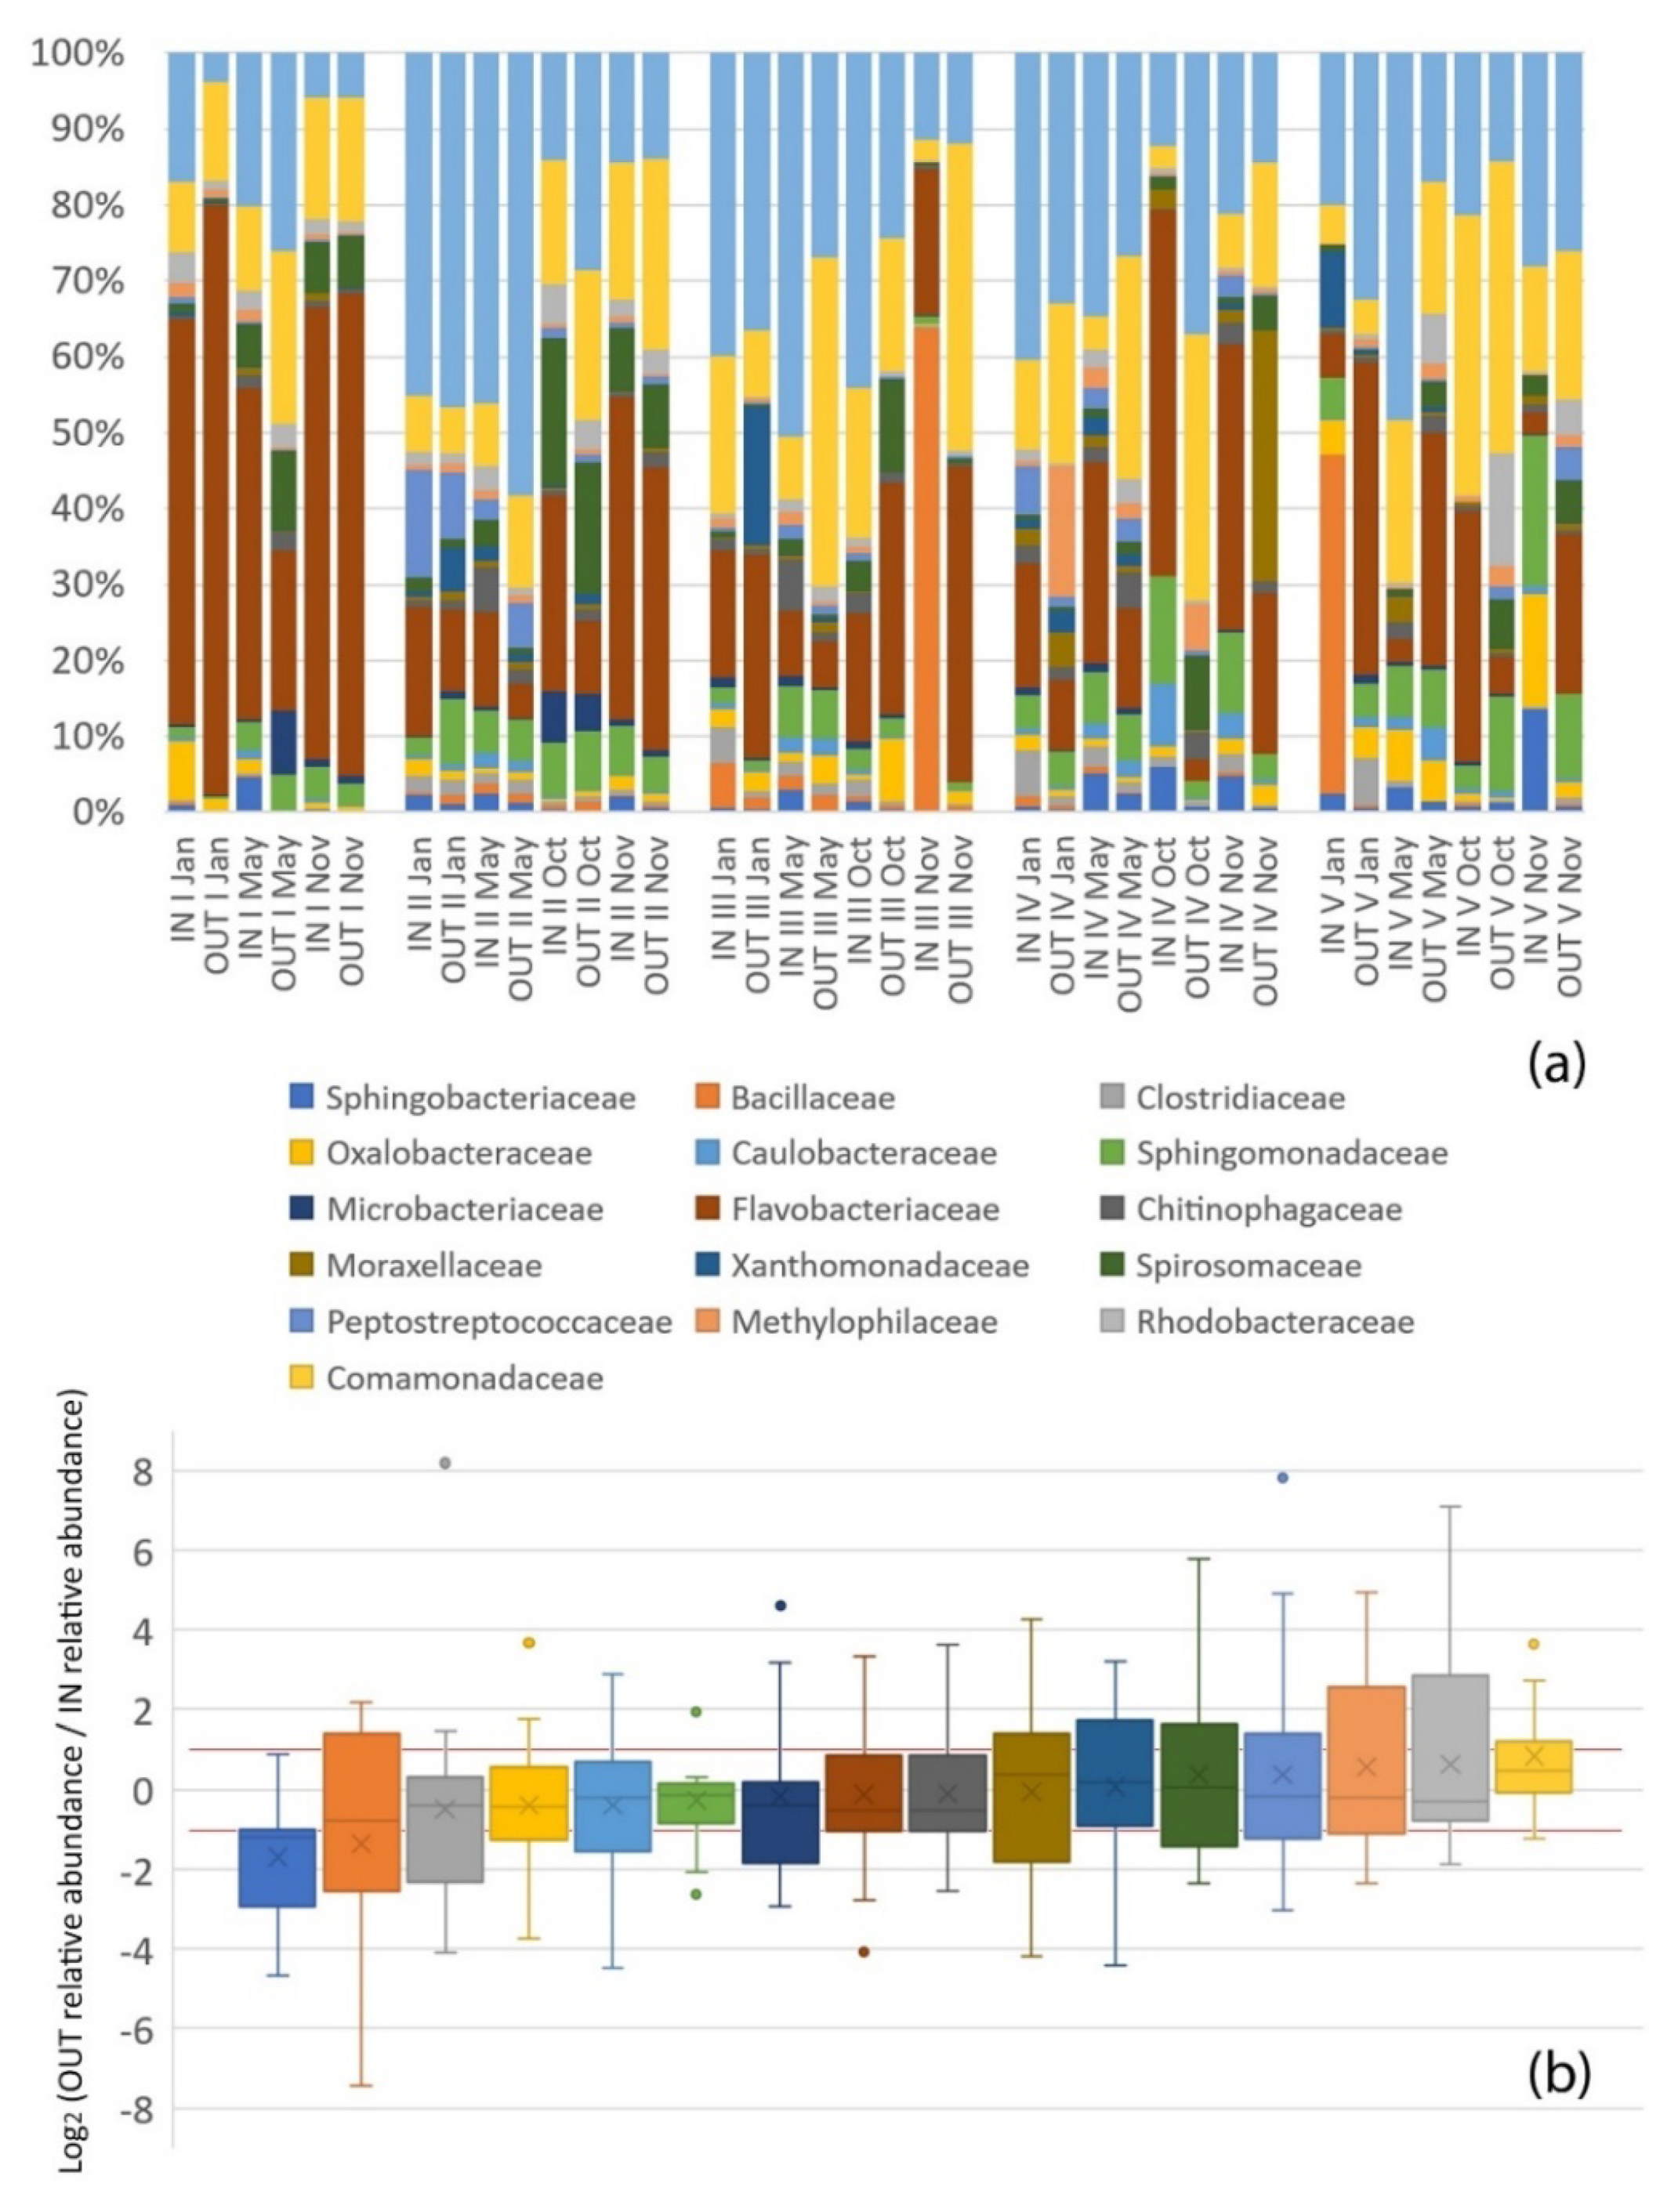
3.2. Microbial Diversity and Community Structure

Our analysis resulted in ca 1.1 million reads separated into >12,800 bacterial amplicon sequence variants across 36 samples (Table S1). Of these, the taxa of particular interest are summarized in Table 2 (and Table S3 in the Supplementary Materials). Alpha diversity measures (effective species numbers (Hill numbers) with q = 1 and q = 2; Table S2) revealed a high variability between sites (Figure 3a) with a general decrease in diversity in downstream samples (Figure 3b). A similar trend was observed for evenness (Figure 3a,b) but with a smaller change between upstream and downstream sites.
Distance-based linear models revealed that water chemistry could account for up to 39% of the variation in microbial community structure. Individual and sequential tests revealed that out of the tested parameters (electrical conductivity, NO3, redox potential, O2, pH, resistivity, and temperature), redox potential, resistivity, and temperature did not contribute significantly to the microbial community structure.
The microbial community sampled from the end points of the five hydrokarst systems (HKS) monitored during this study was diverse and varied largely from one HKS to another, and from upstream to downstream locations. The obtained sequences belonged to 49 Bacteria phyla, of which 18 were more abundant, each making up more than 1% of the total community in at least one sample. Though not fully incorporated into the SILVA database, we adopted the new phyla taxonomy recently validated and accepted into the bacterial code of nomenclature [9].
The most abundant phyla belonged to the Pseudomonadota (formerly Proteobacteria), Bacteroidota and Bacillota (formerly Firmicutes) (Figure 4a). Bacteroidota and Pseudomonadota had a similar relative abundance in upstream samples (37 ± 18% and 36 ± 13%, respectively), yet Pseudomonadota were more abundant in downstream samples (47 ± 14% vs. 35 ± 18%). This increase in relative abundance in downstream samples could be attributed to the class Gammaproteobacteria. In contrast, Bacillota were more abundant upstream (13 ± 17%) than downstream (5 ± 4%).
The change in abundance of the different phyla was evaluated between downstream and upstream samples from the same system at individual timepoints, thus accounting for the variation in relative abundance (Figure 4b). Differences between upstream and downstream were noted for all phyla, yet only a few exhibited a significant systematic increases or decrease: Bacillota (p = 0.0018), Pseudomonadota (p = 0.004), Nitrospirota (p = 0.017), and Desulfobacterota (p = 0.033).
To evaluate whether significant changes in the relative abundance of bacteria could be observed at a higher taxonomic resolution, we conducted a similar analysis at the family level (Figure 5). Out of 16 families with an average relative abundance above 1%, 3 showed significant changes between upstream and downstream samples: Comamonadaceae (p = 0.0018), Clostridiaceae (p = 0.04), and Sphingobacteriaceae (p = 0.000).
Finally, we investigated whether significant changes occurred in the abundance of specific taxa obtained from grouping ASVs with the same taxonomy, or of strains (ASVs). Out of 260 taxa that occurred over 1% in at least 1 sample, 56 were significantly different between upstream and downstream locations across all samples (Figure 6, Table 2). Out of the ca. 12,000 ASVs obtained, 241 occurred in 1% of at least 1 sample, of which 86 appeared in half of the sample pairs (10 of 19). Of these, 42 were found to significantly change in relative abundance (i.e., decrease or increase) between upstream and downstream samples (Figure S1). These taxa include potential biodegraders, such as members of Sphingomonas, Flavobacterium, and Limnohabitans; pathogens, such as species belonging to Clostridium, Micrococcaceae, Massilia, and Rickettsiella; and taxa generally known as indicators of pollution, such as species belonging to Romboutsia, Rhodoferax, and Undibacterium (Figure S1).

4. Discussion

In populated karst areas, pollution of subsurface environments is an apparent phenomenon. In the absence of a sewage system, the wastewater is discarded directly into the environment (e.g., in nearby ditches or streams) and it ultimately reaches the subsurface carried by sinking surface streams or diffusely by percolation. The pollution travels then underground with the groundwater flow and eventually emerges downstream in springs, which are used by the local communities as drinking water sources. The fate of contaminants and their subterranean course is not known, but the springs located downstream of pollution sources can represent a hazard to the health of the human communities consuming this water directly. In this study, we characterized the changes that occur in the chemistry and microbial community structure of samples obtained from places where surface water infiltrates underground and arrives at downstream springs in five hydrokarst systems (HKS) located in two karst areas in NW Romania.

4.1. Water Chemistry

We observed that the water that appears in karst springs downstream of the prospected HKS had a different chemical composition compared to that sampled from its upstream locations. In comparison to other settings, where electrical conductivity (EC) is regarded as a measure of pollution with landfill leachate [10], the increase in EC values for the water passaging through the HKS is most likely due to the dissolution of calcium carbonate rock. Here, the water becomes richer in various salts and other compounds that dissolve during underground passage. Increasing EC values can also be due to, for example, nitrogen fertilizers applied to crops [11] or groundwater pollution with wastes originating from pig farms [12]. In our study, the increase in Ca and Mg concentrations in the downstream springs supports this idea. The salts containing Ca and Mg are present in calcareous rocks (i.e., limestone and dolomites) and they are soluble in water, hence the process of karstification and the formation of caves and other underground voids.
The aeration of water may be beneficial for biodegradation of organic materials polluting the water. The more oxygen dissolved in the water, the higher the oxidation-reduction potential (ORP), and a possibly greater chance for organic pollution to become biodegraded. In this study, an increase of oxygen concentration that correlated well with an increase in ORP values was noted in the springs after the underground passage of water. In locations downstream of the HKS, the estimated values for organic matter concentration were lower in comparison to those obtained from the upstream sites. An inverse connection between the decrease in organic matter concentration and the increase in the concentration of nitrates was also noted. This may indicate that the organic matter is retained underground, and when subsequently degraded, the resulting NH4 sustains a community of nitrifiers. Nitrification can be an indication of the potential for natural attenuation in the selected karst environment. The organic matter may thus remain underground. Higher nitrate concentration may also be related to a larger relative abundance of nitrifying microorganisms in the downstream samples. Thus, the organic matter (regarded here as pollution) may firstly be filtered through the karst pores of various sizes, where it may decant down to the bottom of karst aquifers and attach to sediment particles or other substrates to be ultimately degraded by microorganisms. Sulfates are indicators of pollution from the surface originating from human activities such as spills in the environment of various household-related chemicals containing sulfur compounds or the application to crops of fertilizers containing sulfates [13,14]. Sodium-containing compounds originate either naturally in rocks and soils or they may be present in sewage effluents or leach from manure deposits or landfills. Thus, sodium can also be regarded here as an indication of anthropogenic pollution [15].
Dilution with cleaner groundwater provided by the underground HKS tributaries can also be an important factor contributing to the reduction of the mass and concentration of pollution. The concentration of several chemical compounds decreased between the upstream to downstream locations, but the concentration of other compounds increased at the downstream sites. When dilution is the main factor contributing to a decrease in pollution levels, then a decrease in the concentration values of all measured chemical parameters is expected. Moreover, there were no changes in the concentration of chlorides between the upstream and downstream locations. The chlorides are sometimes used as non-degradable tracers [10,16], and therefore, dilution, as factor contributing to the reduction in the concentration of various compounds, can be excluded. The changes in the concentration of nitrates and organic matter in the subsurface course of water are most probably due to chemical and biological transformations in these environments.

4.2. Microbial Community Structure

The microbial communities in the five HKS systems examined during this study were complex and varied significantly between sites, and while water chemistry accounted for a significant portion of the microbial community structure (39%), we suggest this reflects overall differences between sites, rather than the selection of certain taxa due to the physico-chemical parameters of the water.
Differences in the microbial community structure were observed between upstream and downstream locations. The microbial diversity, as expressed by the effective species numbers, was lower in samples obtained from downstream locations, in agreement with previous preliminary data [2]. This was accompanied by a decrease in evenness, and it suggests the substitution of some of the entering taxa by more specialized bacterial population with higher abundance in the subsurface. The microbial community in samples obtained from the endpoints of the five prospected hydrokarst systems was divided into several groups of microorganisms on basis of their known physiological properties. We addressed the microbial community according to the following main functional groups: (I) pollutant-degrading microorganisms, (II) pollution indicators, and (III) pathogenic bacteria. In principle, all microorganisms with more than 1% presence in all analyzed samples were considered. All information regarding the presence of these microorganisms with a comparison between the change in upstream and downstream samples is gathered in Table 2 (plus Table S3 in the Supplementary Materials), and the share in downstream and upstream samples is depicted in Figure 6.

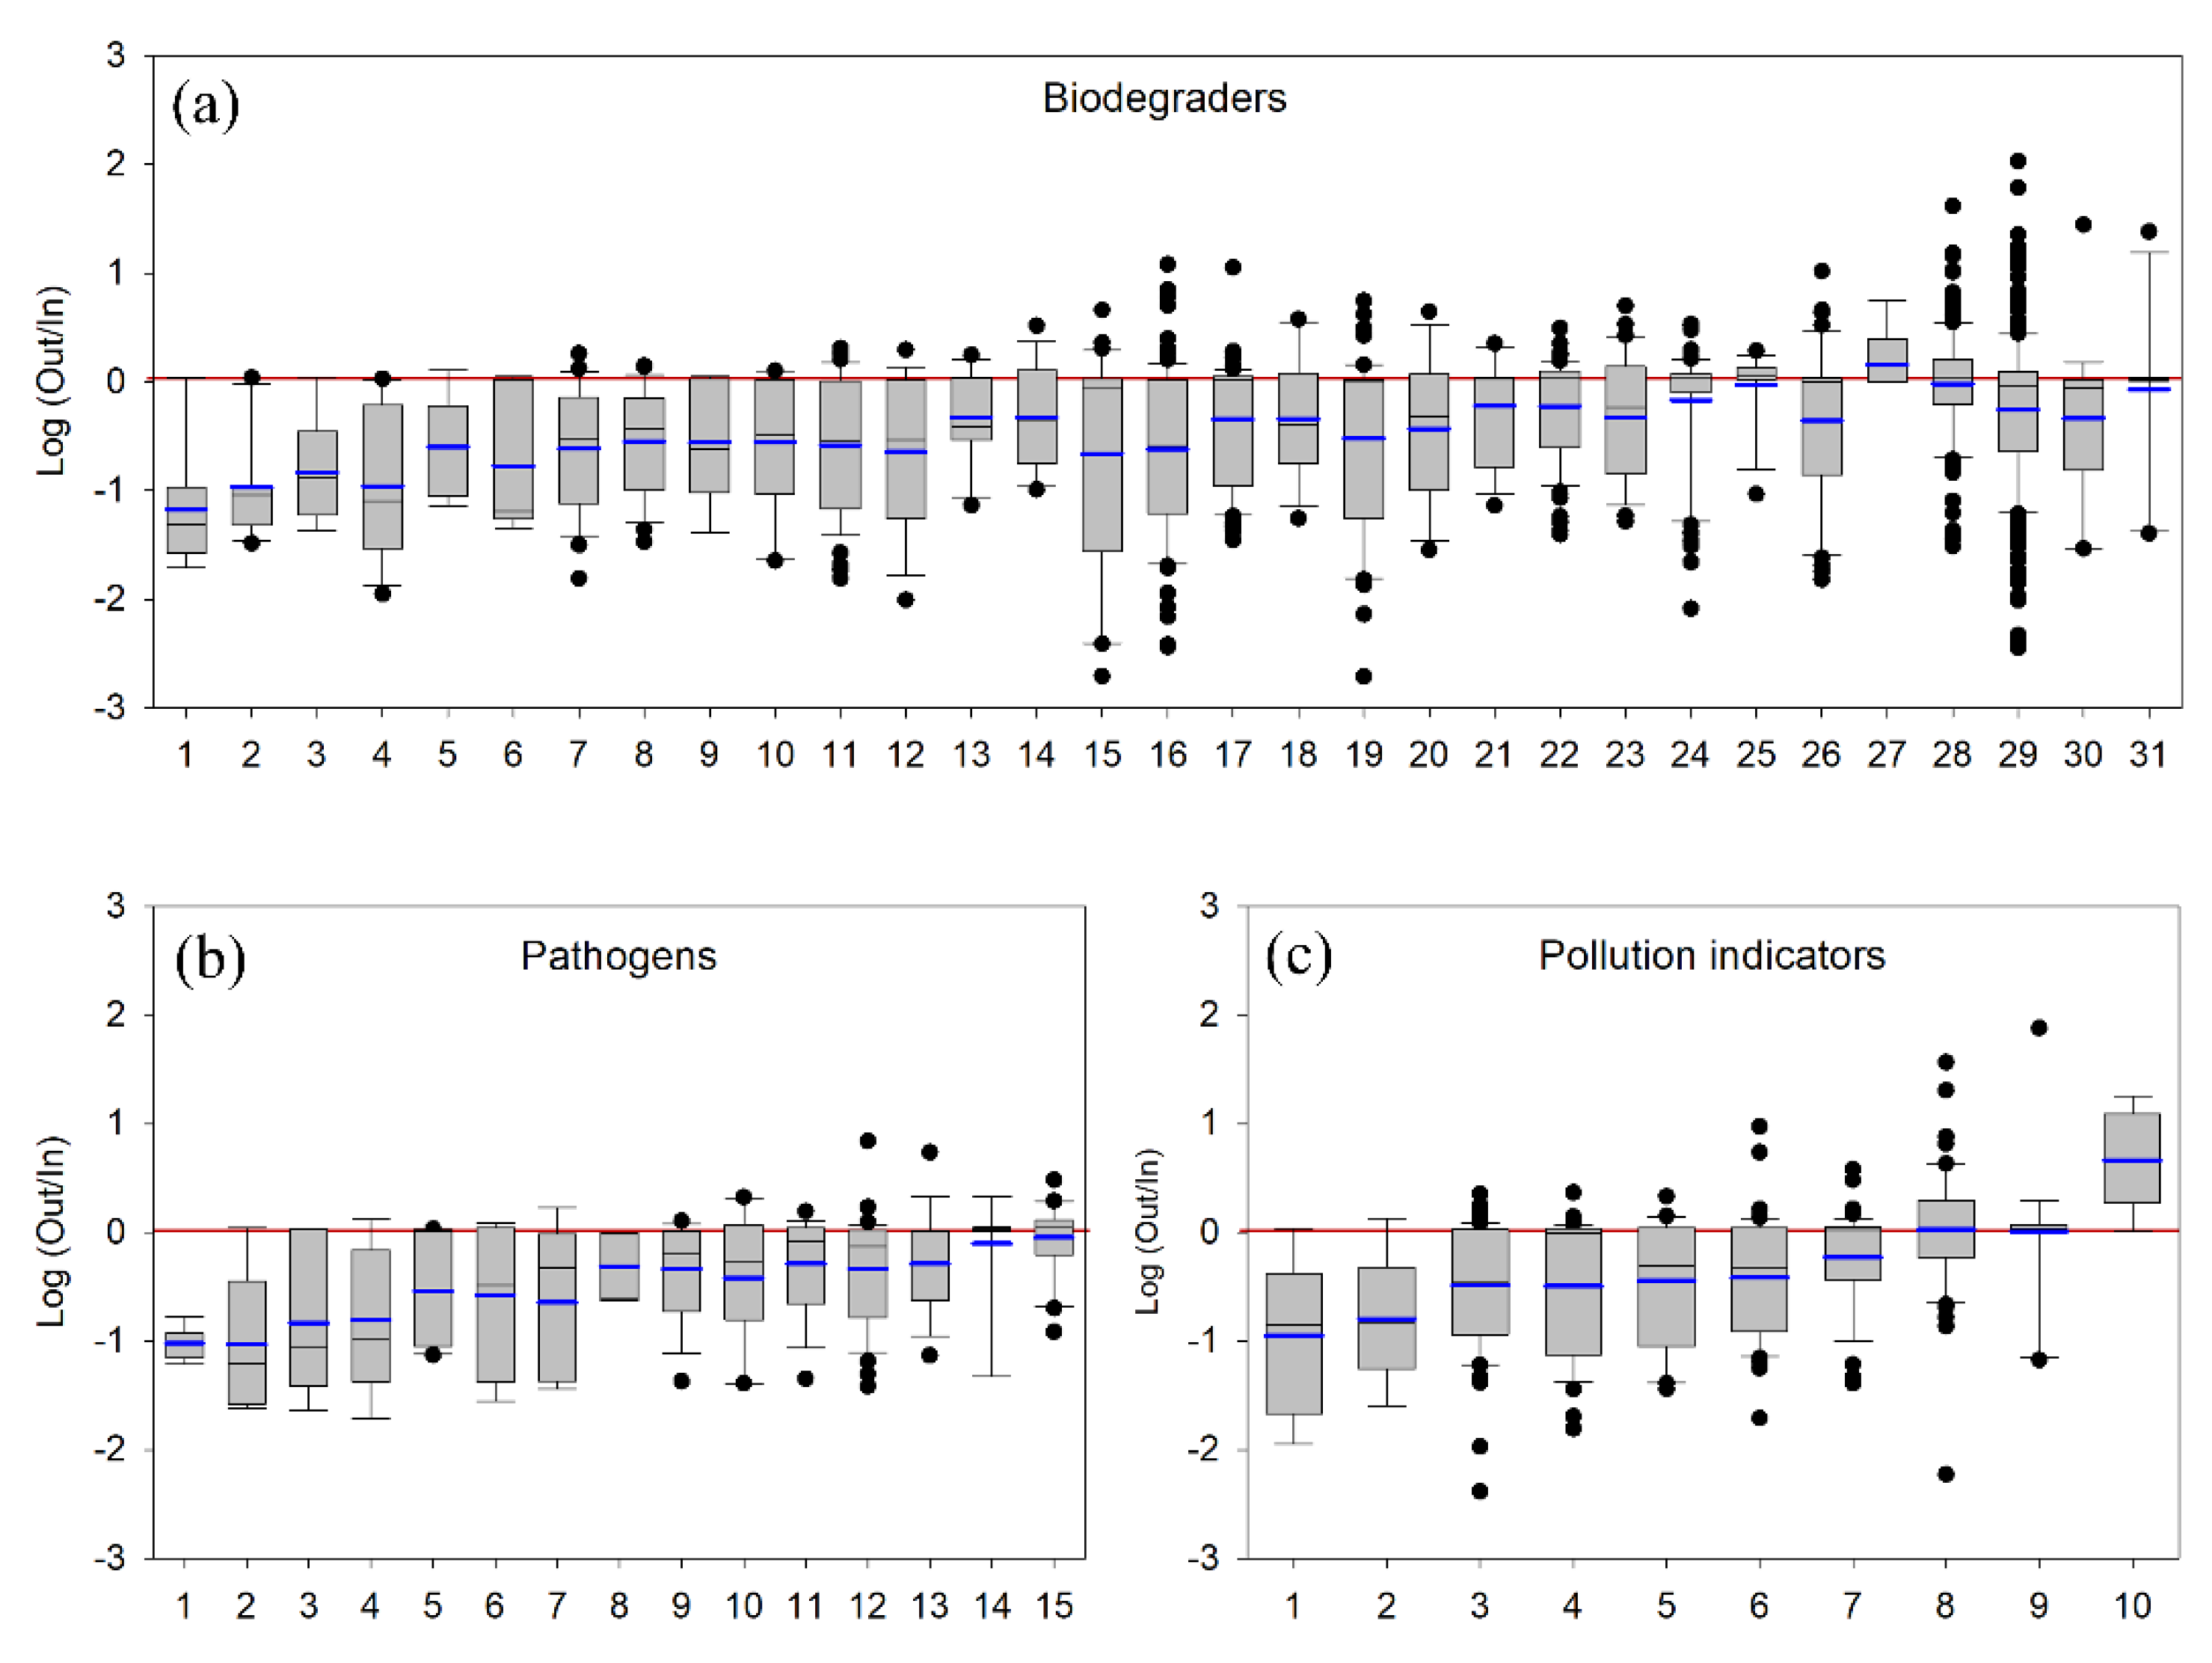
4.2.1. Pollutant-Degrading Microorganisms

Biodegraders are defined here as all those microorganisms that have the capabilities for general degradation of organic materials (pollution) or the degradation of particular chemical compounds. Biodegraders were present in the prospected karst environments over the whole subterranean transect from the upstream ponors to the springs located downstream of the HKS. Analyzed separately (Table S3), there were more microbial taxa where their relative abundance was higher in samples collected upstream than the taxa that prevailed downstream. This can suggest that degrading microorganisms are retained underground, possibly freely in water, or more likely gathered in biofilms, in places where the biodegradation of pollution is desired. This fact can be beneficial for the bioremediation of polluted groundwater.
We identified 76 microbial taxa that are capable of performing processes related to the biodegradation of pollution. Of these, 55 taxa were more abundant in upstream samples, whereas 21 taxa had a higher presence in downstream samples (Table S3). The presence of biodegrading microorganisms, especially in samples collected from upstream locations, can be beneficial for the biodegradation of pollution in subsurface karst environments. A lower presence of biodegraders in the downstream springs indicates their prevalence underground in places where biodegradation of pollution occurs. On the other hand, the spring water is cleaner when it contains fewer microorganisms.
In our study, we identified several taxa of microorganisms that are involved in ammonification and subsequent nitrification of organic matter in the environment. These taxa were Nitrososphaeria, Azospirillales, Nitrosomonadaceae, Nitrospirota, and Nitrosococcaceae, and their relative abundance was higher in samples collected from downstream locations. This increase in the density of nitrifiers along the subterranean water flow path is in agreement with the increasing concentration of nitrates along the subterranean water flow together with a decrease in the amount of organic matter.
The most abundant microbes in our samples were members of the Flavobacterium (Flavobacteriaceae, Bacteroidota). This genus comprises numerous species largely found in soil and freshwater. Members of the Flavobacteriaceae had a higher relative abundance in upstream samples compared to their abundance in downstream samples (Figure 5b). Some species are described as capable of degrading secondary products of nylon 6 manufacture [17], but most Flavobacterium species are described for a wide variety of habitats. These are heterotrophic bacteria that are capable of degrading any organic matter present in the environment, and thus, are important for biodegradation processes in karst subsurface environments. The family Sphingomonadaceae (Alphaproteobacteria) were second in line as the most abundant microorganisms in our samples. They were present mostly in samples collected upstream of the hydrokarst systems (Figure 5b). Some species belonging to Sphingomonadaceae are capable of the biodegradation of aromatic compounds [18,19], which makes them important for the bioremediation of polluted environments. Species from the genus Limnohabitans (Comamonadaceae) were largely present in downstream locations (Figure 5b). They may thrive underground on the available organic matter, the concentration of which decreased as water passed through the HKS. In natural environments, these microorganisms form an important portion of bacterioplankton and have high rates of substrate uptake and growth [20]. Thus, they may contribute significantly to organic matter biodegradation in subsurface aquatic environments. Another genus well represented in soil is Acinetobacter (Moraxellaceae, Gammaproteobacteria). Members of the Moraxellaceae were identified mostly in downstream sites (Figure 5b). Acinetobacter species can contribute to the mineralization of organic matter through both nitrification and denitrification in sewage treatment plants [21]. Other microorganisms, also belonging to Moraxellaceae, but with a higher relative abundance in upstream samples, were members of Alkanindiges. These microorganisms have been detected in activated sludge systems, and they are capable of degrading hydrocarbons, such as squalene [22]. Species belonging to Delftia (Comamonadaceae, Betaproteobacteria) are known for their abilities to degrade a variety of pollutants. They can degrade paracetamol [23], aromatic hydrocarbons [24,25], and herbicides [26]. These species are also associated with the detoxification of heavy metals, such as cadmium [27] and gold [28]. Members of Chitinophagaceae, also detected in our samples, especially in upstream samples (Figure 5b), are important for the biodegradation of carbohydrates (chitin) and other organic compounds [29].
Actinobacteriota members are ubiquitous soil and water microorganisms, largely present in all environments. These microbes can grow in large colonies that resemble fungal mycelia and they contribute, together with fungi, to the decomposition of organic matter. In our study, their presence (Figure 4b) was slightly higher in samples collected downstream of the HKS than upstream samples. Members of Patescibacteria are mostly known from metagenomics and single-cell sequencing, since they are largely uncultivable [30]. Patescibacteria were slightly more common in upstream samples compared to their presence in downstream samples (Figure 4b). These bacteria thrive in groundwater, growing on the available organic matter. This may be beneficial for bioremediation since more (non-pathogenic) bacteria consume organic matter (the pollution).
Cyanobacteria are most likely introduced from the surface during the percolation of water, but the survival of these obligate phototrophs can be affected by the absence of light. Regardless, some Cyanobacteria have been found and are viable deep in the subsurface [31,32]. The relative abundance of Cyanobacteria was, on average, two times larger in samples obtained from downstream locations compared to samples collected from upstream locations (Figure 4b). The presence in the subsurface of these microorganisms can be useful for the bioremediation of polluted groundwater as they can degrade chlorinated compounds [33,34]. In wastewater treatment plants, Cyanobacteria can degrade toxic compounds such as pesticides [35], organophosphorus- and organochlorine insecticides [36], or herbicides [37,38]. Other studies suggest a role for Cyanobacteria in polyethylene [39] and crude oil biodegradation [40].

4.2.2. Pollution Indicators

Pollution indicators are defined here as those microorganisms that are detected and described for various contaminated sites, such as sewage and sludge systems, manure deposits, human and animal intestinal tracts, etc. The presence of these microorganisms in the environment can directly indicate pollution by various human and domestic animal waste. For example, if the waste from a pig farm is spilled directly into a surface stream that sinks later into an underground karst system, then this subsurface environment will be heavily polluted with pig manure. The question refers then to the fate of this type of pollution underground. Is the pollution retained in the subsurface, or is it washed out of the hydrokarst system, contaminating downstream springs that are often used as drinking water sources by local human communities? Ideally, the pollution is retained underground by physical means, such as decantation or sorption to sediments or other substrates, and it is subjected to biodegradation processes performed by microorganisms. In our study, 20 of the 28 analyzed taxa could have originated from human and animal intestinal tracts or various other polluted environments, and were more abundant in upstream samples compared to the 8 taxa that prevailed in downstream samples (Table S3). Thus, a notable proportion of these microorganisms remained underground, and the water in the downstream springs was cleaner, containing less microbes. In the downstream samples, several taxa were present in larger numbers compared to upstream samples, and this aspect may represent a serious hazard for the quality of the drinking water in downstream karst springs. Thus, some of the microorganisms that entered the hydrokarst systems and were detected in samples analyzed during the present study are of human and animal intestinal origin. These microorganisms usually have an anthropogenic source upstream at the surface of the hydrokarst systems where local communities live, grow crops, and house domestic animals. The household refuse originating from, for example, leaking septic tanks, manure, and waste deposits, are ultimately carried by percolating water towards the subsurface with severe consequences for the fragile groundwater ecosystem and the springs that are frequently used as drinking water sources by local communities living downstream of the karst system.
Sludge and sewage samples. The most abundant indicators of human-induced pollution were microorganisms belonging to Rhodoferax (Comamonadaceae, Gammaproteobacteria), which were especially present in samples collected downstream of the prospected hydrokarst systems (Figure 5b). These microbes have been identified in various stagnant water environments, activated sludge, and sewage samples [41]. Species belonging to Rhodoferax are capable of utilizing various carbon sources, such as acetate, lactate, pyruvate or succinate, in either aerobic or anaerobic conditions [42], and can reduce Fe(III) to Fe(II) [43]. Several other microbial species detected in our samples have also been found in sludge systems and sewage samples. These examples include Duganella species [44], Hydrogenophaga species [45], Thermomonas species [46], Malikia species, i.e., Malikia granosa, which was isolated from activated sludge of a municipal wastewater treatment plant [47], Sphaerotilus natans [48], Alkanindiges [49], members of the Elusimicrobia [19], members of the Steroidobacterales [50] and Thiothrix, which occurs in water with a constant source of hydrogen sulfide, but has also been detected in waste water treatment plant samples [51,52]. These later species were more abundant in samples collected upstream of the prospected hydrokarst systems.
Human and animal origin. Romboutsia (Peptostreptococcaceae, Bacillota) species were the most abundant polluting microorganisms, especially in upstream samples (Figure 5b). Several species of Romboutsia have been described in the human gut [53,54]. Species belonging to Pseudoxanthomonas (Xanthomonadaceae, Gammaproteobacteria) have been isolated from human urine and anaerobic digester samples [55] and were detected mostly in downstream samples during this study (Figure 5b). Fusobacteriaceae species, such as Cetobacterium somerae, have been isolated from human feces [56] and Fusobacterium necrophorum is common within the intestinal tract of humans and animals [57]. Some other species identified in our water samples are specifically associated with the presence and growth of domestic animals. For example, Erysipelotrichaceae species are common in the animal gut microbiome and have been isolated from swine manure [58]. Species belonging to Knoellia [59] and Atopostipes [60] have also been isolated from pig manure pits. Rikenellaceae [61], Negativicutes [62], Fibrobacterales [63], Lactobacillus [64], and Muribaculaceae [65] species are all part of animal intestinal tract microbiota and were detected in our samples, reflecting the degree of animal waste pollution in karst groundwater.

4.2.3. Pathogenic Bacteria

Pathogens were detected in samples collected from both ends of the investigated hydrokarst systems. Their presence was related to human activity upstream of the places where the surface streams sink underground. Although many of these microorganisms were more abundance before the water went underground, some of these microbes emerged in downstream springs. These pathogens can threaten the health of people directly consuming water from these sources. Like pollution-indicating bacteria, these microorganisms are a measure of human activity and undesirable in drinking water sources. Their presence in water sources can represent a serious hazard to human health. These incidents should be reported and the consumption of water from these sources ceased. In general, though, notifying the local communities consuming water from contaminated sources in rural areas does not happen. In the five HKS, we counted 32 pathogenic microbial taxa, 24 of which had a larger abundance in upstream samples (Table S3). Thus, these microorganisms may remain underground, and this is an encouraging aspect with regard to natural bioremediation measures. However, a significant portion of the pathogenic microbes (9 taxa) are washed out of the karst systems in springs with potentially severe consequences for the health of the people that consume water from these sources directly.
Bacteroidota comprises a wide group of microorganisms that are present freely in the environment in water and soil alike, but also in the gut of humans and animals [66], where they may be opportunistic pathogens or symbionts contributing to digestive processes. In the groundwater samples we examined, the presence of these microbes in such high proportions may represent a biological hazard associated with agriculture and cattle farming. The family Weeksellaceae contains several pathogenic bacteria species. For example, Chryseobacterium species, also detected in our samples, are responsible for various diseases [67], such as bacteremia, peritonitis, pneumonia, cystitis, and meningitis [68]. Weeksella species occur in the human genital tract [69] and species of Bergeyella are associated with the bite of dogs and cats [70]. Bacteroides species are opportunistic human pathogens, causing infections of the peritoneal cavity and appendicitis [71]. A decrease in the presence and abundance of these microorganism in the drinking water springs located downstream of the hydrokarst systems is likely to benefit downstream communities.
The Bacillota are mainly represented by Bacilli and Clostridia. These two classes include pathogenic microorganisms responsible for various severe diseases. These microorganisms were detected mostly in samples collected downstream of the selected hydrokarst systems (Figure 4b). They were apparently washed out of the HKS to become a hazard to the health of people consuming this water. The most abundant microbes within this group of pathogens present in the water samples collected from both ends of the examined HKS belonged to Bacillus species (Bacillaceae, Bacillota). Bacillaceae members were mostly present in upstream samples (Figure 5b), which suggests that most of these microbes were retained underground to have less impact on drinking water sources located downstream. Bacillus species are omnipresent in various types of environments, in water and soil, and can survive the most extreme conditions, such as high pH, high temperature, and high salinity. A few species produce toxins and can cause poisoning and diseases. For example, Bacillus anthracis, also present in our samples, causes anthrax [72]. Other species, such as Bacillus butanolivorans, which uses n-butanol as its sole carbon source, can be important in bioremediation measures [73].
The genus Clostridium (Clostridiaceae, Bacillota) contains mainly anaerobic microorganisms that were better represented in samples collected from upstream locations (Figure 5b). This group contains several human pathogens that can cause diarrhea, botulism, and tetanus. Clostridium perfringens, present in our samples, causes a wide range of symptoms, from food poisoning to cellulitis, fasciitis, and necrotic enteritis [74]. Other species can be important for bioremediation measures. For example, Clostridium chromiireducens can reduce chromium [75], and Clostridium thiosulfatireducens has been isolated from anaerobic sludge where it reduced thiosulfate and elemental sulfur to sulfide [76]. Species of Psychrobacter (Moraxellaceae, Gammaproteobacteria) are associated with food [77] and can be responsible for diseases such as endocarditis and peritonitis [78].

5. Conclusions

We have observed that the karst subsurface environment may attenuate pollution by the retention of contaminants underground together with degrading microorganisms. A large fraction of pathogenic microorganisms also remains in the subsurface, but many are washed out in the downstream springs. This may represent a serious hazard to the health of people using these sources for their drinking water supply. Therefore, drinking water sources in rural areas should be monitored for the quality of the water, local communities informed of the consequences related to the consumption of water from these springs, and the communities located upstream of the karst systems have to be aware of the possible threats caused by dumping their waste deliberately and unconsciously in the environment.

Supplementary Materials

The following supporting information can be downloaded at: https://0-www-mdpi-com.brum.beds.ac.uk/article/10.3390/w14101597/s1. Figure S1. Amplicon sequence variants (ASV) with a significant change in relative abundance between upstream and downstream samples. Values below 0 (red line) have mostly decreased whereas above have increased. Table S1: ASV annotation table with read counts and calculated relative abundance for the different taxa obtained in samples collected from the end points of the five investigated HKS. Table S2: Alpha diversity measures. Table S3: Overview of the most frequent microorganisms occurring in samples collected from both ends of the selected hydrokarst systems. Multiple amplicon sequence variants were summed up into one genus. The significance of change between upstream and downstream was calculated by normalizing the abundance of each taxon between 0 and for each time point and site. The shown P value was obtained at the ASV level and is reflected in Figure S1. Table S4: Raw measurements of the different chemical parameters.

Author Contributions

Conceptualization, T.B., M.B., D.I. and O.T.M.; methodology, T.B., M.B., D.I., C.M.C., M.K., C.R., A.I., A.F. and I.C.M.; writing—original draft preparation, T.B., M.B. and D.I.; writing—review and editing, T.B., M.B. and D.I.; funding acquisition, O.T.M. All authors have read and agreed to the published version of the manuscript.

Funding

The sampling and analysis were supported through a grant from the Ministry of Research and Innovation in Romania, CNCS-UEFISCDI, project number PN-III-P4-IDPCCF-2016-0016, within PNCDI III (DARKFOOD); and by EEA Grants 2014–2021 under Project EEA138, contract no. 4/2019 for the interpretation of data and writing. D.I. was funded through the German Research Foundation (DFG) Eigene Stelle project IO 98/3-1. M.B. was funded through the German Research Foundation (DFG) Eigene Stelle project BI 1987/2-1.

Institutional Review Board Statement

Not applicable.

Informed Consent Statement

Not applicable.

Data Availability Statement

Not applicable.

Acknowledgments

The authors wish to thank Aurel Perșoiu for help with collecting the samples and Cristian Coman for assistance in the laboratory.

Conflicts of Interest

The authors declare no conflict of interest. The funders had no role in the design of the study; in the collection, analyses, or interpretation of data; in the writing of the manuscript, or in the decision to publish the results.

References

  1. Huang, H.; Liu, H.; Xiong, S.; Zeng, F.; Bu, J.; Zhang, B.; Liu, W.; Zhou, H.; Qi, S.; Xu, L.; et al. Rapid transport of organochlorine pesticides (OCPs) in multimedia environment from karst area. Sci. Total Environ. 2021, 775, 145698. [Google Scholar] [CrossRef] [PubMed]
  2. Brad, T.; Fekete, A.; Sandor, M.S.; Purcarea, C. Natural attenuation potential of selected hydrokarst systems in the Carpathian Mountains (Romania). Water Sci. Technol. Water Supply 2015, 15, 196–206. [Google Scholar] [CrossRef]
  3. Orăşeanu, I.; Iurkiewicz, A. Karst Hydrogeology of Romania; Belvedere: Oradea, Romania, 2010. [Google Scholar]
  4. Callahan, B.J.; McMurdie, P.J.; Rosen, M.J.; Han, A.W.; Johnson, A.J.A.; Holmes, S.P. DADA2: High-resolution sample inference from Illumina amplicon data. Nat. Methods 2016, 13, 581–583. [Google Scholar] [CrossRef] [PubMed] [Green Version]
  5. Pruesse, E.; Peplies, J.; Glöckner, F.O. SINA: Accurate high-throughput multiple sequence alignment of ribosomal RNA genes. Bioinformatics 2012, 28, 1823–1829. [Google Scholar] [CrossRef]
  6. Quast, C.; Pruesse, E.; Yilmaz, P.; Gerken, J.; Schweer, T.; Yarza, P.; Peplies, J.; Glöckner, F.O. The SILVA ribosomal RNA gene database project: Improved data processing and web-based tools. Nucleic Acids Res. 2012, 41, D590–D596. [Google Scholar] [CrossRef]
  7. McMurdie, P.J.; Holmes, S. Waste Not, Want Not: Why Rarefying Microbiome Data Is Inadmissible. PLoS Comput. Biol. 2014, 10, e1003531. [Google Scholar] [CrossRef] [Green Version]
  8. Legendre, P.; Anderson, M.J. Distance-based redundancy analysis: Testing multispecies responses in multifactorial ecological experiments. Ecol. Monogr. 1999, 69, 1–24. [Google Scholar] [CrossRef]
  9. Oren, A.; Garrity, G.M. Valid publication of the names of forty-two phyla of prokaryotes. Int. J. Syst. Evol. Microbiol. 2021, 71, 005056. [Google Scholar] [CrossRef]
  10. Van Breukelen, B.M.; Röling, W.F.M.; Groen, J.; Griffioen, J.; Van Verseveld, H.W. Biogeochemistry and isotope geochemistry of a landfill leachate plume. J. Contam. Hydrol. 2003, 65, 245–268. [Google Scholar] [CrossRef]
  11. Huebsch, M.; Fenton, O.; Horan, B.; Hennessy, D.; Richards, K.G.; Jordan, P.; Goldscheider, N.; Butscher, C.; Blum, P. Mobilisation or dilution? Nitrate response of karst springs to high rainfall events. Hydrol. Earth Syst. Sci. 2014, 18, 4423–4435. [Google Scholar] [CrossRef] [Green Version]
  12. Fridrich, B.; Krčmar, D.; Dalmacija, B.; Molnar, J.; Pešić, V.; Kragulj, M.; Varga, N. Impact of wastewater from pig farm lagoons on the quality of local groundwater. Agric. Water Manag. 2014, 135, 40–53. [Google Scholar] [CrossRef]
  13. Spoelstra, J.; Leal, K.A.; Senger, N.D.; Schiff, S.L.; Post, R. Isotopic Characterization of Sulfate in a Shallow Aquifer Impacted by Agricultural Fertilizer. Ground Water 2021, 59, 658–670. [Google Scholar] [CrossRef] [PubMed]
  14. Sharma, M.K.; Kumar, M. Sulphate contamination in groundwater and its remediation: An overview. Environ. Monit. Assess. 2020, 192, 74. [Google Scholar] [CrossRef] [PubMed]
  15. Szklarek, S.; Górecka, A.; Wojtal-Frankiewicz, A. The effects of road salt on freshwater ecosystems and solutions for mitigating chloride pollution—A review. Sci. Total Environ. 2022, 805, 150289. [Google Scholar] [CrossRef] [PubMed]
  16. Röling, W.F.M.; Van Verseveld, H.W. Natural attenuation: What does the subsurface have in store? Biodegradation 2002, 13, 53–64. [Google Scholar] [CrossRef] [PubMed]
  17. Negoro, S. Biodegradation of nylon oligomers. Appl. Microbiol. Biotechnol. 2000, 54, 461–466. [Google Scholar] [CrossRef]
  18. Nagata, Y.; Kato, H.; Ohtsubo, Y.; Tsuda, M. Lessons from the genomes of lindane-degrading sphingomonads. Environ. Microbiol. Rep. 2019, 11, 630–644. [Google Scholar] [CrossRef]
  19. Yang, Y.; Wang, L.; Xiang, F.; Zhao, L.; Qiao, Z. Activated Sludge Microbial Community and Treatment Performance of Wastewater Treatment Plants in Industrial and Municipal Zones. Int. J. Environ. Res. Public Health 2020, 17, 436. [Google Scholar] [CrossRef] [Green Version]
  20. Zhang, L.; Fang, W.; Li, X.; Lu, W.; Li, J. Strong linkages between dissolved organic matter and the aquatic bacterial community in an urban river. Water Res. 2020, 184, 116089. [Google Scholar] [CrossRef]
  21. Ke, X.; Liu, C.; Tang, S.-Q.; Guo, T.-T.; Pan, L.; Xue, Y.-P.; Zheng, Y.-G. Characterization of Acinetobacter indicus ZJB20129 for heterotrophic nitrification and aerobic denitrification isolated from an urban sewage treatment plant. Bioresour. Technol. 2022, 347, 126423. [Google Scholar] [CrossRef]
  22. Bogan, B.W.; Sullivan, W.R.; Kayser, K.J.; Derr, K.D.; Aldrich, H.C.; Paterek, J.R. Alkanindiges illinoisensis gen. nov., sp. nov., an obligately hydrocarbonoclastic, aerobic squalane-degrading bacterium isolated from oilfield soils. Int. J. Syst. Evol. Microbiol. 2003, 53, 1389–1395. [Google Scholar] [CrossRef] [PubMed]
  23. De Gusseme, B.; Vanhaecke, L.; Verstraete, W.; Boon, N. Degradation of acetaminophen by Delftia tsuruhatensis and Pseudomonas aeruginosa in a membrane bioreactor. Water Res. 2011, 45, 1829–1837. [Google Scholar] [CrossRef] [PubMed]
  24. Shetty, A.R.; de Gannes, V.; Obi, C.C.; Lucas, S.; Lapidus, A.; Cheng, J.-F.; Goodwin, L.A.; Pitluck, S.; Peters, L.; Mikhailova, N.; et al. Complete genome sequence of the phenanthrene-degrading soil bacterium Delftia acidovorans Cs1-4. Stand. Genom. Sci. 2015, 10, 55. [Google Scholar] [CrossRef] [PubMed] [Green Version]
  25. Wu, W.; Huang, H.; Ling, Z.; Yu, Z.; Jiang, Y.; Liu, P.; Li, X. Genome sequencing reveals mechanisms for heavy metal resistance and polycyclic aromatic hydrocarbon degradation in Delftia lacustris strain LZ-C. Ecotoxicology 2016, 25, 234–247. [Google Scholar] [CrossRef]
  26. Leibeling, S.; Schmidt, F.; Jehmlich, N.; von Bergen, M.; Müller, R.H.; Harms, H. Declining Capacity of Starving Delftia acidovorans MC1 to Degrade Phenoxypropionate Herbicides Correlates with Oxidative Modification of the Initial Enzyme. Environ. Sci. Technol. 2010, 44, 3793–3799. [Google Scholar] [CrossRef]
  27. Liu, Y.; Tie, B.; Li, Y.; Lei, M.; Wei, X.; Liu, X.; Du, H. Inoculation of soil with cadmium-resistant bacterium Delftia sp. B9 reduces cadmium accumulation in rice (Oryza sativa L.) grains. Ecotoxicol. Environ. Saf. 2018, 163, 223–229. [Google Scholar] [CrossRef]
  28. Johnston, C.W.; Wyatt, M.A.; Li, X.; Ibrahim, A.; Shuster, J.; Southam, G.; Magarvey, N.A. Gold biomineralization by a metallophore from a gold-associated microbe. Nat. Chem. Biol. 2013, 9, 241–243. [Google Scholar] [CrossRef]
  29. Hou, Y.; Li, B.; Feng, G.; Zhang, C.; He, J.; Li, H.; Zhu, J. Responses of bacterial communities and organic matter degradation in surface sediment to Macrobrachium nipponense bioturbation. Sci. Total Environ. 2021, 759, 143534. [Google Scholar] [CrossRef]
  30. Danczak, R.E.; Johnston, M.D.; Kenah, C.; Slattery, M.; Wrighton, K.C.; Wilkins, M.J. Members of the Candidate Phyla Radiation are functionally differentiated by carbon- and nitrogen-cycling capabilities. Microbiome 2017, 5, 112. [Google Scholar] [CrossRef]
  31. Hubalek, V.; Wu, X.; Eiler, A.; Buck, M.; Heim, C.; Dopson, M.; Bertilsson, S.; Ionescu, D. Connectivity to the surface determines diversity patterns in subsurface aquifers of the Fennoscandian shield. ISME J. 2016, 10, 2447–2458. [Google Scholar] [CrossRef]
  32. Fernando, P.-S.; Alejandro, A.-R.; Monike, O.; Miriam, G.-V.; Mercedes, M.-P.; Yolanda, B.; Nuria, R.; Laurence, B.; Lincoln, S.A.; Fernando, T.; et al. Viable cyanobacteria in the deep continental subsurface. Proc. Natl. Acad. Sci. USA 2018, 115, 10702–10707. [Google Scholar] [CrossRef] [Green Version]
  33. Kuritz, T.; Wolk, C.P. Use of filamentous cyanobacteria for biodegradation of organic pollutants. Appl. Environ. Microbiol. 1995, 61, 234–238. [Google Scholar] [CrossRef] [PubMed] [Green Version]
  34. El-Bestawy, E.A.; El-Salam, A.Z.A.; Mansy, A.E.R.H. Potential use of environmental cyanobacterial species in bioremediation of lindane-contaminated effluents. Int. Biodeterior. Biodegrad. 2007, 59, 180–192. [Google Scholar] [CrossRef]
  35. Cohen, R.R.H. Use of microbes for cost reduction of metal removal from metals and mining industry waste streams. J. Clean. Prod. 2006, 14, 1146–1157. [Google Scholar] [CrossRef]
  36. Vijayakumar, S. Potential Applications of Cyanobacteria in Industrial Effluents—A Review. J. Bioremediat. Biodegrad. 2012, 3, 154. [Google Scholar] [CrossRef]
  37. Forlani, G.; Pavan, M.; Gramek, M.; Kafarski, P.; Lipok, J. Biochemical bases for a widespread tolerance of cyanobacteria to the phosphonate herbicide glyphosate. Plant Cell Physiol. 2008, 49, 443–456. [Google Scholar] [CrossRef]
  38. Lipok, J.; Wieczorek, D.; Jewgiński, M.; Kafarski, P. Prospects of in vivo31P NMR method in glyphosate degradation studies in whole cell system. Enzyme Microb. Technol. 2009, 44, 11–16. [Google Scholar] [CrossRef]
  39. Sarmah, P.; Rout, J. Chapter 22—Role of Algae and Cyanobacteria in Bioremediation: Prospects in Polyethylene Biodegradation; Singh, P.K., Kumar, A., Singh, V.K., Shrivastava, A.K.B.T.-A., Eds.; Academic Press: Cambridge, MA, USA, 2020; pp. 333–349. ISBN 978-0-12-819311-2. [Google Scholar]
  40. Chaillan, F.; Gugger, M.; Saliot, A.; Couté, A.; Oudot, J. Role of cyanobacteria in the biodegradation of crude oil by a tropical cyanobacterial mat. Chemosphere 2006, 62, 1574–1582. [Google Scholar] [CrossRef]
  41. Hiraishi, A.; Hoshino, Y.; Satoh, T. Rhodoferax fermentans gen. nov., sp. nov., a phototrophic purple nonsulfur bacterium previously referred to as the “Rhodocyclus gelatinosus-like” group. Arch. Microbiol. 1991, 155, 330–336. [Google Scholar] [CrossRef]
  42. Madigan, M.T.; Jung, D.O.; Woese, C.R.; Achenbach, L.A. Rhodoferax antarcticus sp. nov., a moderately psychrophilic purple nonsulfur bacterium isolated from an Antarctic microbial mat. Arch. Microbiol. 2000, 173, 269–277. [Google Scholar] [CrossRef]
  43. Finneran, K.T.; Johnsen, C.V.; Lovley, D.R. Rhodoferax ferrireducens sp. nov., a psychrotolerant, facultatively anaerobic bacterium that oxidizes acetate with the reduction of Fe (III). Int. J. Syst. Evol. Microbiol. 2003, 53, 669–673. [Google Scholar] [CrossRef] [PubMed] [Green Version]
  44. Garrity, G.M. Genus II, Duganella. In Bergey’s Manual of Systematic Bacteriology; Springer Science & Business Media: Hoboken, NJ, USA, 2001. [Google Scholar]
  45. Chung, B.S.; Ryu, S.H.; Park, M.; Jeon, Y.; Chung, Y.R.; Jeon, C.O. Hydrogenophaga caeni sp. nov., isolated from activated sludge. Int. J. Syst. Evol. Microbiol. 2007, 57, 1126–1130. [Google Scholar] [CrossRef] [PubMed] [Green Version]
  46. Ju, J.H.; Kim, J.S.; Lee, D.H.; Jeon, J.H.; Heo, S.Y.; Seo, J.W.; Kim, C.H.; Park, D.S.; Oh, B.R. Thermomonas aquatica sp. nov., isolated from an industrial wastewater treatment plant. Int. J. Syst. Evol. Microbiol. 2019, 69, 3399–3404. [Google Scholar] [CrossRef] [PubMed]
  47. Spring, S.; Wagner, M.; Schumann, P.; Kämpfer, P. Malikia granosa gen. nov., sp. nov., a novel polyhydroxyalkanoate- and polyphosphate-accumulating bacterium isolated from activated sludge, and reclassification of Pseudomonas spinosa as Malikia spinosa comb. nov. Int. J. Syst. Evol. Microbiol. 2005, 55, 621–629. [Google Scholar] [CrossRef] [PubMed]
  48. Gnida, A.; Żabczyński, S.; Surmacz-Górska, J. Filamentous bacteria in the nitrifying activated sludge. Water Sci. Technol. 2018, 77, 2709–2713. [Google Scholar] [CrossRef] [PubMed]
  49. Klein, A.N.; Frigon, D.; Raskin, L. Populations related to Alkanindiges, a novel genus containing obligate alkane degraders, are implicated in biological foaming in activated sludge systems. Environ. Microbiol. 2007, 9, 1898–1912. [Google Scholar] [CrossRef] [PubMed]
  50. Fahrbach, M.; Kuever, J.; Remesch, M.; Huber, B.E.; Kämpfer, P.; Dott, W.; Hollender, J. Steroidobacter denitrificans gen. nov., sp. nov., a steroidal hormone-degrading gammaproteobacterium. Int. J. Syst. Evol. Microbiol. 2008, 58, 2215–2223. [Google Scholar] [CrossRef] [Green Version]
  51. Nielsen, P.H.; de Muro, M.A.; Nielsen, J.L. Studies on the in situ physiology of Thiothrix spp. present in activated sludge. Environ. Microbiol. 2000, 2, 389–398. [Google Scholar] [CrossRef]
  52. Henriet, O.; Meunier, C.; Henry, P.; Mahillon, J. Filamentous bulking caused by Thiothrix species is efficiently controlled in full-scale wastewater treatment plants by implementing a sludge densification strategy. Sci. Rep. 2017, 7, 1430. [Google Scholar] [CrossRef]
  53. Gerritsen, J.; Umanets, A.; Staneva, I.; Hornung, B.; Ritari, J.; Paulin, L.; Rijkers, G.T.; de Vos, W.M.; Smidt, H. Romboutsia hominis sp. nov., the first human gut-derived representative of the genus romboutsia, isolated from ileostoma effluent. Int. J. Syst. Evol. Microbiol. 2018, 68, 3479–3486. [Google Scholar] [CrossRef]
  54. Bojović, K.; Ignjatović, Ð.D.I.; Soković Bajić, S.; Vojnović Milutinović, D.; Tomić, M.; Golić, N.; Tolinački, M. Gut Microbiota Dysbiosis Associated With Altered Production of Short Chain Fatty Acids in Children With Neurodevelopmental Disorders. Front. Cell. Infect. Microbiol. 2020, 10, 223. [Google Scholar] [CrossRef] [PubMed]
  55. Thierry, S.; Macarie, H.; Iizuka, T.; Geissdoerfer, W.; Assih, E.; Verhe, F.; Thomas, P.; Fudou, R.; Monroy, O.; Labat, M.; et al. Pseudoxanthomonas mexicana sp. nov. and Pseudoxanthomonas japonensis sp. nov., isolated from diverse environments, and emended descriptions of the genus Pseudoxanthomonas Finkmann et al. 2000 and of its type species. Int. J. Syst. Evol. Microbiol. 2004, 54, 2245–2255. [Google Scholar] [CrossRef] [PubMed] [Green Version]
  56. Finegold, S.M.; Vaisanen, M.-L.; Molitoris, D.R.; Tomzynski, T.J.; Song, Y.; Liu, C.; Collins, M.D.; Lawson, P.A. Cetobacterium somerae sp. nov. from Human Feces and Emended Description of the Genus Cetobacterium. Syst. Appl. Microbiol. 2003, 26, 177–181. [Google Scholar] [CrossRef] [PubMed]
  57. Tan, Z.L.; Nagaraja, T.G.; Chengappa, M.M. Fusobacterium necrophorum infections: Virulence factors, pathogenic mechanism and control measures. Vet. Res. Commun. 1996, 20, 113–140. [Google Scholar] [CrossRef] [PubMed]
  58. Han, L.; Zhang, H.; Chen, S.; Zhou, L.; Li, Y.; Zhao, K.; Huang, F.; Fan, Z.; Xuan, L.; Zhang, X.; et al. Intestinal Microbiota Can Predict Acute Graft-versus-Host Disease Following Allogeneic Hematopoietic Stem Cell Transplantation. Biol. Blood Marrow Transplant. 2019, 25, 1944–1955. [Google Scholar] [CrossRef]
  59. Yu, X.; Du, Y.; Wang, G. Knoellia flava sp. nov., isolated from pig manure. Int. J. Syst. Evol. Microbiol. 2012, 62, 384–389. [Google Scholar] [CrossRef] [Green Version]
  60. Cotta, M.A.; Whitehead, T.R.; Collins, M.D.; Lawson, P.A. Atopostipes suicloacale gen. nov., sp. nov., isolated from an underground swine manure storage pit. Anaerobe 2004, 10, 191–195. [Google Scholar] [CrossRef]
  61. Graf, J. The Family Rikenellaceae BT—The Prokaryotes: Other Major Lineages of Bacteria and the Archaea; Rosenberg, E., DeLong, E.F., Lory, S., Stackebrandt, E., Thompson, F., Eds.; Springer: Berlin/Heidelberg, Germany, 2014; pp. 857–859. ISBN 978-3-642-38954-2. [Google Scholar]
  62. Vos, P.; Garrity, G.; Jones, D.; Krieg, N.R.; Ludwig, W.; Rainey, F.A.; Schleifer, K.-H.; Whitman, W.B. Bergey’s Manual of Systematic Bacteriology: Volume 3: The Firmicutes; Springer Science & Business Media: Hoboken, NJ, USA, 2011; Volume 3, ISBN 0387684891. [Google Scholar]
  63. Theelen, M.J.P.; Luiken, R.E.C.; Wagenaar, J.A.; Sloet van Oldruitenborgh-Oosterbaan, M.M.; Rossen, J.W.A.; Zomer, A.L. The Equine Faecal Microbiota of Healthy Horses and Ponies in The Netherlands: Impact of Host and Environmental Factors. Animals 2021, 11, 1762. [Google Scholar] [CrossRef]
  64. Duar, R.M.; Lin, X.B.; Zheng, J.; Martino, M.E.; Grenier, T.; Pérez-Muñoz, M.E.; Leulier, F.; Gänzle, M.; Walter, J. Lifestyles in transition: Evolution and natural history of the genus Lactobacillus. FEMS Microbiol. Rev. 2017, 41, S27–S48. [Google Scholar] [CrossRef] [Green Version]
  65. Ormerod, K.L.; Wood, D.L.A.; Lachner, N.; Gellatly, S.L.; Daly, J.N.; Parsons, J.D.; Dal’Molin, C.G.O.; Palfreyman, R.W.; Nielsen, L.K.; Cooper, M.A.; et al. Genomic characterization of the uncultured Bacteroidales family S24-7 inhabiting the guts of homeothermic animals. Microbiome 2016, 4, 36. [Google Scholar] [CrossRef] [Green Version]
  66. Rajilić-Stojanović, M.; de Vos, W.M. The first 1000 cultured species of the human gastrointestinal microbiota. FEMS Microbiol. Rev. 2014, 38, 996–1047. [Google Scholar] [CrossRef] [PubMed]
  67. Mukerji, R.; Kakarala, R.; Smith, S.J.; Kusz, H.G. Chryseobacterium indologenes: An emerging infection in the USA. BMJ Case Rep. 2016, 2016, bcr2016214486. [Google Scholar] [CrossRef] [PubMed] [Green Version]
  68. Mehta, R.; Pathak, A. Emerging Chryseobacterium indologenes Infection in Indian Neonatal Intensive Care Units: A Case Report. Antibiotics 2018, 7, 109. [Google Scholar] [CrossRef] [PubMed] [Green Version]
  69. Reina, J.; Gil, J.; Salva, F.; Gomez, J.; Alomar, P. Microbiological characteristics of Weeksella virosa (formerly CDC group IIf) isolated from the human genitourinary tract. J. Clin. Microbiol. 1990, 28, 2357–2359. [Google Scholar] [CrossRef] [PubMed] [Green Version]
  70. Chen, Y.; Liao, K.; Ai, L.; Guo, P.; Huang, H.; Wu, Z.; Liu, M. Bacteremia caused by Bergeyella zoohelcum in an infective endocarditis patient: Case report and review of literature. BMC Infect. Dis. 2017, 17, 271. [Google Scholar] [CrossRef] [PubMed] [Green Version]
  71. Wexler, H.M. Bacteroides: The Good, the Bad, and the Nitty-Gritty. Clin. Microbiol. Rev. 2007, 20, 593–621. [Google Scholar] [CrossRef] [PubMed] [Green Version]
  72. Spencer, R.C. Bacillus anthracis. J. Clin. Pathol. 2003, 56, 182–187. [Google Scholar] [CrossRef] [Green Version]
  73. Kuisiene, N.; Raugalas, J.; Spröer, C.; Kroppenstedt, R.M.; Chitavichius, D. Bacillus butanolivorans sp. nov., a species with industrial application for the remediation of n-butanol. Int. J. Syst. Evol. Microbiol. 2008, 58, 505–509. [Google Scholar] [CrossRef] [Green Version]
  74. Kiu, R.; Hall, L.J. An update on the human and animal enteric pathogen Clostridium perfringens. Emerg. Microbes Infect. 2018, 7, 1–15. [Google Scholar] [CrossRef] [Green Version]
  75. Inglett, K.S.; Bae, H.S.; Aldrich, H.C.; Hatfield, K.; Ogram, A.V. Clostridium chromiireducens sp. nov., isolated from Cr(VI)-contaminated soil. Int. J. Syst. Evol. Microbiol. 2011, 61, 2626–2631. [Google Scholar] [CrossRef] [Green Version]
  76. Hernández-Eugenio, G.; Fardeau, M.-L.; Cayol, J.-L.; Patel, B.K.C.; Thomas, P.; Macarie, H.; Garcia, J.-L.; Ollivier, B. Clostridium thiosulfatireducens sp. nov., a proteolytic, thiosulfate- and sulfur-reducing bacterium isolated from an upflow anaerobic sludge blanket (UASB) reactor. Int. J. Syst. Evol. Microbiol. 2002, 52, 1461–1468. [Google Scholar] [CrossRef] [PubMed] [Green Version]
  77. Druggan, P.; Iversen, C. Chapter 21: Culture Media for Food Spoilage Bacteria of the Order Pseudomonadales: Pseudomonas, Acinetobacter and Psychrobacter spp. In Handbook of Culture Media for Food and Water Microbiology, 3rd ed.; Royal Society of Chemistry: London, UK, 2011; pp. 482–507. [Google Scholar] [CrossRef]
  78. Bonwitt, J.; Tran, M.; Droz, A.; Gonzalez, A.; Glover, W.A. Psychrobacter sanguinis wound infection associated with marine environment exposure, Washington, DC, USA. Emerg. Infect. Dis. 2018, 24, 1942–1944. [Google Scholar] [CrossRef] [PubMed] [Green Version]
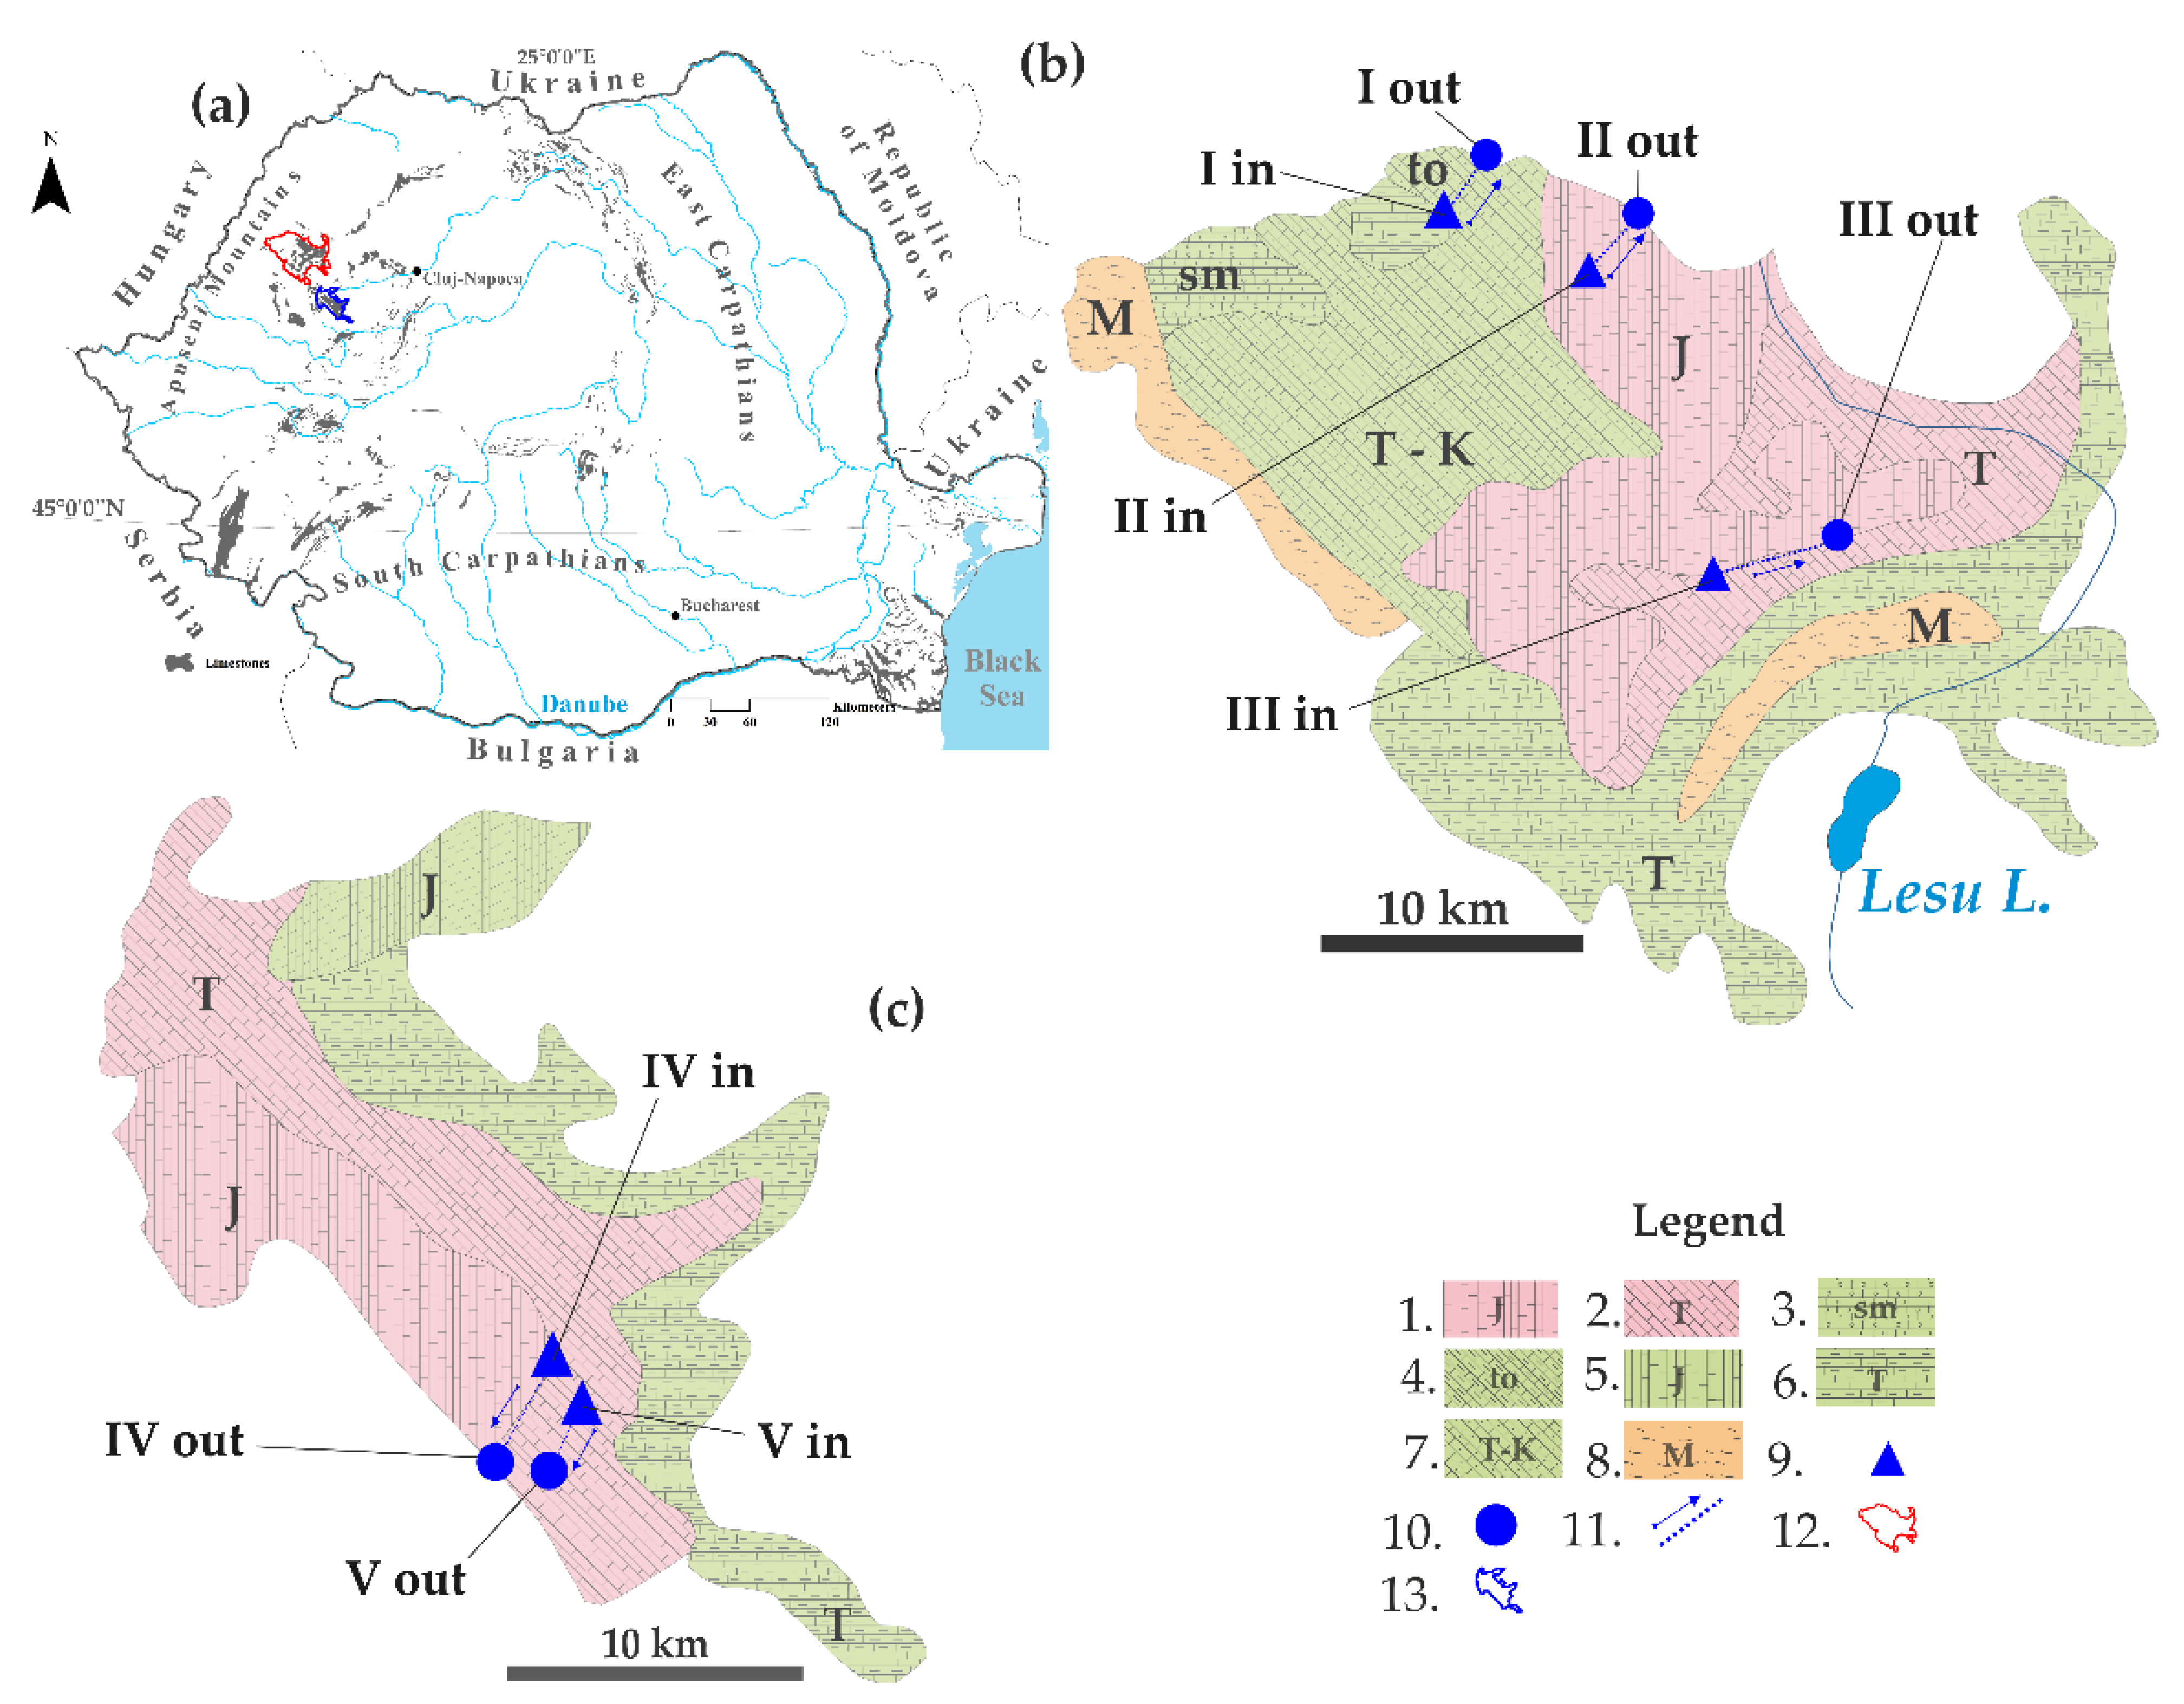
Figure 1. Location of the two mountain ranges (Pădurea Craiului and Bihor Mountains) marked with red and blue delineations, respectively, in NW Romania (a). The five HKS (I to V) are depicted in panels (b,c), with the location of the ponors (triangles), springs (circles) and the direction of the water flow (blue arrows) through the different types of rocks explained in the legend (1. Limestones. 2. Limestones and dolomites. 3. Limestones, sandstones and conglomerates. 4. Calcareous sandstones and limestones. 5. Sandstones, conglomerates and limestones. 6. Limestones and sandstones. 7. Limestones, dolomites, sandstones and conglomerates. 8. Crystalline schists.).
Water 14 01597 g001
Figure 2. Physico-chemical parameters across the different time points and sampling sites shown as blue and red boxplots for the ponors and springs, respectively. Lines show the median, the boxes and whiskers show the 25th and 75th and 10th and 90th percentile, respectively. The raw chemistry measurements are provided in Table S4.
Water 14 01597 g002
Figure 3. Box plots showing (a) Hill N (q = 2) (effective species numbers) as a measure of upstream and downstream alpha diversity; (b) upstream and downstream Piellou’s evenness; and (c) the site and time specific downstream/upstream ratio between the measures in panels (a,b). A value lower than 1 represents a decrease in the downstream sample.
Water 14 01597 g003
Figure 4. (a) Proportion of the different phyla present in samples collected upstream (IN) and downstream (OUT) for the five (I–V) investigated hydrokarst systems. (b) Box plots showing the distribution of the ratios between downstream and upstream locations on a Log2 scale. The ratios were calculated per site per time point. Red lines mark +1 and −1, representing a 2-fold increase or decrease, respectively.
Water 14 01597 g004
Figure 5. (a) Proportion of the different microbial families present in samples collected upstream (IN) and downstream (OUT) from the five (I–V) investigated hydrokarst systems. (b) Box plots showing the distribution of the ratios between downstream and upstream locations on a Log2 scale. The ratios were calculated per site per time point. The red lines mark +1 and −1, representing a 2-fold increase or decrease in downstream communities, respectively.
Water 14 01597 g005
Figure 6. Log ratios of the different taxa (relative abundance > 1%) for which a significant change (p < 0.05) in relative abundance was detected between upstream and downstream locations across all sampling sites and periods. Values above and below 0 indicate a higher abundance downstream and upstream, respectively. The box plots correspond to taxa in Table 2, with matching numbers for the biodegraders (a), pathogenic bacteria (b) and pollution indicators (c).
Water 14 01597 g006
Table 1. Description of the five hydrokarst systems addressed within the present study (information extracted from Orășeanu and Iurkiewicz, 2010 [3]). In each case, the length of the underground course of water is provided, alongside the time needed for the water to flow underground from ponors to springs, the difference in altitude between the two endpoints of the HKS (H) and the number of the underground tributaries that feed the main course (UT). The size of the underground tributaries has not been determined.
MountainHKS Ponor–Spring
(Inflow–Outflow)
Length (m)Time (h)H (m)UT
Pădurea CraiuluiIPotriva Cave–Aștileu Cave2620101072
IIGălășeni Cave–Josani Spring175013950
IIIToaie Ponor–Dămișenilor Spring3550902552
BihorIVOcoale Valley–Cotețul Dobreștilor Spring28003887701
VVuiagă well–Poliței Spring1360102251
Table 2. Bacteria taxa (relative abundance > 1%) for which a significant change (p < 0.05) in relative abundance was detected between upstream and downstream locations across all sampling sites and periods. Ratios were calculated per site and averaged. The complete taxonomic affiliation for each taxon, the p value, and additional taxa that did not have a significant change between upstream and downstream locations are provided in Table S3.
Functional GroupTaxonAverage RatioStandard DeviationHighest Abundance
1BiodegradersBryobacter sp.0.180.36Upstream
2BiodegradersMassilia sp.0.210.33Upstream
3BiodegradersClostridium chromiireducens0.280.37Upstream
4BiodegradersPedobacter boryungensis0.300.39Upstream
5BiodegradersMethylobacterium sp.0.410.45Upstream
6BiodegradersFlavobacterium hauense0.410.50Upstream
7BiodegradersAcinetobacter lwoffii0.470.49Upstream
8BiodegradersFlavobacterium limicola0.490.42Upstream
9BiodegradersBacteriovorax sp.0.500.48Upstream
10BiodegradersAlkanindiges sp.0.530.48Upstream
12BiodegradersParasediminibacterium sp.0.560.59Upstream
11BiodegradersFlavobacterium psychrolimnae0.560.57Upstream
13BiodegradersClostridium butyricum0.660.52Upstream
14BiodegradersBradyrhizobium elkanii0.800.88Upstream
16BiodegradersPedobacter sp.0.841.62Upstream
21BiodegradersTerrimonas sp.0.850.62Upstream
17BiodegradersSediminibacterium sp.0.861.35Upstream
19BiodegradersFlavobacterium saccharophilum0.880.99Upstream
18BiodegradersSphingomonas faeni0.891.10Upstream
20BiodegradersSphingomonas glacialis0.891.24Upstream
22BiodegradersNovosphingobium sp.0.900.62Upstream
23BiodegradersFlavobacterium segetis0.931.09Upstream
26BiodegradersFlavobacterium aquatile1.001.51Downstream
24BiodegradersPseudomonas sp.1.020.68Downstream
15BiodegradersFlavobacterium chungangense1.091.64Downstream
25BiodegradersNitrospira sp.1.120.47Downstream
27BiodegradersFlavobacterium buctense1.932.03Downstream
28BiodegradersLimnohabitans sp.1.943.98Downstream
29BiodegradersFlavobacterium succinicans2.037.86Downstream
30BiodegradersFlavobacterium pectinovorum2.196.40Downstream
31BiodegradersFlavobacterium aquidurense3.106.98Downstream
1PathogensStaphylococcus equorum0.100.04Upstream
2PathogensChryseobacterium chaponense0.250.42Upstream
3PathogensCarnobacterium maltaromaticum0.370.48Upstream
4PathogensRalstonia pickettii0.380.48Upstream
5PathogensFacklamia tabacinasalis0.490.45Upstream
6PathogensCarnobacterium inhibens0.520.49Upstream
7PathogensBrevundimonas intermedia0.570.66Upstream
8PathogensPolynucleobacter sp.0.600.40Upstream
9PathogensPaeniclostridium sp.0.650.42Upstream
10PathogensBrevundimonas staleyi0.710.67Upstream
11PathogensRomboutsia sp.0.730.46Upstream
12PathogensClostridium sp.0.821.13Upstream
13PathogensClostridium estertheticum0.891.28Upstream
14PathogensAeromonas media1.070.56Downstream
15PathogensPolynucleobacter asymbioticus1.130.68Downstream
1Pollution indicatorsRuminiclostridium sp.0.290.41Upstream
2Pollution indicatorsRhizobacter gummiphilus0.360.55Upstream
3Pollution indicatorsLuteolibacter sp.0.640.56Upstream
4Pollution indicatorsUndibacterium sp.0.660.56Upstream
5Pollution indicatorsSphaerotilus sp.0.660.58Upstream
6Pollution indicatorsDevosia sp.0.761.35Upstream
7Pollution indicatorsArenimonas sp.0.880.69Upstream
8Pollution indicatorsRhodoferax sp.1.242.24Downstream
9Pollution indicatorsPerlucidibaca sp.4.9717.19Downstream
10Pollution indicatorsPseudoxanthomonas mexicana6.876.40Downstream
Publisher’s Note: MDPI stays neutral with regard to jurisdictional claims in published maps and institutional affiliations.

