Article

Development and Application of a Real-Time Flood Forecasting System (RTFlood System) in a Tropical Urban Area: A Case Study of Ramkhamhaeng Polder, Bangkok, Thailand

1
Department of Civil Engineering, Shibaura Institute of Technology, 3-7-5 Toyosu, Koto-ku, Tokyo 135-8548, Japan
2
Faculty of Architecture and Planning, Thammasat University Rangsit Campus, Khlong Luang, Pathumthani 12121, Thailand
3
Faculty of Engineering, Kasetsart University, Bangkhen, Bangkok 10900, Thailand
4
School of Engineering and Technology, Asian Institute of Technology, Khlong Luang, Pathumthani 12120, Thailand
*
Author to whom correspondence should be addressed.
Submission received: 12 April 2022 / Revised: 14 May 2022 / Accepted: 17 May 2022 / Published: 20 May 2022

Abstract

:
In urban areas of Thailand, and especially in Bangkok, recent flash floods have caused severe damage and prompted a renewed focus to manage their impacts. The development of a real-time warning system could provide timely information to initiate flood management protocols, thereby reducing impacts. Therefore, we developed an innovative real-time flood forecasting system (RTFlood system) and applied it to the Ramkhamhaeng polder in Bangkok, which is particularly vulnerable to flash floods. The RTFlood system consists of three modules. The first module prepared rainfall input data for subsequent use by a hydraulic model. This module used radar rainfall data measured by the Bangkok Metropolitan Administration and developed forecasts using the TITAN (Thunderstorm Identification, Tracking, Analysis, and Nowcasting) rainfall model. The second module provided a real-time task management system that controlled all processes in the RTFlood system, i.e., input data preparation, hydraulic simulation timing, and post-processing of the output data for presentation. The third module provided a model simulation applying the input data from the first and second modules to simulate flash floods. It used a dynamic, conceptual model (PCSWMM, Personal Computer version of the Stormwater Management Model) to represent the drainage systems of the target urban area and predict the inundation areas. The RTFlood system was applied to the Ramkhamhaeng polder to evaluate the system’s accuracy for 116 recent flash floods. The result showed that 61.2% of the flash floods were successfully predicted with accuracy high enough for appropriate pre-warning. Moreover, it indicated that the RTFlood system alerted inundation potential 20 min earlier than separate flood modeling using radar and local rain stations individually. The earlier alert made it possible to decide on explicit flood controls, including pump and canal gate operations.

1. Introduction

Flood vulnerability in urban areas has increased worldwide [1,2,3] and it is expected that this situation will be exacerbated by a changing climate, particularly in Asia and Southeast Asia due to the combination of long coastlines, a large population inhabiting the coastal zone and river floodplains, compound flooding associated with rising sea levels, more frequent intense storms, and potentially greater total rainfall [4,5,6,7,8,9,10,11,12,13,14,15,16]. Practices for modeling urban flood dynamics that can help address such risks are well established in the Global North [17,18,19], but while there is increasing experience with applied, dynamic, conceptual modeling for urban areas in the Global South [20,21,22,23,24,25], many challenges and knowledge gaps remain [26]. In particular, drainage system design and maintenance, land use patterns, and data availability in the Global South are quite different from conditions in the Global North, where the theoretical conceptual models generally were developed [27,28]. The hydrologic cycle and rainfall/runoff process relationships also may differ in temperate climates typical of Global North countries compared with tropical climates of some regions in the Global South [29,30,31]. In general, it is valuable to explore the ability of existing conceptual models and modeling approaches to adequately represent urban conditions in the Global South.
Real-time analysis and forecasting of the hydrometeorological system can enhance urban resilience in two important areas, real-time control and the issuance of flood warnings [32,33,34,35,36]. Qi et al. [37] noted that real-time control in urban drainage systems has been investigated over the past few decades to mitigate urban flooding, with a particular focus on combined sewer systems to abate wet weather combined sewer overflows. In essence, real-time control is based on pre-established rules such as weather and/or hydrologic/hydraulic conditions, which can optimize and manage the discharge rate, filling and emptying rate, and available capacity of the conveyance and storage elements in the system [38]. An important component of the real-time control system is accurate forecasting of the weather and hydrologic/hydraulic conditions that might trigger an automated response for flow diversion or storage.
However, Brendel et al. [39] noted, “Despite the advances in high-resolution quantitative precipitation forecasts, ensemble forecasting, hydrology, and hydraulics modeling, few operational urban flash flood forecasting systems exist”. Interestingly, René et al. [40] believed a priori that the limited implementation of real-time urban flood forecasting systems was related to the lack of relevant data, but ultimately concluded from their survey of 176 urban flood professionals that “…a possible explanation for so few cases is that urban flood managers or modelers (practitioners) may not be aware they have the means to make a pluvial flood forecast”. In their review, Piadeh et al. [41] noted that early flood warning systems had been widely used for real-time forecasting of floods in the case of river basins, reservoirs, lakes, stream flows, mountainous areas, and prairies, but urban environments present particular challenges to real-time modeling because of the rapid hydrologic/hydraulic response. In the United States, the rapid urban hydrologic response has meant that for smaller areas, flood and flash flood watches and warnings often are based solely on quantitative precipitation estimates (QPEs), and quantitative precipitation forecasts (QPFs) that are generated by integrating weather radar data and rain gage observations, with no hydrologic modeling involved [42]. Piadeh et al. [41] noted that comparatively little research has been conducted on real-time modeling for urban areas in the Global South and Southeast Asia in particular, with a research gap in rain gauge-radar merging methods being especially evident. Rohrer and Armitage [43] explored the viability of implementing a simplified real-time control system in Cape Town, South Africa, to better manage storage pond operations, but relied on historical rain gauge data rather than rainfall forecasting. Both Brendel et al. [39] and Henonin et al. [44] noted that the Asian Institute of Technology had established a real-time modeling approach for the Bangkok Metropolitan Administration (BMA) that employed a combination of radar, rain gauge, and water level data to drive a hydrologic and hydraulic model. However, this system is no longer operational, and to help re-establish the possibility of real-time operations in Bangkok, the BMA expressed interest in a trial project outlined herein. As such, the novel contribution of this paper is the development of a modeling approach to accurately forecast the hydrologic/hydraulic conditions that would trigger some type of real-time response, using the seamlessly linked weather forecasts, weather radar, rain gauge data, and a dynamic conceptual model for a Global South location.
Bangkok, Thailand’s capital city, has increasingly experienced heavy flash floods and severe damages due to a complex combination of several drivers, including rapid urbanization, changes in upstream conditions in northern Thailand, insufficient urban drainage capacity, tidal effects from the downstream river mouth, land subsidence due to groundwater withdrawals, and climate change [45,46,47,48,49]. A particular challenge for Bangkok’s drainage system is that the ground surface level is lower than the controlled water level of the surrounding canals and the Chao Phraya River, thereby greatly limiting the efficiency of gravitational flow. Generally, the solution to such hydraulic challenges is to increase the number or capacity of pumping stations and drainage canals to minimize the risk of severe inundation damage from heavy flash floods. However, land-use limitations exist with respect to improving Bangkok’s urban drainage capacity and outbound canals [50,51,52]. Therefore, flood mitigation with a real-time flood forecasting system would help both the administrative authority and, ultimately, the public in reducing severe flood damages. For the administrative authority, it will provide the potential flooding location and also help in monitoring the current situation. In addition, for the public side, such a system would be helpful by providing communication about flood risk locations and warning for awareness.
The runoff response from largely impervious urban surfaces produces a generally earlier and higher peak in the drainage system. Therefore, the real-time flood forecasting system needs to have a short computation time so that the locations of flood inundation can be predicted and allow time for mitigation options to be implemented. Hydrologic and hydraulic models in 1D (one-dimensional) or 1D/2D (one-dimensional/two-dimensional) are conventionally used to characterize natural flood processes. Still, a coupling effort of these models with sufficient observed data/output as an integrated system is essential for real-time forecasting with high accuracy [41,53,54,55,56,57,58]. A previous study conducted in the Sukhumvit area of Bangkok [59] demonstrated the ability of a real-time system to accurately model flooding conditions but also identified limitations due to data acquisition and processing times. The approach applied in the Sukhumvit area achieved a 10 min lead time using the real-time hydrologic/hydraulic model, with 40 min rainfall duration and 20 min processing time.
This paper integrates a quantitative rainfall forecast package with a hydraulic model simulation and resultant output presentations in a single platform (RTFlood) for autonomous real-time operations to address the shortcomings of the earlier effort [59]. More specifically, the RTFlood system presented in this paper includes important refinements to the work reported by [59] in five areas: (i) all aspects of the rainfall/runoff continuum were included in a single platform rather than independently processing the radar rainfall and the catchment model; (ii) the TITAN (Thunderstorm Identification, Tracking, Analysis, and Nowcasting) model was added to enhance the timing and accuracy of the rainfall forecasting; (iii) the RTFlood platform was coded in Python to facilitate data management and visualization, representing the development of new IP; (iv) because the Python coding was implemented, it supported a visually superior communications website that enabled model results and flooded areas to be explicitly mapped; and (v) the RTFlood approach included much higher temporal and spatial resolution compared with the earlier effort, which improved model predictions. The RTFlood system consists of three modules: (i) a rainfall data preparation module, (ii) a real-time task management module, and (iii) a stormwater simulation module. This paper describes the three modules of the RTFlood system in detail and reports a case study for the Ramkhamhaeng polder in Bangkok, demonstrating how the RTFlood system could be applied to assess the risk of urban flash floods.

2. Materials and Methods
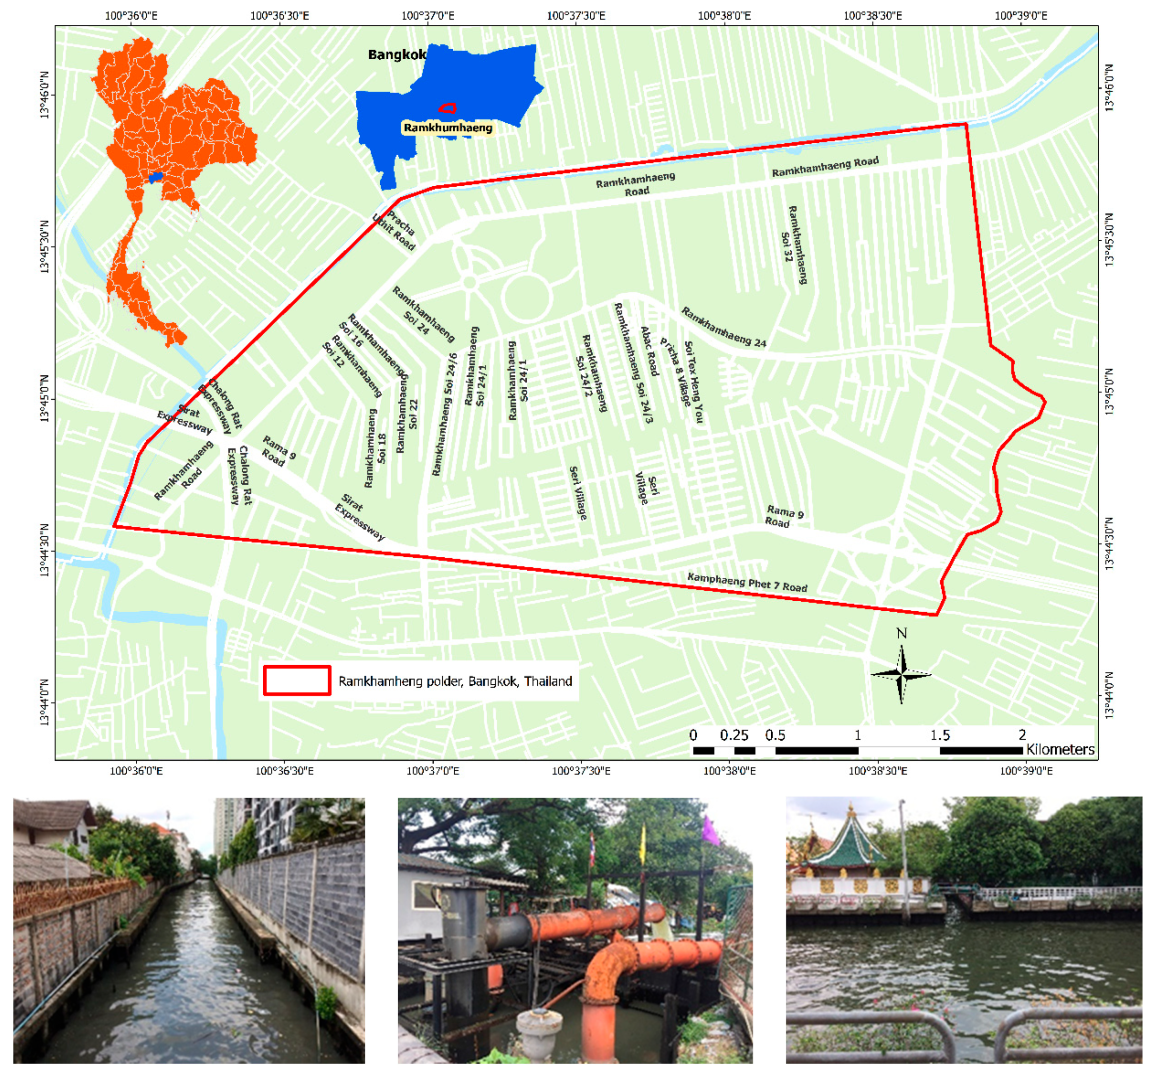
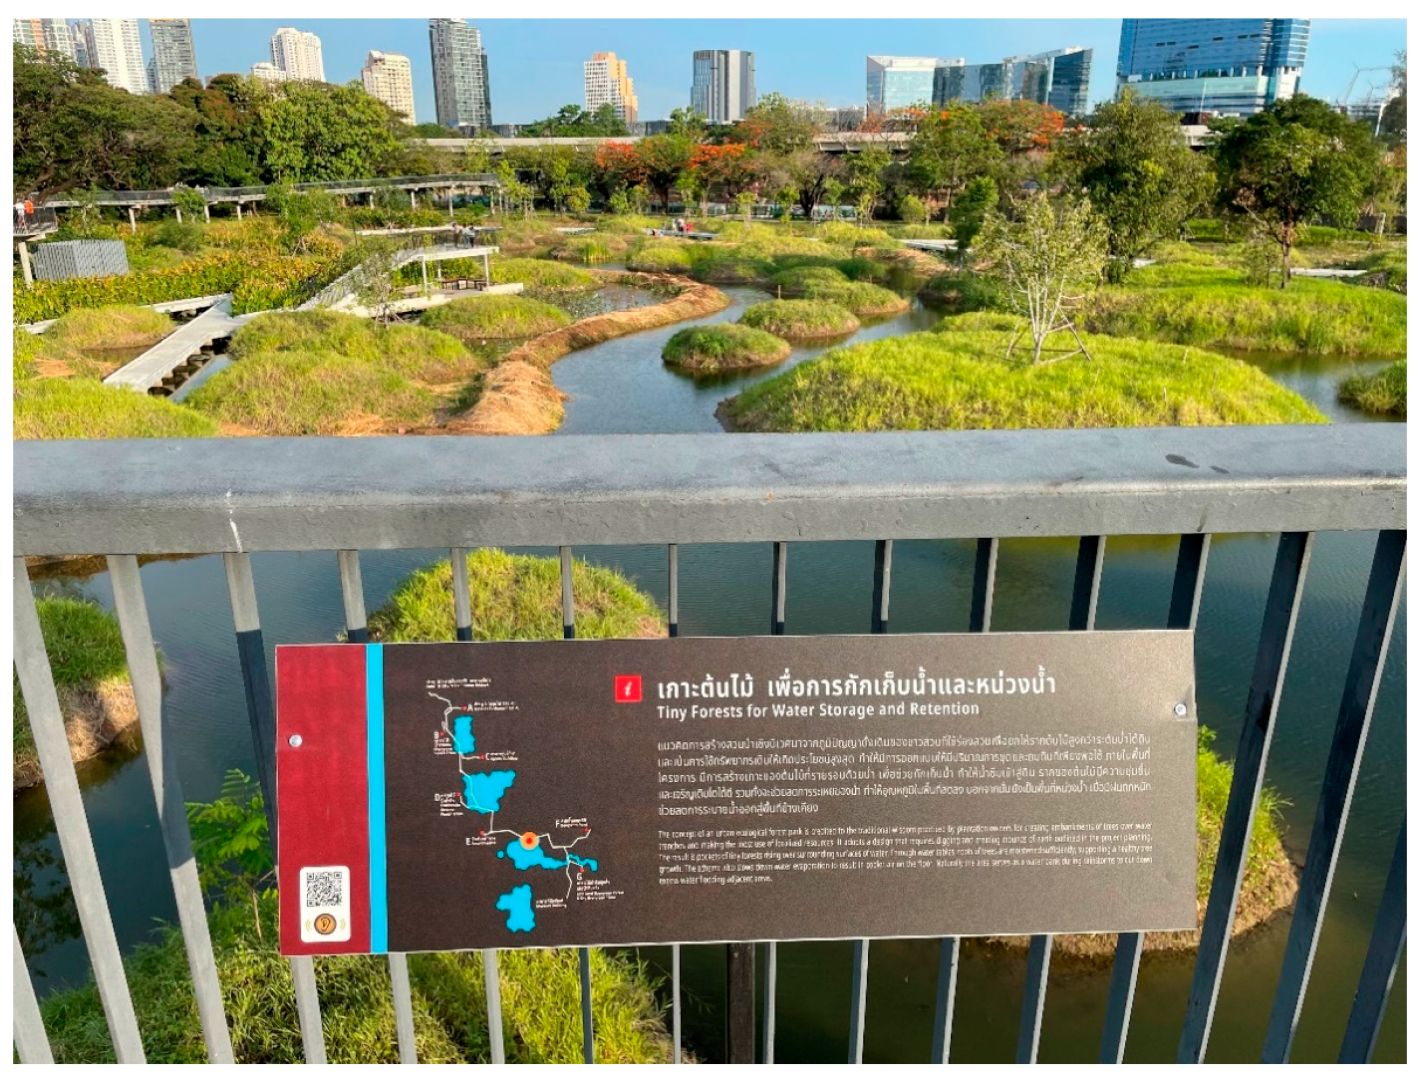
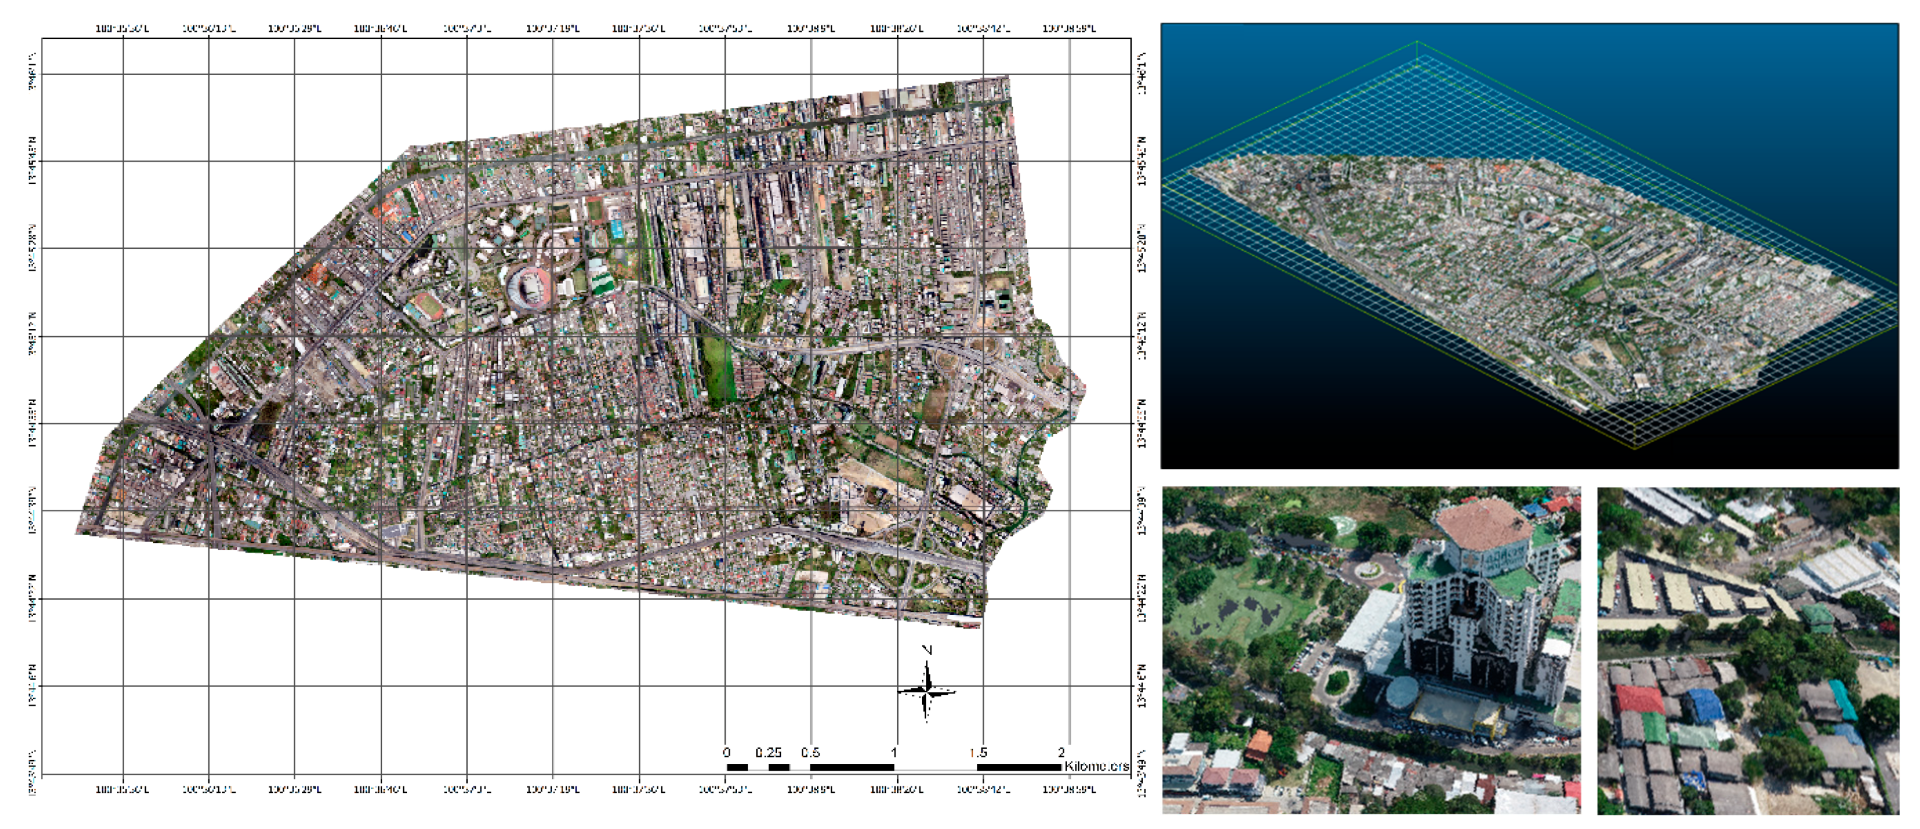
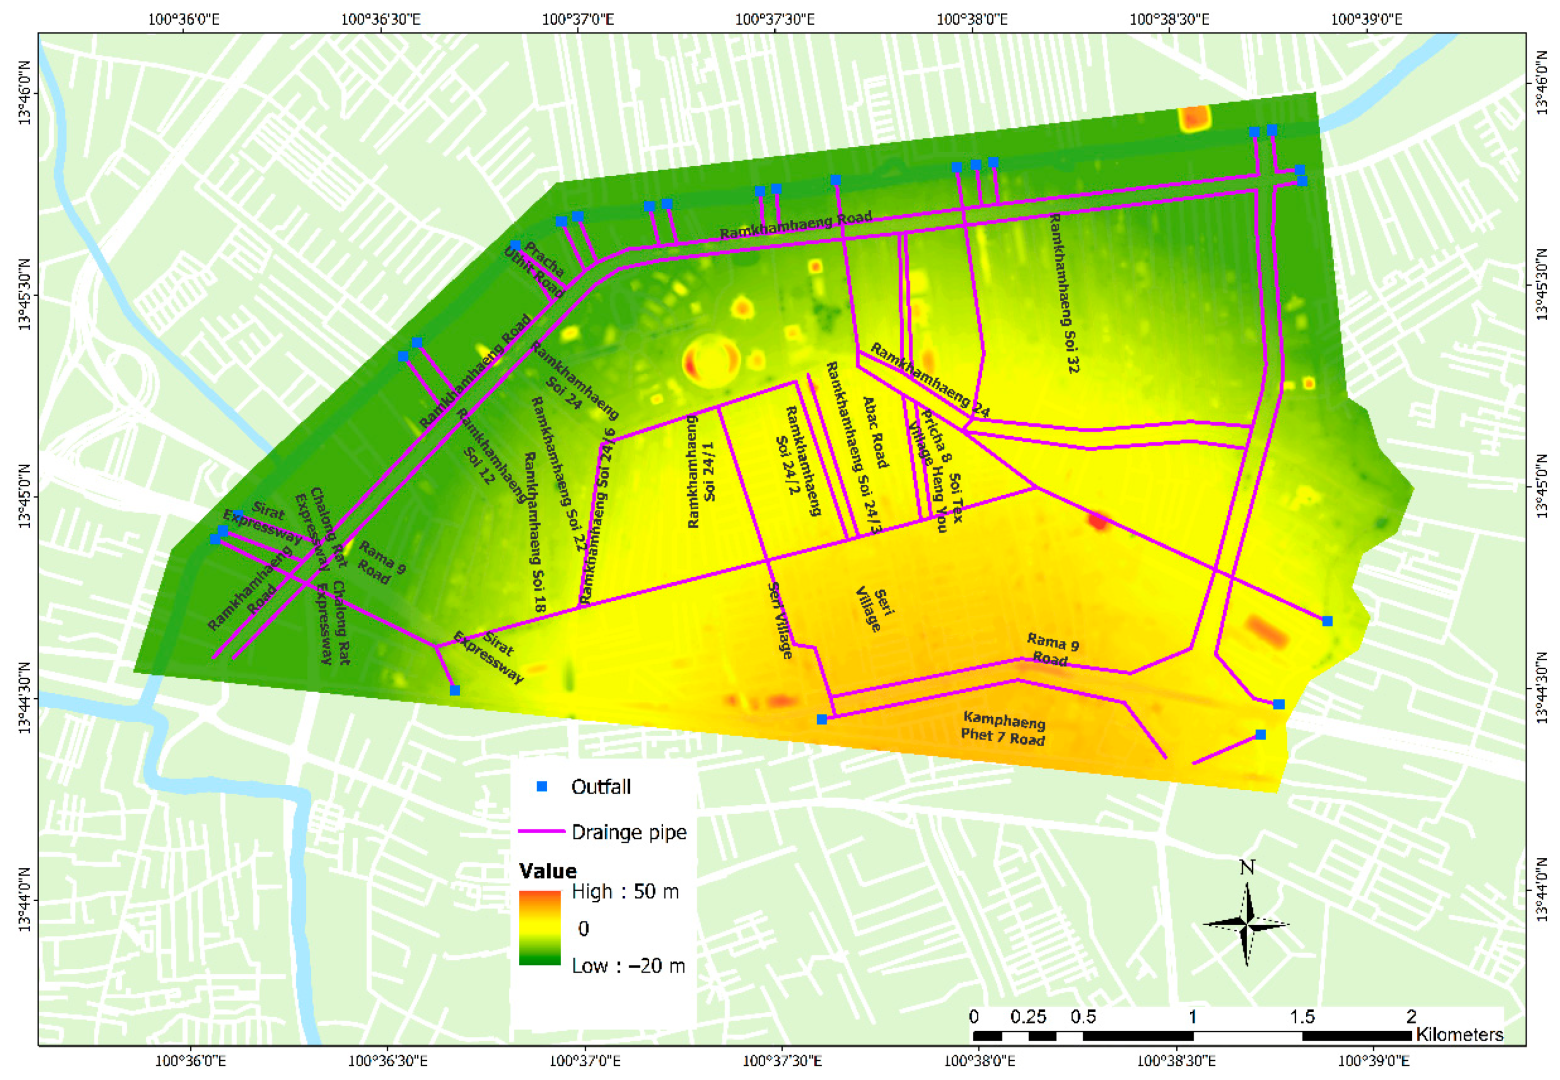
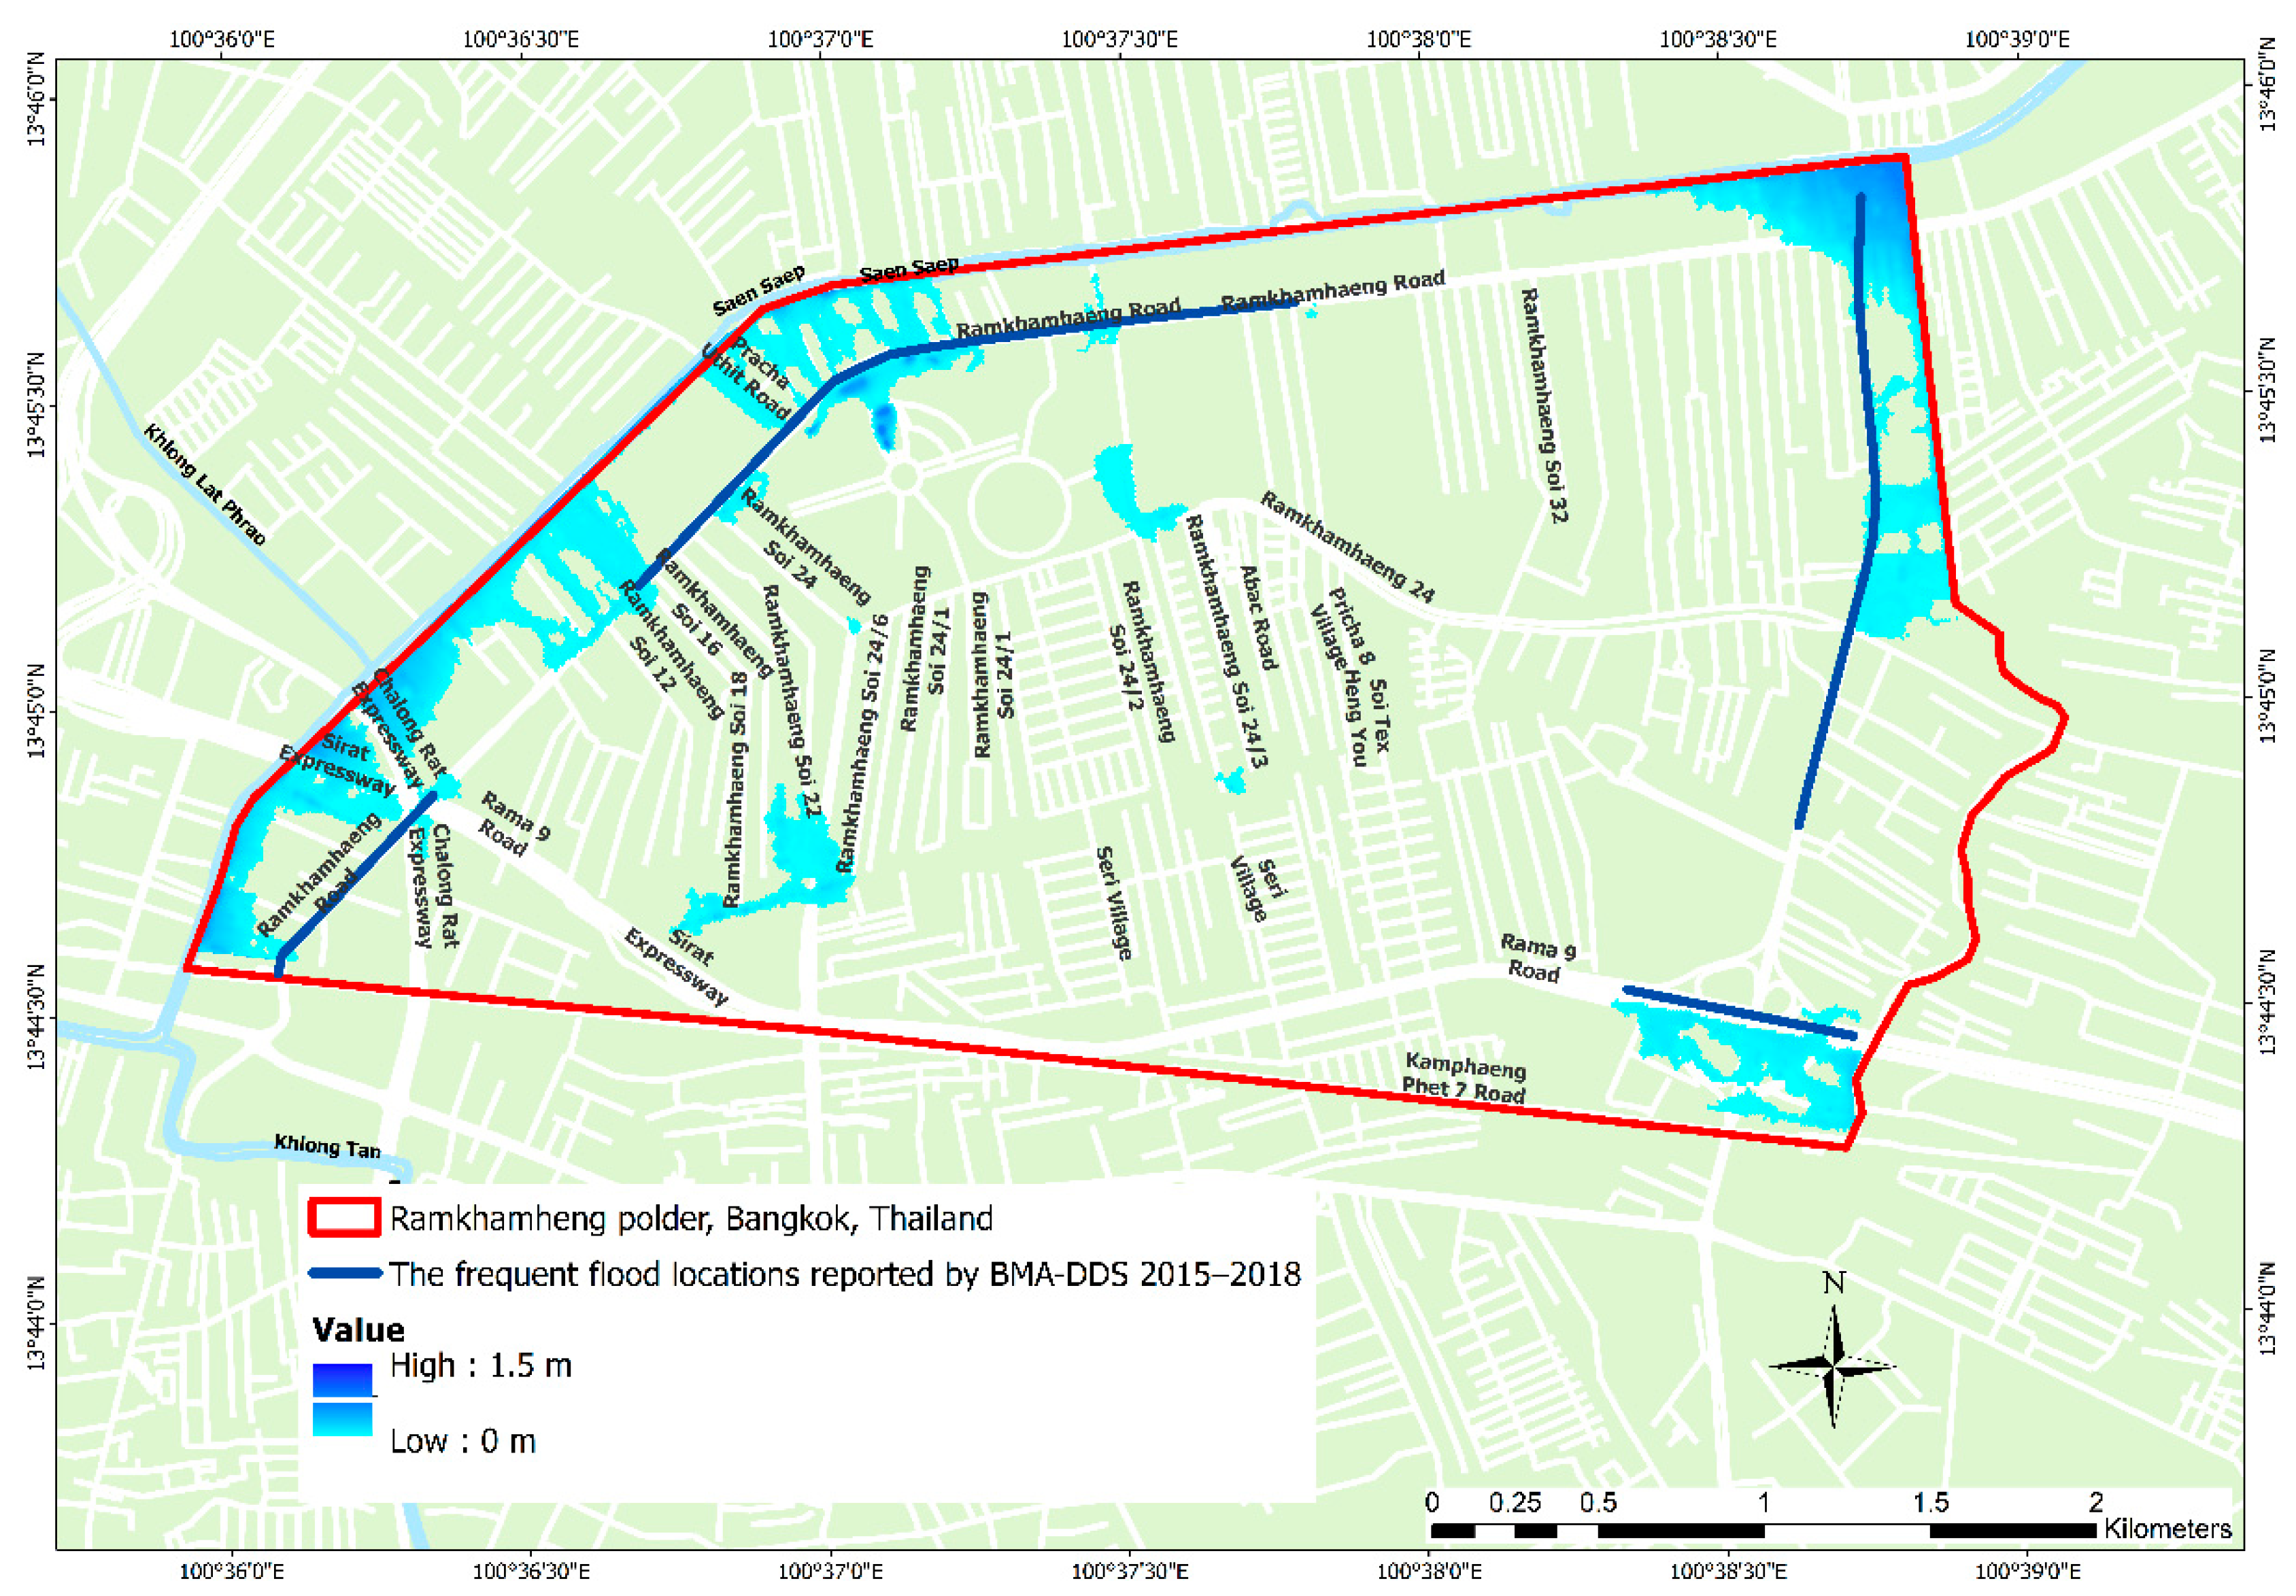
2.1. Study Area

In this study, we examined the Ramkhamhaeng polder, one of the 22 polders managed by the Bangkok Metropolitan Administration, Department of Drainage and Sewerage (BMA-DDS). The Ramkhamhaeng polder is in the middle part of Bangkok and northeast of the Chao Phraya River, as shown in Figure 1. The Saen Saeb canal creates the northern and western boundaries, the Tooyor and Hua Mak canals represent the eastern boundary, and the east railway line provides the southern boundary. The canals form the primary drainage system for the Ramkhamhaeng polder, while a secondary drainage system of underground pipes and smaller connector canals inside the polder area discharges to the primary system (Figure 1).
Bangkok has a tropical savanna type (Aw) climate with distinct rainy and dry seasons. Mean annual precipitation is 1651 mm, 85% of which falls in the rainy season from May to October. The Ramkhamhaeng polder is a densely urbanized central business district (CBD). The catchment has an area of 11.44 km2 and a population density of 8400 persons/km2. The site essentially has a flat topography with the lowest elevation levels in Bangkok, averaging 0.0 to 0.5 m above mean sea level [52]. As such, gravity flow is limited for the stormwater to drain outside of the Ramkhamhaeng polder. Without pumping stations, the stormwater drainage would be a challenge, resulting in severe inundation problems inside the Ramkhamhaeng polder when the water level in the primary drainage system increases due to heavy flash floods during the rainy season [60] (Figure 1). The Ramkhamhaeng polder was selected for study because it is an area with high-value commercial assets (CBD) that floods frequently due to its imperviousness and flat, low-lying topography. Improved forecasting of potential inundation conditions will support better decision making for earlier pump operations to help reduce the risk of inundation. Other catchments in Bangkok also experience pluvial flooding [61,62], and the general forecasting and flood modeling approach prototyped in this study could be applied to these areas. We would note, however, that in some areas of Bangkok, nature-based solution alternatives are being implemented to manage runoff [63,64,65] (Figure 2). These green space opportunities would require a different configuration within the modeling framework presented herein, as compared with pumping operations, but nonetheless still could be accommodated.

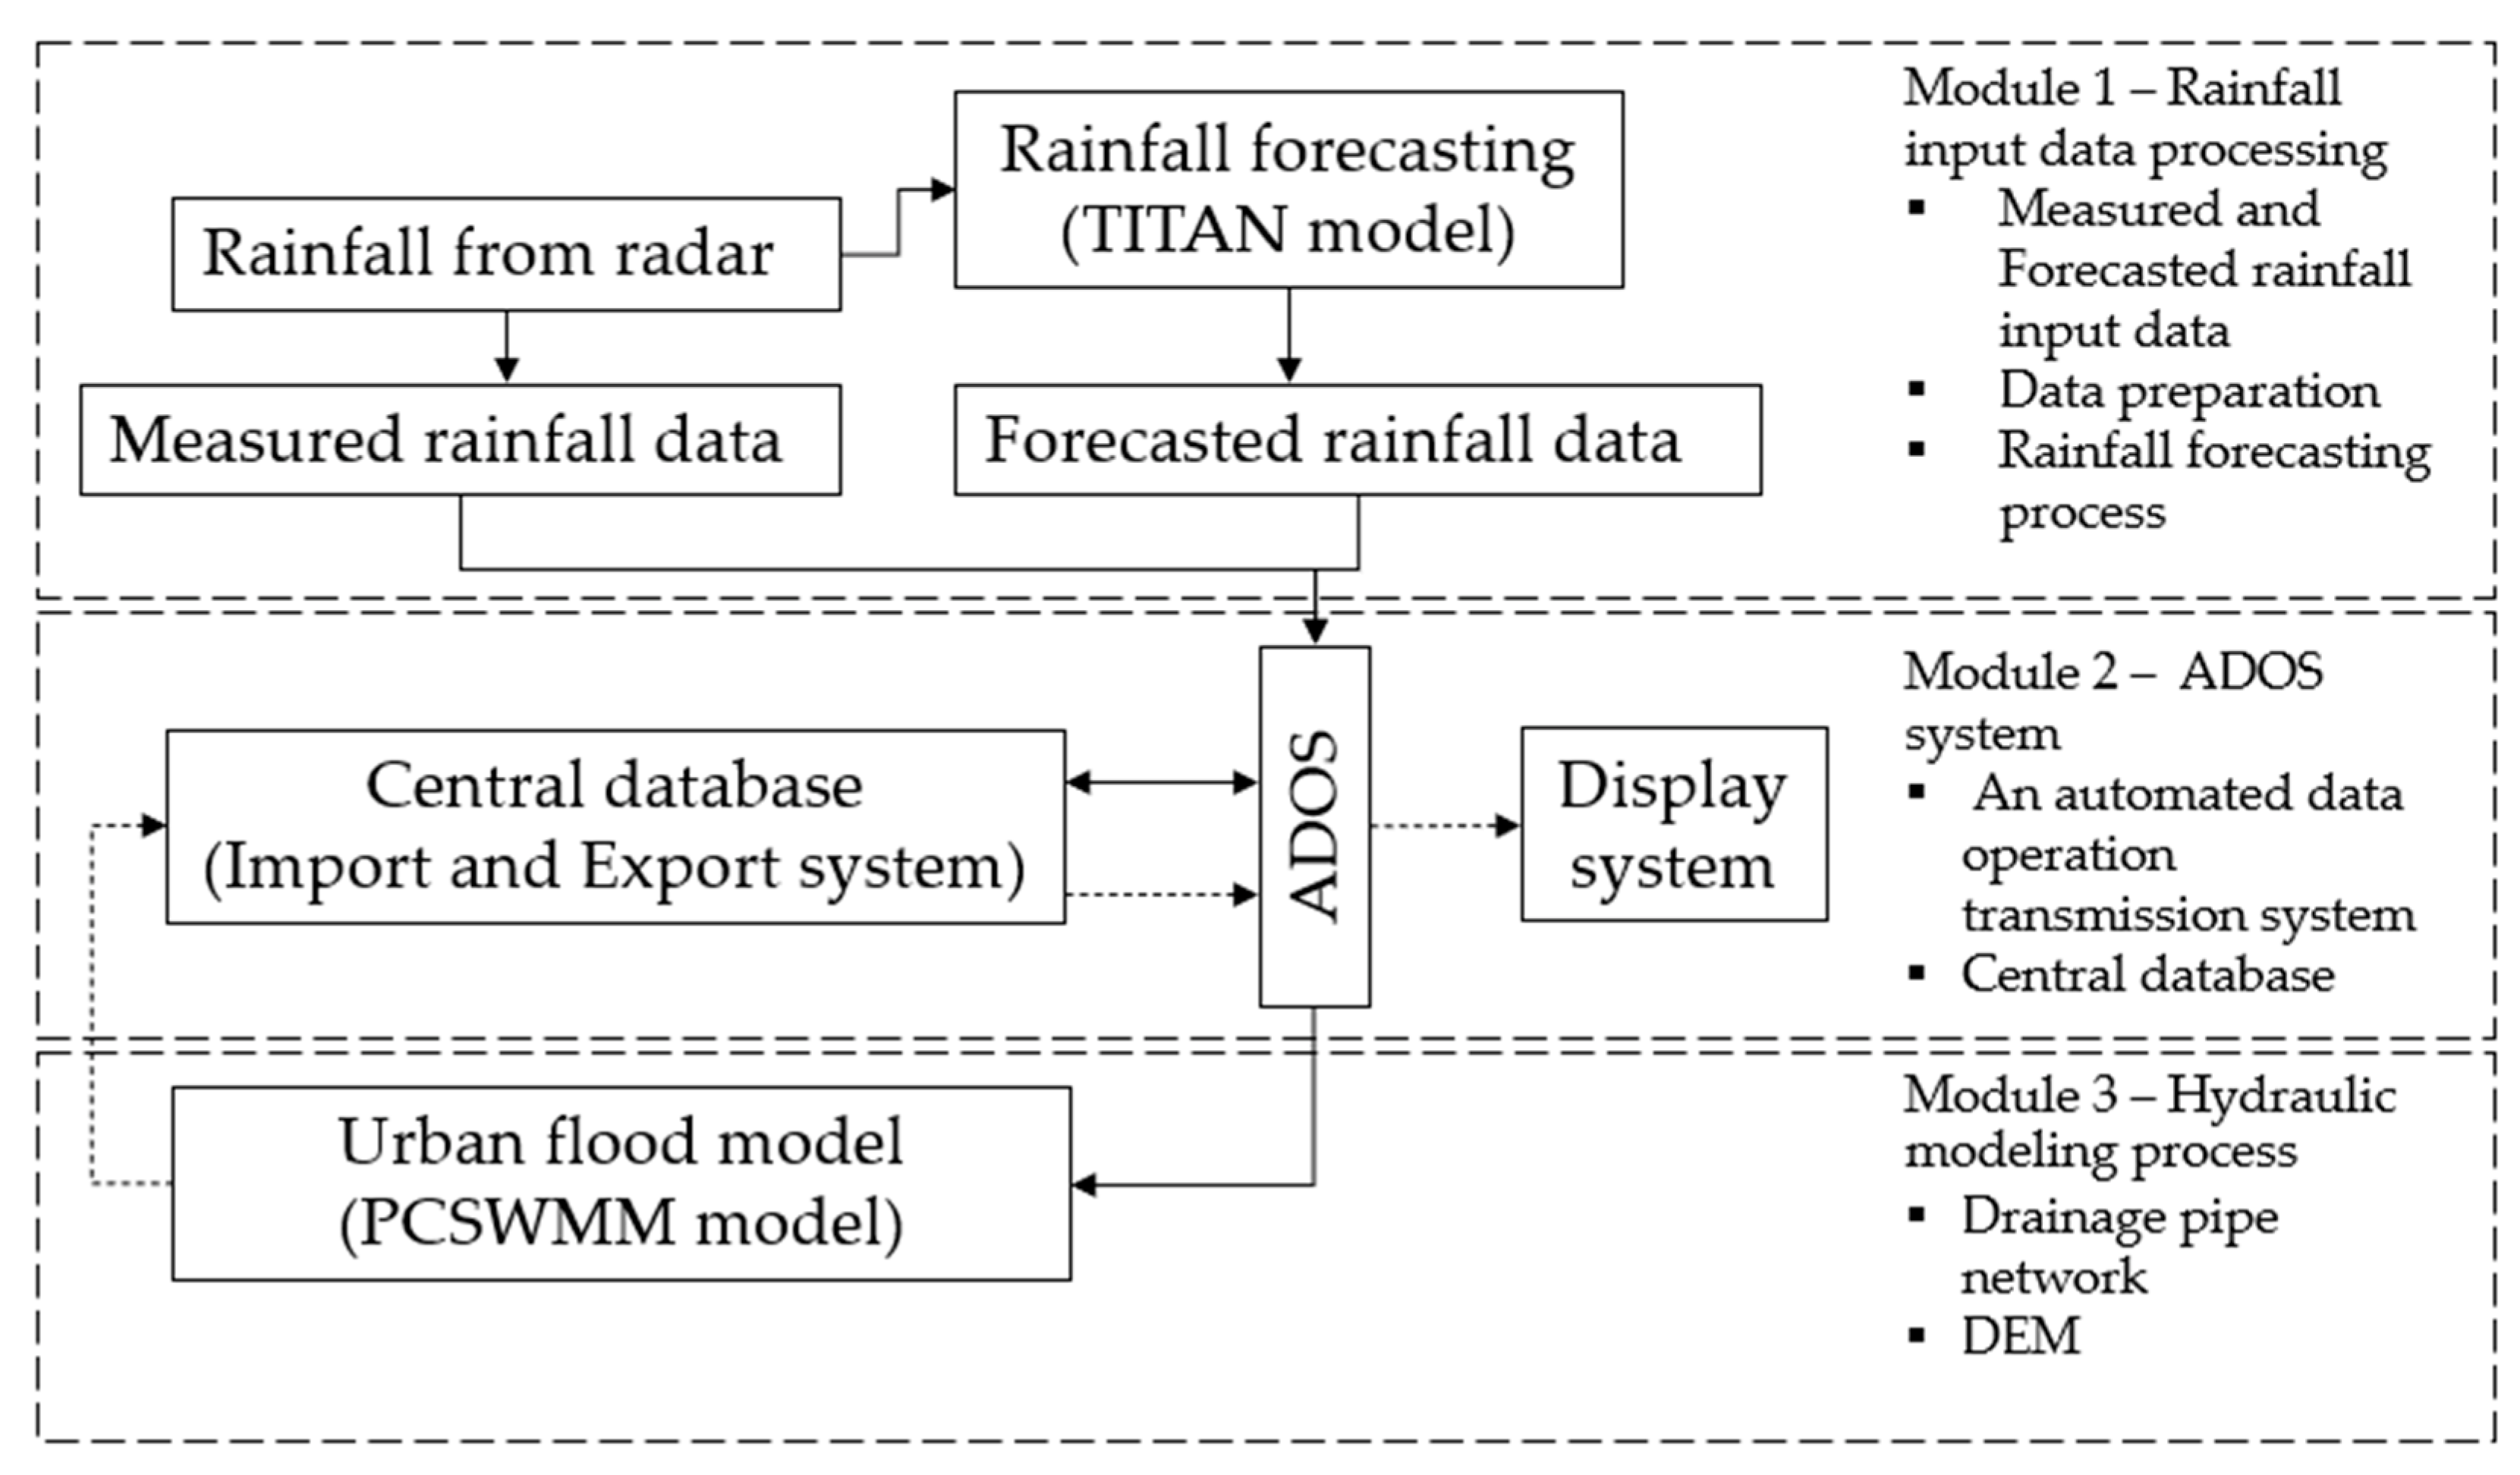
2.2. Real-Time Flood Forecasting System: RTFlood System

In this study, we evaluated the effectiveness of the RTFlood platform for urban flood forecasts by applying it to 116 flash flood events reported in Ramkhamhaeng polder between 2015 and 2018. The RTFlood system consists of three modules, as shown in Figure 3. The first module of the platform handled rainfall data processing and forecasting. This study used rainfall data at 10 min time steps from a radar station near Bangkok. The rainfall data were forecast at 30 min time steps using the TITAN software [66,67,68]. TITAN is able to forecast the movement of storm groups, calculating the overlapping areas between the storm and study areas, thereby obtaining the amount of precipitation in the study area. Further detail on the calculations of forecasting the storm movements is provided in Figure 4 and Figure 5. TITAN employs a storm cell-based approach for radar extrapolation which focuses on locating and tracking specific storm cells using a centroid tracking algorithm that is capable of forecasting the pattern of small, well-defined radar echoes associated with upright convection, as well as more extensive precipitation echoes [69,70]. As noted by [70], an additional advantage to this cell-based approach as compared with full-motion convection field estimates occurs when a specific severe storm is moving differently from surrounding storms, as under such conditions, the cell can be more easily identified and accurately tracked. Pierce et al. [69], in comparing rainfall forecasting accuracy with 5 different models for Australian conditions, concluded that the centroid tracking approach used by TITAN was more reliable in convective scenarios than wind advection techniques such as that employed in the Gandolf modeling system. Although there are a number of different rainfalls forecasting models that could be applied [71,72,73,74,75], the TITAN system has been used in studies around the world [76,77,78,79]. The second module of the platform provided a real-time task management system that operated the overall RTFlood system based on the PCSWMM (Personal Computer version of the Stormwater Management Model) real-time software [80]. PCSWMM employs the U.S. EPA SWMM 5.1 computational engine and includes a graphical user interface for enhanced data management, analysis, and visualization, as well as a scalable GIS engine that supports leading open standard and proprietary GIS and CAD formats to model dynamic rainfall runoff for single events or long-term (continuous) events. The modeling functions in PCSWMM extend the fully dynamic 1D approach in SWMM to represent 2D free surface flow [81]. PCSWMM is a robust computational model that has been applied in water resource studies around the world [20,21,23,82,83,84,85,86,87,88,89,90,91,92,93]. In this study, simulation consisted of a 1D flow model for the drainage pipe network and a 2D overland flow model for the urban terrain. The 2D mesh used in the module was generated with a high-resolution DEM (Digital Elevation Model), discussed in more detail below. Information on the drainage pipe network was obtained from BMA-DDS, followed by a ground-truthing survey to verify and update the details.
The RTFlood system was developed using the open-source Python language for the system’s mainstream. Python was chosen over other alternatives because, typically, it is regarded as having superior data visualization features. It includes packages that easily facilitate the retrieval of the radar data from the BMA-DDS server and the data processing with the TITAN software [66,67,68]. Furthermore, the Python language made it easier to develop applications with PCSWMM’s real-time software. PCSWMM supports Python scripting, allowing us to create the IP for an autonomous mechanism of overall model integration.
The RTFlood system had two software dependencies., i.e., TITAN [66,67,68] and PCSWMM [80,94]. The TITAN software was installed in Module 1 of the RTFlood system to collect and forecast the rainfall intensity distributions in the study area. The PCSWMM software was used in Module 3 of the platform to perform the hydrological and hydraulic simulations in simulating the flash flood inundation areas. Because of the RTFlood system’s dependence on the rainfall forecasting model and hydraulic simulation model, pooling and forecasting rainfall and execution of the hydraulic model simulations cannot be performed on a single computer due to the computational time of each process and the limitation of parallelizing workloads on the computer processing unit. This limitation could be addressed in the future by porting the system to run in the cloud [69]. Thus, the RTFlood system was originally implemented in a multi-computer-based device.

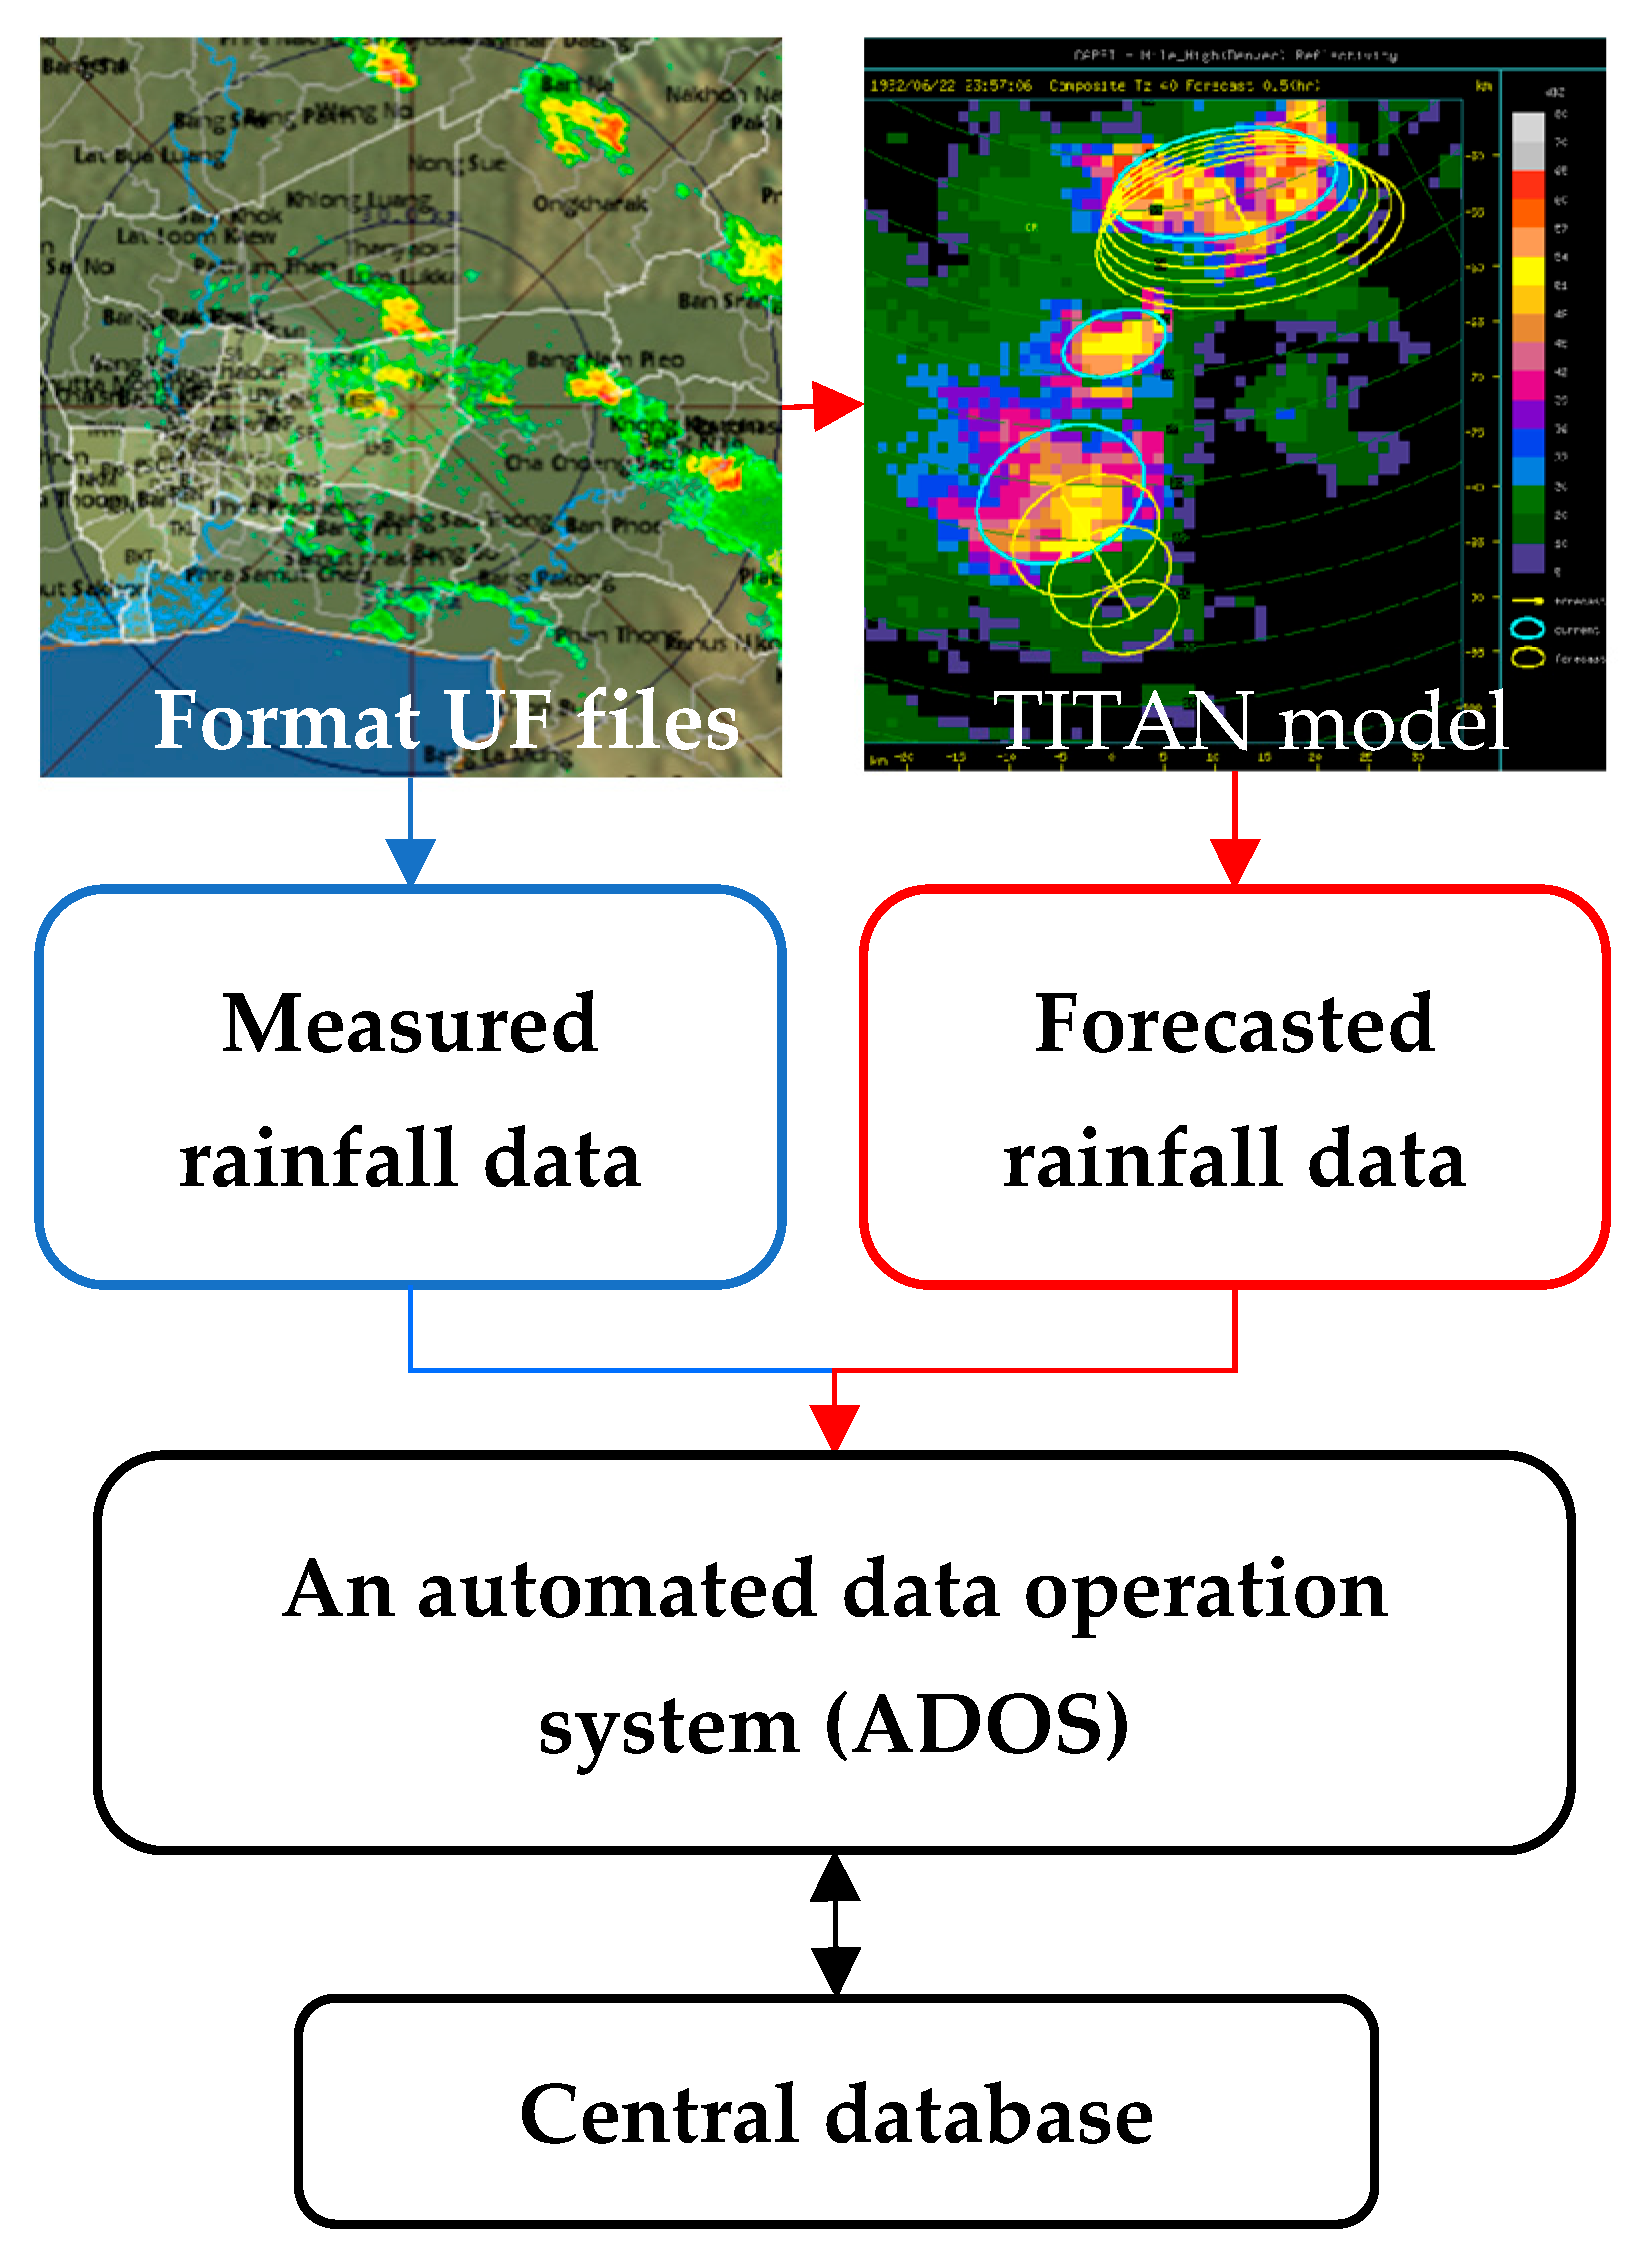
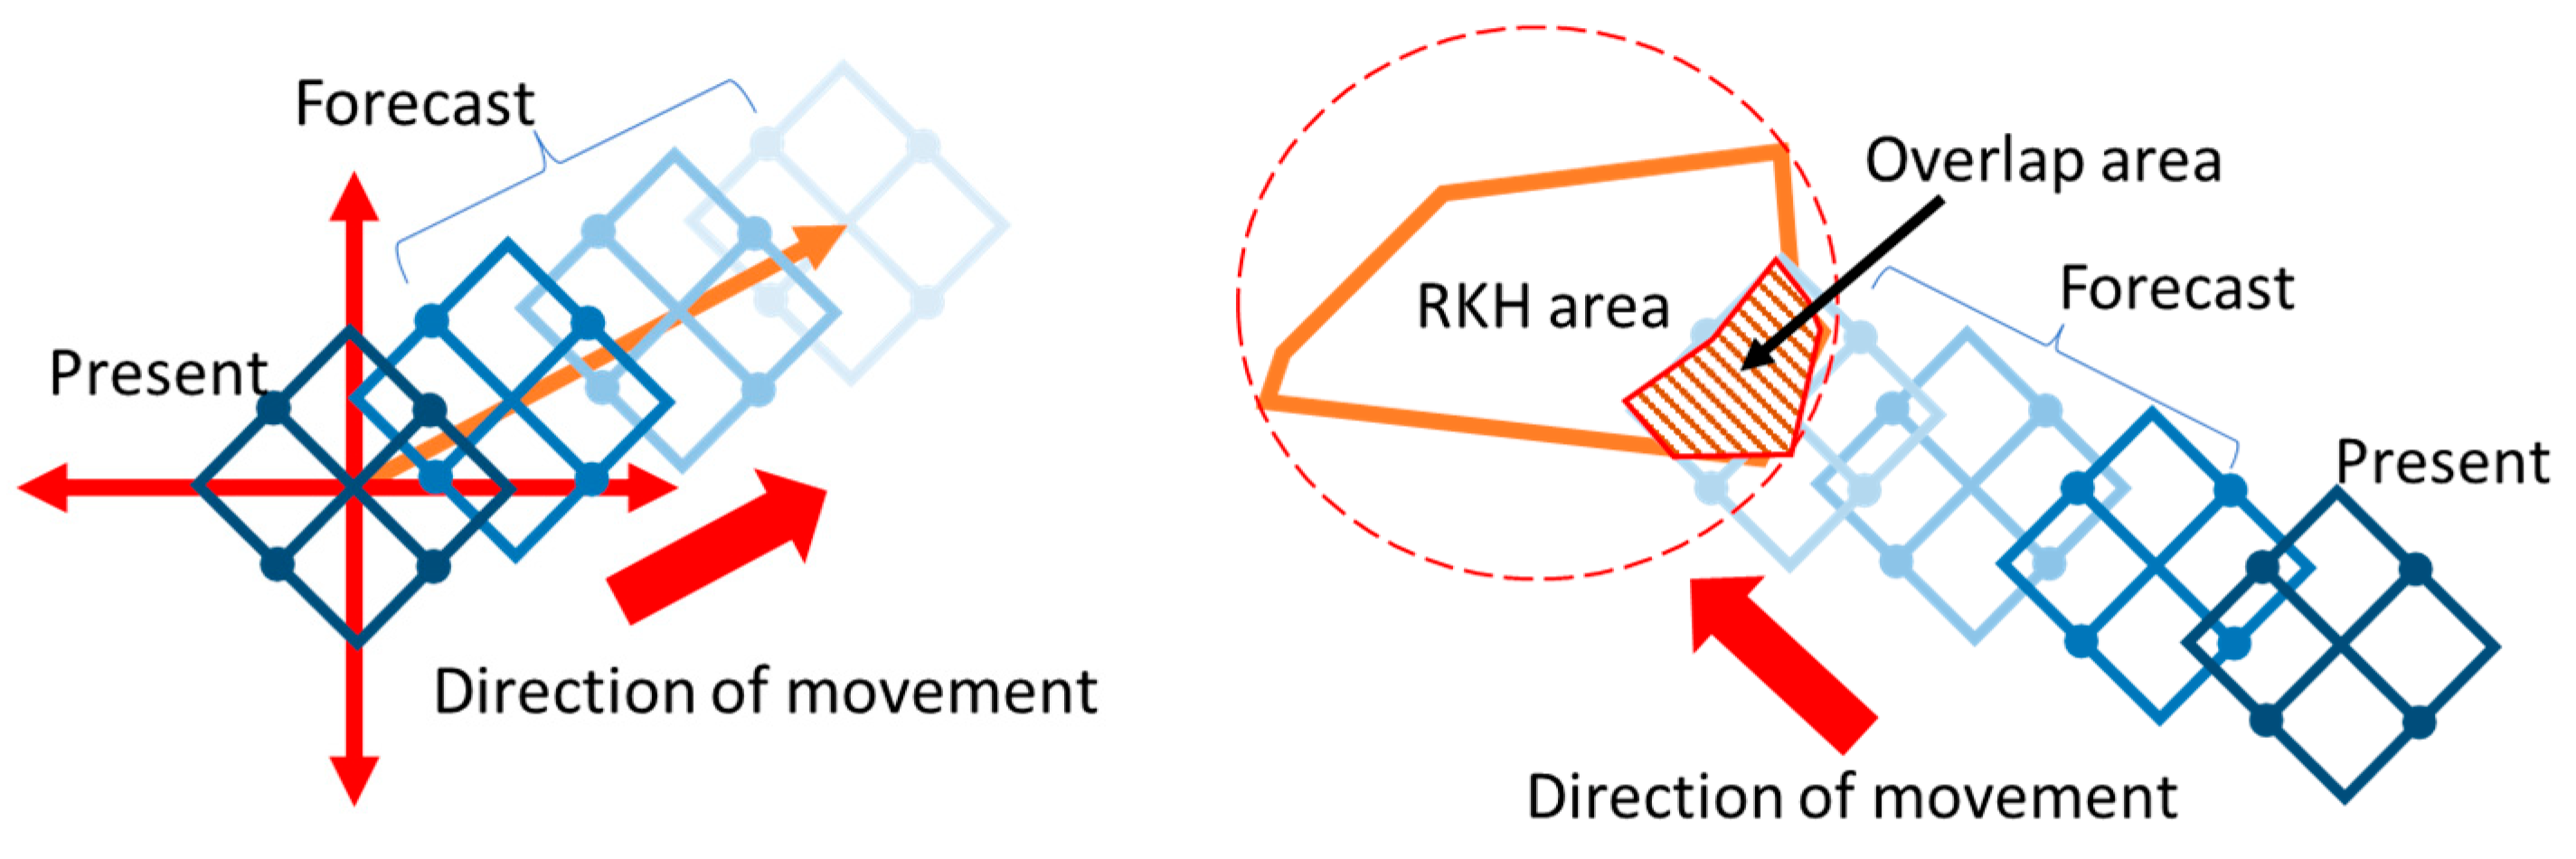
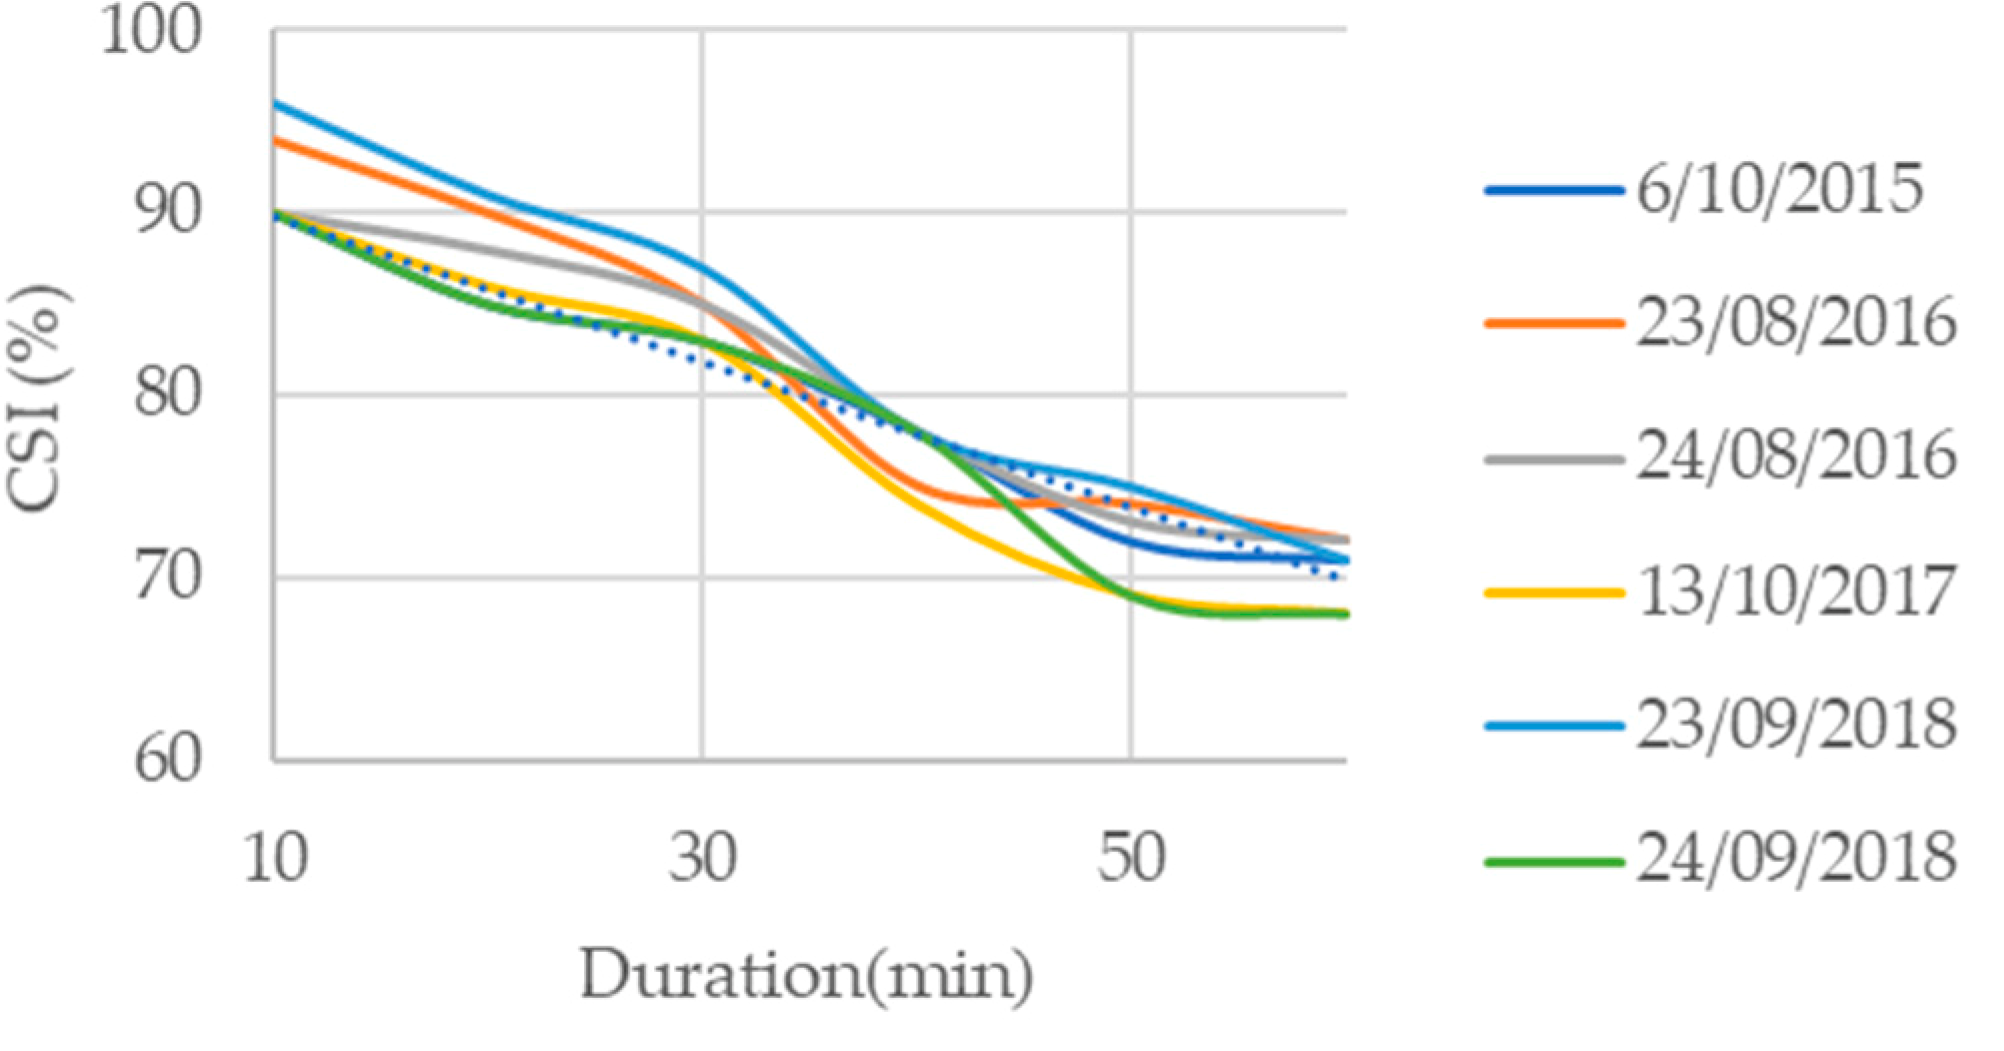
2.2.1. Module 1: Rainfall Input Data Processing

The rainfall input data processing has two components for data acquisition (Figure 4):
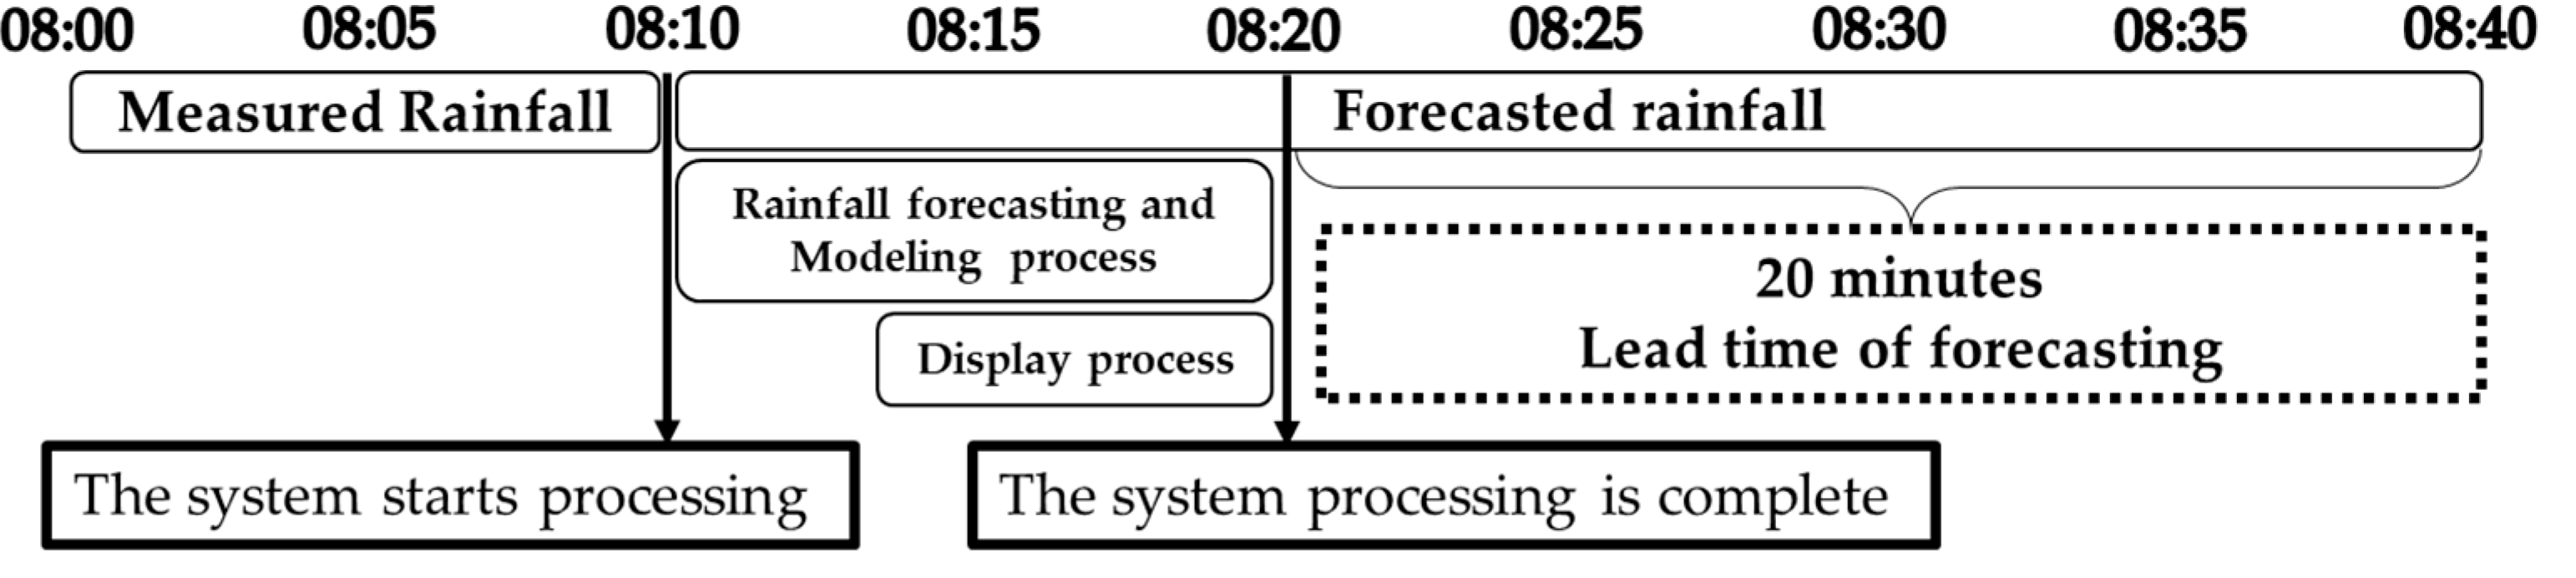
  • Measured rainfall data
The measured rainfall data were obtained for the Nong Jok weather radar station [95], which the BMA-DDS operates for use by the TITAN software to drive the rainfall forecasting. The RTFlood system processed, converted, and stored these data in .csv format every 10 min and subsequently distributed the data to the central database (Figure 3 and Figure 4). The data had the UF file format and are available in 5 min time steps.
  • Forecasted rainfall data
The TITAN software analyzed the radar rainfall data at 10 min intervals to track and forecast the storm movement in the study area. Although the rainfall data were received at 5 min time steps, TITAN required a 10 min rainfall duration, which is two steps backward from 5 min time steps to initiate the forecasting process. After the rainfall data are collected, TITAN analyzes the trend of the storm movement. The schematics of the forecasting are shown in Figure 5. An additional Python program was included to analyze the storm movement to forecast the precipitation positions as they traveled into the study area. The Critical Success Index (CSI) was used for evaluating forecasting accuracy in terms of matching rainfall from forecasting with measured radar rainfall in the recorded events. The CSI was defined with the following equation: CSI = (A)/(A + B + C), where A is a hit, B is a miss, and C is false [96]. The CSI has frequently been used to describe the skill of a forecast system to predict hydrometeorological phenomena (rainfall, rainfall thresholds for flooding, flood inundation levels) [96,97,98,99,100,101,102,103,104].

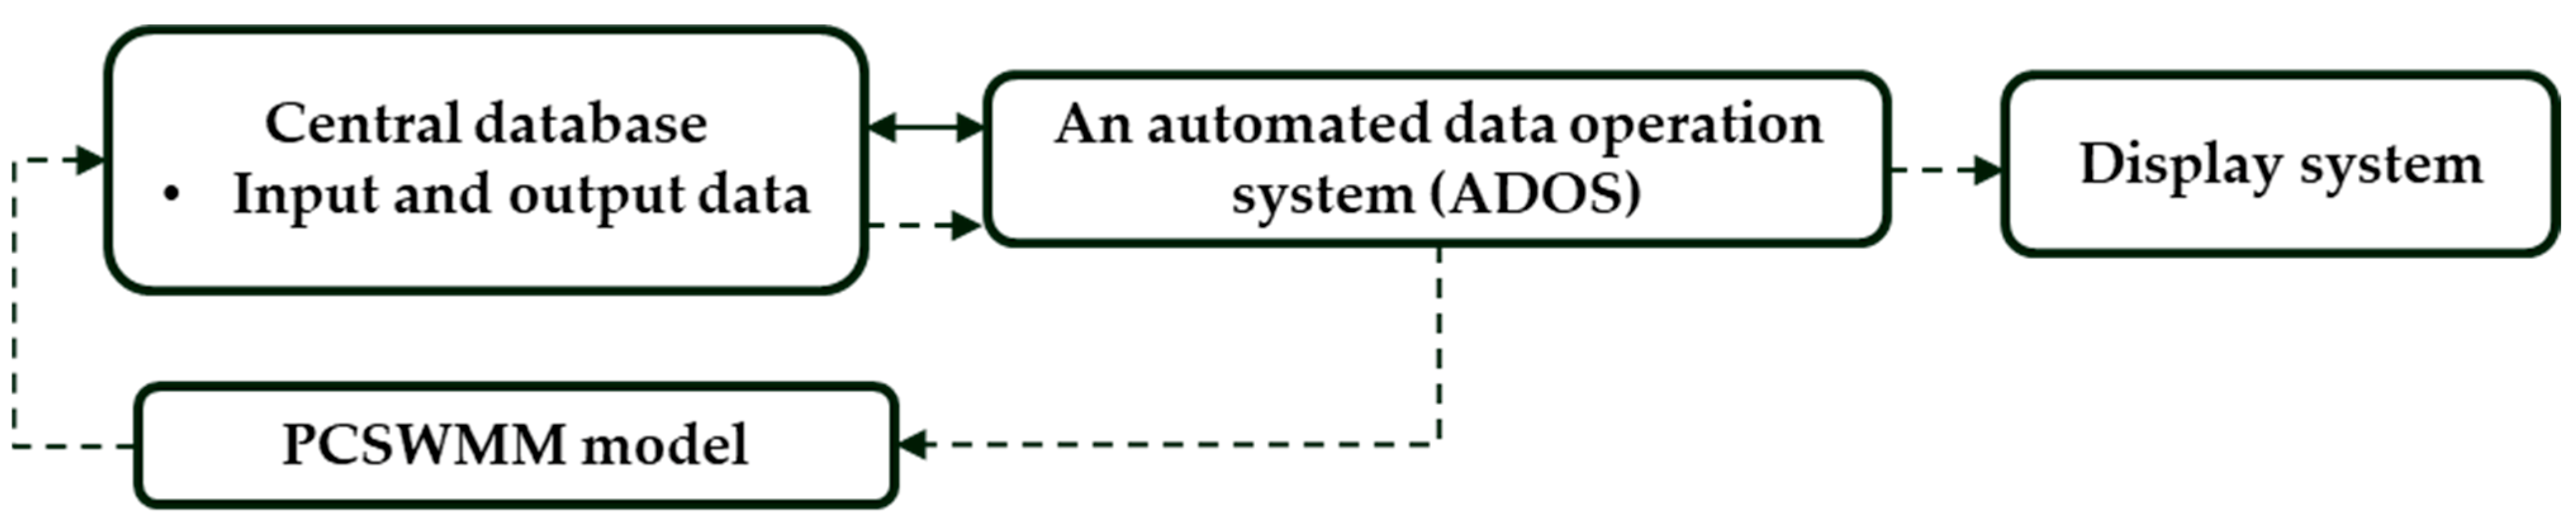
2.2.2. Module 2: An Automated Data Operation System (ADOS)

The core component of the RTFlood system, Module 2, was an automated data operation system (ADOS). The ADOS worked mainly to transfer and store both input and output data within the RTFlood platform, as shown in Figure 6. The rainfall input data are acquired in Module 1, and the ADOS subsequently pools and combines the data, delivering them to the central database in Module 2. The ADOS also managed the timings to deliver the rainfall input data to the stormwater model simulation with PCSWMM in Module 3 and subsequently transferred the output data for display on the website.

2.2.3. Module 3: Hydraulic Model Processing

PCSWMM sits on an open-source GIS to facilitate hydrologic and hydraulic attribute inputs, outputs, and data management and has comprehensive flow modeling tools, i.e., a real-time control analysis, time series management, Digital Elevation Model (DEM) support, automated reporting, and Google Earth visualization for hydrology, hydraulics, and water quality modeling [105,106]. It could also model stormwater pollutant source control technologies to predict water quantity and quality [96]. Therefore, PCSWMM was adopted for this study to investigate flash floods in terms of their locations and depths within the Ramkhamhaeng polder. It would be possible to use other physically based conceptual models for the hydrology and hydraulics of the system within the RTFlood platform, and efforts to provide this option will be explored as a goal of future research efforts.
  • Terrain data
The DEM with a spatial resolution of 2.5 cm was used to represent the terrain elevation of the Ramkhamhaeng polder, as shown in Figure 7. The data were obtained from this study’s UAV (Unmanned Aerial Vehicle) surveys. The high-resolution DEM made it possible to simulate the effects of buildings and roads in PCSWMM. The point cloud data from the UAV surveys contained the 3D (three-dimensional) coordinates, 2D ortho map, and elevation contour map. The accuracy of 2D urban runoff modeling is sensitive to DEM resolution [107,108,109,110], and this was a particularly critical consideration for our study catchment that exhibited micro-topographic relief.
  • A 1D flow model for drainage pipe/secondary canal networks and a 2D flow model for overland flow
In this study, the 1D model was developed using the pipe geometry and plan of the drainage pipe network from BMA-DDS. The typical geometry of the pipe was circular, and the diameter varied from 0.4 to 1.8 m. Open-flow secondary canal geometries (e.g., Figure 1) were represented as rectangular channels. The 1D model was coupled to the 2D model to represent the overland flow. The validation of the 2D model in PCSWMM was performed by comparing the modeled flood areas with observed (mapped) flood risk areas provided by BMA-DDS [51]. In PCSWMM, the streets and sewer links were connected as 1D lines, while the 2D overland flow model was represented using a DEM. The elevation gradient in the grid cells defined the topography of the study area. As shown in Figure 8, all components were connected to 2D cells. The characteristics of the drainage system and typologies of roads and buildings had a substantial influence on the water level in inundation areas. These obstructions were introduced to the 2D hydraulic model, such as pipe networks in the 1D node and link, and the topography of roads and buildings from the DEM in the form of 2D cells for the overland flow simulation.
Table 1 summarizes the number of 2D cells, the cell density per unit area, and the DEM resolution for the present model in the Ramkhamhaeng polder and the previous model for the Sukhumvit area [59]. The comparison shows that the present study has seven times higher cell density than the previous study, resulting in improved spatial terrain expression for flash flood simulation.
The flood inundation simulation by PCSWMM was calibrated from rainfall events of 2015–2017 and validated with 2018 events since the corresponding observation data were available from the flood location reports [51]. The SWMM model has a long history of development and support, first being released in the early 1970s under the auspices of the U.S. Environmental Protection Agency [111] and representative parameter values for a variety of urban conditions, as well as standardized procedures for model calibration and validation, are well-established [81,112]. While PCSWMM includes an auto calibrate tool [113,114,115,116], our preference is to calibrate the model manually, particularly for small catchment areas. Based on the study team’s experience and the literature [81,89,117,118,119,120,121,122,123,124], 10 surface catchment parameters are routinely identified as the primary focus for model calibration due to a combination of model sensitivity and parameter value uncertainty (percent imperviousness, the width of overland flow, depth of pervious surface storage, depth of impervious surface storage, catchment slope, Manning’s N of pervious surfaces, Manning’s N of impervious surfaces, the maximum infiltration rate of the Horton infiltration equation, the minimum infiltration rate of the Horton infiltration equation, and the decay coefficient of the Horton infiltration equation). In this study, we did not include drainage network characteristics in the calibration effort since geometries and slopes generally are well-documented. Furthermore, we did not conduct a full sensitivity analysis [124] as this was not the focus of the study and we did not have extensive flow data to support such an effort; instead, we were able to calibrate the model based on percent imperviousness and Manning’s N of impervious surfaces. Irvine et al. [124] also showed that in Singapore, the spatial variability of rainfall had a greater impact on model uncertainty than the surface hydrology parameters. The model results were compared with the observed inundation areas, as shown in Figure 9. Qualitatively the model results match well with the flooding locations on roads and intersections from the flooded location records. Thus, the model’s validation could be considered practical for the Ramkhamhaeng polder area.

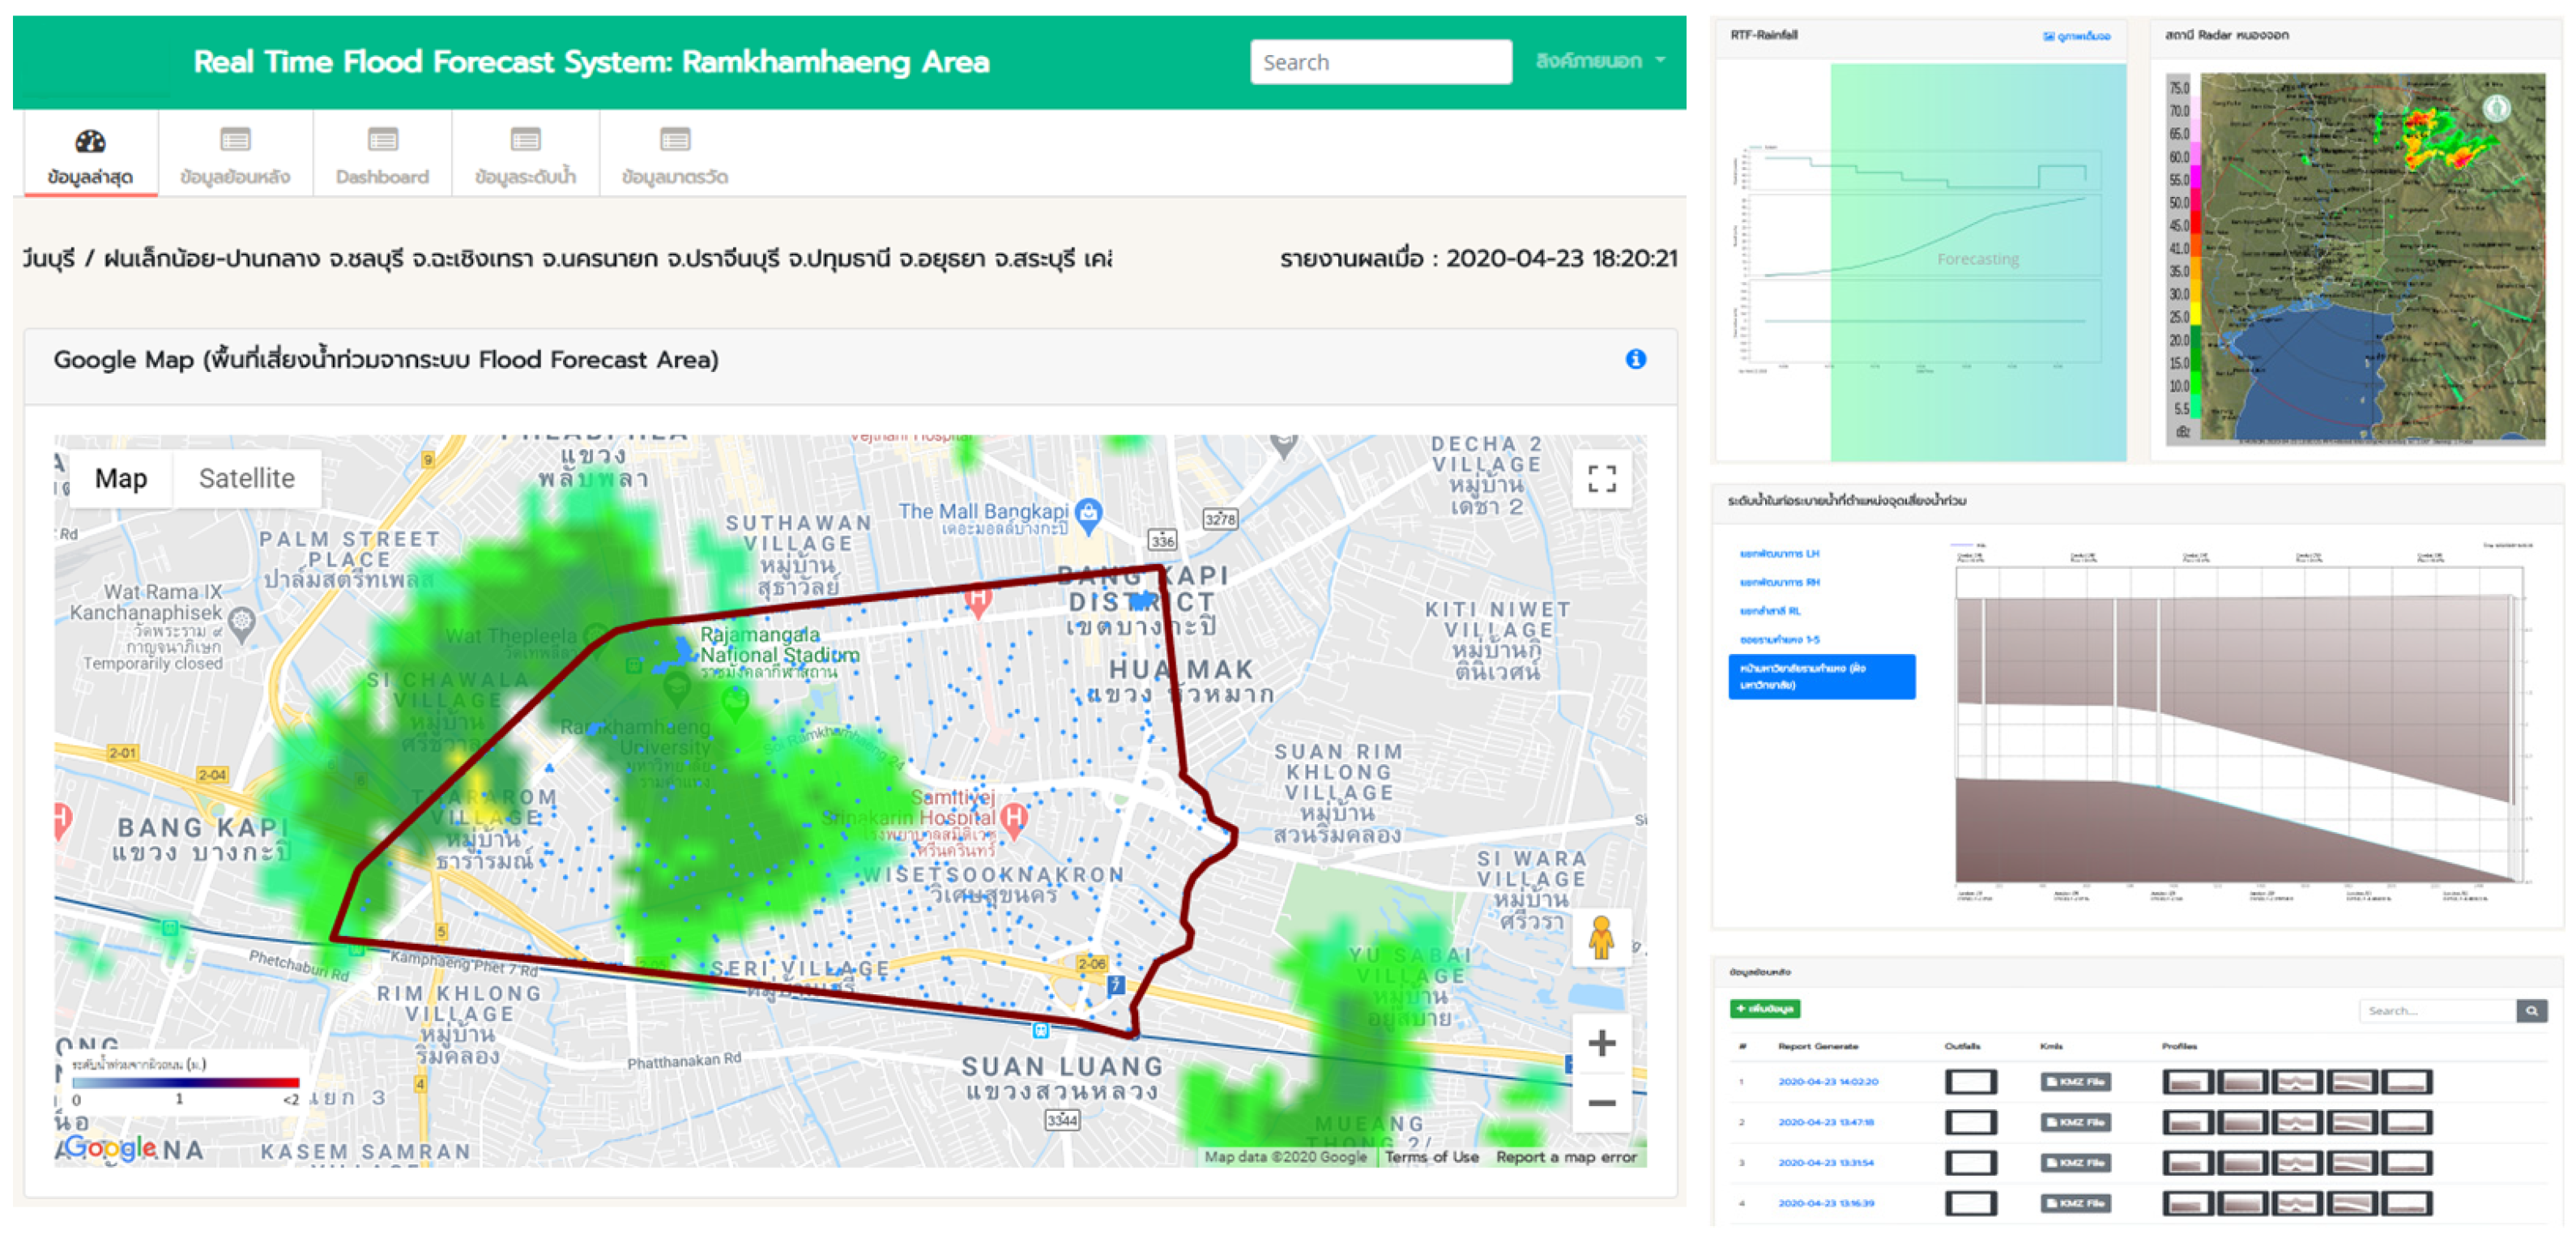
2.2.4. The Display System for Flood Forecasting

The designed presentations of water levels in time series, inundation maps, and their animation were provided to help the BMA administration staff support their decision making regarding flood management and community communication related to flood risk in the area. The RTFlood system results were presented in two ways. First, the simulation results were reported, for which the time series of water levels at nodes were automatically visualized. The nodes’ selection was based on the significance of flood inundation risk. Second, a real-time flood map was generated. The main display of the RTFlood system is visualized on a website with a web mapping platform (e.g., Google Maps) by overlaying the flood map result layer and the rainfall radar images on the same map, as shown in Figure 10. This type of visualization can be beneficial for providing near-real-time implementation of all urban flooding abatement measures.

3. Results

3.1. RTFlood System Operation

  • A lead time of the flood inundation forecasts
The lead time of the RTFlood system was tested for several flood cases with different measured and forecast rainfall durations. The interval time step of rainfall data was 5 min from the radar. Several varied rainfall duration cases were analyzed to set up the system runtime, starting from the minimum time step of rainfall data, 5 min to at least 60 min, based on compatibility, stability, and duration of the computing process. Moreover, the rainfall duration of the RTFlood system combines measured and forecast rainfall duration components, which represent the total rainfall processing time of the system. The overall processing time (including the PCSWMM runs, data management, and data visualization) also needs to be considered.
The total processing time is one of the critical limitations of a real-time forecasting system [39,44]. The forecast lead time is lost if the model runtime and the following processing times are too long. Moreover, the radar forecast needs at least two time steps or 10 min of rainfall duration to forecast the rainfall. Thus, the measured rainfall processing time was 10 min in the present study. The model results indicate that optimal performance occurred with rainfall forecasting of 30 min into the future, with a CSI of 84.4%, as shown in Figure 11. Although the CSI values were better at 10 min into the future forecasts, this duration is too short for most mitigation measures to be implemented as the PCSWMM run time, plus the other tasks took 10 min. Therefore, the modeling approach presented herein could provide 20 min of lead time from the initiation of the RTFlood real-time analysis. An example of the RTFlood system timeline is shown in Figure 12.
The RTFlood system was divided into three modules, as shown in Figure 2. The first module is rainfall input data, which consists of 10 min of measured rainfall and 30 min of the forecast rainfall. The input data were generated from the rainfall forecasting process and automatically updated every 10 min. The second module contained the automated data operation system (ADOS) to process and update data in terms of managing the timing, retrieving input and output data from the other modules, and displaying the results on a website. The third module was the hydraulic model processing, which simulated the 1D and 2D flows using PCSWMM. These modules required a total of 10 min of run time based on the computer resource of this study, the size of the hydraulic model settings, and the rainfall duration.

3.2. The Improvement of the RTFlood System

Observation data for 116 flood events were tested in this study. It was found that the system could accurately provide 71 pre-warnings for the 116 floods. The accuracy of the flood forecast (61.2%) also depends on the rainfall forecasting system’s accuracy. Thus, the RTFlood system needs accurate rainfall from the forecasting system to provide an accurate flood location in the study area. In turn, the accuracy of the rainfall forecasts and the runoff modeling is dependent on the weather radar accuracy [125,126,127]. The flood system provided notification of potential floods 20 min earlier than flood models with the separate use of ground rain stations and measured radar data individually, as summarized in Table 2 and [59]. This earlier alert could allow BMA administrative staff to be more informed and produce spatially explicit flood control decisions, including optimal operations of the pumps and canal gates.
The previous RTFlood system for the Sukhumvit area [59], located near the Ram-khamhaeng polder, was developed based on a similar concept. The previous system used 40 min of total rainfall processing, consisting of the input to the model containing 10 min for the measured rainfall duration and 30 min of the forecast duration, which is the same as the present study. However, the lead time for the Sukhumvit study was 10 min shorter than the 20 min provided in this study based on the computer resources of the system. In addition, the computation time was shorter for this study despite the much higher resolution input data. With the CSI index, the rainfall forecasting accuracy also increased from 80.0 to 84.4, which is the advantage of the TITAN application in this study. The CSI results for this study, in general, are satisfactory, as CSI values reported for rainfall in the literature generally are in the 20–80% range. The rainfall forecasting of the present study improved in terms of storm direction and intensity prediction. Thus, the flood forecasting accuracy improved from 58.0% to 61.2% by accurately providing pre-warning events, as summarized in Table 2.
The ratio of the 2D cells per square meter in Ramkhamhaeng, as shown in Table 1, was seven times higher than in the Sukhumvit area [59]. To compare the 2D flooding area accuracy of the Ramkhamhaeng polder in this study and the Sukhumvit area in the previous study [59], the ratio of the flooded cells to the total number of cells in the area was used. The flood forecasting accuracy for the Ramkhamhaeng study site was evaluated by comparing the simulated flooded area with the measured flood area. Because of the lack of measured data on flood depth, we focused on the frequently flooded locations of three zones reported by the BMA-DDS, as shown in Figure 13. The number of simulated 2D flooded cells was similar to the measured number of cells, with a relative error of 3.5–5.8% in the three zones, as shown in Table 3.

4. Discussion

The RTFlood platform, as defined in this research, is an integrated system that employs a rainfall forecasting system using TITAN and an urban flood model using PCSWMM. The rainfall forecasting system with radar data played an important role in determining the whole RTFlood system’s accuracy, including forecasting the piped system flows and overland floods. Rainfall forecasting was obtained approximately 30 min in advance in this study. All the flooded locations from RTFlood were similar to flood risk locations reported by BMA-DDS. The surface flooding was accumulated and concentrated at the drainage outlet points. The amount of rainfall used in this study generally was in the range of the 5- to 10-year return period used in Bangkok’s drainage system design [51]. Therefore, the drainage system improvement should be prioritized by implementing Water Sensitive Urban Design (WSUD) measures in the area. WSUD has the potential to reduce the surface runoff by up to 50% [83,127,128] and may accrue other ecosystem service benefits, including improved water quality, aesthetics, urban heat island mitigation, noise reduction, and enhanced biodiversity [105,129,130,131,132]. As illustrated in Figure 2 and discussed in [63,64,65], there is increasing interest in WSUD and NbS designs to manage runoff in Bangkok, although as shown in the recent review by [131], mainstreaming of WSUD/NbS designs in Southeast Asia remains limited, with insufficient primary hydrological data and information on societal and environmental impacts. Application of conceptual, physically based models such as PCSWMM are well suited to explore the hydrologic benefits of such green designs, as the processes are explicitly represented and visualized, thereby facilitating design thinking and optimization through the assessment of alternative scenarios [105].
Information from the 2D hydraulic model can be used to show flood maps in terms of inundation locations. A performance analysis was carried out using various flood events from the BMA-DDS in this study. Flooded areas predicted by the model accurately compared to the flood risk areas from the BMA-DDS in the study area. The RTFlood system provided flood estimate results 20 min in advance. The comparison of the RTFlood system with the previous system [59] showed improvement in terms of rainfall forecasting, high-resolution terrain data, faster performance, inundation prediction, and forecasting lead time. This lead time could be used as an accompanying announcement to administrative staff responsible for drainage management so that pump operations could commence in a timelier way, for example. However, this study’s lead time still seems to not be long enough to effectively notify the public of flood evacuation.
This research provides an example of successful real-time modeling in a tropical Global South context. Results from this project and an earlier project for the Sukhumvit area of Bangkok suggest that existing conceptual hydrologic/hydraulic models can adequately capture runoff and flood dynamics for this environment. However, four areas of caution and future work remain. First, although the TITAN weather forecasting model was successfully employed here, a more detailed analysis of its forecasting capability for a short duration, intense, tropical convectional events should be carried out. In addition, the relative accuracy of the combined weather radar and rain gauge system implemented in this study should be further evaluated. Uncertainty in the weather forecasting and radar/rain gauge systems will propagate to produce further uncertainty in hydrologic and hydraulic modeling. Second, although the study was able to acquire four years of flood location data to calibrate and validate the hydrologic/hydraulic model results, it would be preferable to have continuous flow monitoring stations in both the primary and secondary drainage systems. The availability of continuous data has been a limitation of rigorous calibration of hydrologic/hydraulic models in the Global South setting, but this shortcoming may gradually be addressed through the use of cost-effective IoT technology [133,134], as well as other creative indirect means such as crowdsourcing of flood locations and high-water marks on buildings and trees [135,136,137,138,139,140]. Third, the run times for the entire RTFlood platform were reasonable for the small area examined in this study. With larger city areas, run times, particularly for the 2D modeling, may become prohibitive for effective real-time forecasting. It is possible to run the 2D model in parallel on a computer cluster to speed up run time or, more cost-effectively, accrue increased computational speed by porting the model to the cloud [141]. We expect this latter approach to be utilized to a greater extent in the future. Finally, Mosavi et al. [142] recently reviewed machine learning applications for flood prediction as an alternative to conceptual, physically based models, noting that such applications “…can numerically formulate the flood nonlinearity, solely based on historical data without requiring knowledge about the underlying physical processes”. For the urban catchment modeling, as described here, we do not see a benefit for the data-driven approach that relies on pattern recognition without understanding the underlying physical processes, and because we have limited data. The runoff modeling is complicated by the flashiness of the urban surfaces and connection to the drainage system. As noted above, to assess design scenarios, a conceptual model also is preferable. However, recent studies have suggested that hybrid machine learning approaches with traditional quantitative rainfall estimates may improve forecast accuracy [143,144,145], and this should be explored as a future enhancement to RTFlood.

5. Conclusions

A real-time flood forecasting platform, RTFlood, was developed and trialed for an area of downtown Bangkok that is particularly vulnerable to flash floods. The RTFlood system contains three modules, namely, rainfall input data processing, automated data operation system (ADOS), and hydraulic model processing. The real-time platform accurately provided 71 pre-warnings 30 min in advance for 116 observed floods. This level of advanced warning would be sufficient to implement real-time control (e.g., pump operations, gate closures) within the system. However, flood warnings and evacuation probably could not be achieved. This project provided valuable information on the efficacy of real-time modeling approaches for cities in the Global South, particularly those in tropical climates. However, improvements should be considered in future efforts, particularly a deeper assessment of the TITAN rainfall forecasting model and the weather radar/rain gauges and porting the platform to the cloud to enhance run times.

Author Contributions

Conceptualization, D.C., H.M. and S.P.; methodology, D.C., H.M. and K.N.I.; software, D.C., K.N.I. and H.H.L.; validation, D.C.; formal analysis, D.C.; investigation, D.C.; data curation, D.C.; writing—original draft preparation, D.C.; writing—review and editing, D.C., H.M. and K.N.I.; visualization, D.C. and H.M.; supervision, H.M. All authors have read and agreed to the published version of the manuscript.

Funding

This research received no external funding.

Institutional Review Board Statement

Not applicable.

Informed Consent Statement

Not applicable.

Data Availability Statement

Not applicable.

Acknowledgments

The authors sincerely thank the Drainage and Sewerage Department of the Bangkok Metropolitan Administration for providing data and necessary information for the research. The authors would also like to thank all laboratory members for their advice and help in computer technology. D.C. is grateful to the CHI university grant program for the PCSWMM Professional 2D educational software from Computational Hydraulics International (CHI).

Conflicts of Interest

The authors declare no conflict of interest.

References

  1. Wu, Z.; Shen, Y.; Wang, H. Assessing urban areas’ vulnerability to flood disaster based on text data: A case study in Zhengzhou City. Sustainability 2019, 11, 4548. [Google Scholar] [CrossRef] [Green Version]
  2. Chang, H.; Pallathadka, A.; Sauer, J.; Grimm, N.; Zimmerman, R.; Cheng, C.; Iwaniec, D.; Kim, Y.; Lloyd, R.; McPhearson, T.; et al. Assessment of urban flood vulnerability using the social-ecological-technological systems framework in six US cities. Sustain. Cities Soc. 2021, 68, 102786. [Google Scholar] [CrossRef]
  3. Fatemi, M.; Okyere, S.; Diko, S.; Kita, M.; Shimoda, M.; Matsubara, S. Physical Vulnerability and Local Responses to Flood Damage in Peri-Urban Areas of Dhaka, Bangladesh. Sustainability 2020, 12, 3957. [Google Scholar] [CrossRef]
  4. McGranahan, G.; Balk, D.; Anderson, B. The rising tide: Assessing the risks of climate change and human settlements in low elevation coastal zones. Environ. Urban. 2007, 19, 17–37. [Google Scholar] [CrossRef]
  5. Fuchs, R.; Conran, M.; Louis, E. Climate change and Asia’s coastal urban cities: Can they meet the challenge? Environ. Urban. Asia 2011, 2, 13–28. [Google Scholar] [CrossRef]
  6. Ziegler, A.; She, L.; Tantasarin, C.; Jachowski, N.; Wasson, R. Floods, false hope, and the future. Hydrol. Process. 2012, 26, 1748–1750. [Google Scholar] [CrossRef]
  7. Chang, C.; Irvine, K. Climate Change Resilience and Public Education in Response to Hydrologic Extremes in Singapore. Br. J. Environ. Clim. Chang. 2014, 4, 328–354. [Google Scholar] [CrossRef]
  8. Kundzewicz, Z.; Kanae, S.; Seneviratne, S.; Handmer, J.; Nicholls, N.; Peduzzi, P.; Mechler, R.; Bouwer, L.; Arnell, N.; Mach, K.; et al. Flood risk and climate change: Global and regional perspectives. Hydrol. Sci. J. 2013, 59, 1–28. [Google Scholar] [CrossRef] [Green Version]
  9. Arnell, N.; Gosling, S. The impacts of climate change on river flood risk at the global scale. Clim. Chang. 2014, 134, 387–401. [Google Scholar] [CrossRef] [Green Version]
  10. Winsemius, H.; Aerts, J.; van Beek, L.; Bierkens, M.; Bouwman, A.; Jongman, B.; Kwadijk, J.; Ligtvoet, W.; Lucas, P.; van Vuuren, D.; et al. Global drivers of future river flood risk. Nat. Clim. Chang. 2015, 6, 381–385. [Google Scholar] [CrossRef]
  11. Promchote, P.; Simon Wang, S.; Johnson, P. The 2011 Great Flood in Thailand: Climate Diagnostics and Implications from Climate Change. J. Clim. 2015, 29, 367–379. [Google Scholar] [CrossRef] [Green Version]
  12. Hens, L.; Thinh, N.; Hanh, T.; Cuong, N.; Lan, T.; Thanh, N.; Le, D. Sea-level rise and resilience in Vietnam and the Asia-Pacific: A synthesis. Vietnam J. Earth Sci. 2018, 40, 127–153. [Google Scholar] [CrossRef] [Green Version]
  13. Ward, P.; Couasnon, A.; Eilander, D.; Haigh, I.; Hendry, A.; Muis, S.; Veldkamp, T.; Winsemius, H.; Wahl, T. Dependence between high sea-level and high river discharge increases flood hazard in global deltas and estuaries. Environ. Res. Lett. 2018, 13, 084012. [Google Scholar] [CrossRef]
  14. Hendry, A.; Haigh, I.; Nicholls, R.; Winter, H.; Neal, R.; Wahl, T.; Joly-Laugel, A.; Darby, S. Assessing the characteristics and drivers of compound flooding events around the UK coast. Hydrol. Earth Syst. Sci. 2019, 23, 3117–3139. [Google Scholar] [CrossRef] [Green Version]
  15. Vachaud, G.; Quertamp, F.; Phan, T.; Tran Ngoc, T.; Nguyen, T.; Luu, X.; Nguyen, A.; Gratiot, N. Flood-related risks in Ho Chi Minh City and ways of mitigation. J. Hydrol. 2019, 573, 1021–1027. [Google Scholar] [CrossRef]
  16. Pasquier, U.; He, Y.; Hooton, S.; Goulden, M.; Hiscock, K. An integrated 1D–2D hydraulic modeling approach to assess the sensitivity of a coastal region to compound flooding hazard under climate change. Nat. Hazards 2018, 98, 915–937. [Google Scholar] [CrossRef] [Green Version]
  17. Schmitt, T.; Thomas, M.; Ettrich, N. Analysis and modeling of flooding in urban drainage systems. J. Hydrol. 2004, 299, 300–311. [Google Scholar] [CrossRef]
  18. Hammond, M.; Chen, A.; Djordjević, S.; Butler, D.; Mark, O. Urban flood impact assessment: A state-of-the-art review. Urban Water J. 2013, 12, 14–29. [Google Scholar] [CrossRef] [Green Version]
  19. Teng, J.; Jakeman, A.; Vaze, J.; Croke, B.; Dutta, D.; Kim, S. Flood inundation modeling: A review of methods, recent advances and uncertainty analysis. Environ. Model. Softw. 2017, 90, 201–216. [Google Scholar] [CrossRef]
  20. Irvine, K.; Sovann, C.; Suthipong, S.; Kok, S.; Chea, E. Application of PCSWMM to Assess Wastewater Treatment and Urban Flooding Scenarios in Phnom Penh, Cambodia: A Tool to Support Eco-City Planning. J. Water Manag. Model. 2015, C389. [Google Scholar] [CrossRef]
  21. Loc, H.; Babel, M.; Weesakul, S.; Irvine, K.; Duyen, P. Exploratory Assessment of SUDS Feasibility in Nhieu Loc-Thi Nghe Basin, Ho Chi Minh City, Vietnam. Br. J. Environ. Clim. Chang. 2015, 5, 91–103. [Google Scholar] [CrossRef] [PubMed]
  22. Avila, L.; Avila, H.; Sisa, A. A Reactive Early Warning Model for Urban Flash Flood Management. In Proceedings of the World Environmental and Water Resources Congress 2017, Sacramento, CA, USA, 21–25 May 2017. [Google Scholar]
  23. Sidek, L.; Chua, L.; Azizi, A.; Basri, H.; Jaafar, A.; Moon, W. Application of PCSWMM for the 1-D and 1-D–2-D Modeling of Urban Flooding in Damansara Catchment, Malaysia. Appl. Sci. 2021, 11, 9300. [Google Scholar] [CrossRef]
  24. Pinos, J.; Quesada-Román, A. Flood Risk-Related Research Trends in Latin America and the Caribbean. Water 2021, 14, 10. [Google Scholar] [CrossRef]
  25. Ben-Daoud, A.; Ben-Daoud, M.; Moroșanu, G.; M’Rabet, S. The use of low impact development technologies in the attenuation of flood flows in an urban area: Settat city (Morocco) as a case. Environ. Chall. 2022, 6, 100403. [Google Scholar] [CrossRef]
  26. Nkwunonwo, U.; Whitworth, M.; Baily, B. A review of the current status of flood modeling for urban flood risk management in the developing countries. Sci. Afr. 2020, 7, e00269. [Google Scholar]
  27. Rivard, G.; Rinfret, L.; Davidson, S.; Morin, P.; Vinicio Corrales, M.; Kompaniets, S. Applying Stormwater Management Concepts in Tropical Countries. J. Water Manag. Model. 2006, R225-03. [Google Scholar] [CrossRef]
  28. Irvine, K. Climate Change and Urban Hydrology: Research Needs in the Developed and Developing Worlds. J. Water Manag. Model. 2013, R246-11. [Google Scholar] [CrossRef]
  29. Chaudhary, S.; Chua, L.; Kansal, A. Modeling washoff in temperate and tropical urban catchments. J. Hydrol. 2021, 603, 126951. [Google Scholar] [CrossRef]
  30. Petheram, C.; Rustomji, P.; Chiew, F.; Vleeshouwer, J. Rainfall–runoff modeling in northern Australia: A guide to modeling strategies in the tropics. J. Hydrol. 2012, 462–463, 28–41. [Google Scholar] [CrossRef]
  31. Kempen, G.; van der Wiel, K.; Melsen, L. The impact of hydrological model structure on the simulation of extreme runoff events. Nat. Hazards Earth Syst. Sci. 2021, 21, 961–976. [Google Scholar] [CrossRef]
  32. Georgakakos, K. On the Design of National, Real-Time Warning Systems with Capability for Site-Specific, Flash-Flood Forecasts. Bull. Am. Meteorol. Soc. 1986, 67, 1233–1239. [Google Scholar] [CrossRef]
  33. Bedient, P.; Holder, A.; Benavides, J.; Vieux, B. Radar-Based Flood Warning System Applied to Tropical Storm Allison. J. Hydrol. Eng. 2003, 8, 308–318. [Google Scholar] [CrossRef]
  34. Martin, C.; Russell, S.; Amico, C.; Wagner, L.; James, R.; Vogelsang, T. Integrated Web-Based Flow Monitoring and Hydraulic Modeling in Erie County, New York. J. Water Manag. Model. 2008, R228-08. [Google Scholar] [CrossRef] [Green Version]
  35. García, L.; Barreiro-Gomez, J.; Escobar, E.; Téllez, D.; Quijano, N.; Ocampo-Martinez, C. Modeling and real-time control of urban drainage systems: A review. Adv. Water Resour. 2015, 85, 120–132. [Google Scholar] [CrossRef] [Green Version]
  36. Liang, R.; Thyer, M.; Maier, H.; Dandy, G.; Di Matteo, M. Optimising the design and real-time operation of systems of distributed stormwater storages to reduce urban flooding at the catchment scale. J. Hydrol. 2021, 602, 126787. [Google Scholar] [CrossRef]
  37. Qi, W.; Ma, C.; Xu, H.; Chen, Z.; Zhao, K.; Han, H. A review on applications of urban flood models in flood mitigation strategies. Nat. Hazards 2021, 108, 31–62. [Google Scholar] [CrossRef]
  38. Maiolo, M.; Palermo, S.; Brusco, A.; Pirouz, B.; Turco, M.; Vinci, A.; Spezzano, G.; Piro, P. On the Use of a Real-Time Control Approach for Urban Stormwater Management. Water 2020, 12, 2842. [Google Scholar] [CrossRef]
  39. Brendel, C.; Dymond, R.; Aguilar, M. Integration of quantitative precipitation forecasts with real-time hydrology and hydraulics modeling towards probabilistic forecasting of urban flooding. Environ. Model. Softw. 2020, 134, 104864. [Google Scholar] [CrossRef]
  40. René, J.; Djordjević, S.; Butler, D.; Madsen, H.; Mark, O. Assessing the potential for real-time urban flood forecasting based on a worldwide survey on data availability. Urban Water J. 2013, 11, 573–583. [Google Scholar] [CrossRef] [Green Version]
  41. Piadeh, F.; Behzadian, K.; Alani, A. A critical review of real-time modeling of flood forecasting in urban drainage systems. J. Hydrol. 2022, 607, 127476. [Google Scholar] [CrossRef]
  42. Hjelmstad, A.; Shrestha, A.; Garcia, M.; Mascaro, G. Propagation of radar rainfall uncertainties into urban pluvial flood modeling during the North American monsoon. Hydrol. Sci. J. 2021, 66, 2232–2248. [Google Scholar] [CrossRef]
  43. Rohrer, A.; Armitage, N. Improving the Viability of Stormwater Harvesting through Rudimentary Real Time Control. Water 2017, 9, 371. [Google Scholar] [CrossRef] [Green Version]
  44. Henonin, J.; Russo, B.; Mark, O.; Gourbesville, P. Real-time urban flood forecasting and modeling—A state of the art. J. Hydroinform. 2013, 15, 717–736. [Google Scholar] [CrossRef]
  45. Worawiwat, A.; Chaleeraktrakoon, C.; Sharma, A. Is increased flooding in Bangkok a result of rising local temperatures? J. Hydrol. X 2021, 13, 100095. [Google Scholar] [CrossRef]
  46. Marks, D.; Connell, J.; Ferrara, F. Contested notions of disaster justice during the 2011 Bangkok floods: Unequal risk, unrest and claims to the city. Asia Pac. Viewp. 2020, 61, 19–36. [Google Scholar] [CrossRef]
  47. Schmidt-Thomé, P. The 2011 floods in bangkok—causes and consequences. Reg. Mag. 2012, 288, 20–22. [Google Scholar] [CrossRef]
  48. Loc, H.; Park, E.; Chitwatkulsiri, D.; Lim, J.; Yun, S.; Maneechot, L.; Minh Phuong, D. Local rainfall or river overflow? Re-evaluating the cause of the Great 2011 Thailand flood. J. Hydrol. 2020, 589, 125368. [Google Scholar] [CrossRef]
  49. Laeni, N.; van den Brink, M.; Arts, J. Is Bangkok becoming more resilient to flooding? A framing analysis of Bangkok’s flood resilience policy combining insights from both insiders and outsiders. Cities 2019, 90, 157–167. [Google Scholar] [CrossRef]
  50. The Urbanization of Bangkok: Its Prominence, Problems, and Prospects. Available online: https://archive.unu.edu/unupress/unupbooks/uu11ee/uu11ee0z.htm (accessed on 6 February 2022).
  51. BANGKOK Urban Planning and Urban Development. Available online: http://iad.bangkok.go.th/en/node/4971 (accessed on 6 February 2022).
  52. Department of Drainage and Sewerage Annual Report. Available online: https://dds.bangkok.go.th/eng/index.php (accessed on 6 February 2022).
  53. René, J.; Djordjević, S.; Butler, D.; Mark, O.; Henonin, J.; Eisum, N.; Madsen, H. A real-time pluvial flood forecasting system for Castries, St. Lucia. J. Flood Risk Manag. 2015, 11, S269–S283. [Google Scholar] [CrossRef] [Green Version]
  54. Şensoy, A.; Uysal, G.; Şorman, A. Developing a decision support framework for real-time flood management using integrated models. J. Flood Risk Manag. 2016, 11, S866–S883. [Google Scholar] [CrossRef]
  55. Annis, A.; Nardi, F. Integrating VGI and 2D hydraulic models into a data assimilation framework for real time flood forecasting and mapping. Geo-Spat. Inf. Sci. 2019, 22, 223–236. [Google Scholar] [CrossRef] [Green Version]
  56. Chen, Y.; Zhou, H.; Zhang, H.; Du, G.; Zhou, J. Urban flood risk warning under rapid urbanization. Environ. Res. 2015, 139, 3–10. [Google Scholar] [CrossRef] [PubMed]
  57. Peyron, N.; Raymond, M.; Alfonsi, F.; Naigre, B. Implementation of a Unique Real Time Flash Flood Forecasting System in Martinique (France). J. Water Manag. Model. 2010, R236-03. [Google Scholar] [CrossRef] [Green Version]
  58. Zanchetta, A.; Coulibaly, P. Recent Advances in Real-Time Pluvial Flash Flood Forecasting. Water 2020, 12, 570. [Google Scholar] [CrossRef] [Green Version]
  59. Chitwatkulsiri, D.; Miyamoto, H.; Weesakul, S. Development of a Simulation Model for Real-Time Urban Floods Warning: A Case Study at Sukhumvit Area, Bangkok, Thailand. Water 2021, 13, 1458. [Google Scholar] [CrossRef]
  60. Flood Prevention and Response Action Plan. Available online: https://dds.bangkok.go.th/eng/about23.php (accessed on 6 February 2022).
  61. Gozzoli, P.; Rongrat, T.; Gozzoli, R. Design Thinking and Urban Community Development: East Bangkok. Sustainability 2022, 14, 4117. [Google Scholar] [CrossRef]
  62. Sawangnate, C.; Chaisri, B.; Kittipongvises, S. Flood Hazard Mapping and Flood Preparedness Literacy of the Elderly Population Residing in Bangkok, Thailand. Water 2022, 14, 1268. [Google Scholar] [CrossRef]
  63. Yarnvudhi, A.; Leksungnoen, N.; Tor-Ngern, P.; Premashthira, A.; Thinkampheang, S.; Hermhuk, S. Evaluation of Regulating and Provisioning Services Provided by a Park Designed to Be Resilient to Climate Change in Bangkok, Thailand. Sustainability 2021, 13, 13624. [Google Scholar] [CrossRef]
  64. Chan, N.; Tan, M.; Ghani, A.; Zakaria, N. Sustainable urban drainage as a viable measure of coping with heat and floods due to climate change. IOP Conf. Ser. Earth Environ. Sci. 2019, 257, 012013. [Google Scholar] [CrossRef]
  65. Kongphunphin, C.; Srivanit, M. A Multi-Dimensional Clustering Applied to Classify the Typology of Urban Public Parks in Bangkok Metropolitan Area, Thailand. Sustainability 2021, 13, 11426. [Google Scholar] [CrossRef]
  66. Thunderstorm Identification, Tracking, Analysis, and Nowcasting (TITAN)|NCAR Research Applications Laboratory|RAL. Available online: https://ral.ucar.edu/solutions/products/thunderstorm-identification-tracking-analysis-and-nowcasting-titan (accessed on 6 February 2022).
  67. Dixon, M.; Wiener, G. TITAN: Thunderstorm Identification, Tracking, Analysis, and Nowcasting—A Radar-based Methodology. J. Atmos. Ocean. Technol. 1993, 10, 785–797. [Google Scholar] [CrossRef]
  68. Sharif, H.; Yates, D.; Roberts, R.; Mueller, C. The Use of an Automated Nowcasting System to Forecast Flash Floods in an Urban Watershed. J. Hydrometeorol. 2006, 7, 190–202. [Google Scholar] [CrossRef] [Green Version]
  69. Pierce, C.; Ebert, E.; Seed, A.; Sleigh, M.; Collier, C.; Fox, N.; Donaldson, N.; Wilson, J.; Roberts, R.; Mueller, C. The Nowcasting of Precipitation during Sydney 2000: An Appraisal of the QPF Algorithms. Weather Forecast. 2004, 19, 7–21. [Google Scholar] [CrossRef]
  70. Prudden, R.; Adams, S.; Kangin, D.; Robinson, N.; Ravuri, S.; Mohamed, S.; Arribas, A. A Review of Radar-Based Nowcasting of Precipitation and Applicable Machine Learning Techniques. Available online: https://arxiv.org/abs/2005.04988 (accessed on 12 May 2022).
  71. Wang, Y.; Tang, L. A Short-Term Quantitative Precipitation Forecasting Approach Using Radar Data and a RAP Model. Geomatics 2021, 1, 310–323. [Google Scholar] [CrossRef]
  72. Moser, B.; Gallus, W.; Mantilla, R. An Initial Assessment of Radar Data Assimilation on Warm Season Rainfall Forecasts for Use in Hydrologic Models. Weather Forecast. 2015, 30, 1491–1520. [Google Scholar] [CrossRef]
  73. Spyrou, C.; Varlas, G.; Pappa, A.; Mentzafou, A.; Katsafados, P.; Papadopoulos, A.; Anagnostou, M.; Kalogiros, J. Implementation of a Nowcasting Hydrometeorological System for Studying Flash Flood Events: The Case of Mandra, Greece. Remote Sens. 2020, 12, 2784. [Google Scholar] [CrossRef]
  74. Shehu, B.; Haberlandt, U. Relevance of merging radar and rainfall gauge data for rainfall nowcasting in urban hydrology. J. Hydrol. 2021, 594, 125931. [Google Scholar] [CrossRef]
  75. Imhoff, R.; Brauer, C.; Overeem, A.; Weerts, A.; Uijlenhoet, R. Spatial and Temporal Evaluation of Radar Rainfall Nowcasting Techniques on 1,533 Events. Water Resour. Res. 2020, 56, e2019WR026723. [Google Scholar] [CrossRef]
  76. Bopape, M.; Sebego, E.; Ndarana, T.; Maseko, B.; Netshilema, M.; Gijben, M.; Landman, S.; Phaduli, E.; Rambuwani, G.; van Hemert, L.; et al. Evaluating South African Weather Service information on Idai tropical cyclone and KwaZulu-Natal flood events. S. Afr. J. Sci. 2021, 117, 1–13. [Google Scholar] [CrossRef]
  77. Yates, D.; Warner, T.; Brandes, E.; Leavesley, G.; Sun, J.; Mueller, C. Evaluation of Flash-Flood Discharge Forecasts in Complex Terrain Using Precipitation. J. Hydrol. Eng. 2001, 6, 265–274. [Google Scholar] [CrossRef]
  78. Chu, H.; Liu, M.; Sun, M.; Chen, L. Rainfall Nowcasting by Blending of Radar Data and Numerical Weather Prediction. Available online: https://www.intechopen.com/chapters/64130 (accessed on 12 May 2022).
  79. Wang, L.; Wang, H.; Heng, Z. A rapid identification and warning method for severe weather via Doppler radar based on an improved TITAN algorithm. J. Atmos. Sol.-Terr. Phys. 2019, 193, 105080. [Google Scholar] [CrossRef]
  80. SWMM5 Modeling with PCSWMM. Available online: https://www.pcswmm.com/ (accessed on 6 February 2022).
  81. James, W.; Huber, W.; Rossman, L.; Dickinson, R.; Pitt, R.; James, R.; Aldrich, J. Storm Water Management Model (PCSWMM)-Version 5: User’s Guide to SWMM; Computational Hydraulics International (CHI): Guelph, ON, Canada, 2010. [Google Scholar]
  82. Marvin, J.; Wilson, A. One Dimensional, Two Dimensional and Three Dimensional Hydrodynamic Modeling of a Dyked Coastal River in the Bay of Fundy. J. Water Manag. Model. 2016, 25, C404. [Google Scholar] [CrossRef] [Green Version]
  83. Akhter, M.; Hewa, G. The Use of PCSWMM for Assessing the Impacts of Land Use Changes on Hydrological Responses and Performance of WSUD in Managing the Impacts at Myponga Catchment, South Australia. Water 2016, 8, 511. [Google Scholar] [CrossRef]
  84. Akter, A.; Alam, M. Urban Flood Hazard Modeling and Mapping Using PCSWMM. In Proceedings of the International Conference on Sustainable Infrastructure 2019, Los Angeles, CA, USA, 6–9 November 2019. [Google Scholar]
  85. Beganskas, S.; Ryan, R.; Walters, E.; Soro, M.; Cushman, E.; Toran, L. Coupling PCSWMM and WASP to Evaluate Green Stormwater Infrastructure Impacts to Storm Sediment Loads in an Urban Watershed. JAWRA J. Am. Water Resour. Assoc. 2020, 57, 134–153. [Google Scholar] [CrossRef]
  86. Nasrin, T.; Sharma, A.; Muttil, N. Impact of Short Duration Intense Rainfall Events on Sanitary Sewer Network Performance. Water 2017, 9, 225. [Google Scholar] [CrossRef] [Green Version]
  87. Goncalves, M.; Zischg, J.; Rau, S.; Sitzmann, M.; Rauch, W.; Kleidorfer, M. Modeling the Effects of Introducing Low Impact Development in a Tropical City: A Case Study from Joinville, Brazil. Sustainability 2018, 10, 728. [Google Scholar] [CrossRef] [Green Version]
  88. Shrestha, A.; Chaosakul, T.; Priyankara, D.; Chuyen, L.; Myat, S.; Syne, N.; Irvine, K.; Koottatep, T.; Babel, M. Application of PCSWMM to Explore Possible Climate Change Impacts on Surface Flooding in a Peri-Urban Area of Pathumthani, Thailand. J. Water Manag. Model. 2014, C377. [Google Scholar] [CrossRef] [Green Version]
  89. Irvine, K.; Chua, L. Modeling Stormwater Runoff from an Urban Park, Singapore Using PCSWWM. J. Water Manag. Model. 2016, 25, C410. [Google Scholar] [CrossRef] [Green Version]
  90. Paule-Mercado, M.; Lee, B.; Memon, S.; Umer, S.; Salim, I.; Lee, C. Influence of land development on stormwater runoff from a mixed land use and land cover catchment. Sci. Total Environ. 2017, 599–600, 2142–2155. [Google Scholar] [CrossRef]
  91. Pilotti, M.; Barone, L.; Balistrocchi, M.; Valerio, G.; Milanesi, L.; Nizzoli, D. Nutrient delivery efficiency of a combined sewer along a lake challenged by incipient eutrophication. Water Res. 2021, 190, 116727. [Google Scholar] [CrossRef]
  92. KC, S.; Shrestha, S.; Ninsawat, S.; Chonwattana, S. Predicting flood events in Kathmandu Metropolitan City under climate change and urbanisation. J. Environ. Manag. 2021, 281, 111894. [Google Scholar] [CrossRef] [PubMed]
  93. Munir, B.; Ahmad, S.; Hafeez, S. Integrated Hazard Modeling for Simulating Torrential Stream Response to Flash Flood Events. ISPRS Int. J. Geo-Inf. 2019, 9, 1. [Google Scholar] [CrossRef] [Green Version]
  94. SWMM5/PCSWMM 2D Application for Urban Dual Drainage Modeling. Available online: https://www.icwmm.org/Archive/2012-C021-29/swmm5-pcswmm-2d-application-for-urban-dual-drainage-modeling (accessed on 6 February 2022).
  95. Nong Jok Weather Radar Station. Available online: https://weather.bangkok.go.th/Radar/ (accessed on 6 February 2022).
  96. Rezaei, A.; Ismail, Z.; Niksokhan, M.; Dayarian, M.; Ramli, A.; Shirazi, S. A Quantity–Quality Model to Assess the Effects of Source Control Stormwater Management on Hydrology and Water Quality at the Catchment Scale. Water 2019, 11, 1415. [Google Scholar] [CrossRef] [Green Version]
  97. Norbiato, D.; Borga, M.; Degli Esposti, S.; Gaume, E.; Anquetin, S. Flash flood warning based on rainfall thresholds and soil moisture conditions: An assessment for gauged and ungauged basins. J. Hydrol. 2008, 362, 274–290. [Google Scholar] [CrossRef]
  98. Gourley, J.; Erlingis, J.; Hong, Y.; Wells, E. Evaluation of Tools Used for Monitoring and Forecasting Flash Floods in the United States. Weather Forecast. 2012, 27, 158–173. [Google Scholar] [CrossRef] [Green Version]
  99. Fares, A.; Awal, R.; Michaud, J.; Chu, P.; Fares, S.; Kodama, K.; Rosener, M. Rainfall-runoff modeling in a flashy tropical watershed using the distributed HL-RDHM model. J. Hydrol. 2014, 519, 3436–3447. [Google Scholar] [CrossRef] [Green Version]
  100. Li, Y.; Lu, G.; Wu, Z.; He, H.; Shi, J.; Ma, Y.; Weng, S. Evaluation of optimized WRF precipitation forecast over a complex topography region during flood season. Atmosphere 2016, 7, 145. [Google Scholar] [CrossRef] [Green Version]
  101. Jeong, C.H.; Kim, W.; Joo, W.; Jang, D.; Yi, M.Y. Enhancing the Encoding-Forecasting Model for Precipitation Nowcasting by Putting High Emphasis on the Latest Data of the Time Step. Atmosphere 2021, 12, 261. [Google Scholar] [CrossRef]
  102. Sharma, K.; Ashrit, R.; Kumar, S.; Milton, S.; Rajagopal, E.N.; Mitra, A.K. Unified model rainfall forecasts over India during 2007–2018: Evaluating extreme rains over hilly regions. J. Earth Syst. Sci. 2021, 130, 1–13. [Google Scholar] [CrossRef]
  103. Luong, T.T.; Pöschmann, J.; Kronenberg, R.; Bernhofer, C. Rainfall threshold for flash flood warning based on model output of soil moisture: Case study Wernersbach, Germany. Water 2021, 13, 1061. [Google Scholar] [CrossRef]
  104. Chen, L.; Cao, Y.; Ma, L.; Zhang, J. A deep learning-based methodology for precipitation nowcasting with radar. Earth Space Sci. 2020, 7, e2019EA000812. [Google Scholar] [CrossRef] [Green Version]
  105. Irvine, K.; Loc, H.; Sovann, C.; Suwanarit, A.; Likitswat, F.; Jindal, R.; Koottatep, T.; Gaut, J.; Chua, L.; Qi, L.; et al. Bridging the Form and Function Gap in Urban Green Space Design through Environmental Systems Modeling. J. Water Manag. Model. 2021, 29, C476. [Google Scholar] [CrossRef]
  106. Abdelrahman, Y.; Moustafa, A.; Elfawy, M. Simulating Flood Urban Drain. Netw. Through 1d/2d Model Analysis. J. Water Manag. Model. 2018, 26, C454. [Google Scholar] [CrossRef]
  107. Shen, J.; Tan, F. Effects of DEM resolution and resampling technique on building treatment for urban inundation modeling: A case study for the 2016 flooding of the HUST campus in Wuhan. Nat. Hazards 2020, 104, 927–957. [Google Scholar] [CrossRef]
  108. Yu, D.; Lane, S. Urban fluvial flood modeling using a two-dimensional diffusion-wave treatment, part 1: Mesh resolution effects. Hydrol. Process. 2006, 20, 1541–1565. [Google Scholar] [CrossRef]
  109. Shrestha, A.; Mascaro, G.; Garcia, M. Effects of stormwater infrastructure data completeness and model resolution on urban flood modeling. J. Hydrol. 2022, 607, 127498. [Google Scholar] [CrossRef]
  110. Rahman, M.; Di, L. The state of the art of spaceborne remote sensing in flood management. Nat. Hazards 2016, 85, 1223–1248. [Google Scholar] [CrossRef]
  111. James, W. Introduction to the SWMM Environment. J. Water Manag. Model. 1993, Rl75-01. [Google Scholar] [CrossRef] [Green Version]
  112. James, W. Rules for Responsible Modeling; Computational Hydraulics International (CHI): Guelph, ON, Canada, 2005. [Google Scholar]
  113. Finney, K.; Gharabaghi, B. Using the PCSWMM 2010 SRTC Tool to Design a Compost Biofilter for Highway Stormwater Runoff Treatment. J. Water Manag. Model. 2011, R241-09. [Google Scholar] [CrossRef]
  114. Moynihan, K.; Vasconcelos, J. SWMM Modeling of a Rural Watershed in the Lower Coastal Plains of the United States. J. Water Manag. Model. 2014, 1–12. [Google Scholar] [CrossRef] [Green Version]
  115. Vonach, T.; Tscheikner-Gratl, F.; Rauch, W.; Kleidorfer, M. A Heuristic Method for Measurement Site Selection in Sewer Systems. Water 2018, 10, 122. [Google Scholar] [CrossRef] [Green Version]
  116. Hou, X.; Guo, H.; Wang, F.; Li, M.; Xue, X.; Liu, X.; Zeng, S. Is the sponge city construction sufficiently adaptable for the future stormwater management under climate change? J. Hydrol. 2020, 588, 125055. [Google Scholar] [CrossRef]
  117. Irvine, K.; Loganathan, B.; Pratt, E.; Sikka, H. Calibration of PCSWMM to Estimate Metals, PCBs and HCB in CSOs from an Industrial Sewershed. J. Water Manag. Model. 1993, Rl75-10. [Google Scholar] [CrossRef] [Green Version]
  118. James, W.; Wan, B.; James, W. Implementation in PCSWMM Using Genetic Algorithms for Auto Calibration and Design-Optimization. In Proceedings of the Ninth International Conference on Urban Drainage (9ICUD), Portland, OR, USA, 8–13 September 2002. [Google Scholar]
  119. Barco, J.; Wong, K.; Stenstrom, M. Automatic Calibration of the U.S. EPA SWMM Model for a Large Urban Catchment. J. Hydraul. Eng. 2008, 134, 466–474. [Google Scholar] [CrossRef]
  120. Ogden, F.; Raj Pradhan, N.; Downer, C.; Zahner, J. Relative importance of impervious area, drainage density, width function, and subsurface storm drainage on flood runoff from an urbanized catchment. Water Resour. Res. 2011, 47. [Google Scholar] [CrossRef] [Green Version]
  121. Li, C.; Wang, W.; Xiong, J.; Chen, P. Sensitivity Analysis for Urban Drainage Modeling Using Mutual Information. Entropy 2014, 16, 5738–5752. [Google Scholar] [CrossRef]
  122. Sun, N.; Hall, M.; Hong, B.; Zhang, L. Impact of SWMM Catchment Discretization: Case Study in Syracuse, New York. J. Hydrol. Eng. 2014, 19, 223–234. [Google Scholar] [CrossRef]
  123. Shahed Behrouz, M.; Zhu, Z.; Matott, L.; Rabideau, A. A new tool for automatic calibration of the Storm Water Management Model (SWMM). J. Hydrol. 2020, 581, 124436. [Google Scholar] [CrossRef]
  124. Irvine, K.N.; Lloyd, H.C.; Chua, L.H.C.; Ashrafi, M.; Loc, H.H.; Le, S.H. Submitted. Drivers of Model Uncertainty for Urban Runoff in a Tropical Climate: The Effect of Rainfall Variability and Subcatchment Parameterization. J. Water Manag. Model. 2022, submitted. [Google Scholar]
  125. Schleiss, M.; Olsson, J.; Berg, P.; Niemi, T.; Kokkonen, T.; Thorndahl, S.; Nielsen, R.; Ellerbæk Nielsen, J.; Bozhinova, D.; Pulkkinen, S. The accuracy of weather radar in heavy rain: A comparative study for Denmark, the Netherlands, Finland and Sweden. Hydrol. Earth Syst. Sci. 2020, 24, 3157–3188. [Google Scholar] [CrossRef]
  126. Yoon, S.; Lee, B. Effects of Using High-Density Rain Gauge Networks and Weather Radar Data on Urban Hydrological Analyses. Water 2017, 9, 931. [Google Scholar] [CrossRef] [Green Version]
  127. Yau, W.; Radhakrishnan, M.; Liong, S.; Zevenbergen, C.; Pathirana, A. Effectiveness of ABC Waters Design Features for Runoff Quantity Control in Urban Singapore. Water 2017, 9, 577. [Google Scholar] [CrossRef] [Green Version]
  128. Paredes, D. Hydraulic Analysis of Urban Drainage Systems with Conventional Solutions and Sustainable Technologies: Case Study in Quito, Ecuador. J. Water Manag. Model. 2018, 26, C440. [Google Scholar] [CrossRef]
  129. Iftekhar, M.; Buurman, J.; Lee, T.; He, Q.; Chen, E. Non-market value of Singapore’s ABC Waters Program. Water Res. 2019, 157, 310–320. [Google Scholar] [CrossRef] [PubMed]
  130. Huu Loc, H.; Irvine, K.; Suwanarit, A.; Vallikul, P.; Likitswat, F.; Sahavacharin, A.; Sovann, C.; Song Ha, L. Mainstreaming Ecosystem Services as Public Policy in South East Asia, from Theory to Practice. In Sustainability and Law; Springer: Cham, Switzerland, 2020; pp. 631–665. [Google Scholar]
  131. Hamel, P.; Tan, L. Blue–Green Infrastructure for Flood and Water Quality Management in Southeast Asia: Evidence and Knowledge Gaps. Environ. Manag. 2021, 69, 699–718. [Google Scholar] [CrossRef]
  132. Wang, J.; Chua, L.; Shanahan, P. Modeling and designing for nitrogen removal in bioretention basins. Environ. Model. Softw. 2021, 146, 105212. [Google Scholar] [CrossRef]
  133. Keung, K.; Lee, C.; Ng, K.; Yeung, C. Smart City Application and Analysis: Real-time Urban Drainage Monitoring by IoT Sensors: A Case Study of Hong Kong. In Proceedings of the 2018 IEEE International Conference on Industrial Engineering and Engineering Management (IEEM) 2018, Bangkok, Thailand, 16–19 December 2018. [Google Scholar]
  134. Zhang, D.; Lindholm, G.; Ratnaweera, H. Use long short-term memory to enhance Internet of Things for combined sewer overflow monitoring. J. Hydrol. 2018, 556, 409–418. [Google Scholar] [CrossRef]
  135. Yu, D.; Yin, J.; Liu, M. Validating city-scale surface water flood modeling using crowd-sourced data. Environ. Res. Lett. 2016, 11, 124011. [Google Scholar] [CrossRef]
  136. Wang, R.; Mao, H.; Wang, Y.; Rae, C.; Shaw, W. Hyper-resolution monitoring of urban flooding with social media and crowdsourcing data. Comput. Geosci. 2018, 111, 139–147. [Google Scholar] [CrossRef] [Green Version]
  137. Helmrich, A.; Ruddell, B.; Bessem, K.; Chester, M.; Chohan, N.; Doerry, E.; Eppinger, J.; Garcia, M.; Goodall, J.; Lowry, C.; et al. Opportunities for crowdsourcing in urban flood monitoring. Environ. Model. Softw. 2021, 143, 105124. [Google Scholar] [CrossRef]
  138. Kim, B.; Sanders, B.; Han, K.; Kim, Y.; Famiglietti, J. Calibration of stormwater management model using flood extent data. Proc. Inst. Civ. Eng.-Water Manag. 2014, 167, 17–29. [Google Scholar] [CrossRef] [Green Version]
  139. Fabio, P.; Aronica, G.; Apel, H. Towards automatic calibration of 2-D flood propagation models. Hydrol. Earth Syst. Sci. 2010, 14, 911–924. [Google Scholar] [CrossRef] [Green Version]
  140. Quesada-Román, A.; Ballesteros-Cánovas, J.; Granados-Bolaños, S.; Birkel, C.; Stoffel, M. Improving regional flood risk assessment using flood frequency and dendrogeomorphic analyses in mountain catchments impacted by tropical cyclones. Geomorphology 2022, 396, 108000. [Google Scholar] [CrossRef]
  141. Conley, G.; Beck, N.; Riihimaki, C.; McDonald, K.; Tanner, M. Assessing the Feasibility of a Cloud-Based, Spatially Distributed Modeling Approach for Tracking Green Stormwater Infrastructure Runoff Reductions. Water 2021, 13, 255. [Google Scholar] [CrossRef]
  142. Mosavi, A.; Ozturk, P.; Chau, K.-W. Flood Prediction Using Machine Learning Models: Literature Review. Water 2018, 10, 1536. [Google Scholar] [CrossRef] [Green Version]
  143. Ko, C.; Jeong, Y.; Lee, Y.; Kim, B. The Development of a Quantitative Precipitation Forecast Correction Technique Based on Machine Learning for Hydrological Applications. Atmosphere 2020, 11, 111. [Google Scholar] [CrossRef] [Green Version]
  144. Bouget, V.; Béréziat, D.; Brajard, J.; Charantonis, A.; Filoche, A. Fusion of Rain Radar Images and Wind Forecasts in a Deep Learning Model Applied to Rain Nowcasting. Remote Sens. 2021, 13, 246. [Google Scholar] [CrossRef]
  145. Liu, Y.; Li, L.; Liu, Y.; Chan, P.; Zhang, W.; Zhang, L. Estimation of precipitation induced by tropical cyclones based on machine-learning-enhanced analogue identification of numerical prediction. Meteorol. Appl. 2021, 28, e1978. [Google Scholar] [CrossRef]
Figure 1. Top. Map of the Ramkhamhaeng polder, Bangkok, Thailand. The Ramkhamhaeng polder is one of Bangkok’s water management polder systems [51]. Additionally, shown (bottom photographs) are the typologies of the drainage system illustrating its distinct characteristics from those of the Global North. Bottom left: A secondary canal within the study area. Bottom middle: Pumping water from the central region of the study area towards the primary canal system. Bottom right: The primary canal, Saen Seab, is in the foreground, with the mouth of a secondary canal visible to the right of the temple area (photos by authors).
Water 14 01641 g001
Figure 2. Phase two of the Benjakitti Park development in downtown Bangkok, which opened in December 2021 and presents nature-based water storage and retention opportunities (photo by authors).
Water 14 01641 g002
Figure 3. The framework of the real-time flood forecasting system (RTFlood system). It contains three modules, i.e., rainfall input data processing, automated data operation system (ADOS), and hydraulic model processing.
Water 14 01641 g003
Figure 4. The framework for rainfall input data processing.
Water 14 01641 g004
Figure 5. Schematics of forecasting the storm movements.
Water 14 01641 g005
Figure 6. The flowchart of an automated data operation system (ADOS).
Water 14 01641 g006
Figure 7. Digital Elevation Model (DEM) of the Ramkhamhaeng polder, Bangkok, Thailand.
Water 14 01641 g007
Figure 8. The model setting of the 1D drainage pipe/secondary canal network on the 2D DEM terrain.
Water 14 01641 g008
Figure 9. Comparison of flood locations recorded by BMA-DDS with those generated by PCSWMM between 2015 and 2018 at Ramkhamhaeng polder, Bangkok, Thailand.
Water 14 01641 g009
Figure 10. The result of the RTFlood system displayed on a website.
Water 14 01641 g010
Figure 11. Forecasting performance in CSI (%) in the rainfall forecasting process.
Water 14 01641 g011
Figure 12. An example of the timeline of the RTFlood system.
Water 14 01641 g012
Figure 13. The three zones of frequent floods were reported by BMA-DDS [52].
Water 14 01641 g013
Table 1. The 2D cell density in a unit area in the present model (Ramkhamhaeng polder) and the previous model (Sukhumvit area).
LocationNumber of 2D CellsArea
(km2)
Density (Cell/m2)
Ramkhamhaeng757,83611.40.07
Sukhumvit321,18024.00.01
Table 2. A lead time and flood forecasting accuracy in the previous and present studies.
LocationTotal Rainfall
(min)
Measured Rainfall
(min)
Forecasted Rainfall
(min)
Model Running (min)The Lead Time of the Forecast
(min)
Forecasted Rainfall CSIFlood Forecast
Accuracy
Ramkhamhaeng401030102084.461.2% (71/116)
Sukhumvit [59]401030201080.058.0% (40/69)
Table 3. The comparison of the measured and simulated results in the three zones of Figure 12.
ZoneNumber of 2D Flooded CellsRelative Error (%)
SimulatedObserved
125,58724,5564.2
215,50914,6595.8
327,40426,4783.5
Publisher’s Note: MDPI stays neutral with regard to jurisdictional claims in published maps and institutional affiliations.

