
Study on the Relationship between Water Resources Utilization and Economic Growth in Tarim River basin from the Perspective of Water Footprint

Abstract
:1. Introduction
2. Research Methods and Data Sources
2.1. Data Sources
2.2. Water Footprint Calculation Model
2.3. Calculation Methods of Different Types of Water Footprint
2.3.1. Virtual Water Amount for Agricultural Production
2.3.2. Industrial Virtual Water Quantity, Domestic Virtual Water Quantity, Ecological Virtual Water Quantity, Import, and Re-Export Virtual Water Quantity
2.3.3. Virtual Water Quantity Exported and Imported
2.4. Actual Calculation Formula of Regional Water Footprint
2.5. Water Footprint Evaluation Index
2.5.1. Evaluation Index of Internal Benefits of Water Footprint
- Population density of water footprint in ten thousand tons
- 2.
- Economic benefits of water footprint
- 3.
- Water footprint land density
2.5.2. Evaluation Index of External Benefits of Water Footprint
- 1.
- Water footprint net trade value
- 2.
- Water footprint contribution rate
- 3.
- Water footprint value conversion rate
2.5.3. Water Footprint Scarcity Index
2.5.4. Self-Sufficiency Rate of Water Resources
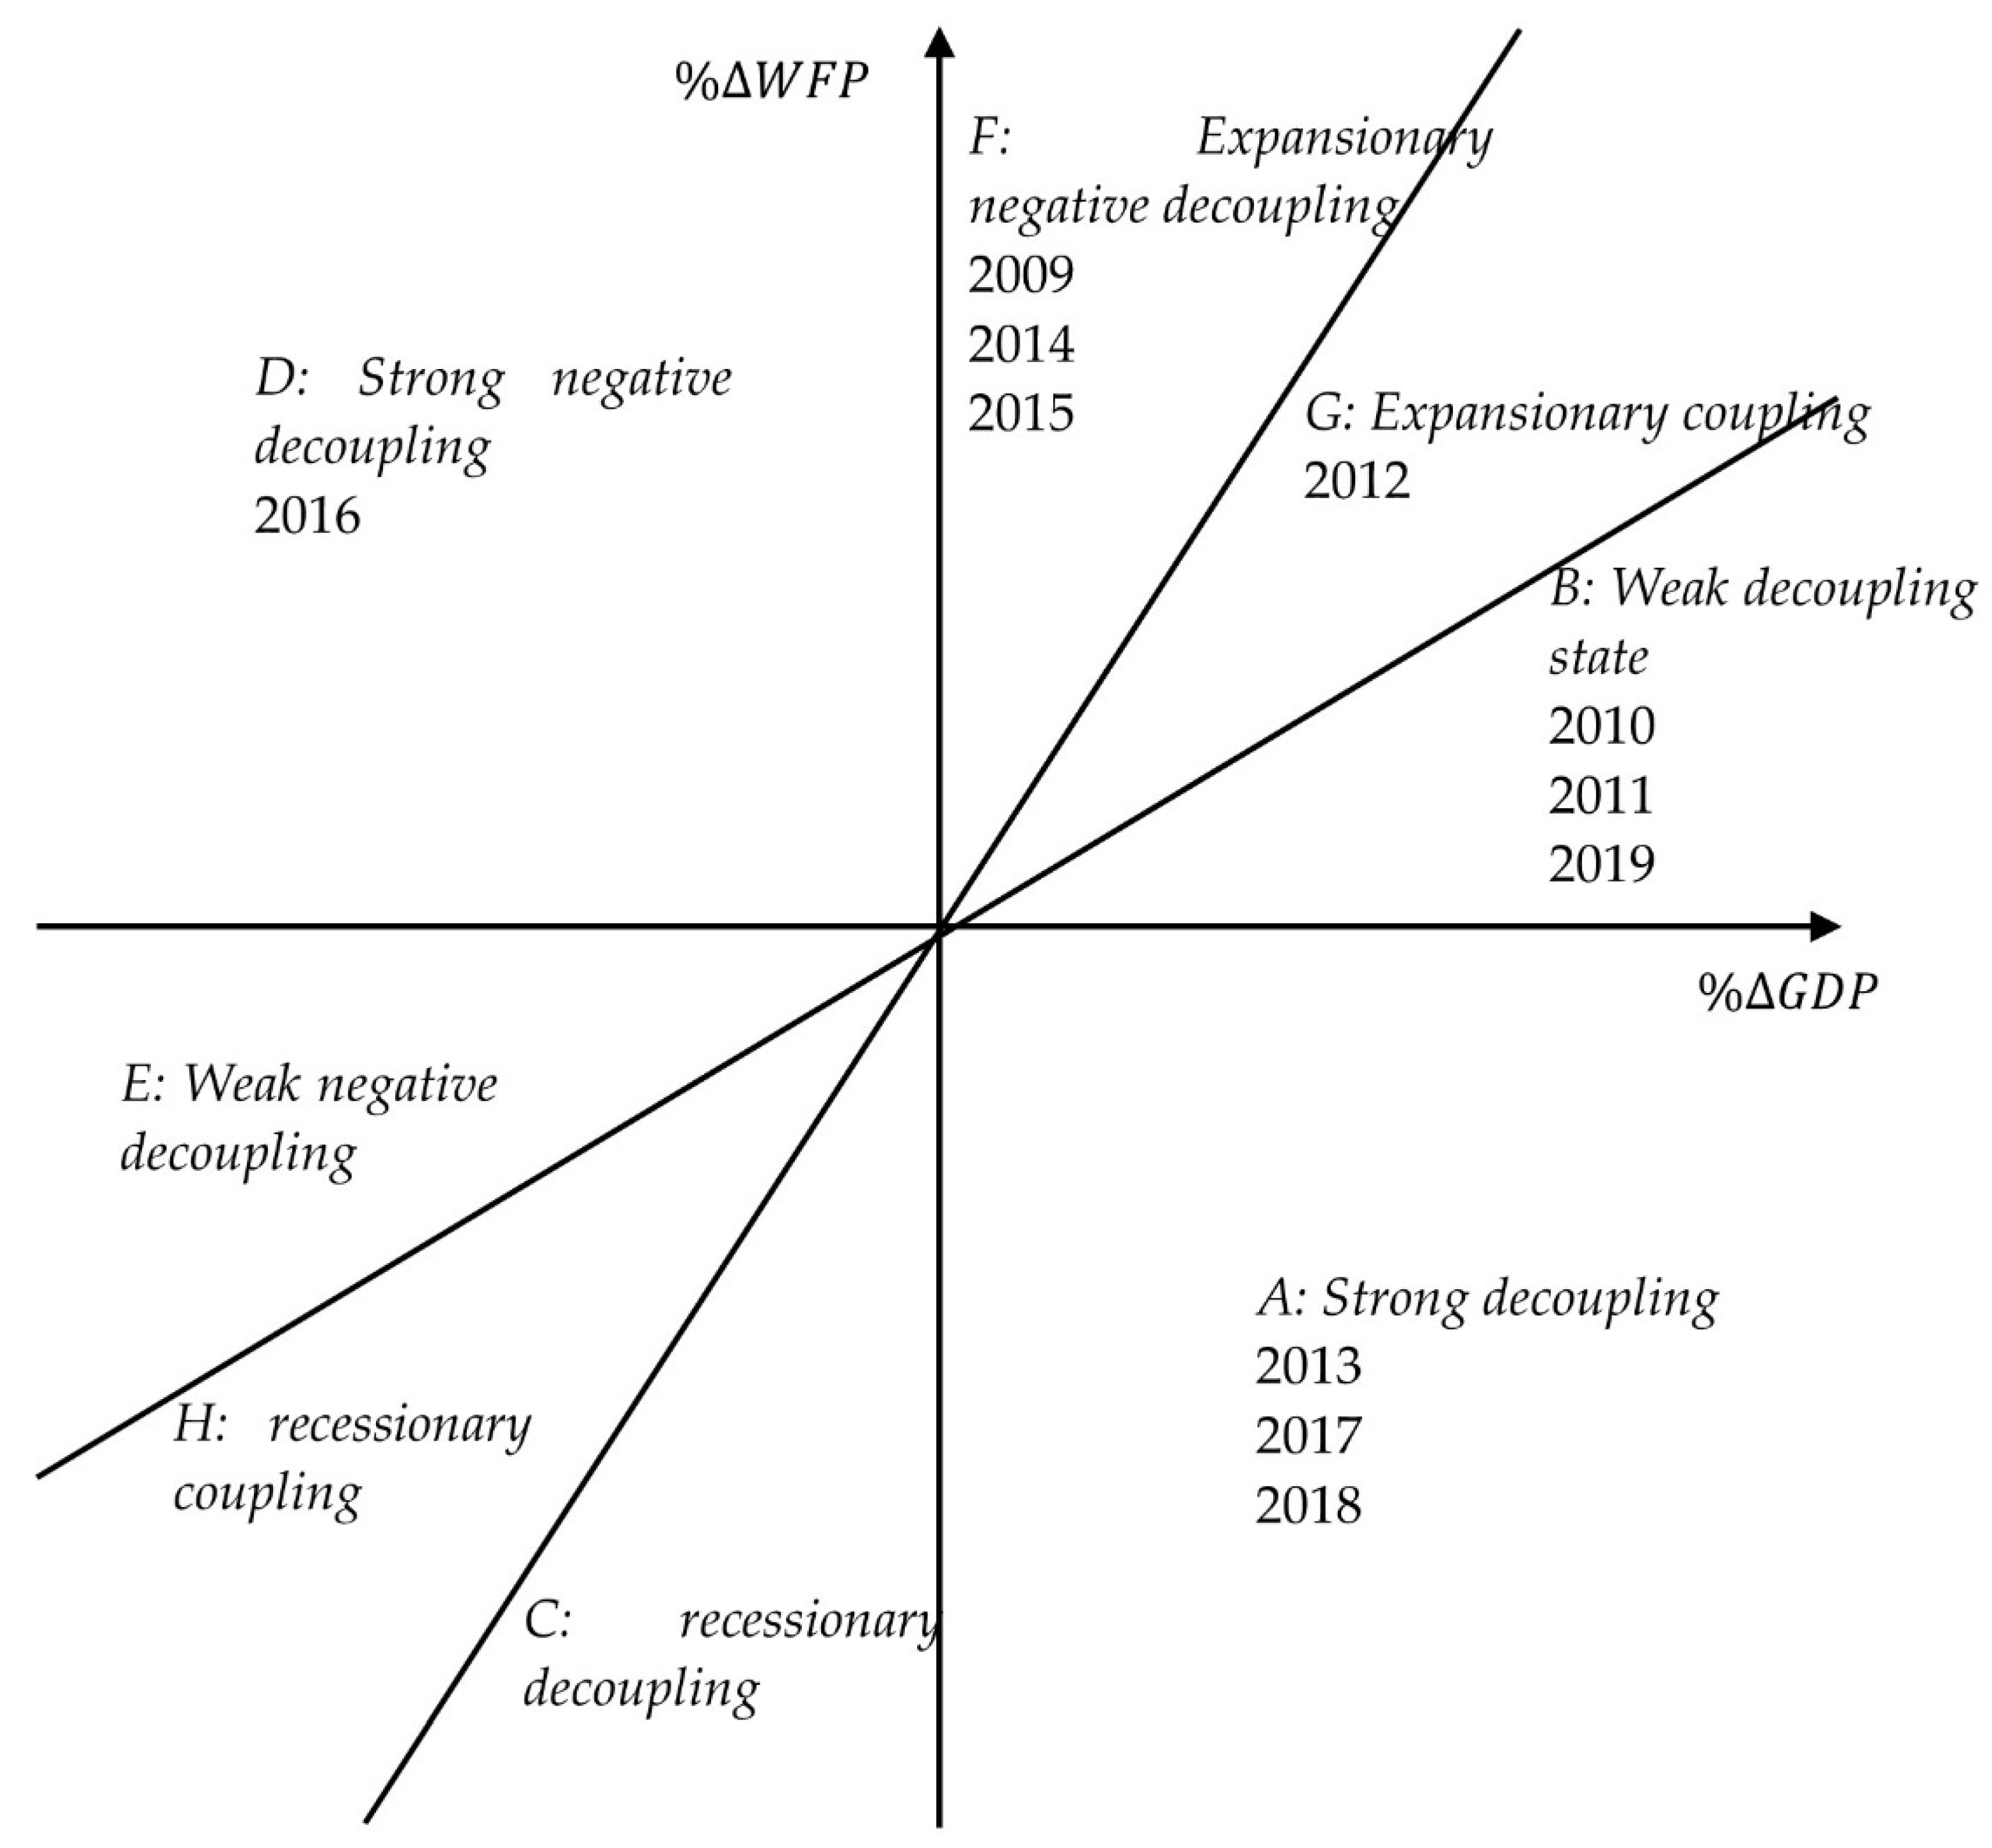
2.6. Tapio Decoupling Model
3. Calculation Results and Analysis
3.1. Water Footprint Analysis
3.1.1. Comparison of Water Footprints in Different Regions
3.1.2. Composition of Water Footprint
3.1.3. Structural Variation Characteristics of Agricultural Water Footprint
3.2. Water Footprint Evaluation Index System
3.2.1. Evaluation Index of Internal Benefits of Water Footprint
- 1.
- Population density of ten thousand tons of water footprint
- 2.
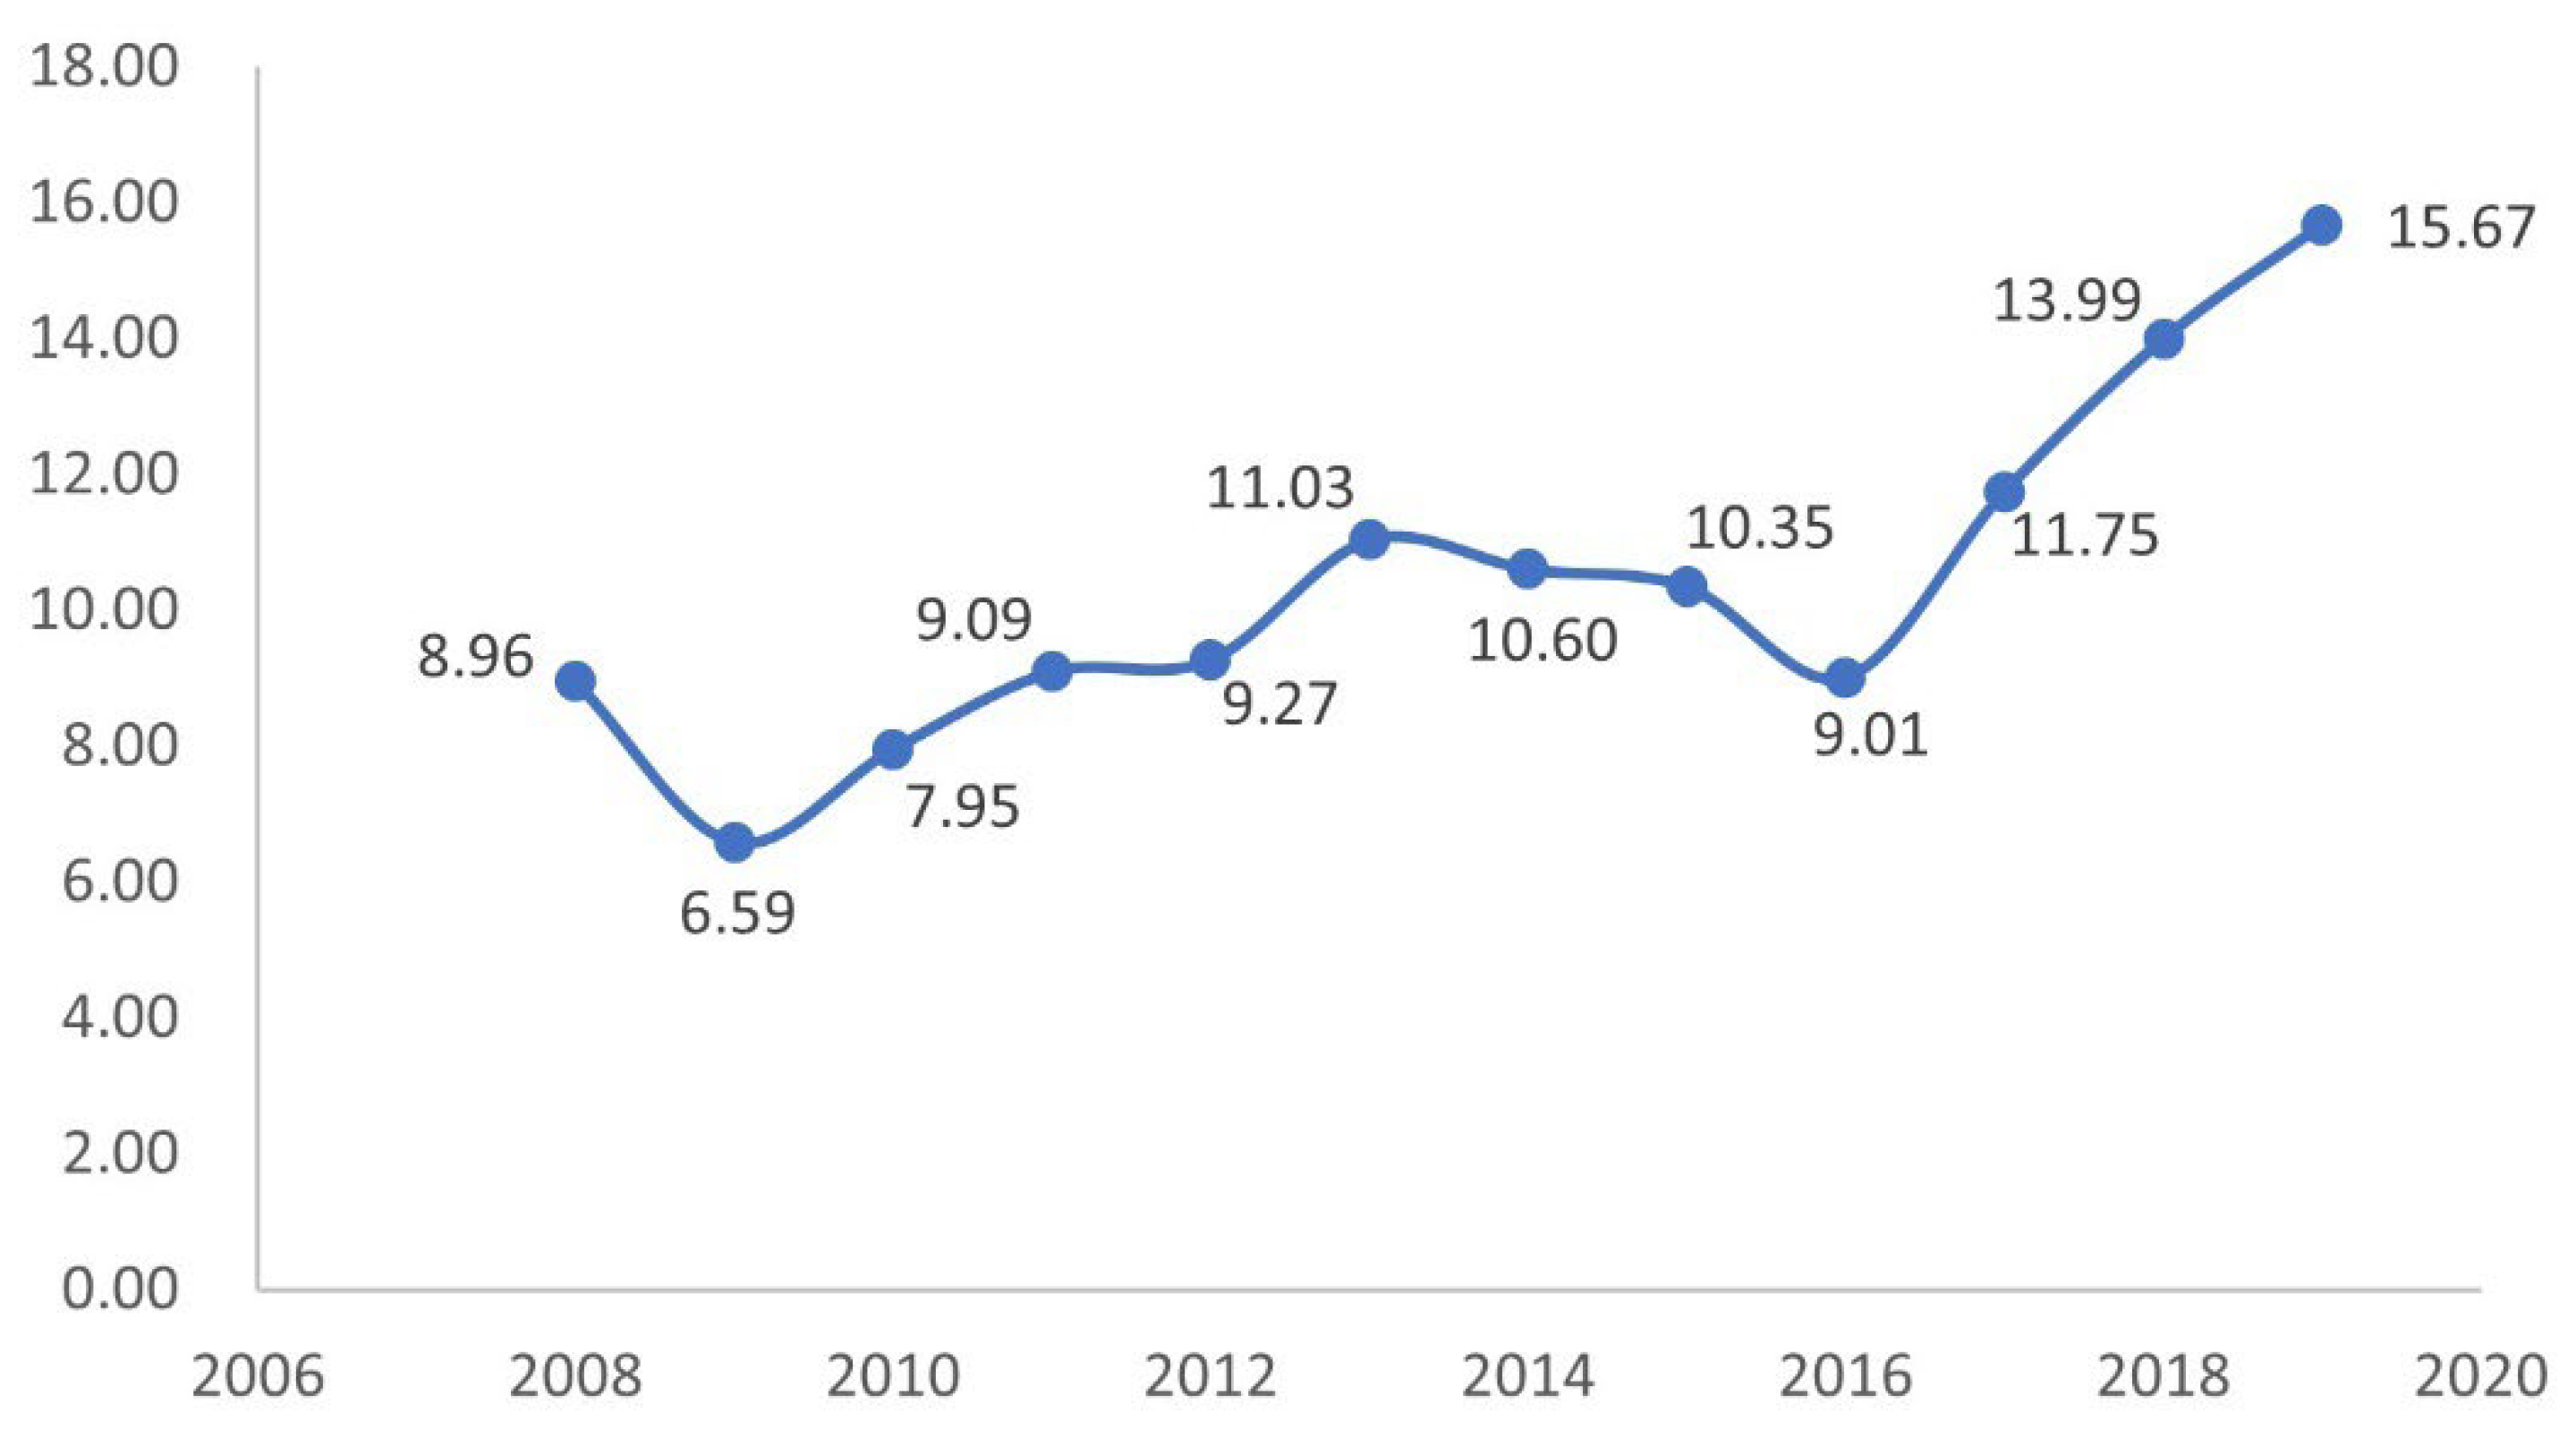
- Economic benefits of water footprint
- 3.
- Land density value of water footprint
3.2.2. Evaluation Index of External Benefits of Water Footprint
- 1.
- Water footprint net trade volume
- 2.
- Water footprint contribution rate
- 3.
- Water footprint value conversion rate
3.2.3. Index of Water Resource Shortage
3.2.4. Self-Sufficiency Rate of Water Resources
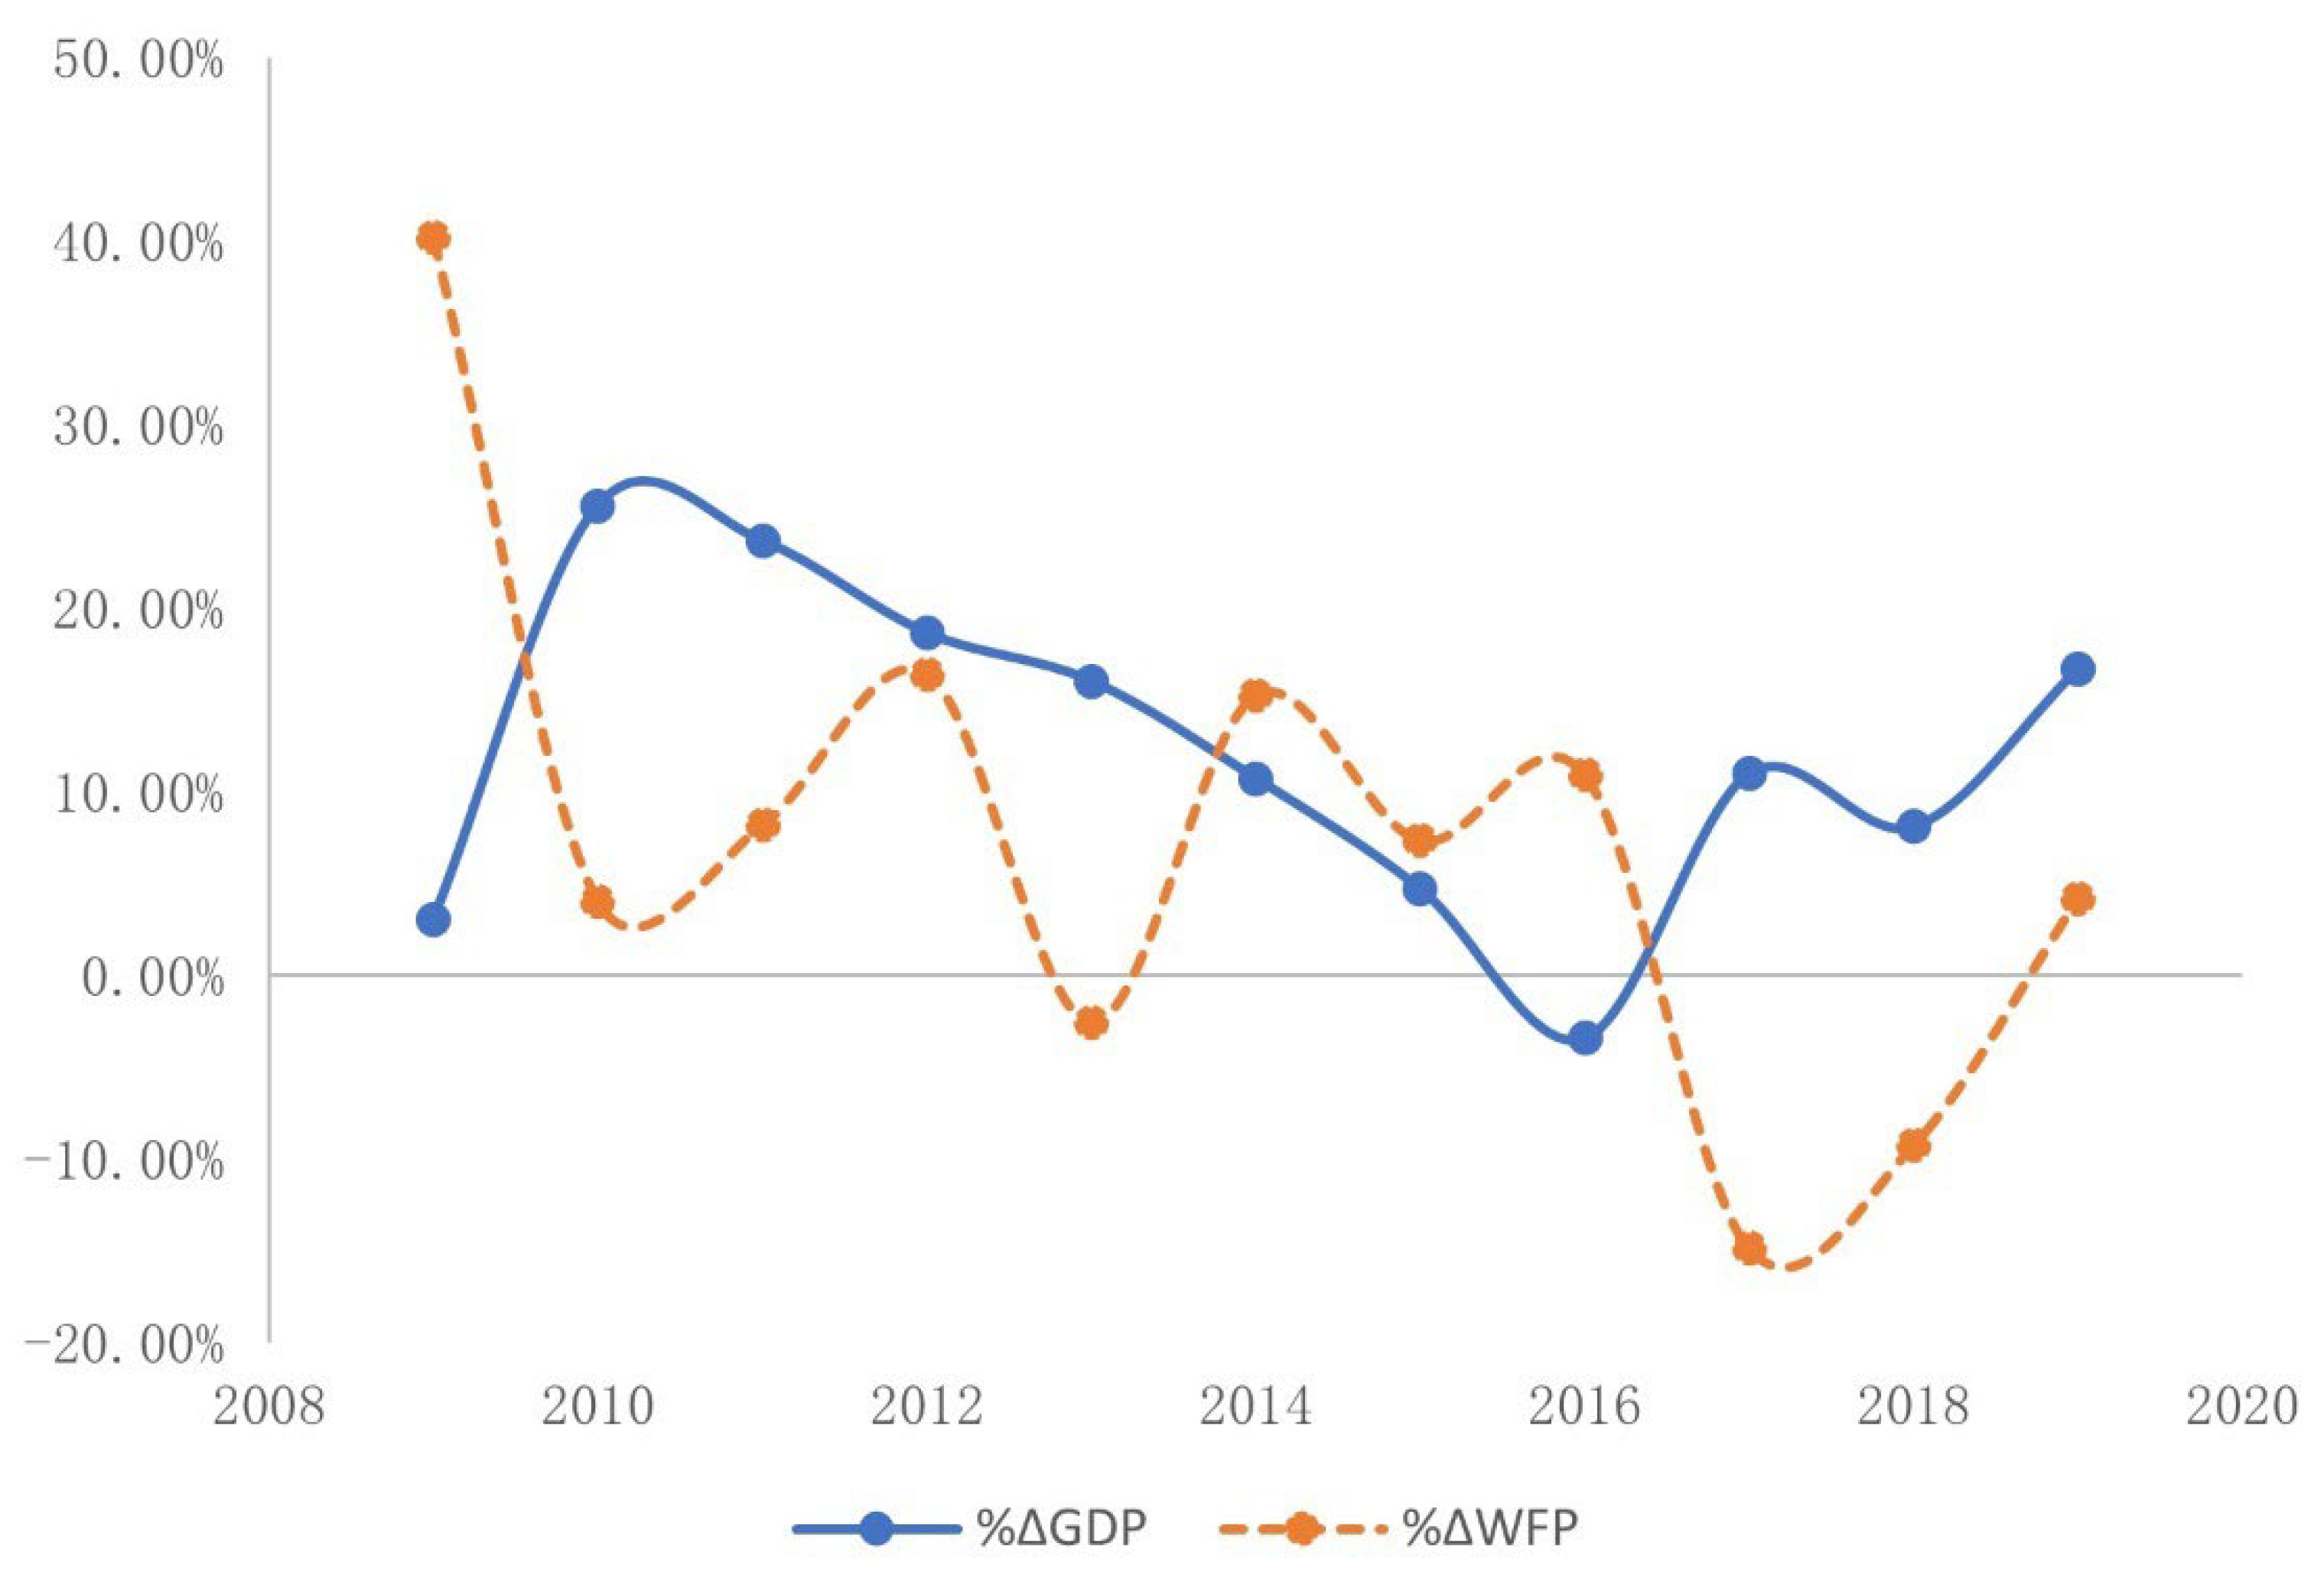
3.3. Decoupling Analysis
3.4. Policy Interpretation of Decoupling Relationship between Water Resources Utilization and Economic Growth
4. Conclusions and Suggestions
4.1. Conclusions
4.2. Suggestions
Author Contributions
Funding
Institutional Review Board Statement
Informed Consent Statement
Data Availability Statement
Conflicts of Interest
References
- Wang, G.; Wang, Y.; Gui, D. Research progress of water resources in Tarim River basin. Arid. Land Geogr. 2018, 41, 1151–1159. [Google Scholar]
- Li, X.; Zhou, H. Sustainable utilization of water resources in Tarim River after human intervention. Geogr. Res. 1998, 2, 60–66. [Google Scholar]
- Li, X.; Yang, D. Water resources utilization and ecological loss in Tarim River. Arid. Land Geogr. 2001, 4, 327–331. [Google Scholar]
- Wu, S.; Han, P.; Li, Y.; Xue, Y.; Zhu, Y. Prediction of water resources change trend in headstream of Tarim River. J. Glaciol. Geocryol. 2003, 6, 708–711. [Google Scholar]
- Chen, Y.; Li, W.; Zhang, Y.; Cui, W. Development and utilization of water resources and ecological conservation strategies in Tarim River, Xinjiang. Resour. Sci. 2004, S1, 74–76. [Google Scholar]
- Luo, W.; Lu, Y.; Chen, Y. Ecological compensation standard based on ensuring ecological water demand: A case study of The Mainstream of Tarim River. Water Sav. Irrig. 2016, 5, 71–74+80. [Google Scholar]
- Wang, C.; Du, H.; Zhang, X.; Wang, F.; Zhang, L.; Li, X. Comparative resource carrying capacity of Tarim River basin. Acta Ecol. Sin. 2015, 35, 2880–2893. [Google Scholar]
- Chen, L.; Liang, X. Evaluation of water resources carrying capacity of “Three sources and one trunk” in Tarim River basin based on improved comprehensive weighting method. Water Sav. Irrig. 2019, 1, 72–75+83. [Google Scholar]
- Sun, J.; Han, G. Analysis on the economic effect of industrial water resources allocation and utilization in The Tarim River basin. J. Irrig. Drain. 2012, 31, 66–68+81. [Google Scholar]
- Sun, J.; Han, G. Analysis on economic effect of agricultural water resources allocation and utilization in Tarim River basin. Water Resour. Hydropower Technol. 2009, 40, 57–60. [Google Scholar]
- Sun, J.; Han, G. Analysis of economic effects of agricultural water price adjustment on allocation and utilization of agricultural water resources in Tarim River basin. Water Resour. Econ. 2010, 28, 4–6+11+69. [Google Scholar]
- An, D.; Wu, B.; Song, B.; Li, Q. Application of trend analysis in water resources supervision system of Tarim river. Yellow River 2019, 41, 50–54. [Google Scholar]
- Chen, Y.; He, X.; Chen, Y.; Zhu, C. Study on water system connectivity and ecological protection of Tarim River basin in Xinjiang. Sci. Technol. Soc. 2019, 34, 1156–1163. [Google Scholar]
- Zhang, P. Study on the Coupling of Social-Ecology-Water Resource System in Tarim River basin. Ph.D. Thesis, China Academy of Water Resources and Hydropower, Beijing, China, 2019. [Google Scholar]
- Qiao, K.; Gao, Z. Analysis on the decoupling between water resources utilization and economic development in Xinjiang: Based on the perspective of water footprint. J. Yili Norm. Univ. Nat. Sci. Ed. 2016, 10, 62–68. [Google Scholar]
- Xie, W.; Chen, T.; Liu, G. Decoupling relationship and effect decomposition between agricultural water resources utilization and economic growth in Xinjiang. Water Sav. Irrig. 2018, 4, 69–72+77. [Google Scholar]
- Chen, C. Analysis of water resources utilization and economic growth based on decoupling index in Southern Xinjiang. Heilongjiang Water Resour. Sci. Technol. 2018, 46, 31–33. [Google Scholar]
- Cui, Y.; Wu, R. Study on the relationship between water resources utilization and economic growth in Arid Area of China: A case study of Ningxia Hui Autonomous Region. J. Harbin Inst. Technol. Soc. Sci. Ed. 2018, 20, 135–140. [Google Scholar]
- Zhang, F.; Xue, H.; Dong, H.; Bi, Y.; Gao, J. Dynamic response of water resources utilization and economic growth in Yellow River delta. Environ. Sci. Technol. 2016, 39, 187–194. [Google Scholar]
- Li, L. Evaluation of Coordinated Development of Water Resources Utilization and Economic Growth in Hebei Province. Master Thesis, China University of Geosciences, Beijing, China, 2019. [Google Scholar]
- Pan, D.; Ying, R. Research on the relationship between water resources and agricultural economic growth in China: Based on panel VAR model. China Popul. Resour. Environ. 2012, 22, 161–166. [Google Scholar]
- Chen, H.; Li, B. Empirical analysis of dynamic relationship between water resources utilization and economic growth in Hotan Area. Resour. Dev. Mark. 2015, 31, 1076–1079+1136. [Google Scholar]
- Wu, Z.; Dong, H. An empirical study on the dynamic relationship between water resources utilization and economic growth: A case study of Shandong Province. Essays Dongyue 2013, 34, 68–72. [Google Scholar]
- Xing, X.; Xiu, C.; Liu, Y. Study on the coupling coordination between water resources utilization efficiency and economic development in the Yellow River basin. Soft Sci. 2020, 34, 44–50. [Google Scholar]
- Yang, Y.; Cao, S.; Liu, Y.; Cheng, Y. Water resources utilization and economic development in shandong province based on water ecological footprint. J. Drain. Irrig. Mach. Eng. 2019, 37, 256–262. [Google Scholar]
- Jiao, S.; Zhang, X.; Wang, A.; Zhang, J.; Zhang, C.; Zhao, R.; Chen, L. Study on the relationship between water resources utilization and economic growth in Anyang city from the perspective of water footprint. Chin. J. Agric. Resour. Reg. Plan. 2019, 40, 10–15. [Google Scholar]
- Li, N.; Zhang, J.; Wang, L. Analysis of the decoupling between water resources utilization and economic coordinated development in the middle reaches of the Yangtze River based on water footprint method. China Popul. Resour. Environ. 2017, 27, 202–208. [Google Scholar]
- Gu, X.; Wang, Y.; Zhao, H.; Wang, F.; Zhu, X.; Lu, G. Research on the relationship between water resources utilization and economic growth in jiangsu province. China Environ. Sci. 2012, 32, 351–358. [Google Scholar]
- Chen, Y.; Li, W.; Zhang, Y.; Cui, W. Exploitation and utilization of water resources and ecological conservation countermeasures of Tarim River in Xinjiang. Resour. Sci. 2004, S1, 77–80. [Google Scholar]
- Qin, X.; Aihemaidi, T.; Wubuli, W.; Huang, X.; Yuan, Z. Unified Management and Dispatching practice of Water Resources in Tarim River basin; China Water and Power Press: Beijing, China, 2014. [Google Scholar]
- Tang, D.; Deng, M. Research on Water Right Management in Tarim River basin; China Water and Power Press: Beijing, China, 2010. [Google Scholar]
- Huang, Q.; Xu, H.; Zhang, S.; Huang, F.; Aihemati, T. Rational Allocation of Water Resources in Tarim Inland River Basin; Science Press: Beijing, China, 2015. [Google Scholar]
- Sun, C.; Zhang, L. Spatial-temporal variation of virtual water for agricultural products and cultivated land resources in China. Resour. Sci. 2009, 31, 84–93. [Google Scholar]
- Mekonnen, M.M.; Hoekstra, A.Y. A global assessment of the water footprint of farm animal products. Ecosystems 2012, 15, 401–415. [Google Scholar] [CrossRef] [Green Version]
- Liu, N. Research on Rational Allocation of Water Resources in Beijing-Tianjin-Hebei Region Based on Water Footprint. Ph.D. Thesis, China University of Geosciences, Beijing, China, 2016. [Google Scholar]
- Wang, X.; Gao, X.; Cao, L.; Qiu, J. Evaluation of agricultural water resources utilization in Zhongwei City of Ningxia from the perspective of water footprint. J. Lanzhou Univ. Nat. Sci. 2015, 51, 619–624. (In Chinese) [Google Scholar]
- Chapagain, A.K.; Hoekstra, A.Y. Virtual Water Flows between Nations in Relation to Trade in Livestock and Livestock Products. Value Water Res. Rep. Ser. 2003, 1, 11–15. [Google Scholar]
- Wu, P.; Sun, S.; Wang, Y.; Li, X.; Zhao, X. Quantitative method and evaluation of water footprint of crop production. J. Hydraul. Eng. 2017, 48, 651–660+669. [Google Scholar]
- Qiao, Y.; Jia, C. Analysis of decoupling between water resources utilization and economic development in Shanxi Province based on water footprint Theory. Water Sav. Irrig. 2019, 12, 58–64+71. [Google Scholar]
- Yu, H.; Han, M. Spatial-temporal analysis of sustainable water resources utilization based on water footprint in Shandong Province. J. Nat. Resour. 2017, 32, 474–483. [Google Scholar]
- Pan, W.; Cao, W.; Wang, F.; Chen, J.; Cao, D. Evaluation of water resources in Jiulong River Basin based on water footprint theory. Resour. Sci. 2012, 34, 1905–1912. [Google Scholar]
- Qi, R.; Geng, Y.; Zhu, Q. Evaluation of regional water resources utilization based on water footprint theory. J. Nat. Resour. 2011, 26, 486–495. [Google Scholar]
- Yang, R.; Wang, T. Analysis of decoupling between water resources utilization and economic coordinated development in Jiangxi Province: Based on the perspective of virtual water. Sci. Technol. Manag. Res. 2015, 35, 95–98+111. [Google Scholar]
- Pan, A.; Chen, L. Decoupling analysis of water resources utilization and economic coordinated development in Hubei Province: Based on the perspective of water footprint. Resour. Sci. 2014, 36, 328–333. [Google Scholar]
- Zhu, H.; Pan, L.; Li, W.; Yu, J.; Yao, X.; Sun, W.; Li, Z. Study on the decoupling relationship between water resources utilization and economic development in Yunnan and Guizhou provinces in the past ten years. S. N. Water Transf. Water Sci. Technol. 2013, 11, 1–5. [Google Scholar]
- Yi, W.; Su, W.; Li, W.; Zhang, J.; Xing, D. Decoupling analysis of agricultural water use and economy based on water footprint in Pingtang County, Guizhou Province. Bull. Soil Water Conserv. 2018, 38, 295–300+307+357. [Google Scholar]
- Pan, Z.; Xu, C. Decoupling analysis of water resources utilization and economic growth in China. J. S. China Agric. Univ. Soc. Sci. Ed. 2019, 18, 97–108. [Google Scholar]
- Pan, Z.; Xu, C. Green water efficiency measurement and decoupling analysis of China’s economic growth. J. Huazhong Agric. Univ. Soc. Sci. Ed. 2020, 4, 1–9+173. [Google Scholar]
- Zhang, W.; Qin, Q. Evaluation of water resources utilization and economic development decoupling of planting industry in Shaanxi Province from the perspective of water footprint. Chin. J. Eco-Agric. 2019, 27, 153–162. [Google Scholar]
- Wu, D. Evaluation and prospect of decoupling situation between Economic development and water resources utilization in China. J. Nat. Resour. 2014, 29, 46–54. [Google Scholar]
- Yang, Z.; Su, W.; Zhao, W. Analysis of decoupling between water resources and economic development in Karst area. Econ. Geogr. 2016, 36, 159–165. [Google Scholar]


| Data Sources | Product Name | Virtual Water Content per Unit of Product |
|---|---|---|
| Reference [33] | corn | 0.730 |
| wheat | 1.050 | |
| rice | 1.210 | |
| potato | 0.880 | |
| cotton | 3.810 | |
| oil | 2.430 | |
| Sugar beet | 0.100 | |
| Reference [36] | vegetables | 0.190 |
| Reference [33] | fruit | 0.870 |
| Reference [34] | pork | 5.455 |
| beef | 13.290 | |
| mutton | 5.799 | |
| poultry | 3.117 | |
| eggs | 2.428 | |
| milk | 1.072 | |
| Reference [35] | Aquatic products | 5.000 |
| Abbreviations and Symbols | Item Name | Contains the Meaning |
|---|---|---|
| Total water footprint | The virtual amount of water consumed by a given number of people in an area in the normal course of their lives | |
| Internal water footprint | The amount of water consumed by goods or services produced within the region and used within the region | |
| External water footprint | The amount of water consumed within the region for goods or services produced or provided outside the region | |
| Agricultural virtual water quantity | Actual water consumption during agricultural production in the region | |
| Industrial virtual water quantity | Actual water consumption in the industrial process of the area | |
| Living virtual water quantity | The actual water consumption of residents in the area | |
| Ecological virtual water quantity | The actual water consumption of the ecological environment in the region | |
| Virtual outlet water quantity | The virtual amount of water produced within the region and exported to products (services) outside the region | |
| Imported virtual water quantity | The virtual amount of water produced outside the region and imported into the region for products (services) | |
| Import re-export | The virtual amount of water for products (services) produced outside the region, imported into the region, and then exported |
| Year | Water Footprint (WFP) | |||||
|---|---|---|---|---|---|---|
| Aksu | Bazhou | Kashgar | Kizilsu Kirghiz | Hetian | Tarim River basin | |
| 2008 | 64.74 | 36.89 | 24.76 | 1.89 | 21.01 | 149.28 |
| 2009 | 73.70 | 42.79 | 65.22 | 6.13 | 21.45 | 209.28 |
| 2010 | 74.49 | 45.22 | 69.59 | 8.28 | 20.17 | 217.75 |
| 2011 | 82.95 | 44.73 | 79.88 | 7.13 | 20.90 | 235.59 |
| 2012 | 87.48 | 48.86 | 109.19 | 6.31 | 22.50 | 274.34 |
| 2013 | 92.39 | 51.82 | 94.12 | 5.66 | 23.36 | 267.35 |
| 2014 | 111.48 | 58.41 | 110.18 | 5.08 | 22.98 | 308.13 |
| 2015 | 120.74 | 59.08 | 120.50 | 8.04 | 22.46 | 330.82 |
| 2016 | 128.60 | 70.03 | 100.66 | 8.15 | 59.58 | 367.02 |
| 2017 | 125.94 | 63.50 | 90.19 | 7.08 | 25.79 | 312.49 |
| 2018 | 108.05 | 52.52 | 88.81 | 8.30 | 25.99 | 283.67 |
| 2019 | 109.98 | 50.82 | 100.48 | 7.54 | 26.72 | 295.54 |
| Mean | 98.38 | 52.05 | 87.80 | 6.63 | 26.07 | 270.94 |
| Year | Agriculture | The Second Industry | The Third Industry | Life | Ecology | Export | Import | The Total WFP | WFP per Capita m3 |
|---|---|---|---|---|---|---|---|---|---|
| 2008 | 207.42 | 2.83 | 0.66 | 2.60 | 6.04 | 72.11 | 2.50 | 149.28 | 1435.06 |
| 2009 | 226.65 | 2.62 | 0.52 | 3.09 | 5.83 | 29.82 | 0.90 | 209.28 | 1965.38 |
| 2010 | 230.90 | 3.05 | 0.48 | 2.42 | 4.44 | 23.99 | 0.93 | 217.75 | 1990.03 |
| 2011 | 247.40 | 3.44 | 0.51 | 3.10 | 3.03 | 22.18 | 0.79 | 235.59 | 2105.59 |
| 2012 | 285.91 | 4.02 | 0.67 | 3.38 | 2.88 | 22.76 | 0.91 | 274.34 | 2447.24 |
| 2013 | 297.81 | 4.39 | 0.68 | 3.78 | 1.93 | 41.29 | 0.72 | 267.35 | 2316.96 |
| 2014 | 334.58 | 4.02 | 1.03 | 3.44 | 1.63 | 36.31 | 0.77 | 308.13 | 2568.90 |
| 2015 | 343.68 | 3.75 | 1.02 | 3.77 | 1.53 | 23.34 | 1.44 | 330.82 | 2739.03 |
| 2016 | 391.23 | 3.75 | 1.02 | 3.77 | 1.53 | 35.09 | 1.83 | 367.02 | 3042.05 |
| 2017 | 331.90 | 4.99 | 1.00 | 4.95 | 2.81 | 34.34 | 2.18 | 312.49 | 2518.74 |
| 2018 | 280.11 | 4.09 | 0.44 | 4.46 | 12.38 | 17.87 | 0.50 | 283.67 | 2320.43 |
| 2019 | 303.24 | 4.50 | 0.75 | 4.57 | 5.83 | 23.29 | 0.69 | 295.54 | 2340.41 |
| Item | 2008 | 2009 | 2010 | 2011 | 2012 | 2013 | 2014 | 2015 | 2016 | 2017 | 2018 | 2019 |
|---|---|---|---|---|---|---|---|---|---|---|---|---|
| Corn | 17.25 | 20.78 | 20.27 | 19.78 | 20.85 | 22.23 | 32.70 | 26.96 | 27.37 | 24.85 | 15.75 | 16.43 |
| Wheat | 25.46 | 30.98 | 31.89 | 30.60 | 31.76 | 32.85 | 34.29 | 38.87 | 40.41 | 37.15 | 28.26 | 28.66 |
| Rice | 4.47 | 4.78 | 4.19 | 4.53 | 4.75 | 4.83 | 4.45 | 4.32 | 4.77 | 4.32 | 1.17 | 0.93 |
| Potato | 2.73 | 2.69 | 1.97 | 4.56 | 3.27 | 3.25 | 3.35 | 3.18 | 6.08 | 3.20 | 2.89 | 2.34 |
| Cotton | 64.42 | 61.43 | 61.11 | 69.69 | 73.39 | 73.88 | 113.50 | 103.39 | 130.14 | 110.08 | 96.97 | 99.96 |
| Oils beets | 1.02 | 1.31 | 1.19 | 1.05 | 1.17 | 0.97 | 1.15 | 1.67 | 2.21 | 4.85 | 1.48 | 1.31 |
| Beet | 0.80 | 0.95 | 1.12 | 1.08 | 1.31 | 1.27 | 1.11 | 1.10 | 1.34 | 1.26 | 0.96 | 1.49 |
| Vegetables | 11.09 | 14.49 | 13.42 | 15.20 | 14.70 | 15.00 | 16.00 | 16.38 | 21.02 | 17.79 | 13.96 | 16.22 |
| Fruits | 25.62 | 33.87 | 35.44 | 36.91 | 69.10 | 72.91 | 52.98 | 66.96 | 69.33 | 72.06 | 59.44 | 74.47 |
| Pork | 4.58 | 4.93 | 5.91 | 6.83 | 6.51 | 6.91 | 7.94 | 8.49 | 9.55 | 5.25 | 12.49 | 12.34 |
| Beef | 21.59 | 22.42 | 24.07 | 24.32 | 24.46 | 26.05 | 25.97 | 26.82 | 27.08 | 18.76 | 18.00 | 19.62 |
| Mutton | 17.02 | 15.32 | 15.89 | 16.99 | 17.25 | 17.91 | 19.41 | 21.13 | 26.27 | 16.40 | 15.85 | 15.67 |
| Poultry | 2.82 | 3.42 | 4.14 | 4.46 | 4.88 | 6.36 | 7.06 | 8.11 | 8.45 | 1.64 | 1.51 | 1.97 |
| Eggs | 2.43 | 2.77 | 3.13 | 3.55 | 3.84 | 4.41 | 5.04 | 5.90 | 6.30 | 4.72 | 4.18 | 4.31 |
| Milk | 4.44 | 4.76 | 5.30 | 5.72 | 6.26 | 6.44 | 6.85 | 7.59 | 8.04 | 6.65 | 4.90 | 5.20 |
| Aquatic products | 1.69 | 1.76 | 1.85 | 2.12 | 2.39 | 2.53 | 2.78 | 2.81 | 2.87 | 2.89 | 2.29 | 2.33 |
| Year | Annual Water Availability (Billion m3) | Water Resource Self-Sufficiency Rate (%) | Ten Thousand Tons of WFP Population Density (Person) | WFP Economic Benefits (Yuan/m3) | WFP the Density of the Land (m3⁄ km2) | WFP Net Trade Value (m3) | WFP Conversion Rate (%) | WFP Conversion Rate | WFP Scarcity Index (%) |
|---|---|---|---|---|---|---|---|---|---|
| 2008 | 43.67 | 98.33 | 6.97 | 8.96 | 15.94 | 1.13 | 34.19 | ||
| 2009 | 36.37 | 99.57 | 5.09 | 6.59 | 7.95 | 1.75 | 57.54 | ||
| 2010 | 54.07 | 99.57 | 5.03 | 7.95 | 4.27 | 1.29 | 40.27 | ||
| 2011 | 45.83 | 99.66 | 4.75 | 9.09 | 4.67 | 1.34 | 51.40 | ||
| 2012 | 47.44 | 99.67 | 4.09 | 9.27 | 4.61 | 1.27 | 57.83 | ||
| 2013 | 50.29 | 99.73 | 4.32 | 11.03 | 8.07 | 1.34 | 53.17 | ||
| 2014 | 39.56 | 99.75 | 3.89 | 10.60 | 8.98 | 1.27 | 77.88 | ||
| 2015 | 34.04 | 99.57 | 3.65 | 10.35 | 6.44 | 1.78 | 97.20 | ||
| 2016 | 33.85 | 99.50 | 3.29 | 9.01 | 9.83 | 1.71 | 108.43 | ||
| 2017 | 32.80 | 99.30 | 3.97 | 11.75 | 9.80 | 1.37 | 95.28 | ||
| 2018 | 31.94 | 99.82 | 4.31 | 13.99 | 5.44 | 1.21 | 88.83 | ||
| 2019 | 33.89 | 99.77 | 4.27 | 15.67 | 6.67 | 1.27 | 87.21 |
| Year | (%) | (%) | Elastic Index | Decoupling Judgement |
|---|---|---|---|---|
| 2009 | 3.11 | 40.19 | 12.94 | Expansionary negative decoupling |
| 2010 | 25.61 | 4.05 | 0.16 | Weak decoupling |
| 2011 | 23.69 | 8.19 | 0.35 | Weak decoupling |
| 2012 | 18.68 | 16.45 | 0.88 | Expansive coupling |
| 2013 | 16.06 | −2.55 | −0.16 | Strong decoupling |
| 2014 | 10.76 | 15.25 | 1.42 | Expansionary negative decoupling |
| 2015 | 4.76 | 7.36 | 1.55 | Expansionary negative decoupling |
| 2016 | −3.39 | 10.94 | −3.23 | Strong negative decoupling |
| 2017 | 11.00 | −14.86 | −1.35 | Strong decoupling |
| 2018 | 8.12 | −9.22 | −1.14 | Strong decoupling |
| 2019 | 16.71 | 4.19 | 0.25 | Weak decoupling |
| Mean | 12.28 | 7.27 | 1.06 | Expansive coupling |
| “The 12th Five-Year Plan” | 14.79 | 8.94 | 0.81 | Expansive coupling |
| “The 13th Five-Year Plan” | 8.11 | −2.24 | −1.37 | Strong decoupling |
Publisher’s Note: MDPI stays neutral with regard to jurisdictional claims in published maps and institutional affiliations. |
© 2022 by the authors. Licensee MDPI, Basel, Switzerland. This article is an open access article distributed under the terms and conditions of the Creative Commons Attribution (CC BY) license (https://creativecommons.org/licenses/by/4.0/).
Share and Cite
Lu, Q.; Liu, F.; Li, Y.; Wang, D. Study on the Relationship between Water Resources Utilization and Economic Growth in Tarim River basin from the Perspective of Water Footprint. Water 2022, 14, 1655. https://0-doi-org.brum.beds.ac.uk/10.3390/w14101655
Lu Q, Liu F, Li Y, Wang D. Study on the Relationship between Water Resources Utilization and Economic Growth in Tarim River basin from the Perspective of Water Footprint. Water. 2022; 14(10):1655. https://0-doi-org.brum.beds.ac.uk/10.3390/w14101655
Chicago/Turabian StyleLu, Quan, Fengjiao Liu, Yanjun Li, and Dezhen Wang. 2022. "Study on the Relationship between Water Resources Utilization and Economic Growth in Tarim River basin from the Perspective of Water Footprint" Water 14, no. 10: 1655. https://0-doi-org.brum.beds.ac.uk/10.3390/w14101655