
Morphology Recovery and Convergence of Topographic Evolution in the Natori River Mouth after the 2011 Tohoku Tsunami


Department of Civil Engineering, Tohoku University, Sendai 980-8579, Japan
*
Author to whom correspondence should be addressed.
Water 2022, 14(5), 715; https://0-doi-org.brum.beds.ac.uk/10.3390/w14050715
Submission received: 24 January 2022
/
Revised: 17 February 2022
/
Accepted: 22 February 2022
/
Published: 24 February 2022
(This article belongs to the Topic From Coastal Engineering to Integrated Coastal Zone Management)
Abstract
:The 2011 Great East Japan earthquake and tsunami caused significant damage along the coastal region in Miyagi Prefecture. In the Natori River of Miyagi Prefecture, the recovery process of the estuarine morphology has been observed since the tsunami arrived. In this study, detailed analyses of collected aerial photographs and beach topography in front of the river mouth were conducted to evaluate whether the river mouth has reached a new equilibrium. The shoreline analysis suggests that the river mouth has obtained an equilibrium state after 2014 in which the sediment volume can be preserved within the littoral system. In addition, the convergence process to the stable topography was detected by the first spatial and temporal eigenfunctions obtained from the empirical orthogonal function (EOF) analysis of the beach profiles. From the results, it can be concluded that the river mouth has obtained a new equilibrium of morphology after the tsunami. As the recurrence of the tsunami can be expected in the next several centuries, the findings of this study can be useful for long-term coastal and riverine management against future disasters in this river mouth, and other coastal regions that are prone to large-scale disasters in the near future.
1. Introduction
The 2011 tsunami-induced morphological changes, such as large-scale inundation, beach erosion, and flushing of sand spits and sand barriers, were detected along the coasts and estuaries from Iwate to Fukushima Prefecture. The immediate post-tsunami coastal and estuarine morphology changes were reported and investigated by [1,2,3,4,5]. Before the 2011 Tohoku tsunami, the understanding of the long-term recovery process in coastal and estuarine regions after the tsunami had never been the focus of attention since most post-tsunami surveys considered the immediate aftermath of the disasters. Retrieval of regular monitoring data is also a challenge for most countries wanting to conduct long-term studies. However, tsunami-induced morphological alterations can be regarded as an important part of the history of coastal evolution and irreversible changes to any coastal regions [6,7]. As a result, the post-tsunami recovery is a vital aspect in predicting future mechanisms of morphological change.
Before the 2011 Tohoku tsunami, the 2004 Indian Ocean tsunami and the 2010 Chile tsunami are two events where several studies of the recovery in the coastal and estuarine regions were undertaken [8,9,10]. These studies mostly utilized the satellite images, beach profiles, and sediment sampling on the time span of a few months to a couple of years to investigate the pre- and post-tsunami morphological changes. Some recent studies have been able to numerically investigate the post-tsunami morphological changes and sediment movements. Monecke et al. [11] simulated the cross-shore profile change under the prevailing hydrodynamic conditions to investigate the recovery process, while Martínez et al. [12] applied a more complicated sediment transport model (Delft3D) in conjunction with morphology and topography data analysis to discuss the erosive behavior of the microtidal Tubul-Raqui wetland in south-central Chile. In Japan, more thorough and multidisciplinary research of the coastal and riverine damage and recovery after the tsunami was conducted using the sufficient availability of both pre- and post-tsunami data [13,14,15,16,17,18,19,20,21].
Based on past research, the recovery was rather fast in barrier breaches and straight coasts with minor changes [8,9,10,18]. In the river mouths and tidal inlets, the recovery is more complicated and reliant on the hydrodynamic conditions and the availability of sediment supply in the littoral zone. In natural estuarine areas, where regular coastal processes are the main driving forces, the alongshore transport drift can quickly recover the loss of sediment in the eroded area. For small and wave-dominated river mouths, such as the Nanakita River mouth in the Sendai Bay, recovery was in a matter of months and experienced mouth closure after a year [15]. In the Khuk Khak and Bang Niang tidal inlets, Thailand, the sand spits elongated across the channel and the equilibrium in these areas was detected by analyzing the beach profile data two years after the tsunami [8]. However, in Japan, the industrial ports or lagoons adjacent to river mouths are prominent to serve both economic and flood control management purposes. The river mouths are modern estuaries with coastal structures that have significantly modified the geomorphic and morphological processes and have helped to maintain morphologic stability for a long time, driving the natural coastal and riverine processes. Therefore, after the tsunami, the recovery process in these river mouths is expected to be different from that of natural ones. Hiep et al. [20,21] have recently discussed the littoral sediment budget changes in two rivers in Sendai Bay (the Abukuma and Naruse Rivers) caused by the tsunami, taking into account hydrodynamic conditions and anthropogenic disruption.
After World War II, the Natori River mouth, among other regions along the Sendai Coast, was subjected to anthropogenic impact including river channelization and the construction of multiple coastal areas around it, which stabilized the morphology in this area [22]. Since then, the 2011 tsunami has been regarded as the largest disaster to have occurred, resulting in remarkable morphological and topographical alterations. This heightened the inquisitiveness for coastal recovery after the tsunami which is highly required for future adaptation following the disaster at this river mouth. This study can also be added into the knowledge of understanding the recovery of a modern coastal zone that has suffered a large-scale disaster.
2. Field Site, Materials and Methods
2.1. Field Site
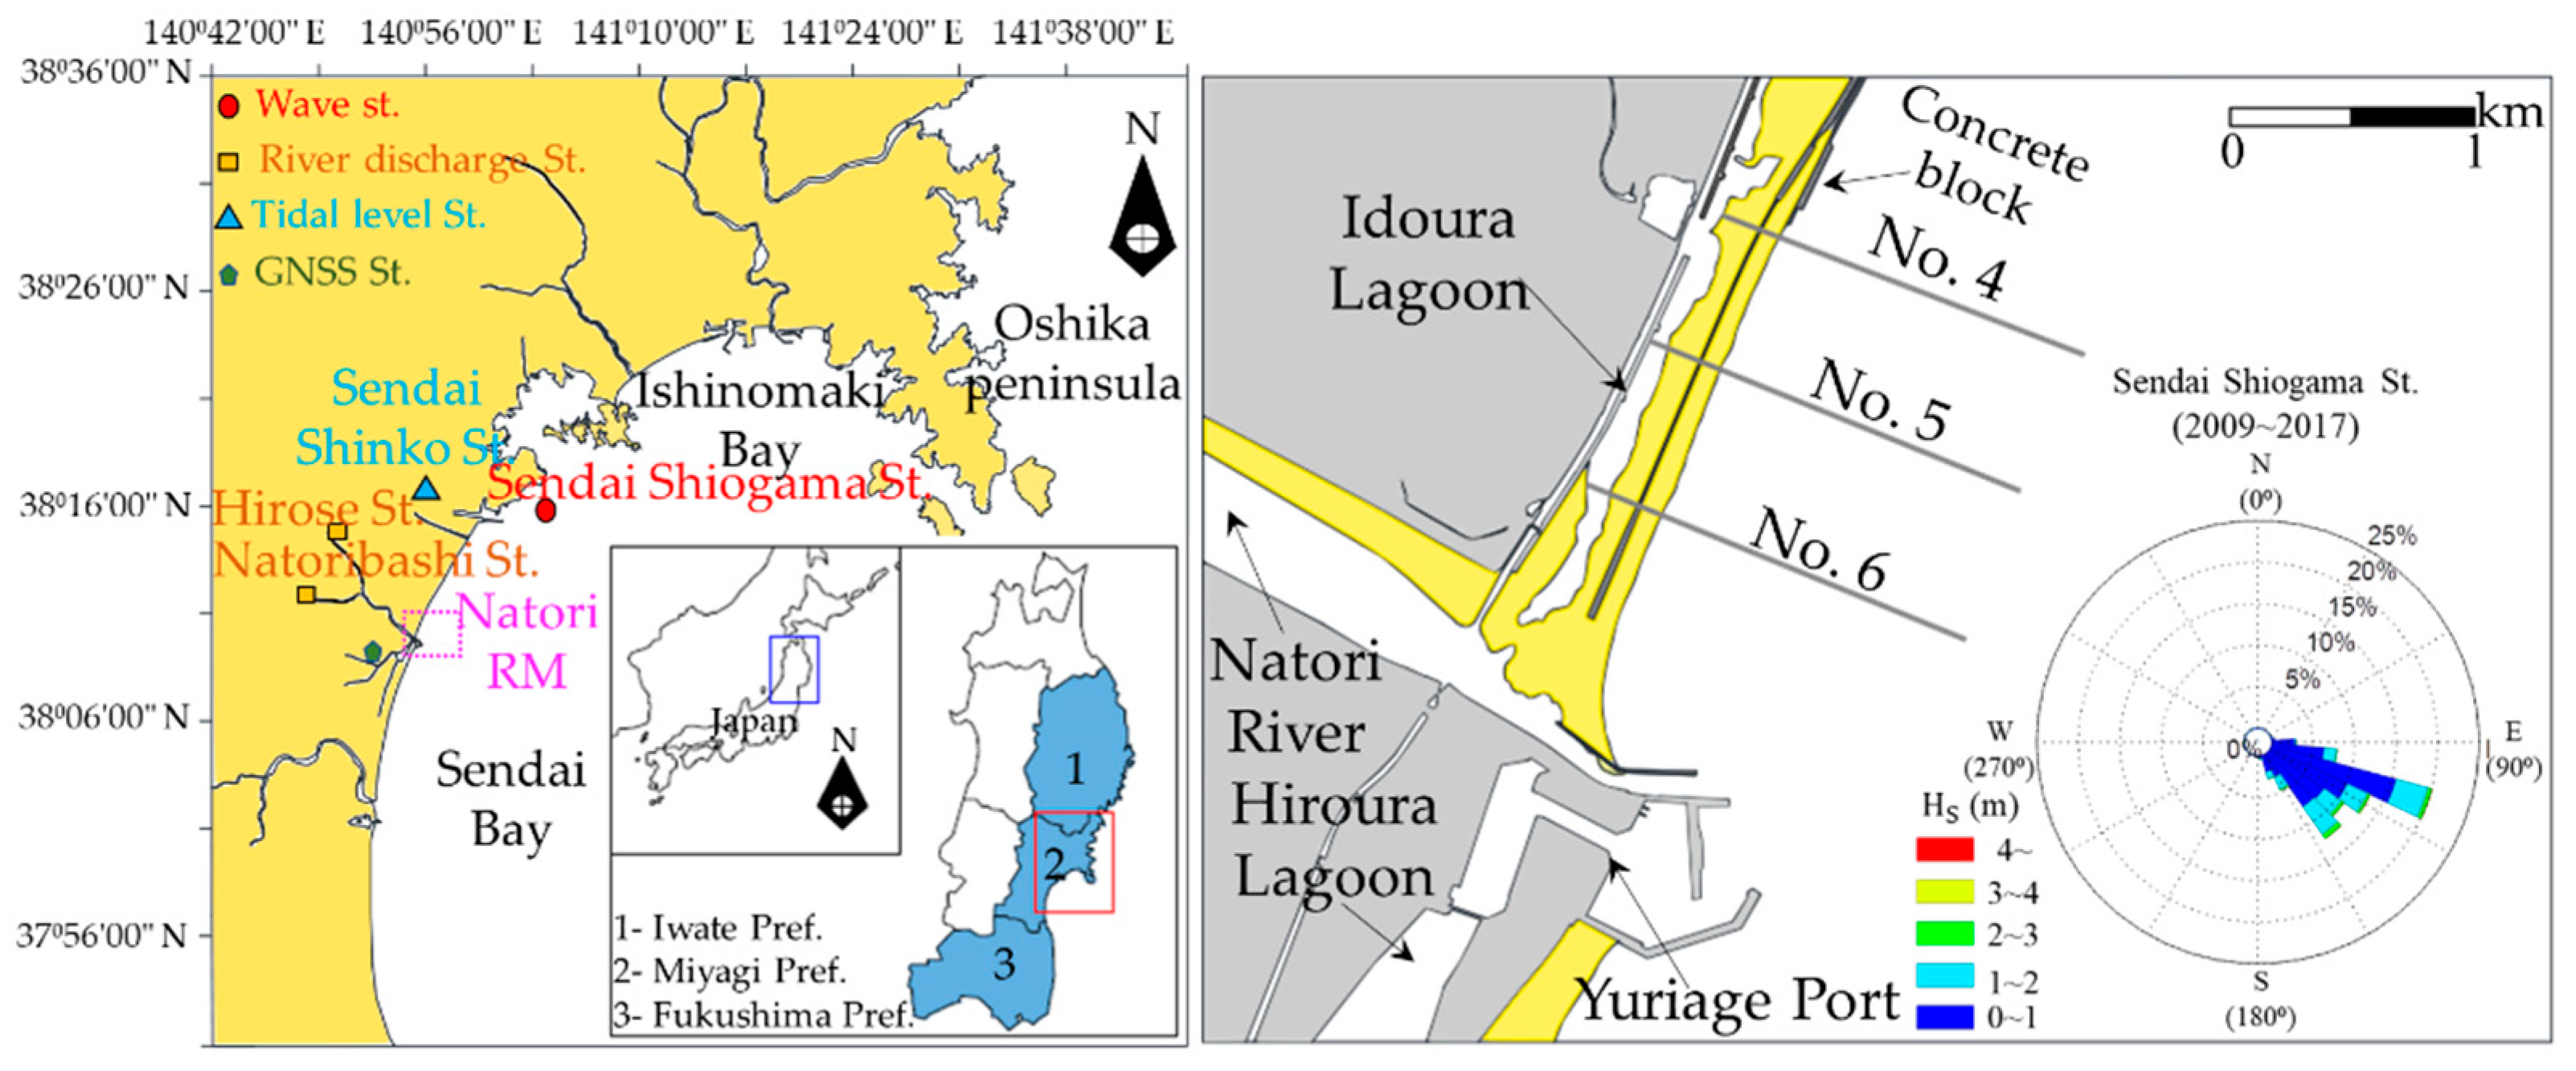
This study focuses on the river mouth of the Natori River in Sendai Bay, Miyagi Prefecture, Japan (Figure 1). The Natori River is one of three rivers in Sendai Bay, having a length of 55 km and a small catchment area of 1133 km2. The river is categorized as a class A river where the national government manages the water resources, environmental management, and disaster control. The Natori River mouth is a part of the Sendai coastal plain where medium to very fine sand is distributed on the shoreface, whereas much of the inner shelf at water depths of 18–20 m is covered with mud [23]. The mouth is characterized by a sandbar with a typical elevation range of 2–3 m and width range of 150–180 m and separated from the low-lying inland area by the Idoura Lagoon. The Idoura Lagoon is a shallow brackish water area where the tidal flats appear on both sides of a narrow tidal channel during ebb tides and many different living species exist [24]. At the mouth entrance, the navigation route is stabilized by two jetties. The jetties are slightly bent towards the north to direct the river flow away from the port to prevent spiral flows and damage to the embankment of the port. The area investigated in this study is limited to the mouth entrance to the wave dissipating block including the sandbar in front of the Idoura Lagoon.
Figure 1 shows the rise of the waves from the 2-h interval wave data (2009–2017) collected from Sendai Shiogama Station of the Nationwide Ocean Wave Information Network for Ports and Harbours (NOWPHAS). Due to the presence of the Oshika Peninsula, wind waves from the North Pacific Ocean in the north (N) and northeast (NE) directions are obstructed from propagating to the Sendai Coast. The wave conditions in the northern area of Sendai Bay, including the Natori River mouth, consist of two main dominant directions which are southeast (SE) during the summer season and east (E) during the winter season. The time series wave data (Figure 2) also shows that the wave height is especially high during the period from September to November when storms and typhoons often occur.
The dominant wave directions indicate that before any anthropogenic processes, the main direction of the alongshore drift on the Sendai Coast is from the south to the north starting from the Abukuma River mouth to the end of the littoral drift at the Sendai Port. According to the field measurement of accumulative sediment from Sawamoto [19], after the construction of the Yuriage Port, the sediment bypassing rate from the updrift through the port to the northern coast is equal to zero. Further investigations conducted by Widyaningtia et al. [25] provided the depth of closure (DoC) value in the port to be from 12 to 14 m, which is much bigger than the average DoC of 8 m on the Sendai Coast [26]. This demonstrates that the longshore sediment transport from updrift to the Natori River mouth is blocked by the Yuriage Port, and the cross-shore movement dominates the river mouth before the tsunami [22]. In addition, according to Kang and Tanaka [27], the first spatial mode of EOF analysis, which contributed 39% of the shoreline change from 1996 to 2003, was the primary transport of cross-shore movement in the entire northern Sendai Coast before the tsunami.
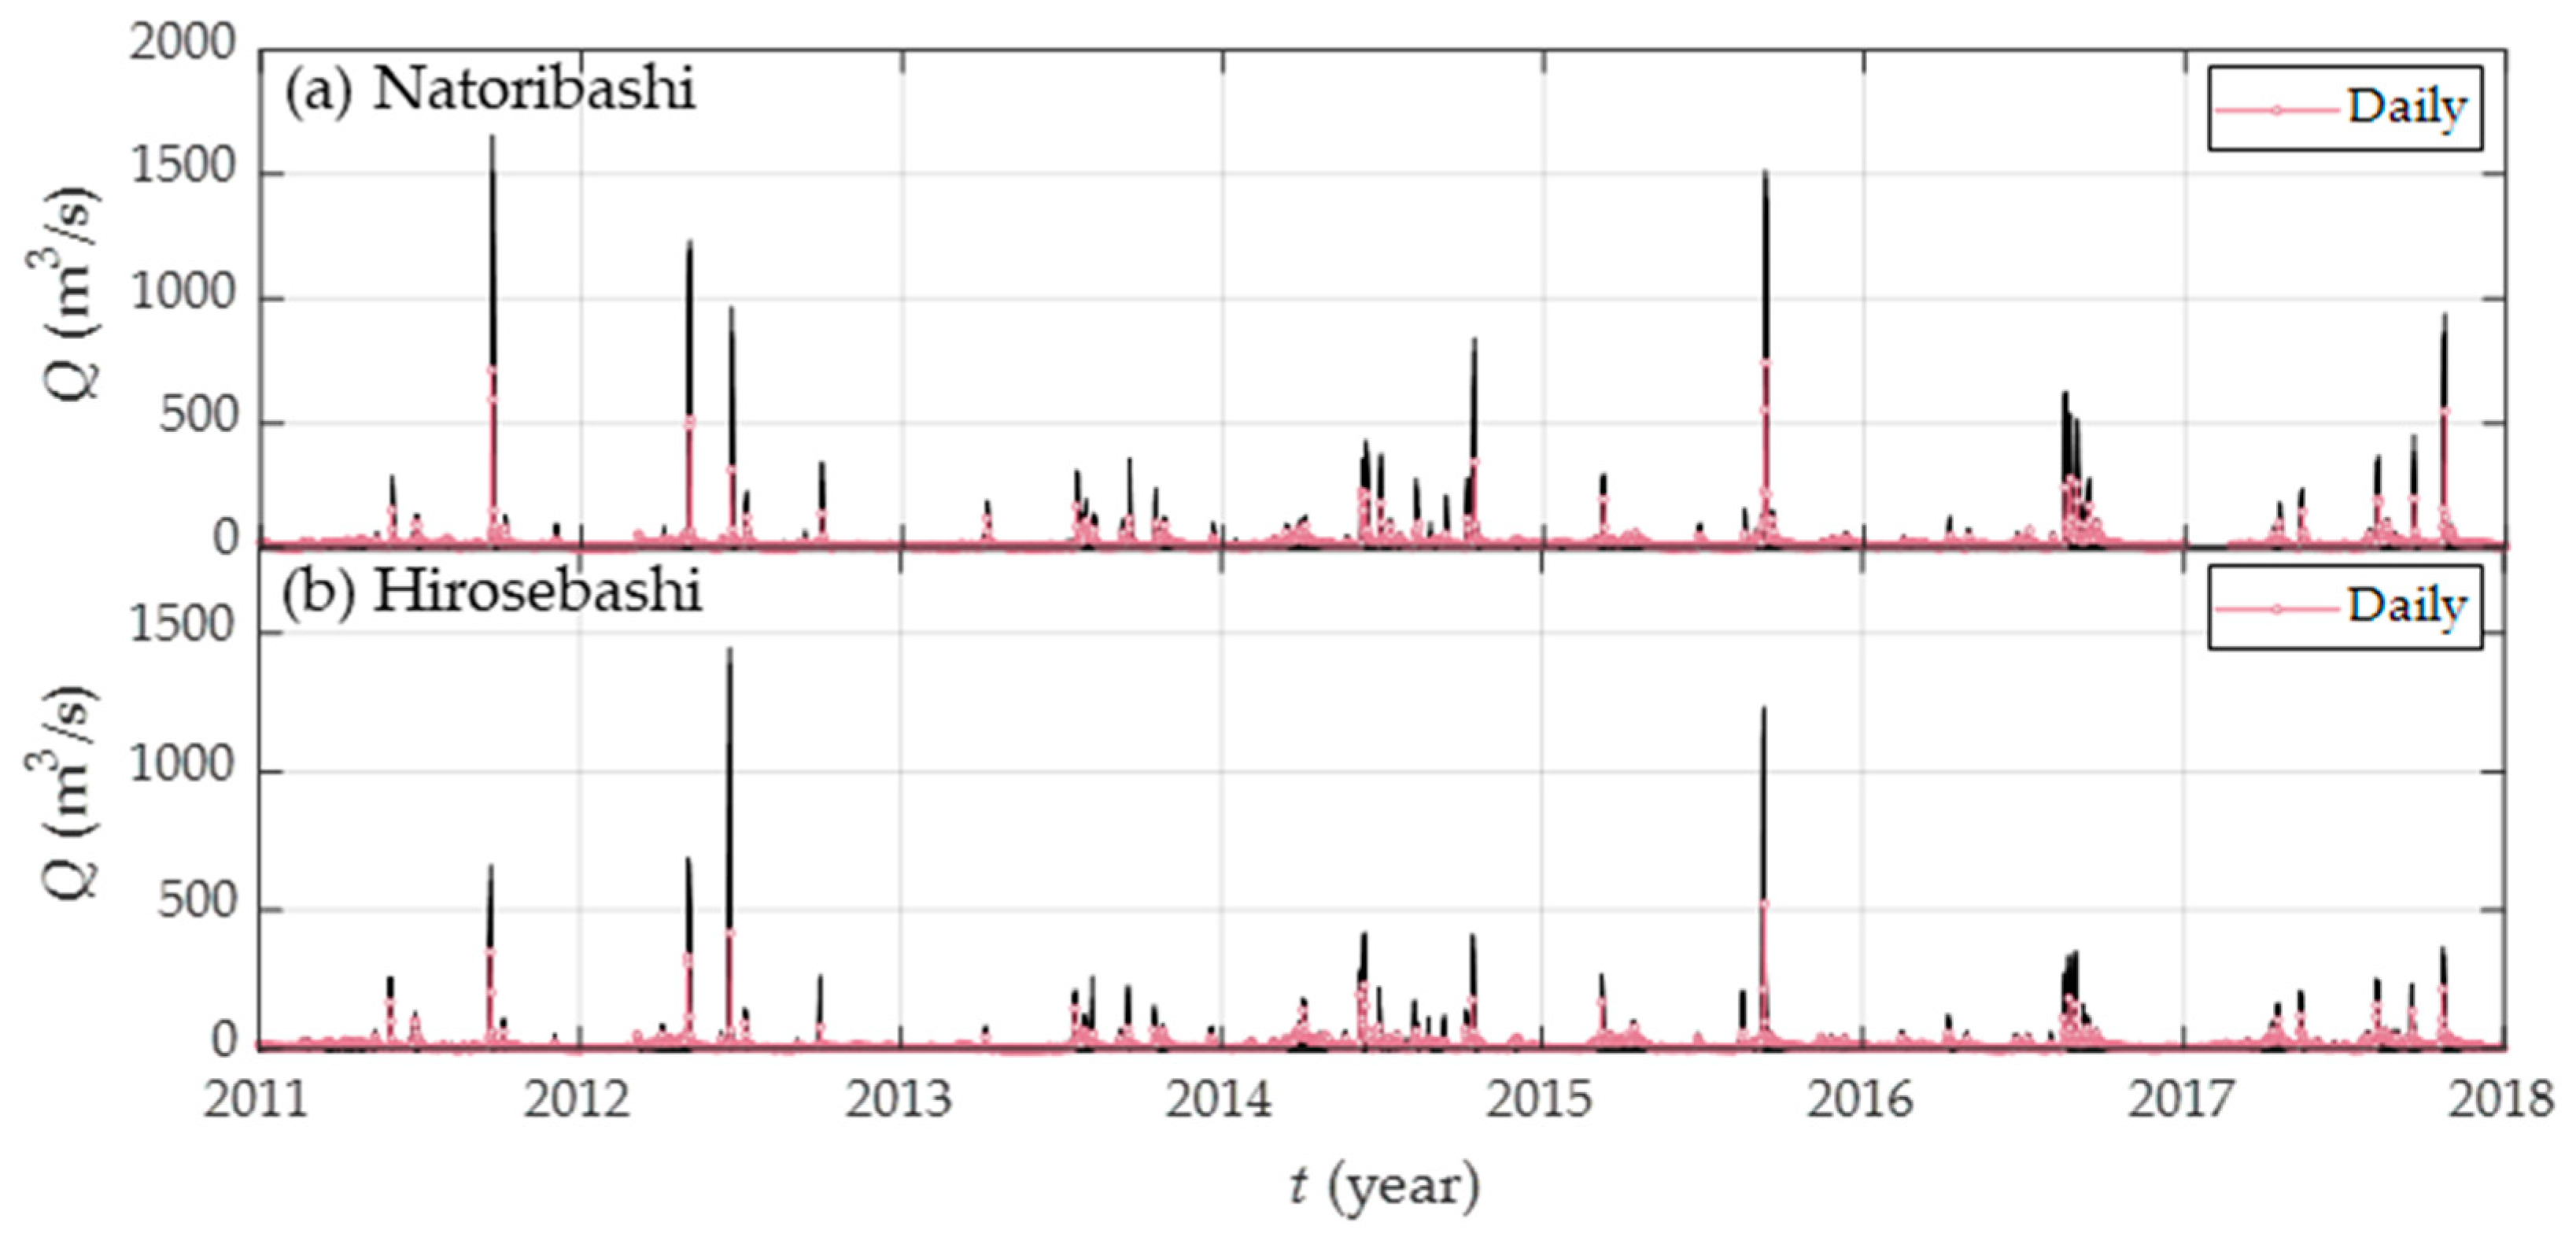
In the Natori River, the average annual discharge estimated from the hourly river discharge data at Natoribashi and Hirose Stations from 2011 to 2017 (Figure 3) is 16 m3/s. The river flows are low and moderate during winter (December–February) and spring (March–May), while in summer (June–August) and autumn (September–November) seasons, the river discharge is substantially higher due to floods or tropical cyclones. Since it is also a small river catchment, the annual sediment discharge contributing to the littoral zone was estimated to be only 10,000 m3/y [22] and hardly changed throughout many decades. Before the tsunami, during extreme flood events, the water level could rise above 2 m at the entrance and the total freshwater discharge could exceed 1500 m3/s. In addition, the flood flow could breach through the sand spit and flush the sediment between the spit and jetty to the offshore area near the head of the left jetty. According to Tu [28], after the flood events observed in 1986, 1989, and 2002, due to the onshore transport and local alongshore transport induced by the east-direction waves, the sand spit recovered rapidly and took less than two months for it to reach the jetty.
When the 2011 tsunami arrived at Sendai Bay, the measured tsunami height at the Natori River mouth was from 10 to 12 m and the penetration of the tsunami could reach far upstream [29]. The disaster resulted in unprecedented destruction of the river mouth morphology. Since the Natori River is important to the development of Sendai and Natori Cities, the morphology of the river mouth is also very vital. It contributes to the control of the eco-system in the upstream of the river where many living species, such as Japanese basket clams and Japanese littleneck clams (asari), are located in the brackish water zone [30]. The control of salinity intrusion under the effects of tidal flows and freshwater discharge between the jetties are important aspects in the long-term sustainability of the upstream habitat. Before the tsunami, the flood-induced breach in the sand spit was the main cause of upstream saltwater intrusion, and simulations of different flushing scenarios were conducted to assess the morphological change after floods [31]. The 2011 tsunami induced a much greater salinity intrusion distance from the mouth and the mixing behaviors gradually changed during the morphological recovery time [32].
Furthermore, after the tsunami, both national and local governments have proposed numerous levels of protection, such as elevating roadways and railways, and constructing canals parallel to the beach to reduce the future tsunami energy and consequent damage. The first line of defense is the coastal embankment along the coastline [33]. This requires a thorough understanding of post-tsunami morphology change behaviors to ensure the sustainability of coastal morphology behavior and prevent the risk of coastal erosion. Therefore, this study could be a highly useful reference for the future coastal and riverine management in this area.
2.2. Materials and Methods
2.2.1. Image Processing and Shoreline Analysis
The aerial photographs in this study were taken by aircraft at the highest frequency of once a month. The spatial interval of a single capture can cover the longshore distance from 0.5 to 1 km. Some images from the Geospatial Information Authority of Japan (GSI) were also retrieved. The resolution of the images is sufficiently high (0.5–1 m) and the detailed information on the retrieved images can be found in Figure 4a. All images were transformed into orthoimages and geo-referenced by selecting a series of ground control points (GCP) from Google Earth Pro software and assigning them to a spatial reference system, WGS84/UTM Zone 54S. Projective matrix and bilinear interpolation were applied as image transformation and resampling methods.
The wet–dry line or the high-water line (HWL) dividing the dark (wet) and light (dry) sand on the beach is defined as the shoreline position using the unsupervised K-means clustering algorithm. A detailed description and some applications of this cluster analysis are referred to in [20,34]. For a small number of images where the features of wave breaking bubbles are neutralized on the shore, a manual shoreline detection based on the edge gradient and direction between sand and water was implemented on each image to detect the shoreline. Different water levels at the time of capture caused by tides can affect the consistency of the shorelines. A conventional tidal correction was applied to each shoreline by translating the detected line onshore and offshore a certain distance determined by the estimated tidal level data at Sendai Shinko Station (Figure 1) and the beach slope (tanβ). The representative beach slope during the recovery process was averaged from the beach slopes of the beach profiles in front of the sandy beach (Figure 1) within the intertidal range from mean low water springs (MLWS) to mean high water springs (MHWS) (Figure 4b,c). Details about the beach profiles are mentioned in the next section. In addition, the overall accuracy of the detected shorelines can be affected by a degree of uncertainty derived from the geo-referencing and shoreline detection. Considering all potential errors, a possible uncertainty of 1.5 m was obtained for the detected shorelines. To support the later estimate and discussions, a new reference system with a baseline rotated counterclockwise 202 degrees to the north was designated to reference all images and detected shorelines.
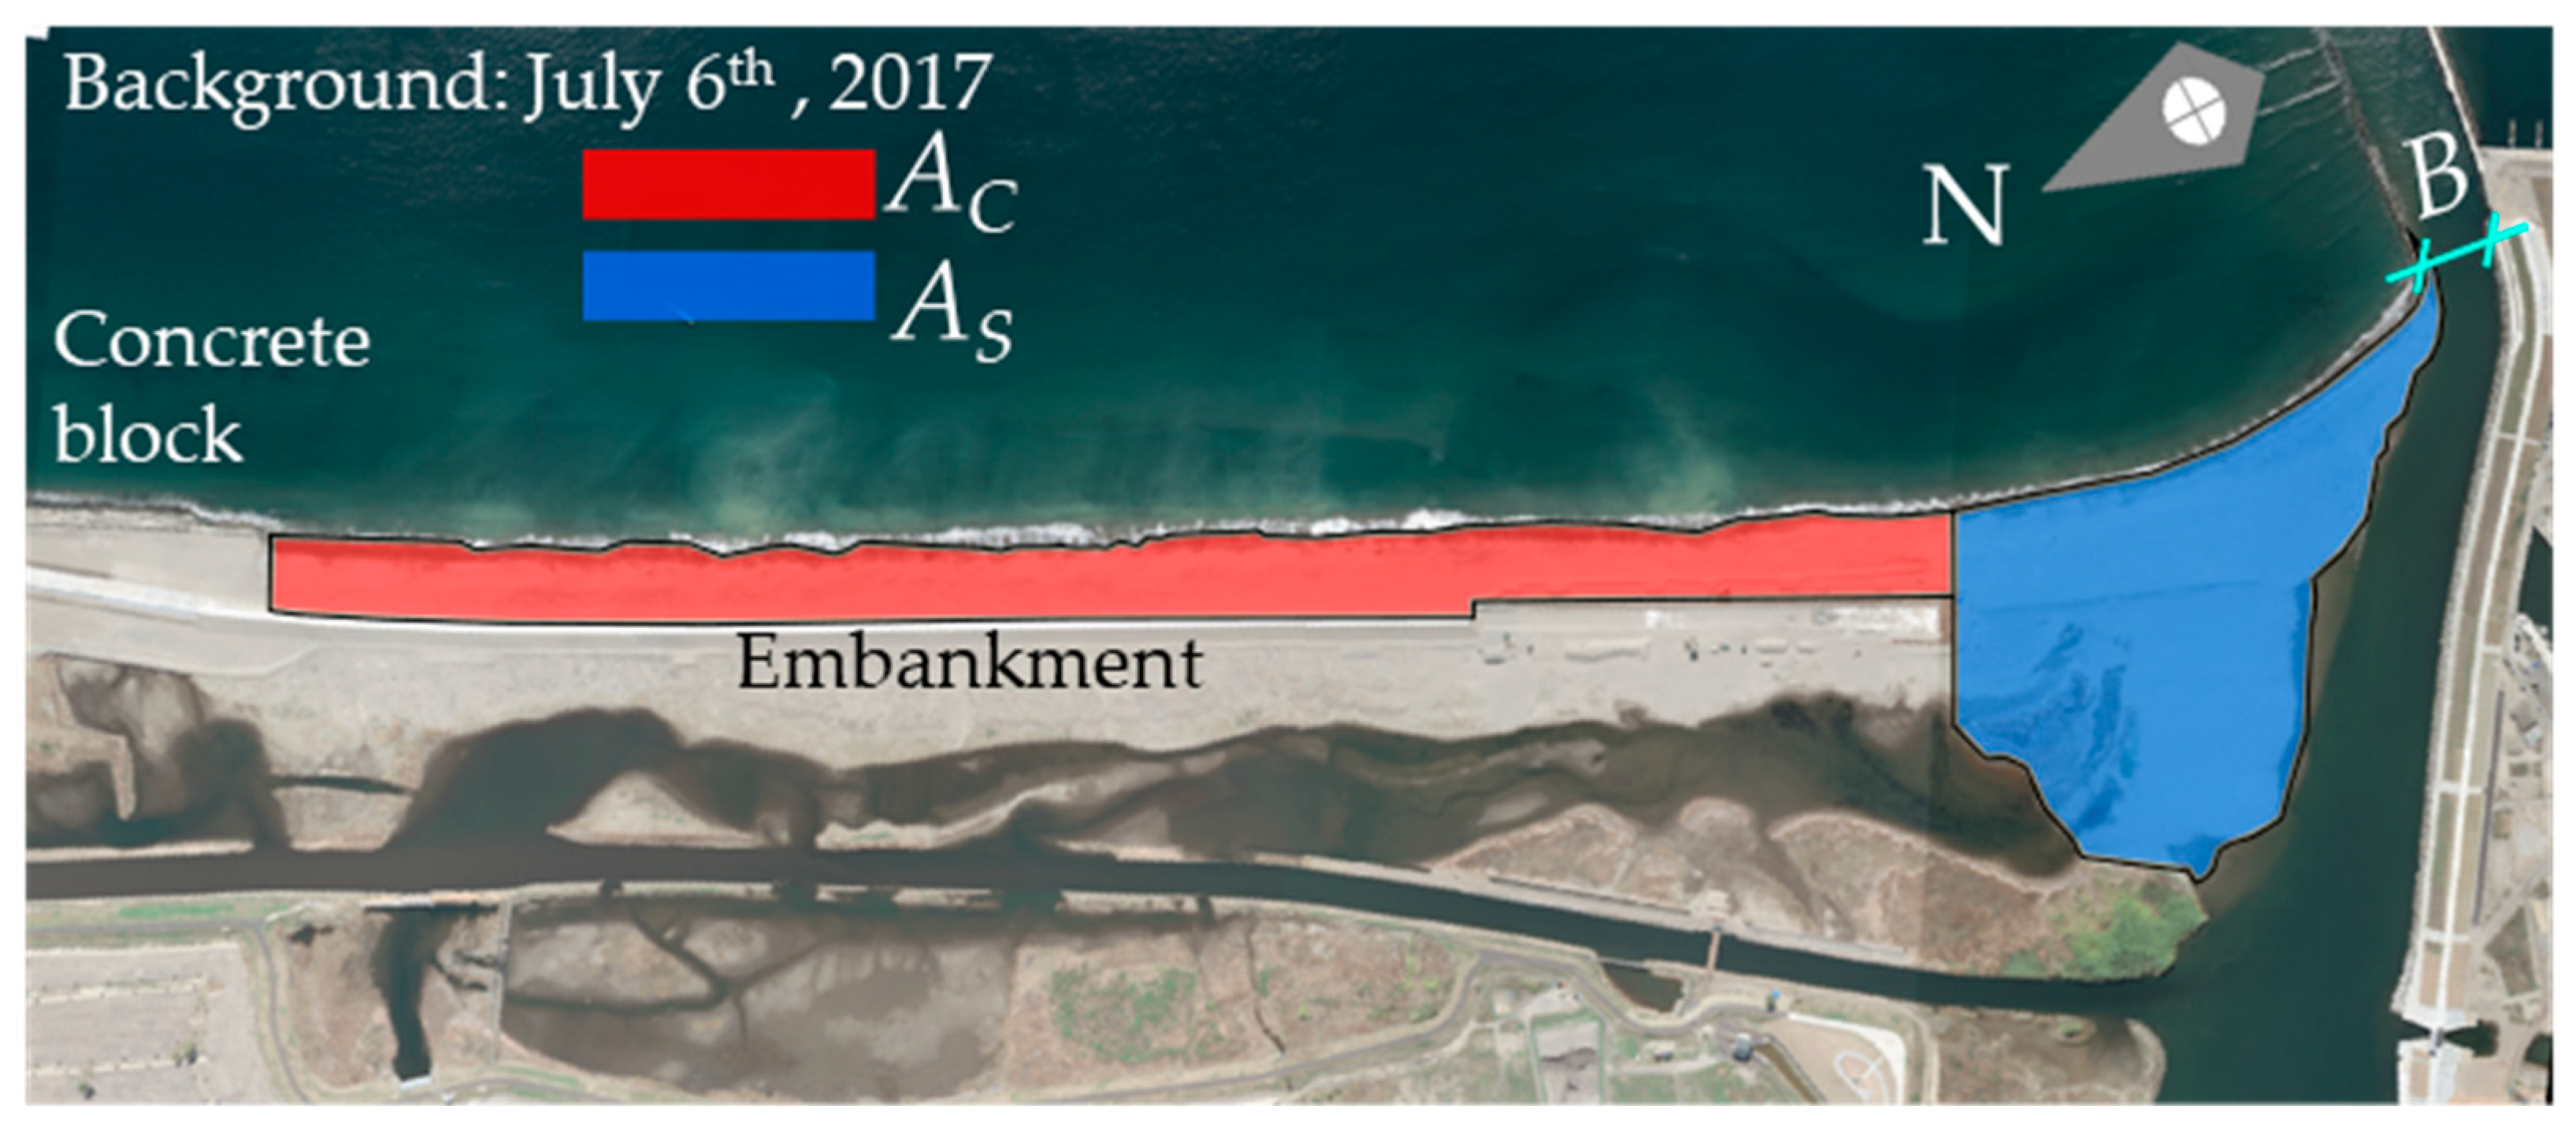
From the shorelines, the morphological change can be investigated by the important features of the river mouths, which are the areas of the sand spit, AS (m2) and sandy beach, AC (m2); the width of the river mouth, B (m). The areas of the sand spit and sandy beach are separated by a defined position where the river flow is assumed to not reach the sandy beach area. The width of the river mouth is the smallest throat channel defined by both sides of river mouth. The clear definitions are shown in Figure 5.
2.2.2. Empirical Orthogonal Function (EOF) Analysis
The EOF analysis is known to be a powerful statistic method to examine the behavior of each dataset in terms of space and time. This method is often used to decompose the beach profiles into the spatial and temporal functions that efficiently explain the data variance under the influence of many complicated processes [35,36,37]. In this section, the EOF analysis and utilized data are introduced, and detailed application and discussion are provided in Section 3.2.
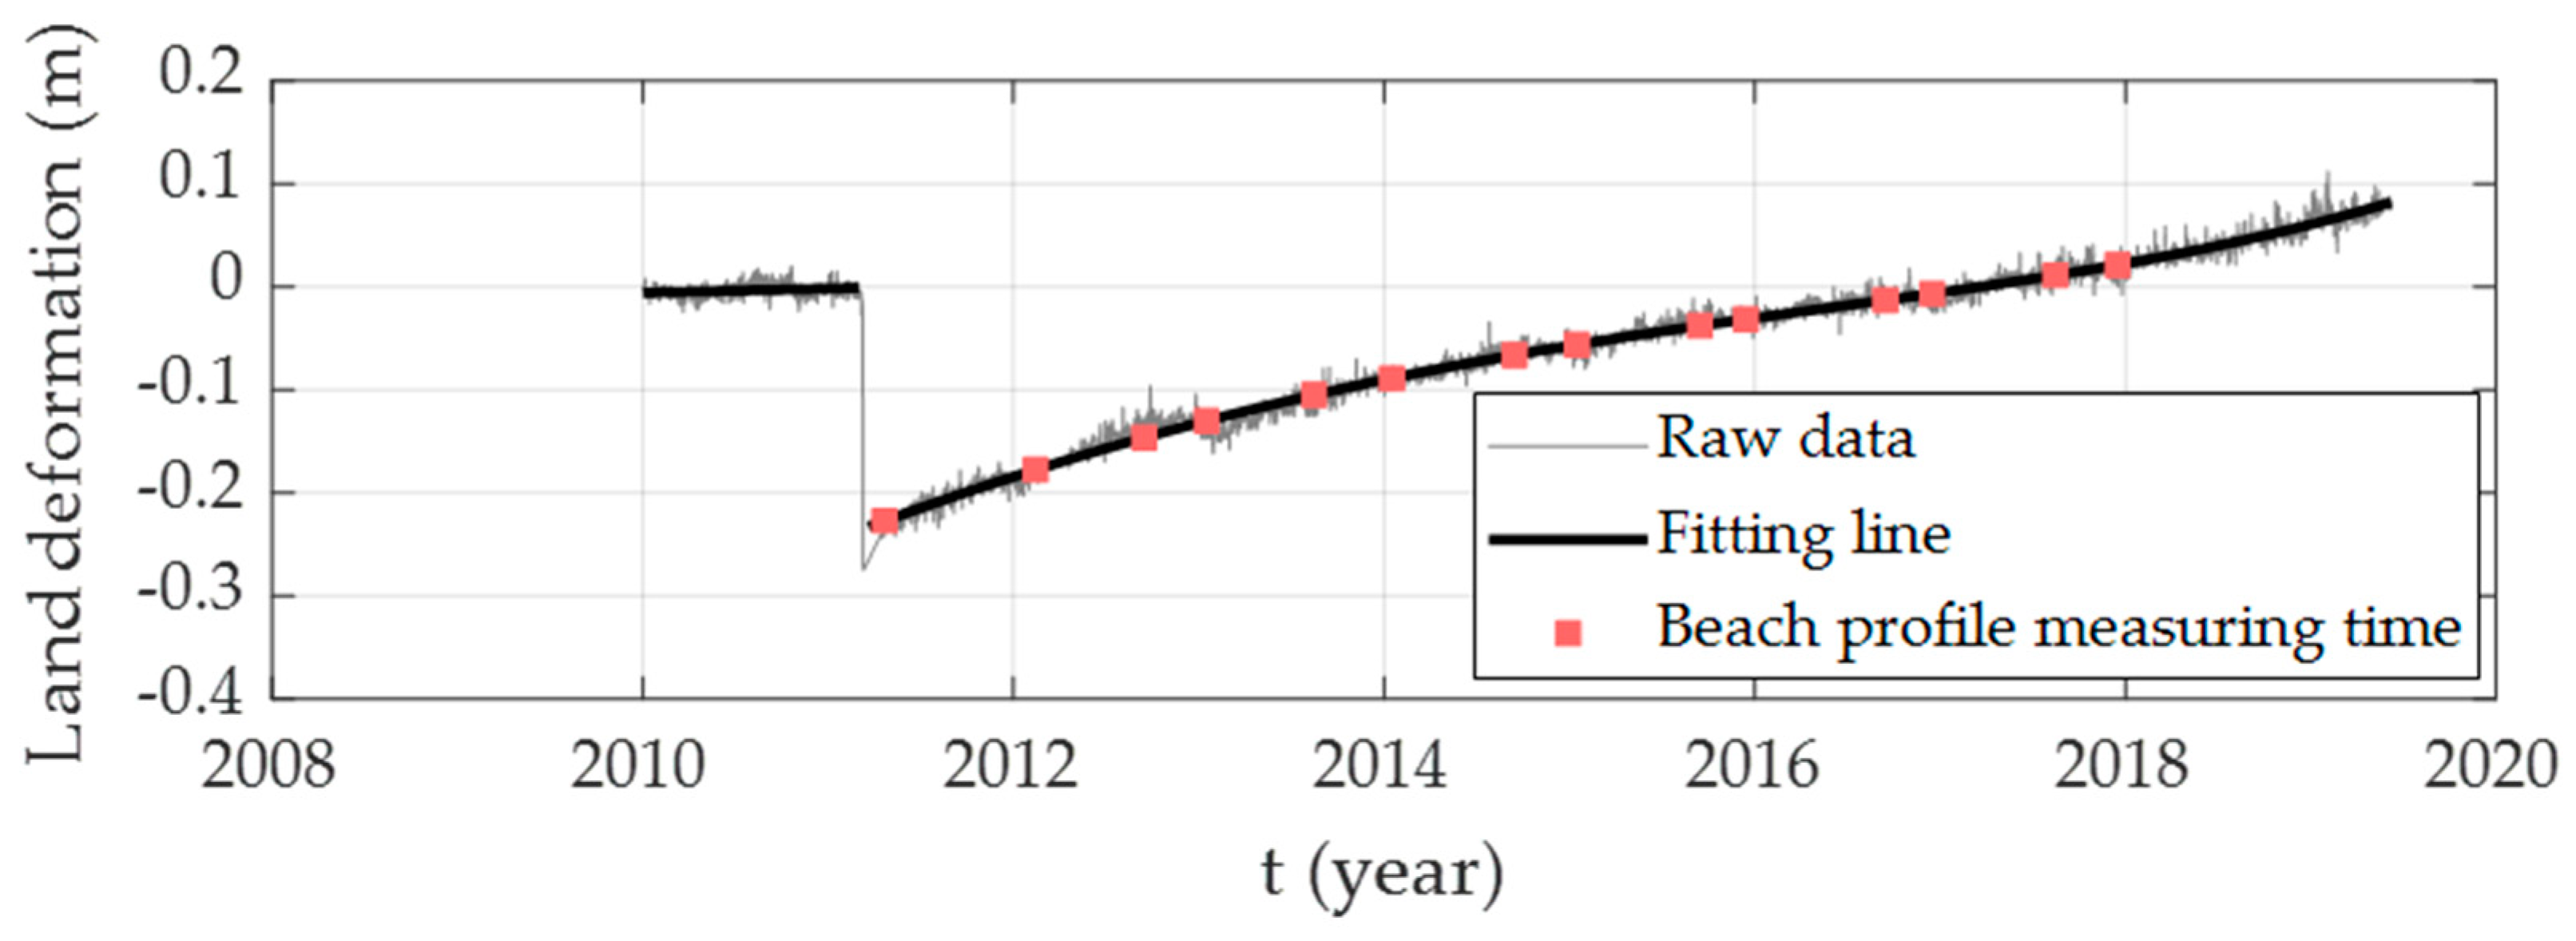
The data utilized for EOF analysis was the survey of beach profiles along the sandy beach in front of Idoura Lagoon provided by the Sendai Office of River and National Highway Ministry of Land, Infrastructure, Transport, and Tourism (MLIT). Three beach profiles at a spacing of about 0.5 km were measured from 2011 to 2017 using an echosounder and integrated DGPS. The precision of the GPS was ±2 m and that of the echosounder was about 0.2 m. Figure 1 shows the location of the measured profiles and the detailed measuring frequency is shown in Figure 6a. Figure 6b presents the measured profile data at each location. The measured daily land elevation data at a GNSS Crustal deformation station nearest to the mouth area (Figure 1) collected from the Geospatial Information Authority of Japan (GSI) suggests that there is a possible seismic land subsidence of 0.22 m induced by liquefaction triggered by the earthquake motion (Figure 7). The post-seismic deformation data show the quick recovery of the ground level with the linearly rising rate. According to Tinh et al. [38], the bed recovery of the Sendai Plain after the tsunami was detected at all GNSS Crustal deformation observations with almost the same land rising rate of 3.3–3.8 cm/year. The land rising levels at the measuring times are not much bigger than the possible uncertainty caused by the measuring device. In addition, the closer view of the profiles at the deep-water area shows insignificant change. Therefore, the removal of bed level rising on the dataset can be neglected in this study.
3. Results
3.1. Overall Morphology Change
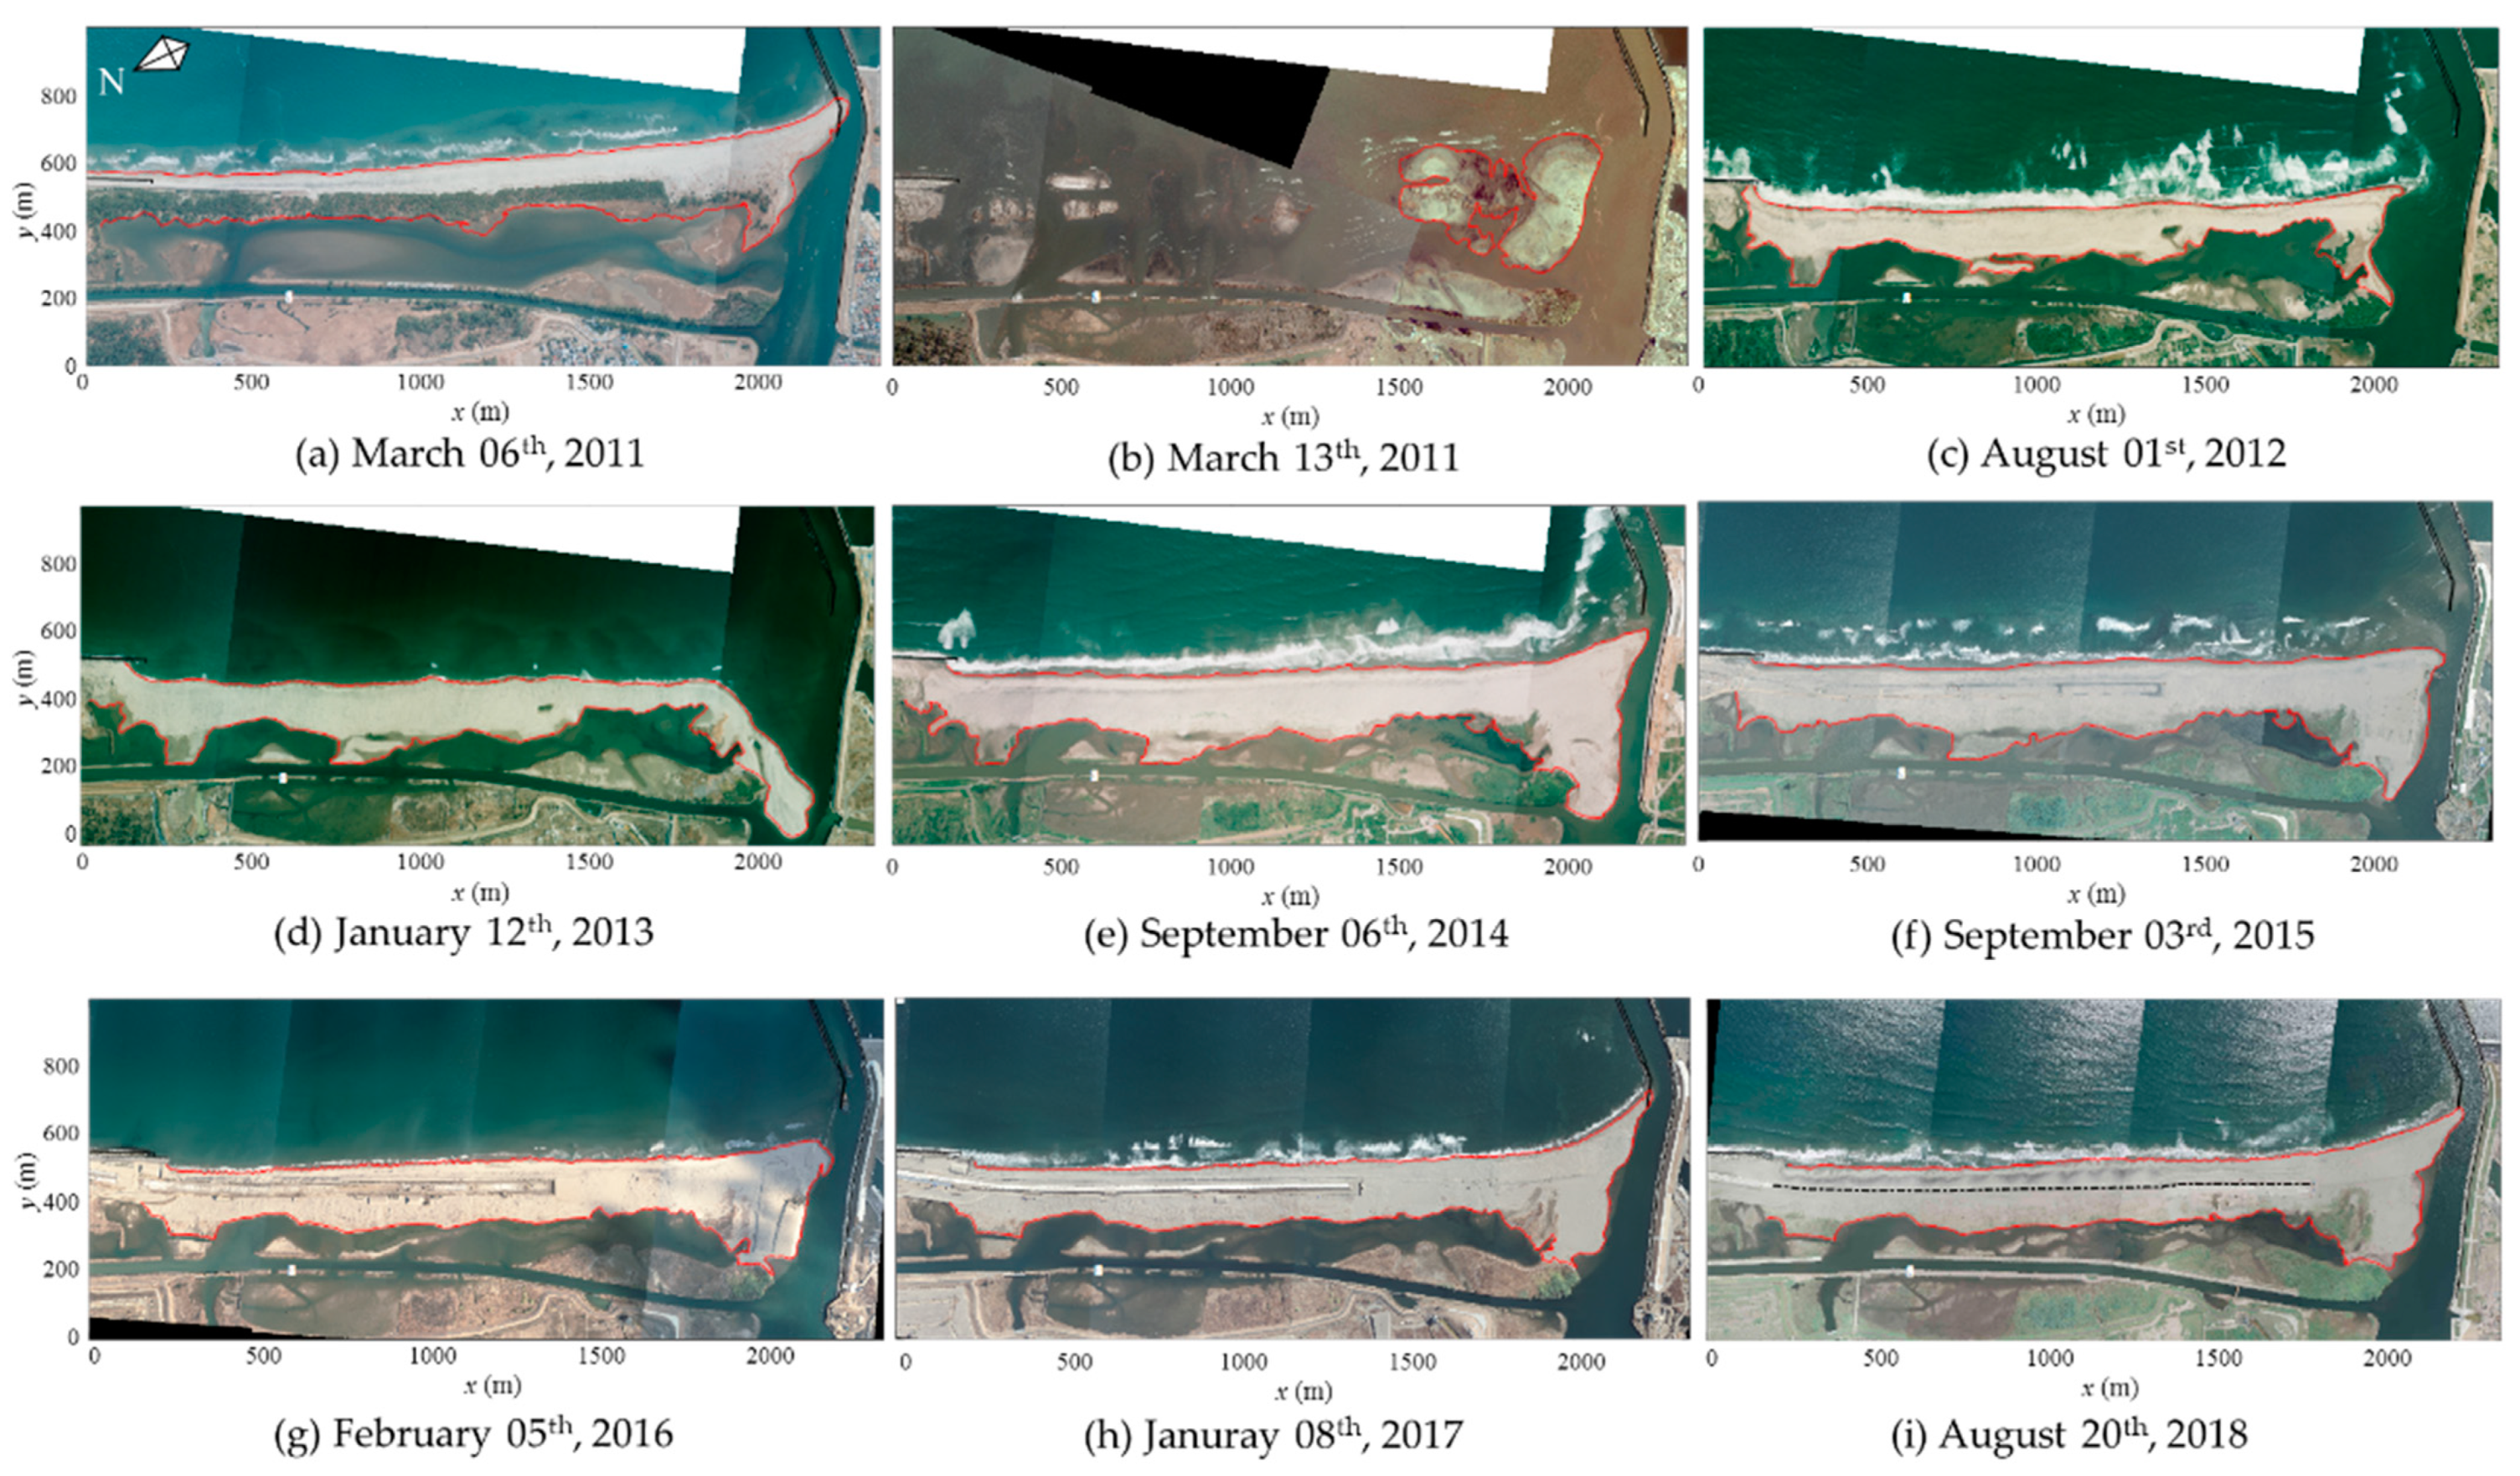
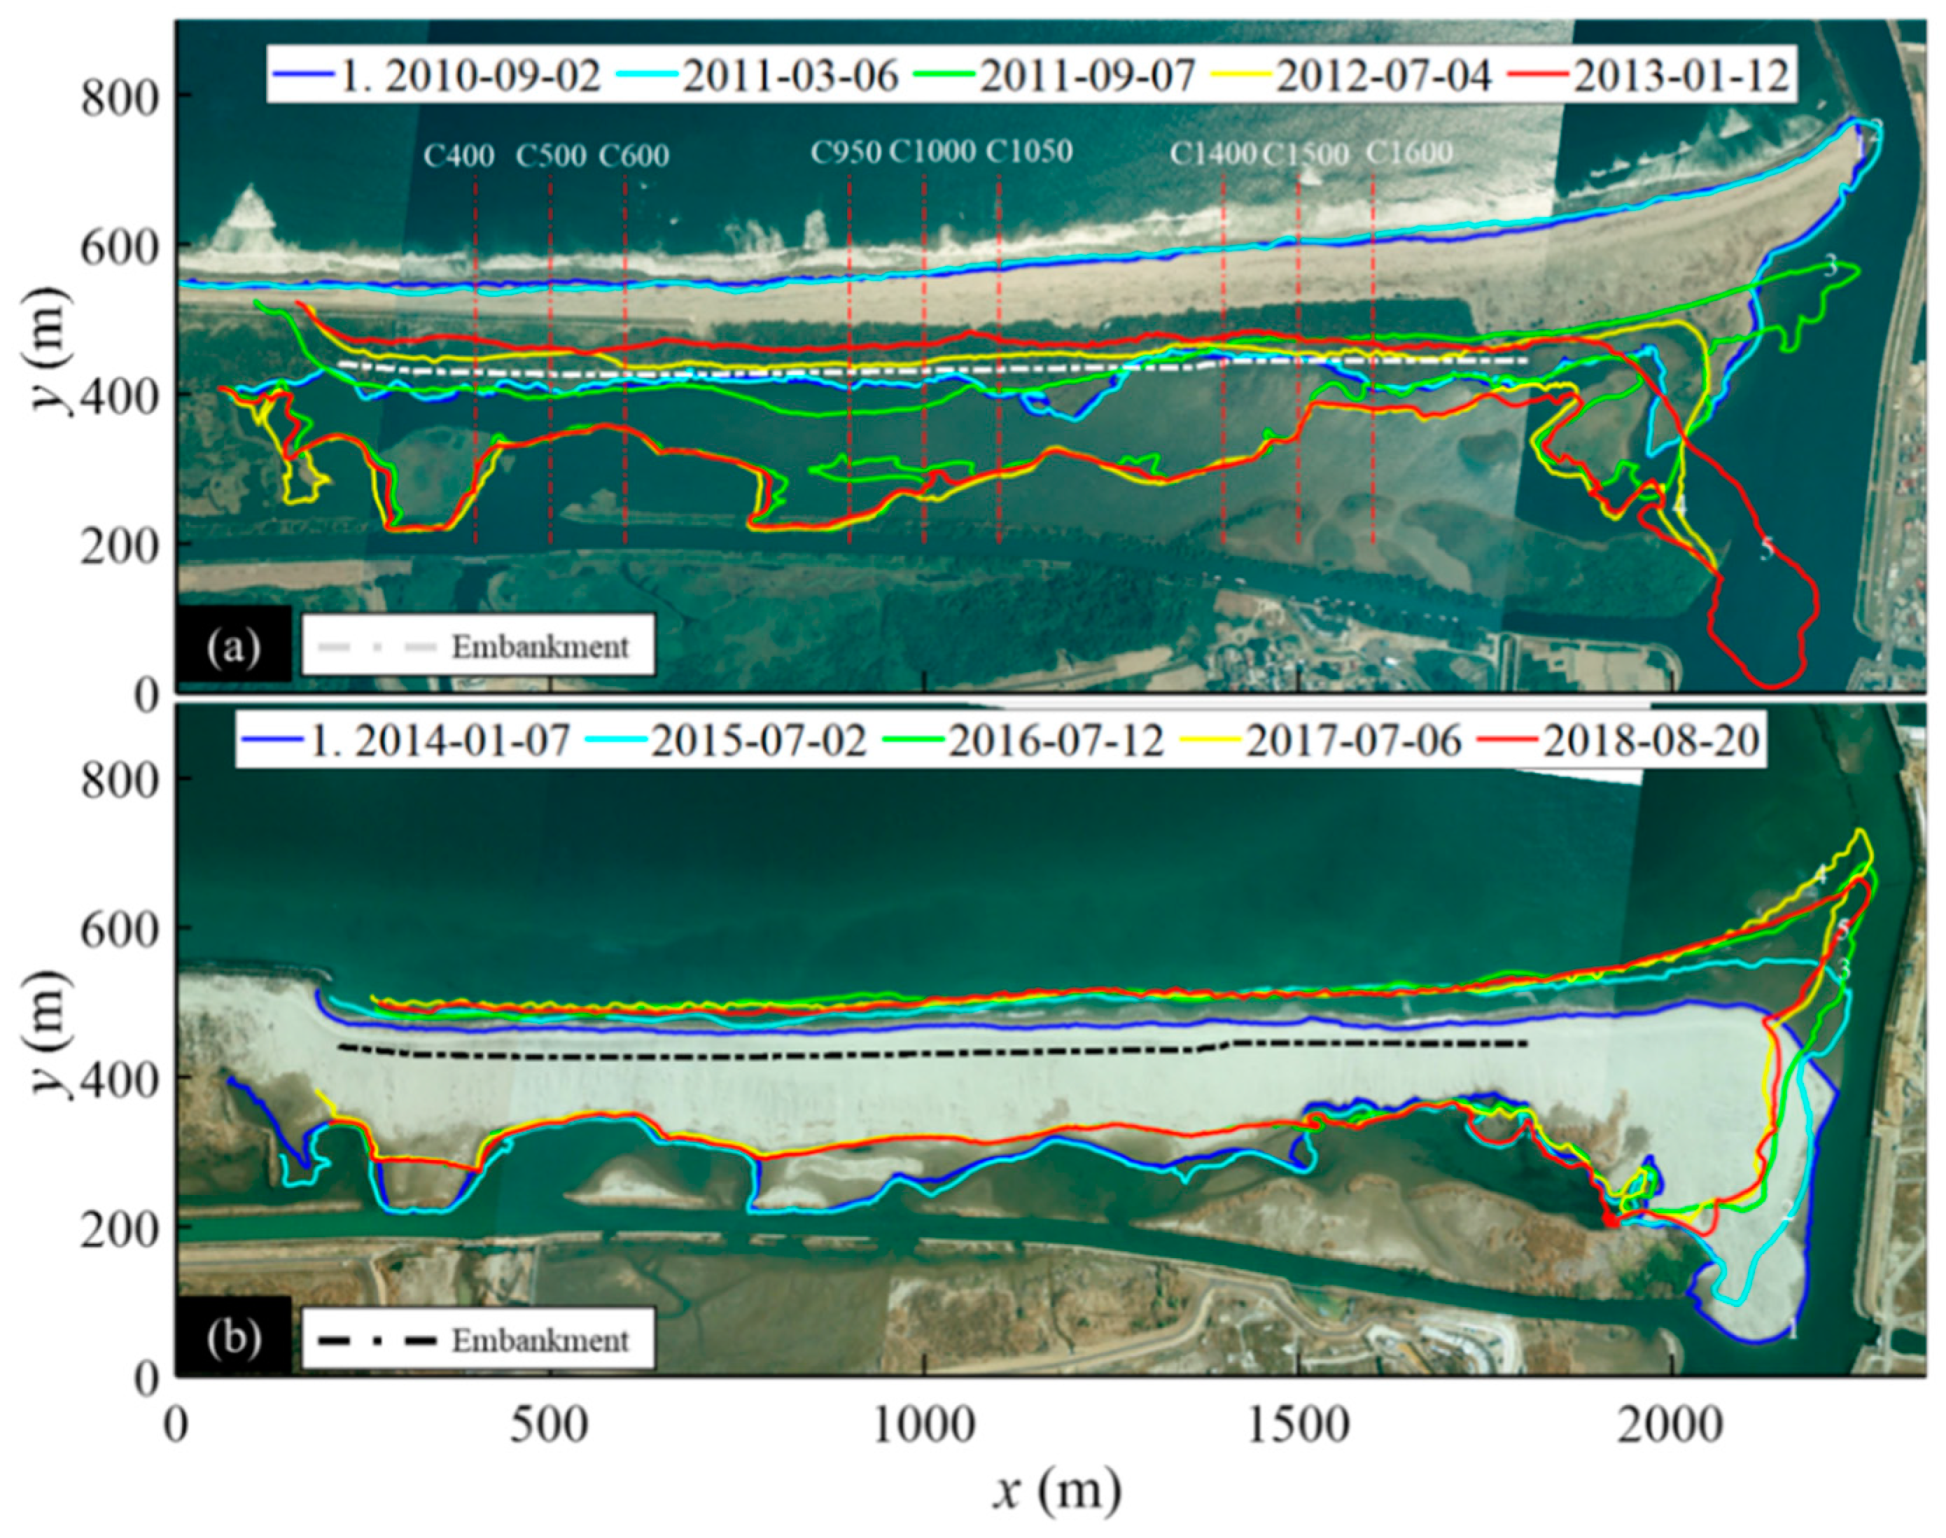
The overall morphology change in the Natori River mouth is shown in Figure 8. As seen in Figure 8a, before the tsunami took place, the Natori River mouth was in a fairly stable morphology. The entire area was changed remarkably when the tsunami arrived and destroyed the sand spit and the sandbar. The black sand, including plenty of iron minerals (magnetite grains), was retained, while finer grains were washed away. The entire mouth area was inundated even 2 days after the tsunami (Figure 8b). The remaining area after the tsunami was pushed further onshore and rapidly formed a new sandbar, as shown in Figure 8c. In early 2013, the configuration of the sand spit was altered as the sediment intruded into the river channel (Figure 8d). From 2013 to the beginning of 2015 the shape of the sandy beach was formed again and the recovery process started accelerating with the sand spit almost reaching the jetty as it had done previously (Figure 8d–g). During this time, a new construction of embankment along the sandy beach was initiated and completed in 2018. It was constructed with the purpose of protecting the coastal and inland regions against future disasters of similar intensity levels. Additionally, the natural recovery was not sufficient to restore the pre-tsunami morphology and the gap between the sand spit and the jetty had remained. In order to support the recovery of the sand spit, in July 2016, the government conducted an artificial work in which the sand in the channel from the sand spit was taken to fill the gap between the spit and the jetty. The observation after 2 years shows that the work was successful and the configuration of the entire river mouth area has returned (Figure 8h,i). The change of the extracted shoreline positions is observed in Figure 9. The morphological change can be separated into two phases: (1) Early stage of the recovery until the intrusion of the sand spit (Figure 9a); (2) After the intrusion of the sand spit until the completion of the newly constructed embankment (Figure 9b).
3.1.1. Sandy Beach
As seen in Figure 9, the shorelines of the sandy beach were pushed onshore after the tsunami. Three different zones along the coast, defined in Figure 9a, were selected to show the temporal variation of the shoreline positions (Figure 10). Shoreline change near the concrete block is indicated by C400, C500, C600 in Figure 10a, while the shoreline changes at the middle area of the sandy beach and near the sand spit’s area are shown in Figure 10b (C900, C1000, C1100) and Figure 10c (C1400, C1500, C1600), respectively.
From the arrival of the tsunami to 2014, the subsequent recovery of the shoreline can be seen in all positions. Since 2014, the evolution of the sandy beach has weakened, as seen by the insignificant scattered fluctuation of the temporal changes of the shorelines. The shorelines have remained nearly stable, keeping a distance of about 30–50 m from the new embankment.
3.1.2. Sand Spit
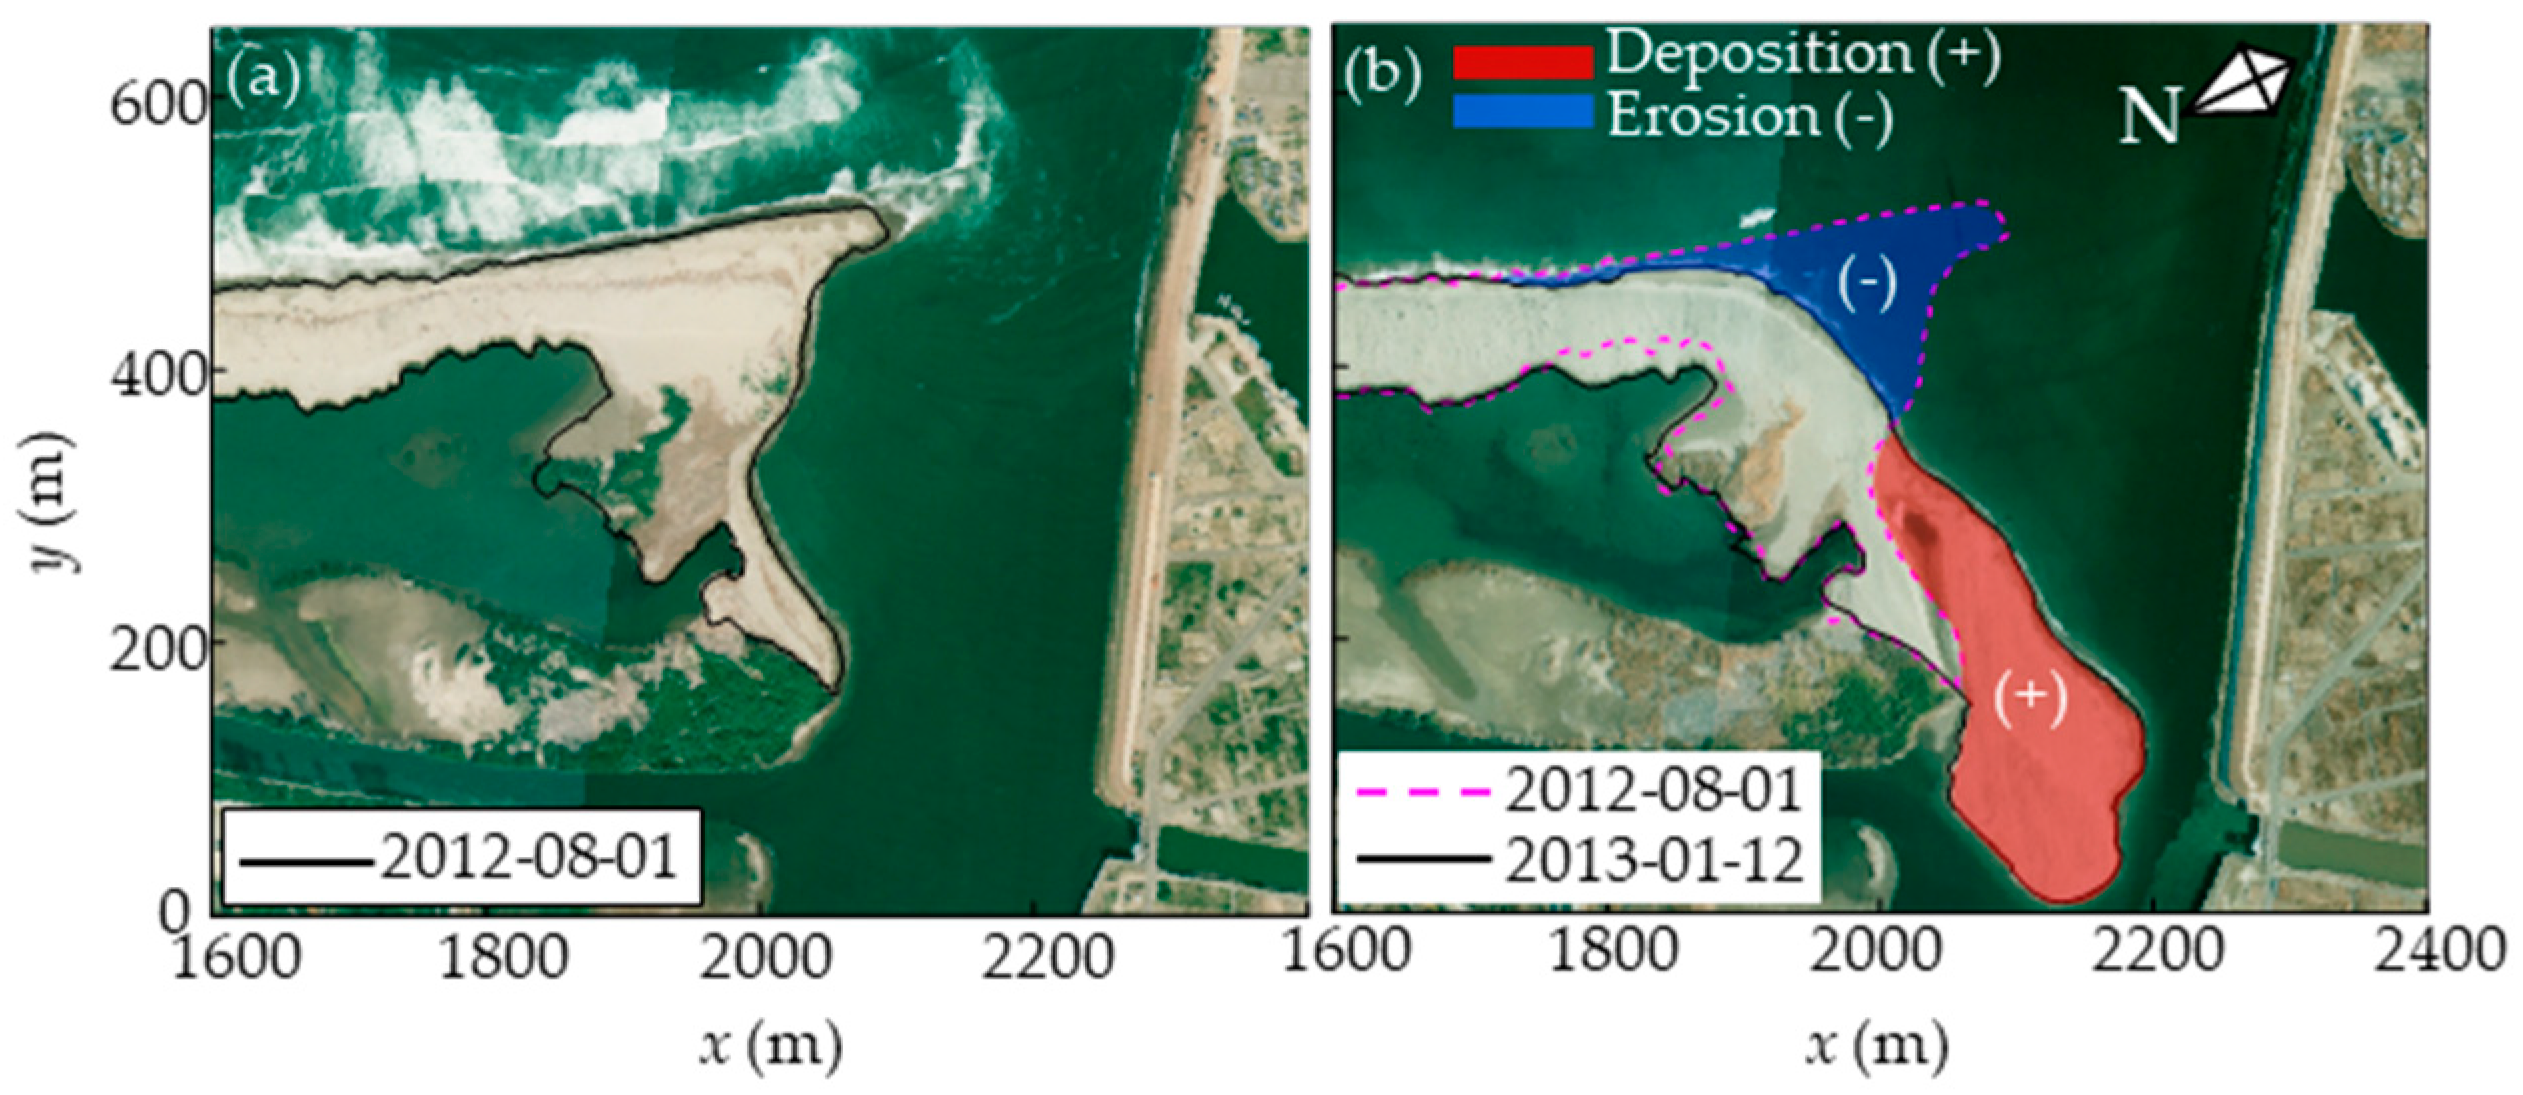
Figure 11a shows the areal evolution of the sand spit. It took roughly two years for the sand spit’s area to recover to its pre-tsunami value. However, the spit continued to develop and was about 1.5 times bigger than it had been previously. After 2014, the increasing rate of the sand spit diminished and the fluctuating behavior was observed. When the area of the sand spit and the sandy beach are compared, it is seen that they both recovered quickly in the early stages of the recovery process from the arrival of the tsunami to 2014. Combining the under-developed sandy beach’s area and the over-developed sand spit (Figure 11b), the total areal recovery in the mouth area remains lower than before the tsunami and the difference corresponds to the loss of sediment in the littoral system (Figure 11c).The over-deposition in the sand spit was due to the sediment intrusion from the offshore region and the adjacent sandy beach into the river channel (Figure 12) under east-direction waves (Figure 11f).
However, the sand spit was not able to elongate transversely and took longer to reach to jetty (Figure 8g). The small contribution of fluvial sediment from the sediment can be perceived. Despite the flushing of the sediment in the sand spit’s zone, the deposition onto the sand spit after the historic flood in 2015 (Figure 11e) was insignificant and the accumulation was attributed to the return of the eroded sediment after flushing under wave action.
In the Natori River mouth, the width of the river mouth is important as it is a parameter to assess the amount of water going in and out of the river mouth. Furthermore, it is related to the salinity control and eco-system upstream of the river. Ito et al. [30] claimed that due to the widened opening, the area near the mouth became more saline resulting in a drop of the basket clams’ stock. Therefore, the nourishment of the sand spit was urgent for the purpose of either flood control or the restoration of the estuarine environment. After the completion of the nourishment in 2016, the sand spit has become stable, and the width of the mouth is controlled in between the jetties (Figure 11d).
3.2. Topography Recovery
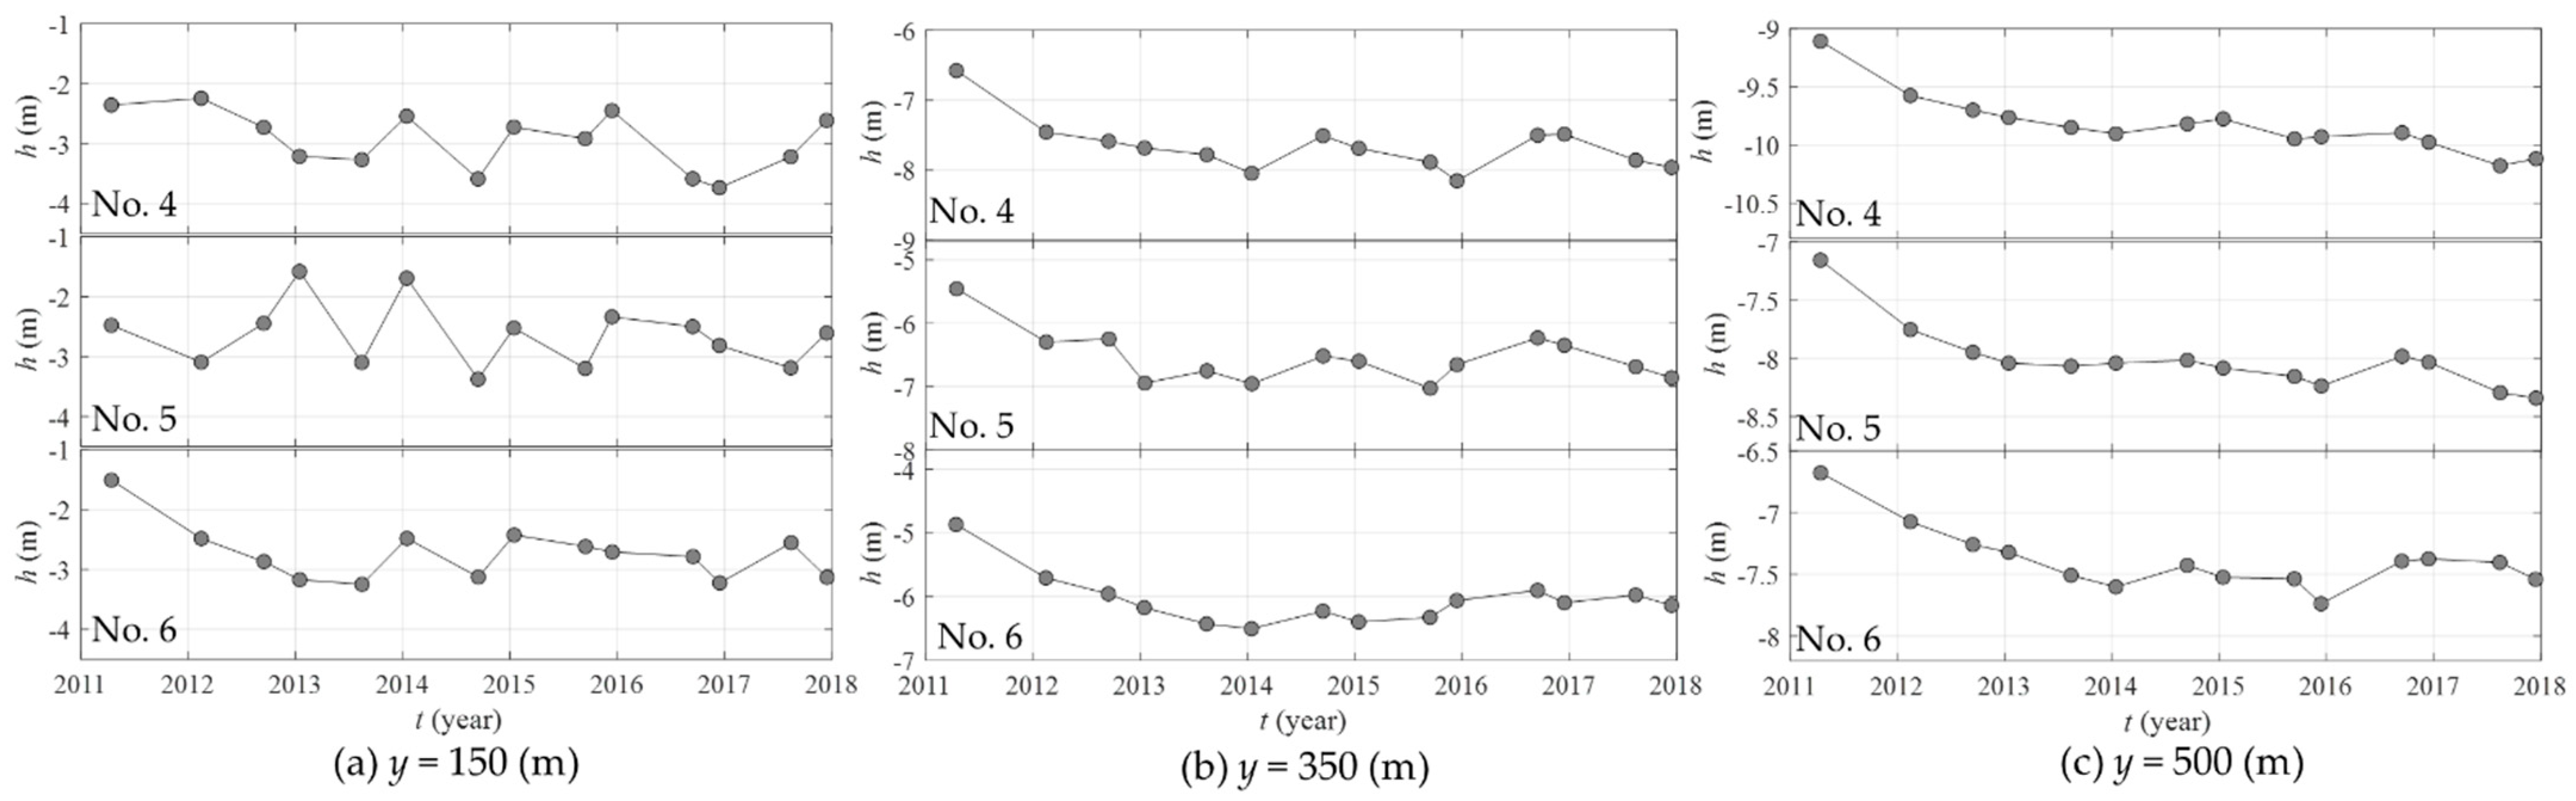
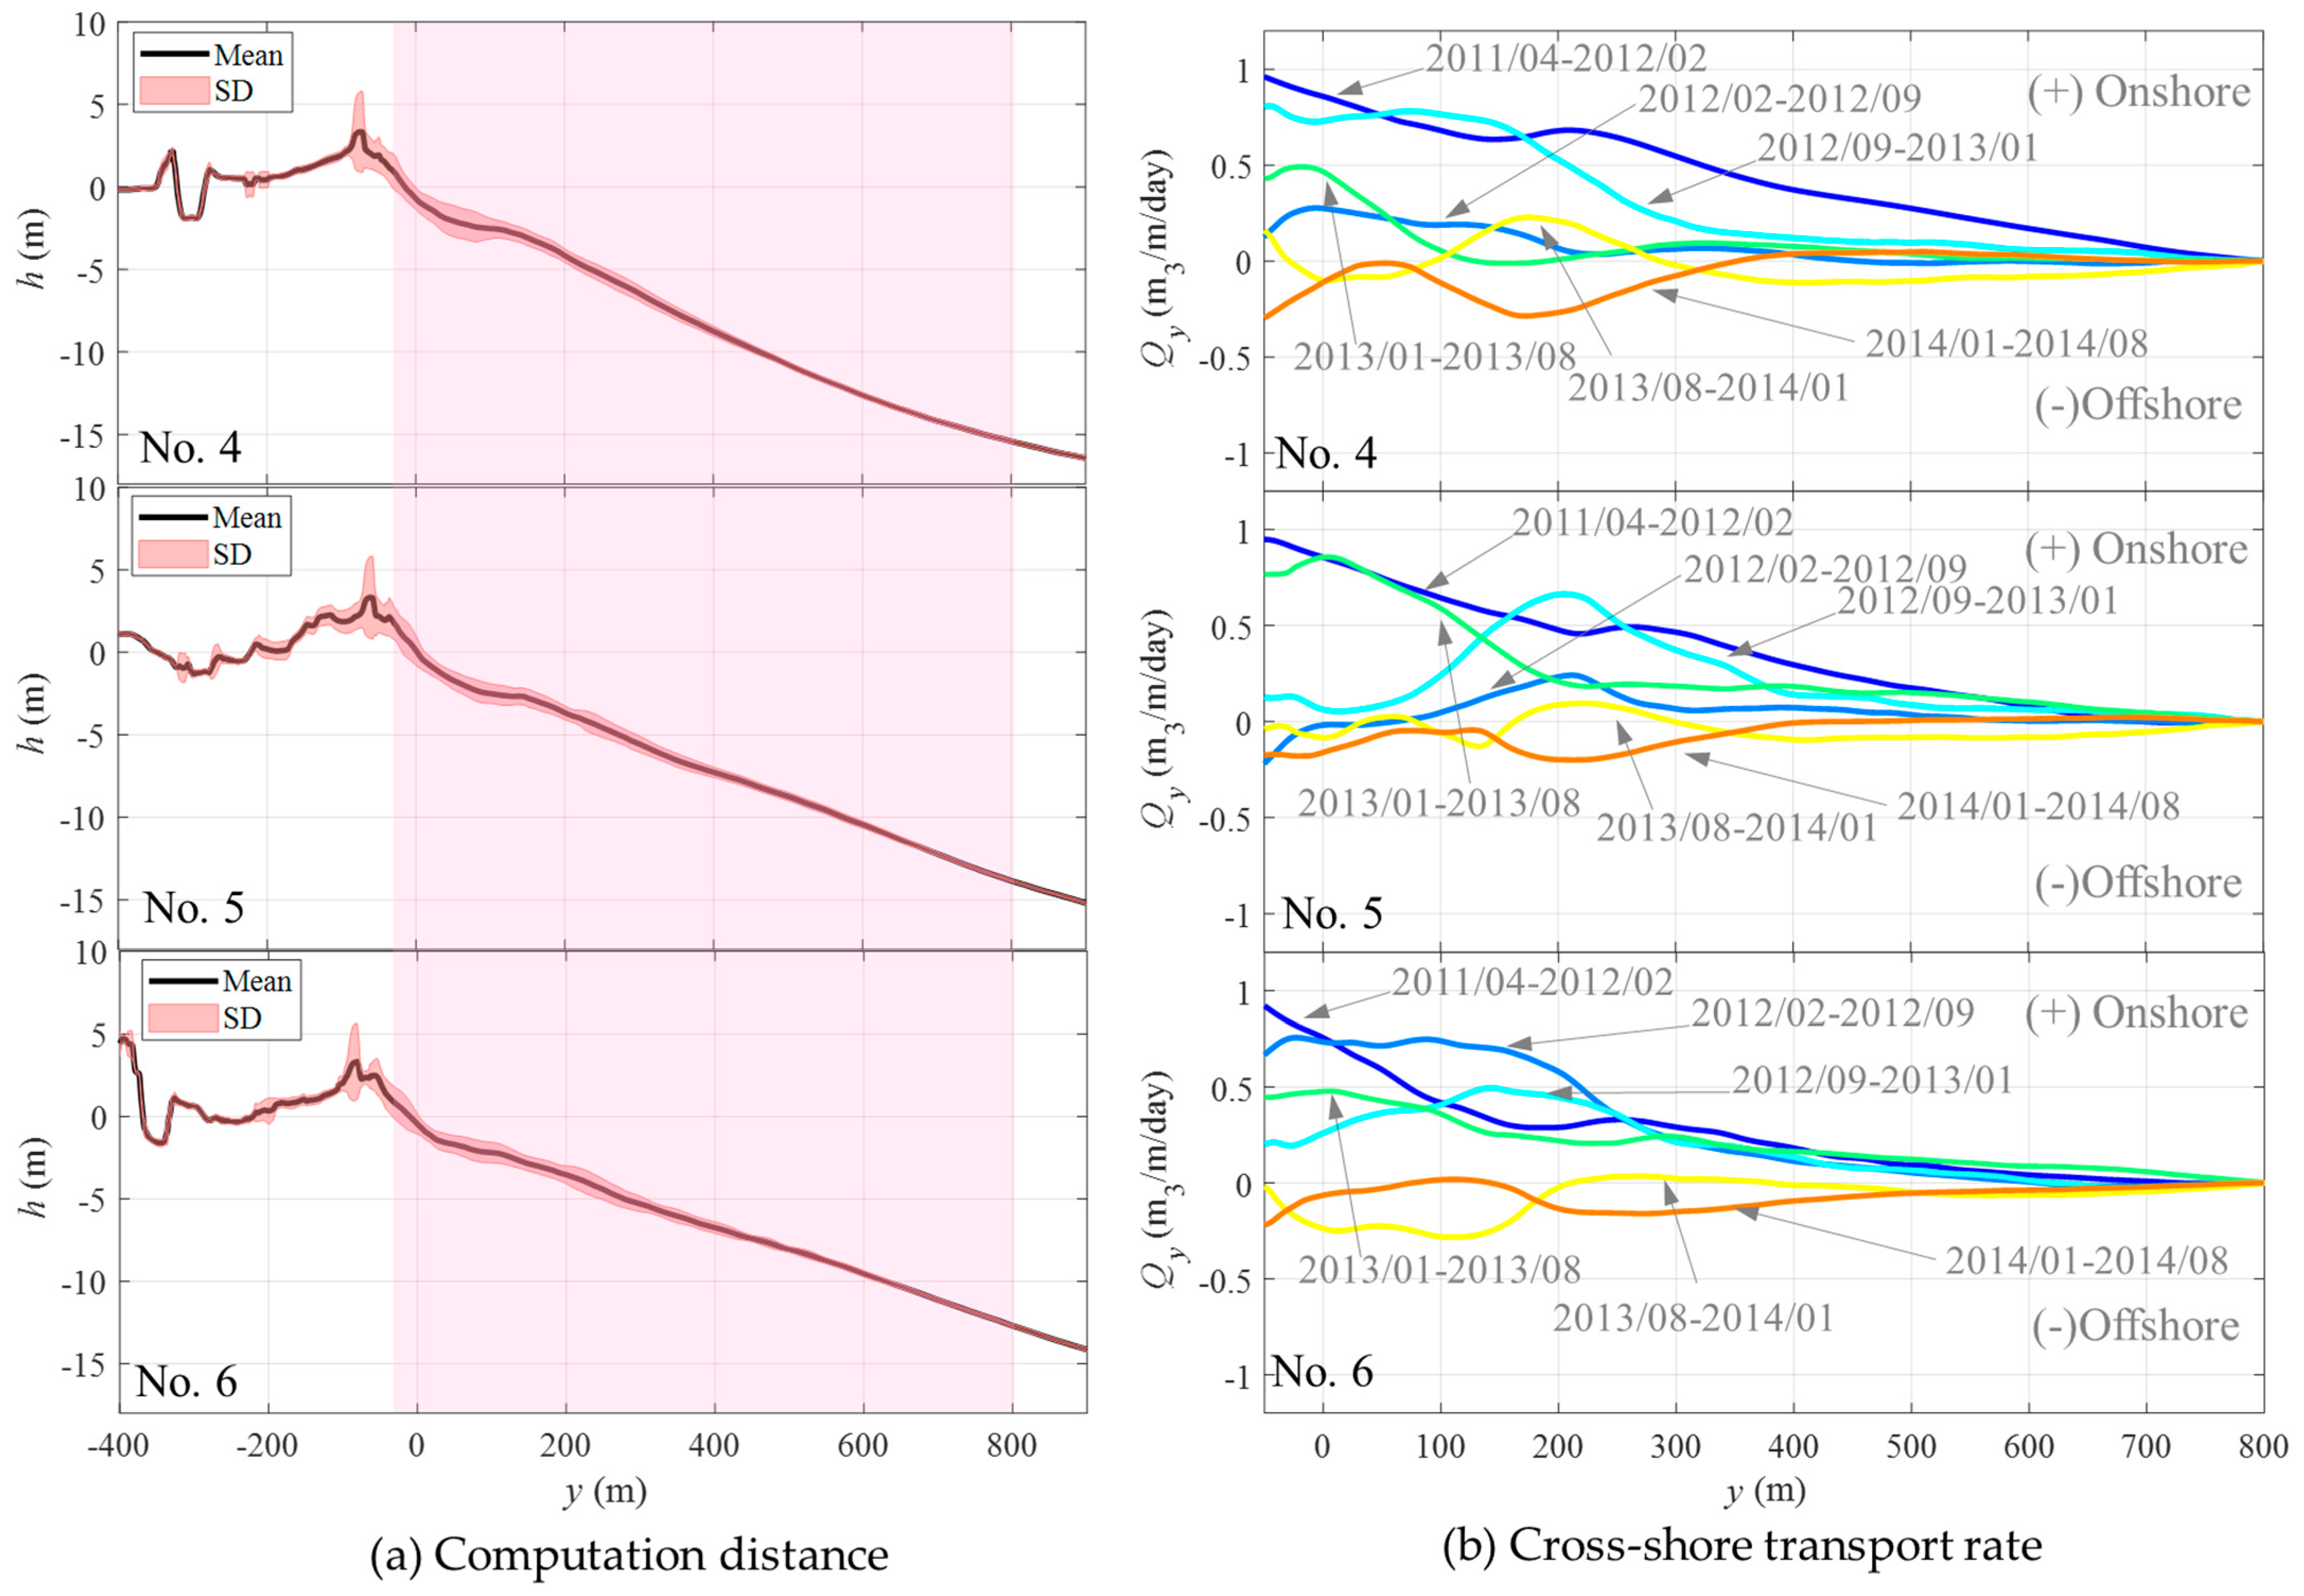
Generally, the stability of a sandy coast can be assessed by the equilibrium beach profile during a long period of observation [39,40,41,42]. However, the exact movement of bar and berm induced by the cross-shore process during the recovery process was difficult to determine due to the complex movement of sediment or the disturbance caused by tsunami. This requires a much longer period of observation in order to actually achieve an equilibrium beach profile and discuss the cross-shore oscillations with the corresponding local wave energy. On the other hand, in contrast to the inner surf zone of the upper shoreface where the long-term tendency cannot be easily extracted from the short-term invariants [43,44,45], the shoal zone shallower than DoC, where wave shoaling dominates with less cross-shore exchange due to non-bar migration and small acceleration skewness, can be considered to investigate the recovery of topography. The depth variations at several positions along the profiles were shown in Figure 13. At y = 150 m, the submerged bar movement resulted in the complex fluctuation of the profiles. However, from y = 350 m, the linear decay from 2011 to 2014 and the random fluctuation from 2014 to 2018 are two notable trends. Similar to the cross-shore sediment transport which results in the onshore sediment movement in the early stage after a flood event [46,47], the transport after the tsunami is induced by skewed and shallow asymmetric waves to produce the onshore and offshore transports. Normally, the offshore sediment transport is low to negligible, and the sediment is transported dominantly from the submarine to the intertidal. Since there is no availability of updrift sediment transport, the main source of sediment for the recovery was attributed to the net onshore transport induced by skewed waves.
Due to the dominance of cross-shore transport in the river mouth, the cross-shore sediment transport rate can be calculated by applying the sediment mass conversation equation and assuming the local longshore transport is insignificant as follows:
where Qy is the cross-shore sediment transport (m3/m/y), y is distance offshore (m), and h is elevation (m). ε is the porosity of sediment (=0.4). The calculation was performed for each profile from the berm location to an assumed position where the cross-shore sediment transport is negligible (Figure 14a). The positive values indicate the onshore sediment transport, and the negative values correspond to the offshore sediment transport. The selected period for the calculation is from 2011 to 2015. The results in Figure 14b show the dominance of onshore transport from 2011 to 2014, especially during the first two years. The oscillation of on- and offshore movements induced by seasonal changes can be observed clearly. The offshore movement during August 2013–January 2014 can be the response to the winter and storm conditions, while the onshore movement during January 2014–August 2014 can be a result of the milder summer wave conditions. The cross-shore transport rate can explain the influence of the onshore transport on the topographic recovery.
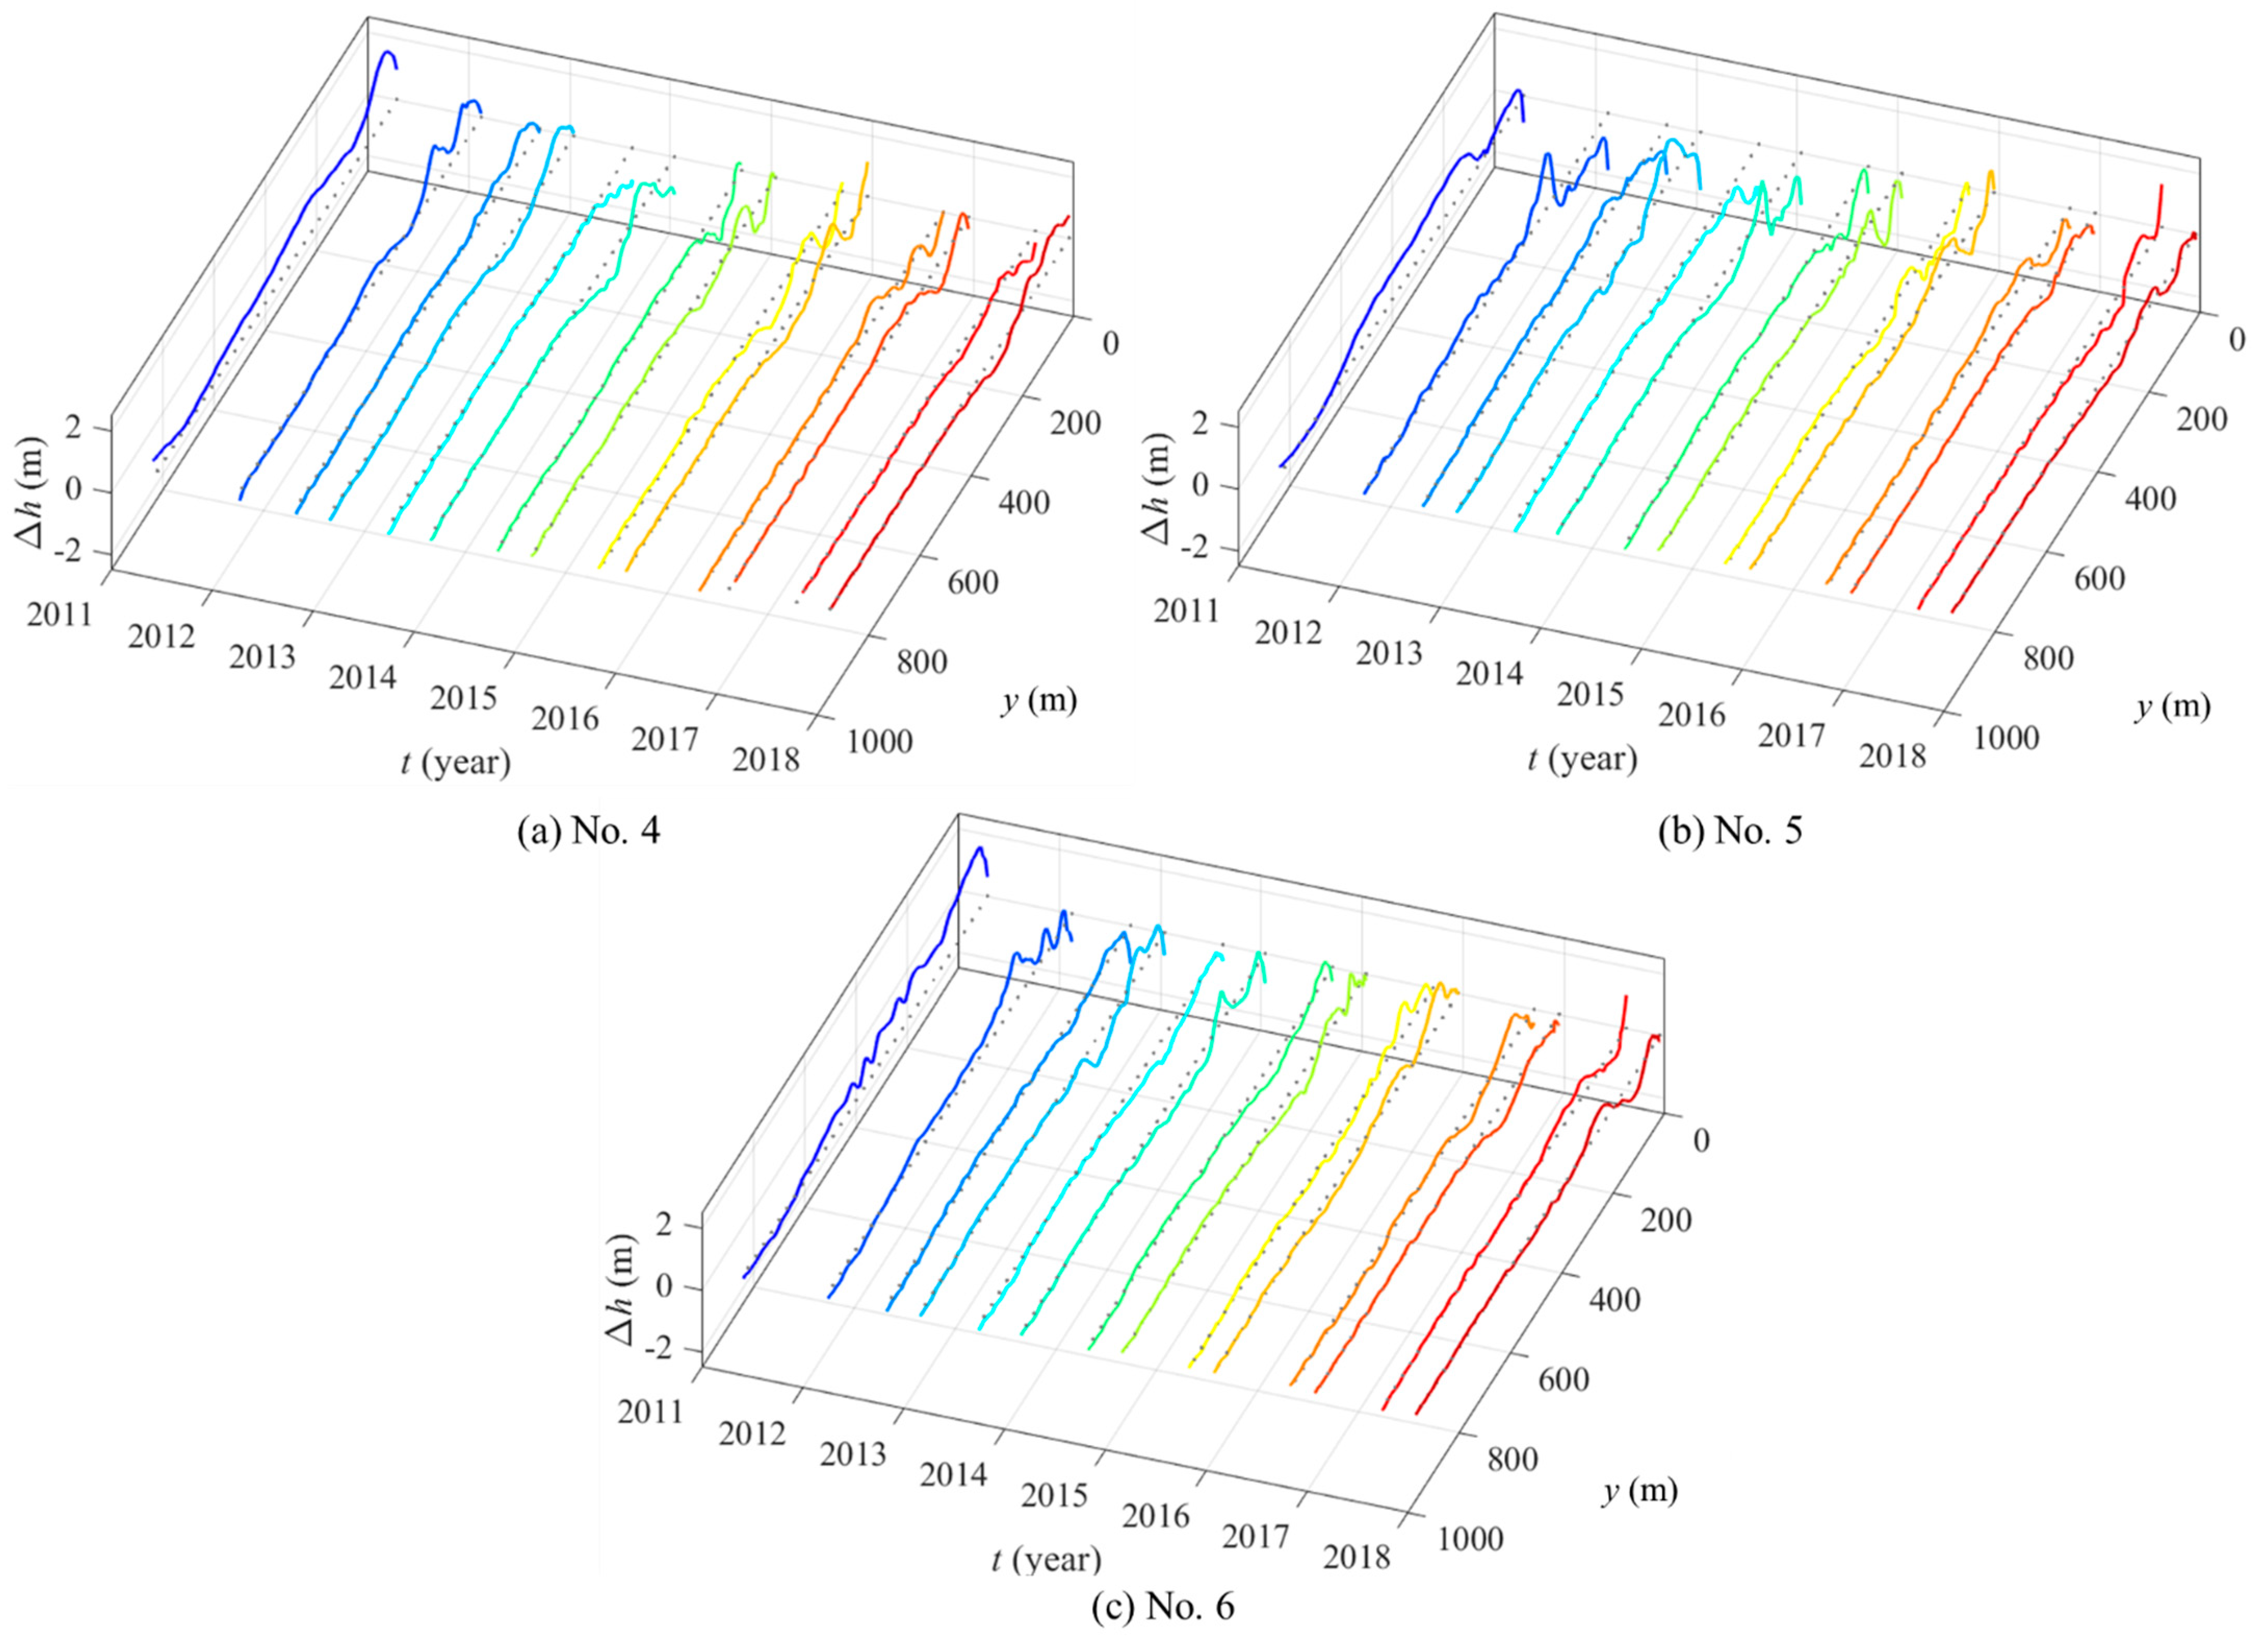
The dominance of onshore transport during the recovery process can also be explained in terms of statistics by applying the EOF analysis. In order to extract the dominant trend of the recovery process, the random noise on the profiles should be removed to the fullest extent. Assuming the equilibrium profile had returned in the last two years (2016–2017), the cross-shore invariants can be minimized by subtracting all profiles from the mean profile of the last four datasets (September 2016–December 2017).
where Δh is the elevation change (m) and is the average of the last 4 profiles (m). The profile changes obtained from Equation (2) is shown in Figure 15.
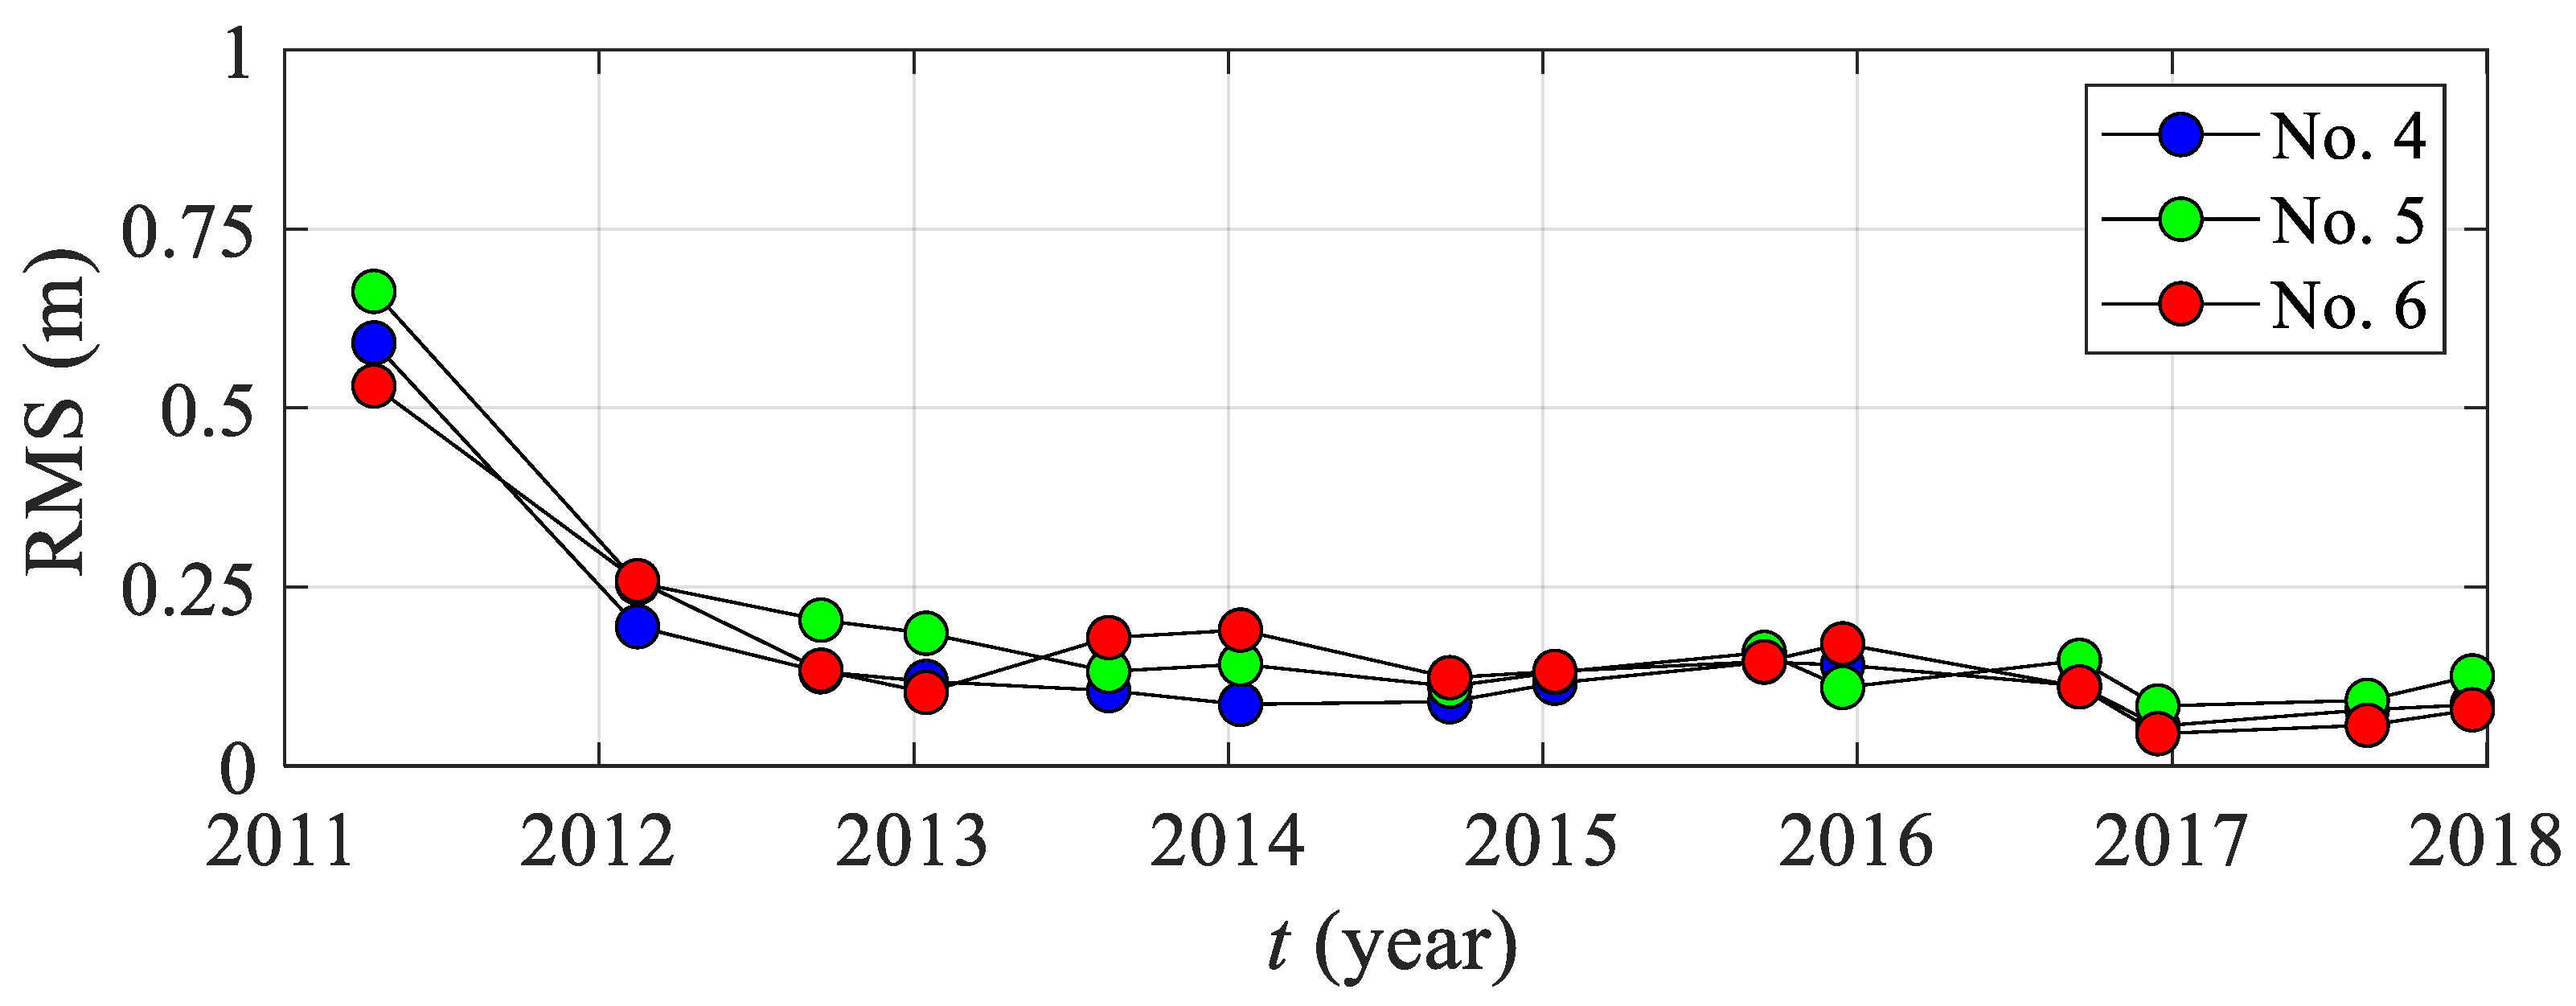
The variation from the depth y = 350 m is very small and almost negligible during the latter half of the observation data. Hence, the root mean square (RMS) values based on Equation (3) demonstrates that the depth change was only significant after the tsunami and gradually reduced to zero from 2014 (Figure 16). The RMS values after 2014 were negligible, since they are smaller than the profile measuring accuracy.
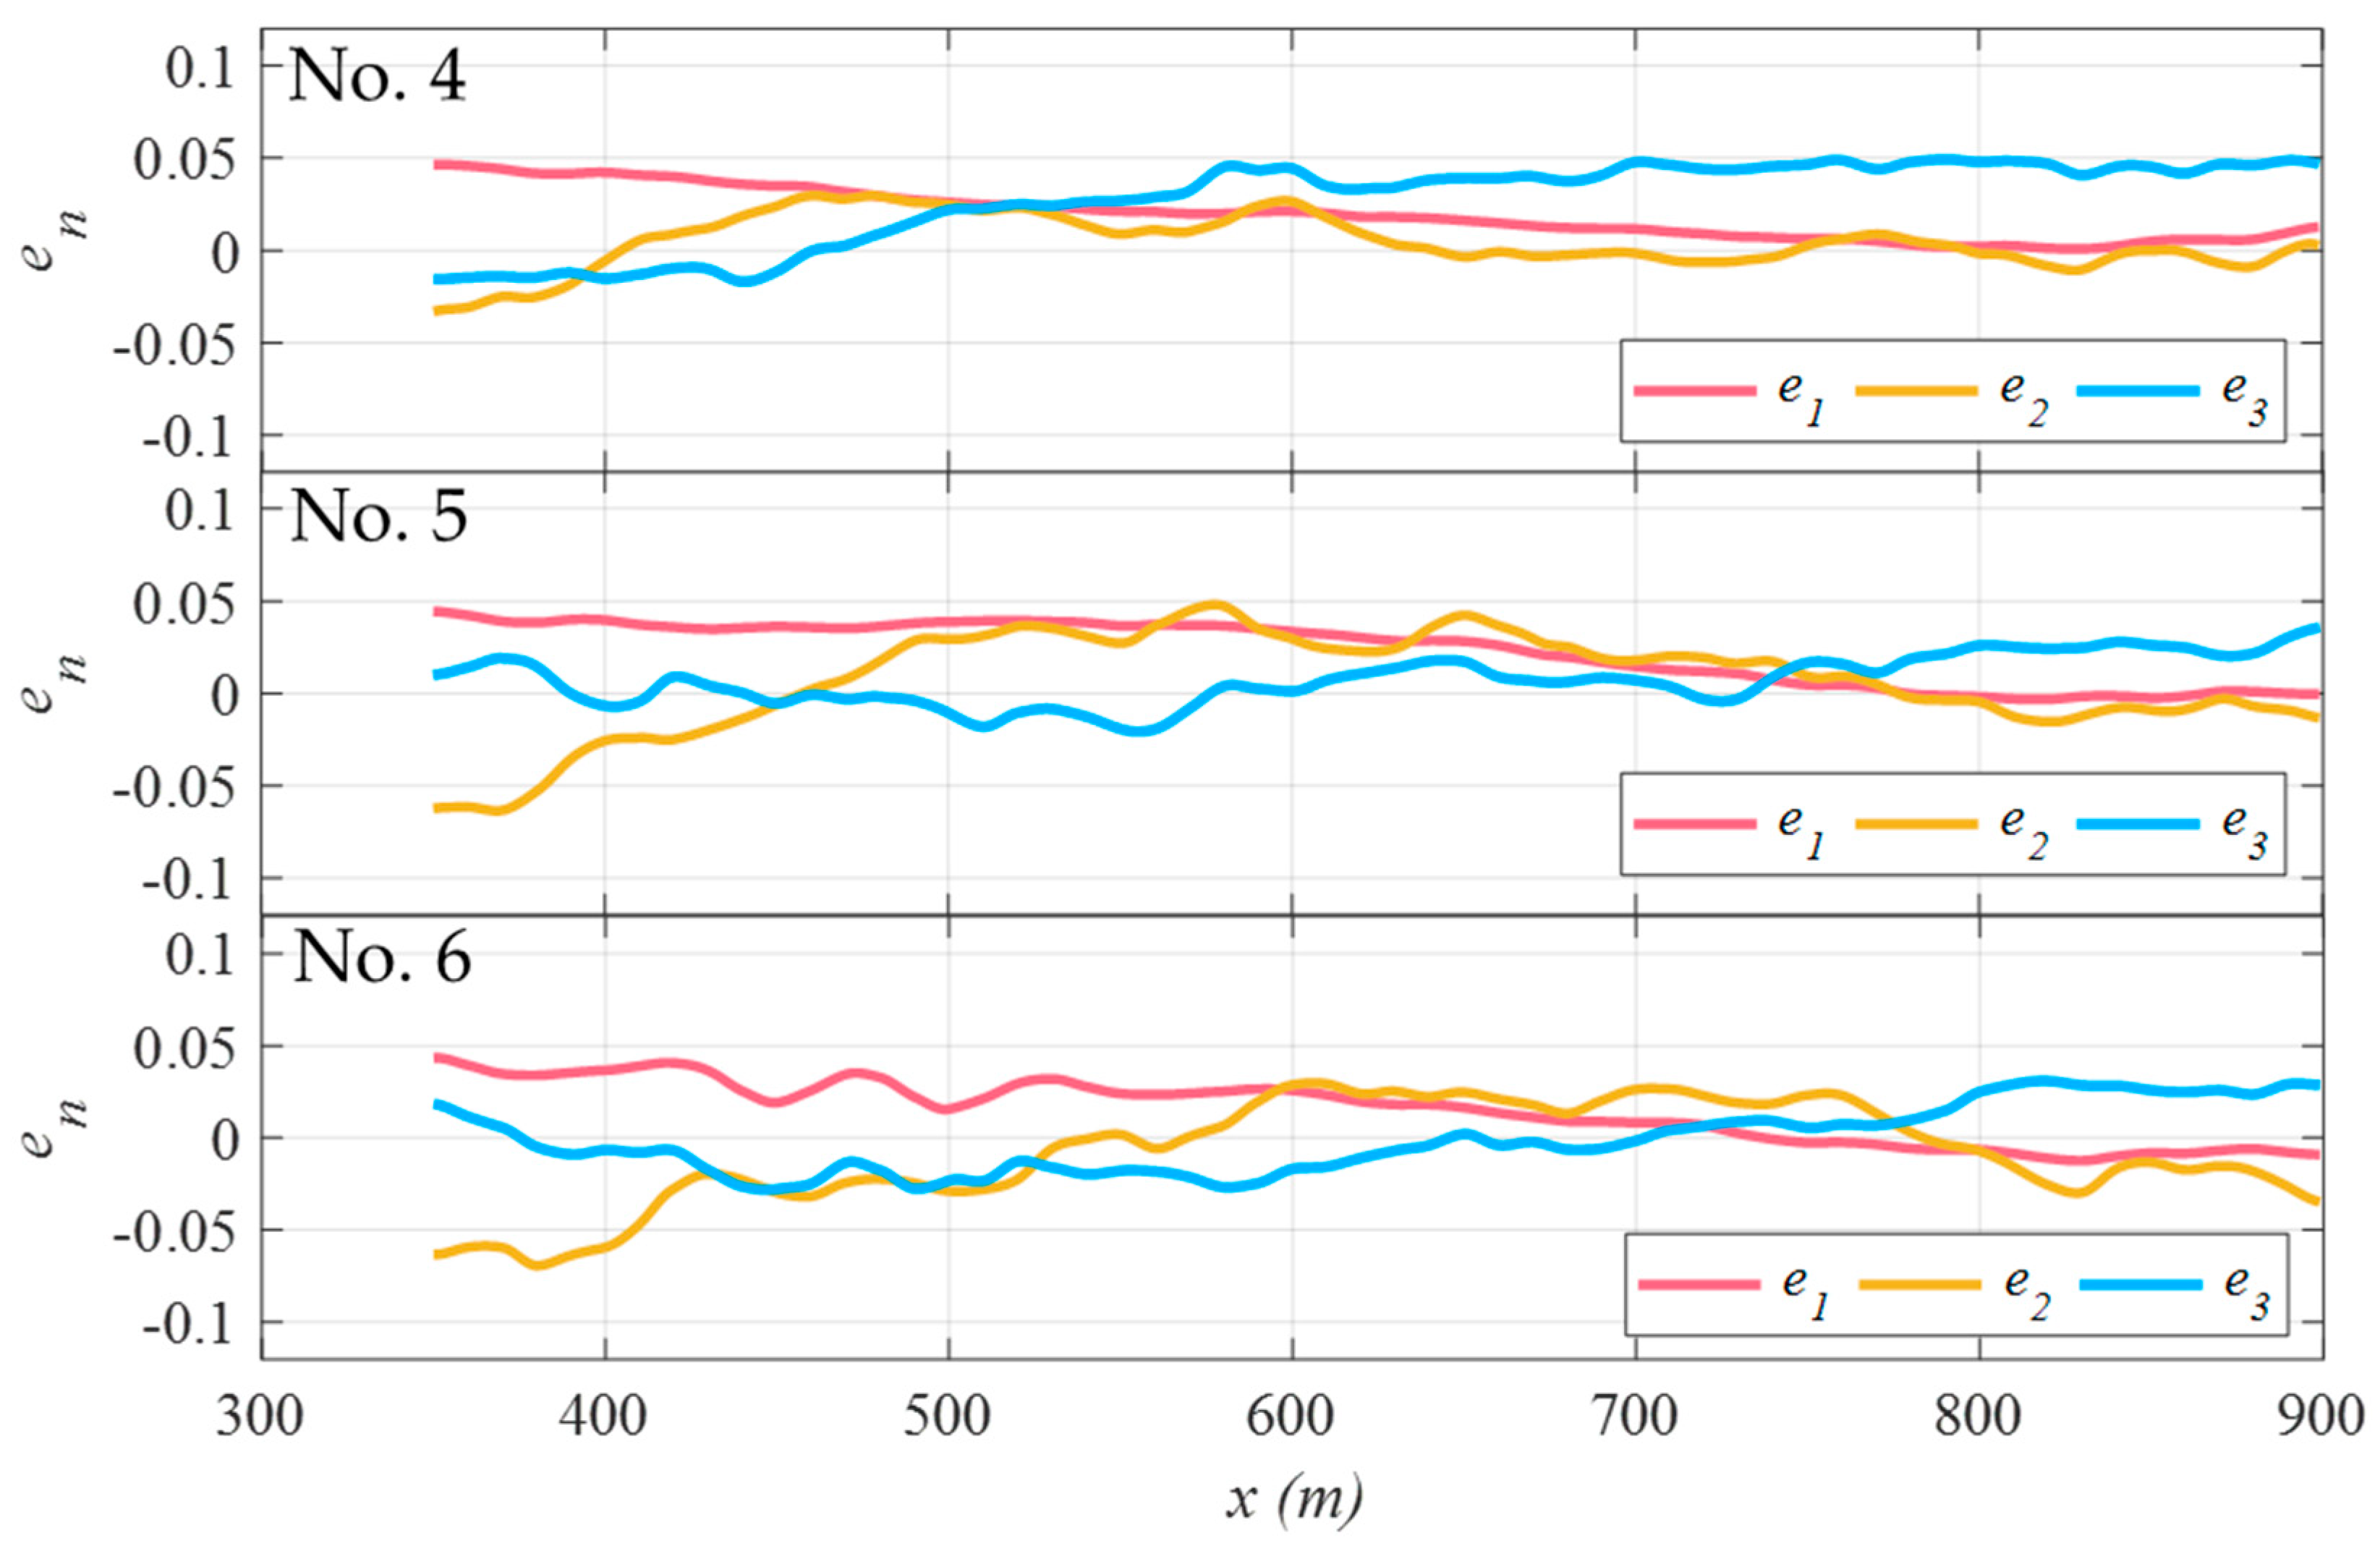
The profile change, Δh (y ≥ 350 m) is then represented by the product of temporal, ct(t) and spatial, en(y) eigenfunctions as follows:
where nth is the number of components and N is the number of utilized profile data. All profiles were used together so they can share the same temporal functions. The first three modes of the spatial functions represent 73.9%, 13.8% and 4.9%, respectively, of the overall elevation variability (Figure 17). The first mode can describe exactly the trend as seen in Figure 15 which the depth changes gradually decrease to zero. The other two modes account for less than 30% and do not contribute to the recovery process. These modes only describe the insignificant profile fluctuations. More importantly, the first temporal mode demonstrates the convergence of topography during the recovery process induced by the dominance of onshore transport from 2011 to 2014 (Figure 18). Similar to the spatial functions, the other modes represented by the temporal eigenfunctions cannot detect any notable variations in the profile change data.
4. Discussion
4.1. Morphology Recovery and the Effect of Intrusion Process
The current morphology of the Natori River mouth is the result of the dominance of the net onshore movement and sediment intrusion into the channel. In natural straight beaches, cross-shore transport processes in surf-zone are more complex due to three-dimensional topography and hydrodynamics including three-dimensional asymmetric oscillatory flows, turbulence introduced by wave breaking and dissipation, undertow patterns, etc. [48,49,50]. In contrast, longshore transport normally becomes a more dominant process along the shoreline owing to the oblique wave breaking angles [51,52,53]. The obstruction of alongshore transport from updrift in Yurigae Port makes the mouth area receive fewer oblique waves from the south and southeast directions and more exposure to directly orthogonal waves [27]. Therefore, the onshore transport was able to dominate the early post-tsunami morphodynamics and the subaerial berm was quickly re-formed. This is somewhat analogous to the post-flood event morphology in many river mouths in the world [46].
The phenomenon of sediment intrusion or spit intrusion into the channel is a special event following the tsunami. In general, elongation of a sand spit is typically discussed in river mouths and tidal inlets [54,55,56]. In river mouths, where the breach of a sand spit often occurs, the sediment may continuously transport from the intertidal to the sub-aerial zone to quickly fill the breach and create the berm of the spit by overwash [46,47]. On the other hand, the intrusion process is broadly discussed in the formation of free spit [57,58] and river mouths experiencing a sudden depth change [59]. In the Natori River, due to the disappearance of the sand spit and deepened river channel after the tsunami, the distance of wave propagation was longer. High waves can transport the sediment from the sandy beach into the channel to accumulate excessively onto the sand spit’s area (Figure 11f), while smaller waves or tidal waves can reduce their energy in the shallow area but continue to propagate further upstream. After the intrusion, the sand spit continued to receive the sediment from the sandy beach under the east-direction waves and the tip of the spit could reach closer to the jetty (Figure 8e,f).
The net onshore transport and sediment intrusion during post-morphology change events can be observed widely in other river mouths after the tsunami. In general, the main source of intruded sediment is the sediment deposition in front of the river mouth and transported from the submarine to the intertidal zone under the onshore sediment transport. However, the response of morphology under the sediment intrusion effect is different depending on the morphological conditions. In natural river mouths, the onshore transport and intrusion process was predominant in the very early stages of the recovery until the alongshore drift re-dominated and elongated the sand spits rapidly at a high migration rate [8,15]. However, in mouths confined by infrastructure (jetties and channel embankments), the main supply is attributed to the available submarine sediment. For example, in a big river mouth such as the Abukuma River mouth, also located in the Sendai Plain, due to the significant submarine sediment deposition created by the post-tsunami floods, the intrusion rate in the channel is very big, reaching 10 × 104 (m3/y) and the intrusion distance of sediment is up to 1 km from the mouth entrance [21]. While, in the Naruse River in Ishinomaki Bay, since it is a small river with almost the same catchment area and sediment discharge amount as the Natori River, the accumulation in the river is rather small at about 1.8 × 10⁴ (m3/y) [20]. However, the impact of wave intrusion was significant since the intruded waves could even severely erode the bank of the river channel.
The interesting finding in the Natori River mouth is that the adjacent sandy beach is also regarded as a source for sediment intrusion into the channel which is different from all other river mouths in the Miyagi Prefecture (Figure 12). This process is considered as the re-distribution of sediment volume inside the local littoral system but did not result from the alongshore movement from updrift.
4.2. Convergence of the Topography after the Tsunami
The recovery of the profile along the shoreface after the tsunami in the Natori River mouth is similar to the overfit disequilibrium of the shallow lower shoreface conceptualized by Anthony and Aagaard [45], where the overfit can be triggered by sea-level fall through the process of forced regression [60] or the tectonic uplift of the strand plain [61] where the depth of the shoreface get shallower. In the river mouths, a significant deposition, induced by extreme flood and transported via the surf-zone and DoC to the lower shoreface, can create the same overfit disequilibrium. This disequilibrium results in onshore-directed upper shoreface sediment domination due to positive wave skewness and upwelling currents [62] resulting in shoreline accretion. The shallow concave shoreface in the Natori River mouth after the tsunami (Figure 6) behaved similarly until a steepening lower shoreface was obtained from a lower concave shape by the decrease of wave skewness. Eventually an equilibrium was approached (convergence process) where onshore and offshore transport can be balanced. This explains the gradual decrease of the first temporal mode in the EOF analysis. After the convergence, the significant change on the shoreline change was weakened, as seen in Figure 10, and the first mode contribution of the spatial functions is comparable to the recovery behavior in the northern coast demonstrated by the first mode of 60% obtained in the EOF analysis of shoreline change from 2011 to 2013 in Hoang et al. [19]. This demonstrates that the mouth area has overcome the significant topography change after the 2011 tsunami.
Even though the timescale of the convergence in the deeper area is rather fast (about 3 years after the tsunami), the equilibrium profile along the entire shoreface may require a much longer time. In general, the timescale of reaching a new equilibrium depends on the responses of the profile to hydrodynamic forcing and grain size conditions. Some past studies expect the adaptation timescale to range from centuries and millennia [63,64,65]. In the Natori River mouth, high waves within the microtidal range can transport finer grain sediment and rework the deeper profile rapidly. However, in the surf-zone, the offshore sandbar migration is induced by the intense waves breaking on the bar crest during storms, driving a strong undertow that carries sediment seaward. The onshore transport of sediment due to velocity-skewed incoming waves during low to moderate conditions makes it much more complicated to predict an equilibrium profile along the upper shoreface or the detailed bar–berm exchange behavior. This is expected to be investigated further in future studies by collecting more datasets.
4.3. Future Management Implication
As mentioned previously, the entire mouth area including the sand spit and sandy beach are now confined between the wave-dissipating concrete block and the jetty. The longshore and cross-shore sediment movements are constrained within the distance between two structures similar to the embayed beach or straight coast bounded by the constructions on both ends. The shoreline advance and retreat are the result of local alongshore sediment transport exchange between the two ends [66,67]. The cross-shore sediment movement is reliant on the submerged bar dissipation of storm waves and the sufficiency of wave energy to transport large amounts of sediment back onto the subaerial beach [68,69,70]. The disrupted longshore drift from the Natori River mouth to the further northern coast can be rehabilitated until the shoreline reaches the concrete blocks. Without additional flux of sediment from the river, the river mouth would preserve a quasi-equilibrium of sediment volume [27]. According to Hoang et al. [19], the behaviors of cross-shore and longshore transports resulted in the shoreline change in the entire northern Sendai Coast that can be observed again from 2013 to 2017. The main sediment transport movements during the recovery process and after the nourishment of the sand spit can be summarized in Figure 19. The arrows in the diagram denote relatively the sediment movement and its magnitude.
Given that the annual sediment discharge from the Natori River is 10,000 m3/y [22], and DoC is 8 m with the assumed berm height of 2.5 m [26], the area change rate in the whole mouth area can be roughly estimated to be 952 m2/y. This value is very small compared to the sediment loss from the littoral region after the tsunami, which indicates that it may take longer for this mouth area to reach the areal value prior to the tsunami and restore the continuous alongshore drift in the northern coast. Within the context of this the study and the recent countermeasures proposed by the national government against future tsunamis, long-term coastal and riverine adaptation planning for the Natori River is expected to be approached by the government authorities in the near future in order to make this area a more resilient coastal region against future disasters and climate change issues [71,72]. Furthermore, with regard to the concerns of the resilience of modern coastal regions against large-scale disasters after urbanizing [12,73], this study also emphasizes the importance of extensive interdisciplinary research into the future management in disaster-prone areas.
5. Conclusions
The morphology and topography recovery of the Natori River mouth after the 2011 Great East Japan Earthquake and Tsunami are investigated thoroughly by using aerial images, in-situ offshore beach profiles, and EOF analysis. The main findings are as follows:
- (1)
- The sandy beach and sand spit in the Natori River mouth were eroded severely after the 2011 Tsunami. The rapid recovery in these areas was observed during the early stage of the recovery process and the sediment intrusion into river channel occurred inside the river mouth.
- (2)
- The recovery rate of the sandy beach and sand spit was weakened after 2014. Afterwards, there was no significant sediment deposition in these areas until recent years. It suggests the river mouth has reached an equilibrium state in which the sediment volume can be preserved within the littoral system.
- (3)
- By the calculation of cross-shore transport rate and EOF analysis, the convergence process of topography, represented by the first spatial mode of the deeper bed elevation (y ≥ 350 m), was supported by the dominance of onshore sediment movement during the recovery, while the first temporal mode indicates that the convergence had completed until 2015 and the significant topography change after the tsunami was restrained.
- (4)
- After the nourishment of the sand spit in 2016, the river mouth, including the sandy beach and the sand spit, is now restricted between the wave-dissipating concrete block and the jetties. Without additional sediment flux from the river, the river mouth would preserve a quasi-equilibrium of sediment volume. The morphology of the river mouth is now maintained by the local longshore and cross-shore movements which are similar to the coastal processes in the embayed beach or straight beach with the constructions on both ends. In the future, the mouth area would require a longer period to compensate for the erosion induced by the tsunami due to the lack of updrift sediment transport and a small amount of annual sediment discharge.
Author Contributions
N.T.H. collected and analyzed the images and field measurement datasets; wrote the original draft preparation. H.T. led group discussions and checked the contents. N.X.T. made contributions in collecting the in-situ beach surveys. All authors have read and agreed to the published version of the manuscript.
Funding
This research was funded under the Tohoku University-Tsinghua University Collaborative Research Fund (2020 to 2021).
Institutional Review Board Statement
Not applicable.
Informed Consent Statement
Not applicable.
Data Availability Statement
Datasets utilized in this study are contained within the article. Further data requests should be addressed to the corresponding author or [email protected] (H.T.).
Acknowledgments
The authors would like to express their utmost appreciation for the financial support from the Tohoku University-Tsinghua University Collaborative Research Fund (2020 to 2021). The authors would also like to gratefully acknowledge all the support from the Ministry of Land, Infrastructure, and Transport (MLIT) for providing in-situ beach profile data and aerial photographs in the Natori River mouth.
Conflicts of Interest
The authors declare no conflict of interest.
References
- Mori, N.; Takahashi, T.; Yasuda, T.; Yanagisawa, H. Survey of 2011 Tohoku earthquake tsunami inundation and run-up. Geophys. Res. Lett. 2011, 38. [Google Scholar] [CrossRef]
- Tanaka, H.; Tinh, N.X.; Umeda, M.; Hirao, R.; Pradjiko, E.; Mano, A.; Udo, K. Coastal and estuarine morphology changes induced by the 2011 Great East Japan earthquake tsunami. Coast. Eng. J. 2012, 54, 1250010-1–1250010-25. [Google Scholar] [CrossRef]
- Suppasri, A.; Koshimura, S.; Imai, K.; Mas, E.; Gokon, H.; Muhari, A.; Imamura, F. Damage characteristic and field survey of the 2011 Great East Japan Tsunami in Miyagi Prefecture. Coast. Eng. J. 2012, 54, 1250005-1–1250005-30. [Google Scholar] [CrossRef]
- Tappin, D.R.; Evans, H.M.; Jordan, C.J.; Richmond, B.; Sugawara, D.; Goto, K. Coastal changes in the Sendai area from the impact of 2011Tohoku-oki tsunami: Interpretations of time series satellite images, helicopter-borne video footage and field observation. Sediment. Geol. 2012, 282, 151–174. [Google Scholar] [CrossRef]
- Koshimura, S.; Hayashi, S.; Gokon, H. The impact of the 2011Tohoku earthquake tsunami disaster and implications to the reconstruction. Soils Found. 2014, 54, 560–572. [Google Scholar] [CrossRef] [Green Version]
- Dawson, A.G. Geomorphological effects of tsunami run-up and backwash. Geomorphology 1994, 10, 83–94. [Google Scholar] [CrossRef]
- Bryant, E.A.; Young, R.W.; Price, D.M. Tsunami as a Major Control on Coastal Evolution, Southeastern Australia. J. Coast. Res. 1996, 12, 831–840. [Google Scholar]
- Choowong, M.; Phantuwongraj, S.; Charoentitirat, T.; Chutakositkano, B.; Yumuang, S.; Charusiri, P. Beach recovery after 2004 Indian Ocean tsunami from Phang-Nga Thailand. Geomorphology 2009, 104, 134–142. [Google Scholar] [CrossRef]
- Liew, S.C.; Gupta, A.; Wong, P.P.; Kwoh, L.K. Recovery from a large tsunami mapped over time: The Aceh coast, Sumatra. J. Geomorphol. 2010, 114, 520–529. [Google Scholar] [CrossRef]
- Catalán, P.A.; Cienfuegos, R.; Villagrán, M. Perspectives on the long-term equilibrium of a wave dominated coastal zone affected by tsunamis: The case of central Chile. J. Coast. Res. 2014, 71, 55–61. [Google Scholar] [CrossRef]
- Monecke, K.; Meilianda, E.; Walstra, D.J.; Hill, E.M.; McAdoo, B.G.; Qiu, Q.; Storms, J.E.A.; Masputri, A.S.; Mayasari, C.D.; Nasir, M.; et al. Postseismic coastal development in Aceh, Indonesia-field observations and numerical modeling. Mar. Geol. 2017, 392, 94–104. [Google Scholar] [CrossRef] [Green Version]
- Martínez, C.; Sepúlveda-Zúñiga, E.; Villagrán, M.; Rojas, O.; Gómez, M.; López, P.; Rojas, C. Coastal Evolution in a Wetland Affected by Large Tsunamigenic Earthquakes in South-Central Chile: Criteria for Integrated Coastal Management. Water 2021, 13, 1467. [Google Scholar] [CrossRef]
- Udo, K.; Sugawara, D.; Tanaka, H.; Imai, K.; Mano, A. Impact of the 2011 Tohoku earthquake and tsunami on beach morphology along the northern Sendai Coast. Coast. Eng. J. 2012, 54, 1250009. [Google Scholar] [CrossRef]
- Udo, K.; Tojo, K.; Takeda, Y.; Tanaka, H.; Mano, A. Characteristics of Shoreline Retreat Due to the 2011 Tohoku Earthquake Tsunami and Its Recovery after Three Years. In Tsunamis and Earthquakes in Coastal Environments; Santiago-Fandino, V., Tanaka, H., Spiske, M., Eds.; Springer: Berlin/Heidelberg, Germany, 2016; pp. 113–123. [Google Scholar]
- Tanaka, H.; Adityawan, M.B.; Mano, A. Morphological changes at the Nanakita River mouth after the Great East Japan Tsunami of 2011. Coast. Eng. 2014, 86, 14–26. [Google Scholar] [CrossRef] [Green Version]
- Adityawan, M.B.; Dao, N.X.; Tanaka, H.; Mano, A.; Udo, K. Morphological changes along the Ishinomaki coast induced by the 2011 Great East Japan Tsunami and the relationship with coastal structures. Coast. Eng. J. 2014, 56, 1450016. [Google Scholar] [CrossRef]
- Yamashita, K.; Sugawara, D.; Takahashi, T.; Imamura, F.; Saito, Y.; Imato, Y.; Kai, T.; Uehara, H.; Kato, T.; Nakata, K.; et al. Numerical Simulations of Large-Scale Sediment Transport Caused by the 2011 Tohoku Earthquake Tsunami in Hirota Bay, Southern Sanriku Coast. Coast. Eng. J. 2016, 58, 1640015. [Google Scholar] [CrossRef] [Green Version]
- Hoang, V.C.; Tanaka, H.; Mitobe, Y. Longshore propagation erosion of beach in the vicinity of tsunami-induced concave shoreline. J. Hydro-Environ. Res. 2019, 23, 1–9. [Google Scholar] [CrossRef]
- Hoang, V.C.; Tanaka, H.; Mitobe, Y. Morphological recovery of beach severely damaged by the 2011 great east Japan tsunami. Estuar. Coast. Shelf Sci. 2019, 226, 106274. [Google Scholar] [CrossRef]
- Hiep, N.T.; Tanaka, H.; Tinh, N.X. Centennial to Multi-Decadal Morphology Change and Sediment Budget Alteration with Consideration of the Impacts of the 2011 Tohoku Earthquake Tsunami along the Nobiru Coast, Japan. J. Mar. Sci. Eng. 2021, 9, 265. [Google Scholar] [CrossRef]
- Hiep, N.T.; Tanaka, H.; Tinh, N.X. Morphology recovery of the Abukuma River mouth after the 2011 Tohoku tsunami under the interaction between sand spit and sand terrace. Coast. Eng. J. 2021, 63, 467–484. [Google Scholar] [CrossRef]
- Sawamoto, M. Sediment Movement in Beaches: An Example on Sendai Coast. In Lecture Notes of the 37th Summer Seminar on Hydraulic Engineering, Course B.; Japan Society of Civil Engineers: Tokyo, Japan, 2001; pp. 1–20. (In Japanese) [Google Scholar]
- Saitoh, Y.; Tamura, T.; Nakano, T. Geochemical constraints on the sources of beach sand, southern Sendai Bay, northeast Japan. Mar. Geol. 2017, 387, 97–107. [Google Scholar] [CrossRef]
- Kanaya, G.; Suzuki, T.; Kikuchi, E. Spatio-temporal variations in macrozoobenthic assemblage structures in a river-affected lagoon (Idoura Lagoon, Sendai Bay, Japan): Influences of freshwater inflow. Estuar. Coast. Shelf Sci. 2011, 92, 169–179. [Google Scholar] [CrossRef]
- Widyaningtia; Tanaka, H.; Kanayama, S. Depth of closure determination in the vicinity of coastal structure. In Proceedings of the 33rd International Conference on Coastal Engineering, Santander, Spain, 1–6 July 2012; p. 15. [Google Scholar]
- Uda, T. Beach Erosion in Japan; Sankaido Press: Tokyo, Japan, 1997; p. 242. (In Japanese) [Google Scholar]
- Kang, H.; Tanaka, H. Monitoring of long-term shoreline evolution on Sendai Coast. In Proceedings of the 4th Congress Environmental Hydraulics and the 14th APD-IAHR Congress, Hongkong, 15–18 December 2004; pp. 1101–1107. [Google Scholar]
- Tu, N.T. Study on Formation Process of Sand Bar at the River Entrance. Ph.D. Dissertation, Tohoku University, Sendai, Japan, 2007; p. 108. [Google Scholar]
- Tanaka, H.; Tinh, N.X.; Hiep, N.T.; Kayane, K.; Roh, M.; Umeda, M.; Sasaki, M.; Kawagoe, S.; Tsuchiya, M. Intrusion distance and flow discharge in rivers during the 2011 Tohoku Tsunami. J. Mar. Sci. Eng. 2020, 8, 882. [Google Scholar] [CrossRef]
- Ito, K.; Katayama, A.; Shizuka, K.; Monna, N. Effects of the Great East Japan Tsunami on Fish Populations and Ecosystem Recovery. The Natori River; Northeastern Japan. In Tsunamis and Earthquakes in Coastal Environments; Santiago-Fandino, V., Tanaka, H., Spiske, M., Eds.; Springer: Berlin/Heidelberg, Germany, 2016; pp. 201–216. [Google Scholar]
- Tanaka, H.; Kuwahara, N.; Sato, K.; Shuto, N. Numerical modelling of 2-D flow and sediment movement in the vicinity of Natori River mouth. In Flow Modeling and Turbulence Measurement IV.; Chen, C., Ed.; A.A. Balkema: Rotterdam, The Netherlands, 1996; pp. 813–820. [Google Scholar]
- Tinh, N.X.; Wang, J.; Tanaka, H.; Ito, K. Response of salinity intrusion to the hydrodynamic condtions and river mouth morphological changes induced by the 2011 tsunami. J. Sci. Technol. Civ. Eng. 2020, 14, 1–16. [Google Scholar]
- Matsui, S.; Okuyama, Y.; Ishikawa, J.; Shishido, H.; Kobayashi, Y.; Mizuno, T.; Hara, F.; Jimbo, M. Project of resilient coastal leeve in Sendai Bay south coast example of ingenuity according to the site condition in Idoura Area. J. Ocean Eng. JSCE 2017, 73, I19–I24. (In Japanese) [Google Scholar] [CrossRef] [Green Version]
- Burningham, H.; French, J. Understanding coastal change using shoreline trend analysis supported by cluster-based segmentation. Geomorphology 2017, 282, 131–149. [Google Scholar] [CrossRef]
- Dick, J.E.; Dalrymple, R.A. Coastal Changes at Bethany Beach, Delaware. In Proceedings of the 19th International Coastal Engineering Conference, Houston, TX, USA, 3–7 September 1984; pp. 1650–1667. [Google Scholar]
- Yates, M.L.; Guza, R.T.; O’Reilly, W.C. Equilibrium shoreline response: Observations and modeling. J. Geophys. Res. 2009, 114, C09014. [Google Scholar] [CrossRef] [Green Version]
- Ludka, B.C.; Guza, R.T.; O’Reilly, W.C.; Yates, M.L. Field evidence of beach profile evolution toward equilibrium. J. Geophys. Res. Oceans 2015, 120, 7574–7597. [Google Scholar] [CrossRef] [Green Version]
- Tinh, N.X.; Tanaka, H.; Larson, M. Analytical solution for time-dependent shoreline position response to the tectonic recovery process in the Sendai Plain, Japan, after the 2011 Great East Japan Earthquake. Cont. Shelf Res. 2021, 231, 104603. [Google Scholar] [CrossRef]
- Bruun, P. Coast Erosion and the Development of Beach Profiles; Beach Erosion Board (Technical Memo. N° 44); US Army Engineer Waterways Experiment Station: Vicksburg, MS, USA, 1954; p. 79. [Google Scholar]
- Dean, R.G. Equilibrium Beach Profiles: U.S. Atlantic and Gulf Coasts. Ocean Engineering; Technical Report N° 12; University of Delaware: Newark, DE, USA, 1977. [Google Scholar]
- Dean, R.G. Equilibrium beach profiles: Characteristics and applications. J. Coast. Res. 1990, 7, 53–84. [Google Scholar]
- Bodge, K.R. Representing equilibrium beach profiles with an exponential expression. J. Coastal Res. 1992, 8, 47–55. [Google Scholar]
- Inman, D.L.; Elwany, M.H.S.; Jekins, S.A. Shorerise and bar-berm profiles on ocean beaches. J. Geophys. Res. 1993, 98, 18181–18199. [Google Scholar] [CrossRef]
- Wang, P.; Davis, R.A. A Beach Profile Model for a Barred Coast-Case Study front Sand Key, West-Central Florida. J. Coast. Res. 1998, 14, 981–991. [Google Scholar]
- Anthony, E.J.; Aagaard, T. The lower shoreface: Morphodynamics and sediment connectivity with the upper shoreface and beach. Earth-Sci. Rev. 2020, 210, 103334. [Google Scholar] [CrossRef]
- Warrick, J.A. Littoral Sediment from Rivers: Patterns, Rates and Processes of River Mouth Morphodynamics. Front. Earth Sci. 2020, 8, 355. [Google Scholar] [CrossRef]
- Tajima, Y.; Takagawa, T.; Sato, S.; Takewaka, S. Collapse and recovery process of the sand spit at the Tenryu River mouth on the Pacific Coast of Japan. Coast. Eng. J. 2018, 60, 532–547. [Google Scholar] [CrossRef]
- Roelvink, J.A.; Stive, M.J.F. Bar-generating cross-shore flow mechanisms on a beach. J. Geophys. Res. Oceans 1989, 94, 4785–4800. [Google Scholar] [CrossRef]
- Aagaard, T. Sediment supply to beaches: Cross-shore sand transport on the lower shoreface. J. Geophys. Res. Earth Surf. 2014, 119, 913–926. [Google Scholar] [CrossRef]
- Wei, Z.; Dalrymple, R.A.; Xu, M.; Garnier, R.; Derakhti, M. Short-crested waves in the surf zone. J. Geophys. Res. Oceans 2017, 122, 4143–4162. [Google Scholar] [CrossRef] [Green Version]
- Komar, P.D. Computer Models of Delta Growth due to Sediment Input from Rivers and Longshore Transport. Geol. Soc. Am. Bull. 1973, 84, 2217–2226. [Google Scholar] [CrossRef]
- Giosan, L.; Bhattacharya, J.P. River Deltas—Concepts, Models, and Examples; SEPM Society for Sedimentary Geology: Tulsa, OK, USA, 2005. [Google Scholar]
- Nienhuis, J.H.; Ashton, A.D.; Giosan, L. What makes a delta wave-dominated? Geology 2015, 43, 511–514. [Google Scholar] [CrossRef] [Green Version]
- Nienhuis, J.H.; Ashton, A.D. Mechanics and rates of tidal inlet migration: Modeling and application to natural examples: Inlet Migration. J. Geophys. Res. Earth Surf. 2016, 121, 2118–2139. [Google Scholar] [CrossRef]
- Nienhuis, J.H.; Ashton, A.D.; Nardin, W.; Fagherazzi, S.; and Giosan, L. Alongshore sediment bypassing as a control on river mouth morphodynamics: Littoral Bypassing. J. Geophys. Res. Earth Surf. 2016, 121, 664–683. [Google Scholar] [CrossRef] [Green Version]
- Duc Anh, N.Q.; Tanaka, H.; Tam, H.S.; Tinh, N.X.; Tung, T.T.; Viet, N.T. Comprehensive Study of the Sand Spit Evolution at Tidal Inlets in the Central Coast of Vietnam. J. Mar. Sci. Eng. 2020, 8, 722. [Google Scholar] [CrossRef]
- Allard, J.; Bertin, X.; Chaumillon, E.; Pouget, F. Sand spit rhythmic development: A potential record of wave climate variations? Arçay Spit, western coast of France. Mar. Geol. 2008, 253, 107–131. [Google Scholar] [CrossRef]
- Ashton, A.D.; Nienhuis, J.; Ells, K. On a neck, on a spit: Controls on the shape of free spits. Earth Surf. Dyn. 2016, 4, 193–210. [Google Scholar] [CrossRef] [Green Version]
- Tanaka, H.; Lee, H.S. Influence of jetty construction on morphology and wave set-up at a river mouth. Coast. Eng. J. 2003, 45, 659–683. [Google Scholar] [CrossRef]
- Posamentier, H.W.; Allen, G.P.; James, D.P.; Tesson, M. Forced regressions in a sequence stratigraphic framework: Concepts, examples, and exploration significance. Am. Assoc. Petrol. Geol. Bull. 1992, 76, 1687–1709. [Google Scholar]
- Tamura, T.; Nanayama, F.; Saito, Y.; Murakami, F.; Nakashima, R.; Watanabe, K. Intra-shoreface erosion in response to rapid sea-level fall: Depositional record of a tectonically uplifted strand plain, Pacific coast of Japan. Sedimentology 2007, 54, 1149–1162. [Google Scholar] [CrossRef]
- Aagaard, T.; Hughes, M.G. Equilibrium shoreface profiles: A sediment transport approach. Mar. Geol. 2017, 390, 321–330. [Google Scholar] [CrossRef]
- Cowell, P.J.; Thom, B.G. Morphodynamics of coastal evolution. In Coastal Evolution: Late Quaternary Shoreline Morphodynamics; Carter, R.W.G., Woodroffe, C.D., Eds.; Cambridge University Press: Cambridge, UK, 1994; pp. 33–86. [Google Scholar]
- Stive, M.J.F.; de Vriend, H.J. Modeling shoreface profile evolution. Mar. Geol. 1995, 126, 235–248. [Google Scholar] [CrossRef] [Green Version]
- Wright, L.D. Morphodynamics of Inner Continental Shelves; CRC Press: Boca Raton, FL, USA, 1995; p. 241. [Google Scholar]
- Harley, M.D.; Turner, I.L.; Short, A.D. New insights into embayed beach rotation: The importance of wave exposure and cross-shore processes. J. Geophys. Res. Earth Surf. 2015, 120, 1470–1484. [Google Scholar] [CrossRef] [Green Version]
- Tinh, N.X.; Thanh, T.M.; Tanaka, H.; Viet, N.T.; Mitobe, Y.; Dien, D.C. Numerical investigation of the effect of seasonal variations of depth-of-closure on shoreline evolution. Int. J. Sediment. Res. 2021, 36, 1–16. [Google Scholar]
- Jara, M.S.; González, M.; Medina, R. Shoreline evolution model from a dynamic equilibrium beach profile. Coast. Eng. 2015, 99, 1–14. [Google Scholar] [CrossRef]
- Wang, P.; Kraus, N.C. Beach Profile Equilibrium and Patterns of Wave Decay and Energy Dissipation across the Surf Zone Elucidated in a Large-Scale Laboratory Experiment. J. Coast. Res. 2005, 21, 552–1534. [Google Scholar] [CrossRef]
- Marinho, B.; Coelho, C.; Larson, M.; Hanson, H. Cross-shore modelling of multiple nearshore bars at a decadal scale. Coast. Eng. 2020, 159, 103722. [Google Scholar] [CrossRef]
- Udo, K.; Takeda, Y. Projections of Future Beach Loss in Japan Due to Sea-Level Rise and Uncertainties in Projected Beach Loss. Coast. Eng. J. 2017, 59, 1740006. [Google Scholar] [CrossRef] [Green Version]
- Takeda, Y.; Udo, K. Effect of Spatial Resolution on Nationwide Projection of Future Beach Loss Rate in Japan. J. Coast. Res. 2020, 95, 1310–1314. [Google Scholar] [CrossRef]
- Koshimura, S.; Shuto, N. Response to the 2011 Great East Japan Earthquake and Tsunami disaster. Philos. Trans. R. Soc. A 2015, 373, 20140373. [Google Scholar] [CrossRef] [Green Version]
Figure 1.
Study area.

Figure 2.
Time series wave data (2009–2017) measured at the Sendai Shiogama Station (NOWPHAS). (a) Significant wave height (Hs). (b) Wave period (Ts). (c) Wave direction.
Figure 2.
Time series wave data (2009–2017) measured at the Sendai Shiogama Station (NOWPHAS). (a) Significant wave height (Hs). (b) Wave period (Ts). (c) Wave direction.

Figure 3.
Hourly river discharge (2011–2017). (a) Natoribashi Station, (b) Hirose Station.

Figure 4.
(a) Image capturing time and tidal level. (b) Beach slope within intertidal range. (c) Mean beach slope in the Natori River mouth; the error bars are the standard deviation of beach slope at each profile.
Figure 4.
(a) Image capturing time and tidal level. (b) Beach slope within intertidal range. (c) Mean beach slope in the Natori River mouth; the error bars are the standard deviation of beach slope at each profile.

Figure 5.
Definition of river mouth features.

Figure 6.
Beach profiles. (a) Measuring time. (b) Measured elevation data.

Figure 7.
Post-seismic land deformation.

Figure 8.
(a–i) Morphological change of the Natori River mouth before and after the 2011 tsunami.

Figure 9.
Shoreline position change. (a) Early stage of the recovery until the intrusion of the sand spit. (b) After the intrusion of the sand spit until the completion of the newly constructed embankment.
Figure 9.
Shoreline position change. (a) Early stage of the recovery until the intrusion of the sand spit. (b) After the intrusion of the sand spit until the completion of the newly constructed embankment.

Figure 10.
Shoreline position change. (a) Near concrete block. (b) Middle region. (c) Near sand spit.
Figure 10.
Shoreline position change. (a) Near concrete block. (b) Middle region. (c) Near sand spit.

Figure 11.
(a) Area of sand spit, AS. (b) Area of sandy beach, AC. (c) Total area, AC + AS. (d) Width of the river mouth, B. (e) Hourly river discharge (Hirosebashi and Natoribashi combined), Q. (f) Significant wave height, Hs.
Figure 11.
(a) Area of sand spit, AS. (b) Area of sandy beach, AC. (c) Total area, AC + AS. (d) Width of the river mouth, B. (e) Hourly river discharge (Hirosebashi and Natoribashi combined), Q. (f) Significant wave height, Hs.

Figure 12.
Sediment intrusion inside the mouth. (a) Before intrusion. (b) After intrusion.

Figure 13.
Temporal bed elevation variation.

Figure 14.
Cross-shore sediment transport. (a) Computation distance: black line is the mean profile of all data at each location, SD is the standard deviation of profile data, the shaded region is the selected computation distance. (b) Cross-shore transport rate, Qy.
Figure 14.
Cross-shore sediment transport. (a) Computation distance: black line is the mean profile of all data at each location, SD is the standard deviation of profile data, the shaded region is the selected computation distance. (b) Cross-shore transport rate, Qy.

Figure 15.
Elevation change after removing random noise.

Figure 16.
RMS values of elevation change.

Figure 17.
The spatial eigenfunctions of the first three components.

Figure 18.
The temporal eigenfunctions of the first three components.

Figure 19.
Sediment movement in the Natori River after the tsunami.

Publisher’s Note: MDPI stays neutral with regard to jurisdictional claims in published maps and institutional affiliations. |
© 2022 by the authors. Licensee MDPI, Basel, Switzerland. This article is an open access article distributed under the terms and conditions of the Creative Commons Attribution (CC BY) license (https://creativecommons.org/licenses/by/4.0/).
Share and Cite
MDPI and ACS Style
Hiep, N.T.; Tanaka, H.; Tinh, N.X. Morphology Recovery and Convergence of Topographic Evolution in the Natori River Mouth after the 2011 Tohoku Tsunami. Water 2022, 14, 715. https://0-doi-org.brum.beds.ac.uk/10.3390/w14050715
AMA Style
Hiep NT, Tanaka H, Tinh NX. Morphology Recovery and Convergence of Topographic Evolution in the Natori River Mouth after the 2011 Tohoku Tsunami. Water. 2022; 14(5):715. https://0-doi-org.brum.beds.ac.uk/10.3390/w14050715
Chicago/Turabian StyleHiep, Nguyen Trong, Hitoshi Tanaka, and Nguyen Xuan Tinh. 2022. "Morphology Recovery and Convergence of Topographic Evolution in the Natori River Mouth after the 2011 Tohoku Tsunami" Water 14, no. 5: 715. https://0-doi-org.brum.beds.ac.uk/10.3390/w14050715
Note that from the first issue of 2016, this journal uses article numbers instead of page numbers. See further details here.