Article

Using the WWF Water Risk Filter to Screen Existing and Projected Hydropower Projects for Climate and Biodiversity Risks

by
Jeffrey J. Opperman
1,*,
Rafael R. Camargo
2,
Ariane Laporte-Bisquit
2,
Christiane Zarfl
3 and
Alexis J. Morgan
2
1
World Wildlife Fund, Washington, DC 20037, USA
2
WWF Germany, 10117 Berlin, Germany
3
Center for Applied Geoscience, Eberhard Karls University of Tübingen, 72074 Tübingen, Germany
*
Author to whom correspondence should be addressed.
Submission received: 18 November 2021 / Revised: 21 January 2022 / Accepted: 24 January 2022 / Published: 24 February 2022
(This article belongs to the Special Issue Hydro-Meteorological Hazards under Climate Change)

Abstract

:
Climate change is predicted to drive various changes in hydrology that can translate into risks for river ecosystems and for those who manage rivers, such as for hydropower. Here we use the WWF Water Risk Filter (WRF) and geospatial analysis to screen hydropower projects, both existing (2488 dams) and projected (3700 dams), for a variety of risks at a global scale, focusing on biodiversity risks, hydrological risks (water scarcity and flooding), and how those hydrological risks may shift with climate change, based on three scenarios. Approximately 26% of existing hydropower dams and 23% of projected dams are within river basins that currently have medium to very high risk of water scarcity; 32% and 20% of the existing and projected dams, respectively, are projected to have increased risk by 2050 due to climate change. For flood risk, 75% of existing dams and 83% of projected dams are within river basins with medium to very high risk, and the proportion of hydropower dams in basins with the highest levels of flood risk is projected to increase by nearly twenty times (e.g., from 2% to 36% of dams). In addition, a large proportion of existing (76%) and projected hydropower dams (93%) are located in river basins with high or very high freshwater biodiversity importance. This is a high-level screening, intended to elucidate broad patterns of risk to increase awareness, highlight trends, and guide more detailed studies.

1. Introduction

The planet’s changing climate is predicted to continue to drive various changes in hydrological patterns and river systems and associated habitats such as floodplains and deltas. These changes translate into risks for river ecosystems and their services and for those who manage rivers for specific objectives. For example, the potential for increased drought frequency to negatively impact hydropower generation is a risk for those who operate hydropower dams and manage power systems. Further, hydropower is also a primary source of risk for river ecosystems, and these sources of risk—climate change and hydropower—interact. At the scale of river basins, hydropower-related risks to river ecosystems, such as fragmentation, may exacerbate risks arising from climate change, such as increased water temperatures. At the scale of policies and investments, climate change mitigation goals can be a driver of hydropower development.
Climate change is predicted to drive a range of perturbations to riverine ecosystems [1]. Even absent any change in precipitation, increasing temperatures will result in increased evapotranspiration causing reduced discharge in rivers [2,3]. By changing the ratio of rain to snow and shifting snowmelt and glacier melt to earlier in the year, rising temperatures can also alter seasonal patterns in runoff [4,5]. Forecasts for how climate change will influence total annual precipitation and runoff are somewhat variable [6], with some general agreement that some currently dry regions of the world will become drier and some wet regions of the world will become wetter [7]. Runoff and river hydrographs are projected to become “flashier”, suggesting that some areas may see increased frequency of both droughts and floods [8]. More intense rainfall events due to climate change can also increase rates of erosion. Thus, climate change may influence rivers’ water quality due to both increased sedimentation and because changes in discharge can affect concentrations of pollutants in water and rising temperatures can affect biochemical processes.
Hydropower poses a range of risks to rivers and associated social and environmental resources, many of which will interact with threats arising from climate change. Most of the world’s large rivers have been fragmented by dams, with only 1/3 of long rivers (>1000 km) remaining free-flowing [9]. Some hydropower dams create large reservoirs that convert a range of terrestrial and aquatic habitats—forest, floodplain, wetland, and riverine—into a still reservoir. Reservoirs also displace farmland and communities, and the World Commission on Dams [10] estimated that, by the year 2000, 40–80 million people had been displaced by dams globally, though many of those reservoirs were multipurpose that also stored water for cities or irrigation. Reservoirs capture sediment and, in some river basins, nearly all (e.g., 98%) sediment is retained behind dams; globally, nearly one quarter of global annual sediment flux is captured by reservoirs [11,12]. This loss of sediment combines with sea-level rise to accelerate the “drowning” of river deltas, illustrating the interaction of climate-driven and hydropower-related threats [13]. Hydropower dams also negatively impact river ecosystems by altering flow patterns and water quality and blocking the movement of organisms. All of these threats can interact with the shifts from climate change described above—e.g., dam operations can exacerbate extreme low flows during increased periods of drought; warmer temperatures can accelerate the processes that create low dissolved oxygen in reservoir water, and dams can prevent species with narrow temperature ranges from migrating to portions of the river network with more appropriate thermal regimes [14].
Hydropower provides approximately 16% of global electricity generation and remains the leading source of low-carbon electricity (although wind and solar PV currently have far greater annual increases in capacity) [15]. Policy responses to climate change have contributed to hydropower expansion. For example, hydropower projects represented a high proportion of projects under the Clean Development Mechanism [16]. Beginning in 2000, hydropower grew rapidly for more than a decade. However, investment has been slowing since a peak in 2013. The slowdown is due to a range of reasons, including a declining number of optimal dam sites and the completion of large projects in China and Brazil without a global pipeline of similarly sized investments to replace those projects [17,18]. In addition, the other leading sources of low-carbon generation (wind and solar PV) have declined dramatically in cost over the past decade [15] while recent reviews have found that hydropower projects have the most delays and cost overruns among major infrastructure projects [19]. Hydropower’s negative impacts on a range of environmental and social resources, described above, can lead to conflict around dam projects, contributing to these trends of delays and cost overruns [17].
It is not clear if hydropower investment will continue the downward trend that began in 2014. However, the models used in reports from the Intergovernmental Panel on Climate Change (IPCC; e.g., their Special Report on 1.5 Degrees [20]) continue to forecast a large increase—an approximate doubling of global capacity—in hydropower investment by 2050 to achieve climate targets [17], as do recent reports from the International Energy Agency [21] and the International Renewable Energy Agency [22]. If hydropower does continue to expand, dams will be planned and built in a period where hydrology is shifting in many parts of the world due to climate change, and some existing dams will also face changing hydrology. Hydropower projects face a range of hydrological risks that will be further exacerbated under future climate change. Some regions of the world are projected to have a higher frequency of droughts, increasing the variability and reducing the reliability of generation, and/or lower overall runoff, reducing total annual generation [23,24]. Van Vliet et al. [25] projected the impact of climate-driven changes in hydrology on the generation of 24,500 hydropower projects globally and they estimated that 61–74% would have reduced generation.
Other regions are projected to have higher magnitude floods, increasing the risk of uncontrolled releases or even dam failures (with recent examples of hydropower dam failures from Laos and Michigan, USA [26,27]). To ensure safety, new dams may need to be planned to withstand larger floods than those of the current hydrological record and existing dams may require retrofits or changes in operational rules to reduce risk from large floods. Because hydrographs are projected to become flashier, some hydropower projects could experience an increased risk of both droughts and floods [8]. Other climate-related risks to hydropower include increasing conflicts with other objectives (including other uses of water and ecosystem services), greater evaporation from reservoirs, and increased sedimentation [10,28].
Regions with the most proposed hydropower are among those with the highest levels of freshwater biodiversity and where people depend most directly on the rivers’ ecosystem services [28,29], underscoring the large environmental and social risks associated with hydropower expansion. Due to climate change, operators of existing dams may confront new environmental and social challenges, for example, if fish populations or ecosystem services that were stable begin to decline due to climate-related stressors, those declines may have regulatory or reputational risks for operators.
In summary, climate change will drive a range of perturbations in rivers. Hydropower projects, both existing and future, will confront a range of shifting and interacting risks, including projected changes in hydrological patterns that could threaten generation levels or structural safety, the high environmental and social values of rivers in the regions where hydropower is planned to expand, and the fact that stressors on rivers from climate change and hydropower may interact in new ways. Management of current systems, including river systems and hydropower, as well as plans for future management, should account for these interacting and shifting risks [30,31,32]. Water managers, planners, and decision-makers will need a range of tools and methods to identify these interacting risks to inform efforts to protect, maintain and restore rivers and also to maintain benefits from hydropower dams, including those that are multipurpose dams and are managed to reduce risks of floods and/or water scarcity.
In recent years, various tools have emerged to assist both the private and public sectors in their ability to assess water risks [33]. These tools translate water data—ranging from historical to near-real-time to future scenarios—into projections of risk and potential financial impacts. Water risk tools, which harness the dramatic expansion of geospatial data, combined with the advances in geospatial software and online platforms, enable users to rapidly assess one to hundreds or even thousands of sites at a time, at low to even no cost. Owners, investors, and operators of hydropower projects could benefit from a screening of risks, as would governments who plan, license, and regulate those projects as well as communities and civil society organizations who focus on resources that may be impacted by hydropower.
Here we demonstrate how one such tool, the WWF Water Risk Filter (WRF), combined with geospatial analysis, can be used to screen for a variety of risks at a global scale, including risks to riverine ecosystems from both climate change and hydropower, as well as risks to hydropower projects—and their operators, owners, and investors—from climate change and potential regulatory or reputational risk arising from negative impacts to ecosystems. We screen existing and planned hydropower dams for potential risks from climate-related hydrological changes and also the reputational and regulatory risks arising from negative impacts on environmental values. We note that this is a high-level screening, intended to elucidate broad patterns of risk to increase awareness, highlight trends, and guide more detailed studies. This form of risk screening is not a substitute for higher resolution hydrological and engineering studies for hydrological risks or environmental and social reviews. Further, we note that by performing this screening we are not suggesting that hydropower dams do not currently incorporate hydrological risk in their planning, design, operations, or other management. The sector can draw on abundant guidance on how to incorporate climate change and shifting risks into planning, design, and operations [34,35,36,37,38,39,40] to improve the ability of dams and reservoirs to adapt to change.

2. Materials and Methods

2.1. Hydropower Dams Data

Water risks vary geographically as do the projected effects of climate change on hydrological processes. To explore the geographic distribution of current and future risks, we used freely available global databases with georeferenced information about dams: the Global Reservoir and Dam Database (GRanD) [41] and the Future Hydropower Reservoirs and Dams (FHReD) [42], both curated and hosted by the Global Dam Watch (http://globaldamwatch.org; accessed 21 January 2022). The GRanD v1.3 contains 7320 records of reservoirs (with a minimum storage capacity of 0.1 km3) and their associated dams. For this study, we used only the 2488 dams that are identified as being used for hydroelectricity production, and discarded any categorized as having been destroyed, removed, replaced, or subsumed. The FHReD (latest update of 2018) contains 3700 records of potential hydropower dams (with a minimum capacity >1 MW) that were identified by Zarfl et al. [42] as being under construction or in the planning process, beyond the pre-feasibility stage, through their survey of a range of sources. For a matter of simplicity, dams in this study from GRanD will be referred to as “existing dams”, and those from FHReD as “projected dams”. Note that projected dams are not certain to be built, but do represent sites where a hydropower dam could potentially be built pending various conditions and decisions (e.g., markets, financing, regulatory approvals).

2.2. Water Risk Filter Data

Launched in 2012, the WWF Water Risk Filter (https://waterriskfilter.org; accessed 21 January 2022) was one of the first online water risk assessment tools designed for companies and investors to assess water risks in their operations, supply chains, and investments, in a spatially explicit manner and at the global scale. The WRF’s risk assessment framework uses the well-recognized categorization of corporate water risks according to three risk types: physical, regulatory, and reputational [43]. Each risk type is further divided into four risk categories. Physical risk comprises water scarcity, flooding, water quality, and ecosystem services status. Regulatory risk comprises enabling environment, institutions and governance, management instruments, and infrastructure and finance. Reputational risk comprises cultural importance, biodiversity importance, media scrutiny, and conflict [44]. Following this framework, the tool contains risk layers for both current day scenarios (2020 for this study), as well as scenarios for the years 2030 and 2050.
For the 2020 risk layers, the 12 WRF risk categories are composed of a total of 32 risk indicators, based on global datasets drawing primarily from the latest peer-reviewed literature—see the WRF methodology (https://waterriskfilter.org/explore/dataandmethods; accessed 21 January 2022) for a detailed description of risk indicators. The original indicators’ raw datasets are first spatially aggregated to a common scale of river basins, using the HydroSHEDS HydroBASIN Level 7 [45], and then classified into risk scores with values ranging from 1 to 5 (Figure 1). This normalization process allows risk indicators to be more easily compared or aggregated, e.g., to the risk categories or risk types.
For the 2030 and 2050 scenario layers, the WRF uses the risk categories’ 2020 risk layers, added with projected changes based on climate impact ensemble projections that represent the consequences and effects of climate and socio-economic changes on water resources based on the IPCC AR5 Representative Concentration Pathways (RCP) [46] and the IIASA Shared Socioeconomic Pathways (SSP) socio-economic models [47,48].
The WRF provides three scenario pathways that are different combinations of climate and socio-economic aspects. The WRF’s optimistic scenario, which can also be described as a “with-mitigation” scenario, represents a world with sustainable socio-economic development (SSP1) and moderate reduction of GHG emissions (RCP2.6/RCP4.5), leading to an increase of global mean surface temperature of approximately 1.5 °C by the end of the 21st century, calculated with respect to the 1986–2005 reference period, and based on the Coupled Model Intercomparison Project Phase 5 (CMIP5) ensembles (an additional 0.6 °C can be added for reference to the pre-industrial baseline) [46]. The current trend scenario represents a world similar to current socio-economic development trends (SSP2) and intermediate GHG emission levels (RCP4.5/RCP6.0), leading to an increase of global mean surface temperature of approximately 2 °C. The pessimistic scenario represents a world with unequal and unstable socio-economic development (SSP3) and high GHG emission levels (RCP6.0/RCP8.5), leading to an increase of global mean surface temperature of approximately 3.5 °C by the end of the 21st century.
Similar to the risk indicators of current risk, the raw datasets for projected change are also spatially aggregated to a common scale of river basins and have values normalized to range from −1.6 (risk decrease) to +1.6 (risk increase) with zero being equal to no change. Scores for risk changes were then added to current risk scores under the various scenarios to generate the future risk scores. Therefore, some regions of the world which have very high risk today and are projected to have increased risk can have future risk scores beyond 5.0, which is then considered as extreme risk (i.e., whereas current risk has five classes, future risk has six; Figure 1).
Although the WRF contains data on current and future risk for 12 risk categories, this study focuses only on three of the most relevant to the hydropower sector in terms of risks from climate change and biodiversity impacts: water scarcity, flooding, and freshwater biodiversity importance.

2.2.1. Water Scarcity

Water scarcity refers to the physical abundance or lack of freshwater resources and is generally calculated as a function of the volume of human water consumption relative to the volume of water resources in a given area [49]. In the WRF 2020 data, this risk category integrates a total of 7 datasets covering different aspects of scarcity as well as different modeling approaches: aridity index [50], water depletion [51], baseline water stress [52], blue water scarcity [53], available water remaining [54], drought frequency probability based on the Standardized Precipitation and Evaporation Index (SPEI) [55], and projected change in drought occurrence [56]. For the 2050 scenarios, the 2020 data are supplemented with projected changes in water scarcity [57] and in water stress [58].

2.2.2. Flooding

In the WRF 2020 data, flood risk considers both historical patterns [59] and future trends [56], where the historical patterns are based on empirical evidence of large flood events from 1985 to 2020, registered by the Dartmouth Flood Observatory’s Global Active Archive of Large Flood Events, derived from a wide variety of news, governmental, instrumental, and remote sensing sources. For the 2050 scenarios, the 2020 data is added with projected changes in the return period of 100-year flood discharge [60].

2.2.3. Biodiversity

Biodiversity risk uses freshwater fish as an indicator of the risks to biodiversity from the development or operation of projects, such as hydropower dams, that will affect riverine connectivity, water volumes, or other components of freshwater habitats. In the WRF 2020 data, this risk category is informed by two datasets from the Freshwater Ecoregions of the World (FEOW) [61]: freshwater fish endemism and freshwater fish richness. These metrics are relatively simple proxies for biodiversity risk but provide a preliminary assessment for a global-scale screening.

2.3. Assessment of Climate-Related Hydrological and Biodiversity Risks for Hydropower

To perform this assessment, we combined each of the dam datasets with the WRF risk layers. For each individual dam in the two datasets, we mapped its upstream catchment and then derived an area-weighted average risk score for its catchment. This process was performed primarily using the Esri ArcGIS tool Watershed, via the python libraries arcpy and pandas, and using the HydroSHEDS drainage flow direction of 15-arcsecond resolution (https://www.hydrosheds.org/page/hydrobasins; accessed 21 January 2022).
Further, we used the open-source software R, including the packages tidyverse, sf, and mapview, to generate descriptive statistics, charts, and maps to assess the distribution of dams in the risk classes and risk changes. We also aggregated the data to the level of countries, summing hydropower capacity and generating mean risk scores and risk changes. Large countries such as Russia, Canada, China, the United States, Brazil, and Australia were divided into sub-national levels to avoid results being averaged across the climatic variability within those countries. The GADM version 3.6 (https://gadm.org; accessed 21 January 2022) was used for the administrative divisions.
To assess the hydrological risks for hydropower projects we analyzed (1) existing dams and scarcity risk, (2) existing dams and flood risk, (3) projected dams and scarcity risk, and (4) projected dams and flood risk. To explore how climate-driven hydrological risks may interact, we also analyzed (5) all dams together (combining existing and projected dams) in a matrix of projected scarcity risk and projected flood risk.
To assess biodiversity risk (which can be viewed as the risk of impacts of projects on biodiversity or, alternatively, the reputational and regulatory risk for projects due to the risks they pose to biodiversity) we analyzed (6) all dams’ current biodiversity risk, and (7) all dams in a matrix of biodiversity risk and projected water scarcity risk, to explore how climate-driven hydrological risks and biodiversity risks may interact, as reduced flows can negatively impact riverine ecosystems and exacerbate management challenges for projects.
For reproducibility, all scripts were made available (see Data Availability Statement).

3. Results

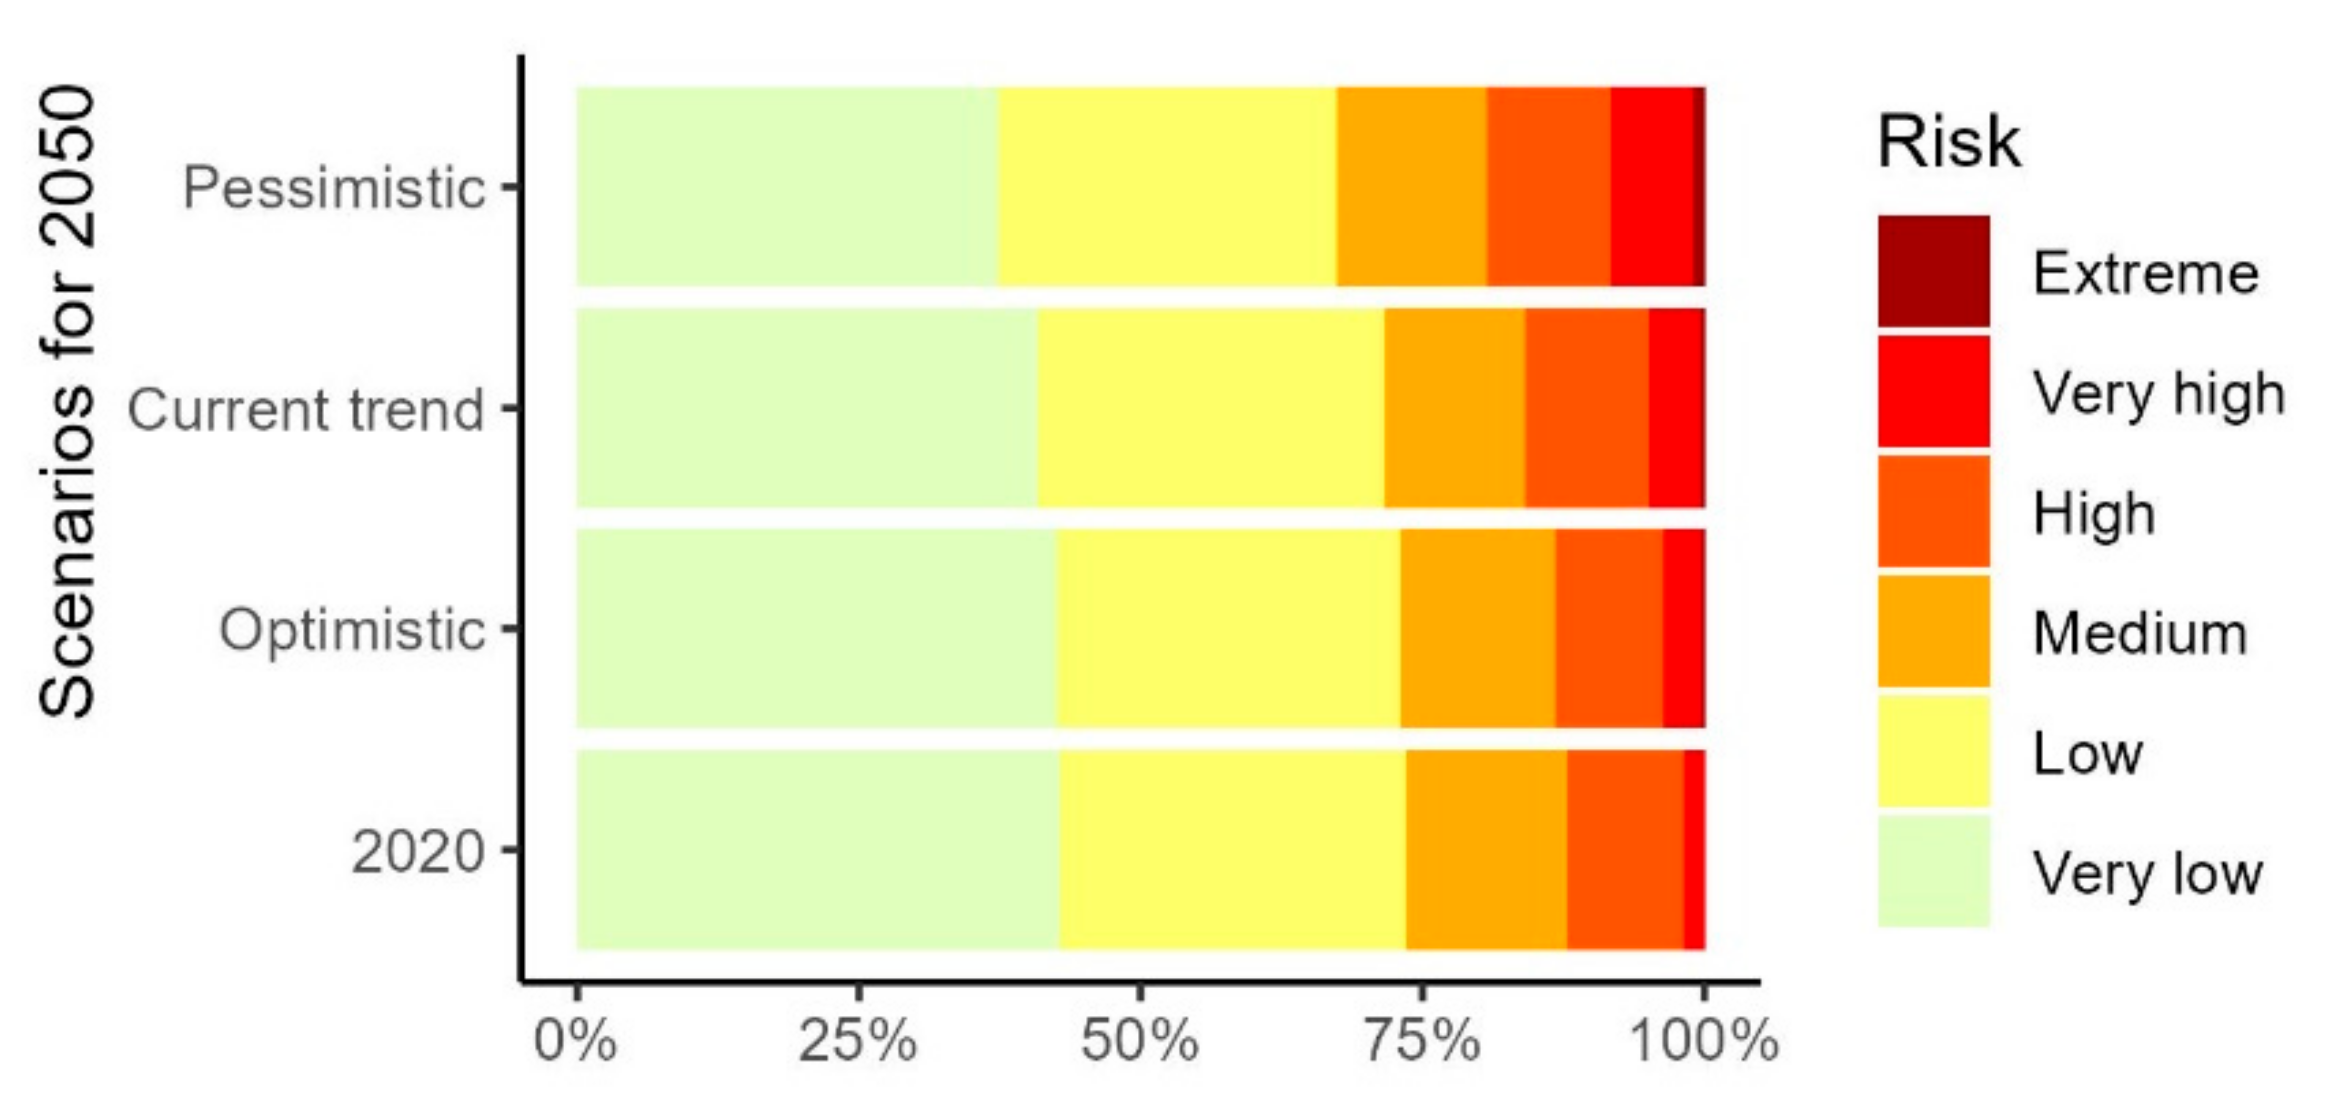
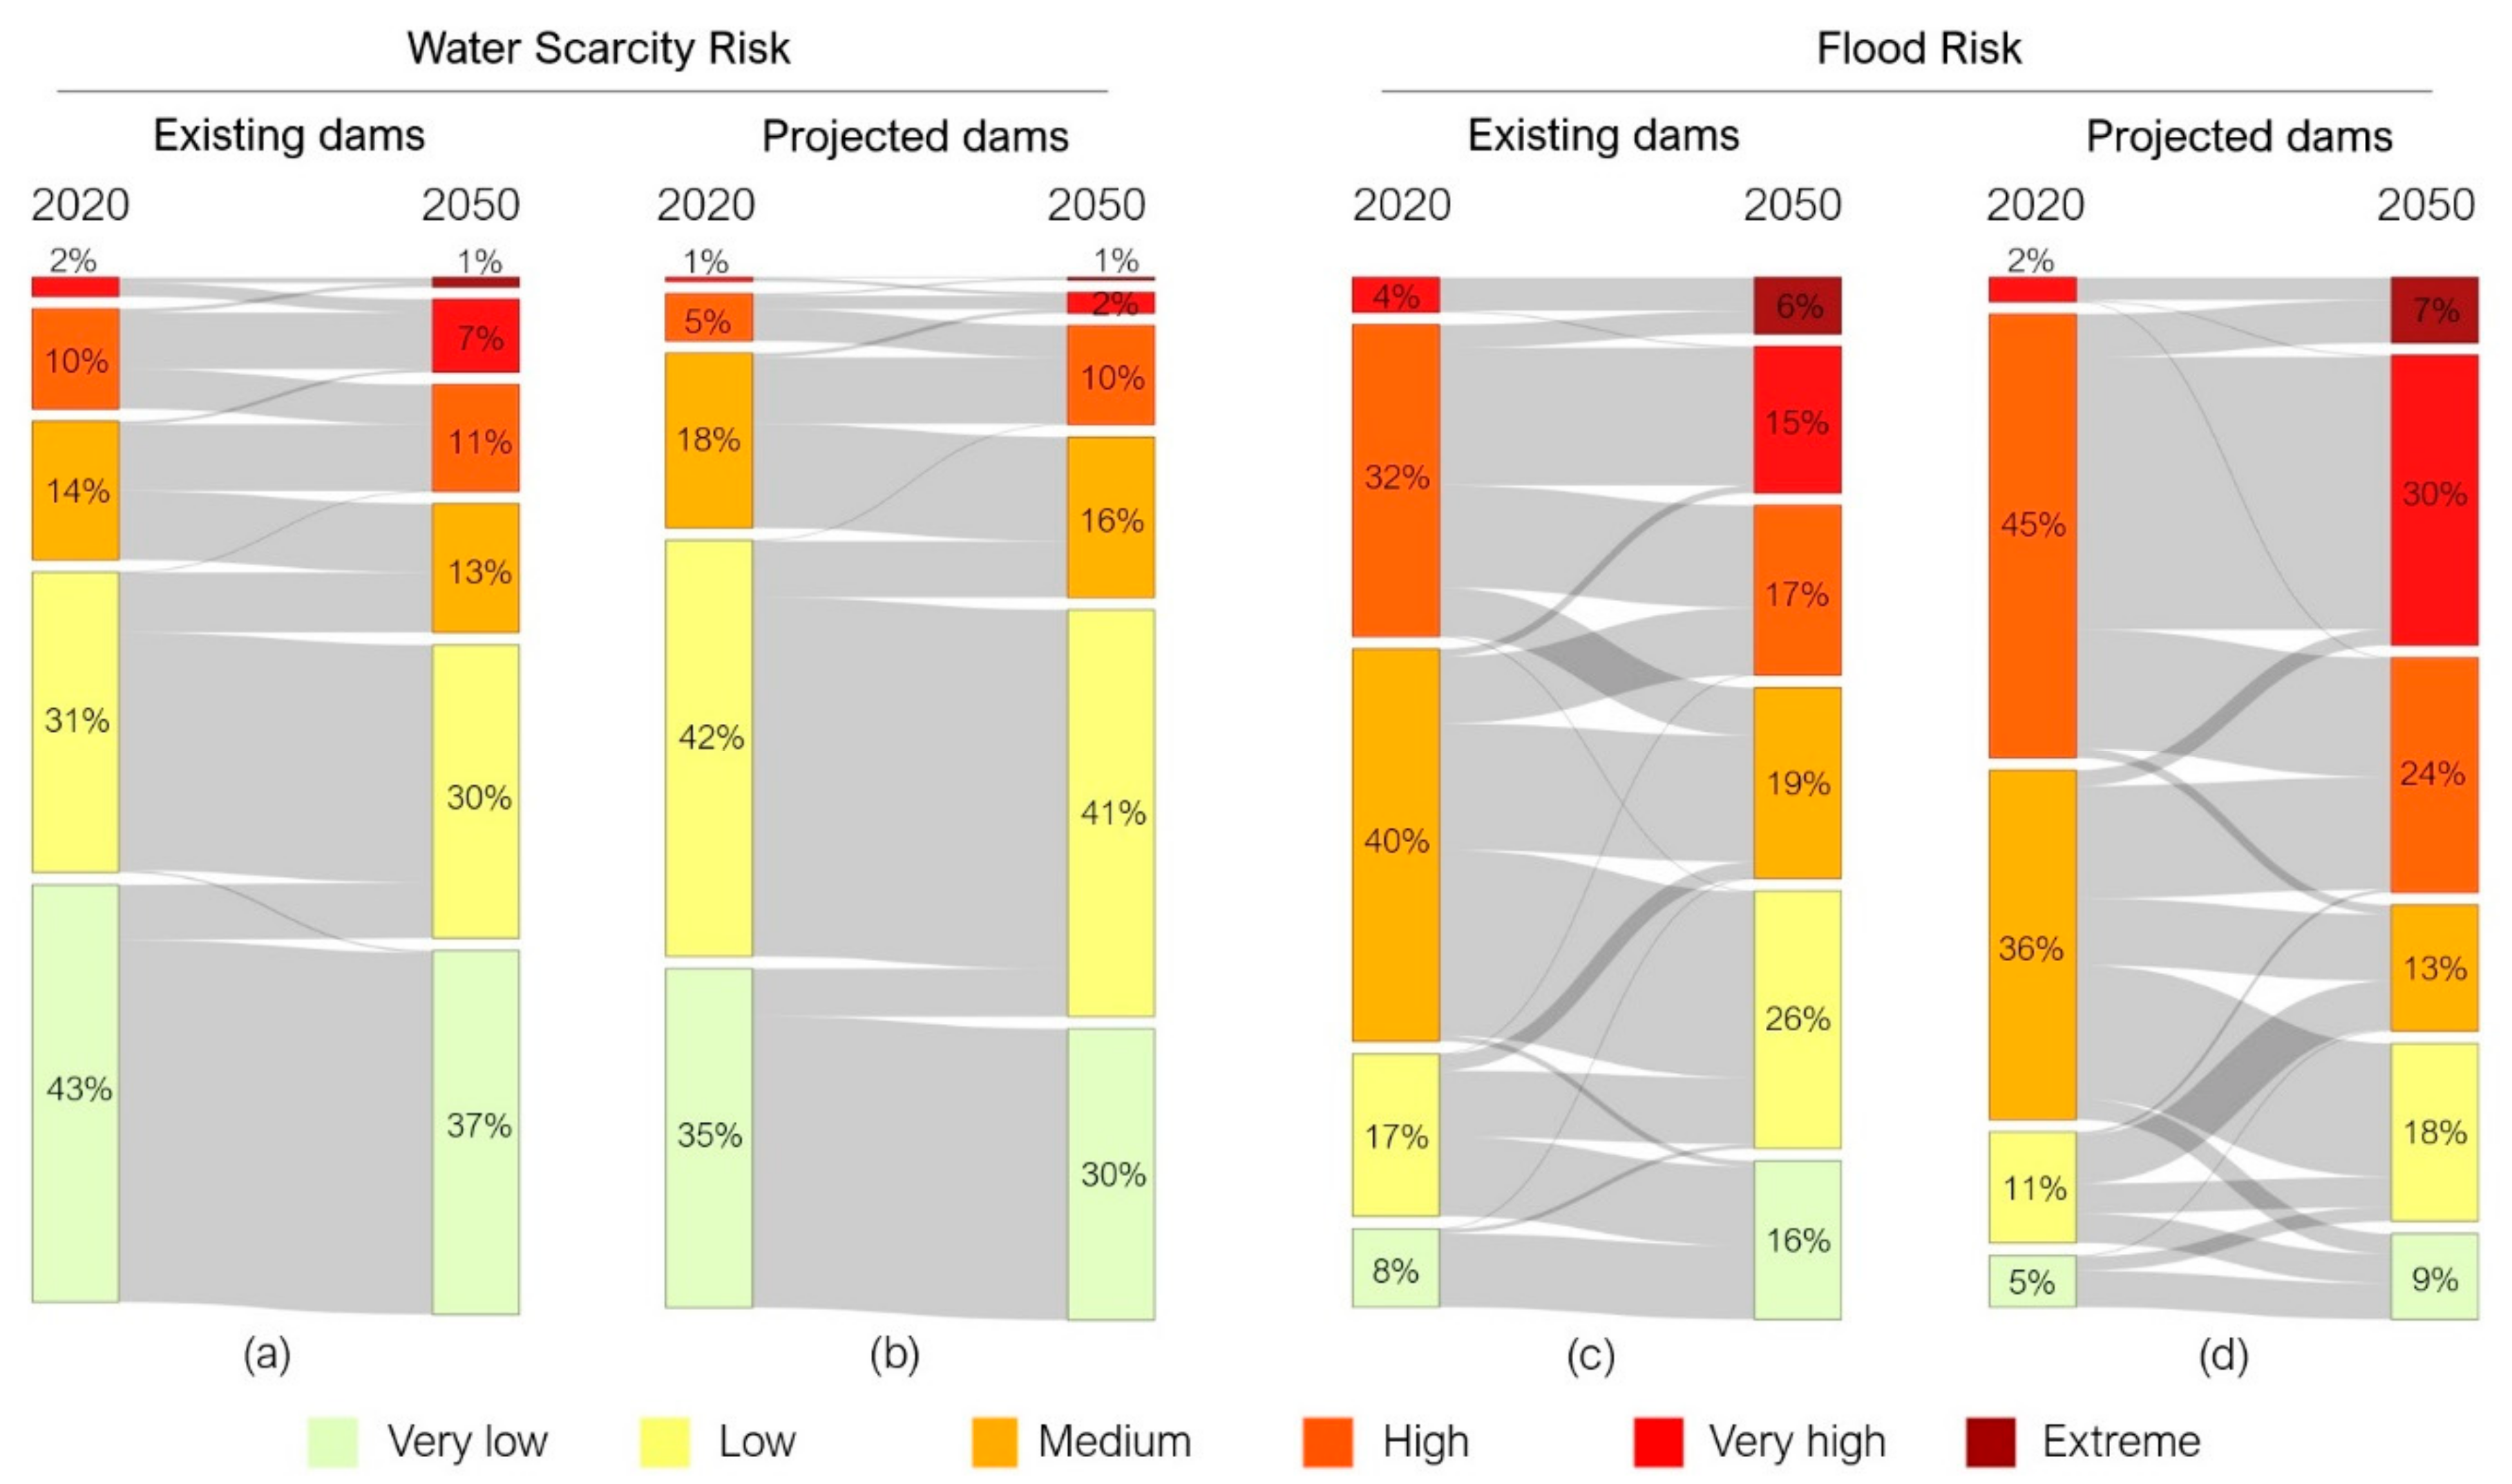
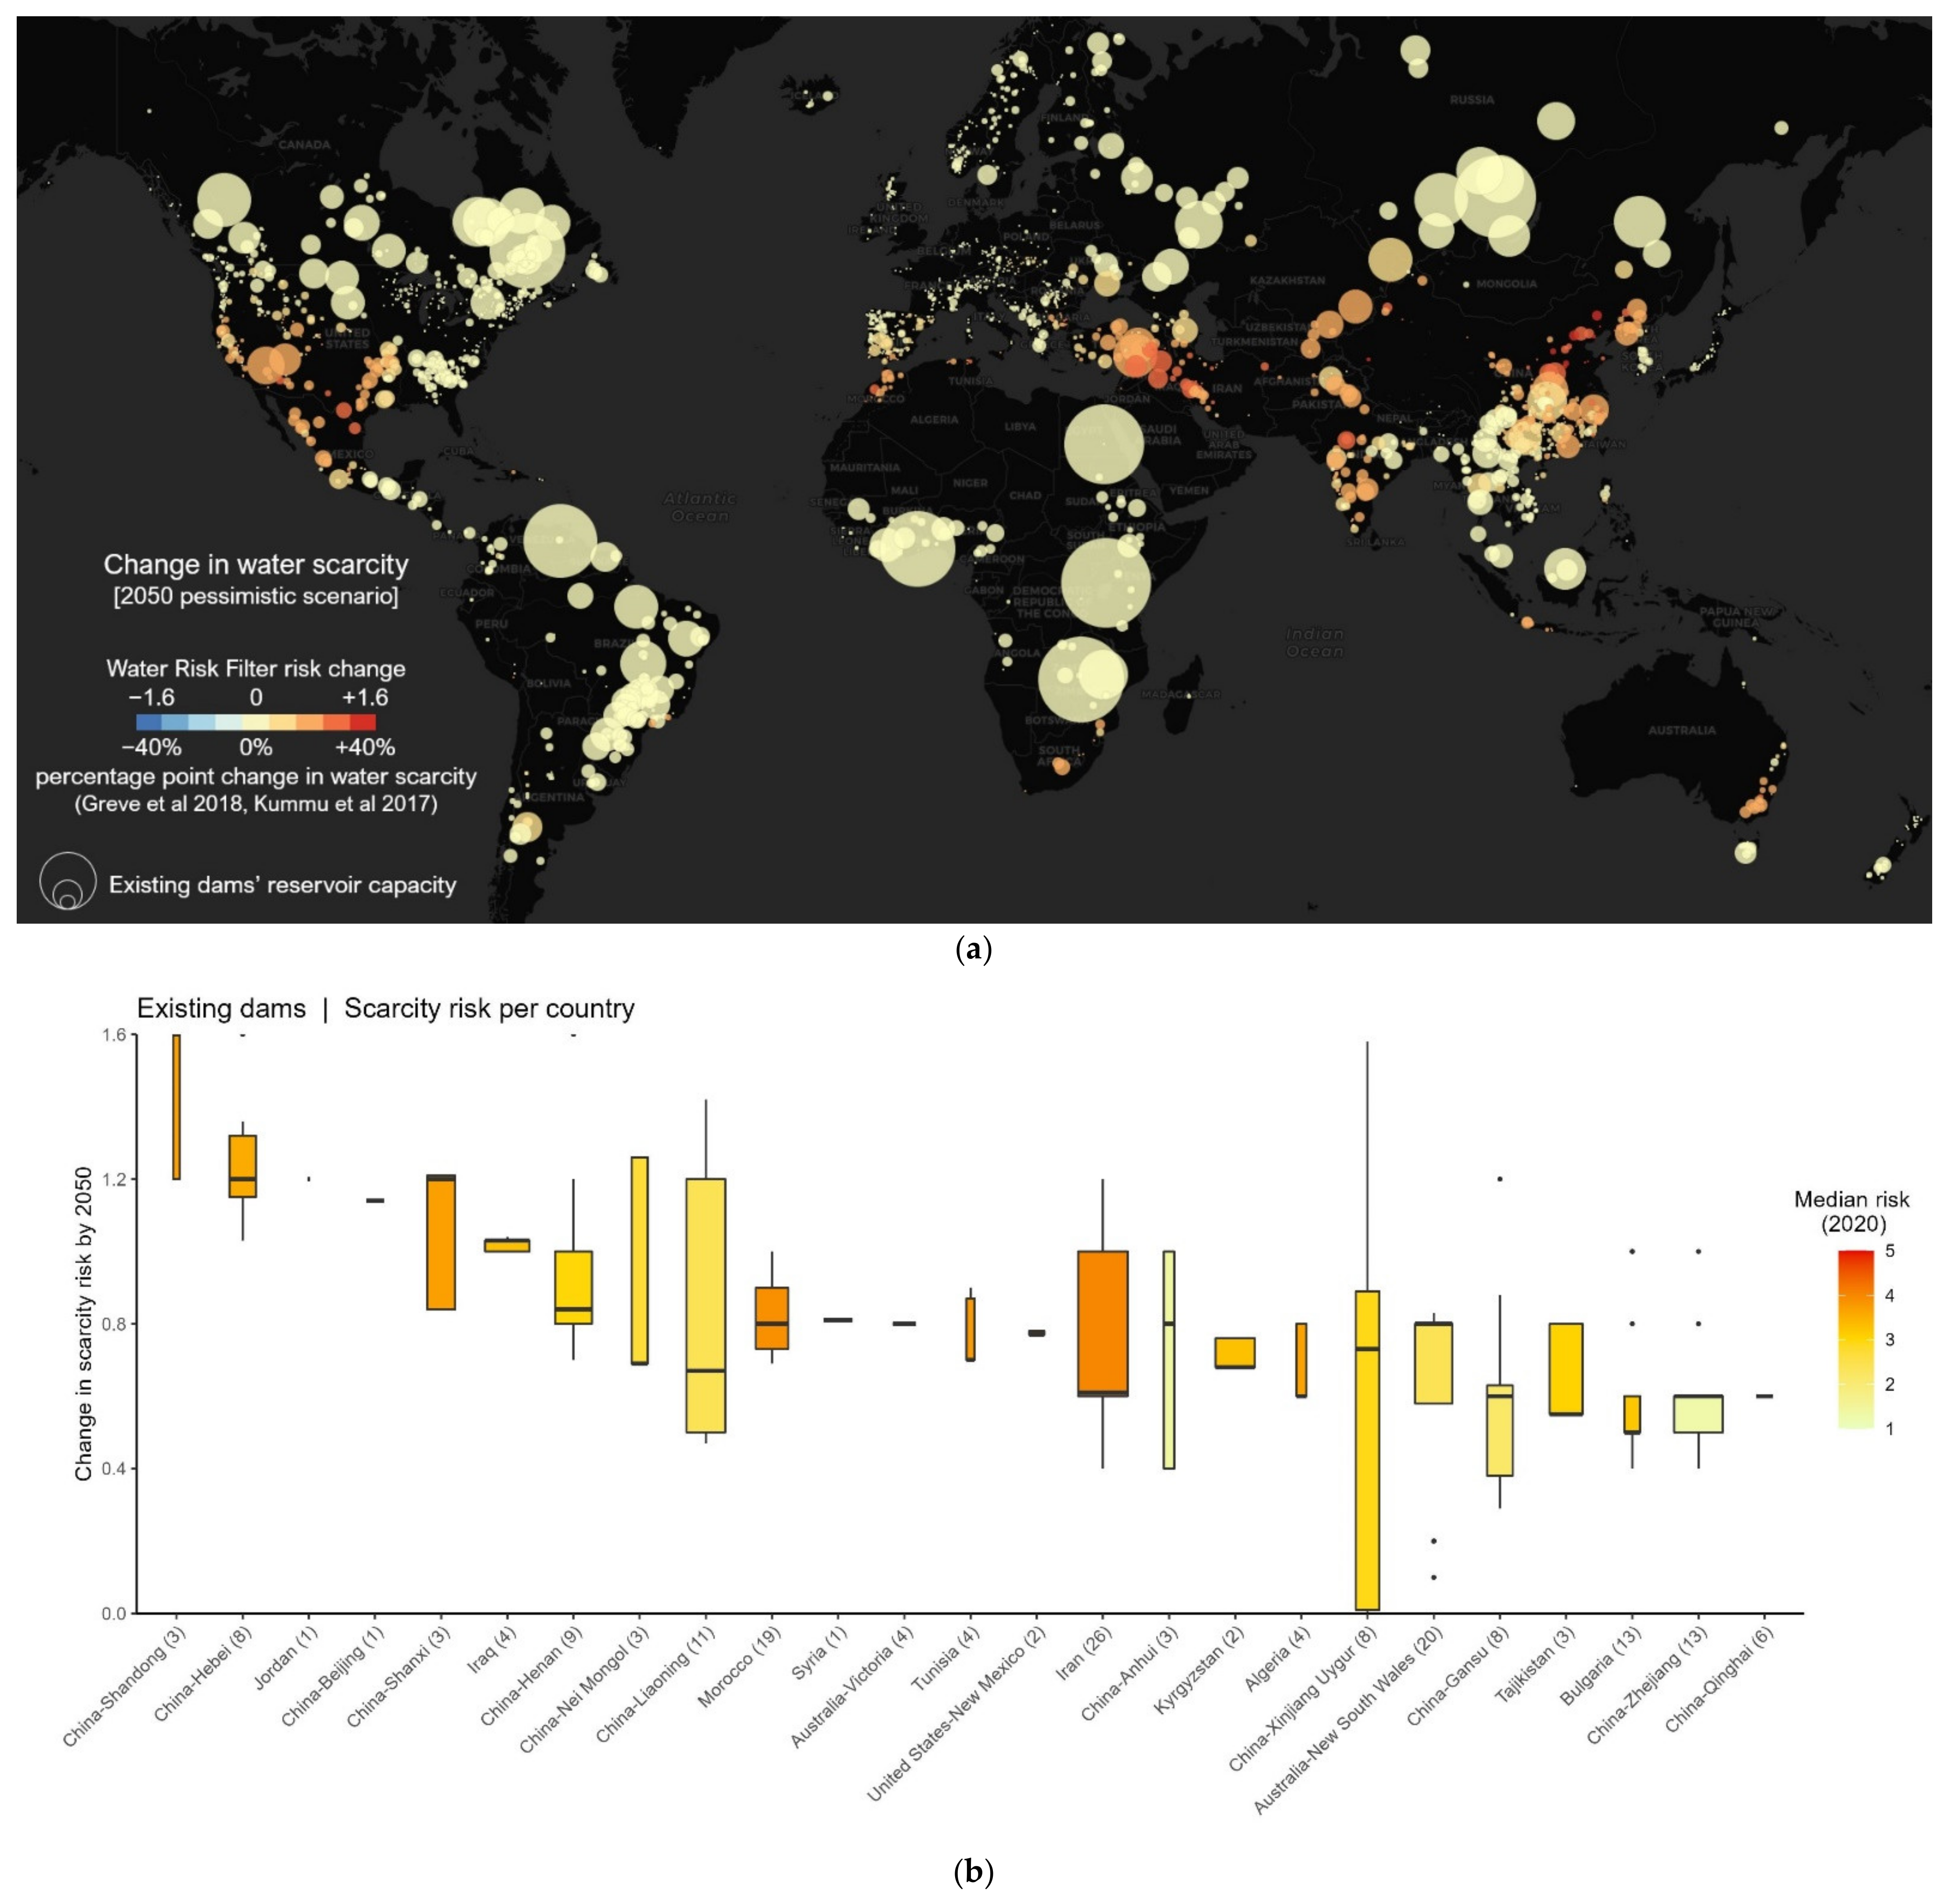
3.1. Existing Hydropower Dams and Changes in Water Scarcity Risk

Based on WRF data for 2020, 658 (26%) of existing hydropower dams are in basins with medium to very high scarcity risk. Little change is projected for the optimistic scenario by 2050 but increases are projected for the other two scenarios with 812 dams (33%) in river basins with medium to high risk in the pessimistic scenario (Figure 2). In the pessimistic scenario, 806 dams (32%) will be in basins projected to have increases in scarcity risk, of which 178 dams (7%) will be in basins changing from medium to high risk, and 168 dams (7%) will be in basins changing from high/very high to very high/extreme risk. The proportion of dams in the highest risk class is forecast to quadruple from 2% today to 8% in 2050 in the pessimistic scenario (Figure 3a).
The countries with existing hydropower dams in basins expected to experience the greatest increase in scarcity risk under the pessimistic scenario are China (especially in the provinces Shandong, Hebei, Beijing, Shanxi, and Henan), Jordan (Al Wedha dam), Iraq, Morocco, Syria (Tabqa dam), and Australia-Victoria. The countries with the greatest hydropower capacity within basins expected to increase in the risk of scarcity include China (especially in the provinces Hubei, Guangxi, Sichuan, Guizhou, Zhejiang, Hunan, Jilin, Liaoning, Henan, Guangdong, Jiangxi), the USA (especially in the states of Montana, Nevada, Texas, Arizona, California, Arkansas, and Oklahoma), as well as India, Turkey, Mexico, Kazakhstan (Bukhtarma dam and Kapchagay dam), Ukraine, and Spain (Figure 4).

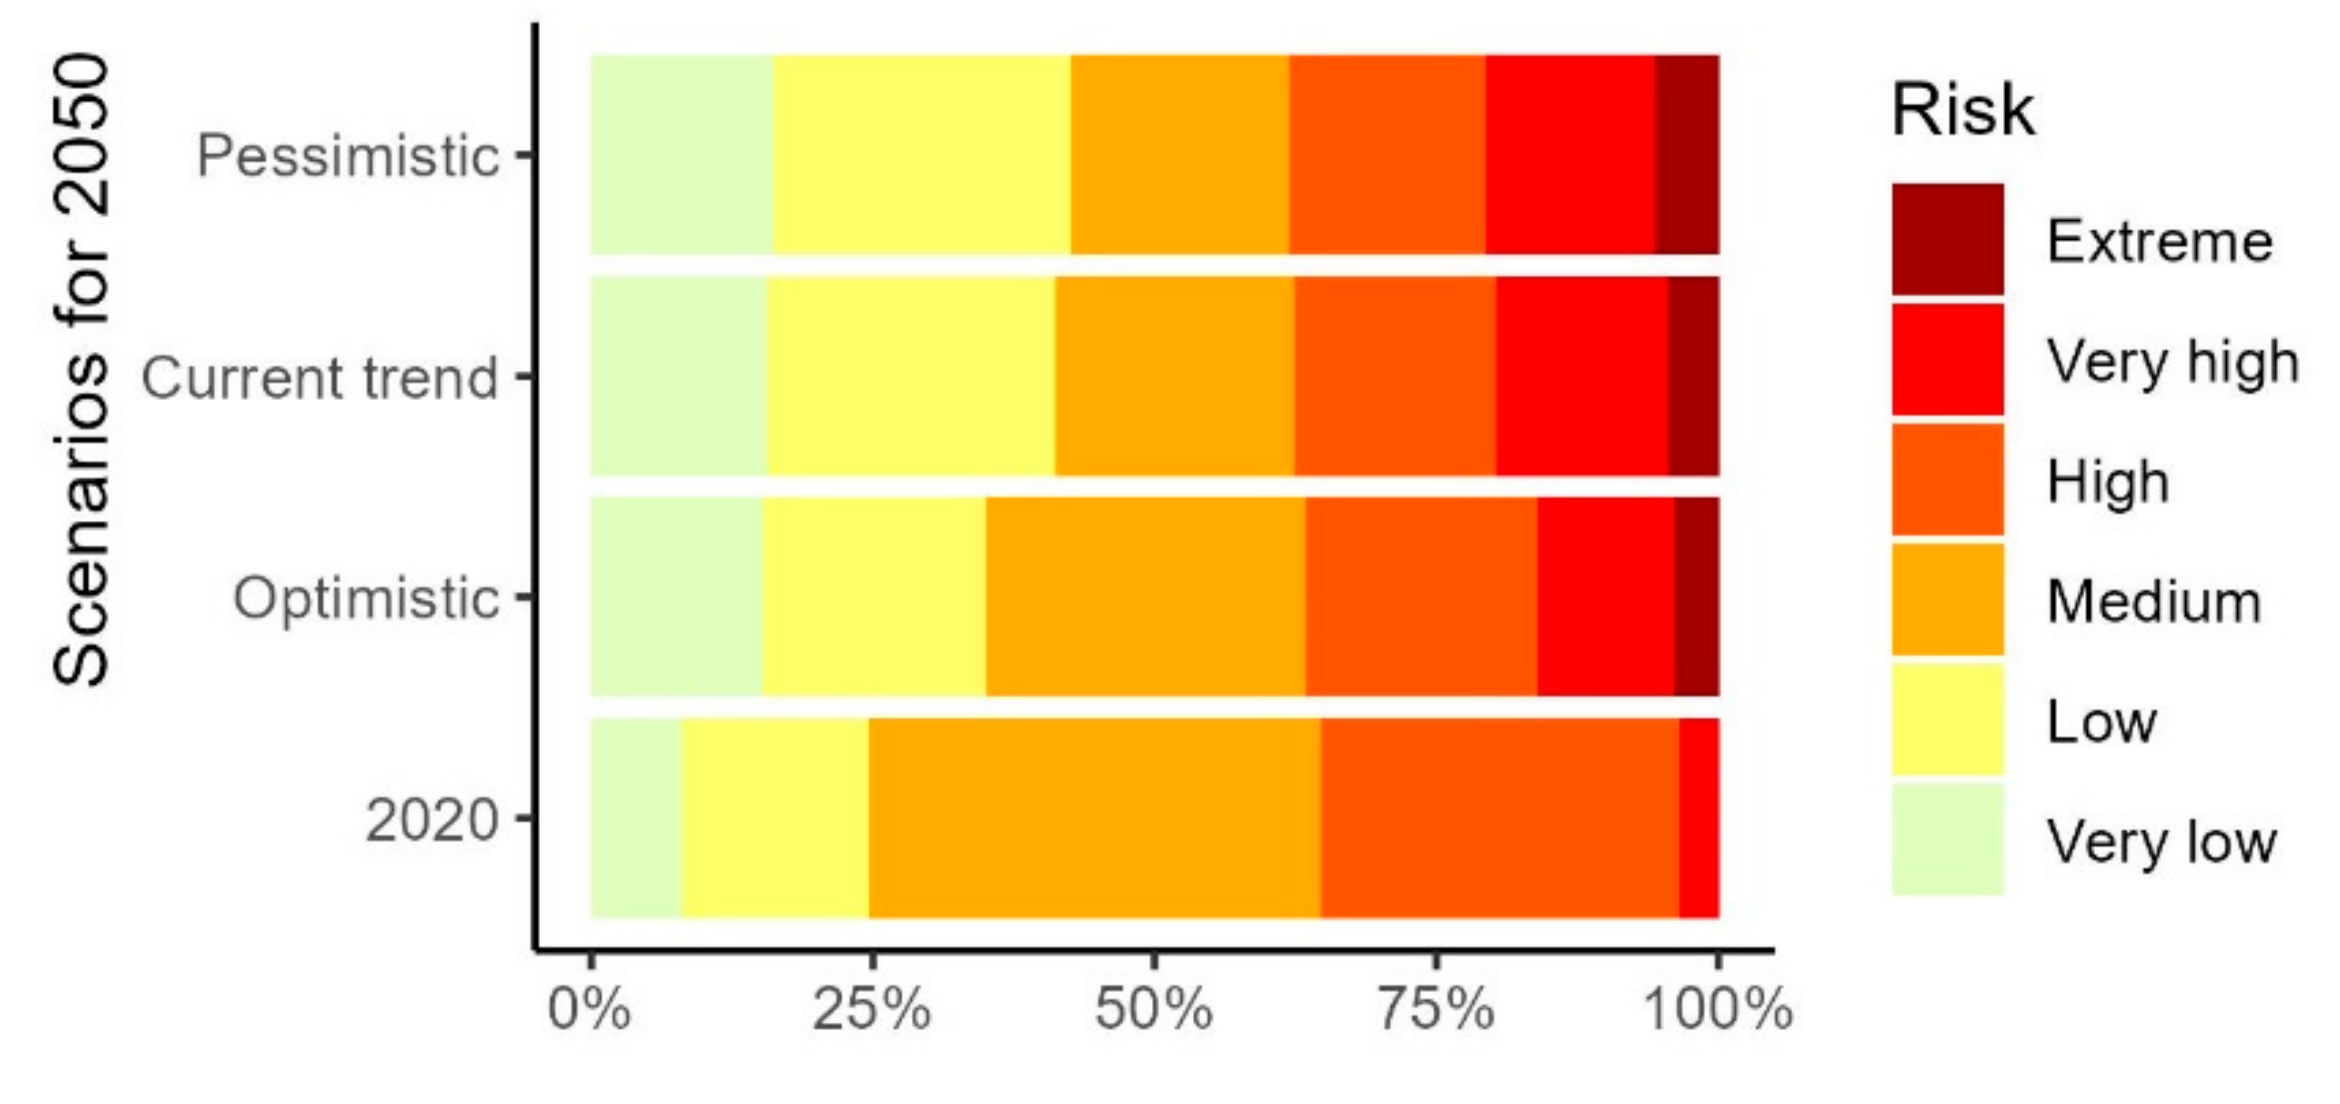
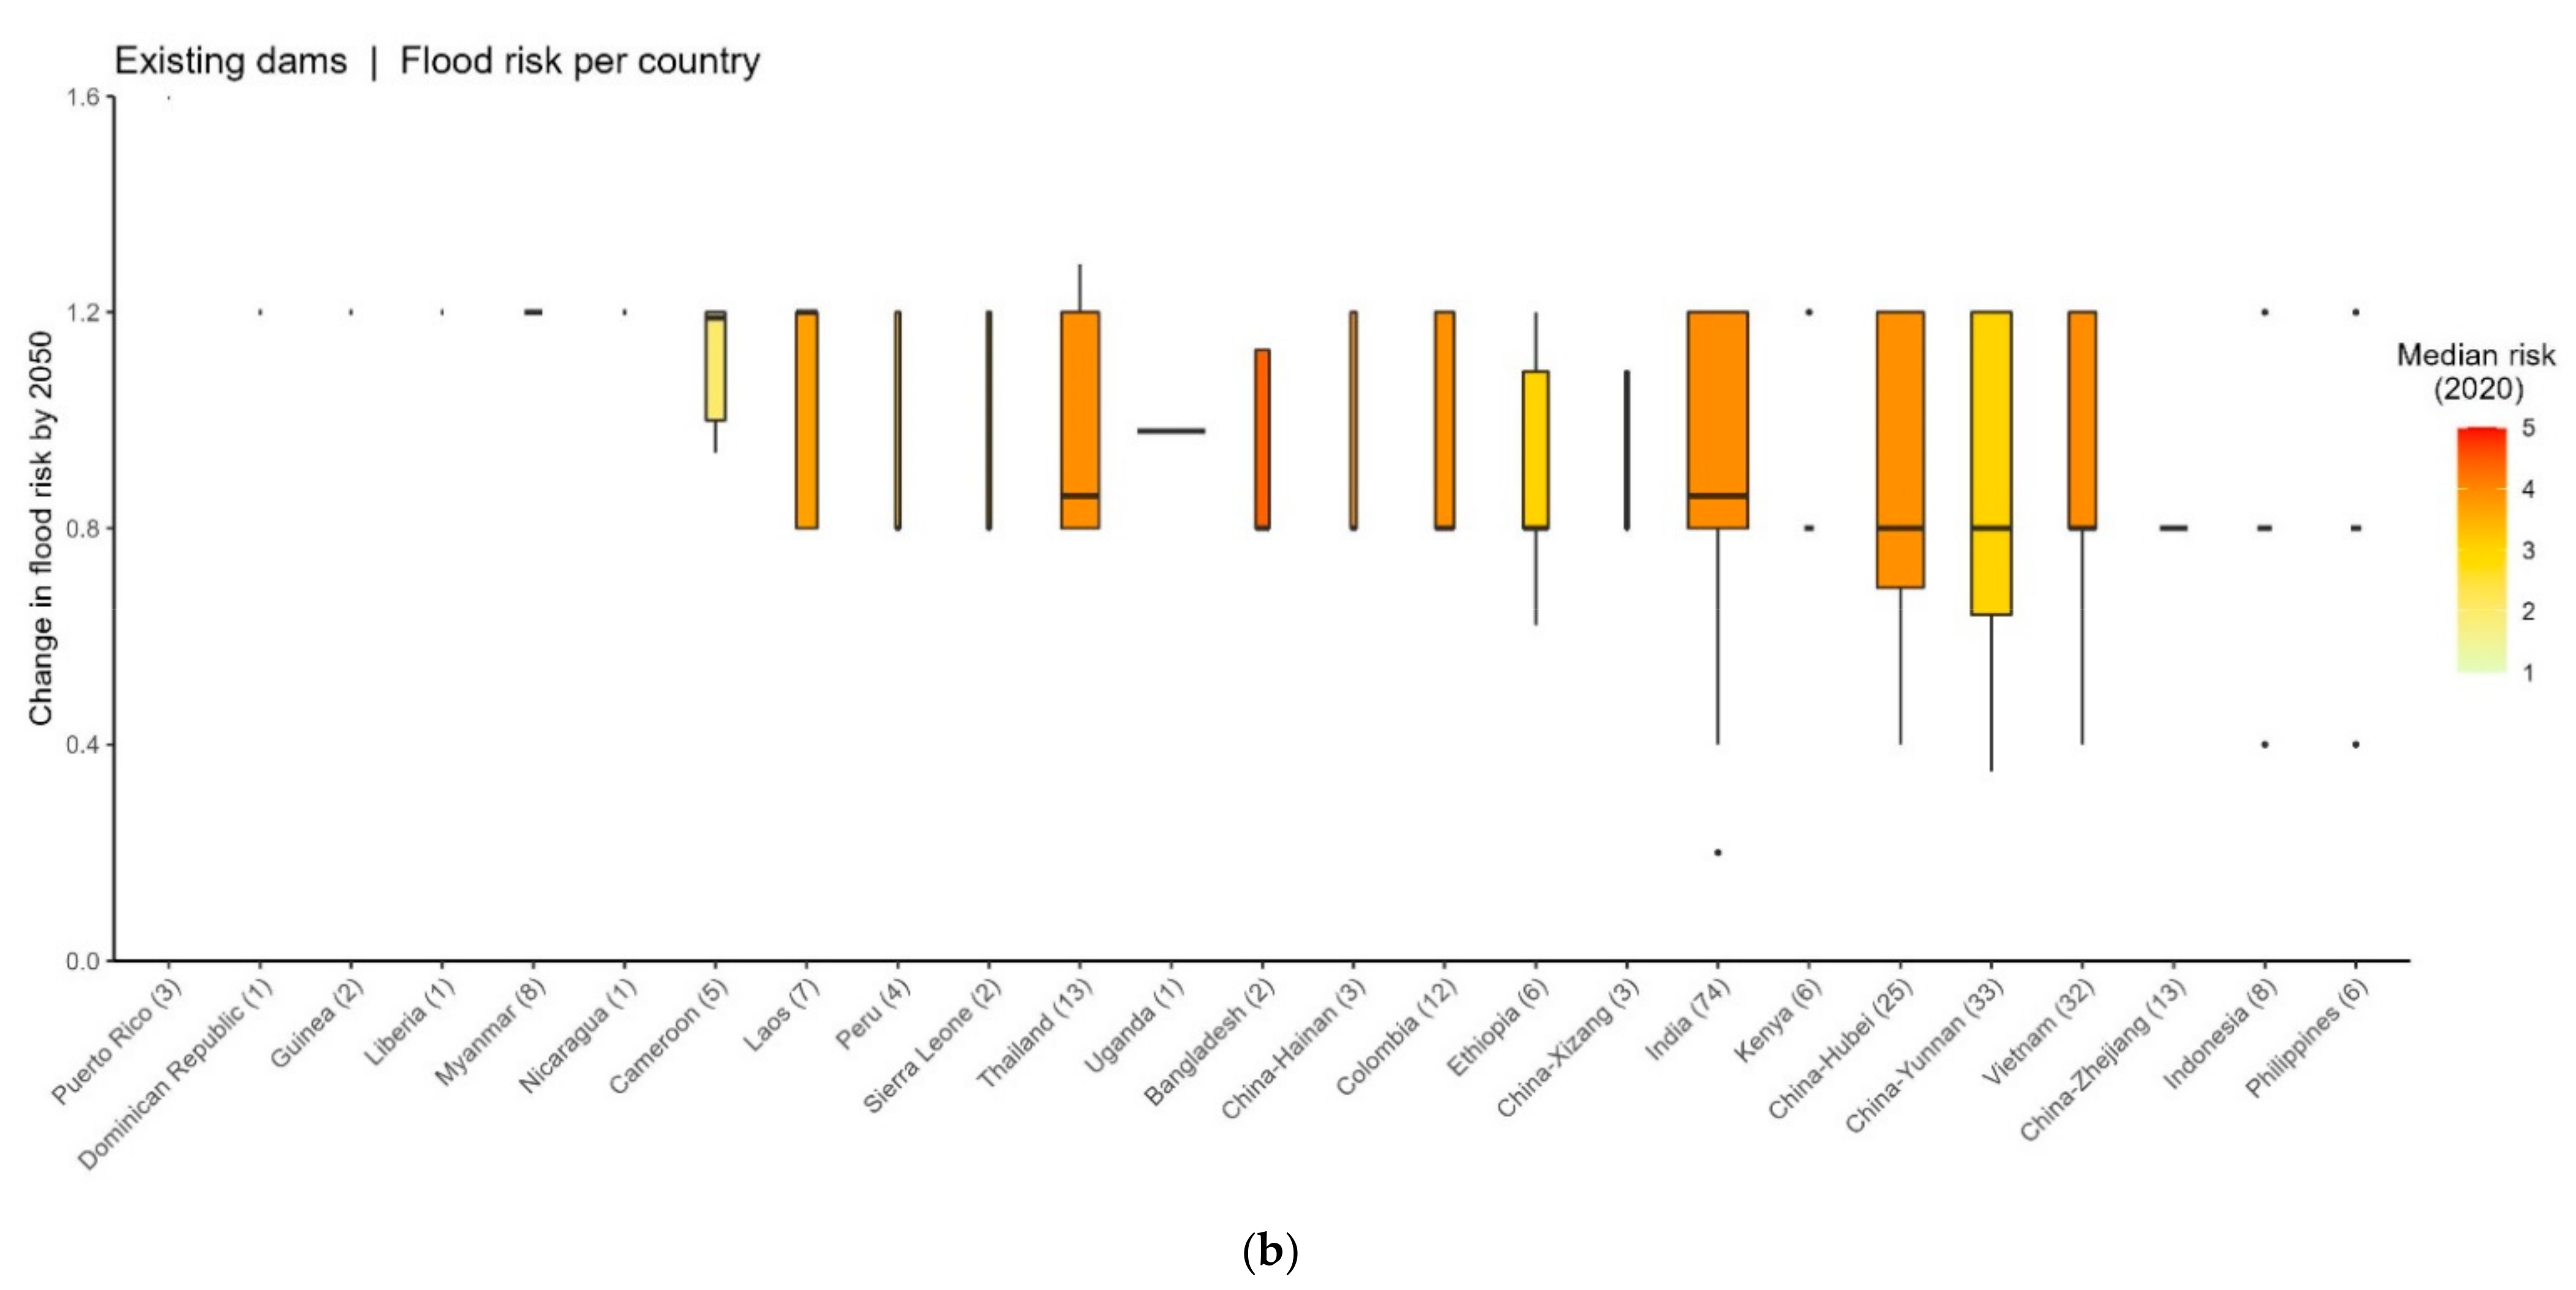
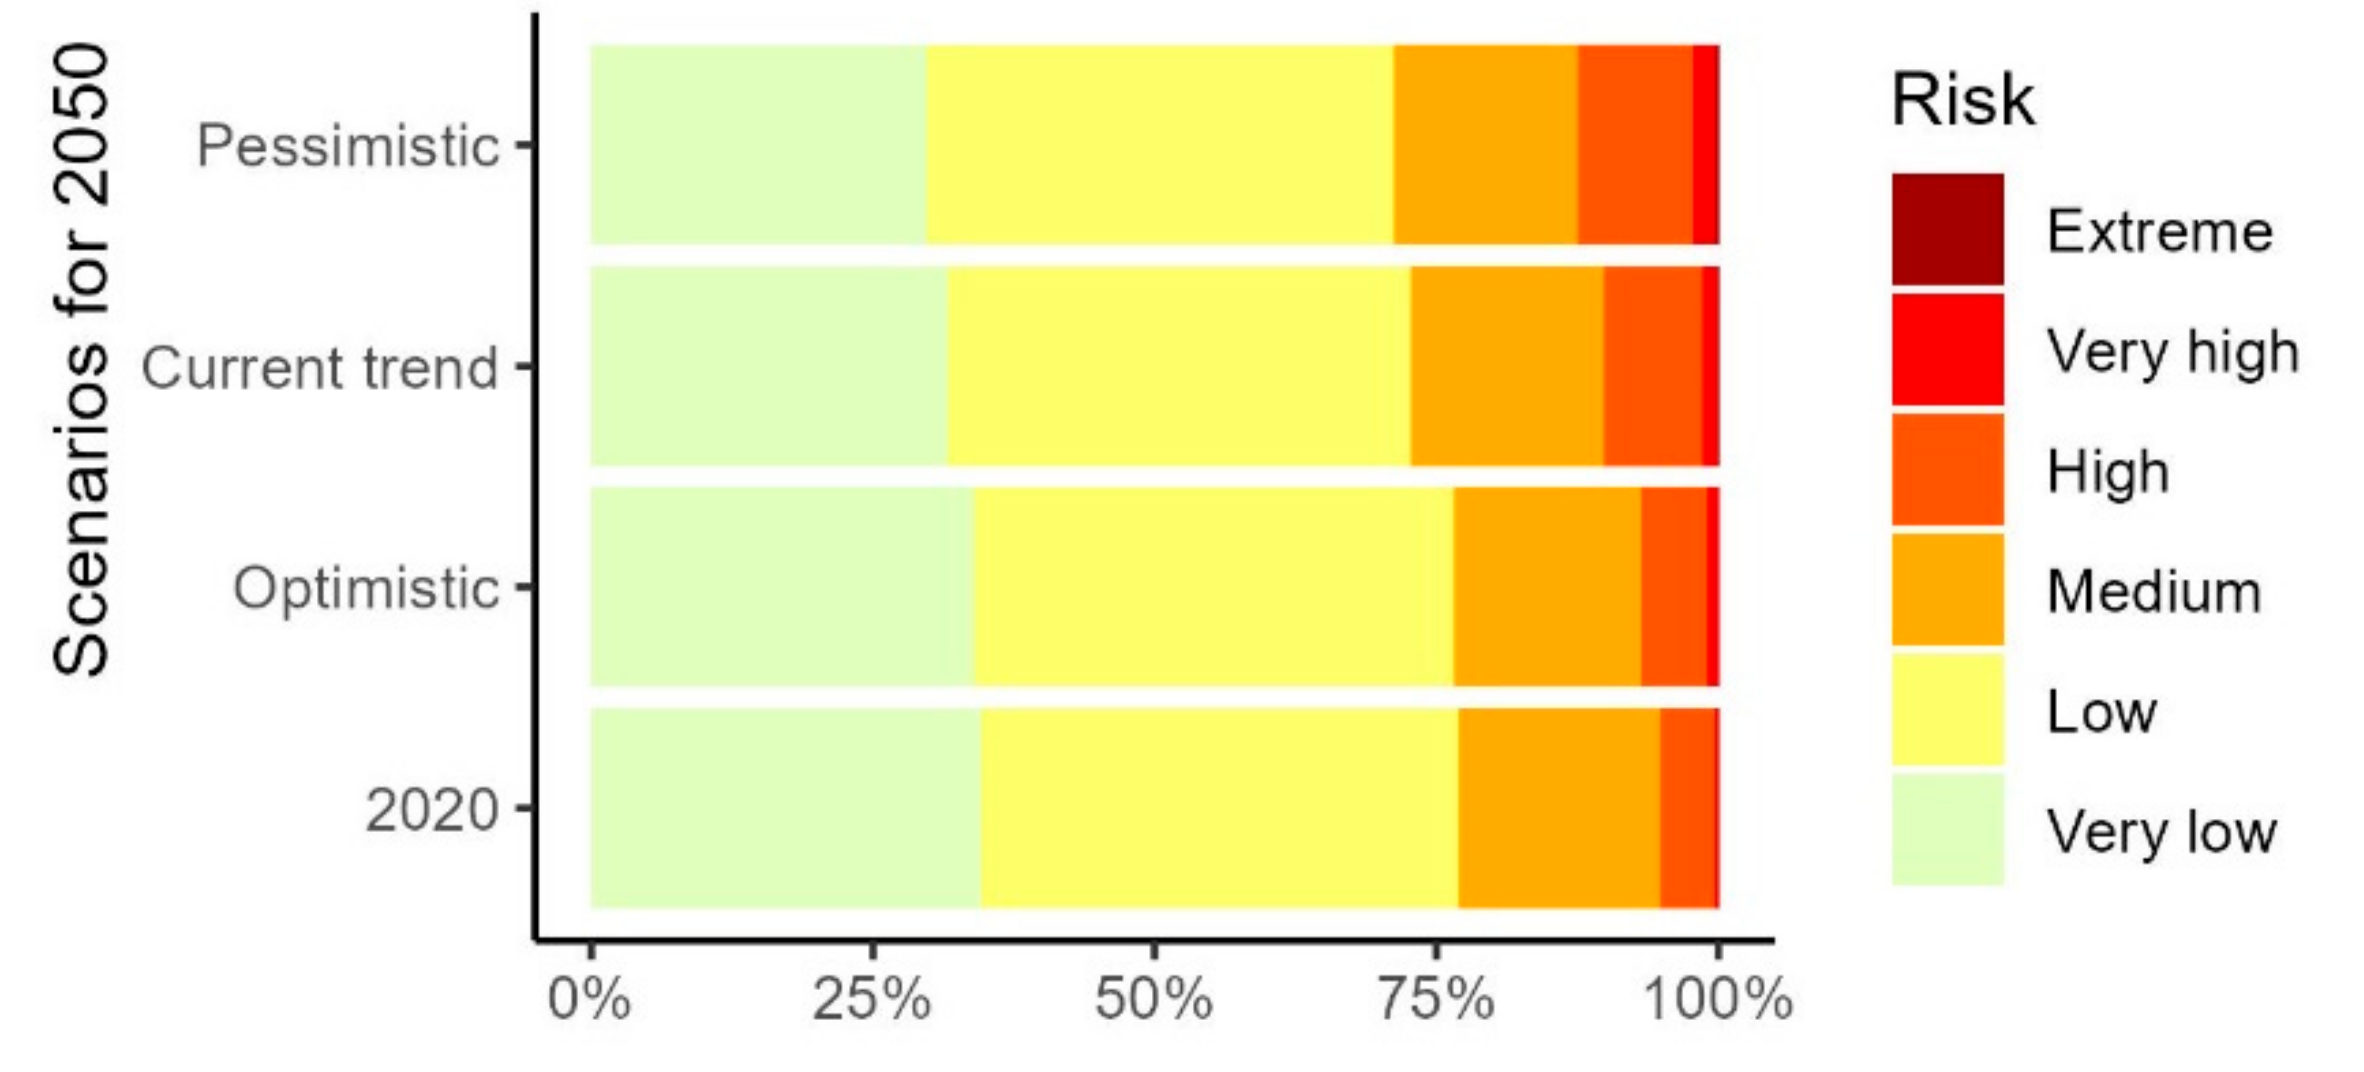
3.2. Existing Hydropower Dams and Changes in Flood Risk

Based on WRF data for 2020, 1877 (75%) of existing hydropower dams are exposed to a medium to very high flood risk. By 2050, this number is projected to decline in all three scenario pathways although the percentage of dams in basins with very high risk is projected to increase in all three scenarios (Figure 5). For example, under the pessimistic scenario, 1056 dams (42%) will be in basins projected to have decreases in flood risk, while 963 dams (39%) will be in basins with increases in flood risk. The proportion of dams currently in basins with very high risk is at 4% but in both the current trend and pessimistic scenario the proportion in very high or extreme risk will increase by a factor of five to approximately 20% (Figure 3c).
The countries with existing hydropower dams expected to experience the greatest increase in flood risk are Myanmar, Cameroon, Laos, Thailand, Uganda, Bangladesh, Colombia, China (especially in the provinces Hainan, Xizang, Hubei, and Yunnan), Ethiopia, India, Kenya, Vietnam, as well as small dams in Puerto Rico, Nicaragua, Dominican Republic, Guinea, and Liberia. The countries with the highest hydropower capacity with hydropower dams projected to have increased risk of flooding include Canada-Quebéc, Uganda, Russia-Krasnoyarsk, Zambia (especially the Kariba dam), Egypt (High Aswan dam), Ghana (especially the Akosombo Main dam), Venezuela (Guri dam), and a numerous dams in India, China (especially in the provinces Hubei, Yunnan, Guangxi, Sichuan, and Guizhou), Brazil (especially in the states of Goiás, Minas Gerais, and São Paulo), and Mexico (Figure 6).

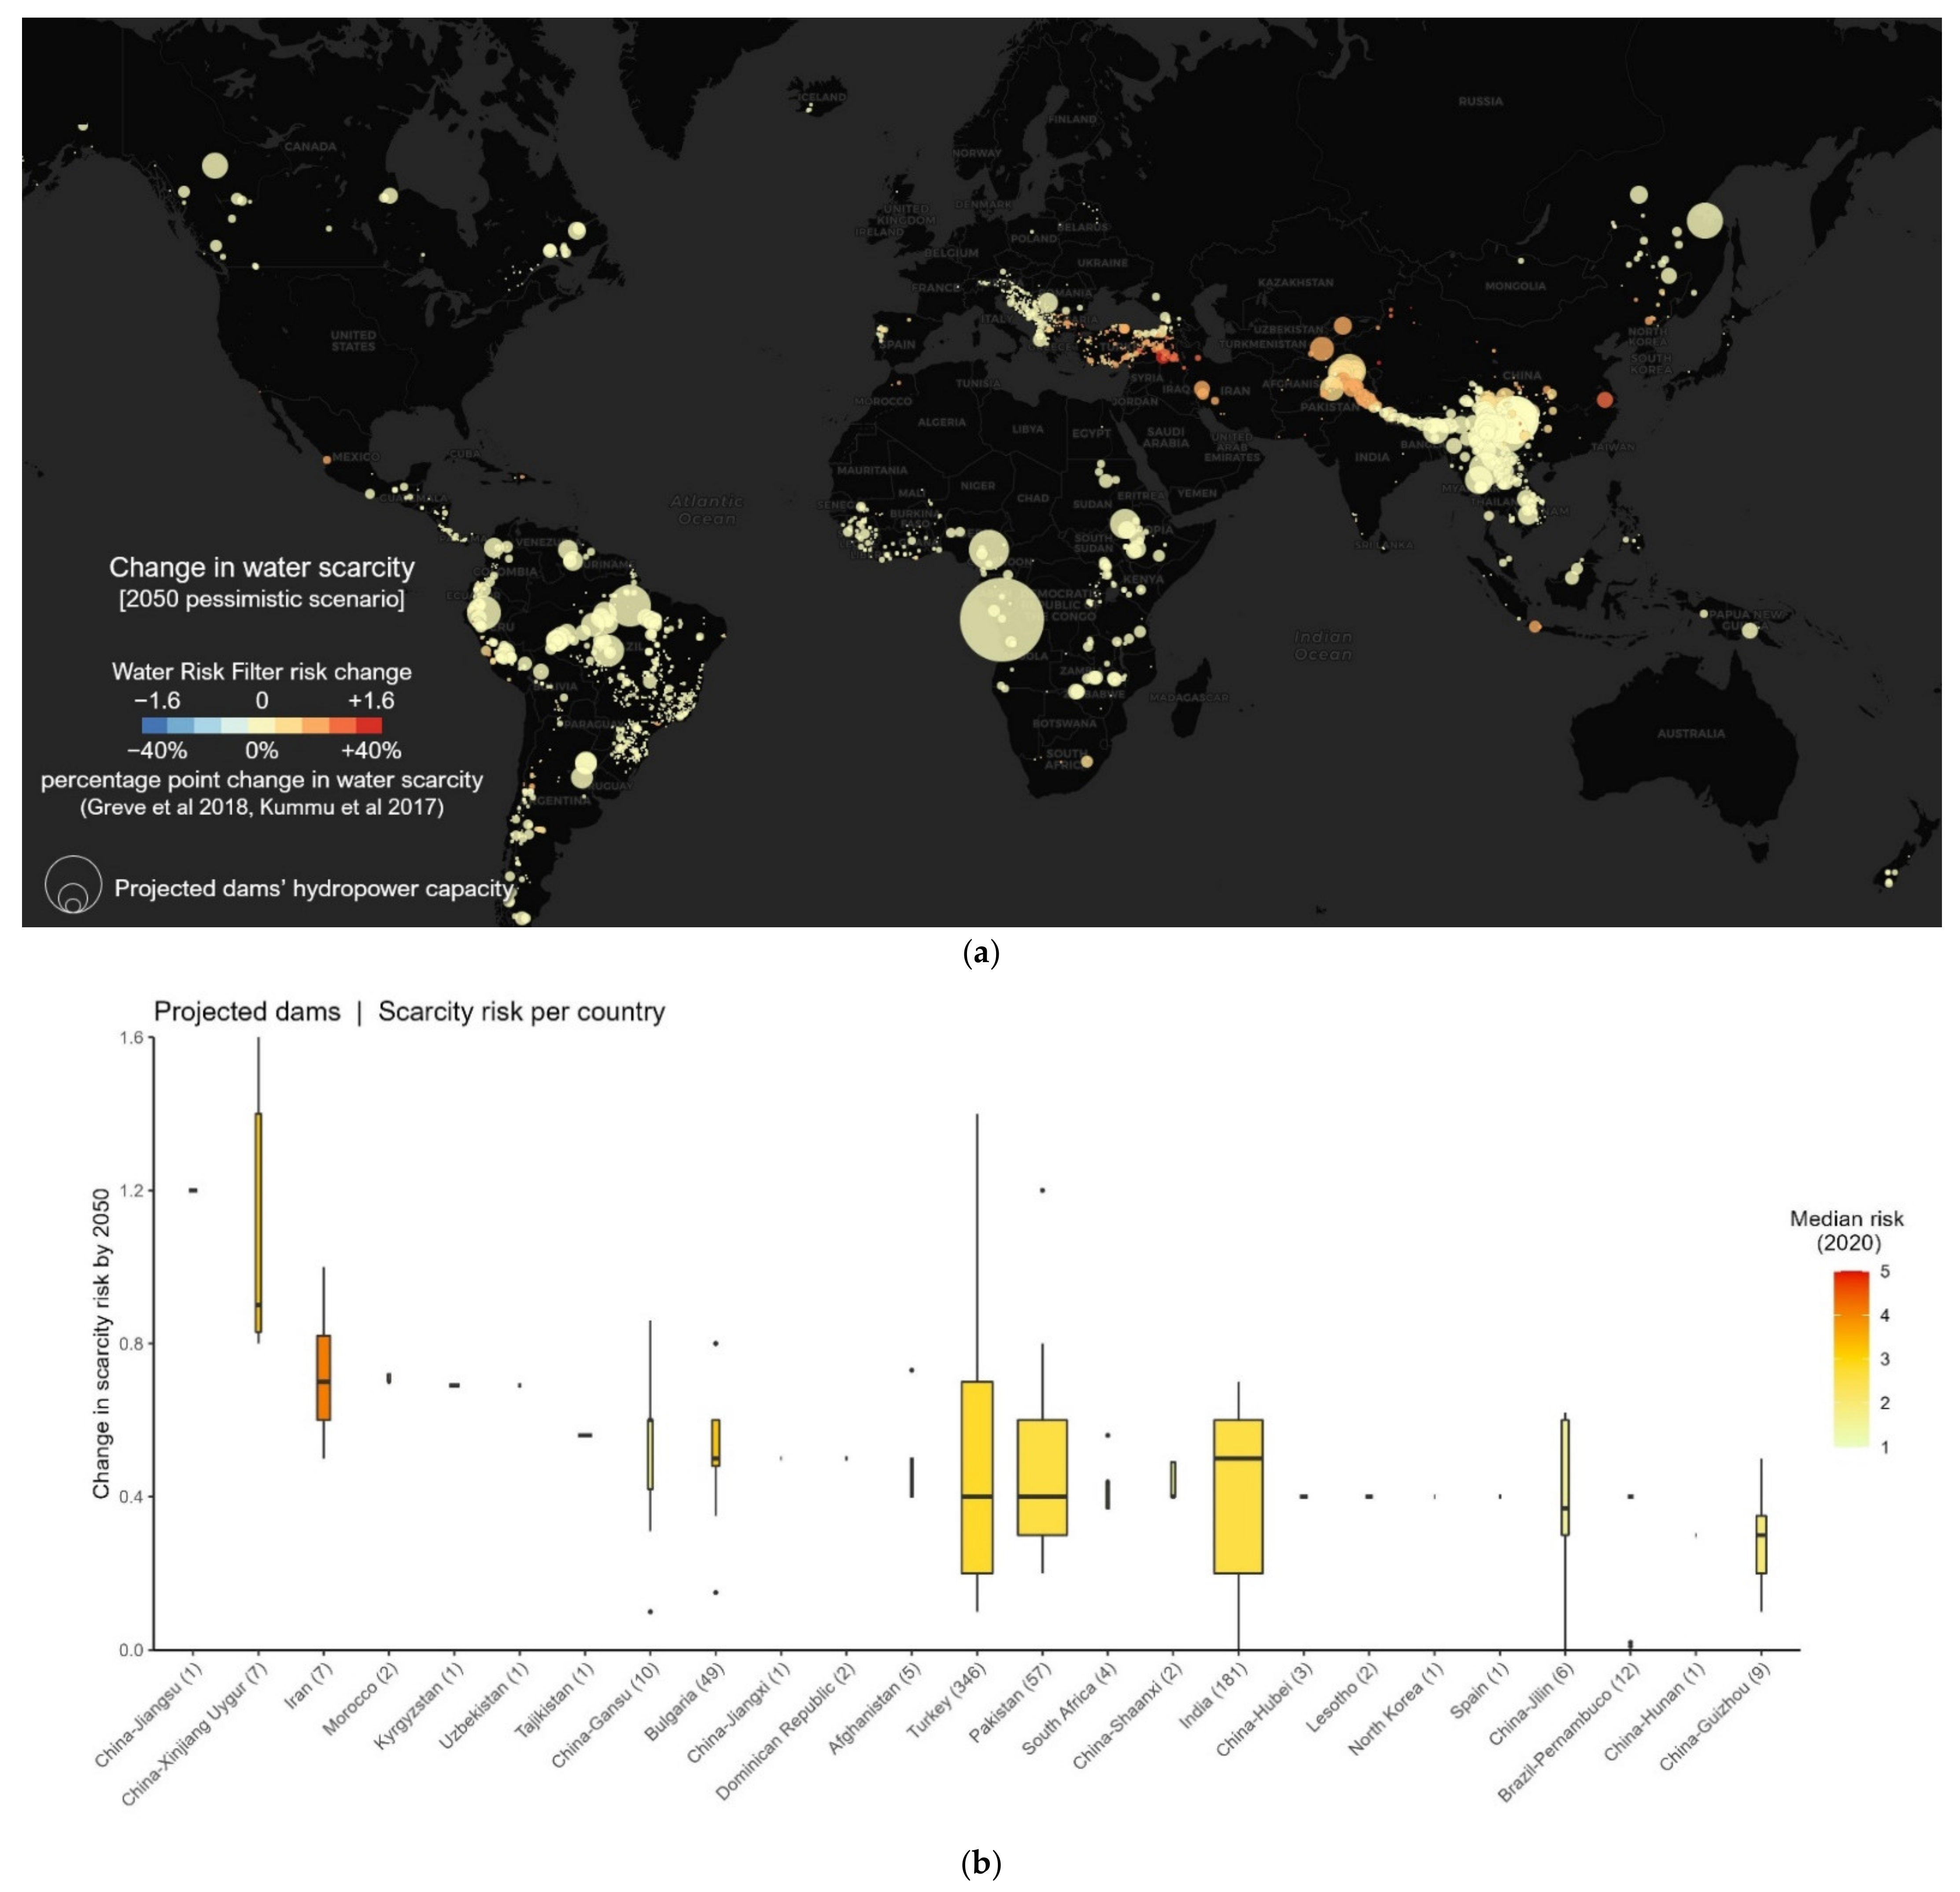
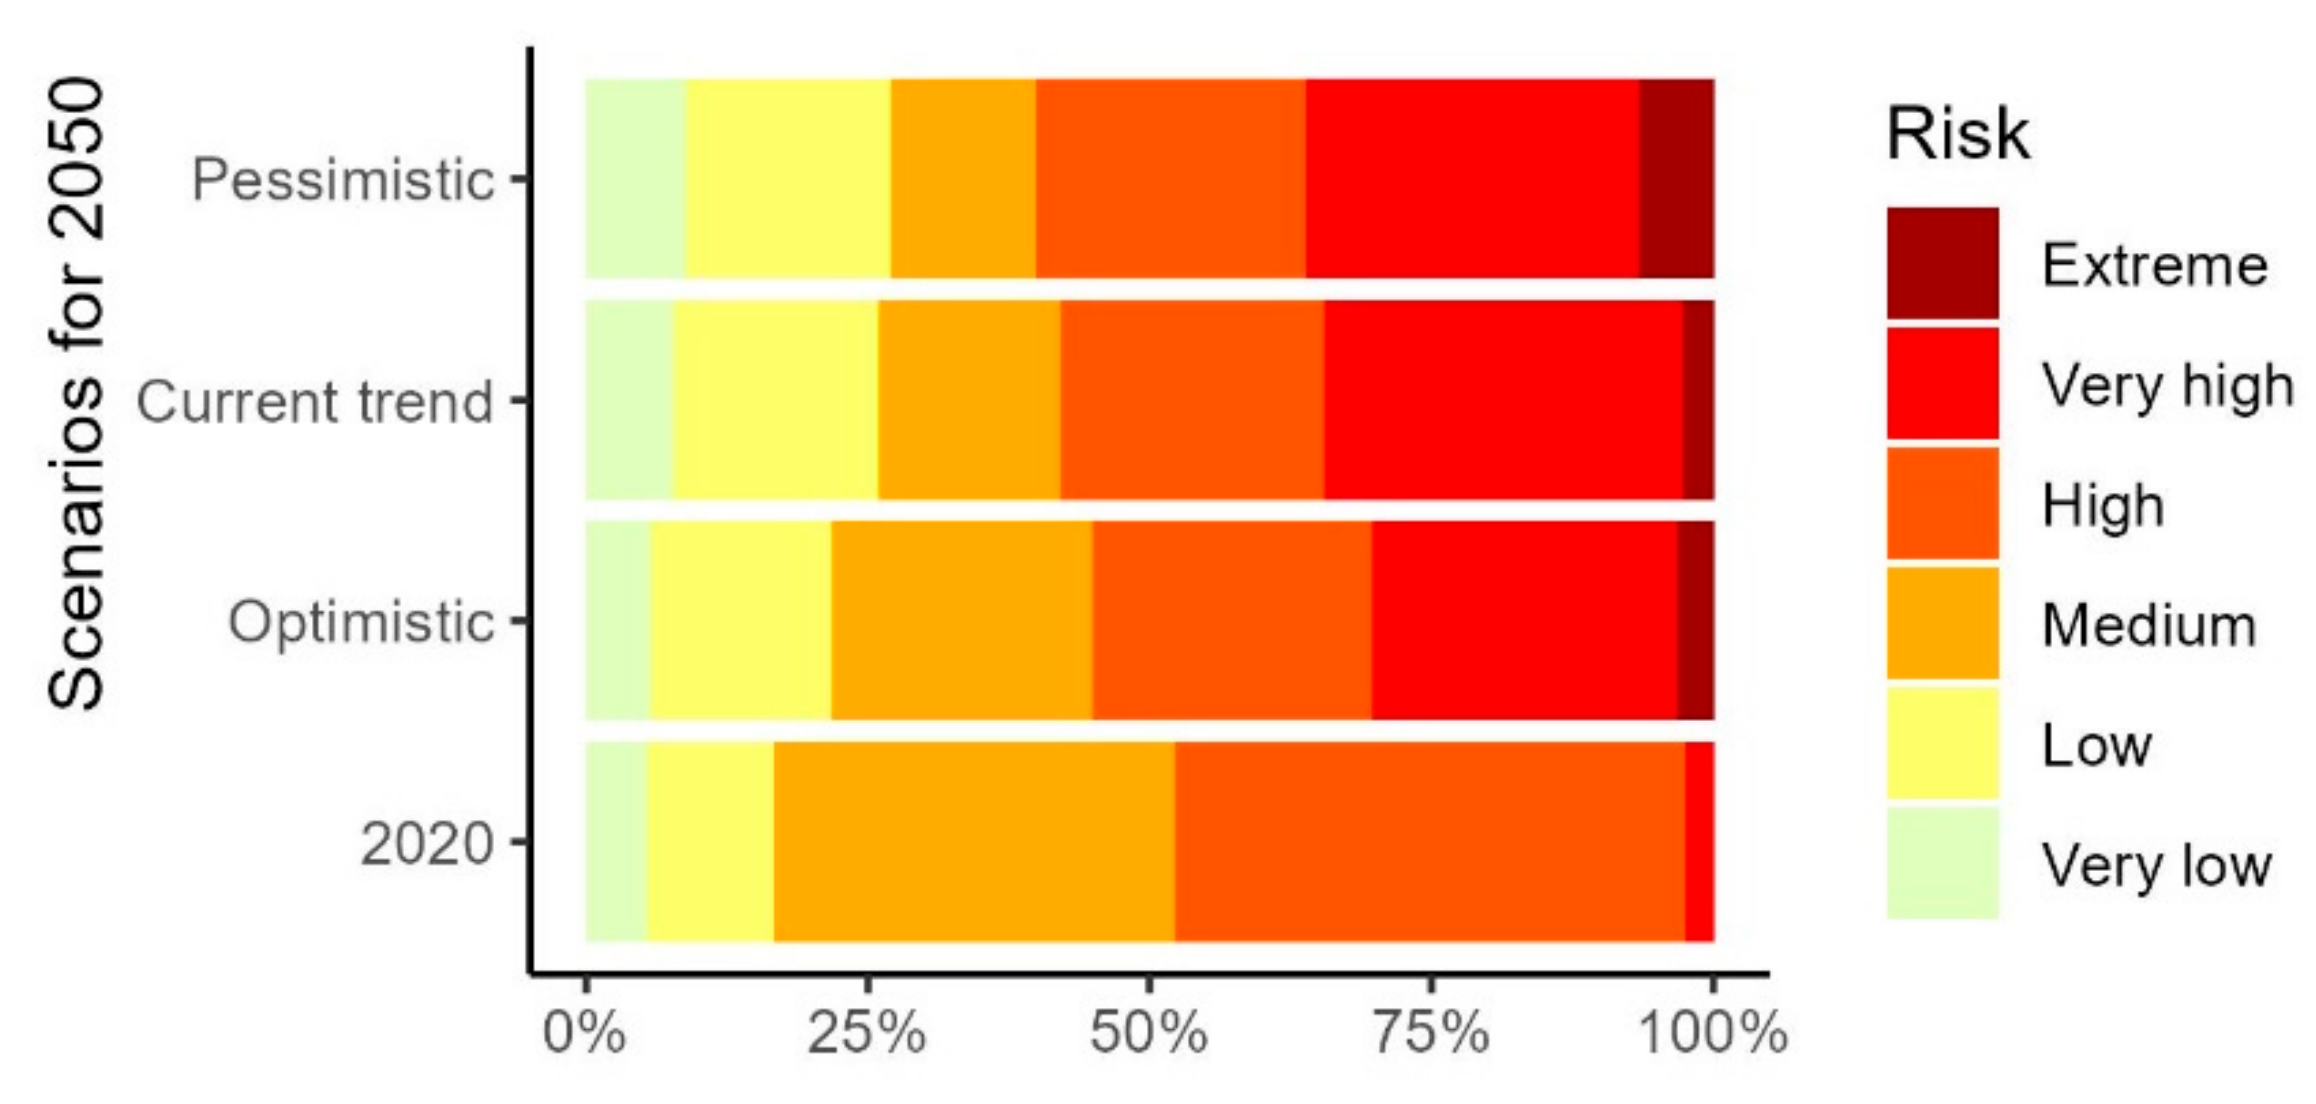
3.3. Projected Dams and Changes in Water Scarcity Risk

Based on WRF data for 2020, 852 (23%) of projected dams are planned in basins that currently have medium to very high scarcity risk. By 2050, this number is essentially unchanged for the optimistic scenario but rises in the other two scenarios, with 1068 dams (29%) in the pessimistic scenario in basins with medium to very high scarcity risk (Figure 7). The majority of projected hydropower dams (71%) are located in basins that have very low or low risk today and are projected to keep the same risk class by 2050, while a total of 730 dams (20%) are planned for basins projected to have a higher risk for water scarcity in 2050 than today (Figure 3b).
The countries with projected hydropower projects planned in basins expected to experience the greatest increase in water scarcity risk are China (especially in the provinces Jiangsu, Xinjiang Uygur, Gansu, Jiangxi, and Shaanxi), Iran, Morocco (M’Dèz-El Menzel project and Ouljet E soltane project), Kyrgyzstan (Kambaratinsk project), Uzbekistan (Tupolang project), Tajikistan (Rogun project), and numerous projects in Bulgaria, Turkey, Pakistan, and India. The countries with the greatest aggregate capacity of projected hydropower dams planned in basins that are predicted to face increased scarcity risk include Pakistan, India, Turkey, China (especially in the provinces Sichuan, Chongqing, Guizhou, Jiangsu, Heilongjiang, and Hubei) as well as Nepal, Tajikistan, and Iran. (Figure 8).

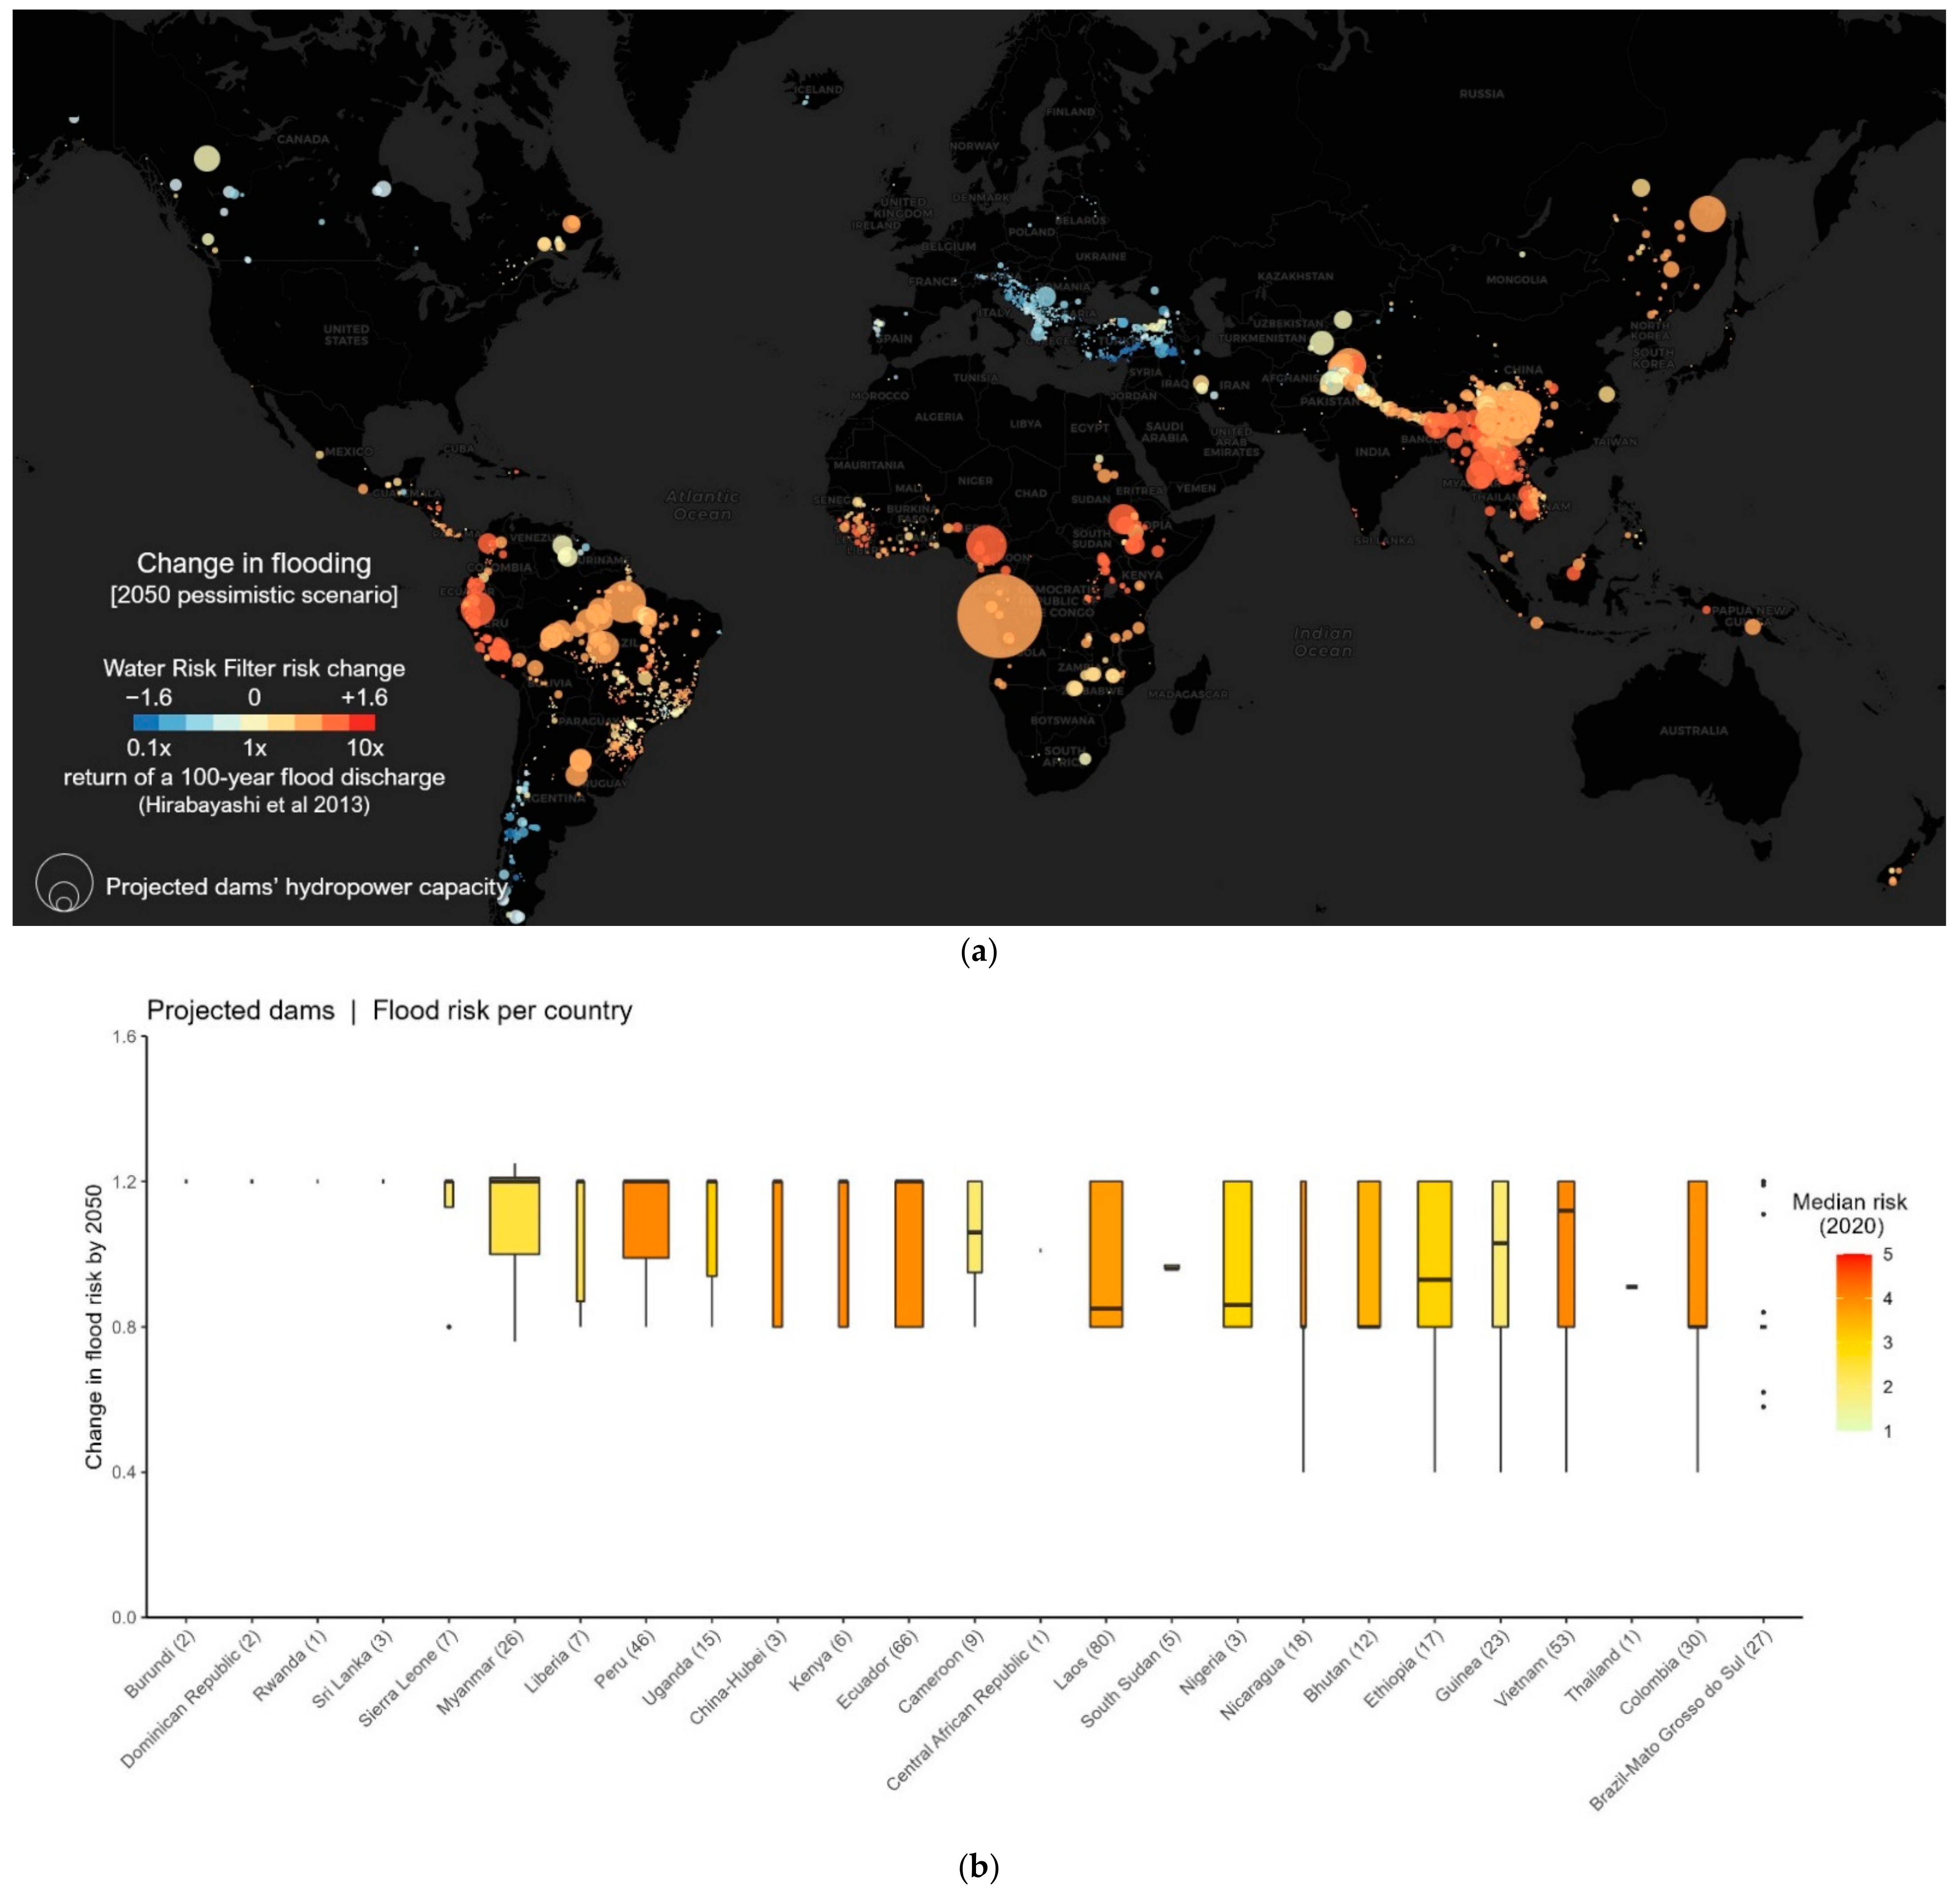
3.4. Projected Dams and Changes in Flood Risk

Based on WRF data for 2020, 3086 (83%) of projected dams are planned in basins with current flood risks that are medium to very high. By 2050, this number is projected to decline in all three scenario pathways (Figure 9). For example, under the pessimistic scenario, 2705 dams (73%) are planned for basins with medium to very high risk. Although 582 (18%) of projected hydropower dams are planned for regions in which flood risk will decrease from medium to low/very low, a total of 2315 (63%) of all projected hydropower projects are planned in regions projected to have increases in flood risk. While only 91 of the projected dams (2%) are planned in basins that currently have the highest risk level for flooding, nearly 20 times that number (1343 or 36% of all dams) are planned for basins that are forecast to have the highest risk level by 2050 in the pessimistic scenario (combining very high and extreme risk levels; Figure 3d).
The countries with projected hydropower projects planned in basins expected to experience the greatest increase in flood risk include Myanmar, Peru, China-Hubei, Kenya, Uganda, Ecuador, Cameroon, as well as many small projects in the Dominican Republic, Rwanda, Sri Lanka, Burundi, Sierra Leone, and Liberia. The countries with the greatest aggregate capacity of projected hydropower dams planned in regions projected to have increased flood risk include China (especially in the provinces Sichuan, Yunnan, and Xizang), the Democratic Republic of the Congo (as the Grand Inga project), India, Myanmar, Brazil (especially in the states of Pará, Mato Grosso, and Rondônia), Peru, Ethiopia, Nepal, Laos, Nigeria, Ecuador, as well as a great number of smaller projects in Brazil (especially in the states of Tocantins, Minas Gerais, Paraná, and Santa Catarina) (Figure 10).

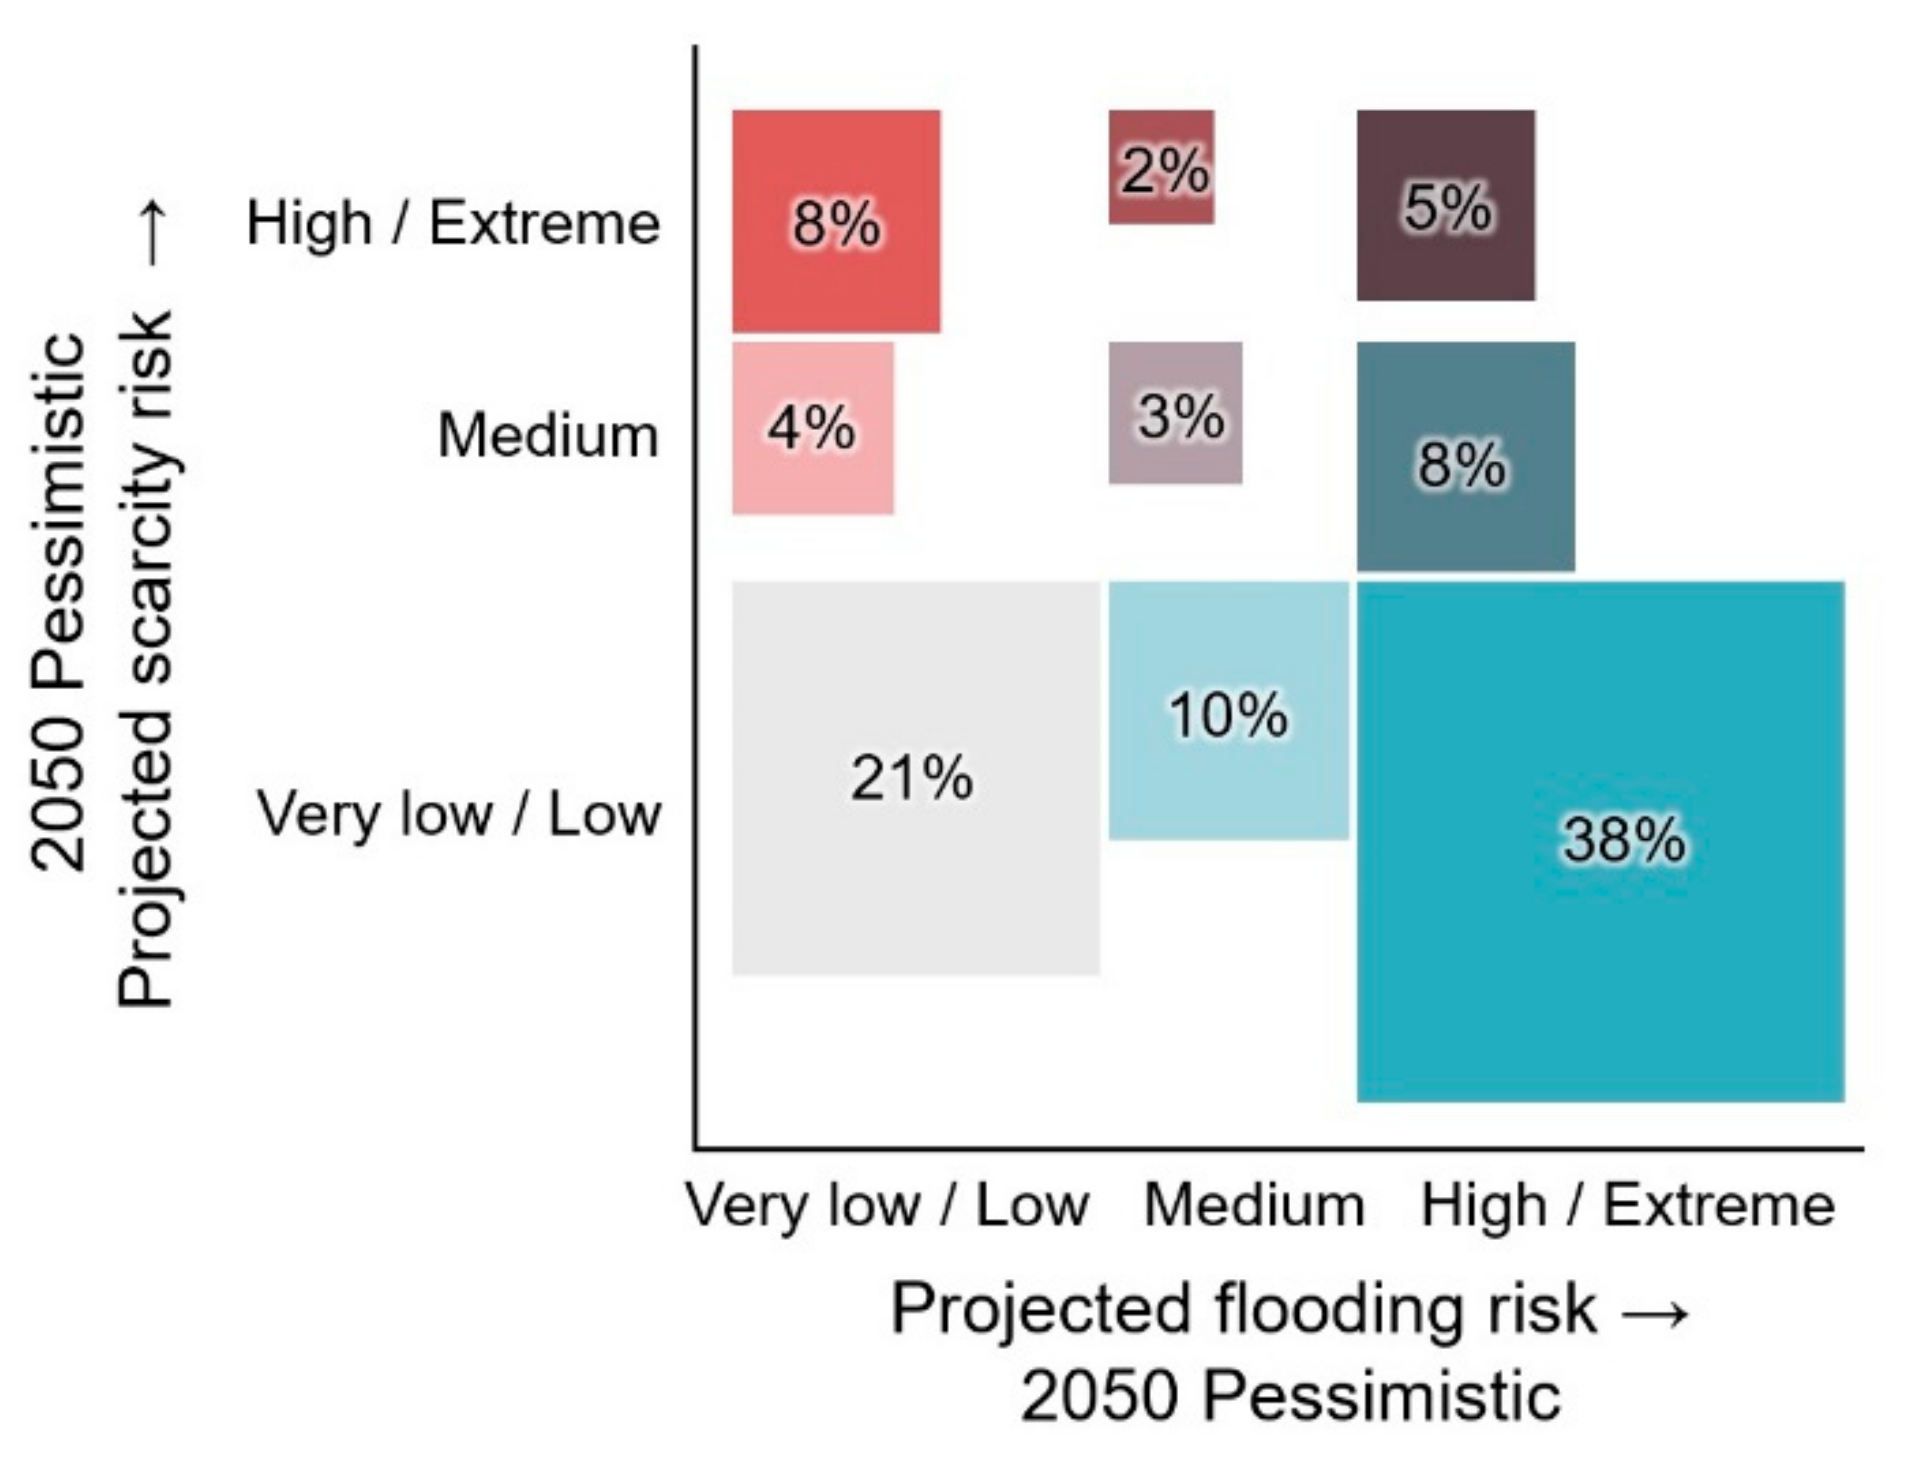
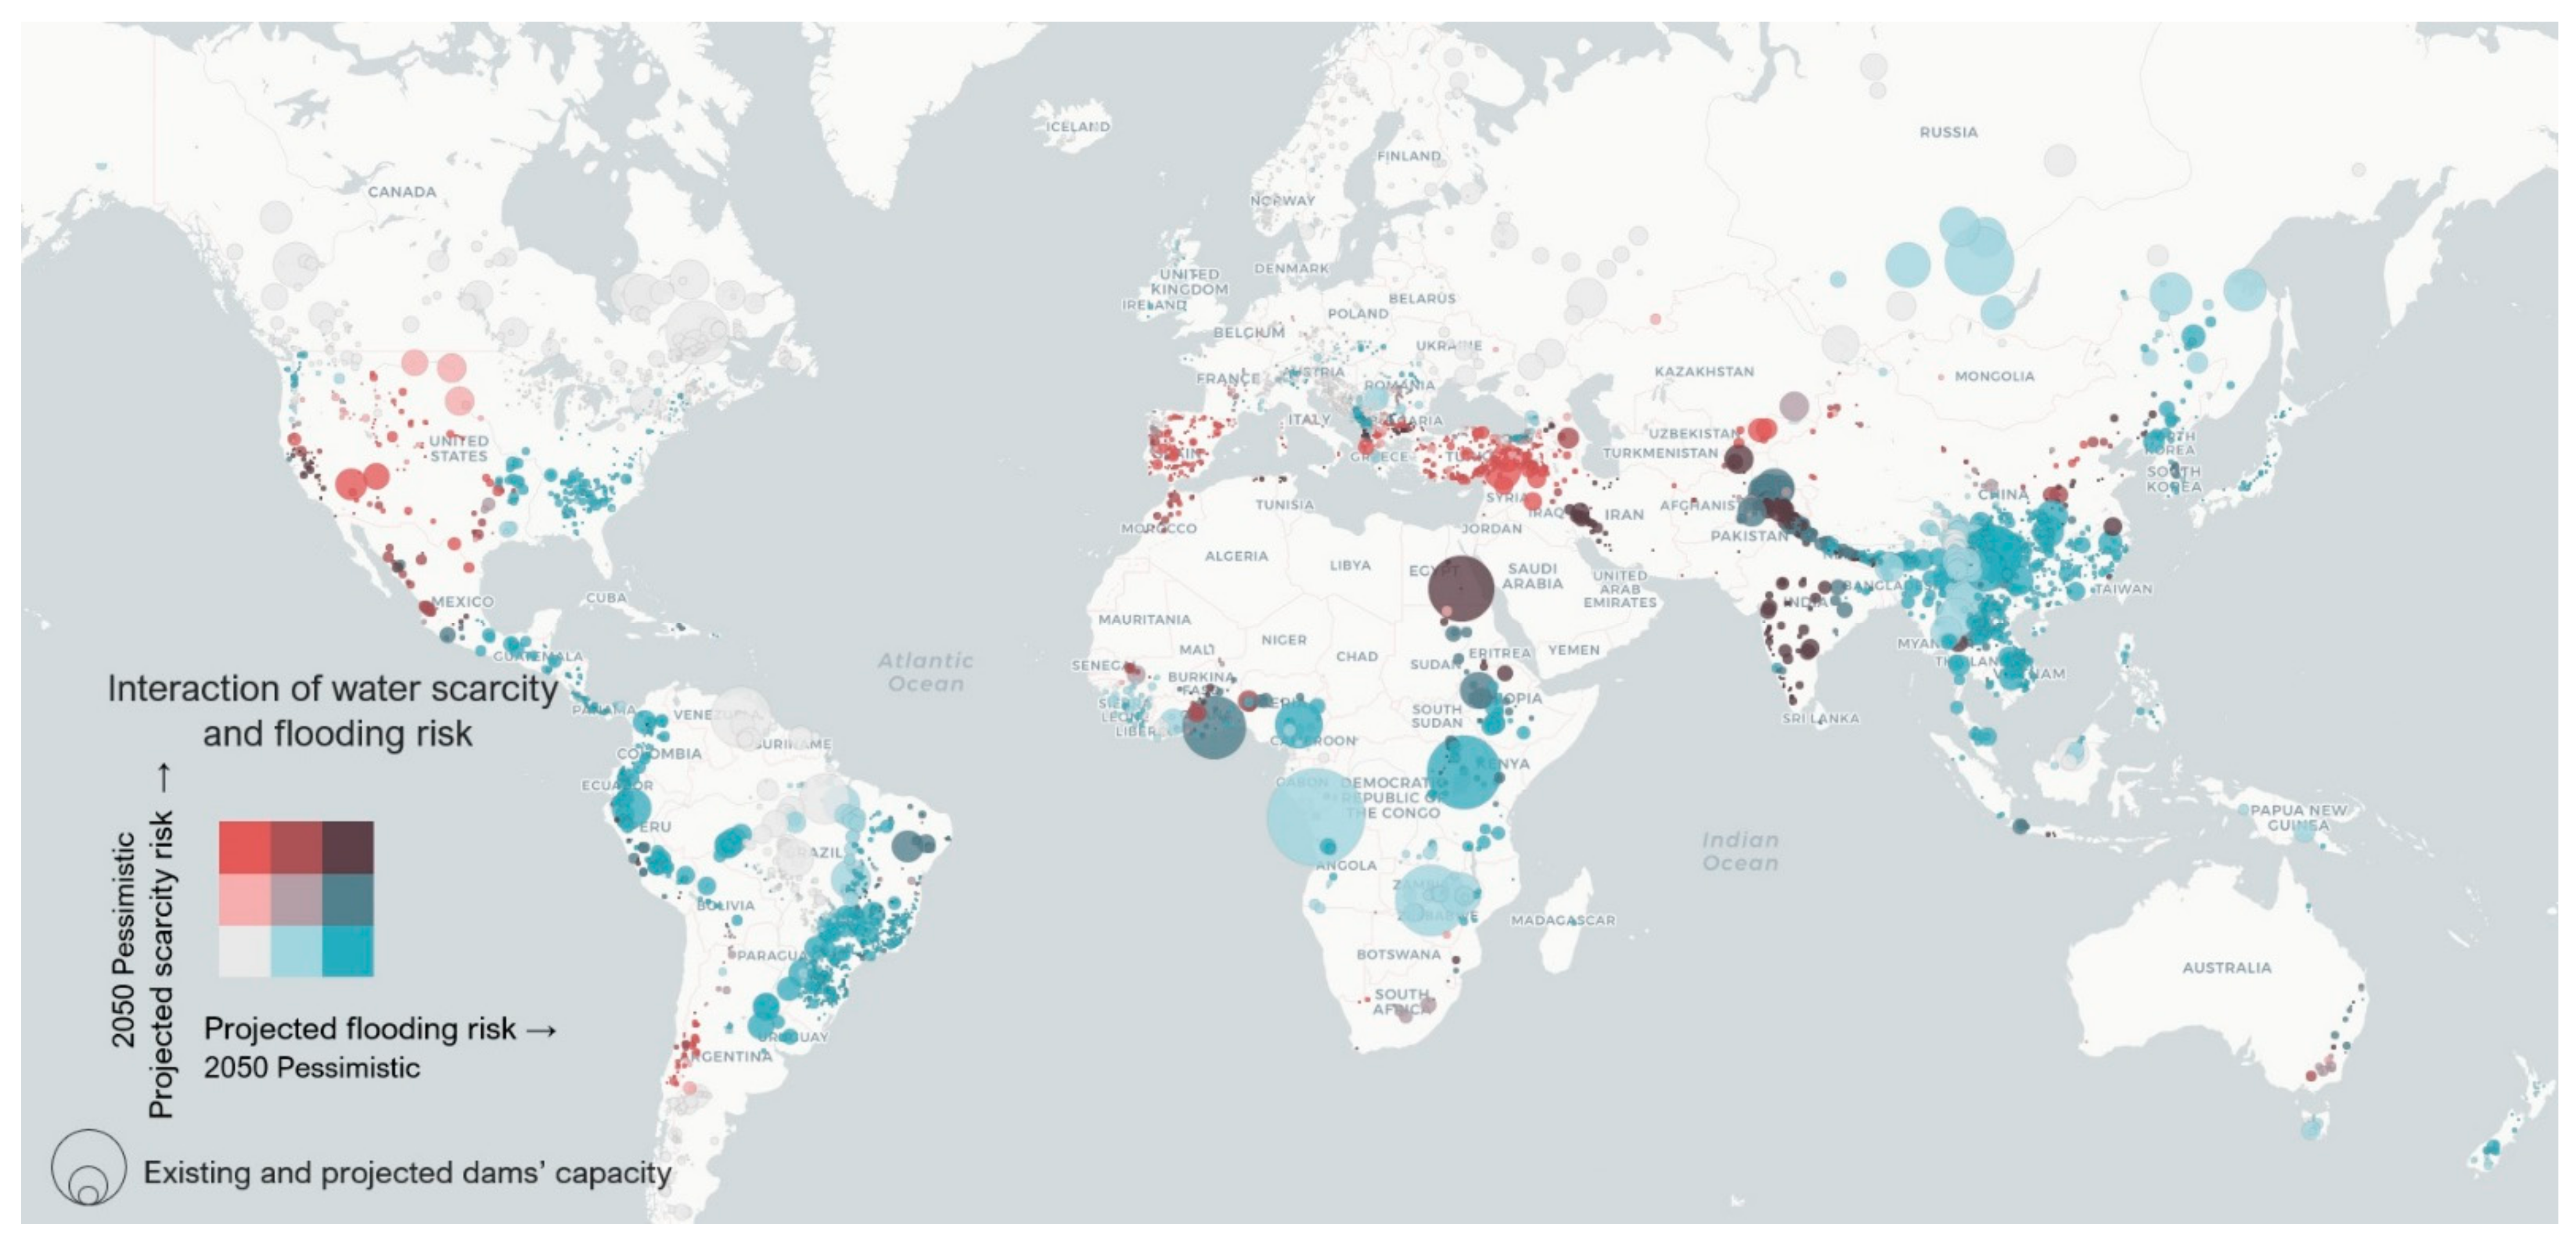
3.5. Hydropower Dams and the Interaction of Projected Water Scarcity and Flood Risk

To explore how various risks may interact, we assessed all hydropower dams (existing and projected) for their combined projected risks of water scarcity and floods by 2050, under a pessimistic scenario. A total of 3465 (56% of all dams) are in basins projected to have high or extreme risk for one risk: flooding (46%) or water scarcity (10%). An additional 329 dams (5%) are in basins projected to have high or extreme risks for both water scarcity and flood risk (Figure 11).
The countries with the greatest number of dams in basins of medium to very high levels for both risks are Nepal (210 dams), India (184), Pakistan (54), Albania (48), Bulgaria (35), USA-California (33), Romania (31), Turkey (31), Iran (27), and Mexico (26). In addition, individual large dams with medium to high levels of both risks include High Aswan (Egypt), Akosombo (Ghana), Grand Ethiopian Renaissance (Ethiopia), Sobradinho (Brazil-Bahia), Rogun (Tajikistan), Kapchagay (Kazakhstan), and Kakhovskaya (Ukraine) as well as the Bunji, Diamer-Bhasha, Dasu, Kalabagh, among others in Pakistan (Figure 12).

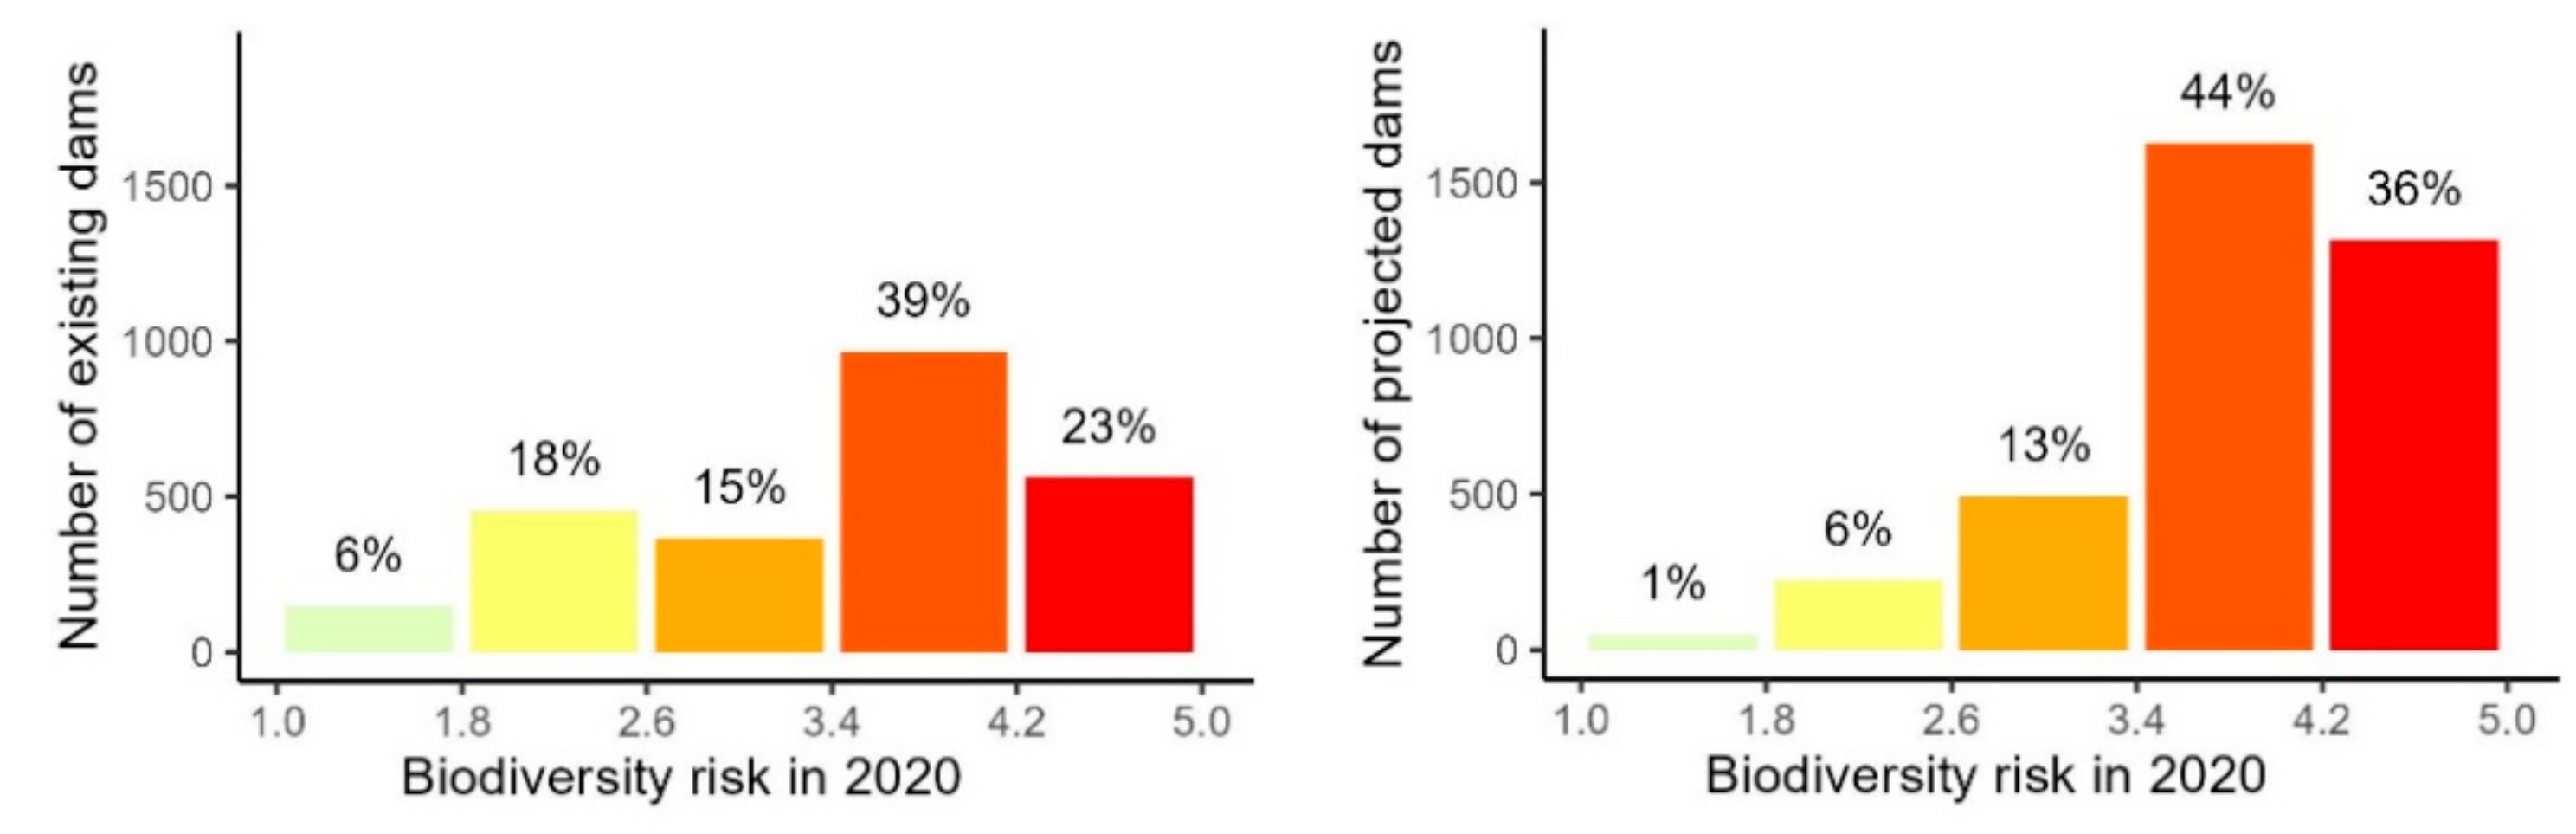
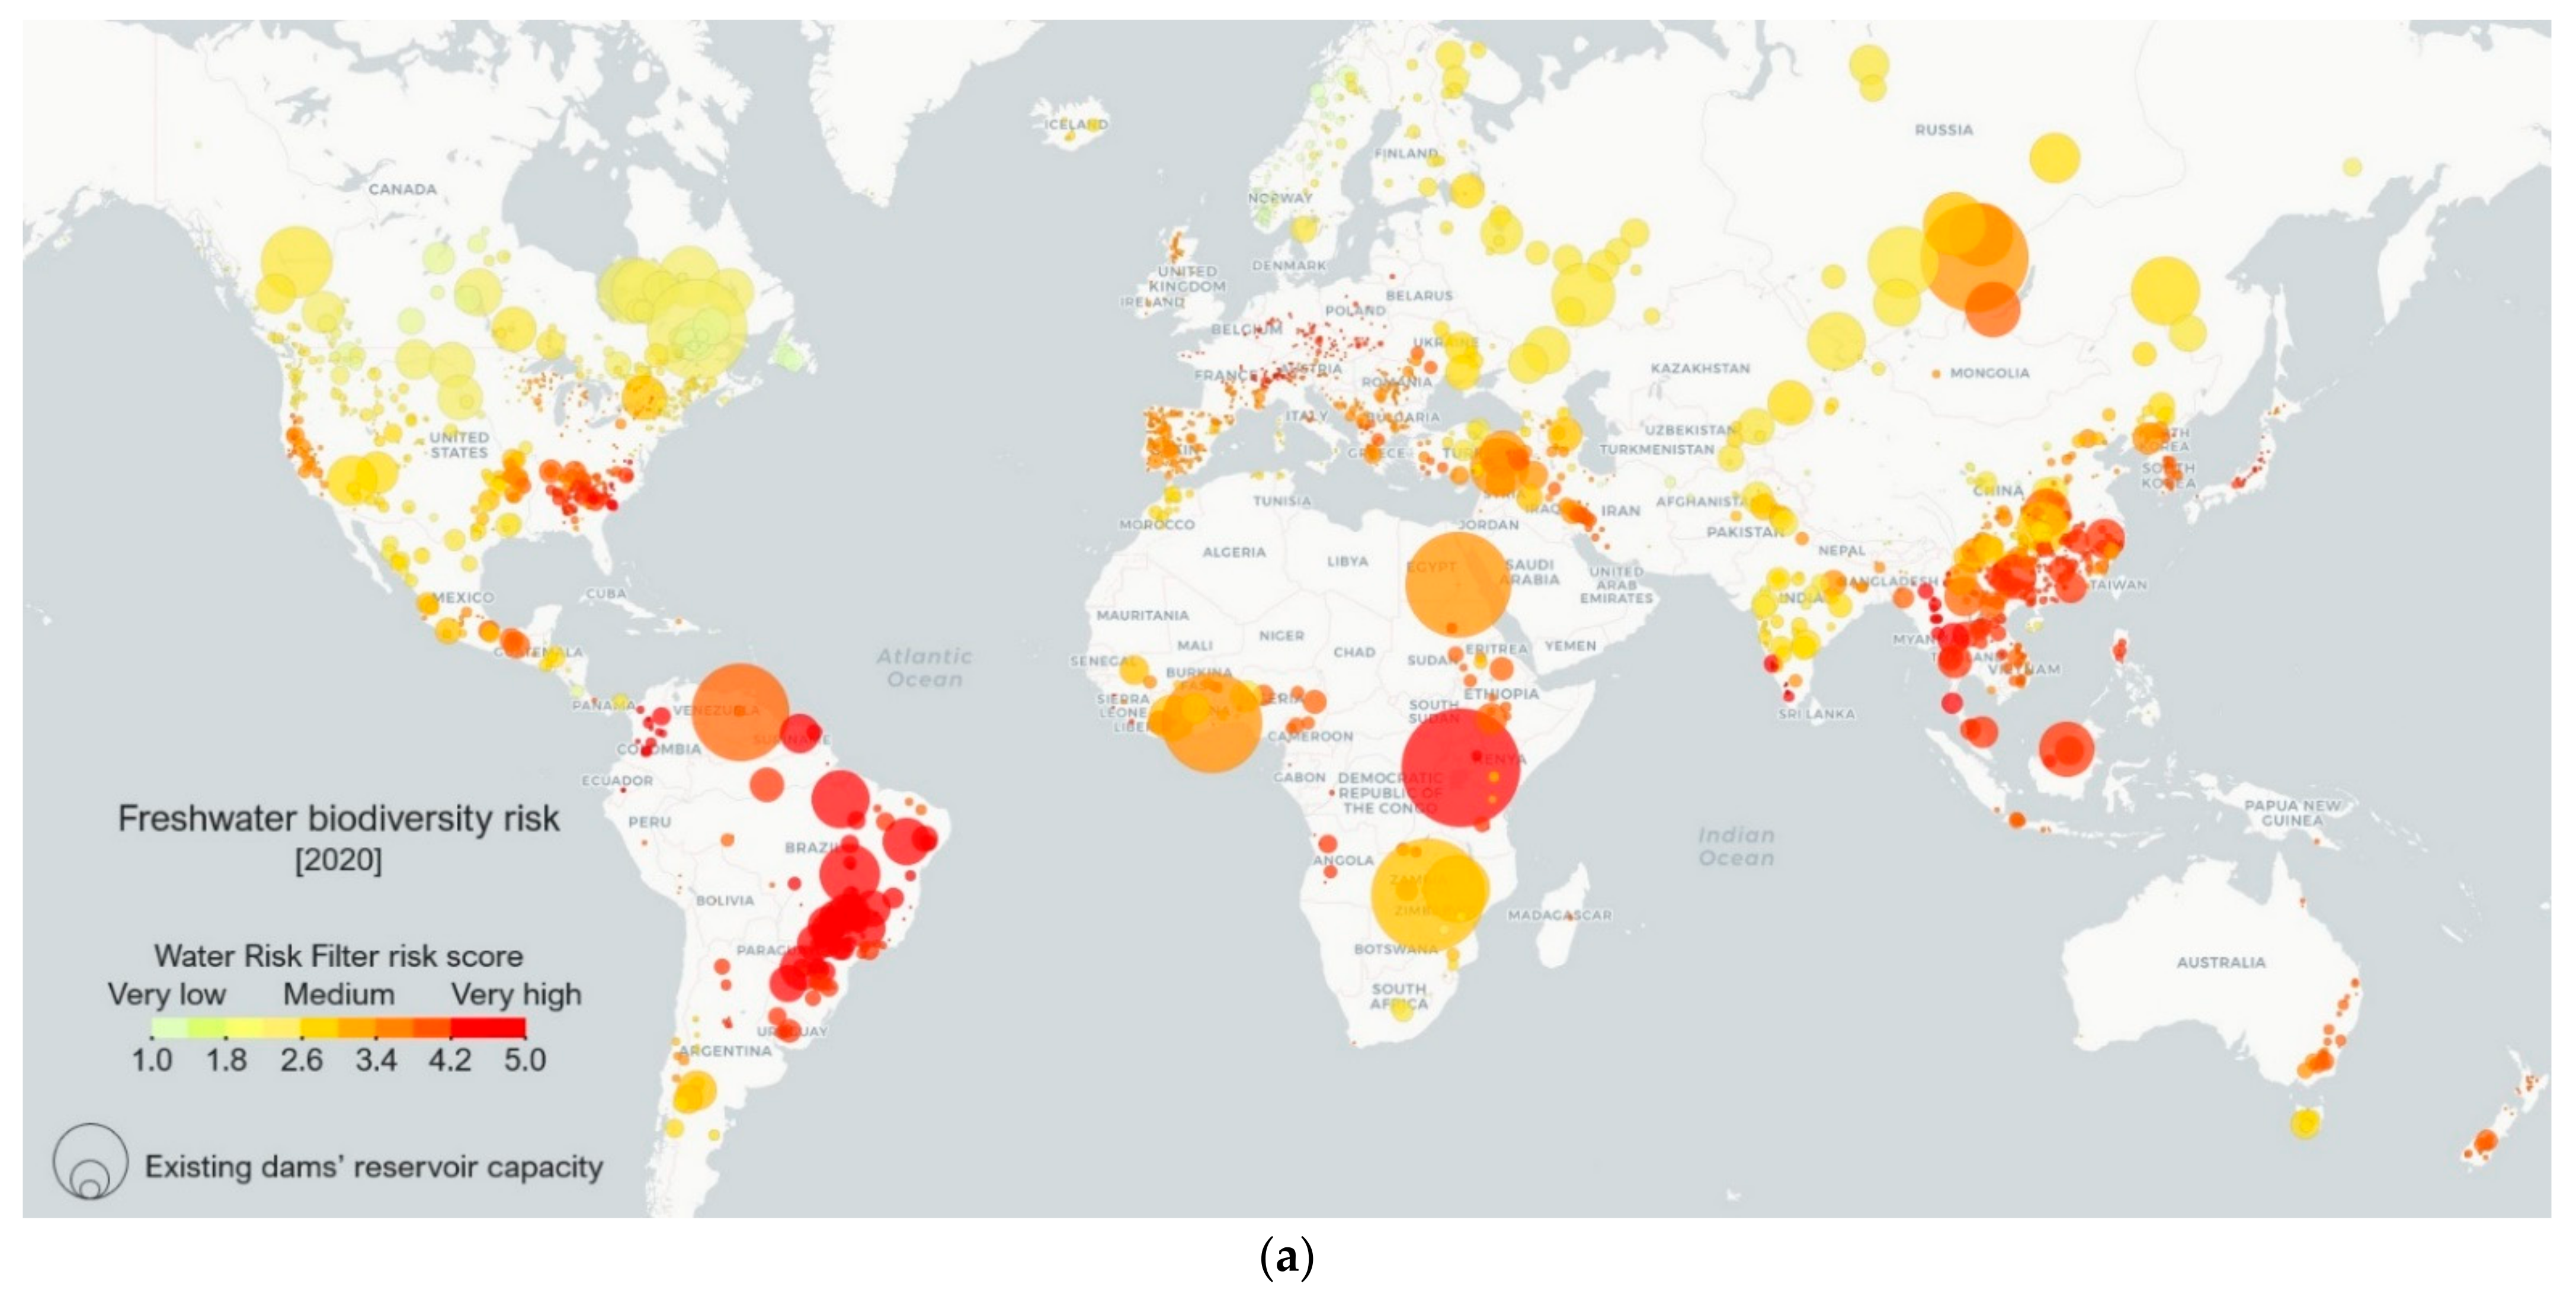
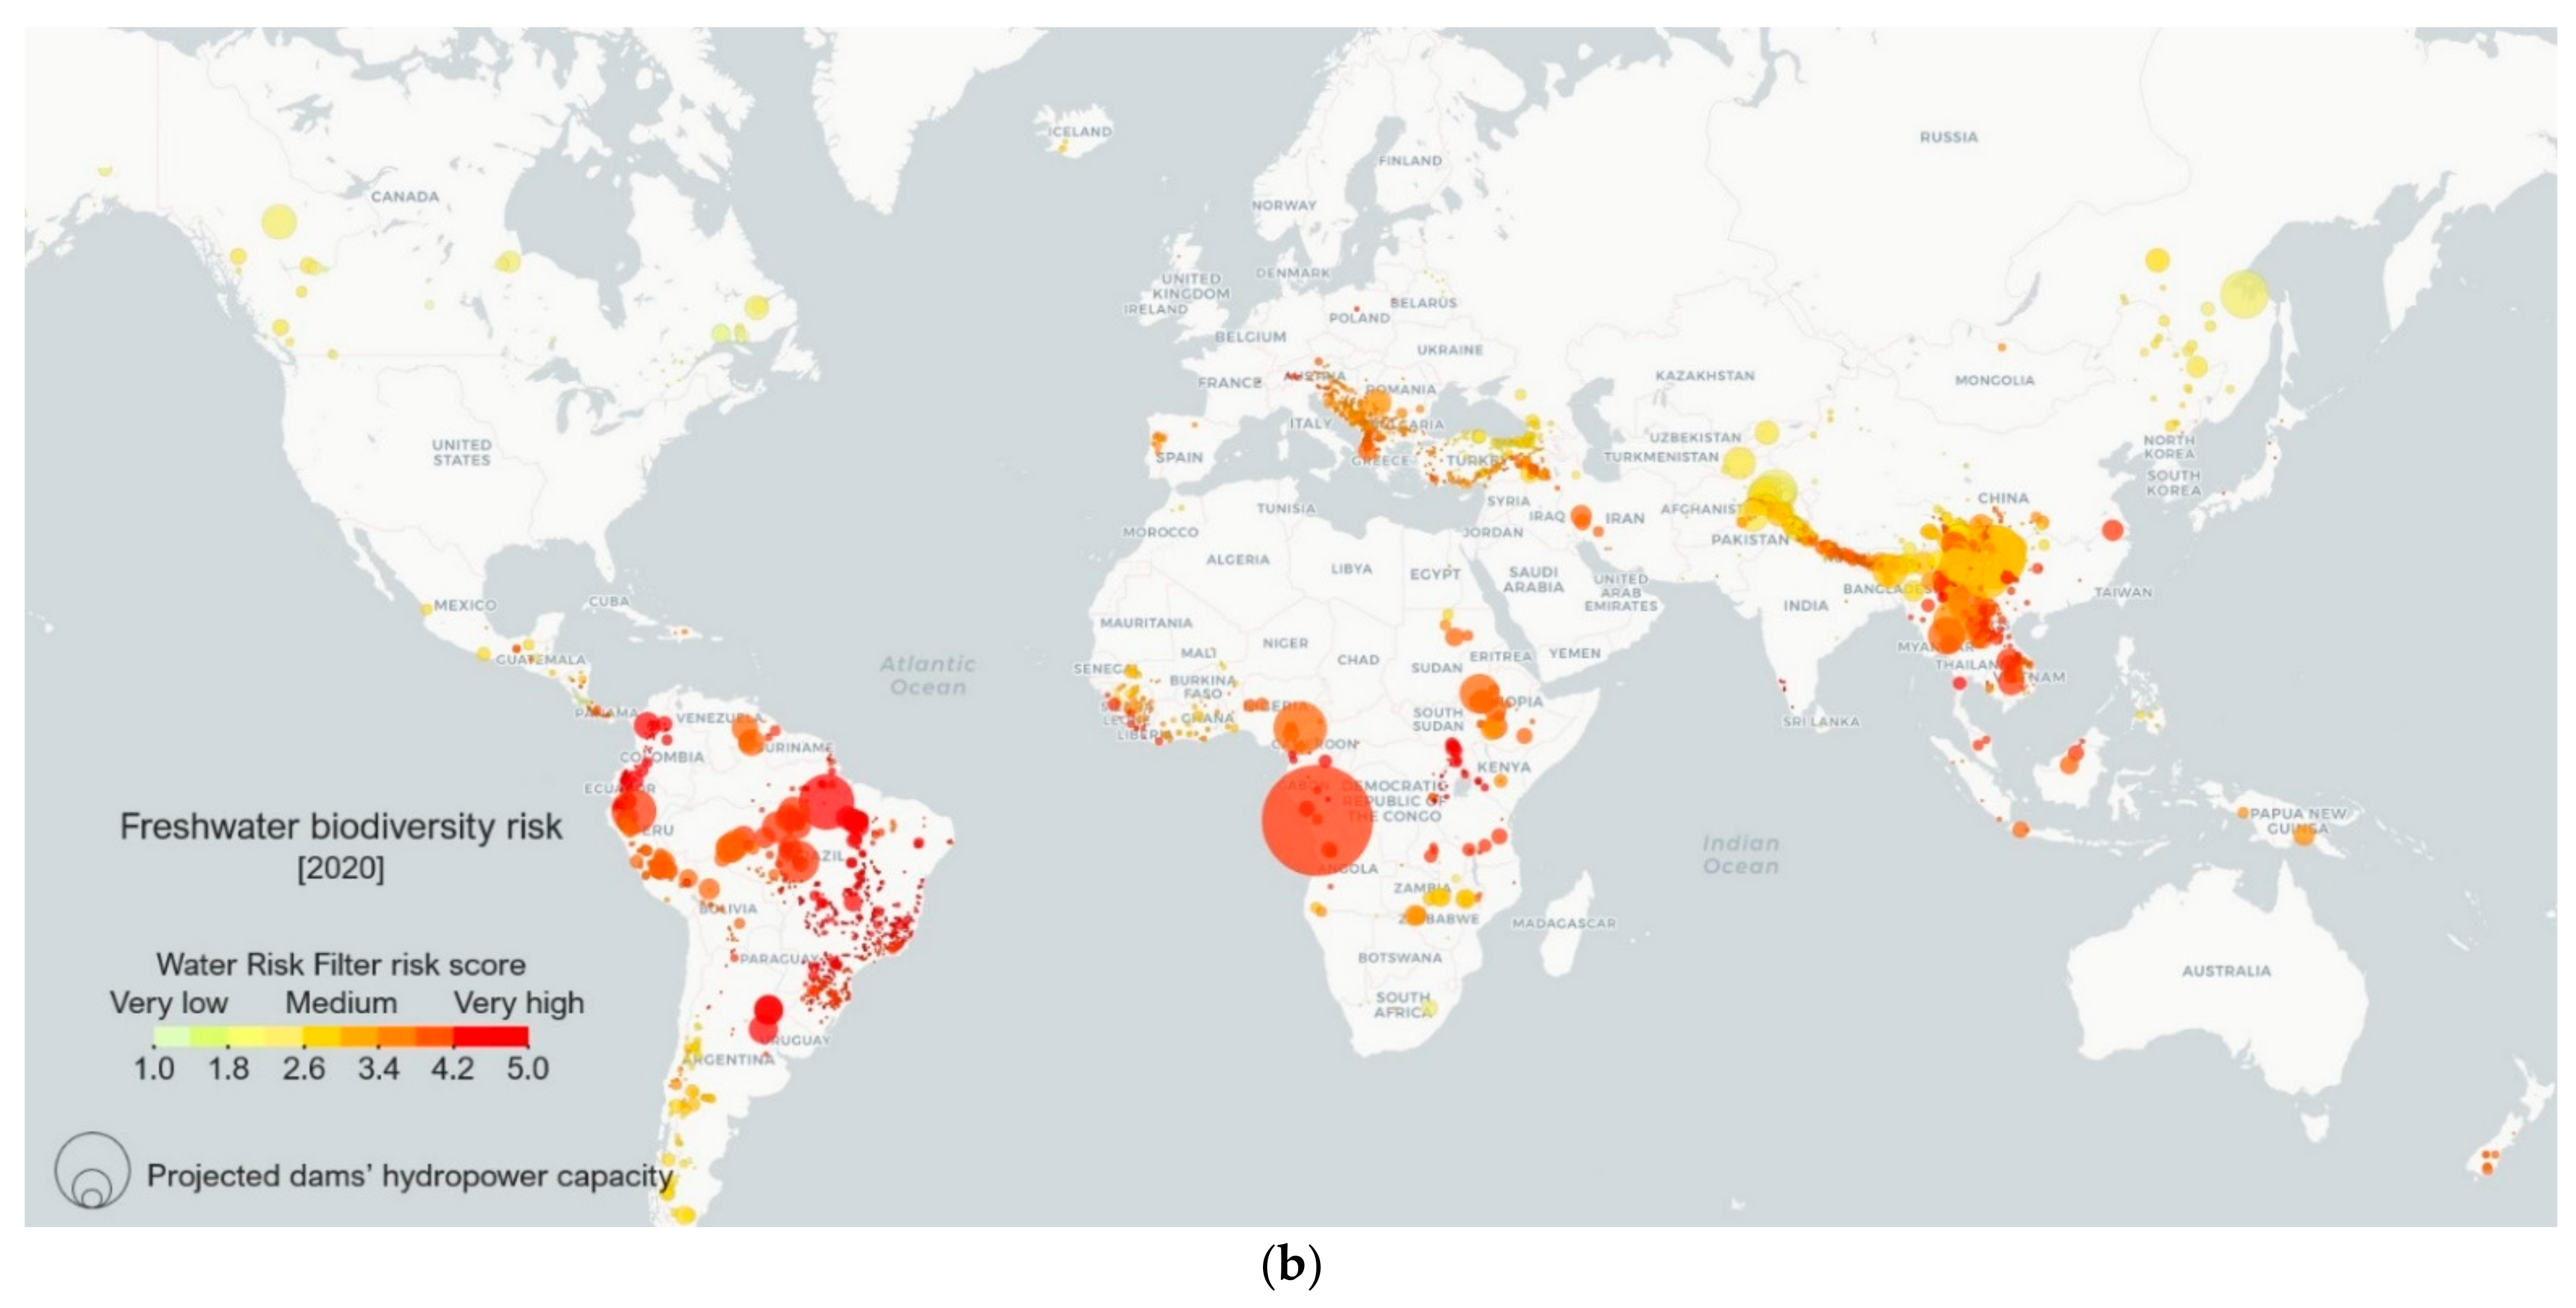
3.6. Hydropower Dams and Freshwater Biodiversity Risk

Projected hydropower dams are planned in river basins with higher biodiversity risk (mean 3.9 ± 0.01 (SE)) relative to basins with existing hydropower dams (3.4 ± 0.02), with biodiversity risk based on species richness and endemism for freshwater fish. In addition, 1889 (76%) of existing dams are in areas of medium to very high biodiversity risk, compared to 3431 (93%) projected dams (Figure 13).
The countries with the greatest number of existing hydropower dams in areas of medium to very high freshwater biodiversity risk are Russia-Irkutsk, Uganda, Zambia, Egypt, Ghana, Venezuela, Turkey, India, Brazil (especially in the states of Goiás and Minas Gerais), and China (especially in the provinces Hubei and Yunnan) (Figure 14a).
The countries with the greatest number of projected hydropower dams in areas of medium to very high freshwater biodiversity risk are China (especially in the provinces Sichuan, Yunnan, and Xizang), the Democratic Republic of the Congo, India, Myanmar, Brazil-Pará, Peru, Argentina, Ethiopia, Nepal, Laos, Brazil-Mato Grosso, and Turkey (Figure 14b).

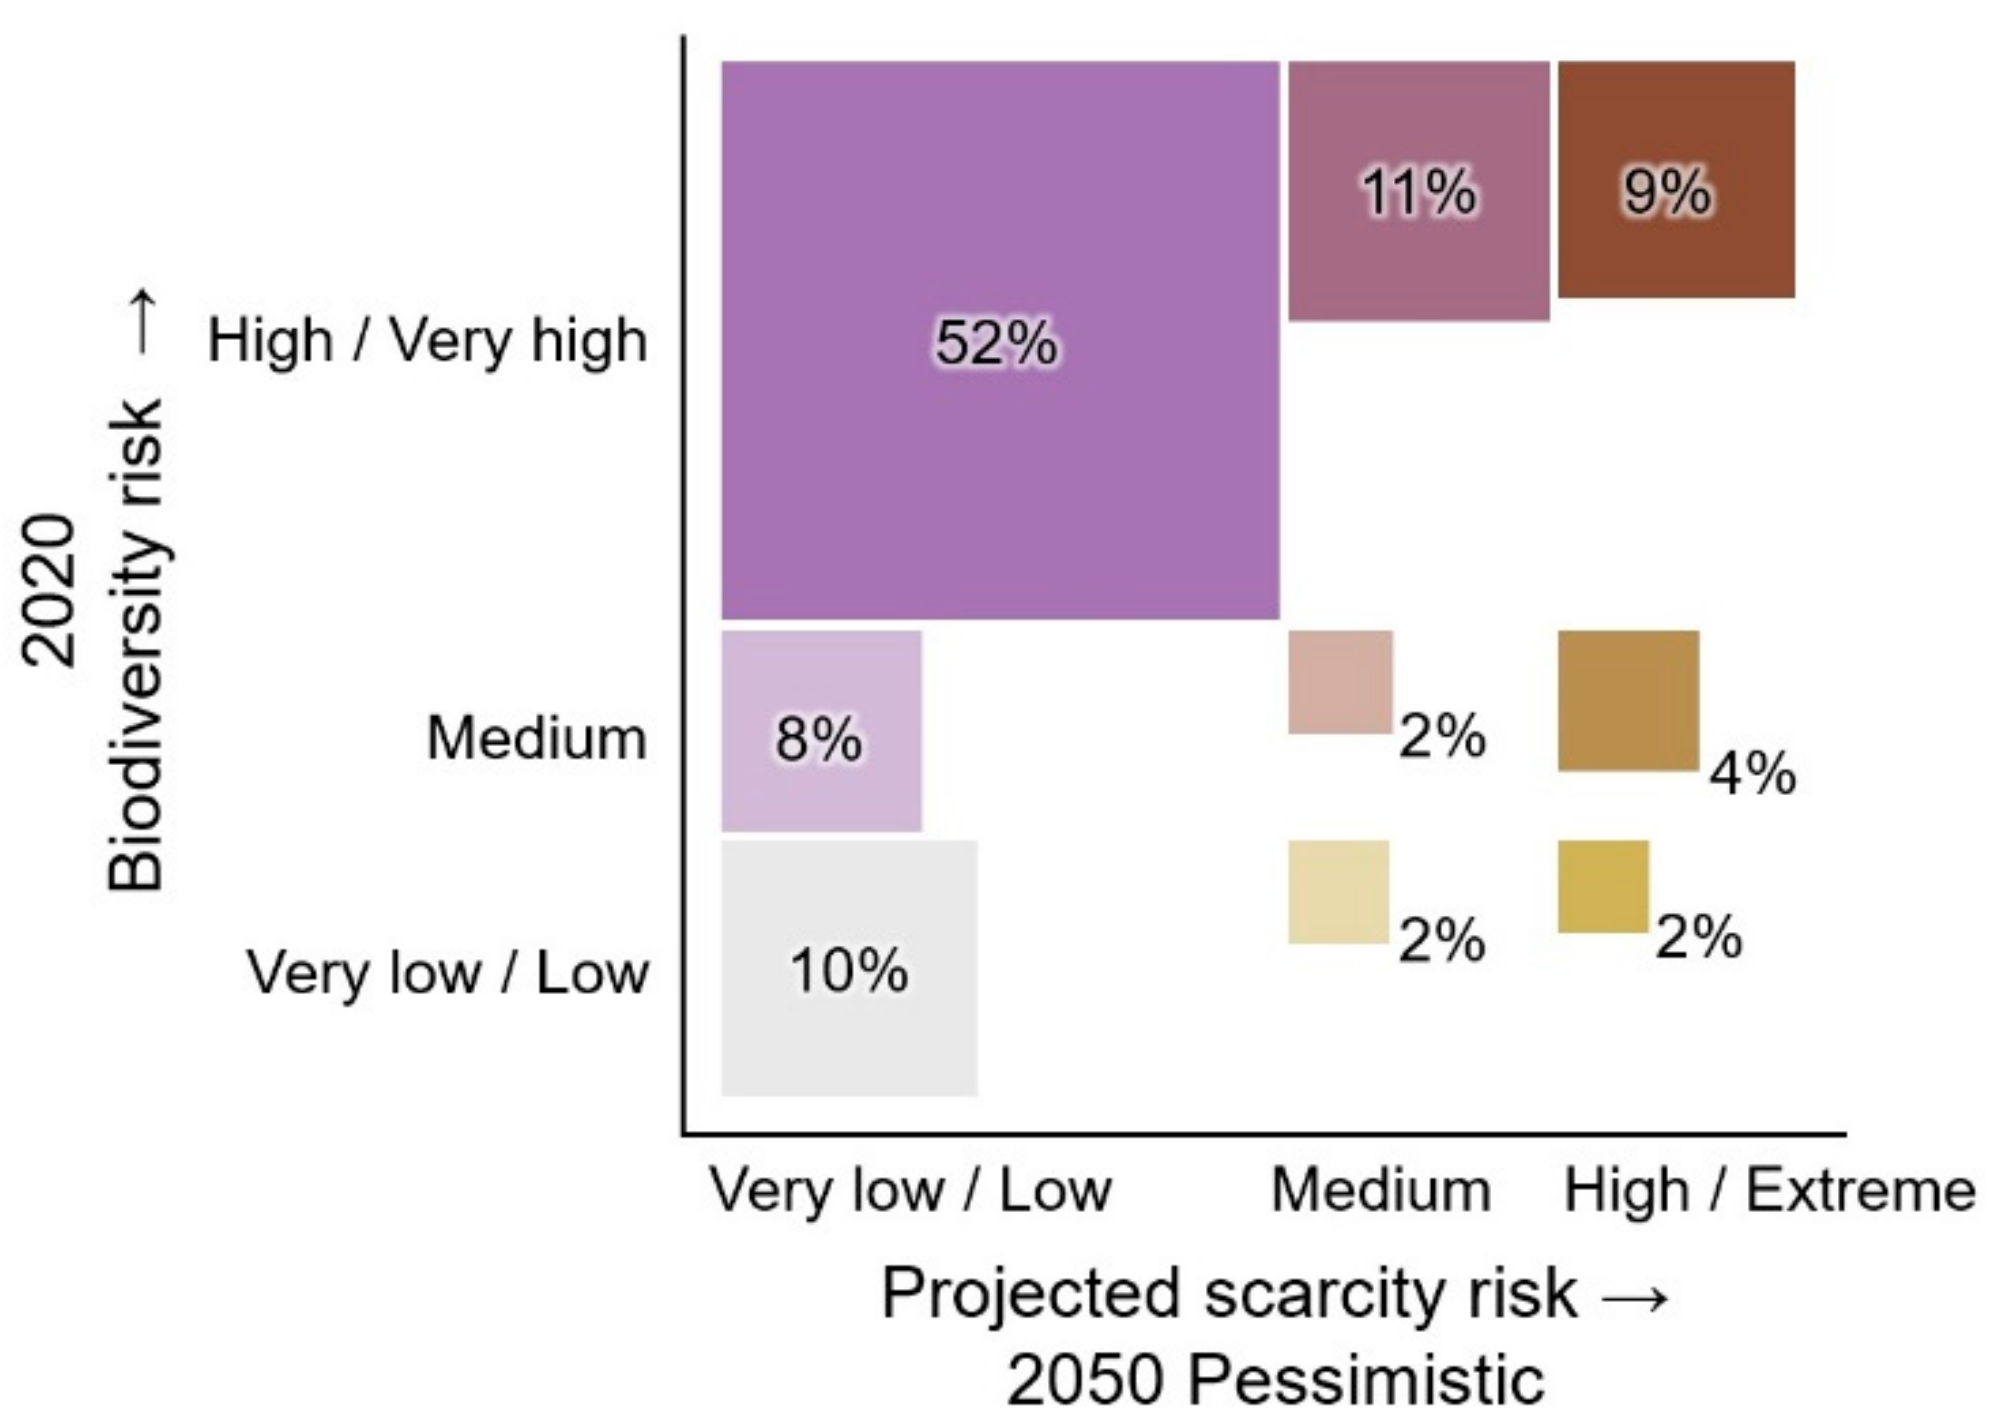
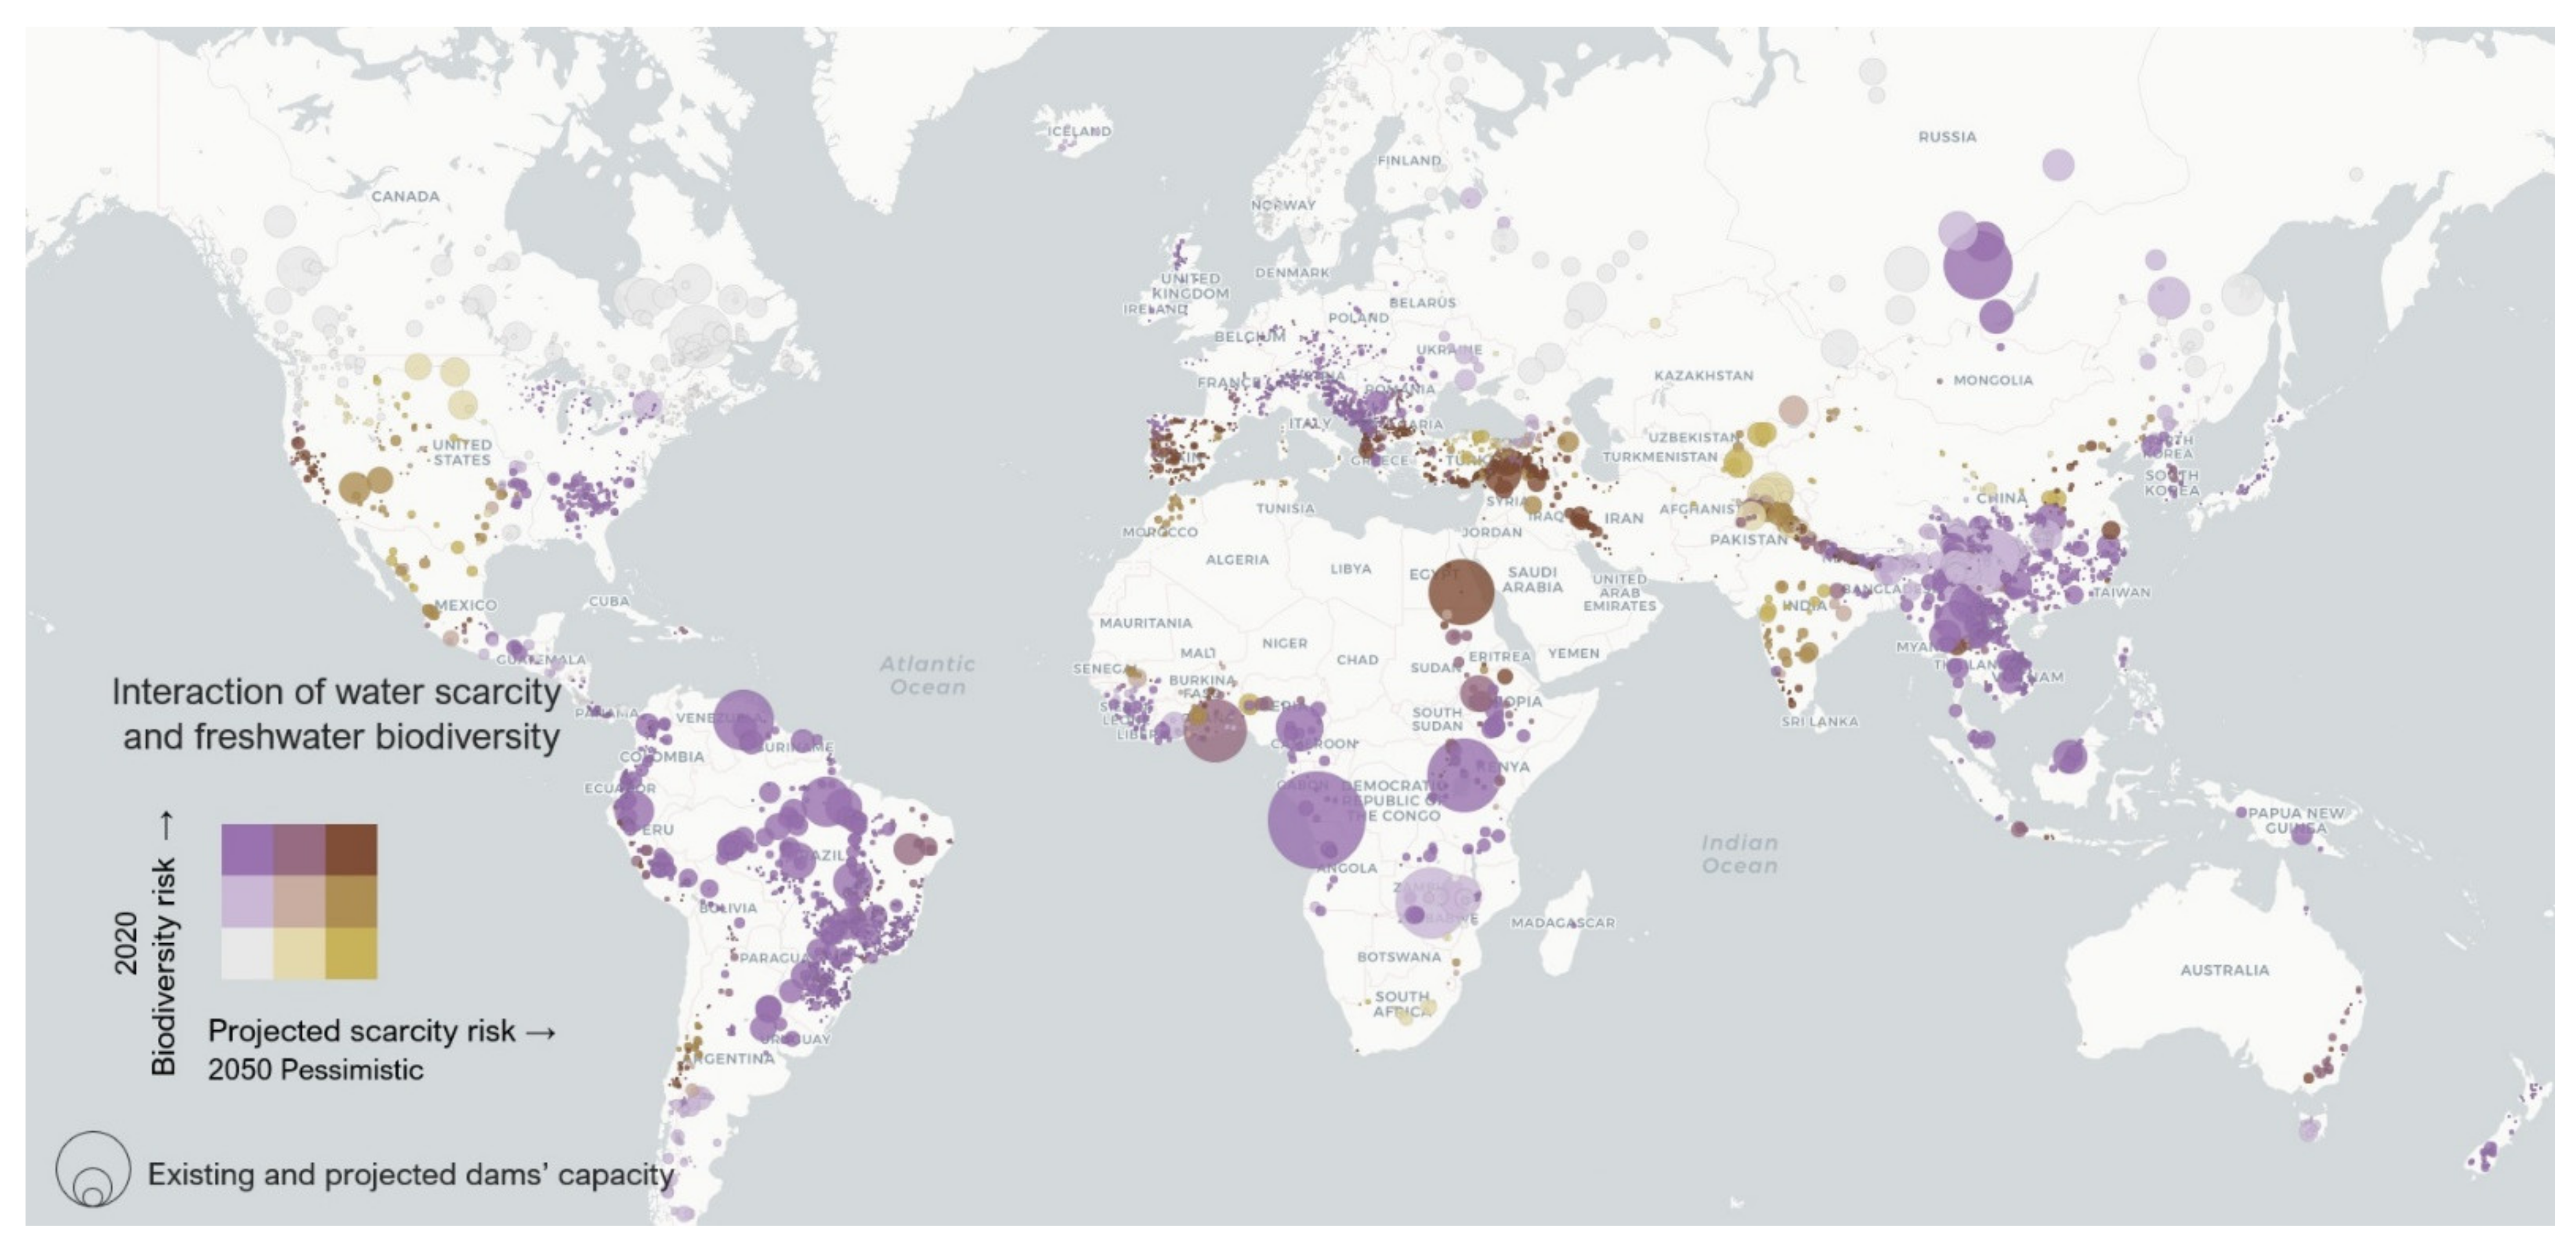
3.7. Hydropower Dams and the Interaction of Projected Water Scarcity and Freshwater Biodiversity

To explore how various risks may interact, we assessed all hydropower dams (existing and projected) for their combined risks for biodiversity and projected water scarcity in 2050, under a pessimistic scenario. Just over a quarter of all dams (1648; 27%) are in regions that have medium to very high biodiversity risk and are projected to also have medium to extreme risk for water scarcity in 2050 (Figure 15).
The countries with the greatest number of dams in areas of medium to very high levels for both risks are Turkey (233 dams), Nepal (210), India (161), Spain (110), Albania (73), Bulgaria (60), Portugal (51), Argentina (40), USA-California (39), and Pakistan (37). In addition, individual large dams with medium to high levels of both risks include High Aswan (Egypt), Akosombo (Ghana), Ataturk (Turkey), Grand Ethiopian Renaissance (Ethiopia), Hoover (USA-Nevada), Sobradinho (Brazil-Bahia), Keban (Turkey), Kapchagay (Kazakhstan), Glen Canyon (USA-Arizona), and Mingechaur (Azerbaijan) (Figure 16).

4. Discussion

During the past century, water management has been planned and operated based on the principle of stationarity—that future hydrological patterns could be predicted based on observations of past hydrological patterns. Precipitation trends have already changed sufficiently in much of the world to raise doubts about the utility of stationarity, and forecasts of changing patterns and increasing variability with climate change further challenge its utility [30]. The operations of water-management infrastructure are already being challenged in regions such as the southwestern U.S. and southern Africa, underscoring that both operations of existing and planning for new water-management infrastructure will need to account for the likely effects of climate change; infrastructure developed and/or operated without doing so will be more vulnerable to structural, economic, or environmental failure, exacerbating risks to both energy systems and ecosystems [31,32].

4.1. Risks for Hydropower Projects and Systems: Water Scarcity, Floods, and Biodiversity

The WRF analysis highlights that existing and projected dams are already present or being planned in areas with medium to high water risks, including scarcity (26% of existing dams and 23% of projected dams) and flooding (75% of existing dams and 83% of projected dams). Further, many regions are projected to have increased water risks with climate change. Under the pessimistic scenario, 32% of existing hydropower dams as well as 20% of projected dams are in basins predicted to have higher scarcity risk in 2050, especially in the Middle East, China, the southwestern USA, and India. Turner et al. found similar regions at risk of reduced discharge due to climate change leading to reduced generation [62].
Although the proportion of existing hydropower dams in basins with low flood risk is projected to increase with all three climate scenarios, the proportion in basins with the highest levels of risk is projected to increase considerably. For example, in 2020, only 4% of existing hydropower dams are within basins considered to have very high flood risk, but under both the current trend and pessimistic scenario, more than 20% of existing dams are projected to be within basins with very high or extreme flood risk. Similarly, while only 2% of projected hydropower dams are planned for basins that currently have very high risks of flooding, even under the optimistic scenario nearly 30% of the projected dams are planned within basins forecast to have very high or extreme risk and this rises to 36% for current trends and pessimistic scenarios. Thus, even as the proportion of existing and projected dams in basins with low flood risk is predicted to increase, the proportion of all dams in basins with very high or extreme flood risk is projected to increase by up to twenty times by 2050.
This WRF analysis reveals that a large proportion of existing (62%) and projected hydropower dams (80%) are located in regions with high or very high freshwater biodiversity importance, which could lead to potential regulatory or reputational risks for operators, particularly as approximately one-quarter of all dams (existing plus projected) are predicted to have medium to very high risk for both water scarcity and biodiversity impacts. This study included only a single resource, freshwater fish, as a proxy for risks to biodiversity and ecosystems; comprehensive planning for energy systems should also consider risks from displacing communities and agriculture, impacts to fisheries, and risks associated with the capture of sediment behind dams.
In general, hydropower projects with storage reservoirs will be somewhat less vulnerable to water scarcity than will run-of-river projects. Projects for which snowmelt comprises a high proportion of annual runoff will be more vulnerable than those that rely primarily on rainfall. Illustrating these generalized trends, Connel-Buck et al. [63] reported that the lower elevation projects in California’s Sierra Nevada, which have storage reservoirs, will experience a decline of 4.5% in hydropower generation in a typical year due to climate change, with a 6.5% decline in dry years. In comparison, Madani and Lund [64] estimated climate-related declines in generation of 14% for California’s high-elevation hydropower system, which consists mostly of run-of-river projects that have a high proportion of flow from snowmelt.
In addition to declining flows and increased frequency of droughts for some regions, warmer temperatures can also increase evaporation from reservoir surfaces. Evaporative losses can be a major “user” of water in arid areas. For example, approximately 16% of the Zambezi’s mean annual flow is evaporated from reservoirs, so hydropower is the largest single water consumer in the Zambezi basin [65].
Along with risks from increasing water scarcity, climate change will also drive increases in flood risk for many existing and planned hydropower dams. Hirabayashi et al. [60] reported that relatively small increases in the global average temperature are likely to increase the frequency of damaging floods in some regions. Beyond forecasts, some regions of the world are already experiencing more intense rainfall events and higher flood levels. The frequency of intense storms (>7.5 cm of rain in a single day) in the Midwestern USA has approximately doubled over the past 50 years [66]. Lall and Larauri [67] note that this increase in intense precipitation is combining with aging dams to increase risks, as illustrated by the failure of two hydropower dams in Michigan (USA) in May 2020, requiring the evacuation of thousands of people and causing USD 200 million in damage to 2500 buildings that were inundated [27]. The threat of dam failure from aging dams combined with climate-driven increases in flood levels is a global issue [68]. However, even a new dam can fail due to flaws in design and/or construction, such as the 2018 failure of a portion of the Xe-Namnoy Hydropower project in Laos [26], and failure to account for increasing storm intensities or flood levels will increase the risk of failure or overtopping. This study found that Laos was among the countries with the greatest increase in flooding risk for both existing and projected dams.
Within river basins, hydropower operations often take place in a complex mosaic of other water-management sectors and a range of other environmental and social values. Climate change may also affect these sectors and values in ways that will affect hydropower operations. For example, demand for irrigation water may increase due to increasing evapotranspiration from crops even as the volume of water stored for irrigation decreases due to lower precipitation, higher rates of evapotranspiration in the upstream watershed, and more evaporation from the reservoir. This may increase competition for water storage within a multipurpose reservoir that provides both irrigation water storage and hydropower [69]. There may also be increased conflict with flood-management objectives as flood managers may seek greater allocations to flood storage, which requires lowering the reservoir—a change in allocation that will reduce hydraulic head for hydropower generation and also increase the reservoir’s risk to droughts [24].
Further, climate change will act as a stressor on river ecosystems and, if those stressors contribute to the decline of environmental resources in a river affected by a hydropower dam, the climate stressors could increase regulatory and/or reputational risk for the hydropower project. Management of reservoirs, for hydropower or other purposes, may also see increasing competition between storage (e.g., to provide firm power) and the release of environmental flows, such as those provided for salmon populations in the Columbia River basin [70], even as climate change increases stress on temperature-sensitive species, such as salmon, potentially increasing the regulatory requirements to protect such species [71,72].

4.2. Hydrological Risks and Financial and Economic Risks for Hydropower Projects and Systems

These various hydrological risks have the potential to result in financial impacts for existing hydropower dams, including reduced generation (and revenue) driven by increases in water scarcity or the frequency of droughts and the financial impacts of structural damage or failure from flood risks. For example, studies on how precipitation and runoff in the Zambezi basin will be affected by climate change forecast a 26–40% reduction in the average annual runoff by 2050, relative to a 1960–1990 baseline. Because of the associated decline in river discharge, a World Bank study forecast a 32% decline in firm energy from hydropower dams in the basin (from 30,000 GWh/year to 20,000 GWh/year) [24]. Climate change is also projected to reduce the discharge of the rivers in the Amazon basin. Almeida et al. found that this lower discharge will reduce generation at 350 projected dams by up to 30% compared to current hydrology, potentially making these dams financially less competitive relative to other sources of renewable generation such as wind and solar [73].
Stresses from water scarcity and drought on power generation, potentially already influenced by climate change, are already being experienced by hydropower projects in southern Africa and Southeast Asia, revealing the vulnerability to droughts of countries with a high reliance on hydropower [32,34]. Approximately 60% of electricity generation in southern Africa is from hydropower and thus the region is already somewhat vulnerable to drought and could become more so as it is predicted to become drier with increased drought frequency [24]. For these reasons, some scientists and business leaders are calling for the region to diversify away from its high reliance on hydropower and to increase investment in wind and solar PV [74,75].

4.3. Options for Hydropower Planning and Management to Address Risk

Some regions are forecast to experience significant increases in flood levels, such as Southeast Asia where what is today a large, rare flood (e.g., a 1% exceedance level) is predicted to become five to 10 times more likely by 2050—the type of flood that happens several times a decade [60]. In regions where flood risk is likely to increase, future hydropower dams should be designed for safety against likely future flood levels, not those of today. Existing hydropower dams may require retrofits (e.g., increased capacity of the emergency spillway to handle larger uncontrolled spill volumes) or changes in operations (e.g., lowering of the flood pool) to account for shifting flood risk. Improvements in forecasting can also allow dams to more effectively manage flood risk and/or balance flood-risk management with multiple objectives [76].
Existing hydropower projects have a range of options for managing increasing risks from water scarcity and increasing risks to riverine biodiversity (both from climate and from hydropower)—and the interactions between these risks. Improved forecasting and updated operating rules, including dynamic operating rules informed by forecasting, can increase a hydropower project’s resiliency to increased risk of water scarcity. In some regions, investments in upstream nature-based solutions can reduce water scarcity risks for hydropower projects. For example, by storing water during the wet season, and releasing water during the dry season, floodplains often increase downstream river flows during the dry season [77]. On the Zambezi River in Africa, this “sponge effect” from the Lukanga Swamp increases flow during the dry season, reducing the risk of low water for downstream hydropower projects. Investments in maintaining or restoring upstream wetlands could potentially help hydropower projects reduce the risk of water scarcity during the dry season [78].
Updated plans for operations should simultaneously consider potential shifts in hydrology as well as the need to maintain or restore river ecosystems and services. A comprehensive review of operations can strive to incorporate an environmental flow regime that maintains or restores key processes downstream [79,80]. Because increasing temperatures may increase the need for aquatic organisms to move within a channel network, existing dams can add or improve structures to facilitate fish passage [81].
Climate change may have serious negative impacts on the availability of habitat for some species, particularly for those with limited ranges and/or narrow thermal limits. In these situations, retrofits or reoperation of a hydropower dam may actually provide opportunities to partially mitigate those climate impacts. For example, as access to cold water habitat diminishes for Chinook salmon, cold water released from a reservoir may be able to maintain some habitat with appropriate thermal regimes [71]. Dams can be retrofitted to improve their ability to release cold water from the hypolimnion of their reservoir, such as multi-level outlets. However, these can be quite expensive, such as the USD 80 million temperature control device installed in Shasta Dam (Sacramento River, California, USA) to improve the dam’s ability to release cold water for salmon [82]. Due to the high cost of retrofits, new dams should be designed (where needed) with the ability to release water with a range of temperatures or other water quality attributes.
Similarly, climate change may result in changes to the timing of various processes necessary for species to complete portions of their life history, and hydropower operations may be able to help mitigate those impacts. For example, in California’s Central Valley, riparian trees, such as willows and cottonwoods, release their seeds as a function of degree-days, defined as the cumulative daily heat load above a specific threshold temperature, with timing evolved to coincide with periods of snowmelt that create the appropriate hydrological conditions for seed dispersal (high flows) and germination (bare soil on newly created sand or gravel bars). With a changing climate, including a shift in the ratio of rain to snow, these appropriate hydrological conditions may become temporally decoupled from the degree-day threshold the plants evolved as a cue. Dams with storage reservoirs, including the multipurpose hydropower dams in the Sierra Nevada foothills, could manage flow releases to provide the appropriate flood pulse at the time that trees are releasing seed [83].
All of the interventions described above, including retrofits, reoperation, or reallocation of storage to manage climate and/or environmental risks can be promoted through periodic relicensing of existing hydropower projects, such as occurs in the United States, administered by the Federal Energy Regulatory Commission (FERC). Relicensing provides the opportunity to study changing conditions—including climate, ecosystems, and other water-management objectives—and to revise operations, or modify physical structures, based on those changing conditions and objectives. Absent relicensing there is often limited opportunity to revise operations, except through legislation or litigation. Currently, few countries require that hydropower projects undergo relicensing processes. Pittock and Hartmann [84] recommend widespread adoption of periodic relicensing as an important step for increasing the sustainability of hydropower projects and their ability to respond to climate-driven changes in risks.
Relicensing, or other processes to study shifting risks and revise hydropower management in response, can potentially achieve more impactful outcomes if those processes focus at the scale of systems (e.g., river basins) rather than single projects. Lee et al. [76] found that optimized release curves for a system of dams on the Columbia River could allow the system to provide better outcomes across objectives as hydrology shifted due to climate change. Compared to the existing operation, using fixed flood-control release curves for each dam, the optimized curves for the system could provide increased hydropower generation while maintaining flood-risk management and also retaining more water to release late in the summer to maintain appropriate flow and temperature for salmon.
A system-scale approach to relicensing can also find opportunities for restoration that would be difficult to achieve at the scale of a single dam. On the Penobscot River, a relicensing process considered multiple dams on the lower river and developed a solution that included removal of two dams, and construction of a nature-like bypass around a third, that increased by hundreds of kilometers the extent of river and stream habitat available to migratory fish. With changes to the operation and equipment at the dams that remain, the overall system of hydropower now provides an equal, or even greater, level of generation, while species such as river herring have rebounded from a few thousand to a few million spawning in the Penobscot annually [79,85]. Strategic dam removal, potentially facilitated by system-scale approaches to relicensing and mitigation, could be an important strategy for increasing the availability of habitat for fish that need to shift their ranges due to climate change.
The system scale is also key for increasing the ability of planned dams to manage shifting risks from climate and environmental impacts [86]. Countries considering hydropower development should fully consider the full set of risks from climate change and from negative impacts to environmental and social resources—and how those risks may shift over time. These risks can be assessed within a framework that compares the costs and benefits of multiple options for meeting energy objectives, considering various technologies for generation, storage, and grid management [17]. As described above, several countries that are highly reliant on hydropower, including Zambia and Cambodia, have recently experienced drought-induced deficits of generation, causing blackouts, demonstrating the vulnerability of grids with a high proportion of generation from hydropower, particularly if climate change is already causing increased frequency and intensity of droughts. Energy planning processes should include scenarios of likely climate change with the goal of identifying options for low-carbon grids that are resilient to climate change and that minimize negative impacts on other resources to the extent possible.
Dam planners and operators can draw on a range of guidance on how to understand and manage for hydrological risks [36,38,86,87]. Below we summarize several recommendations for how hydropower planners and managers can reduce risks from climate change and environmental impacts, distilled from a range of other sources [16,23,31,36,83]:
  • Hydropower should be planned within broad energy system planning processes that can assess multiple potential pathways (e.g., different combinations of technologies for generation and storage) and can compare how those options perform across a range of objectives. These processes should use scenario analysis to incorporate potential future climate-driven hydrological changes.
  • Diversify the regional power pool to reduce dependency on hydropower that could be vulnerable to droughts.
  • Hydropower dams should be planned and managed at the basin or regional scale, integrated with other sectors and resources.
  • Periodic relicensing provides the opportunity to revise the operations of existing hydropower projects, accounting for climate change as well as changes in objectives for other resources. System-scale approaches may increase the range of solutions available during the rebalancing process afforded by relicensing.
  • Invest in hydropower infrastructure that is reversible and/or resilient/adaptable. Increase the flexibility of dam operations through operation rules and design, such as the incorporation of a broader range of turbine sizes or multiple outlets, to increase the range of flows and water temperatures that a dam can release.
  • Include larger safety margins for new dams and, where needed, retrofit existing dams to reduce risks from flooding (e.g., increased spillway capacity for potentially larger floods).

5. Conclusions

The analyses in this paper reveal broad trends about global risks for hydropower from shifts in hydrological risks due to climate change as well as risks of negative impacts from hydropower expansion on freshwater biodiversity. These results can serve as initial screening information for planners, managers, and/or decision-makers. More specific decisions—for example on design or investments—would require focused studies at river basin and site scales.
Although the current trend and pessimistic scenarios increase the proportion of dams with medium to high risk for water scarcity, the optimistic scenario’s results are little changed from today’s level of risk. This underscores that, for some types of risks, minimizing climate change can minimize social, environmental, and economic impacts: for hydropower generation, achieving the 1.5 °C target may minimize disruptions from changes in water scarcity. This finding is consistent with the IPCC Special Report on the 1.5 °C target, which found major differences in the scale of impact on various resources between holding warming to 1.5 °C rather than 2 °C [20].
In contrast, even under the optimistic scenario, the proportion of all hydropower dams with very high flood risk is projected to increase considerably. This result highlights that even if the world achieves its most ambitious climate targets, a certain amount of adaptation to changes and impacts from climate change will still be necessary. For hydropower dams, this may include upgrades to the infrastructure (e.g., emergency spillways) but could also include a range of investments, both upstream and downstream, to reduce flood risk. These investments could encompass nature-based solutions (NBS), such as changes to upstream land management and land cover that may reduce flood runoff or downstream reconnection of floodplains to safely manage higher downstream releases [87,88]. Better forecasting and dynamic operations may allow hydropower dams to reduce flood risk while maintaining or even increasing generation, while also increasing the ability to achieve environmental flow targets [76]—particularly when combined with downstream floodplain reconnection [28].
Although we based this study on the best available relevant global datasets, we acknowledge that the results unavoidably inherit some limitations from the datasets they are drawn from. The global databases of dams cover the majority of major projects; however, the databases are still being expanded to be more fully comprehensive. The raw datasets which inform the WRF risk layers are generally outputs of global models and, therefore, effectively reflect regional patterns but in some cases, they may not reflect local variations. Finally, the climate impact ensemble projections that represent the consequences and effects of climate and socio-economic changes still incorporate a significant number of assumptions and uncertainties, despite the great effort of the climate modeling community to minimize them. On the other hand, scenario analysis is a method to manage uncertainties by examining alternatives of how the future might unfold, and thus can inform decision-making processes and facilitate planning discussions [89].
In summary, minimizing climate change will be important for minimizing disruptions to existing hydropower generation due to water scarcity, as well as reducing the number of dams with very high or extreme flood risk. However, considerable adaptation will be required even under the most optimistic scenarios—and there remains sufficient uncertainty about all of these projections—and therefore hydropower planning and management should fully account for both potential shifts in hydrological risks as well as risks to freshwater ecosystems and how these risks interact.

Author Contributions

Conceptualization, J.J.O., R.R.C. and A.L.-B.; methodology, R.R.C., A.L.-B., and J.J.O.; formal analysis, R.R.C., A.L.-B. and J.J.O.; data curation, C.Z. and A.J.M.; writing—original draft preparation, J.J.O., R.R.C. and A.L.-B.; writing—review and editing, C.Z. and A.J.M. All authors have read and agreed to the published version of the manuscript.

Funding

This research received no external funding.

Institutional Review Board Statement

Not applicable.

Informed Consent Statement

Not applicable.

Data Availability Statement

Datasets used in this study can be found at https://zenodo.org/record/5826187 and interactive maps can be found at https://rcamargo.shinyapps.io/HydropowerClimateChange. The source code used in this study is available at https://github.com/rafaelatwwf/hydropowerClimateChange (all websites accessed on 21 January 2022).

Conflicts of Interest

The authors declare no conflict of interest.

References

  1. Barbarossa, V.; Bosmans, J.; Wanders, N.; King, H.; Bierkens, M.F.P.; Huijbregts, M.A.J.; Schipper, A.M. Threats of Global Warming to the World’s Freshwater Fishes. Nat. Commun. 2021, 12, 1701. [Google Scholar] [CrossRef] [PubMed]
  2. Cai, W.; Cowan, T. Evidence of Impacts from Rising Temperature on Inflows to the Murray-Darling Basin. Geophys. Res. Lett. 2008, 35. [Google Scholar] [CrossRef]
  3. van Vliet, M.T.H.; Franssen, W.H.P.; Yearsley, J.R.; Ludwig, F.; Haddeland, I.; Lettenmaier, D.P.; Kabat, P. Global River Discharge and Water Temperature under Climate Change. Glob. Environ. Change 2013, 23, 450–464. [Google Scholar] [CrossRef]
  4. Gleick, P.H.; Chalecki, E.L. The Impacts of Climatic Changes for Water Resources of the Colorado and Sacramento-San Joaquin River Basins. JAWRA J. Am. Water Resour. Assoc. 1999, 35, 1429–1441. [Google Scholar] [CrossRef]
  5. Barnett, T.P.; Adam, J.C.; Lettenmaier, D.P. Potential Impacts of a Warming Climate on Water Availability in Snow-Dominated Regions. Nature 2005, 438, 303–309. [Google Scholar] [CrossRef]
  6. Mamalakis, A.; Randerson, J.T.; Yu, J.-Y.; Pritchard, M.S.; Magnusdottir, G.; Smyth, P.; Levine, P.A.; Yu, S.; Foufoula-Georgiou, E. Zonally Contrasting Shifts of the Tropical Rain Belt in Response to Climate Change. Nat. Clim. Change 2021, 11, 1–9. [Google Scholar] [CrossRef]
  7. Durack, P.J.; Wijffels, S.E.; Matear, R.J. Ocean Salinities Reveal Strong Global Water Cycle Intensification during 1950 to 2000. Science 2012, 336, 455–458. [Google Scholar] [CrossRef] [Green Version]
  8. Kundzewicz, Z.W.; Mata, L.; Arnell, N.W.; Döll, P.; Jimenez, B.; Miller, K.; Oki, T.; Şen, Z.; Shiklomanov, I. The Implications of Projected Climate Change for Freshwater Resources and Their Management. Hydrol. Sci. J. 2008, 53, 3–10. [Google Scholar] [CrossRef]
  9. Grill, G.; Lehner, B.; Thieme, M.; Geenen, B.; Tickner, D.; Antonelli, F.; Babu, S.; Borrelli, P.; Cheng, L.; Crochetiere, H.; et al. Mapping the World’s Free-Flowing Rivers. Nature 2019, 569, 215–221. [Google Scholar] [CrossRef]
  10. World Commission on Dams Dams and Development: A New Framework for Decision-Making: The Report of the World Commission on Dams; Earthscan: London, UK, 2000; ISBN 978-1-85383-798-2.
  11. Syvitski, J.P.M. Deltas at Risk. Sustain. Sci. 2008, 3, 23–32. [Google Scholar] [CrossRef]
  12. Syvitski, J.P.M.; Kettner, A.J.; Overeem, I.; Hutton, E.W.H.; Hannon, M.T.; Brakenridge, G.R.; Day, J.; Vörösmarty, C.; Saito, Y.; Giosan, L.; et al. Sinking Deltas Due to Human Activities. Nat. Geosci. 2009, 2, 681–686. [Google Scholar] [CrossRef]
  13. Dunn, F.E.; Darby, S.E.; Nicholls, R.J.; Cohen, S.; Zarfl, C.; Fekete, B.M. Projections of Declining Fluvial Sediment Delivery to Major Deltas Worldwide in Response to Climate Change and Anthropogenic Stress. Environ. Res. Lett. 2019, 14, 084034. [Google Scholar] [CrossRef]
  14. Palmer, M.A.; Liermann, C.A.R.; Nilsson, C.; Flörke, M.; Alcamo, J.; Lake, P.S.; Bond, N. Climate Change and the World’s River Basins: Anticipating Management Options. Front. Ecol. Environ. 2008, 6, 81–89. [Google Scholar] [CrossRef] [Green Version]
  15. IEA World Energy Outlook 2020; International Energy Agency: Paris, France, 2020.
  16. Opperman, J.; Hartmann, J.; Harrison, D. Hydropower within the Climate, Energy and Water Nexus. In Climate, Energy and Water: Managing Trade-offs, Seizing Opportunities; Dovers, S., Hussey, K., Pittock, J., Eds.; Cambridge University Press: Cambridge, UK, 2015; pp. 79–107. [Google Scholar]
  17. Opperman, J.; Hartmann, J.; Lambrides, M.; Carvallo, J.; Chapin, E.; Baruch-Mordo, S.; Eyler, B.; Goichot, M.; Harou, J.; Hepp, J. Connected and Flowing: A Renewable Future for Rivers, Climate, and People; WWF and The Nature Conservancy: Washington, DC, USA, 2019. [Google Scholar]
  18. Opperman, J.; Baruch-Mordo, S.; Carvallo, J.; Kammen, D.; Kiesecker, J.; Weber, C. Sustaining the Last Rivers. Am. Sci. 2019, 107, 302. [Google Scholar] [CrossRef]
  19. Ansar, A.; Flyvbjerg, B.; Budzier, A.; Lunn, D. Should We Build More Large Dams? The Actual Costs of Hydropower Megaproject Development. Energy Policy 2014, 69, 43–56. [Google Scholar] [CrossRef] [Green Version]
  20. IPCC. Global Warming of 1.5 °C; Intergovernmental Panel on Climate Change: Geneva, Switzerland, 2018. [Google Scholar]
  21. IEA. Net Zero by 2050—A Roadmap for the Global Energy Sector; International Energy Agency: Paris, France, 2021. [Google Scholar]
  22. International Renewable Energy Agency. World Energy Transitions Outlook: 1.5 °C Pathway; International Renewable Energy Agency: Abu Dhabi, United Arab Emirates, 2021. [Google Scholar]
  23. Von Randow, R.C.S.; Rodriguez, D.A.; Tomasella, J.; Aguiar, A.P.D.; Kruijt, B.; Kabat, P. Response of the River Discharge in the Tocantins River Basin, Brazil, to Environmental Changes and the Associated Effects on the Energy Potential. Reg. Environ. Change 2019, 19, 193–204. [Google Scholar] [CrossRef]
  24. Beilfuss, D.R. A Risky Climate for Southern African Hydro; International Rivers: Berkeley, CA, USA, 2012; p. 60. [Google Scholar]
  25. van Vliet, M.T.H.; Wiberg, D.; Leduc, S.; Riahi, K. Power-Generation System Vulnerability and Adaptation to Changes in Climate and Water Resources. Nat. Clim. Change 2016, 6, 375–380. [Google Scholar] [CrossRef]
  26. Latrubesse, E.M.; Park, E.; Sieh, K.; Dang, T.; Lin, Y.N.; Yun, S.-H. Dam Failure and a Catastrophic Flood in the Mekong Basin (Bolaven Plateau), Southern Laos, 2018. Geomorphology 2020, 362, 107221. [Google Scholar] [CrossRef]
  27. Beggin, R. Midland Failed Dams, Floods Caused $200M in Damages to 2500 Buildings. Bridge Michigan. 2020. Available online: https://www.bridgemi.com/michigan-government/midland-failed-dams-floods-caused-200m-damages-2500-buildings (accessed on 21 January 2022).
  28. Opperman, J.; Hartmann, J.; Raepple, J.; Angarita, H.; Beames, P.; Chapin, E.; Geressu, R.; Grill, G.; Harou, J.; Hurford, A.; et al. The Power of Rivers: A Business Case; The Nature Conservancy: Arlington, VA, USA, 2017. [Google Scholar]
  29. Opperman, J.J.; Grill, G.; Hartmann, J. The Power of Rivers; The Nature Conservancy: Arlington, VA, USA, 2015. [Google Scholar]
  30. Milly, P.C.D.; Betancourt, J.; Falkenmark, M.; Hirsch, R.M.; Kundzewicz, Z.W.; Lettenmaier, D.P.; Stouffer, R.J. Stationarity Is Dead: Whither Water Management? Science 2008, 319, 573–574. [Google Scholar] [CrossRef]
  31. Poff, N.L.; Brown, C.M.; Grantham, T.E.; Matthews, J.H.; Palmer, M.A.; Spence, C.M.; Wilby, R.L.; Haasnoot, M.; Mendoza, G.F.; Dominique, K.C.; et al. Sustainable Water Management under Future Uncertainty with Eco-Engineering Decision Scaling. Nat. Clim. Change 2016, 6, 25–34. [Google Scholar] [CrossRef] [Green Version]
  32. Matthews, J.H.; Wickel, B.A.J.; Freeman, S. Converging Currents in Climate-Relevant Conservation: Water, Infrastructure, and Institutions. PLoS Biol. 2011, 9, e1001159. [Google Scholar] [CrossRef] [Green Version]
  33. WWF; WBCSD. Right Tool for the Job: Tools and Approaches for Companies and Investors to Assess Water Risks and Shared Water Challenges; The World Wildlife Fund (WWF) and the World Business Council for Sustainable Development (WBCSD): Washington, DC, USA, 2020. [Google Scholar]
  34. Ebinger, J.; Vergara, W. Climate Impacts on Energy Systems; World Bank Studies; The World Bank: Washington, DC, USA, 2011; ISBN 978-0-8213-8697-2. [Google Scholar]
  35. Hallegatte, S. Strategies to Adapt to an Uncertain Climate Change. Glob. Environ. Change 2009, 19, 240–247. [Google Scholar] [CrossRef]
  36. Hallegatte, S.; Rentschler, J.; Rozenberg, J. Adaptation Principles: A Guide for Designing Strategies for Climate Change Adaptation and Resilience; The World Bank: Washington, DC, USA, 2020. [Google Scholar]
  37. ICOLD. Dam Safety Management; International Commission on Large Dams: Paris, France, 2021. [Google Scholar]
  38. ICOLD. Flood Evaluation and Dam Safety; International Commission on Large Dams: Paris, France, 2018. [Google Scholar]
  39. International Hydropower Association. Hydropower Sector Climate Resilience Guide; International Hydropower Association: London, UK, 2019. [Google Scholar]
  40. Karki, P.; Bonzanigo, L.; Ohtsuka, H.; Pahuja, S. Toward Climate-Resilient Hydropower in South Asia; The World Bank: Washington, DC, USA, 2016. [Google Scholar]
  41. Lehner, B.; Liermann, C.R.; Revenga, C.; Vörösmarty, C.; Fekete, B.; Crouzet, P.; Döll, P.; Endejan, M.; Frenken, K.; Magome, J.; et al. High-resolution Mapping of the World’s Reservoirs and Dams for Sustainable River-flow Management. Front. Ecol. Environ. 2011, 9, 494–502. [Google Scholar] [CrossRef] [Green Version]
  42. Zarfl, C.; Lumsdon, A.E.; Berlekamp, J.; Tydecks, L.; Tockner, K. A Global Boom in Hydropower Dam Construction. Aquat. Sci. 2015, 77, 161–170. [Google Scholar] [CrossRef]
  43. Schulte, P.; Morrison, J. Driving Harmonization of Water-Related Terminology. CEO Water Mandate Discussion Paper; Pacific Institute: Oakland, CA, USA, 2014. [Google Scholar]
  44. Laporte-Bisquit, A. WWF Water Risk Filter: Assess, Respond & Value Water Risks. In Sustainable Industrial Water Use: Perspecitves, Incentives, Tools; IWA Publishing: London, UK, 2021. [Google Scholar] [CrossRef]
  45. Lehner, B.; Grill, G. Global River Hydrography and Network Routing: Baseline Data and New Approaches to Study the World’s Large River Systems. Hydrol. Processes 2013, 27, 2171–2186. [Google Scholar] [CrossRef]
  46. IPCC. AR5 Synthesis Report: Climate Change 2014; Intergovernmental Panel on Climate Change (IPCC): Geneva, Switzerland, 2014. [Google Scholar]
  47. O’Neill, B.C.; Kriegler, E.; Ebi, K.L.; Kemp-Benedict, E.; Riahi, K.; Rothman, D.S.; van Ruijven, B.J.; van Vuuren, D.P.; Birkmann, J.; Kok, K.; et al. The Roads Ahead: Narratives for Shared Socioeconomic Pathways Describing World Futures in the 21st Century. Glob. Environ. Change 2017, 42, 169–180. [Google Scholar] [CrossRef] [Green Version]
  48. Riahi, K.; van Vuuren, D.P.; Kriegler, E.; Edmonds, J.; O’Neill, B.C.; Fujimori, S.; Bauer, N.; Calvin, K.; Dellink, R.; Fricko, O.; et al. The Shared Socioeconomic Pathways and Their Energy, Land Use, and Greenhouse Gas Emissions Implications: An Overview. Glob. Environ. Change 2017, 42, 153–168. [Google Scholar] [CrossRef] [Green Version]
  49. Hoekstra, A.Y.; Chapagain, A.K. Water Footprints of Nations: Water Use by People as a Function of Their Consumption Pattern. In Integrated Assessment of Water Resources and Global Change: A North-South Analysis; Craswell, E., Bonnell, M., Bossio, D., Demuth, S., Van De Giesen, N., Eds.; Springer: Dordrecht, The Netherlands, 2007; pp. 35–48. ISBN 978-1-4020-5591-1. [Google Scholar]
  50. Trabucco, A.; Zomer, R. Global Aridity Index and Potential Evapotranspiration (ET0) Climate Database V2. 2019. Available online: https://0-doi-org.brum.beds.ac.uk/10.6084/m9.figshare.7504448.v3 (accessed on 21 January 2022).
  51. Brauman, K.A.; Richter, B.D.; Postel, S.; Malsy, M.; Flörke, M. Water Depletion: An Improved Metric for Incorporating Seasonal and Dry-Year Water Scarcity into Water Risk Assessments. Elem. Sci. Anthr. 2016, 4, 83. [Google Scholar] [CrossRef] [Green Version]
  52. Hofste, R.; Kuzma, S.; Walker, S.; Sutanudjaja, E.; Bierkens, M.; Kuijper, M.; Faneca Sanchez, M.; Van Beek, R.; Wada, Y.; Galvis Rodríguez, S.; et al. Aqueduct 3.0: Updated Decision-Relevant Global Water Risk Indicators; World Recources Insititute: Washington, DC, USA, 2019. [Google Scholar] [CrossRef]
  53. Mekonnen, M.M.; Hoekstra, A.Y. Four Billion People Facing Severe Water Scarcity. Sci. Adv. 2016, 2, e1500323. [Google Scholar] [CrossRef] [Green Version]
  54. Boulay, A.-M.; Bare, J.; Benini, L.; Berger, M.; Lathuillière, M.J.; Manzardo, A.; Margni, M.; Motoshita, M.; Núñez, M.; Pastor, A.V.; et al. The WULCA Consensus Characterization Model for Water Scarcity Footprints: Assessing Impacts of Water Consumption Based on Available Water Remaining (AWARE). Int. J. Life Cycle Assess. 2018, 23, 368–378. [Google Scholar] [CrossRef] [Green Version]
  55. Vicente-Serrano, S.M.; Beguería, S.; López-Moreno, J.I. A Multiscalar Drought Index Sensitive to Global Warming: The Standardized Precipitation Evapotranspiration Index. J. Clim. 2010, 23, 1696–1718. [Google Scholar] [CrossRef] [Green Version]
  56. Frieler, K.; Lange, S.; Piontek, F.; Reyer, C.P.O.; Schewe, J.; Warszawski, L.; Zhao, F.; Chini, L.; Denvil, S.; Emanuel, K.; et al. Assessing the Impacts of 1.5 °C Global Warming—Simulation Protocol of the Inter-Sectoral Impact Model Intercomparison Project (ISIMIP2b). Geosci. Model Dev. 2017, 10, 4321–4345. [Google Scholar] [CrossRef] [Green Version]
  57. Greve, P.; Kahil, T.; Mochizuki, J.; Schinko, T.; Satoh, Y.; Burek, P.; Fischer, G.; Tramberend, S.; Burtscher, R.; Langan, S.; et al. Global Assessment of Water Challenges under Uncertainty in Water Scarcity Projections. Nat. Sustain. 2018, 1, 486–494. [Google Scholar] [CrossRef]
  58. Kummu, M.; Fader, M.; Gerten, D.; Guillaume, J.H.; Jalava, M.; Jägermeyr, J.; Pfister, S.; Porkka, M.; Siebert, S.; Varis, O. Bringing It All Together: Linking Measures to Secure Nations’ Food Supply. Curr. Opin. Environ. Sustain. 2017, 29, 98–117. [Google Scholar] [CrossRef] [Green Version]
  59. Brakenridge, G.R. Global Active Archive of Large Flood Events; Dartmouth Flood Observatory, University of Colorado: Boulder, CO, USA, 2020. [Google Scholar]
  60. Hirabayashi, Y.; Mahendran, R.; Koirala, S.; Konoshima, L.; Yamazaki, D.; Watanabe, S.; Kim, H.; Kanae, S. Global Flood Risk under Climate Change. Nat. Clim. Change 2013, 3, 816–821. [Google Scholar] [CrossRef]
  61. Abell, R.; Thieme, M.L.; Revenga, C.; Bryer, M.; Kottelat, M.; Bogutskaya, N.; Coad, B.; Mandrak, N.; Balderas, S.C.; Bussing, W.; et al. Freshwater Ecoregions of the World: A New Map of Biogeographic Units for Freshwater Biodiversity Conservation. BioScience 2008, 58, 403–414. [Google Scholar] [CrossRef] [Green Version]
  62. Turner, S.W.D.; Ng, J.Y.; Galelli, S. Examining Global Electricity Supply Vulnerability to Climate Change Using a High-Fidelity Hydropower Dam Model. Sci. Total Environ. 2017, 590–591, 663–675. [Google Scholar] [CrossRef]
  63. Connell-Buck, C.R.; Medellín-Azuara, J.; Lund, J.R.; Madani, K. Adapting California’s Water System to Warm vs. Dry Climates. Clim. Change 2011, 109, 133–149. [Google Scholar] [CrossRef]
  64. Madani, K.; Lund, J.R. Modeling California’s High-Elevation Hydropower Systems in Energy Units. Water Resour. Res. 2009, 45. [Google Scholar] [CrossRef]
  65. MacDonald, E.M. Integrated Water Resources Management Strategy and Implementation Plan for the Zambezi River Basin. SADC-WD/Zambezi River Authority. 2008. Available online: https://zambezicommission.org/sites/default/files/clusters_pdfs/Zambezi%20River_Basin_IWRM_Strategy_ZAMSTRAT.pdf (accessed on 21 January 2022).
  66. Saunders, S.; Findlay, D.; Easley, T.; Spencer, T. Doubled Trouble: More Midwestern Extreme Storms; The Rocky Mountain Climate Organization and the Natural Resources Defense Council: Washington, DC, USA, 2012; pp. 409–419. [Google Scholar]
  67. Lall, U.; Larrauri, P.C. The Michigan Dam Failures Are a Warning. The New York Times, 27 May 2020. [Google Scholar]
  68. Perera, D.; Smakhtin, V.; Williams, S.; North, T.; Curry, A. Ageing Water Storage Infrastructure: An Emerging Global Risk; UNU-INWEH Report Series; Issue 11, United Nations University: Tokyo, Japan, 2021. [Google Scholar]
  69. Lee, J.; Hamlet, A.; Asce, M.; Fitzgerald, C.; Burges, S.; Asce, F. Optimized Flood Control in the Columbia River Basin for a Global Warming Scenario. J. Water Resour. Plan. Manag. 2009, 135. [Google Scholar] [CrossRef] [Green Version]
  70. Payne, J.T.; Wood, A.W.; Hamlet, A.F.; Palmer, R.N.; Lettenmaier, D.P. Mitigating the Effects of Climate Change on the Water Resources of the Columbia River Basin. Clim. Change 2004, 62, 233–256. [Google Scholar] [CrossRef]
  71. Yates, D.; Galbraith, H.; Purkey, D.; Huber-Lee, A.; Sieber, J.; West, J.; Herrod-Julius, S.; Joyce, B. Climate Warming, Water Storage, and Chinook Salmon in California’s Sacramento Valley. Clim. Change 2008, 91, 335. [Google Scholar] [CrossRef]
  72. Bryant, M.D. Global Climate Change and Potential Effects on Pacific Salmonids in Freshwater Ecosystems of Southeast Alaska. Clim. Change 2009, 95, 169–193. [Google Scholar] [CrossRef]
  73. Almeida, R.M.; Fleischmann, A.S.; Brêda, J.P.; Cardoso, D.S.; Angarita, H.; Collischonn, W.; Forsberg, B.; García-Villacorta, R.; Hamilton, S.K.; Hannam, P.M.; et al. Climate Change Impairs Electricity Generation and Economic Viability of Future Amazon Hydropower. Glob. Environ. Change 2021, 71, 102383. [Google Scholar] [CrossRef]
  74. Birru, B.; Ethiopian Droughts Prompt Hydro Rethink. African Business. 2020. Available online: https://african.business/2020/05/energy-resources/ethiopian-droughts-prompt-hydro-rethink/ (accessed on 21 January 2022).
  75. Reuters Staff. African Nations Urged to Avoid Hydropower Reliance; Reuters: London, UK, 2018. [Google Scholar]
  76. Lee, S.-Y.; Fitzgerald, C.J.; Hamlet, A.F.; Burges, S.J. Daily Time-Step Refinement of Optimized Flood Control Rule Curves for a Global Warming Scenario. J. Water Resour. Plan. Manag. 2011, 137, 309–317. [Google Scholar] [CrossRef] [Green Version]
  77. Acreman, M.; Smith, A.; Charters, L.; Tickner, D.; Opperman, J.; Acreman, S.; Edwards, F.; Sayers, P.; Chivava, F. Evidence for the Effectiveness of Nature-Based Solutions to Water Issues in Africa. Environ. Res. Lett. 2021, 16, 063007. [Google Scholar] [CrossRef]
  78. Hunink, J.E.; Contreras, S.; Simons, G.; Droogers, P. Hydrological Evaluation and Ecosystem Valuation of the Lukanga Swamps. Future Water Prepared for The Nature Conservancy. 2017. Available online: https://www.futurewater.nl/wp-content/uploads/2017/06/Zambia_Lukanga_v8.pdf (accessed on 21 January 2022).
  79. Opperman, J.J.; Kendy, E.; Barrios, E. Securing Environmental Flows Through System Reoperation and Management: Lessons From Case Studies of Implementation. Front. Environ. Sci. 2019, 7, 104. [Google Scholar] [CrossRef] [Green Version]
  80. Opperman, J.J.; Kendy, E.; Tharme, R.E.; Warner, A.T.; Barrios, E.; Richter, B.D. A Three-Level Framework for Assessing and Implementing Environmental Flows. Front. Environ. Sci. 2018, 6, 76. [Google Scholar] [CrossRef]
  81. Noonan, M.J.; Grant, J.W.; Jackson, C.D. A Quantitative Assessment of Fish Passage Efficiency. Fish Fish. 2012, 13, 450–464. [Google Scholar] [CrossRef]
  82. Bartholow, J.; Hanna, R.B.; Saito, L.; Lieberman, D.; Horn, M. Simulated Limnological Effects of the Shasta Lake Temperature Control Device. Environ. Manag. 2001, 27, 609–626. [Google Scholar] [CrossRef]
  83. Stella, J.C.; Battles, J.J.; McBride, J.R. Restoring Recruitment Processes for Riparian Cottonwoods and Willows: A Field Calibrated Predictive Model for the Lower San Joaquin Basin; Stillwater Sciences: Berkeley, CA, USA, 2006. [Google Scholar]
  84. Pittock, J.; Hartmann, J. Taking a Second Look: Climate Change, Periodic Relicensing and Improved Management of Dams. Mar. Freshwater Res. 2011, 62, 312–320. [Google Scholar] [CrossRef]
  85. Opperman, J.; Royte, J.; Banks, J.; Rose Day, L.; Apse, C. The Penobscot River, Maine, USA: A Basin-Scale Approach to Balancing Power Generation and Ecosystem Restoration. Ecol. Soc. 2011, 16. [Google Scholar] [CrossRef]
  86. Hurford, A.P.; Harou, J.J.; Bonzanigo, L.; Ray, P.A.; Karki, P.; Bharati, L.; Chinnasamy, P. Efficient and Robust Hydropower System Design under Uncertainty—A Demonstration in Nepal. Renew. Sustain. Energy Rev. 2020, 132, 109910. [Google Scholar] [CrossRef]
  87. UN Water. 2018 UN World Water Development Report, Nature-Based Solutions for Water; UNESCO: Geneva, Switzerland, 2018. [Google Scholar]
  88. Opperman, J.J.; Moyle, P.B.; Larsen, E.W.; Florsheim, J.L.; Manfree, A.D. Floodplains: Processes and Management for Ecosystem Services; University of California Press: Berkeley, CA, USA, 2017; ISBN 0-520-96632-5. [Google Scholar]
  89. Shearer, A.W. Approaching Scenario-Based Studies: Three Perceptions about the Future and Considerations for Landscape Planning. Environ. Plan. B 2005, 32, 67–87. [Google Scholar] [CrossRef]
Figure 1. The WWF Water Risk Filter Risk’s risk classes and respective thresholds. * The “extreme risk” class is only applied in the case of future scenarios.
Water 14 00721 g001
Figure 2. Proportion of existing hydropower projects in basins with different classes for risk of water scarcity currently (2020) and in 2050 under three scenario pathways: optimistic, current trend, and pessimistic.
Water 14 00721 g002
Figure 3. The shift in risk classes between 2020 and 2050 (pessimistic scenario) for existing and projected hydropower projects, in water scarcity (a,b) and flood risk (c,d).
Water 14 00721 g003
Figure 4. (a) Distribution of existing dams with color indicating the projected relative change in basin risk for water scarcity in 2050 under the pessimistic scenario. The size of the circle reflects the hydropower capacity of the dam. See the interactive version of this map at https://rcamargo.shinyapps.io/HydropowerClimateChange.; (accessed 21 January 2022). (b) Change in water scarcity risk (vertical axis) for the river basins of existing hydropower dams by 2050 according to country or subnational region under the pessimistic scenario. Bar color indicates current risk and width indicates aggregate hydropower capacity.
Water 14 00721 g004
Figure 5. Proportion of existing hydropower projects in different risk classes for flood risk currently (2020) and in 2050 under three scenario pathways: optimistic, current trend, and pessimistic.
Water 14 00721 g005
Figure 6. (a) Distribution of existing dams with color indicating the projected change in relative flood risk in 2050 under the pessimistic scenario. The size of the circle reflects the hydropower capacity of the dam. See the interactive version of this map at https://rcamargo.shinyapps.io/HydropowerClimateChange; (accessed 21 January 2022). (b) Change in flood risk (vertical axis) for existing hydropower dams by 2050 according to country or subnational region under the pessimistic scenario. Bar color indicates current risk and width indicates aggregate hydropower capacity.
Water 14 00721 g006aWater 14 00721 g006b
Figure 7. Proportion of projected hydropower projects in different risk classes for risk of water scarcity currently (2020) and in 2050 under three scenario pathways: optimistic, current trend, and pessimistic.
Water 14 00721 g007
Figure 8. (a) Distribution of projected hydropower dams with color indicating the projected change in relative risk for water scarcity in 2050 under the pessimistic scenario. The size of the circle reflects the hydropower capacity of the dam. See the interactive version of this map at https://rcamargo.shinyapps.io/HydropowerClimateChange; (accessed 21 January 2022). (b) Change in water scarcity risk (vertical axis) for the basins of projected hydropower dams by 2050 according to country or subnational region under the pessimistic scenario. Bar color indicates current risk and width indicates aggregate hydropower capacity.
Water 14 00721 g008
Figure 9. Proportion of projected hydropower projects in different risk classes for flood risk currently (2020) and in 2050 under three scenario pathways: optimistic, current trend, and pessimistic.
Water 14 00721 g009
Figure 10. (a) Distribution of projected hydropower dams with color indicating the projected change in relative flood risk in 2050 under the pessimistic scenario. The size of the circle reflects the hydropower capacity of the dam. See the interactive version of this map at https://rcamargo.shinyapps.io/HydropowerClimateChange; (accessed 21 January 2022). (b) Change in flood risk (vertical axis) for the basins of projected hydropower dams by 2050 according to country or subnational region under the pessimistic scenario. Bar color indicates current risk and width indicates aggregate hydropower capacity.
Water 14 00721 g010
Figure 11. Interaction of projected water scarcity risk and projected flood risk, under the 2050 pessimistic scenario for all dams in this study (existing and projected).
Water 14 00721 g011
Figure 12. All hydropower dams in this study (existing and projected) with color indicating the combined projected risks of water scarcity and floods by 2050, under a pessimistic scenario, using the same color pattern as Figure 11. The size of circles indicates the hydropower capacity of the dam. See the interactive version of this map at https://rcamargo.shinyapps.io/HydropowerClimateChange; (accessed 21 January 2022).
Water 14 00721 g012
Figure 13. Distribution of biodiversity risk, based on species richness and endemism of freshwater fish, in the locations of existing hydropower dams (left) and where projected hydropower dams are planned (right). Note that biodiversity risk is only expressed in terms of 2020 data, so here we describe the current status of fish endemism and fish richness of basins where projected dams will be potentially located, not a projection of future biodiversity status.
Water 14 00721 g013
Figure 14. (a) Existing hydropower dams with color indicating biodiversity risk (based on species richness and endemism of freshwater fish in the dam’s river basin). The size of the circle indicates the hydropower capacity of the dam. (b) Projected hydropower dams with color indicating biodiversity risk (based on species richness and endemism of freshwater fish in the dam’s river basin). The size of circles indicates hydropower capacity. See the interactive version of these maps at https://rcamargo.shinyapps.io/HydropowerClimateChange; (accessed 21 January 2022).
Water 14 00721 g014aWater 14 00721 g014b
Figure 15. Biodiversity risk (using 2020 data for freshwater species richness) and projected risk of water scarcity under the pessimistic scenario for all dams in this study (existing and projected).
Water 14 00721 g015
Figure 16. All hydropower dams in this study (existing and projected) with color indicating combined risks of biodiversity loss and future water scarcity, using the same color pattern as Figure 15. The size of circles indicates the hydropower capacity of the dam. See the interactive version of this map at https://rcamargo.shinyapps.io/HydropowerClimateChange; (accessed 21 January 2022).
Water 14 00721 g016
Publisher’s Note: MDPI stays neutral with regard to jurisdictional claims in published maps and institutional affiliations.

