Article

Evaluation of the Groundwater and Irrigation Quality in the Zhuoshui River Alluvial Fan between Wet and Dry Seasons

1
Agricultural Engineering Research Center, 196-1 Chung Yuan Road, Zhongli, Taoyuan City 320, Taiwan
2
Water Administration Division, Water Resources Agency, MOEA, 501, Sec. 2, Liming Road, Taichung 408, Taiwan
3
Department of Water Resources and Environmental Engineering, Tamkang University, 151 Yingzhuan Road, Tamsul, New Taipei City 251, Taiwan
*
Author to whom correspondence should be addressed.
Submission received: 16 March 2022 / Revised: 30 April 2022 / Accepted: 2 May 2022 / Published: 6 May 2022

Abstract

:
The Zhuoshui River alluvial fan is one of the most important groundwater and agricultural areas in Taiwan. Abundant groundwater resources are the main source of domestic water supply and irrigation water. However, groundwater recharge and groundwater quality have been greatly affected under extreme climate and hydrological conditions. Hence, the quality of groundwater has been a topic of concern to the public. In this study, groundwater level and groundwater quality data of the Zhuoshui River alluvial fan from 2008 to 2020 were used to divide the wet and dry season groups according to the sampling dates. An independent samples t-test was used to evaluate the differences in the mean groundwater level and the mean concentration between the wet and dry seasons. The test results show that there was no statistically significant difference in the mean groundwater level between the wet and dry seasons. This may result from the time lag effects of groundwater recharge. Except for groundwater temperature, bicarbonate, and total organic carbon (TOC), there were no significant differences among the mean concentrations of other groundwater quality parameters in Aquifer 1 and Aquifer 2 between the wet and dry seasons. In terms of the alluvial fan location, although the soil texture, land utilization, cropping systems, and hydrogeology of the proximal, mid-, and distal fan may affect groundwater quality variations, it seems that only Aquifer 1 is affected by surface water infiltration, resulting in significant differences in mean groundwater temperature, mean concentrations of major ions, and nitrate between the wet and dry seasons, whereas Aquifer 2 is less affected. At the same time, owing to the geological conditions and intensive cultivation in the Zhuoshui River alluvial fan, nitrate and arsenic could represent a high risk to the public’s health if groundwater is used as a source for domestic water supply or irrigation water in the distal fan area, whether in the wet season or dry season. Meanwhile, due to global climate change and uneven droughts and floods, the hydrological conditions of the so-called “wet season” and “dry season” are obviously different from those in the past. Compared with precipitation, groundwater level may be a better indicator for understanding variations in groundwater quality.

1. Introduction

The Zhuoshui River alluvial fan is one of the most important groundwater and agricultural areas in Taiwan, and is also one of the areas with the earliest development and utilization of groundwater resources. According to statistics from the Water Resource Agency (WRA) [1], there are more than 198,500 public and private wells scattered in the Zhuoshui River alluvial fan for irrigation, and most of them draw out groundwater from Aquifer 1 and Aquifer 2. The production of rice, vegetables, hog carcass weight, and inland aquaculture account for 38.2%, 39.1%, 42.3%, and 20.7% of Taiwan’s total production, respectively [2]. Hence, the abundant groundwater resources are the main water source for agricultural and even domestic water supply in this area due to insufficient surface water resources. Moreover, the over extraction of groundwater in this area has resulted in serious land subsidence for decades [3]. Therefore, groundwater quality has long been concerning to the public. However, global warming and uneven floods, as well as droughts, have become more and more obvious. Hsu (2018) [4] indicates that, as Taiwan advances towards a more extreme climate of being drier and drier and wetter and wetter, the probability of floods or droughts in the future will increase. The most obvious evidence for this is that there was no typhoon landfall in Taiwan from late 2020 to early 2021, which is a 56-year historical record. The water storage of the main reservoir continues to record lows. However, in early August of 2021, Central and Southern Taiwan immediately experienced the heaviest rainfall in the past 10 years, with precipitation that exceeded 100 mm/h and caused flooding in many areas. Such hydrological conditions may result in drastic groundwater recharge variations and a possible impact on groundwater quality as well as irrigation water quality. According to previous studies, Chen and Tsai (2018) [5] have shown that the time lag of surface water infiltration varies depending on factors such as land utilization, geological composition, the thickness of aquifers, etc., which may result in a time lag of several hours, days, tens of days, or even longer. Chang et al. (2014) [6] also indicate that the diurnal variation of the groundwater level of the Zhuoshui River alluvial fan is closely related to the correlation analysis of the river flow and the rainfall of the previous day. The National Chiao Tung University (2017) [7] pointed out that rainfall has a high correlation with the shallow groundwater level on the north bank of the Zhuoshui River and the proximal fan. The WRA, MOEA (2015) [8] also indicated that the groundwater level of the Zhuoshui River alluvial fan is time-lagged by about 3 to 4 months due to rainfall and the recharging of river water. Li et al. (2014) [9] pointed out that the groundwater level is positively correlated with rainfall recharge, but that there is a phenomenon of time lag, however, that gradually shortens from downstream to upstream. This indicates that, the more upstream, the faster the recharge by rainfall. Chen (2015) [10] also pointed out that Aquifer 1 to Aquifer 3 of the Zhuoshui River alluvial fan were recharged by rainfall; the time lag of the groundwater rise was about 2, 6, and 30 h after rainfall, respectively. Consequently, the deeper aquifers had a longer time lag after being recharged by rainfall. Yang (2002) [11], using a binary cross-correlation function analysis, showed that there is a temporal correlation between rainfall and groundwater level in the proximal fan of the Zhuoshui River alluvial fan. Although there is no firmly similar relationship between rainfall and the groundwater level, rainfall can still be a pre-indicator that affects the rise and fall of the groundwater level. Wang et al. (2017) [12] also pointed out that the variations in the groundwater level and river level in the Zhuoshui River alluvial fan are highly correlated during seasonal and annual periods, but not significantly with rainfall.
According to the above results, it is known that groundwater infiltration and recharge with a time lag effect after rainfall may affect groundwater level variations, and that the groundwater quality may also be affected between the wet season (May to October) and the dry season (November to April of the next year). Previous conclusions on the relation between precipitation and water quality appear to be contradictory. Therefore, this paper offers a new look on the subject. In addition, the proximal fan of the Zhuoshui River alluvial fan is the main recharge area. Four aquifers can be connected to each other at the proximal fan area. Owing to the aquifers being blocked by aquitards and the time lag effects, the groundwater level and quality variations at deeper aquifers and mid-fan or distal fan areas are not as timely as those at the proximal fan and Aquifer 1. Therefore, this study collected data on groundwater level and groundwater quality in the Zhuoshui River alluvial fan monitored by the WRA, MOEA from 2008 to 2020. Differences in the groundwater level and groundwater quality were evaluated in Aquifer 1 and Aquifer 2 between the wet season and dry season.

2. Materials and Methods
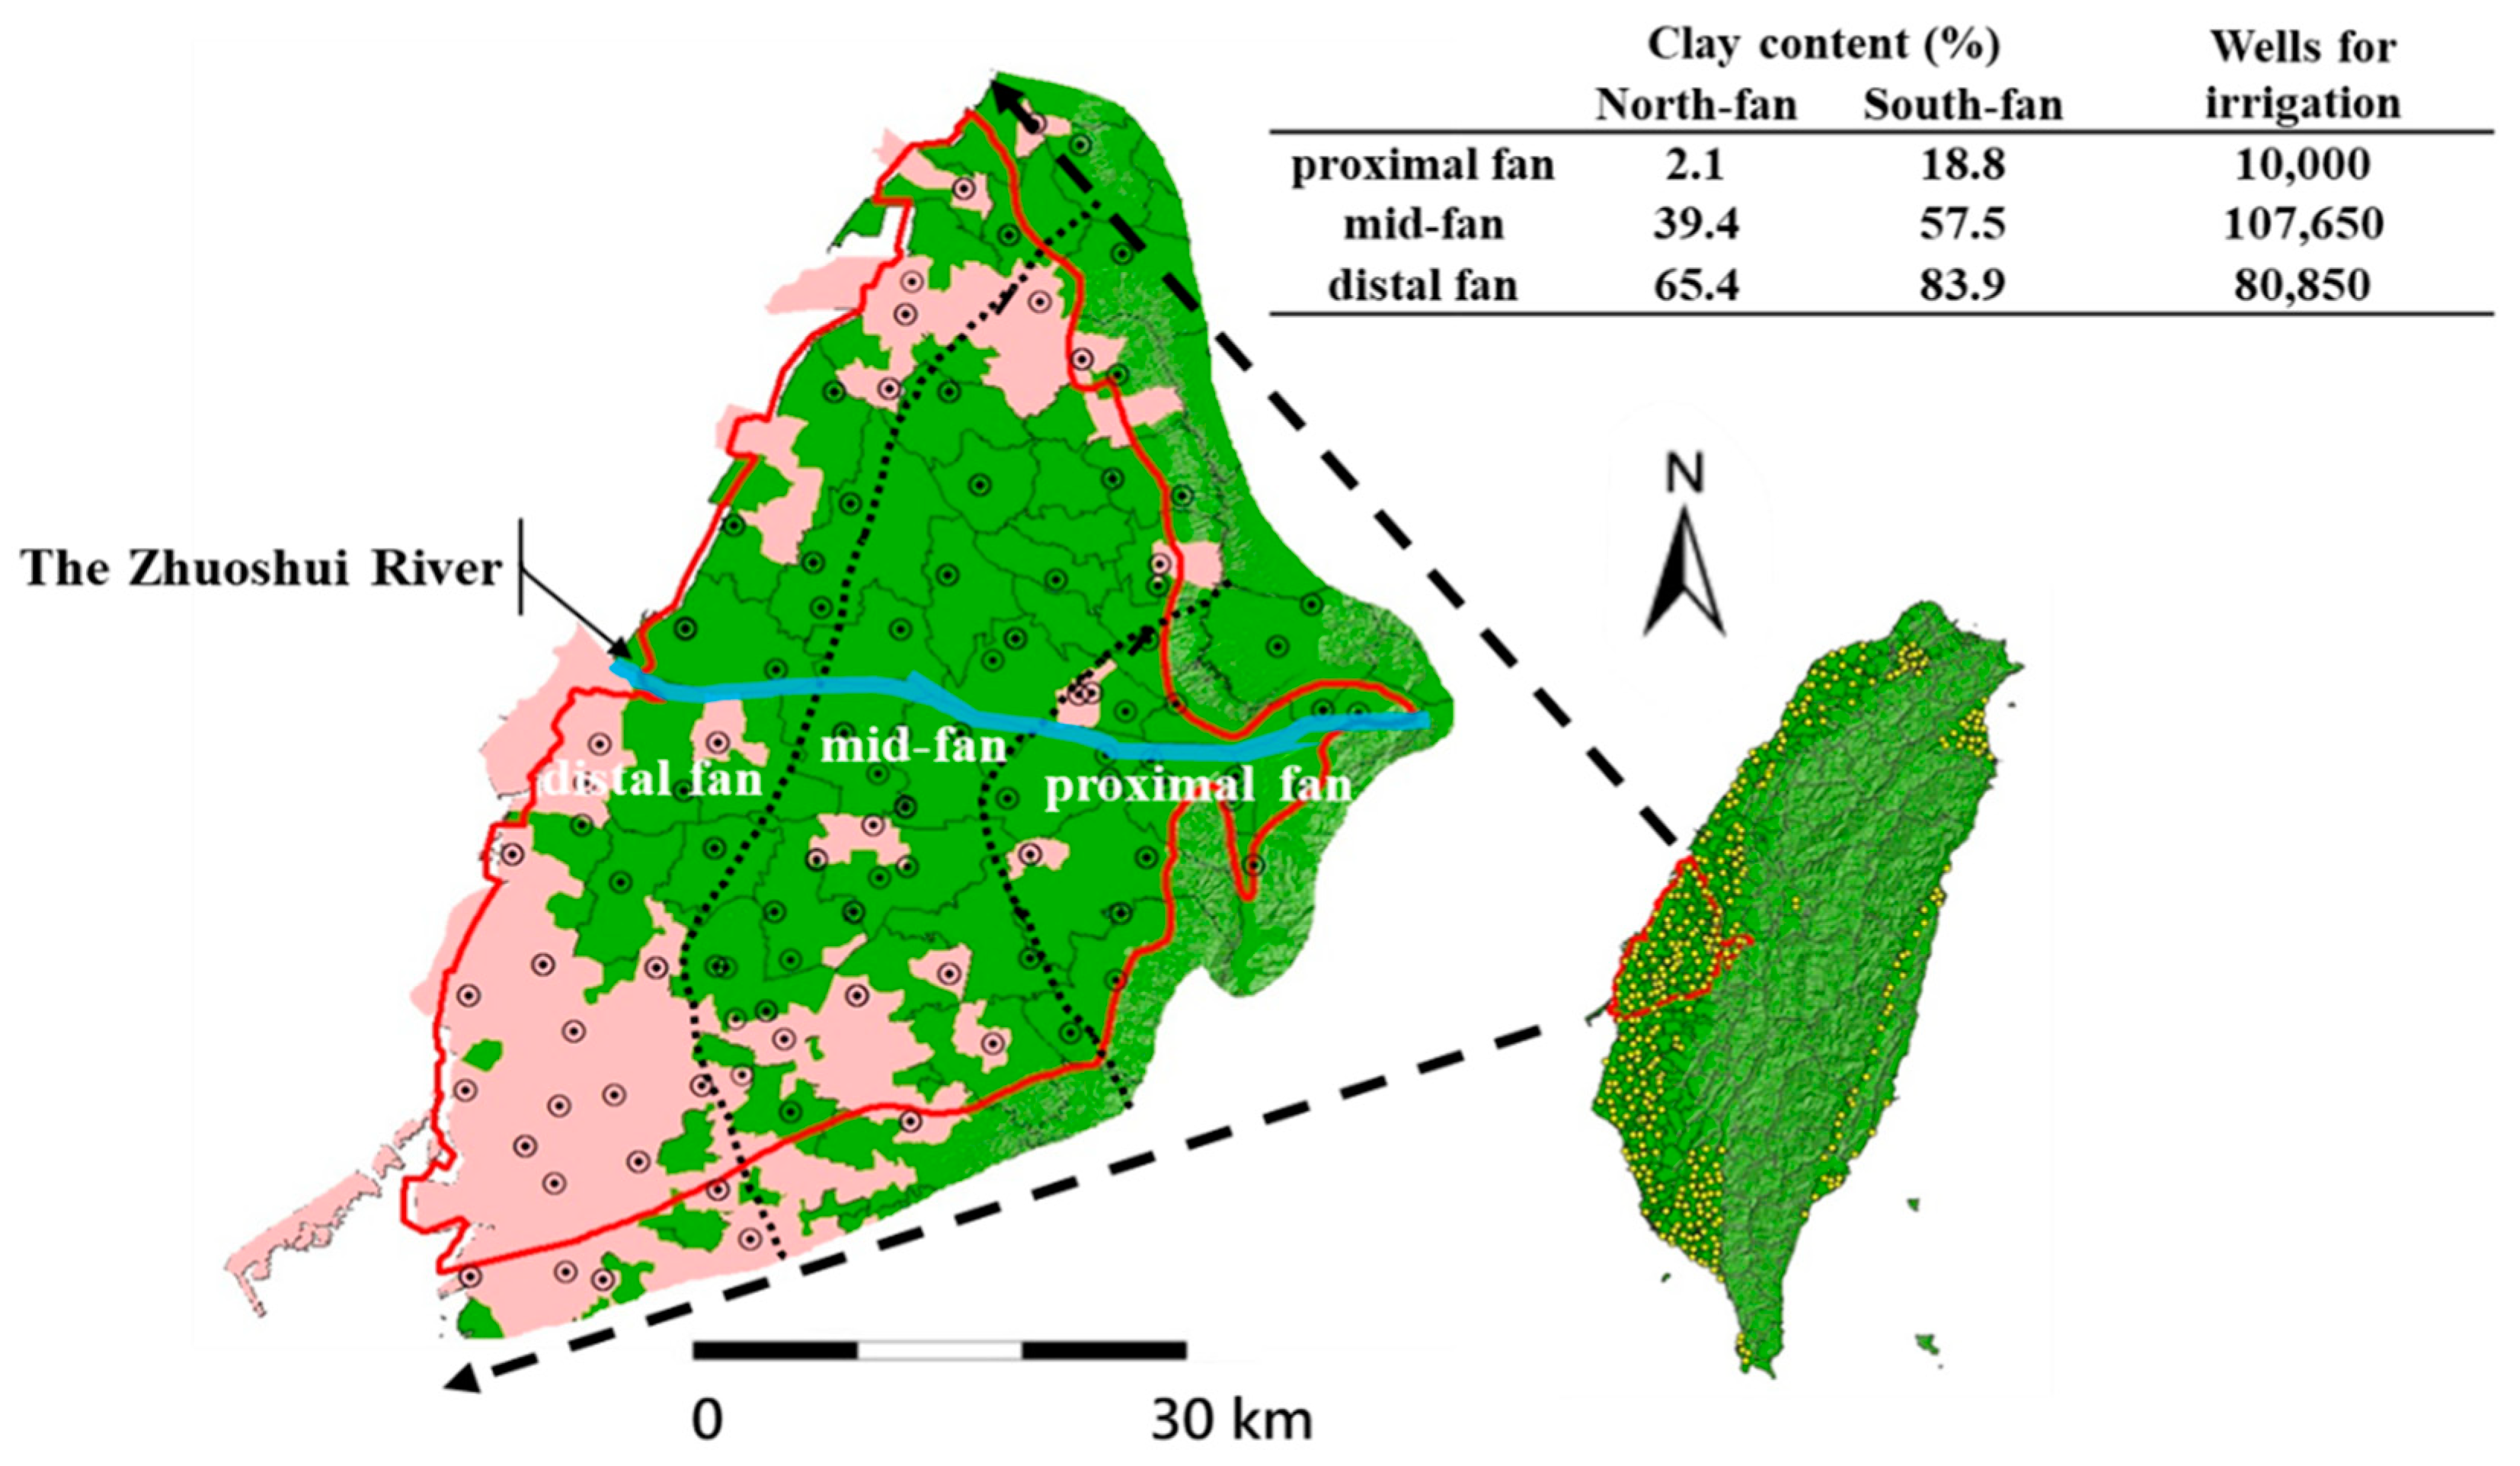
2.1. Study Area

The Zhuoshui River alluvial fan is located in the middle of the western coast of Taiwan. It is about 70 km long and 40 km wide, and covers an area of 2079 km2. The Zhuoshui River flows from east to west, from the central mountainous area through the alluvial fan before discharging into the Taiwan Strait (Wang, 2016) [13]. The terrain is flat, and the elevation is between 0 and 100 m above sea level. The main stratum is composed of unconsolidated clay, fine sand, and gravel. The deeper layers are Pliocene or older, composed of sand and shale with poor permeability and water content (Hydraulic Research Institute, 2012) [14]. The Central Geological Survey (2000) [15] divided the concept layers of groundwater aquifers in the Zhuoshui River alluvial fan into one unconfined and three confined aquifers, named Aquifer 1 to Aquifer 4, which were approximately identified as being shallow to 300 m in depth. Table 1 shows the depth distribution of each of the 4 aquifers. Based on a prior geological investigation (Central Geological Survey, 2000) [15], all of the aquifers are connected to each other at the proximal fan, which is mainly composed of thick gravel layers and located east of the line connecting the Yuanlin, Xizhou, Xiluo, Huxi, and Donghe observation stations. There are no obvious aquitards between the aquifers in the proximal fan, and therefore, rainfall and surface water can be rapidly infiltrated and recharged into the aquifers (Hydraulic Research Institute, 2012; Central Geological Survey, 2014; Jiang, 1999) [14,16,17]. The mid-fan is located between the west of the proximal fan and the east of the line connecting the Haoxiu, Zhaojia, Tanzang, Tianyang, and Beigang observation stations. The distal fan is located between the west of the mid-fan and the coast. Aquitard 1 is located under Aquifer 1, and is widely distributed at the mid-fan and distal fan areas. This being the case, rainfall and surface water cannot recharge the deeper aquifers in the mid-fan and distal fan. However, in terms of stratum materials, the proportion of sand and gravel materials is relatively large in the north of the Zhuoshui River alluvial fan, while the proportion of silt, mud, and clay is larger to the south of the alluvial fan. There are about 10,000, 107,650, and 80,850 public and private wells for irrigation scattered in the proximal fan, mid-fan, and distal fan areas, respectively [1]. Most of the irrigation water has been pumped from Aquifers 1 and 2. Therefore, irrigation water quality may be affected by groundwater quality between the wet and dry seasons due to hydrological condition variations, land utilization, and cropping systems.
In order to grasp the status of groundwater resources in the Zhuoshui River alluvial fan, the WRA has built 95 stations and a total of 235 groundwater observation wells in the four aquifers since 1992. These observation wells are utilized to conduct systematic surveys for groundwater hydrogeology, resources, land subsidence, and groundwater quality monitoring. Figure 1 shows the distribution of the groundwater observation stations built in the 9 major groundwater areas, including the Zhuoshui River alluvial fan in Taiwan, and shows the proximal fan, mid-fan, and distal fan areas with the clay content of the soil and wells for irrigation.

2.2. Study Methods

This study collected 737 datapoints on groundwater level and groundwater quality in the Zhuoshui River alluvial fan during the period of 1993 to 2020, of which 297 and 440 datapoints were sampled from Aquifer 1 and Aquifer 2, respectively. In terms of data grouping, all of the data were divided into the wet season and dry season according to the sampling dates. There are about 308 datapoints from two aquifers during the wet season (May to October), and about 429 datapoints during the dry season (November to April of the next year). The amounts of data during the periods of the wet and dry seasons are not even, since each observation well is not regularly monitored every year. In addition to the groundwater level data, the groundwater quality data include 5 on-site parameters, such as water temperature, pH, conductivity, dissolved oxygen, and redox potential; the other water quality parameters include 8 major anions and cations, such as chloride, sulfate, carbonate, bicarbonate, calcium, magnesium, potassium, and sodium, and the other 7 parameters include iron, manganese, arsenic, nitrate, ammonia nitrogen, TOC, and coliforms. All of the data were divided into two groups of the wet and dry seasons according to the above principles. An independent samples t-test was used to evaluate the difference in the mean groundwater level and the mean concentration between the wet and dry seasons, respectively. If the significance (p-value) is less than 0.05, it can be determined that there is a significant difference between the mean values of the wet and dry seasons.

3. Results and Discussion

3.1. Groundwater Level Variation

Table 2 shows the mean groundwater level of Aquifer 1 and Aquifer 2 in addition to the results of the independent samples t-test in the Zhuoshui River alluvial fan from 2008 to 2020 between the wet and dry seasons. In terms of the groundwater level, there is no significant difference in the mean groundwater level of both aquifers between the wet and dry seasons (p-value > 0.05). However, the groundwater level in both aquifers varies with the terrain, the location of the proximal, mid-, and distal fan, and land utilization. There may be a lower groundwater level in the well of Aquifer 1 at the distal fan area where the groundwater level is lower than the well in Aquifer 2 at the mid- or proximal fan areas. Therefore, this study also divides the proximal, mid-, and distal fan areas of both aquifers to test the mean groundwater level in the wet and dry seasons. It is shown in Table 2 that there is no significant difference in the mean groundwater levels between the wet and dry seasons even in the proximal fan area where no obvious aquitard is, and rainfall and surface water can be easily recharged to the aquifer. Moreover, most of the mean groundwater level of both aquifers in the dry season is higher than in the wet season. This may result from the time lag effects of groundwater recharge (WRA, 2015; Li et al., 2014; Chen, 2015; and Wang et al., 2017) [8,9,10,12].
However, the spatial and temporal distribution of uneven rainfall in Taiwan might be due to global climate changes. The decrease in the days of annual rainfall and short-term heavy rainfall may be one of the reasons for the insignificant difference in the mean groundwater level between the wet season and dry season.

3.2. Groundwater Quality Variation in the Shallow Aquifer of the Alluvial Fan

In terms of groundwater quality, Table 3 shows the results of the independent samples t-test of groundwater quality in the Zhuoshui River alluvial fan from 2008 to 2020. The mean values of all of the groundwater quality parameters are not distinguished by aquifers. In this study, all of the groundwater parameters were analyzed according to the standard method of the Environmental Protection Administration (EPA), Taiwan. All of the cations were analyzed by an inductively coupled plasma optical emission spectrometer (ICP-OES, PerkinElmer Optima 7300 DV); chloride, carbonate, and bicarbonate were analyzed by the titration method; sulfate, nitrate, and ammonia nitrogen were analyzed by a UV/VIS spectrometer (PerkinElmer Lambda 25); As was analyzed by an atomic absorption spectrometer (AAS, PerkinElmer PinAAcle 900F), and the TOC was analyzed using a TOC analyzer (O.I. Analytical, Aurora 1030).
As shown in Table 3, the mean values of a few of the groundwater quality parameters in the dry season are slightly greater than those in the wet season. However, the mean values of all of the groundwater quality parameters are not much different between the wet and dry seasons. According to the test results, only five of the groundwater quality parameters’ (26.3%) mean values show significant differences between the wet and dry seasons, which include groundwater temperature, dissolved oxygen, redox potential, bicarbonate, and TOC. Among these, the differences in the groundwater temperature, dissolved oxygen, and redox potential may reflect the impact of surface water infiltration and recharging after rainfall, while the mean concentrations of the eight main anions and cations, except for bicarbonate, show no significant differences between the wet and dry seasons. Meanwhile, the pollutants of more public concern in groundwater, such as nitrate, ammonia nitrogen, and arsenic, also show no statistically significant differences in the mean concentrations between the wet and dry seasons. Table 3 also shows the standard for irrigation water quality in Taiwan. Electrical conductivity and chloride concentration in both aquifers had gone beyond the standard. Soil salinization could be led by long-term irrigation with high-electrical-conductivity irrigation water. As for the arsenic content, both of the mean concentrations at the wet and dry seasons were higher than the guideline value of 0.01 mg/L for safe drinking water recommended by the World Health Organization (WHO, 2011) [18], and almost reached the standard of irrigation water quality (0.05 mg/L), indicating that the arsenic content in the groundwater in some areas is indeed high, particularly in groundwater that has been used in the mid-fan and distal fan areas. Figure 1 also shows the potentially arsenic-polluted area of groundwater (pink background), where groundwater is used as the irrigation water source for a long time. Although, out of 1142 crops, only 18 crops (1.6%) contained arsenic above the maximum level (ML) of metals in foods of Taiwan (0.35 mg/kg), according to the monitoring data of the Agriculture and Food Agency from 2014 to 2021 [19]. These 18 crops were all unpolished rice samples, with no vegetables, fruits, or grain crops. It is shown that the arsenic accumulated in unpolished rice will endanger food safety and result in health risks for public health.
As far as Aquifer 1 is concerned, the Zhuoshui River alluvial fan has no obvious aquitard in the proximal fan area. Surface water and rainfall can be easily recharged to deeper aquifers (Wang et al., 2017) [12], and groundwater quality will depend on factors such as land utilization. For Aquifer 2, in addition to the proximal fan area, the aquitard blocks groundwater infiltration between the aquifers at the mid-fan and distal fan areas (Institute of Hydraulics, 2012; Central Geological Survey, 2014) [14,16]; considering the time lag effects of groundwater recharge, the groundwater quality of Aquifer 2 may be different from that of Aquifer 1 in the wet and dry seasons. This will be discussed in the next section.

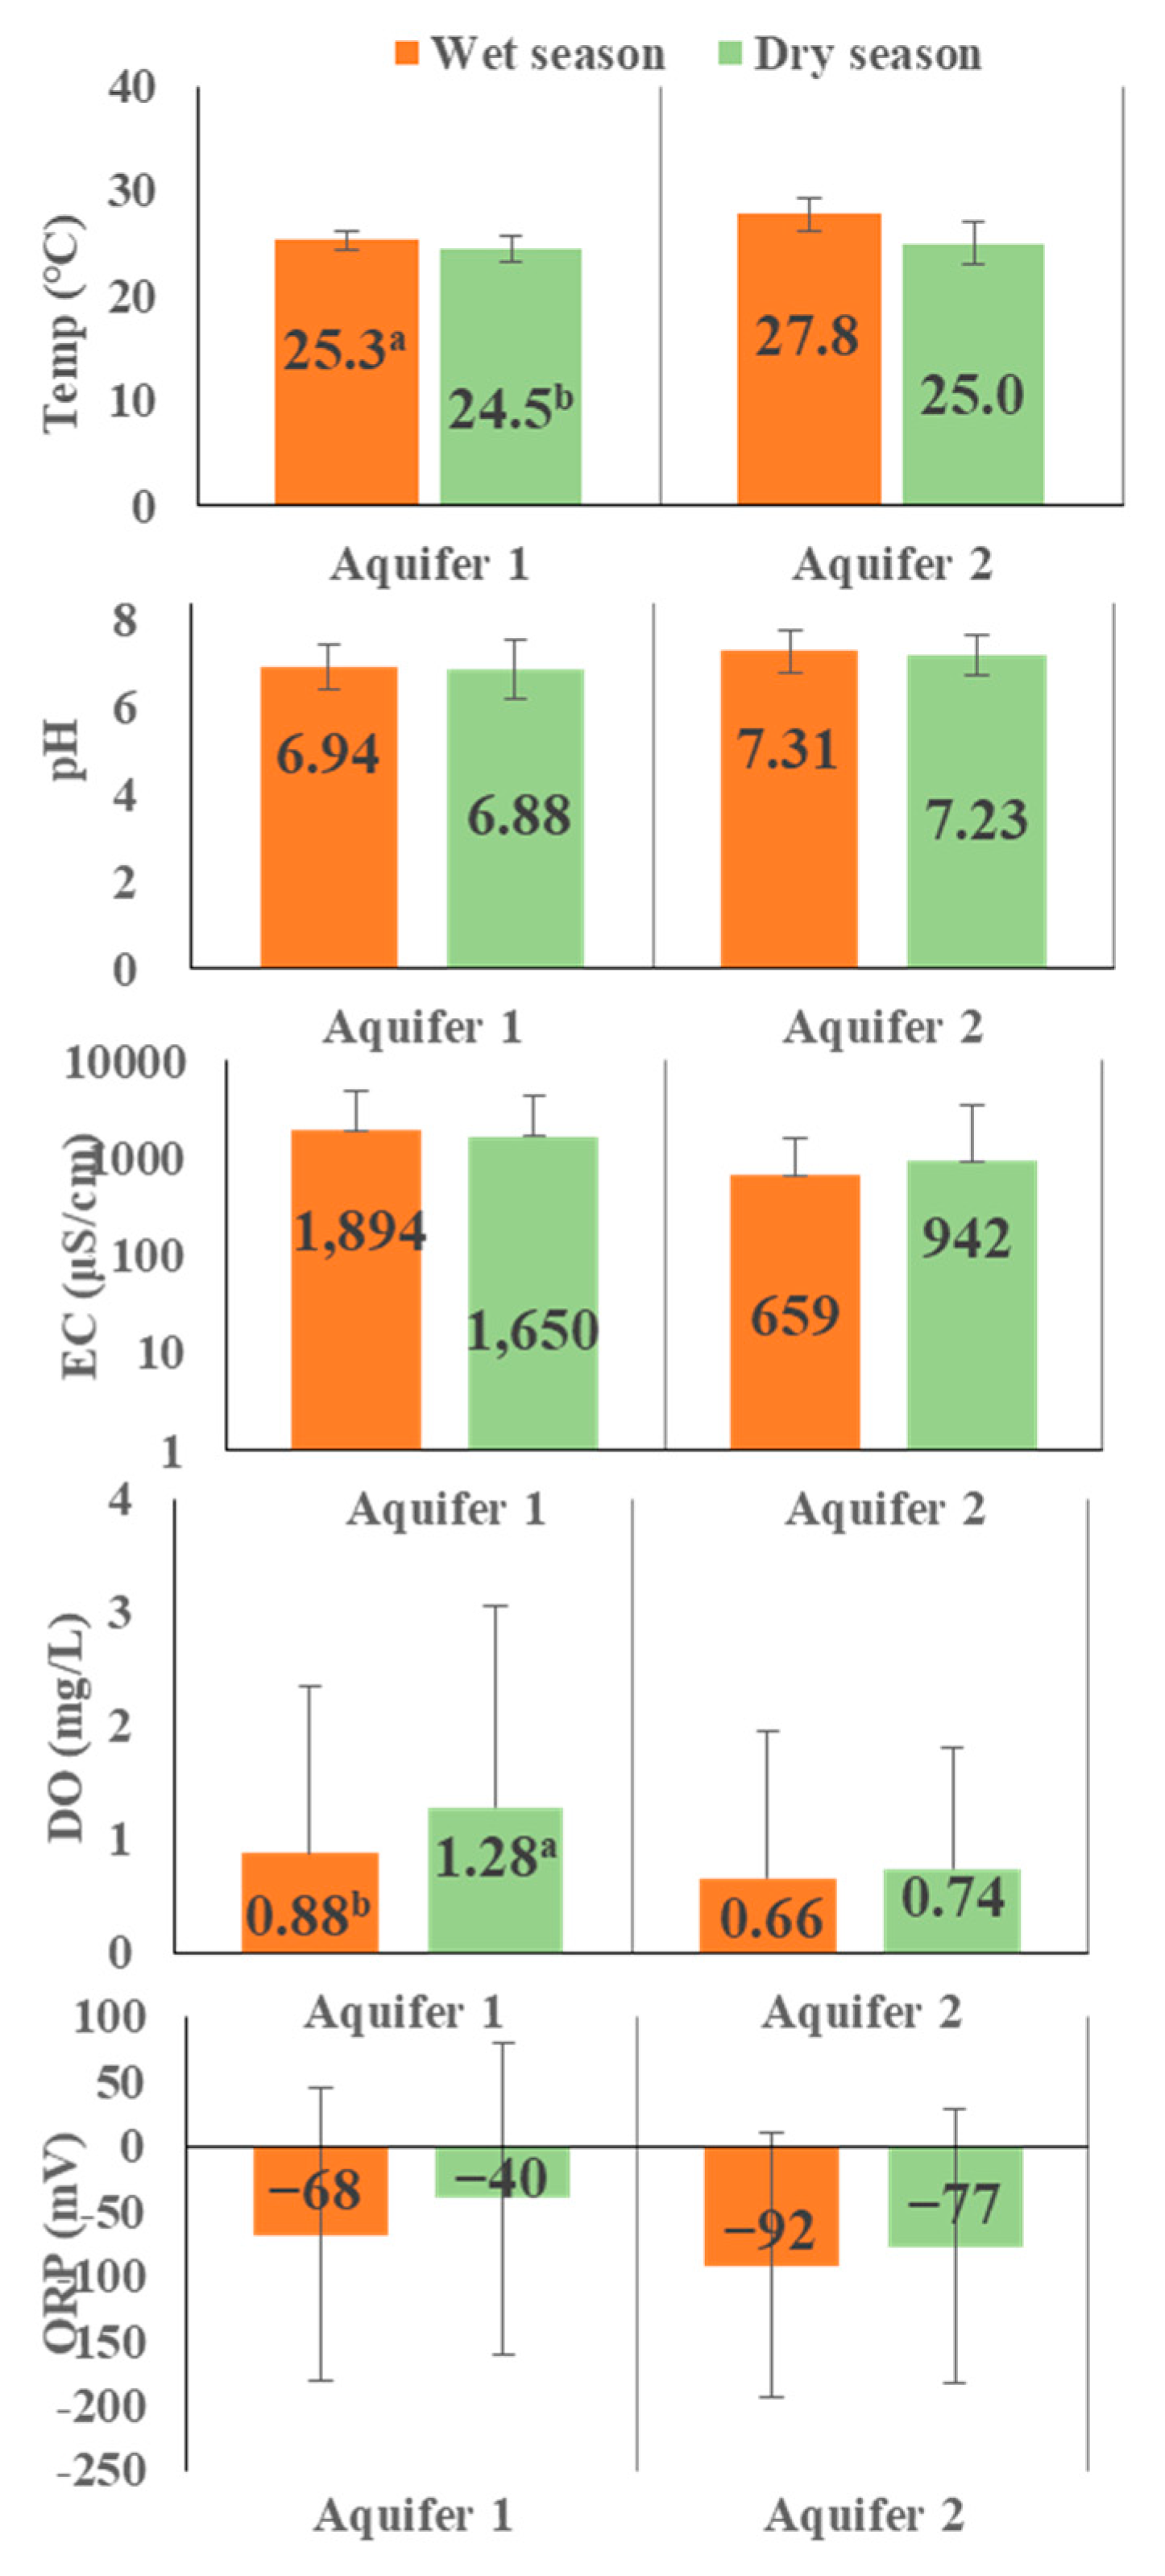
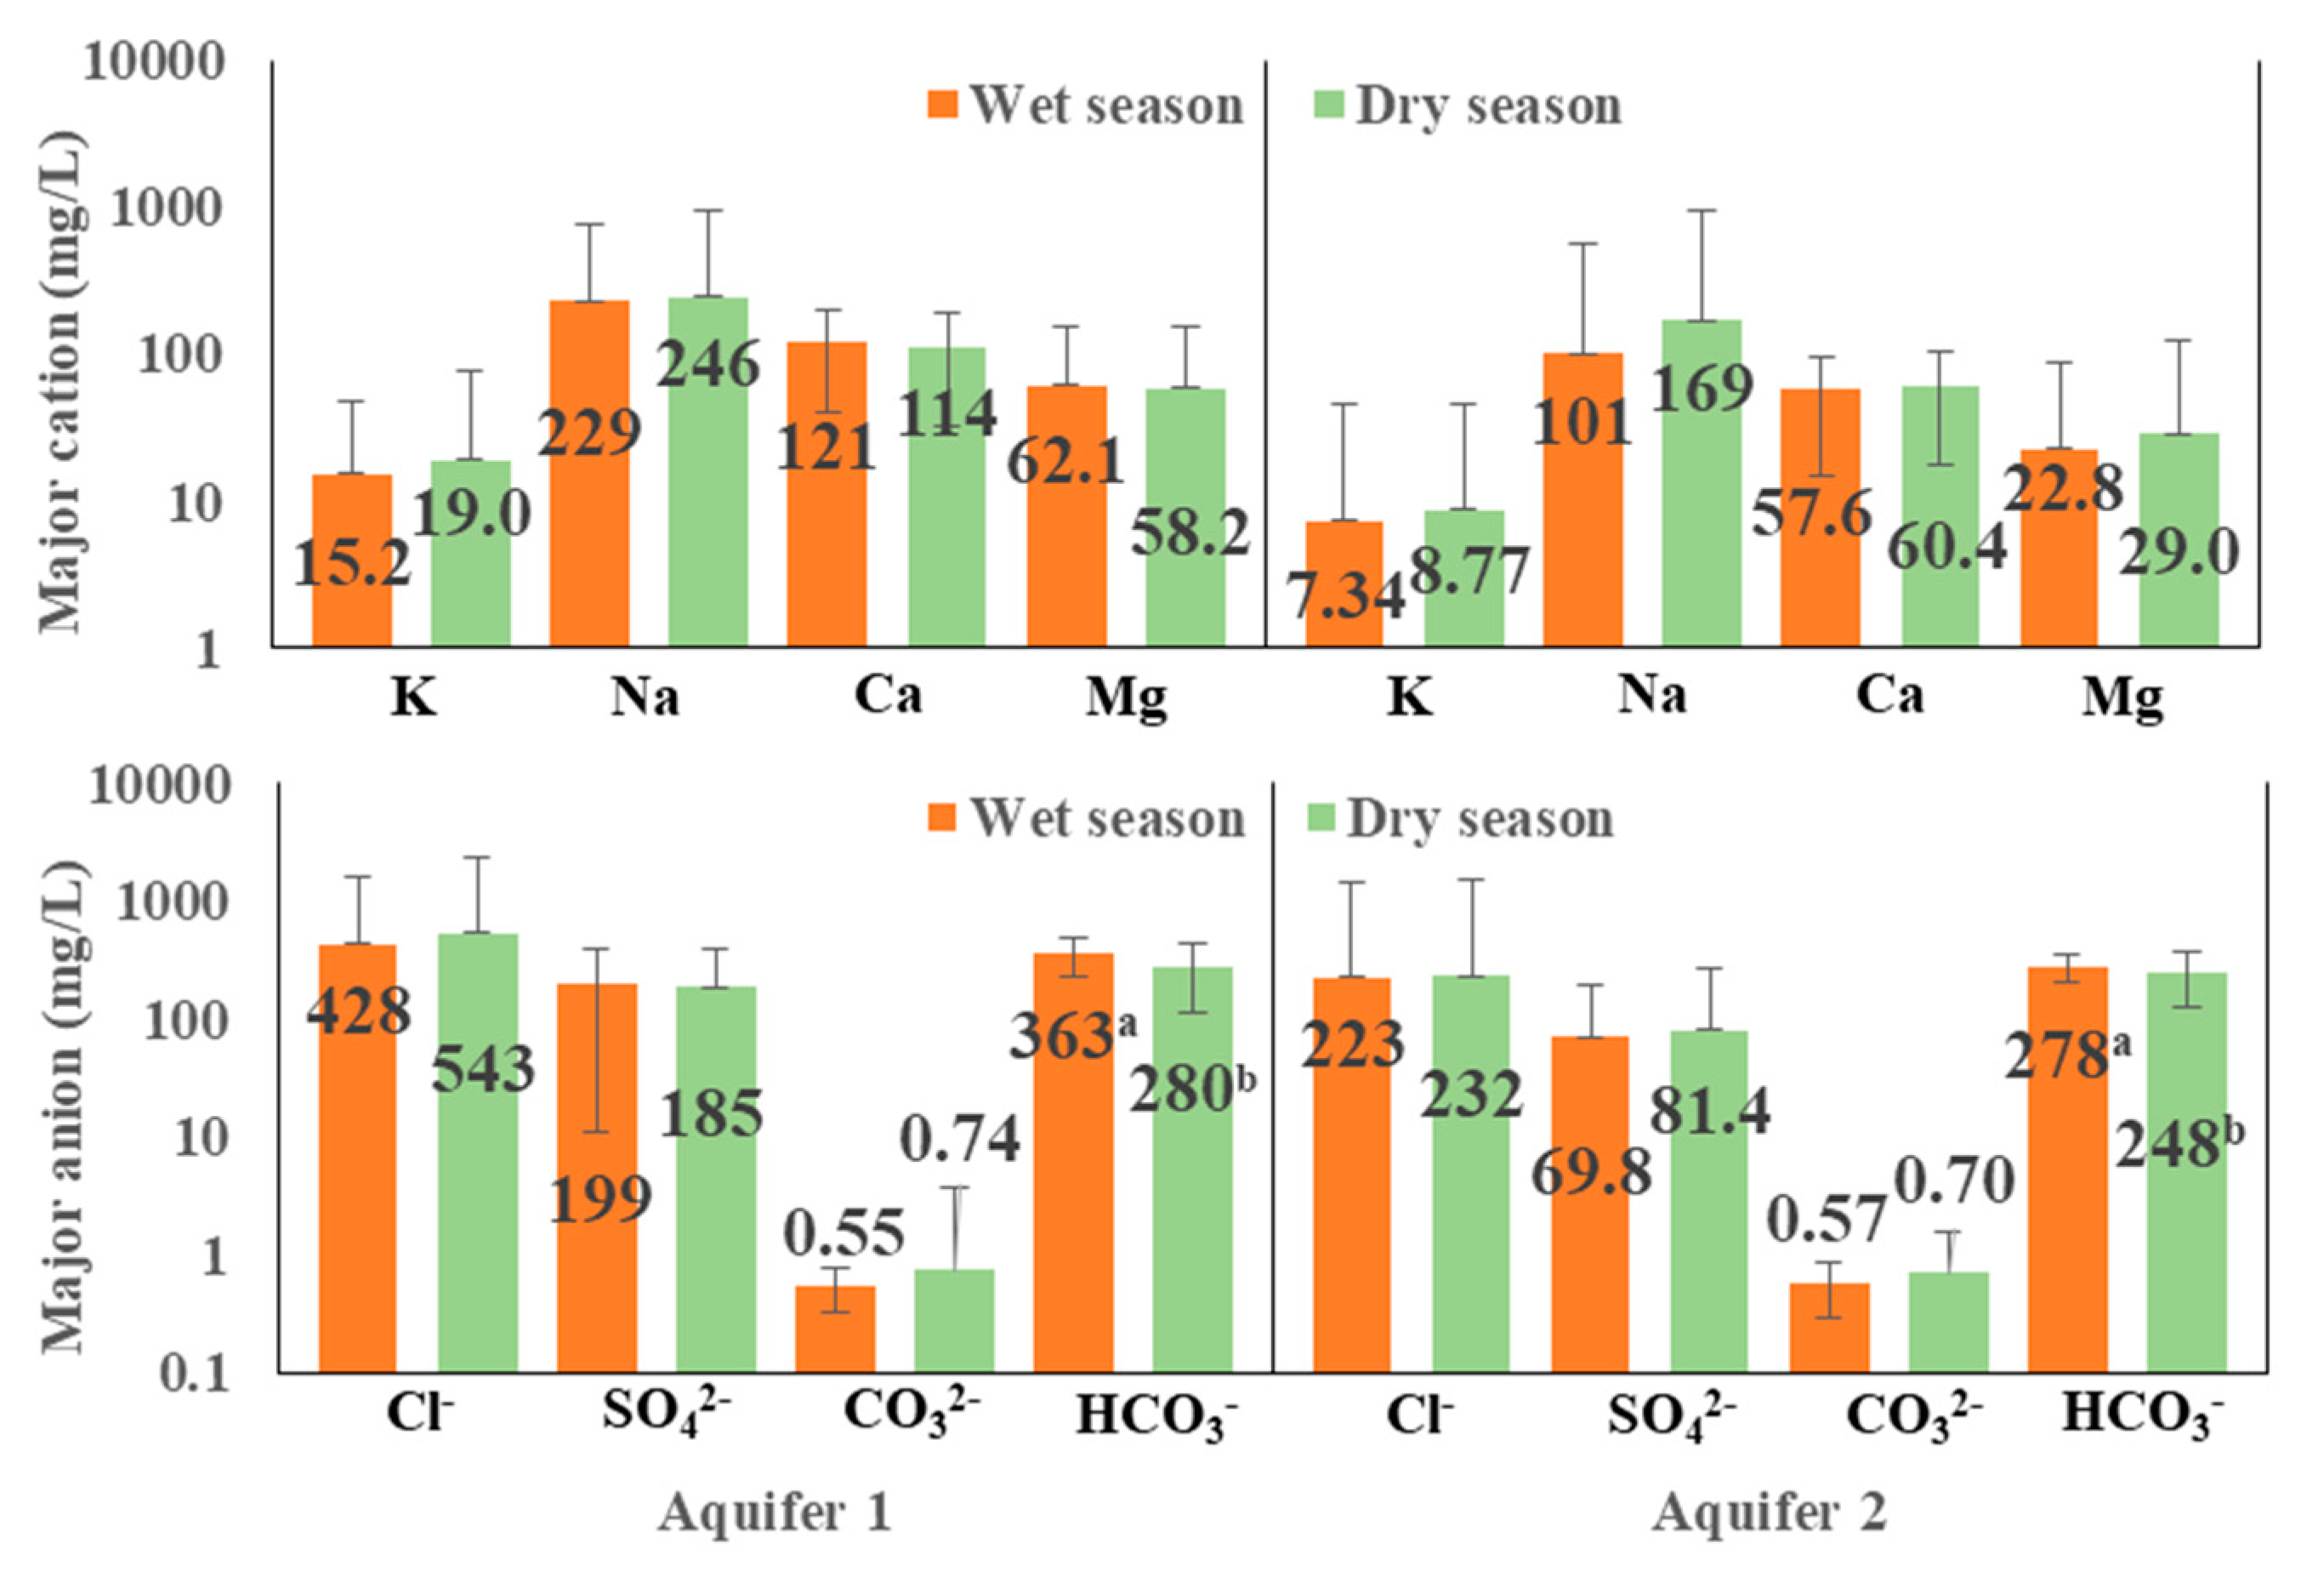
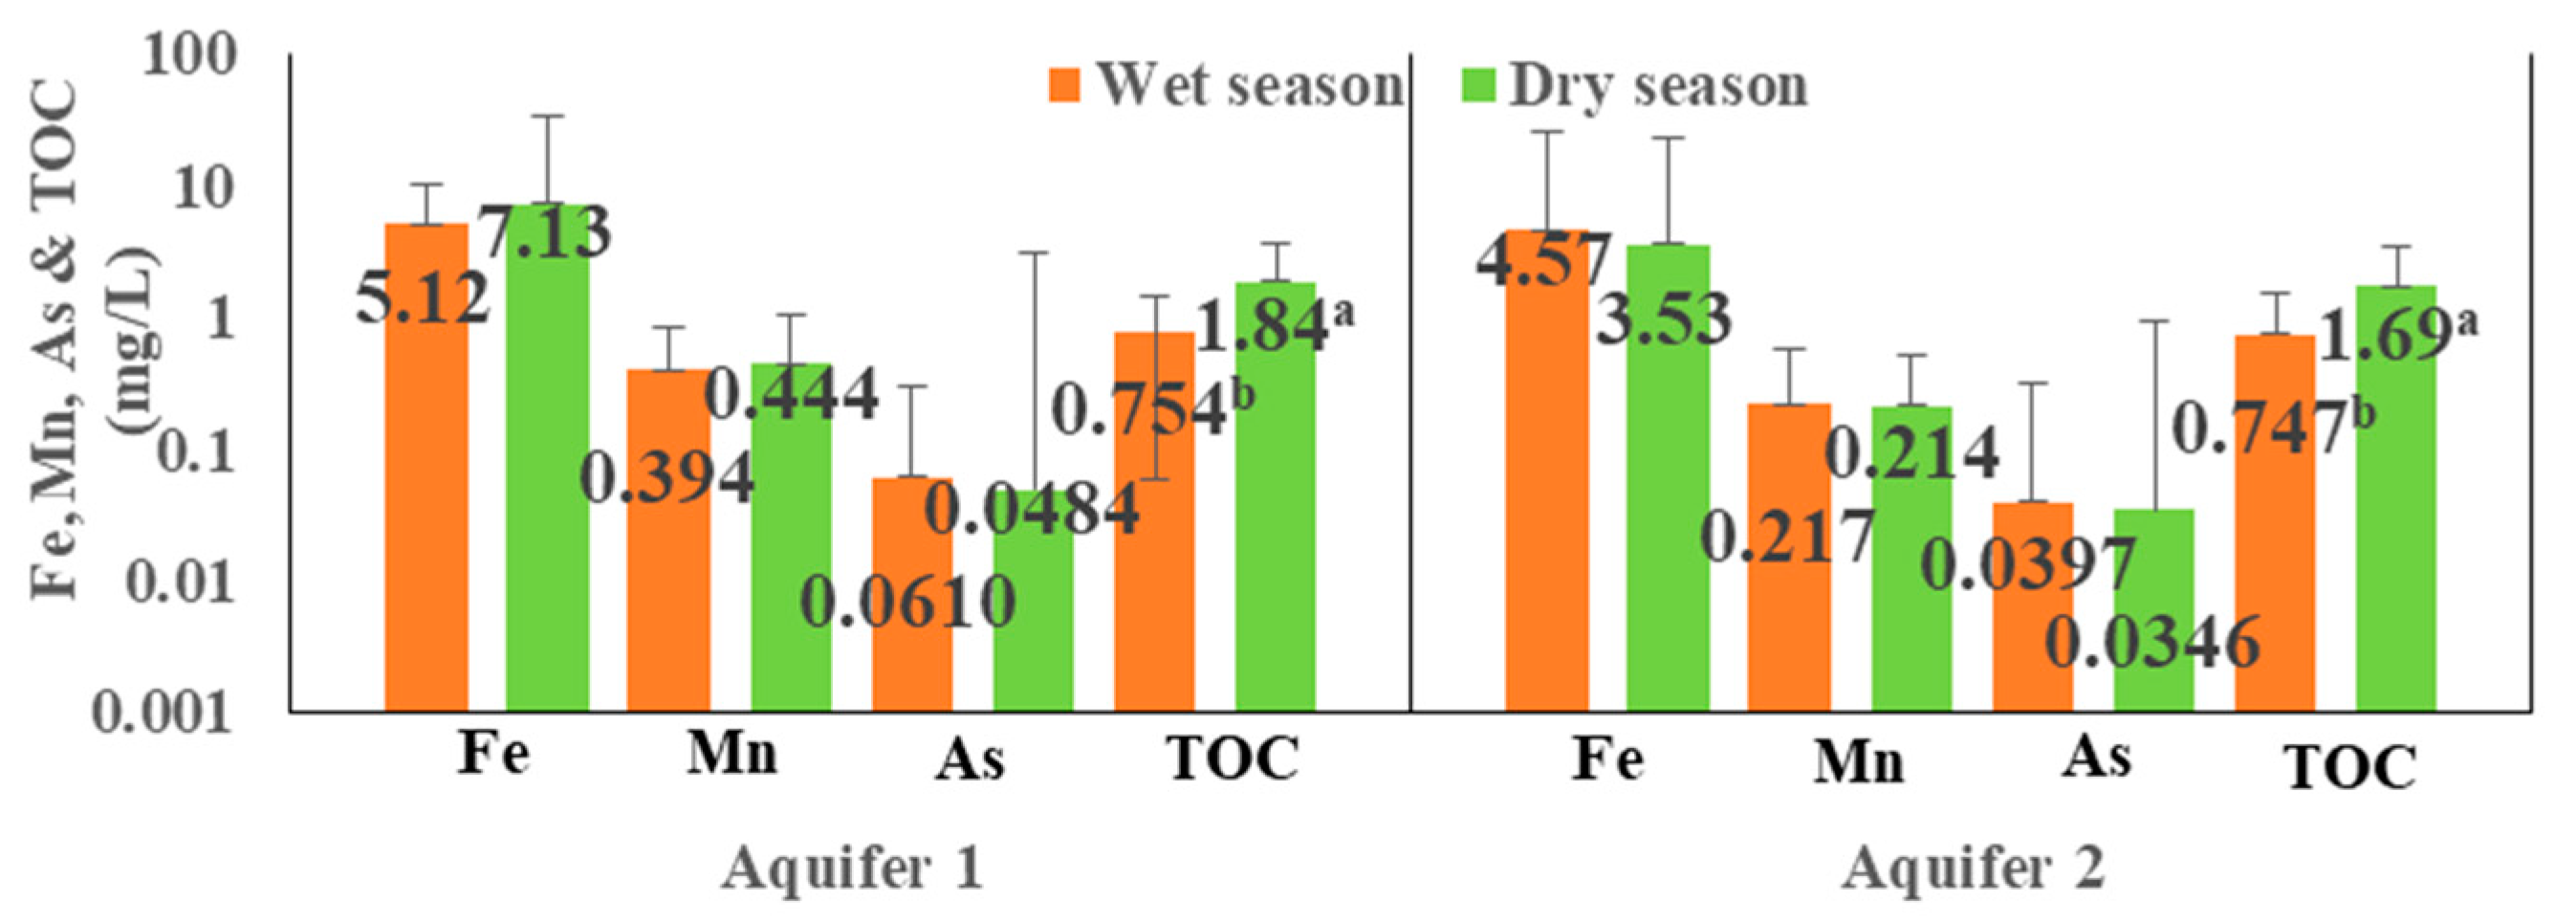
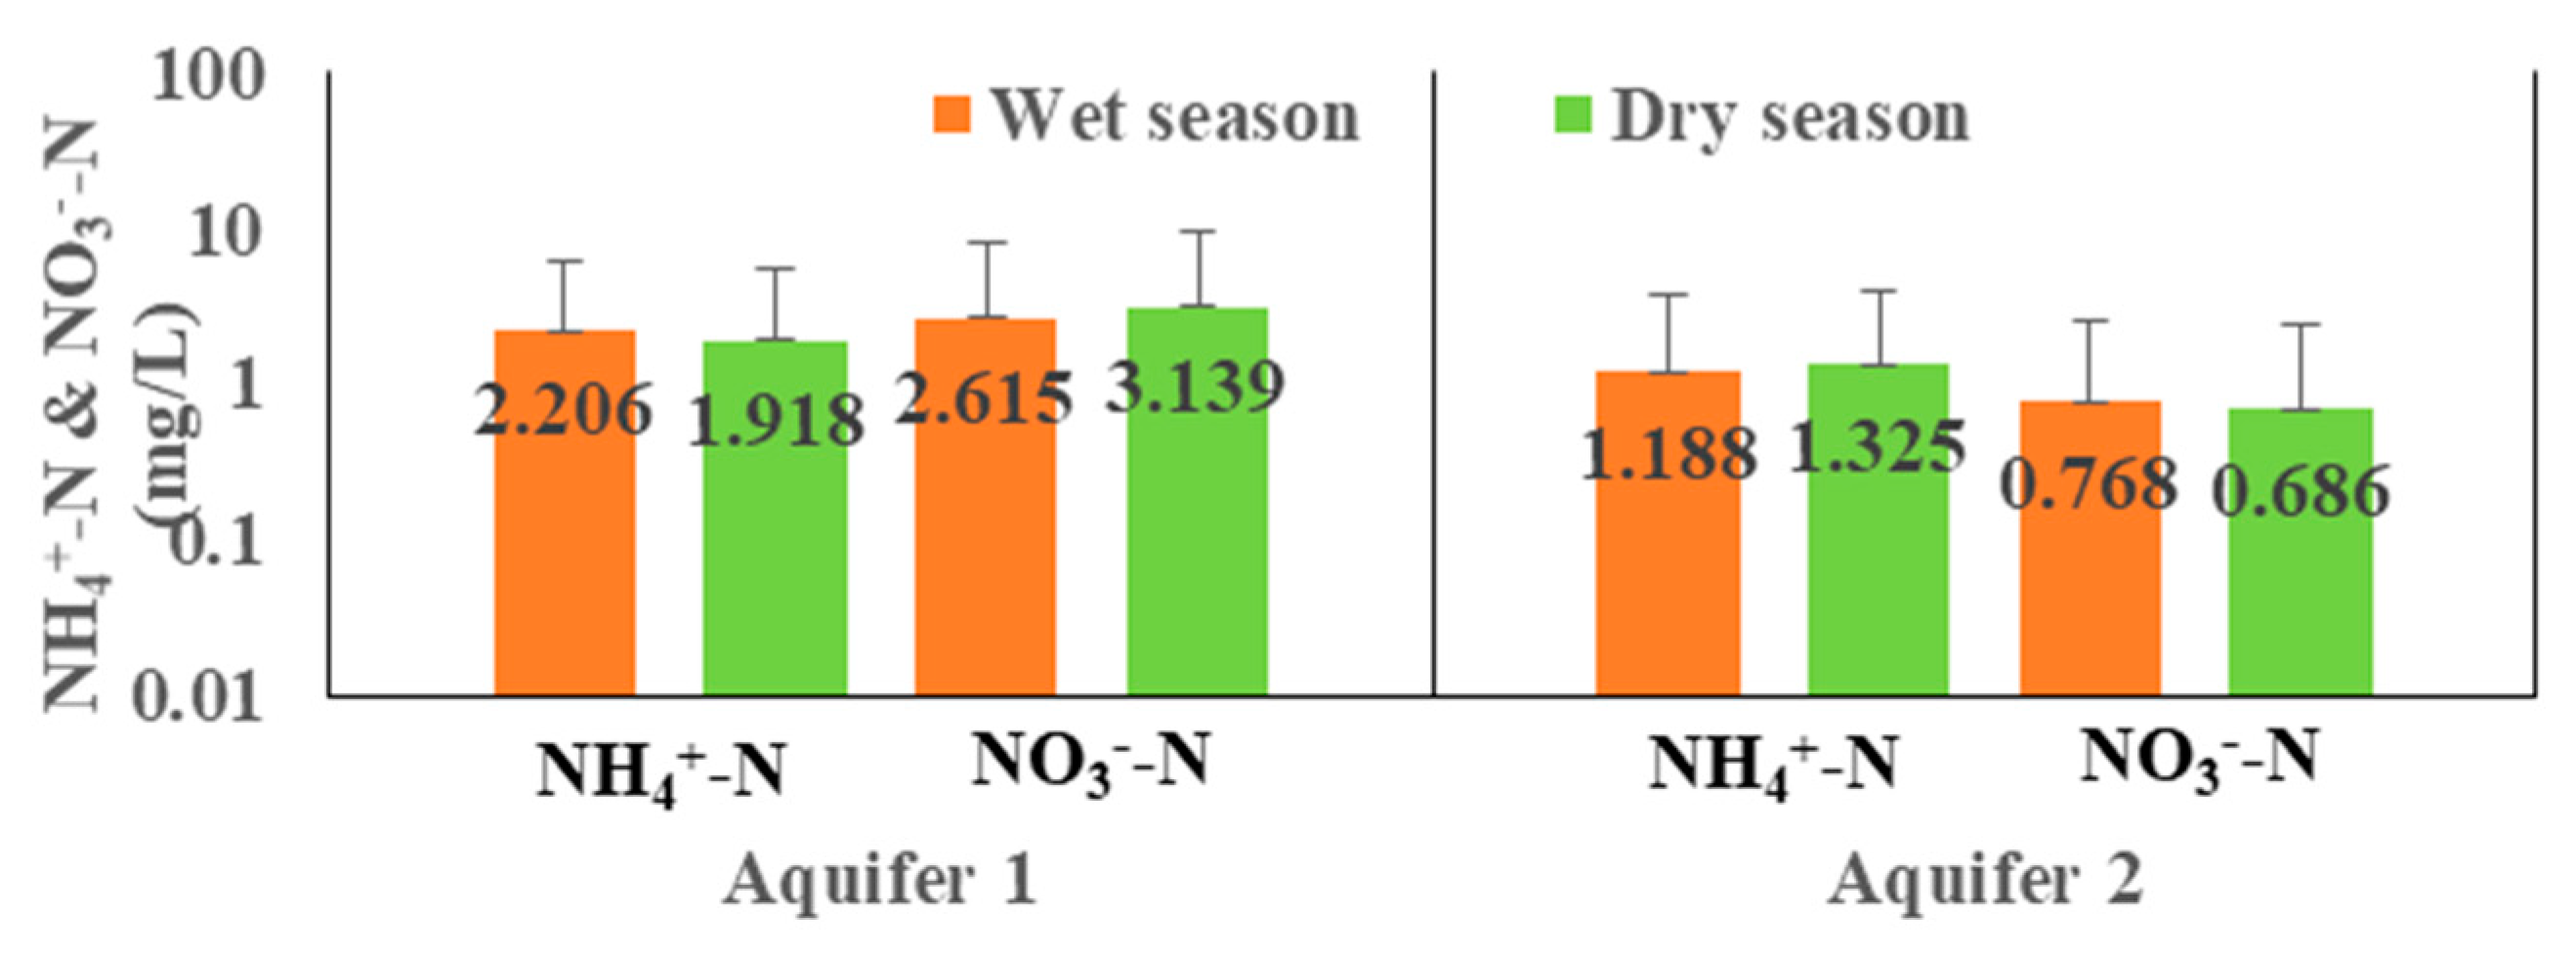
3.3. Groundwater Quality Variation in Aquifer 1 and Aquifer 2 of the Alluvial Fan

For the convenience of presentation and discussion, the 20 groundwater quality parameters were divided into four categories. The first category consists of the on-site parameters, including groundwater temperature, pH, conductivity, dissolved oxygen, and redox potential; the second category consists of the eight major cations and anions in natural water bodies, which include potassium, sodium, calcium, magnesium, chloride, sulfate, carbonate, and bicarbonate; the third category consists of iron, manganese, arsenic, and TOC, and the fourth category consists of nitrate and ammonia nitrogen. The category 1 indicates the physical and chemical properties of groundwater. Conductivity reflects soluble ion contents, dissolved oxygen shows oxygen concentration dissolved in groundwater, and the level of dissolved oxygen could affect chemical and biological reactions. The category 3 includes possible components that respond to As release in groundwater. Figure 2, Figure 3, Figure 4 and Figure 5 show the independent samples t-test results of the four categories for both aquifers in the wet and dry seasons. The numbers displayed on the bar graph are the mean values of the water quality parameters. When there is a superscript character after the mean value, it means that the water quality parameter has significant differences between the wet and dry seasons in the aquifer. However, it does not represent a difference between the aquifers.
Figure 2 shows the test results of the five on-site parameters in Aquifer 1 and Aquifer 2 between the wet and dry seasons. In terms of the groundwater temperature, since the wet season is at the end of spring and summer, the groundwater temperature is higher than that in the dry season. Among both of the aquifers, Aquifer 2 has no significant difference in groundwater temperature during the wet and dry seasons. A possible reason for this is that Aquifer 2 is larger and, frequently, the more-pumped aquifer. The pH is increased with the depth of the aquifer, and there is no significant difference between the wet and dry seasons. The electrical conductivity is decreased with the depth of the aquifer, which should be the effect of the infiltration of contaminated surface water, but there is also no significant difference in both aquifers. Surface water or rainfall infiltration with high dissolved oxygen causes the dissolved oxygen and redox potential to decrease with the depth of the aquifer. In the dry season, dissolved oxygen are higher levels than those found during the wet season. This may be due to the recharge time lag and the difference between water temperature and dissolved oxygen in the water source. However, there are no significant differences in the dissolved oxygen and redox potential levels between the wet and dry seasons. Only Aquifer 1 shows a significant difference in dissolved oxygen. According to the test results, it is shown that the five on-site water quality parameters of groundwater are more susceptible to surface water or rainfall infiltration and recharge time lag.
Figure 3 shows the test results of the mean concentrations of the eight major cations and anions in natural water. All mean concentrations decreased with the depth of the aquifer. Except for bicarbonate, there is no statistically significant difference between the wet and dry seasons in the other seven parameters. This is consistent with the aforementioned behavior in electrical conductivity.
As with other worldwide areas, such as Mexico (Mora et al., 2021) [20], Bangladesh (Mihajlov et al., 2020) [21], Europe (Banning, 2021) [22], and eastern India (Saha et al., 2010) [23], the coastal zone of the Zhuoshui River alluvial fan is also an area with high arsenic content in the groundwater. As a result of this, the residents had used a high-arsenic artesian well for more than 50 years. Blackfoot disease was once common in the southwestern coast of Taiwan (Chiou, 1996) [24]. Past research has inferred that the arsenic adsorbed on iron and manganese oxides was dissolved in a reducing environment (Lu et al., 2010; Chen and Liu, 2007) [25,26]. The infiltration of organic matter during rainfall plays a critical role in releasing arsenic and iron in the sediments, due to the oxidation of organic matter consuming dissolved oxygen and promoting the release of As [23]. Figure 4 shows the test results of the mean concentrations of iron, manganese, arsenic, and TOC in both aquifers between the wet and dry seasons. The mean concentrations of iron, manganese, arsenic, and TOC decreased with the depth of the aquifer, and there was no statistically significant difference in the mean concentrations between the wet and dry seasons. The TOC mean concentration in the dry season was significantly two times higher than that in the wet season, which may be attributed to the higher groundwater temperature during the wet season. This promotes the degradation of organic carbon compounds and releases more iron and As in the wet season. As a consequence, the arsenic concentration is greater than the guideline value (0.01 mg/L) for safe drinking water determined by the WHO in Aquifers 1 and 2. Even in the wet season, the arsenic mean concentration in Aquifer 1 exceeds the standard of irrigation water quality (0.05 mg/L) and drinking water source quality (0.05 mg/L) of Taiwan. For farmers who have small planting areas that use the groundwater of Aquifer 1 as irrigation water, the safety of agricultural products is still a matter of concern. Although the drinking water sources in this area are mostly taken from Aquifer 2, the arsenic mean concentration is still relatively higher than in other areas. There are still risks to human health.
The concentration of nitrate and ammonia nitrogen in groundwater is an important issue of concern to the government and the public, particularly in the Zhuoshui River alluvial fan area, where groundwater is the main source of water supply. Figure 5 shows the test results of nitrate and ammonia nitrogen in groundwater in both aquifers between the wet and dry seasons. The nitrate and ammonia nitrogen standards of drinking water source quality are 10 mg/L and 0.1 mg/L, respectively, in Taiwan. The irrigation water quality standard is 3 mg/L for ammonia nitrogen only. There has been evidence that the use of nitrate-contaminated drinking water to prepare infant formula is a well-known risk factor for methemoglobinemia in infants (i.e., blue baby syndrome) (Knobeloch et al., 2007) [27]. As shown in Figure 5, the mean ammonia nitrogen concentration in both aquifers has exceeded the standard of drinking water source quality, including in Aquifer 2, the main aquifer that supplies water for domestic and irrigation uses. At the same time, the Zhuoshui River alluvial fan is an important agricultural area with intensive vegetable production, animal husbandry, and aquaculture. Therefore, the infiltration of agricultural wastewater may be the main reason for the increase in the concentration of nitrate and ammonia nitrogen in groundwater. Compared with Aquifer 1, which possesses higher dissolved oxygen due to rainfall or surface water infiltrating, the mean concentration of ammonia nitrogen was increased in Aquifer 2 due to the reduction environment, no matter whether in the wet or dry season. In order to reduce the health risk to the public, it is recommended that the main aquifer for domestic water supply should be Aquifer 2 rather than Aquifer 1. However, there are no statistically significant differences in the mean concentrations of nitrate and ammonia nitrogen in both aquifers between the wet and dry seasons.
Based on the above descriptions, the groundwater quality of both aquifers in the Zhu-oshui River alluvial fan is not significantly different between the wet and dry seasons. Only three parameters: groundwater temperature, bicarbonate, and TOC, have statistically significant differences between the wet and dry seasons. However, the Zhuoshui River alluvial fan is about 50 km away from the proximal fan to the distal fan. Surface water or rainfall can easily infiltrate into the deeper aquifer in the proximal fan area only. The land utilization in the mid-fan and distal fan areas may be an important factor in groundwater quality variability, particularly in Aquifer 1. Therefore, the next section will discuss the groundwater quality at the proximal fan, mid-fan, and distal fan of both aquifers between wet and dry seasons.

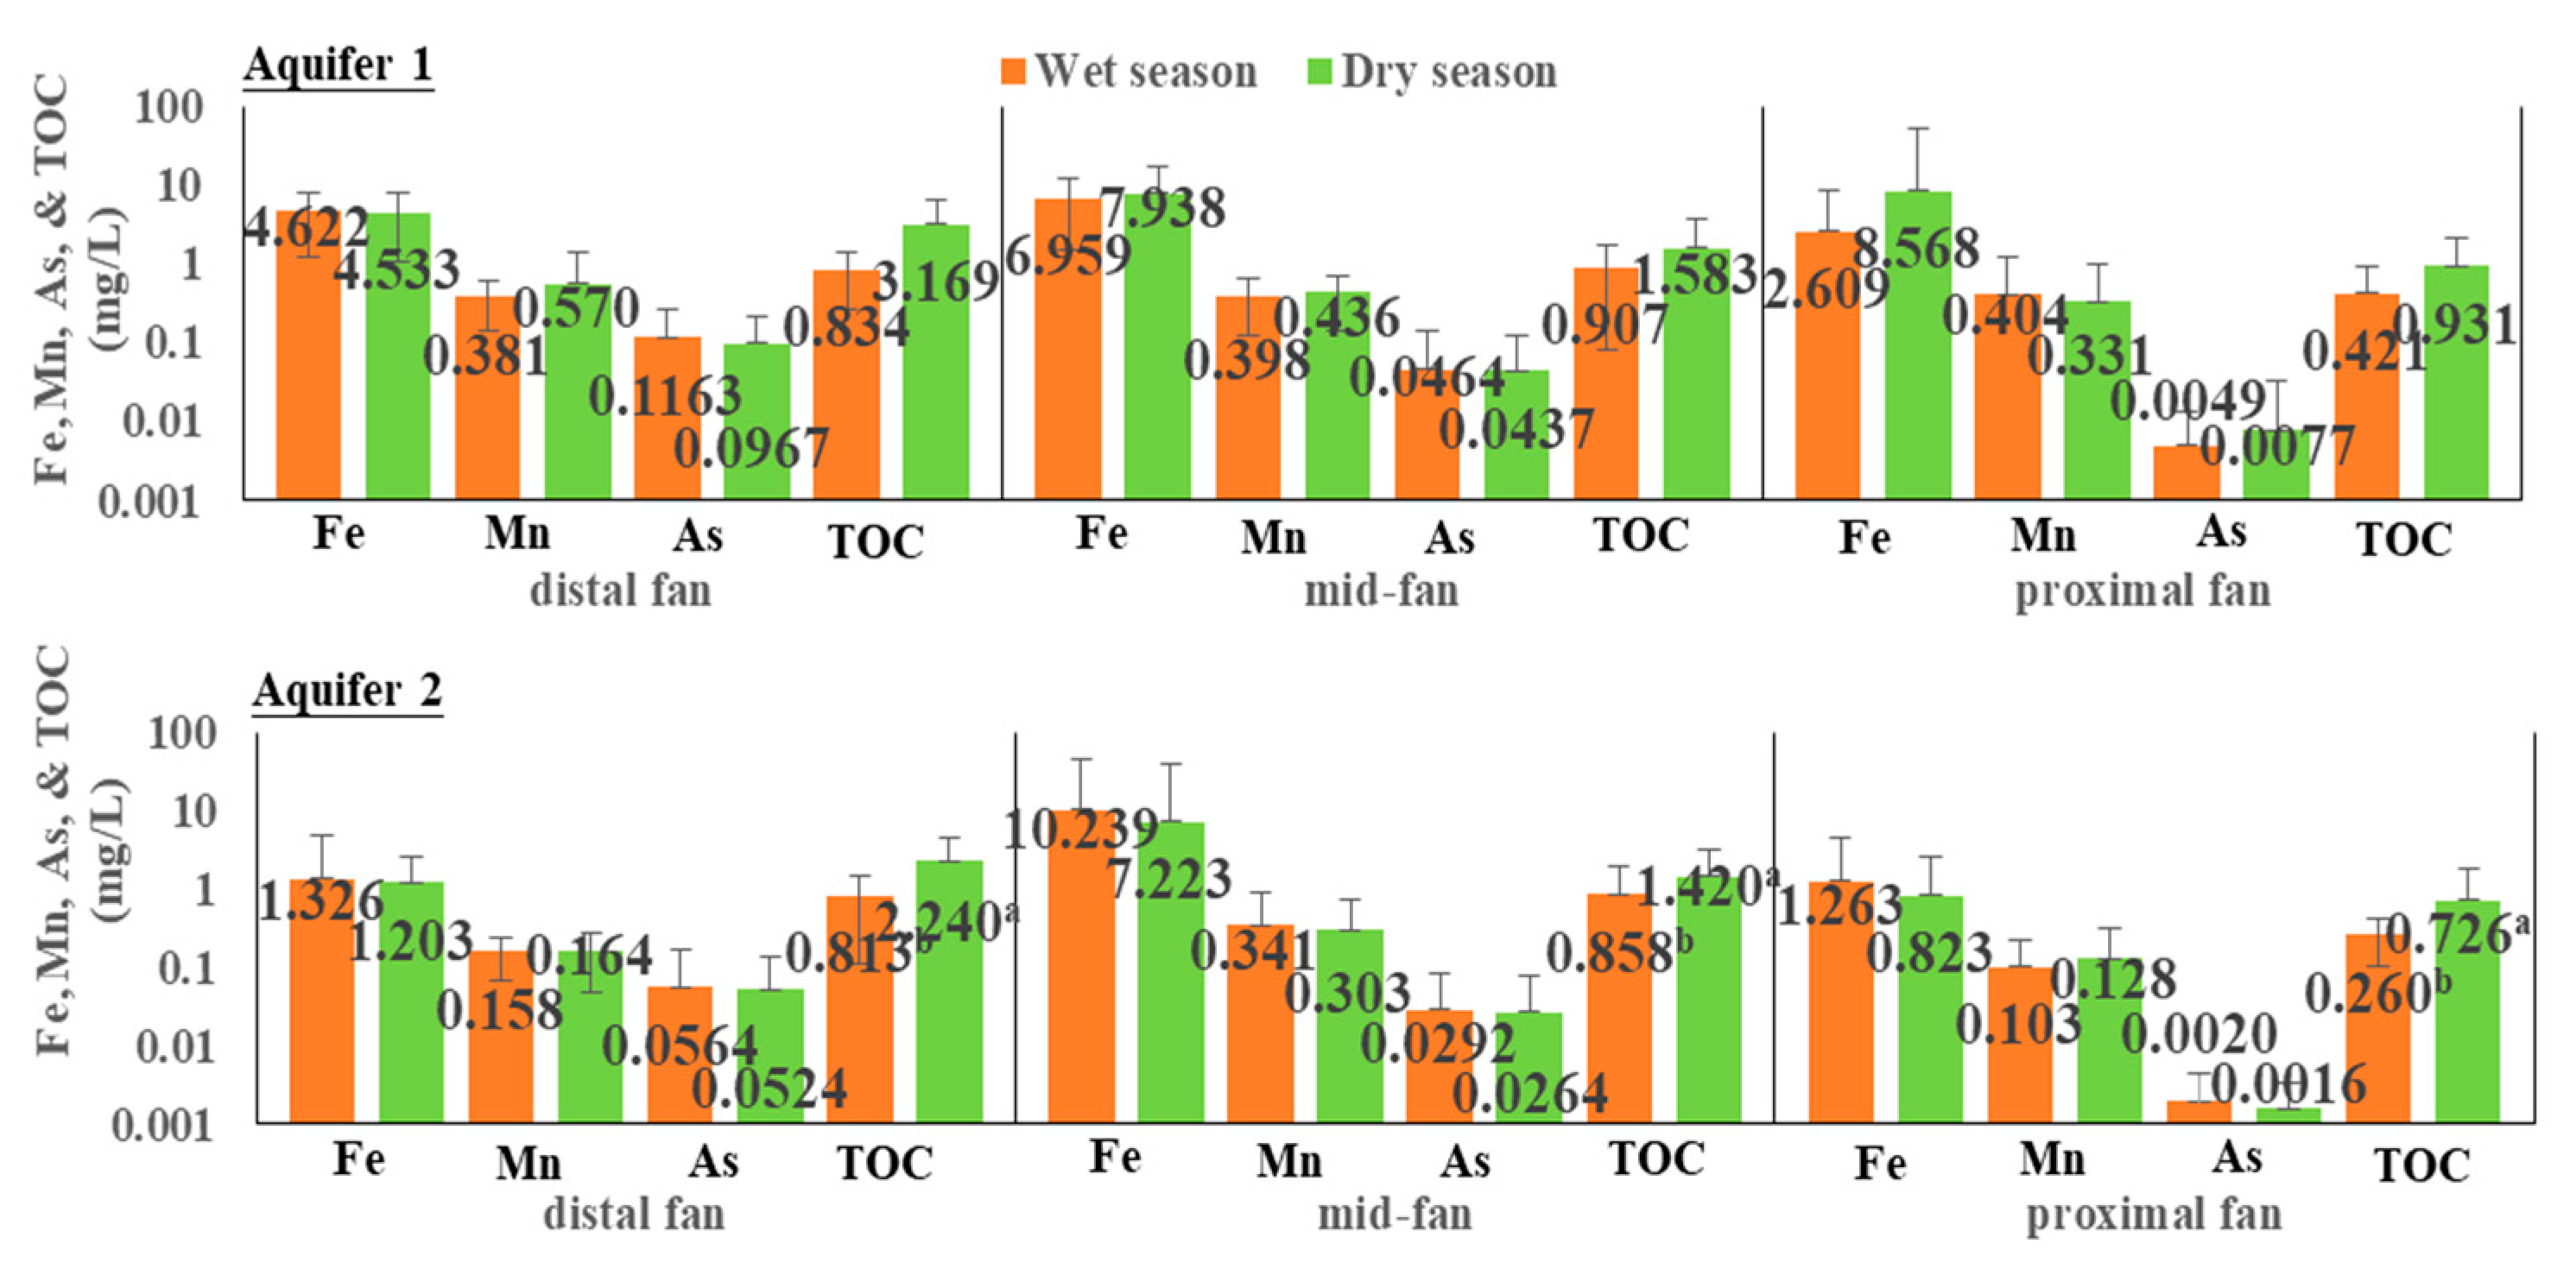
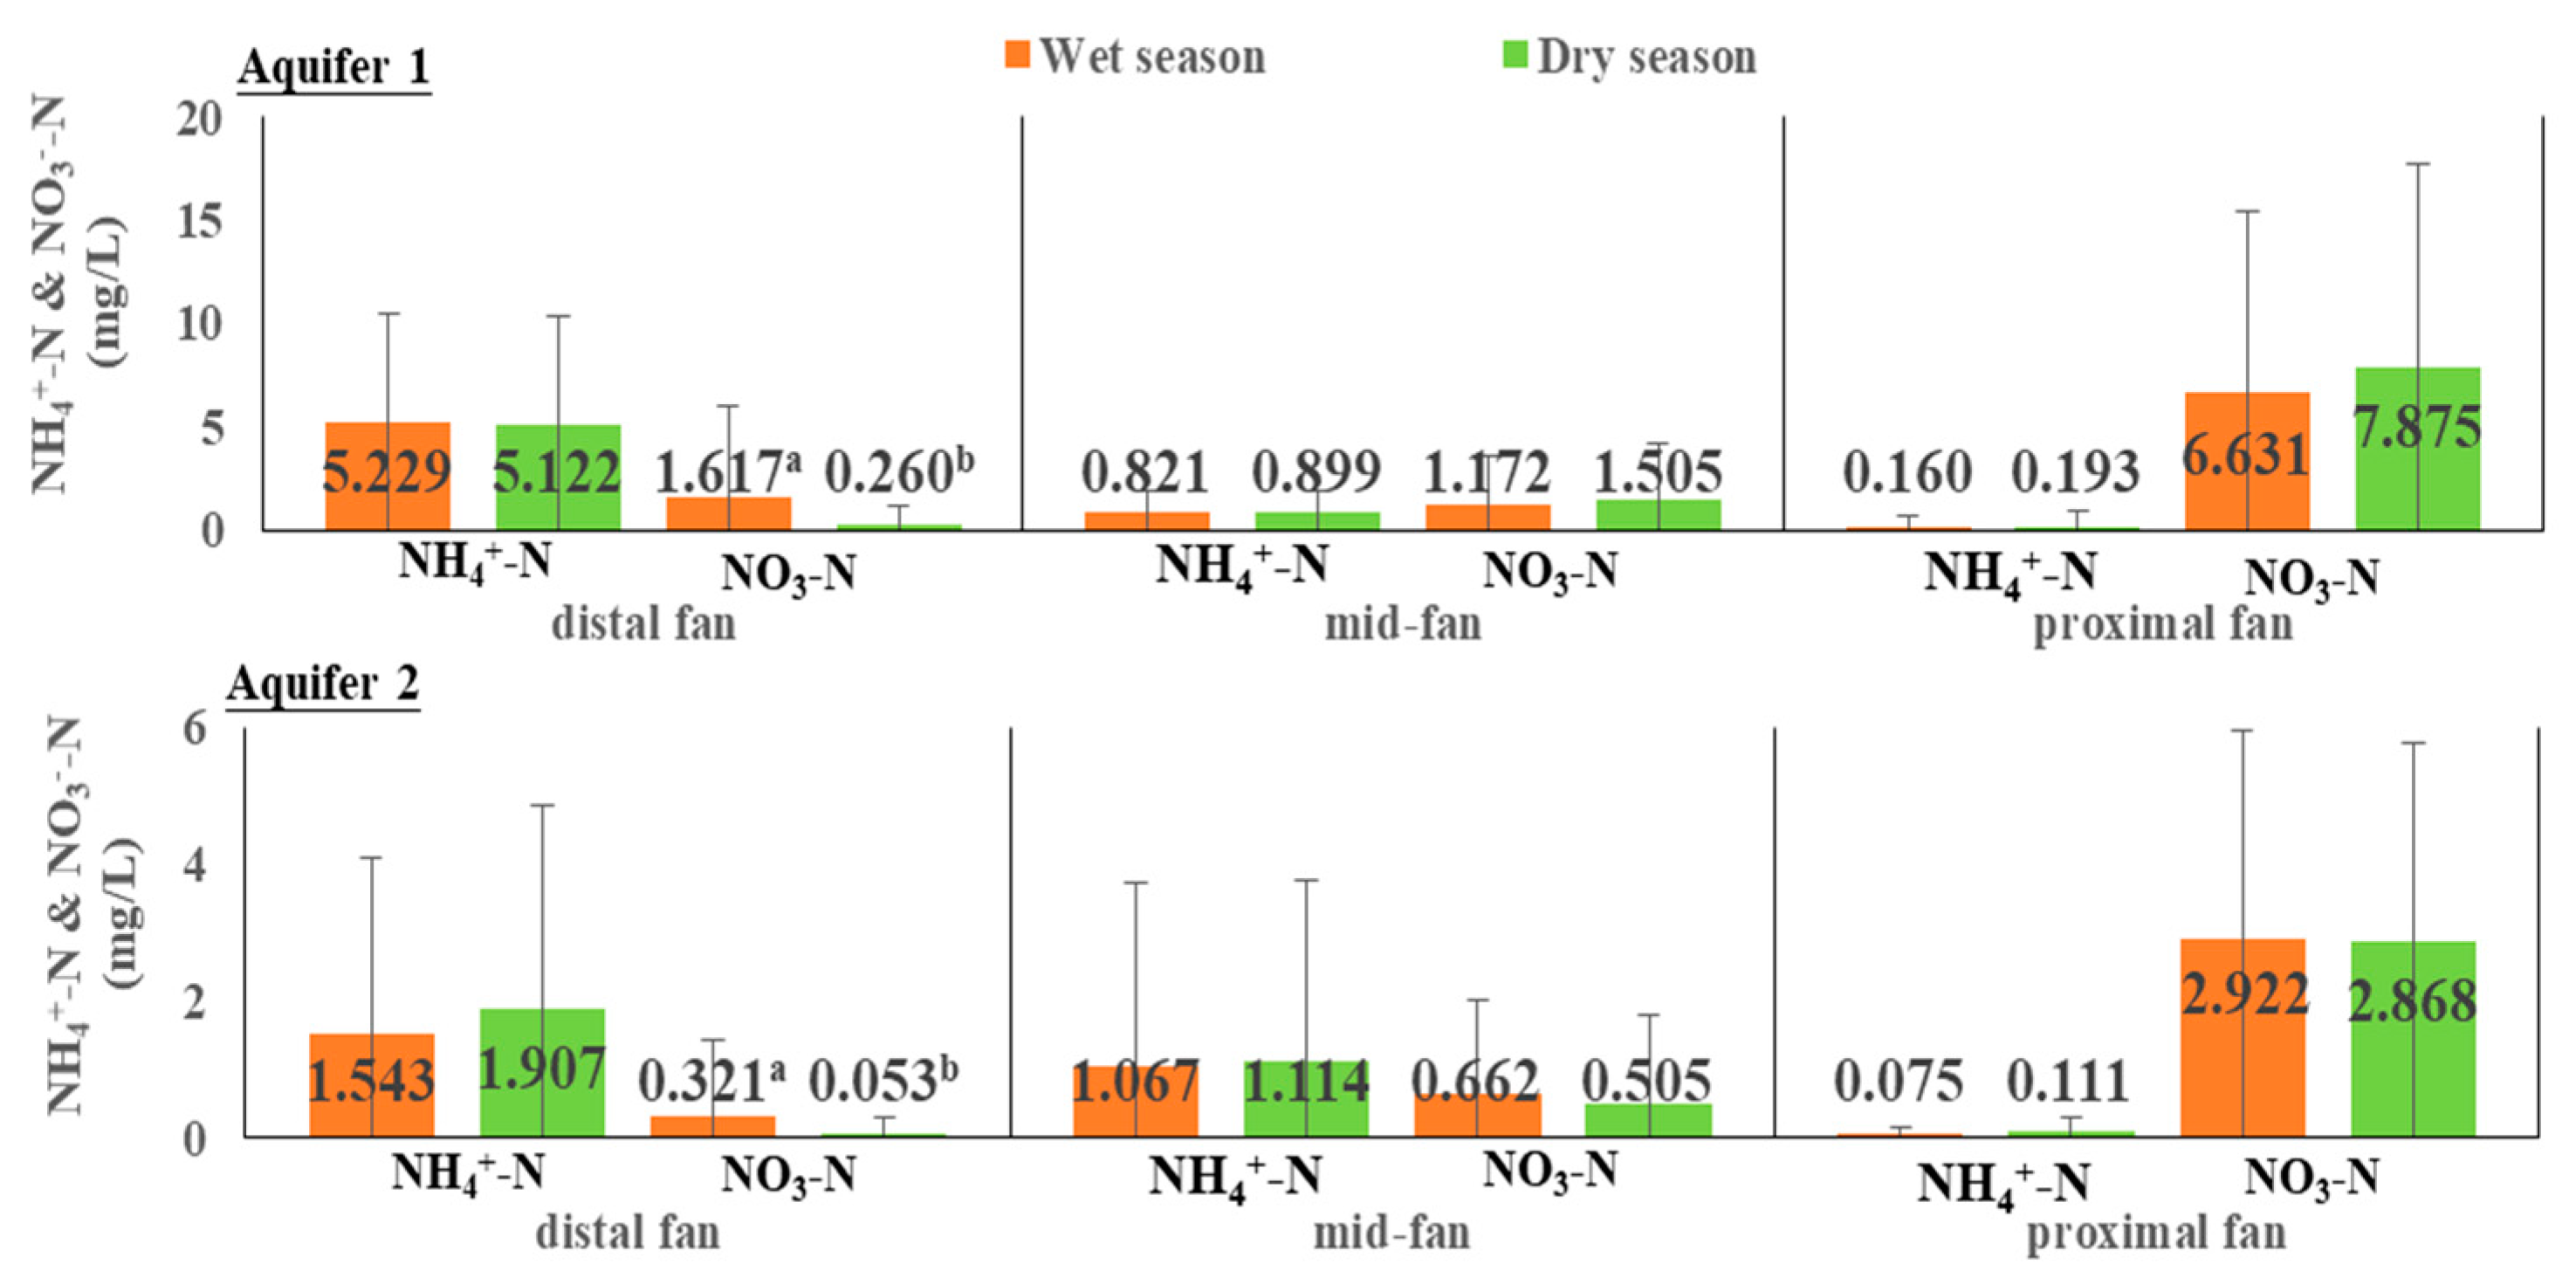
3.4. Groundwater Quality Variation in the Proximal Fan, Mid-Fan, and Distal Fan Areas

The Zhuoshui River alluvial fan is one of the most important agricultural areas in Taiwan. It is an area where rice, vegetables, grains, and animal husbandry are intensively produced. In addition, inland aquaculture is also very prosperous in the coastal area of the distal fan. Consequently, these land utilization and farming systems may have an impact on groundwater quality. Chen and Liao (2021) [28] indicated that the reason for the deterioration of groundwater quality in the Zhuoshui River alluvial fan was caused by the long-term excessive application of fertilizers and farming systems. Wang (1989) [29] examined the relationship between groundwater and land utilization in Rhode Island, USA, using linear and multiple regression analyses. He found that residential land use was related to an increase in chloride, sodium, and nitrate concentrations in groundwater. Learner and Harris (2009) [30] also indicated that groundwater is intimately connected with the landscape and land use that it underlies, and that most of the landscape is vulnerable to the anthropogenic activities on the land surface above. Liu et al. (2011) [31] also demonstrated that upland crop and grass lands have high contamination potential, whereas forest, reservoir, and housing lands have low contamination potential. Owing to this, the average proportions of fine-grained soil in the proximal fan, mid-fan, and distal fan areas of the Zhuoshui River alluvial fan are 10.5%, 48.5%, and 74.7%, respectively (Figure 1). They also affect surface water or rainfall infiltration and groundwater quality. Therefore, the groundwater quality of the proximal fan, mid-fan, and distal fan areas in the Zhuoshui River alluvial fan were evaluated between the wet and dry seasons. Figure 6, Figure 7, Figure 8 and Figure 9 show the test results of the groundwater quality of the proximal fan, mid-fan, and distal fan areas of the Zhuoshui River alluvial fan in both aquifers between the wet and dry seasons. Overall, the proportion of water quality parameters showing significant differences in the proximal fan, mid-fan, and distal fan areas of Aquifer 1 is higher than that of Aquifer 2 and is dominated by cations and anions. Aquifer 2 is less affected by surface water or rainfall infiltration. At the same time, the mean concentrations of main cations and anions in the proximal fan area are lower and have an increased trend to the distal fan area. This can be attributed to the coarser soil texture and lower land utilization in the proximal fan area, which are conducive to the infiltration and recharge of unpolluted surface water with low electrical conductivity and nutrient elements. On the contrary, except for groundwater temperature and TOC, Aquifer 2 rarely showed a significant difference in the groundwater quality parameters between the wet and dry seasons, particularly in the distal fan area.
As for the arsenic content, the mean concentrations in the proximal fan and mid-fan areas are under the standards of drinking water source quality and irrigation water quality of Taiwan. However, in the distal fan area, the mean arsenic concentration exceeds two regulations, although the proportion of arsenic content in crops exceeding the regulatory standard is not high (about 1.6%) in recent years. Consequently, the use of groundwater as a source for domestic water supply or irrigation in the distal fan area is still a high risk to public health, regardless of whether it is the wet or dry season.
As for nitrate and ammonia nitrogen, the proximal fan area of both aquifers has a relatively higher concentration of nitrate. According to the results of Wilson et al. (2014) [32], in most of Southland, New Zealand, about 90% of the region is expected to have a transit time of less than two years for nitrate leaching to the unsaturated zone and shallow groundwater. Owing to the long-term and intensive cultivation of tea and pineapple production in the proximal fan area, the application of fertilizers causes a higher nitrate concentration in groundwater for a long time. The nitrate concentration in the mid-fan and distal fan areas gradually decreased, and the ammonia nitrogen concentration gradually increased. This may be attributed to the nitrate being gradually transformed into ammonia nitrogen under a reduction environment. This also led to the mean ammonia nitrogen concentration in both aquifers in the distal fan area exceeding the water quality standards for drinking water sources and irrigation water in Aquifer 1. Therefore, it is not recommended to use groundwater as a drinking water source or for irrigation in the distal-fan area in order to reduce the risk to public health. However, there is definitely a significant difference in nitrate concentration between the wet and dry seasons in the distal fan of Aquifers 1 and 2.

4. Conclusions

In this study, data of the groundwater level and groundwater quality monitored by the WRA were collected in the Zhuoshui River alluvial fan from 2008 to 2020. All of the data were divided into the wet and dry seasons according to the sampling dates. An independent samples t-test was used to evaluate the difference in mean groundwater level and mean groundwater quality between the wet and dry seasons. The test results show that there is no significant difference in mean groundwater level between the wet and dry seasons. This means that the long-term groundwater level variations in the Zhuoshui River alluvial fan are not significantly affected by hydrological conditions. In terms of groundwater quality assessment, except for groundwater temperature, bicarbonate, and TOC, there are no significant differences in the mean concentrations of the other groundwater quality parameters. The Agricultural Engineering Research Center (AERC) (2016) [33] conducted an analysis of variance (ANOVA) on 26 groundwater quality parameters in Taiwan in 2015 (n = 150) and 2016 (n = 160). The results showed that only 23.1% and 16.0% of groundwater quality parameters have significant differences in wet and dry seasons. In addition, the AERC (2019) [34] also analyzed the accumulated precipitation of 30 to 120 days before the sampling date as well as 13 groundwater quality parameters (n = 25) in the Zhuoshui River alluvial fan. There was no significant correlation between accumulated precipitation and groundwater quality parameters as well, which was roughly consistent with the results of this study.
However, according to this study, the location of the Zhuoshui River alluvial fan, including the proximal fan, mid-fan, or distal fan areas, may be one of the factors affecting groundwater quality variations. This is due to soil texture, geological conditions, land utilization, farming systems, etc. However, except for the major ions, Aquifer 1 is significantly affected by surface water or rainfall infiltration; the groundwater quality in Aquifer 2 is less affected. Therefore, it is inferred that, under different hydrological conditions (wet and dry seasons), the composition of the groundwater in the Zhuoshui River alluvial fan does not dramatically change, and only some variations are caused by the infiltration of recharged surface water sources. Meanwhile, it is worth noting that, due to the geological conditions and long-term intensive cultivation behavior in the Zhuoshui River alluvial fan, the nitrate and arsenic mean concentrations in both aquifers have exceeded the water quality standards for drinking water sources and irrigation, and they may result in a health risk for the public.
Due to global climate change and uneven droughts and floods, there may not necessarily be more abundant rainfall during the traditional definition of the so-called “wet season”. The most recent example occurred in 2020. The cumulative mean precipitation in Taiwan from June to February for the past two decades was 1778 mm; however, the cumulative mean precipitation from June 2020 to February 2021 was only 752 mm. The precipitation of the so-called “wet season” is obviously different from the past, and the groundwater recharge is limited. In fact, Chen and Tsai (2018) [5] showed that the time lag of surface water infiltration varies depending on factors such as land utilization, geological composition, and the thickness of aquifers, etc., which may result in a time lag of several hours, days, tens of days, or even longer. Bai et al. (2019) [35] also pointed out that more days of accumulated precipitation are required to affect the variable groundwater level in low-permeability wells or deep wells. Therefore, the impact of rainfall on groundwater quality seems to have not been suitable to be evaluated by the “wet” and “dry” seasons. On the contrary, the groundwater level should be more representative of groundwater storage at the time of sampling. This will avoid the conflict of low precipitation in the wet season or high groundwater recharge in the dry season. The groundwater level at the time of sampling may have more reference value for groundwater quality assessment.

Author Contributions

Conceptualization, T.C.; investigation, C.H. (Chinghsuan Hsu); data curation, K.W., C.H. (Chialian Hsu) and T.C.; writing—original draft preparation, T.C.; writing—review and editing, S.W. and K.W.; project administration, T.C., C.H. (Chinghsuan Hsu) and S.W.; funding acquisition, T.C. All authors have read and agreed to the published version of the manuscript.

Funding

This research was funded by the Water Resources Agency, MOEA, grant numbers MOEAWRA1090335, 1100230, and 1110342, and the Environmental Protection Administration, grant number LAB-R-I-H1C1C2-M.

Institutional Review Board Statement

Not applicable.

Informed Consent Statement

Not applicable.

Data Availability Statement

Restrictions apply to the availability of these data. The data were obtained from the WRA, MOEA, and are available at https://gweb.wra.gov.tw/hyadmin/home.aspx (accessed on 25 September 2021) with the permission of the WRA, MOEA.

Conflicts of Interest

The authors declare no conflict of interest. The funders had no role in the design of the study; in the collection, analyses, or interpretation of data; in the writing of the manuscript, or in the decision to publish the results.

References

  1. Water Resources Agency. Available online: https://wellmis.wra.gov.tw/wellmis/Login.aspx?ReturnUrl=%2Fwellmis%2F (accessed on 4 March 2022).
  2. Agricultural Statistics Yearbook. 2020. Available online: https://agrstat.coa.gov.tw/sdweb/public/book/Book.aspx (accessed on 22 February 2022).
  3. Tsai, W.P.; Chiang, Y.M.; Huang, J.L.; Chang, F.J. Exploring the Mechanism of Surface and Ground Water through Data-Driven Techniques with Sensitivity Analysis for Water Resources Management. Int. Ser. Prog. Waters. 2016, 30, 4789–4806. [Google Scholar] [CrossRef]
  4. Hsu, H.S. Taiwan Climate Change Science Report 2017—Physical Phenomenon and Mechanism (General Abstract); Ministry of Science and Technology: Taipei, Taiwan, 2018. (In Chinese)
  5. Chen, S.K.; Tsai, C.B. Analysis of groundwater-level response to heavy rainfall and recharge potential in the shallow aquifer, central Taiwan. In Proceedings of the 20th EGU General Assembly, Vienna, Austria, 4–13 April 2018. [Google Scholar]
  6. Chang, F.J.; Lin, C.H.; Chang, K.C.; Kao, Y.H.; Chang, L.C. Investigating the interactive mechanisms between surface water and groundwater over the Jhuoshuei river basin in central Taiwan. Paddy Water Environ. 2014, 12, 365–377. [Google Scholar] [CrossRef]
  7. National Chiao Tung University. The Investigation of Hydrogeology and Groundwater Resources—The Utilization Improvement and Capacity Assessment of Underground Reservoir (1/4); Central Geological Survey: New Taipei City, Taiwan, 2017. (In Chinese)
  8. Water Resources Agency. Available online: https://epaper.wra.gov.tw/Article_Detail.aspx?s=F3070EB87D1A051D (accessed on 22 February 2022).
  9. Li, F.M.; Hsu, S.M.; Wang, Y.M. Research on the correlation between GPS, rainfall and groundwater level. In Proceedings of the 8th Groundwater Resources and Water Quality Protection Seminar and 2014 Cross-Strait Groundwater and Hydrogeological Application Seminar Proceedings, Tainan, Taiwan, 17–18 November 2014. (In Chinese). [Google Scholar]
  10. Chen, W.Y. A Study of Interaction Mechanism between Surface Water and Groundwater during Typhoon Period in Zhuoshui alluvial Fan. Master’s Thesis, Department of Water Resources and Environmental Engineering, Tamkang University, New Taipei City, Taiwan, 2015. (In Chinese). [Google Scholar]
  11. Yang, W.C. Rainfall and Groundwater Levels Trends and Fluctuation Analysis at Upper Choshui River Alluvial by Time Series Analysis. Master’s Thesis, Department of Soil and Water Conservation, National Chung Hsing University, Taichung, Taiwan, 2002. (In Chinese). [Google Scholar]
  12. Wang, Y.L.; Yeh, T.C.; Wen, J.C.; Huang, S.Y.; Zha, Y.; Tsai, J.P.; Hao, Y.; Liang, Y. Characterizing subsurface hydraulic heterogeneity of alluvial fan using riverstage fluctuations. J. Hydrol. 2017, 547, 650–663. [Google Scholar] [CrossRef]
  13. Wang, Y.L. Characterizing Subsurface Hydraulic Characteristics at Zhuoshui River Alluvial Fan. Taiwan. Master Thesis, Department of Hydrology and Water Resources, University of Arizona, Tucson, AZ, USA, 2016. [Google Scholar]
  14. Hydraulic Research Institute of the National Taiwan University. Collection and Display of Essential Results of Groundwater Observation Network and Stratum Subsidence Prevention; Water Resources Agency of the Ministry of Economic Affairs: Taichung, Taiwan, 2012. (In Chinese)
  15. Central Geological Survey. General Report on Hydrogeological Survey and Research of Zhuoshui River Alluvial Fan; Water Resources Bureau of the Ministry of Economic Affairs: Taichung, Taiwan, 2000. (In Chinese)
  16. Central Geological Survey. Groundwater Recharge Geologically Sensitive area Delineation Plan—G0001 Zhuoshui River Alluvial Fan; Ministry of Economic Affairs: Taipei, Taiwan, 2014. (In Chinese)
  17. Jiang, C.R. General Report on Hydrogeological Survey and Research of Zhuoshui River Alluvial Fan in the First Phase of the Taiwan Groundwater Observation Network; Central Geological Survey: New Taipei City, Taiwan, 1999. (In Chinese)
  18. World Health Organization. Guidelines for Drinking-water Quality, 4th ed.; World Health Organization: Geneva, Switzerland, 2011. [Google Scholar]
  19. Agricultural and Food Agency. Available online: https://https://gisvm.aerc.org.tw/landhmc/ (accessed on 11 March 2022).
  20. Mora, A.; Torres-Martínez, J.A.; Moreau, C.; Bertrand, G.; Mahlknecht. Mapping salinization and trace element abundance (including As and other metalloids) in the groundwater of north-central Mexico using a double-clustering approach. Water Res. 2021, 205, 117709. [Google Scholar] [CrossRef] [PubMed]
  21. Mihajlov, I.; Mozumder, R.; Bostick, B.; Stute, M.; Mailloux, B.J.; Knappett, P.S.K.; Choudhury, I.; Ahmed, K.M.; Schlosser, P.; van Geen, A. Arsenic contamination of Bangladesh aquifers exacerbated by clay layers. Nat. Commun. 2020, 11, 2244. [Google Scholar] [CrossRef] [PubMed]
  22. Banning, A. Geogenic arsenic and uranium in Germany: Large-scale distribution control in sediments and groundwater. J. Hazard. Mater. 2021, 405, 124186. [Google Scholar] [CrossRef] [PubMed]
  23. Saha, D.; Sarangam, S.S.; Dwivedi, S.N.; Bhartariya, K.G. Evaluation of hydrogeochemical processes in arsenic-contaminated alluvial aquifers in parts of Mid-Ganga Basin, Bihar, Eastern India. Environ. Earth Sci. 2010, 61, 799–811. [Google Scholar] [CrossRef]
  24. Chiou, H.Y. Epidemiologic Studies on Inorganic Arsenic Methylation Capacity and Inorganic Arsenic Induced Health Effects among Residents in the Blackfoot Disease Endemic Area and Lanyang Basin in Taiwan. Doctoral Dissertation, Institute of Epidemiology, National Taiwan University, Taipei, Taiwan, 1996. [Google Scholar]
  25. Lu, K.L.; Liu, C.W.; Wang, S.W.; Jang, C.S.; Lin, K.H.; Liao, H.C.; Liao, C.M.; Chang, F.J. Primary sink and source of geogenic arsenic in sedimentary aquifers in the southern Choushui River alluvial fan, Taiwan. Appl. Geochem. 2010, 25, 684–695. [Google Scholar] [CrossRef]
  26. Chen, K.Y.; and Liu, T.K. Major factors controlling arsenic occurrence in the groundwater and sediments of the Chianan coastal Plain, SW Taiwan. Terr. Atmos. Ocean. Sci. 2007, 18, 975–994. [Google Scholar] [CrossRef] [Green Version]
  27. Knobeloch, L.; Salna, B.; Hogan, A.; Postle, J.; Anderson, H. Blue babies and nitrate-contaminated well water. Environ. Health Perspect. 2000, 108, 675–678. [Google Scholar] [CrossRef] [PubMed]
  28. Chen, S.K.; Liao, T.L. Analysis of the relationship between regional groundwater quality variation trend of shallow aquifer and the cropping pattern in Choushui River alluvial fan. In Proceedings of the Annual Agricultural Water Conservancy Science and Technology Seminar in 2021, Zhongli, Taiwan, 30 November 2021; pp. 51–75. (In Chinese). [Google Scholar]
  29. Wang, X. The Relationship of Land Use and Groundwater Quality: A Case Study of Rhode Island. Master’s Thesis, Department of Community Planning and Area Development, University of Rhode Island, Kingston, RI, USA, 1989. Available online: https://digitalcommons.uri.edu/theses/660 (accessed on 15 October 2021).
  30. Lerner, D.N.; Harris, B. The relationship between land use and groundwater resources and quality. Land Use Policy 2009, 26, 165–273. [Google Scholar] [CrossRef]
  31. Liu, C.W.; Lin, C.N.; Jang, C.S.; Ling, M.P.; Tsai, J.W. Assessing nitrate contamination and its potential health risk to Kinmen residents. Environ. Geochem. Health 2011, 33, 503–514. [Google Scholar] [CrossRef] [PubMed]
  32. Wilson, S.; Chanut, P.; Rissmann, C.; Ledgard, G. Estimating Time Lags for Nitrate Response in Shallow Southland Groundwater; Southland Regional Council: Waikiwi, Invercargill, New Zealand, 2014; p. 1.
  33. Agricultural Engineering Research Center. Groundwater Quality Inspection, Analysis and Evaluation in 2016; Water Resources Agency of the Ministry of Economic Affairs: Taichung, Taiwan, 2016. (In Chinese)
  34. Agricultural Engineering Research Center. Groundwater Quality Inspection, Analysis and Evaluation in 2019; Water Resources Agency of the Ministry of Economic Affairs: Taichung, Taiwan, 2019. (In Chinese)
  35. Bai, T.; Tsai, W.P.; Chiang, Y.M.; Chang, F.J.; Chang, W.Y.; Chang, L.C.; Chang, K.C. Modeling and Investigating the Mechanisms of Groundwater Level Variation in the Jhuoshui River Basin of Central Taiwan. Water 2019, 11, 1554. [Google Scholar] [CrossRef] [Green Version]
Figure 1. Distribution of the groundwater observation stations in Taiwan and the clay content of the soil and wells for irrigation in the proximal fan, mid-fan, and distal fan in the Zhuoshui River alluvial fan. (Areas with a pink background indicate a potentially arsenic-polluted area of groundwater.).
Water 14 01494 g001
Figure 2. The mean values of the five on-site parameters and statistical results in Aquifer 1 and Aquifer 2 between the wet and dry seasons. (a superscript character after the mean value means that the water quality parameter has significant differences).
Water 14 01494 g002
Figure 3. The mean concentrations of major cations and anions in addition to statistical results in Aquifer 1 and Aquifer 2 between the wet and dry seasons. (a superscript character after the mean value means that the water quality parameter has significant differences).
Water 14 01494 g003
Figure 4. The mean concentrations of Fe, Mn, As, and TOC in addition to statistical results in Aquifer 1 and Aquifer 2 between the wet and dry seasons. (a superscript character after the mean value means that the water quality parameter has significant differences).
Water 14 01494 g004
Figure 5. The mean concentrations of NH4+-N and NO3-N in addition to statistical results in Aquifer 1 and Aquifer 2 between the wet and dry seasons.
Water 14 01494 g005
Figure 6. The mean values of the five on-site parameters and the statistical results of the proximal fan, mid-fan, and distal fan areas in both aquifers between the wet and dry seasons. (a superscript character after the mean value means that the water quality parameter has significant differences).
Water 14 01494 g006
Figure 7. The mean concentrations of major cations and anions in addition to the statistical results of the proximal fan, mid-fan, and distal fan areas in both aquifers between the wet and dry seasons. (a superscript character after the mean value means that the water quality parameter has significant differences).
Water 14 01494 g007
Figure 8. The mean concentrations of Fe, Mn, As, and TOC in addition to the statistical results of the proximal fan, mid-fan, and distal fan areas in both aquifers between the wet and dry seasons. (a superscript character after the mean value means that the water quality parameter has significant differences).
Water 14 01494 g008
Figure 9. The mean concentration of NH4+-N and NO3-N, and statistical results of the proximal fan, mid-fan, and distal fan areas in both aquifers between wet and dry seasons. (a superscript character after the mean value means that the water quality parameter has significant differences).
Water 14 01494 g009
Table 1. Depth distribution of each of the 4 aquifers in the Zhuoshui River alluvial fan.
AquiferAquifer 1Aquifer 2Aquifer 3Aquifer 4
Depth distribution (m)0~10335~217140~275238~313
Aquifer thickness (m)
(mean)
19~103
(42)
76~145
(95)
42 ~122
(86)
6~51
(24)
Table 2. Mean groundwater level and significance (p-value) in the Zhuoshui River alluvial fan Aquifer 1 and Aquifer 2 between the wet and dry seasons from 2008 to 2020.
AquiferAquifer 1 (n = 297)Aquifer 2 (n = 440)
Hydrologic conditionsWet seasonDry seasonWet seasonDry season
Mean groundwater level (m)
(sample numbers: n)
25.38
(n = 123)
32.16
(n = 174)
9.84
(n = 185)
12.17
(n = 255)
Significance (p-value)0.2110.657
Proximal fan
(n = 148)
Mean groundwater level (m)
(sample numbers: n)
75.16
(n = 29)
78.66
(n = 54)
81.43
(n = 23)
83.64
(n = 42)
Significance (p-value)0.8490.806
Mid-
fan
(n = 290)
Mean groundwater level (m)
(sample numbers: n)
21.69
(n = 51)
22.45
(n = 72)
13.46
(n = 67)
9.79
(n = 100)
Significance (p-value)0.7340.902
Distal fan
(n = 299)
Mean groundwater level (m)
(sample numbers: n)
−3.83
(n = 43)
−5.57
(n = 48)
−10.05
(n = 95)
−12.28
(n = 113)
Significance (p-value)0.1760.135
Table 3. Independent samples t-test of groundwater quality parameters in the Zhuoshui River alluvial fan Aquifer 1 and Aquifer 2 between the wet and dry seasons from 2008 to 2020.
Water Quality
Parameters
Temp
(℃)
pH
(-)
EC
(μS/cm)
DO
(mg/L)
ORP
(mV)
Fe
(mg/L)
Mn
(mg/L)
As
(mg/L)
TOC
(mg/L)
E.Coli
(CFU/100 mL)
Hydrological
Conditions
Irrigation water quality
standard in Taiwan
<356~9<750>3.0---<0.05--
Wet season mean (n = 308)25.57.1612250.73−824.5040.2810.04900.7801991
Dry season mean (n = 429)24.87.0812300.96−624.9670.3060.04001.7502647
Significance (p-value)0.0000 * 0.08400.98200.0230 * 0.0230 * 0.75500.44400.17200.0000 * 0.5710
Water quality
parameters
Ca
(mg/L)
Mg
(mg/L)
K
(mg/L)
Na
(mg/L)
CO32−
(mg/L)
HCO3
(mg/L)
Cl
(mg/L)
SO42−
(mg/L)
NO3-N
(mg/L)
NH4+-N
(mg/L)
Hydrological
conditions
Irrigation water quality
standard in Taiwan
------<175<200-<3.0
Wet season mean (n = 308)80.938.110.51590.563123131191.4451.662
Dry season mean (n = 429)81.740.712.92000.712613571231.6861.562
Significance (p-value)0.86600.70200.45900.40900.16800.0000 * 0.67800.78700.44500.6700
Bold italics with a superscript “*” represent a significant difference (p-value < 0.05).
Publisher’s Note: MDPI stays neutral with regard to jurisdictional claims in published maps and institutional affiliations.

