Article

Comparison of the Performance of IMERG Products and Interpolation-Based Precipitation Estimates in the Middle Reaches of Yellow River Basin

1
College of Hydrology and Water Resources, Hohai University, Nanjing 210098, China
2
State Key Laboratory of Hydrology-Water Resources and Hydraulic Engineering, Nanjing Hydraulic Research Institute, Nanjing 210029, China
3
Research Center for Climate Change, Ministry of Water Resources, Nanjing 210029, China
4
Yangtze Institute for Conservation and Development, Nanjing 210098, China
*
Author to whom correspondence should be addressed.
Submission received: 11 April 2022 / Revised: 30 April 2022 / Accepted: 3 May 2022 / Published: 7 May 2022
(This article belongs to the Section Hydrology)

Abstract

:
Accurate spatial precipitation data are of prime importance for hydrological simulations and flood forecasts. Interpolation methods and satellite-based precipitation products (SPPs) are often applied to obtain spatially distributed precipitation over basins. The objective of this study is to investigate whether satellite precipitation data can yield better estimates than the precipitation information (gauge observations) already available in the basin. In this study, we assessed the performance of three Integrated Multi-satellite Retrievals for Global Precipitation Measurement (IMERG) products against two calculated interpolation data and the ground precipitation observations at a daily scale in the middle reaches of the Yellow River Basin (MRYRB). This research includes two interpolation methods, namely, inverse distance weighting (IDW) and ordinary kriging (OK), and three latest IMERG SPPs, namely, IMERG “Early”, “Late”, and “Final” run SPPs (IMERG-E, IMERG-L, and IMERG-F). The results show that the two interpolation methods (IDW and OK) obtain the best overall performance, followed by IMERG-F, whereas IMERG-E and IMERG-L have inferior performance. Compared with the two interpolation methods, IMERG-F obtains higher CC values and lower FAR scores during the rainy season and presents better correlation with the gauge-based precipitation at the basin boundary. Furthermore, IMERG-F possesses a better capability over IDW and OK in detecting heavy precipitation events (over 20 mm). Nevertheless, the three IMERG SPPs generally provide similarly poor performance in terms of detection metrics and failed to accurately detect winter precipitation. The findings of this study are expected to provide SPP researchers and users with useful feedback on the net utility of satellite products and remind researchers of the importance of interpolated precipitation data in the assessment of satellite precipitation.

1. Introduction

Precipitation plays a vital role in terrestrial hydrological processes, and the accuracy of precipitation data enormously influences the effectiveness of hydrological simulations and flood forecasts [1]. Rain gauges, ground-based radars, and satellite-based sensors are three common methods of estimating precipitation [2]. Rain gauge observations are one of the mainstream approaches for ground precipitation measurement, while the accuracy of estimations is limited in capturing the spatiotemporal variation of precipitation owing to the sparse and uneven distribution of rain gauge networks. Ground-based radars provide spatially continuous data with high spatial and real-time temporal resolution over large areas [3]. However, the sparse distributions and beam blockages of radar networks hinder their application, resulting in various sources of errors [4]. In contrast, satellite-based precipitation products (SPPs) with high spatial or temporal resolutions have been available for hydrological simulations and flood forecasts in remote regions or ungauged basins [5].
A series of open-access SPPs have been released in recent years, such as Climate Prediction Center morphing method (CMORPH) [6], precipitation estimation from remotely sensed information using artificial neural networks (PERSIANN) [7], Tropical Rainfall Measuring Mission (TRMM) multi-satellite precipitation analysis (TMPA) [8], global satellite mapping of precipitation (GSMaP) [9], and integrated multi-satellite retrievals for Global Precipitation Measurement (GPM) (IMERG) [10]. These SPPs have been extensively evaluated and utilized worldwide for various applications [11,12,13]. As the successor of TRMM, GPM is an international satellite mission that was launched by the US National Aeronautics and Space Administration (NASA) and the Japan Aerospace Exploration Agency (JAXA) in February 2014 [14]. GPM includes a core observatory satellite, which carries a dual-frequency precipitation radar, a multi-channel GPM microwave imager, and approximately 10 partner satellites [2]. IMERG has improved the capacity for sensing light and solid precipitation in cold seasons with these advanced sensors. IMERG includes three types of products, namely, the near-real-time “early” and “late” run products (IMERG-E and IMERG-L) and the post-real-time “final” run product (IMERG-F) [15].
Many previous studies have been conducted to statistically or hydrologically evaluate IMERG SPPs in many regions of the world, such as Mainland China [14], Australia [13], Canada [16], Turkey [17], and Vietnam [18]. Some of these studies evaluated the accuracy of IMERG in comparison with TMPA. Tang et al. [2] comprehensively evaluated the Version-7 post-real-time 3B42 (3B42V7) product of TMPA and IMERG-F over Mainland China at 3 h and daily temporal resolutions and concluded that IMERG-F presented evidently better performance than 3B42V7 at both the sub-daily and daily timescales, especially at the mid- and high-latitudes and in relatively dry climate regions. Kim et al. [19] found that IMERG-F generally outperformed 3B42V7 in depicting the spatial distribution of precipitation at Far-East Asia, and both SPPs showed uncertainties caused by orographic convection and the land ocean classification algorithm. Fang et al. [20] evaluated the performance of 3B42V7 and IMERG-F in extreme precipitation estimation over China and demonstrated that both SPPs captured the spatial pattern of extreme precipitation over China well, with an overall underestimation for the extreme precipitation rate and an overestimation for the annual extreme precipitation volume. A few previous studies compared the performance of the IMERG SPPs with other open-access SPPs in different regions. Yuan et al. [21] accessed the hydrological feasibility of IMERG V5 and GSMaP V7 SPPs in both post- and near-real-time versions at a sub-daily time scale and concluded that GSMaP SPPs (GSMaP-NRT, GSMaP-MVK, and GSMaP-Gauge) generally presented relatively poorer hydrological performance than IMERG SPPs (IMERG-E, IMERG-L, and IMERG-F). Over the Tibetan Plateau, Lu et al. [22] compared the hydrological performance of IMERG final run products (IMERG-UC and IMERG-C) and GSMaP products (GSMaP-MVK and GSMaP-Gauge) and demonstrated that IMERG-UC and GSMaP-MVK presented poor performance for hydrological feasibility and GSMaP-Gauge showed comparable performance with gauge reference data.
To obtain better estimates of spatial precipitation, Kumar et al. [23] validated eleven gridded precipitation products versus ground observations, including five satellite-based, four reanalysis model-based, and two gauge-interpolated precipitation estimates in the Eastern Himalaya. The results indicated that the gauge-interpolated product is recommended for precipitation trend and variability analysis but requires appropriate bias correction to address negative bias at high altitudes and positive bias across the Himalayan region [23]. Although widely used as reference datasets, interpolated precipitation estimates have rarely been compared with satellite precipitation estimates. Samuel et al. [24] evaluated the performance of seven interpolation methods in estimating the spatial distribution of monthly precipitation through a cross-validation procedure over the state of Pernambuco, Brazil. They found that the trend surface analysis yielded the best overall interpolation results, followed by the natural neighbor method, inverse distance weighting (IDW), and ordinary kriging (OK). Most of the previous studies mainly emphasized how accurate satellite precipitation data are but seldom consider whether satellite precipitation data are more accurate than spatial interpolation data. Considering the uncertainty of hydrological models and parameter estimations, applying satellite precipitation data to drive hydrological models to evaluate the accuracy of satellite data frequently leads to non-negligible divergence in the results of different research studies. Therefore, it is necessary to quantitatively determine whether satellite precipitation data can yield better estimates than the precipitation information (especially gauge observations) already available in the basin, which is one of the most practical aspects of hydrological simulation in sparsely gauged or ungauged basins.
This study evaluated the accuracy of IMERG SPPs relative to interpolation data at a daily scale in the middle reaches of the Yellow River Basin. Given that previous studies seldom focused on the evaluation and comparison of gauge-interpolated precipitation estimates and IMERG SPPs in near-real-time and post-real-time versions at a daily time scale, the main objectives of this study are as follows: (1) to statistically evaluate the quality of two interpolation data (IDW and OK) and three IMERG SPPs (IMERG-E, IMERG-L, and IMERG-F) against the ground precipitation observations at a daily scale; and (2) investigate the potential effects of spatiotemporal variation and precipitation intensity on precipitation estimation to explore the applicability of satellite precipitation data in more detail. The findings of this study are expected to provide SPP researchers and users with useful feedback on the net utility of satellite products.

2. Study Area and Data
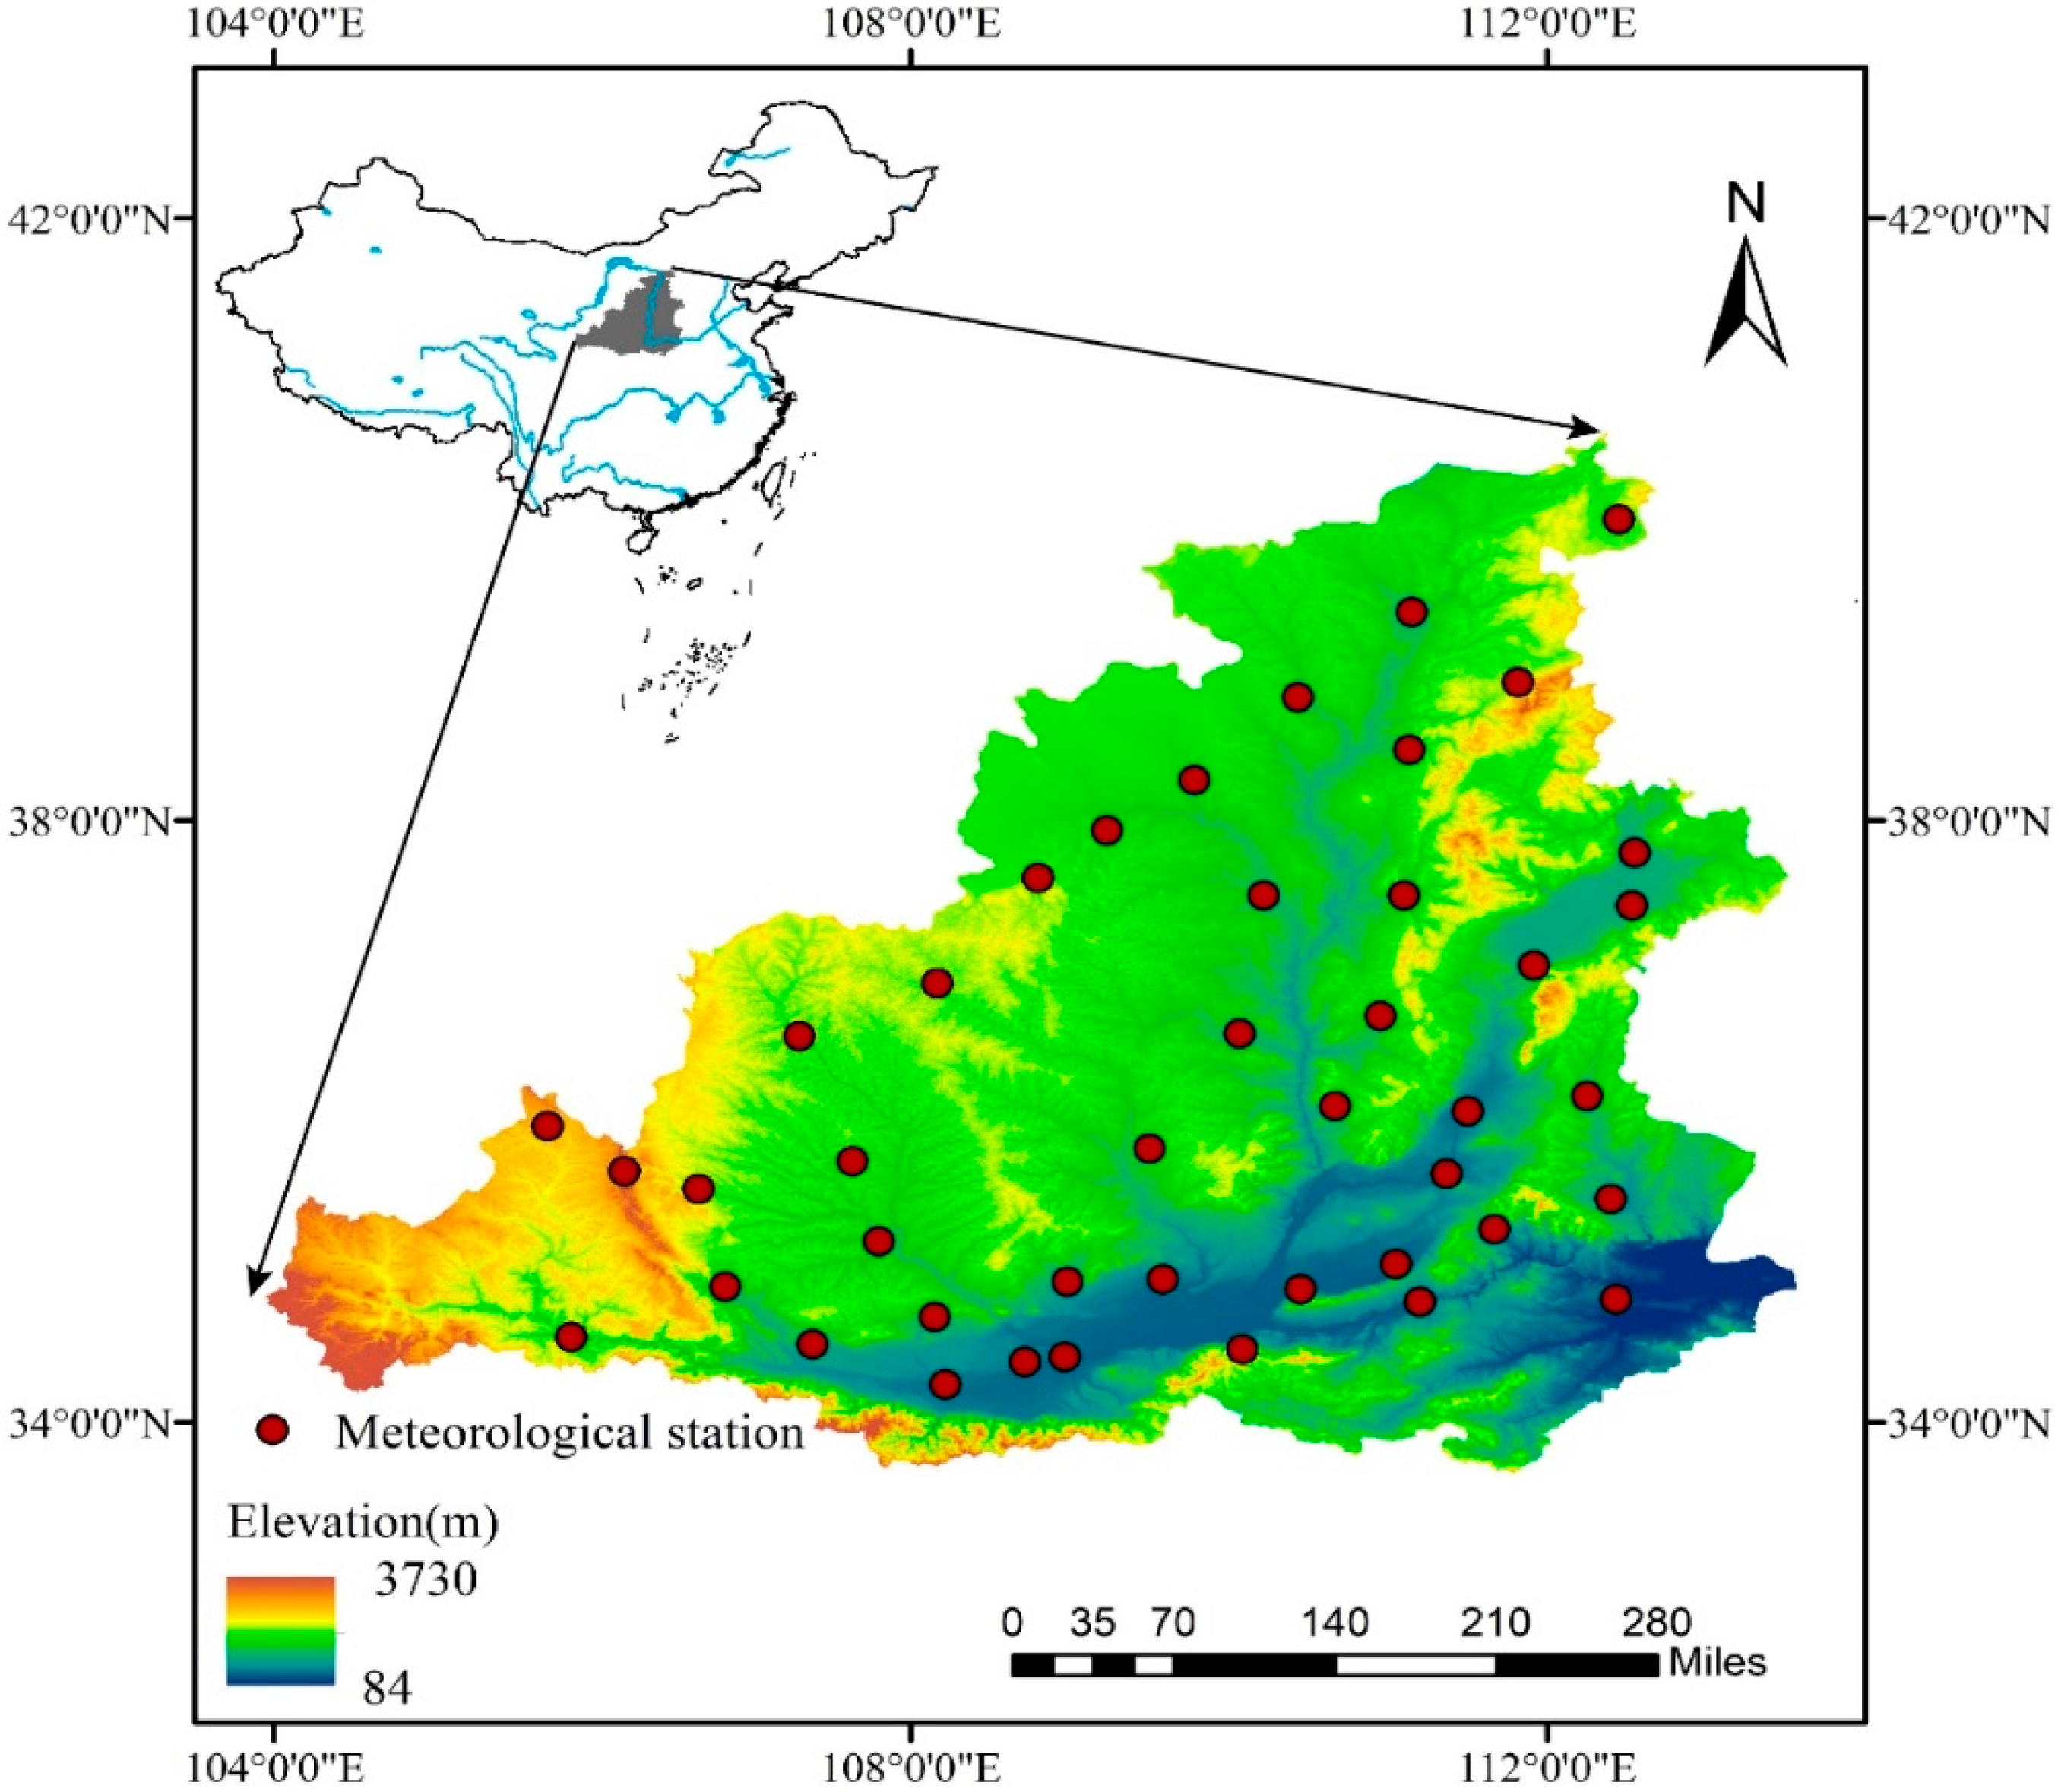
2.1. Study Area

The middle reaches of the Yellow River Basin (MRYRB) are located in the middle of the Loess Plateau within the latitude belt of 32–42° N and the longitude belt of 104–113° E (Figure 1), covering a drainage area of 362,000 km2. The basin spans semi-arid and sub-humid climate zones and is dominated by the continental monsoon climate [25]. The altitude of the region ranges from 84 m to 3730 m, with a distinctively decreasing trend from northwest to southeast (Figure 1). Influenced by the alternation of winter and summer winds and the surrounding terrain, the spatial and temporal distribution of precipitation is hugely uneven. Precipitation in winter and spring accounts for less than 20% of the total annual precipitation and makes up about 70% during the flood season (June to September) [26]. Annual precipitation in the MRYRB exhibits considerable spatial variability, with the overall distribution decreasing from 800 mm in the southeast to 320 mm in the northwest [27,28]. Given the relatively sparse and uneven distribution of the local rainfall-monitoring network, satellite precipitation information plays a positive role in the effectiveness of flood and drought forecasting as a supplement to ground precipitation observations.

2.2. Gauge Precipitation Observation

The daily precipitation records at 43 weather stations (Figure 1) in MRYRB from 1 January 2008 to 31 December 2019 were acquired from the China Meteorological Administration (CMA). These ground precipitation data were automatically recorded by siphoning or tipping-bucket rain gauges and have undergone a strict data check by the CMA in terms of internal and spatial consistency [29]. In this study, the gauge data were used as the benchmark for the interpolation and evaluation of IMERG SPPs.

2.3. Satellite Precipitation Products

The latest IMERG V06B products were released by NASA in May 2019. The current IMERG SPPs provide a series of precipitation estimates in 0.1 × 0.1° spatial resolution and half-hourly temporal resolution, covering the latitude belt of 60° N–60° S. IMERG provides datasets from June 2000 to December 2015 by incorporating TRMM satellite data as a calibrator and concurrently offers users with GPM-era data from 2014 to the present [30]. The IMERG system provides three products with different latencies, including the near-real-time datasets (IMERG-E and IMERG-L) and the post-real-time product (IMERG-F) with 4 h, 14 h, and 3.5 month latencies, respectively. IMERG-F combines the Global Precipitation Climatology Center (GPCC) monthly gauge-analysis precipitation and uses the European Centre for Medium-Range Weather Forecasts (ECMWF) ancillary data for calibration [31]. In this study, all three IMERG SPPs from 1 January 2008 to 31 December 2019 were downloaded from the Precipitation Measurement Missions website (http://pmm.nasa.gov/data-access/downloads/gpm (accessed on 16 March 2022)). The UTC-based IMERG datasets were converted to be consistent with the local precipitation records (UTC+8). The brief information of three IMERG SPPs is described briefly below (Table 1).

3. Methods

In this study, three IMERG SPPs (IMERG-E, IMERG-L, and IMERG-F) were statistically evaluated versus ground precipitation observations and their interpolation data. Considering the considerable uncertainty in assessing the accuracy of SPPs at the basin scale by interpolating ground observations, this study directly compared the IMERG precipitation estimates at the grid boxes with the corresponding ground precipitation observations. Additionally, this study compared the accuracy of satellite precipitation with interpolated precipitation at the grid boxes where the gauge stations are located to determine the net effect of satellite precipitation products for hydrological applications. Since the local ground precipitation gauges could only measure precipitation above 0.1 mm/day, the threshold of precipitation events determination was set to 0.1 mm/day to eliminate the effect of drizzles.

3.1. Spatial Interpolation Methods

Spatial interpolation is the most common and traditional method for converting point precipitation to areal precipitation. Li et al. [32] counted the frequency of individual spatial interpolation methods applied to the 80 cases and comprehensively compared their performance. The results showed that inverse distance weighting (IDW) and ordinary kriging (OK) are the most frequently used methods, and data variation is a dominant impact factor which has significant effects on the performance of the methods. Consequently, this study applied two commonly used interpolation methods (IDW and OK) to obtain precipitation estimation.
IDW is an interpolation method based on Tobler’s First Law of Geography, which states that geographical attributes are correlated with each other in their spatial distribution [33]. This method assumes that the sampled points closer to the unsampled points present more similar attributes than those further away. The weights are based on the functions of the inverse distances in which the power is set between 0.5 and 3 (typically equal to 2) [34]. The formula is as follows:
Z ^ = [ i = 1 n Z i d i p ] / [ i = 1 n 1 d i p ]
where Z ^ is the estimated value at the interpolated point; n is the number of the surrounding sampled points used in the interpolation calculation; Z i is the observations at the i th gauge station; d i is the distance between the target and each of the i th observations; p is the exponential value, which was set to 2 in this study.
Kriging interpolation methods are a group of geostatistical techniques based on statistical models involving autocorrelation. The two-step process of kriging starts with the parameter estimations of the variogram model and then performs the interpolation. Geostatistical methods include several types of kriging, namely, Ordinary Kriging (OK), Universal Kriging (UK), Kriging with External Drift (KED), and Co-Kriging (CK). Among them, OK is the most common form of kriging and assumes that the field of regionalized variable is stationary in second-order. A kriging estimator Z ^ ( x 0 ) is a linear combination of the given points Z ( x i ) that could be written as:
Z ^ ( x 0 ) = i = 1 n λ i Z ( x i )
where the weight λ i is derived from the kriging system:
{ i = 1 n λ i γ ( x i , x j ) μ = γ ( x 0 , x i ) i = 1 n λ i 1 = 0
where γ ( x i , x j ) represents the variogram function constructed from the spatial observations of regionalized variables. Instead of the Euclidian distance, the variogram is a measure of dissimilarity between observations by computing the average squared difference between the components of data pairs. The variogram function represents the spatial dependence structure of the data, which must be estimated before interpolation [35]. Different kinds of mathematical models, such as the spherical model, gaussian model, and exponential model, are applied to model the experimental variogram [36]. This study selected the exponential model after comparing estimation accuracy.

3.2. Statistical Metrics

To gain a comprehensive understanding of the performance of IMERG SPPs, several statistical metrics were adopted (Table 2). Pearson correlation coefficient (CC) measures the linear correlation between the satellite estimates and precipitation observations. Relative bias (RB) describes the systematic biases of SPPs, mean absolute error (MAE) measures the overall errors of the SPPs without considering their directions, and root-mean-squared error (RMSE) denotes the average absolute deviation between satellite estimates and observed values, with greater weights given to the larger errors relative to MAE. In addition, probability of detection (POD), false alarm ratio (FAR), and critical success index (CSI) were applied to measure the precipitation detection capability of SPPs. POD describes the proportion of precipitation events correctly detected by the satellites among all real events, while FAR represents the fraction of false precipitation events among all the events identified by the satellites. CSI combines POD and FAR properties and denotes the overall fraction of precipitation events correctly detected by the satellites.

3.3. Cross Validation

Cross validation is commonly used to compare measured values with estimated values, using the information available in the sample data set, which helps to choose better estimation methods [37]. The leave-one-out cross validation (LOOCV) was carried out to evaluate the accuracy of interpolated precipitation. More specifically, the data information of the gauge station selected for interpolation is left out in the interpolation process, and the precipitation at the interpolated point is obtained by interpolation with the information of the remaining rainfall stations. This procedure is repeated for all available gauge stations, and afterwards, the estimation of precipitation is compared by statistical metrics calculation. It should be noted that the information of the estimated point was not used in the interpolation process to ensure fairness when comparing the accuracy of SPPs.

4. Results

The evaluation results of the IMERG SPPs versus the interpolated precipitation estimates based on gauge observations are presented in this section. Such investigations were performed with respect to the statistical performance of SPP-based and gauge-interpolated precipitation estimates at a daily scale. It should be noted that the gauge-interpolated precipitation estimates were obtained by the LOOCV for each gauge station without using the information of the estimated points.

4.1. Overall Assessment of IMERG SPPs versus Interpolated Precipitation Estimates

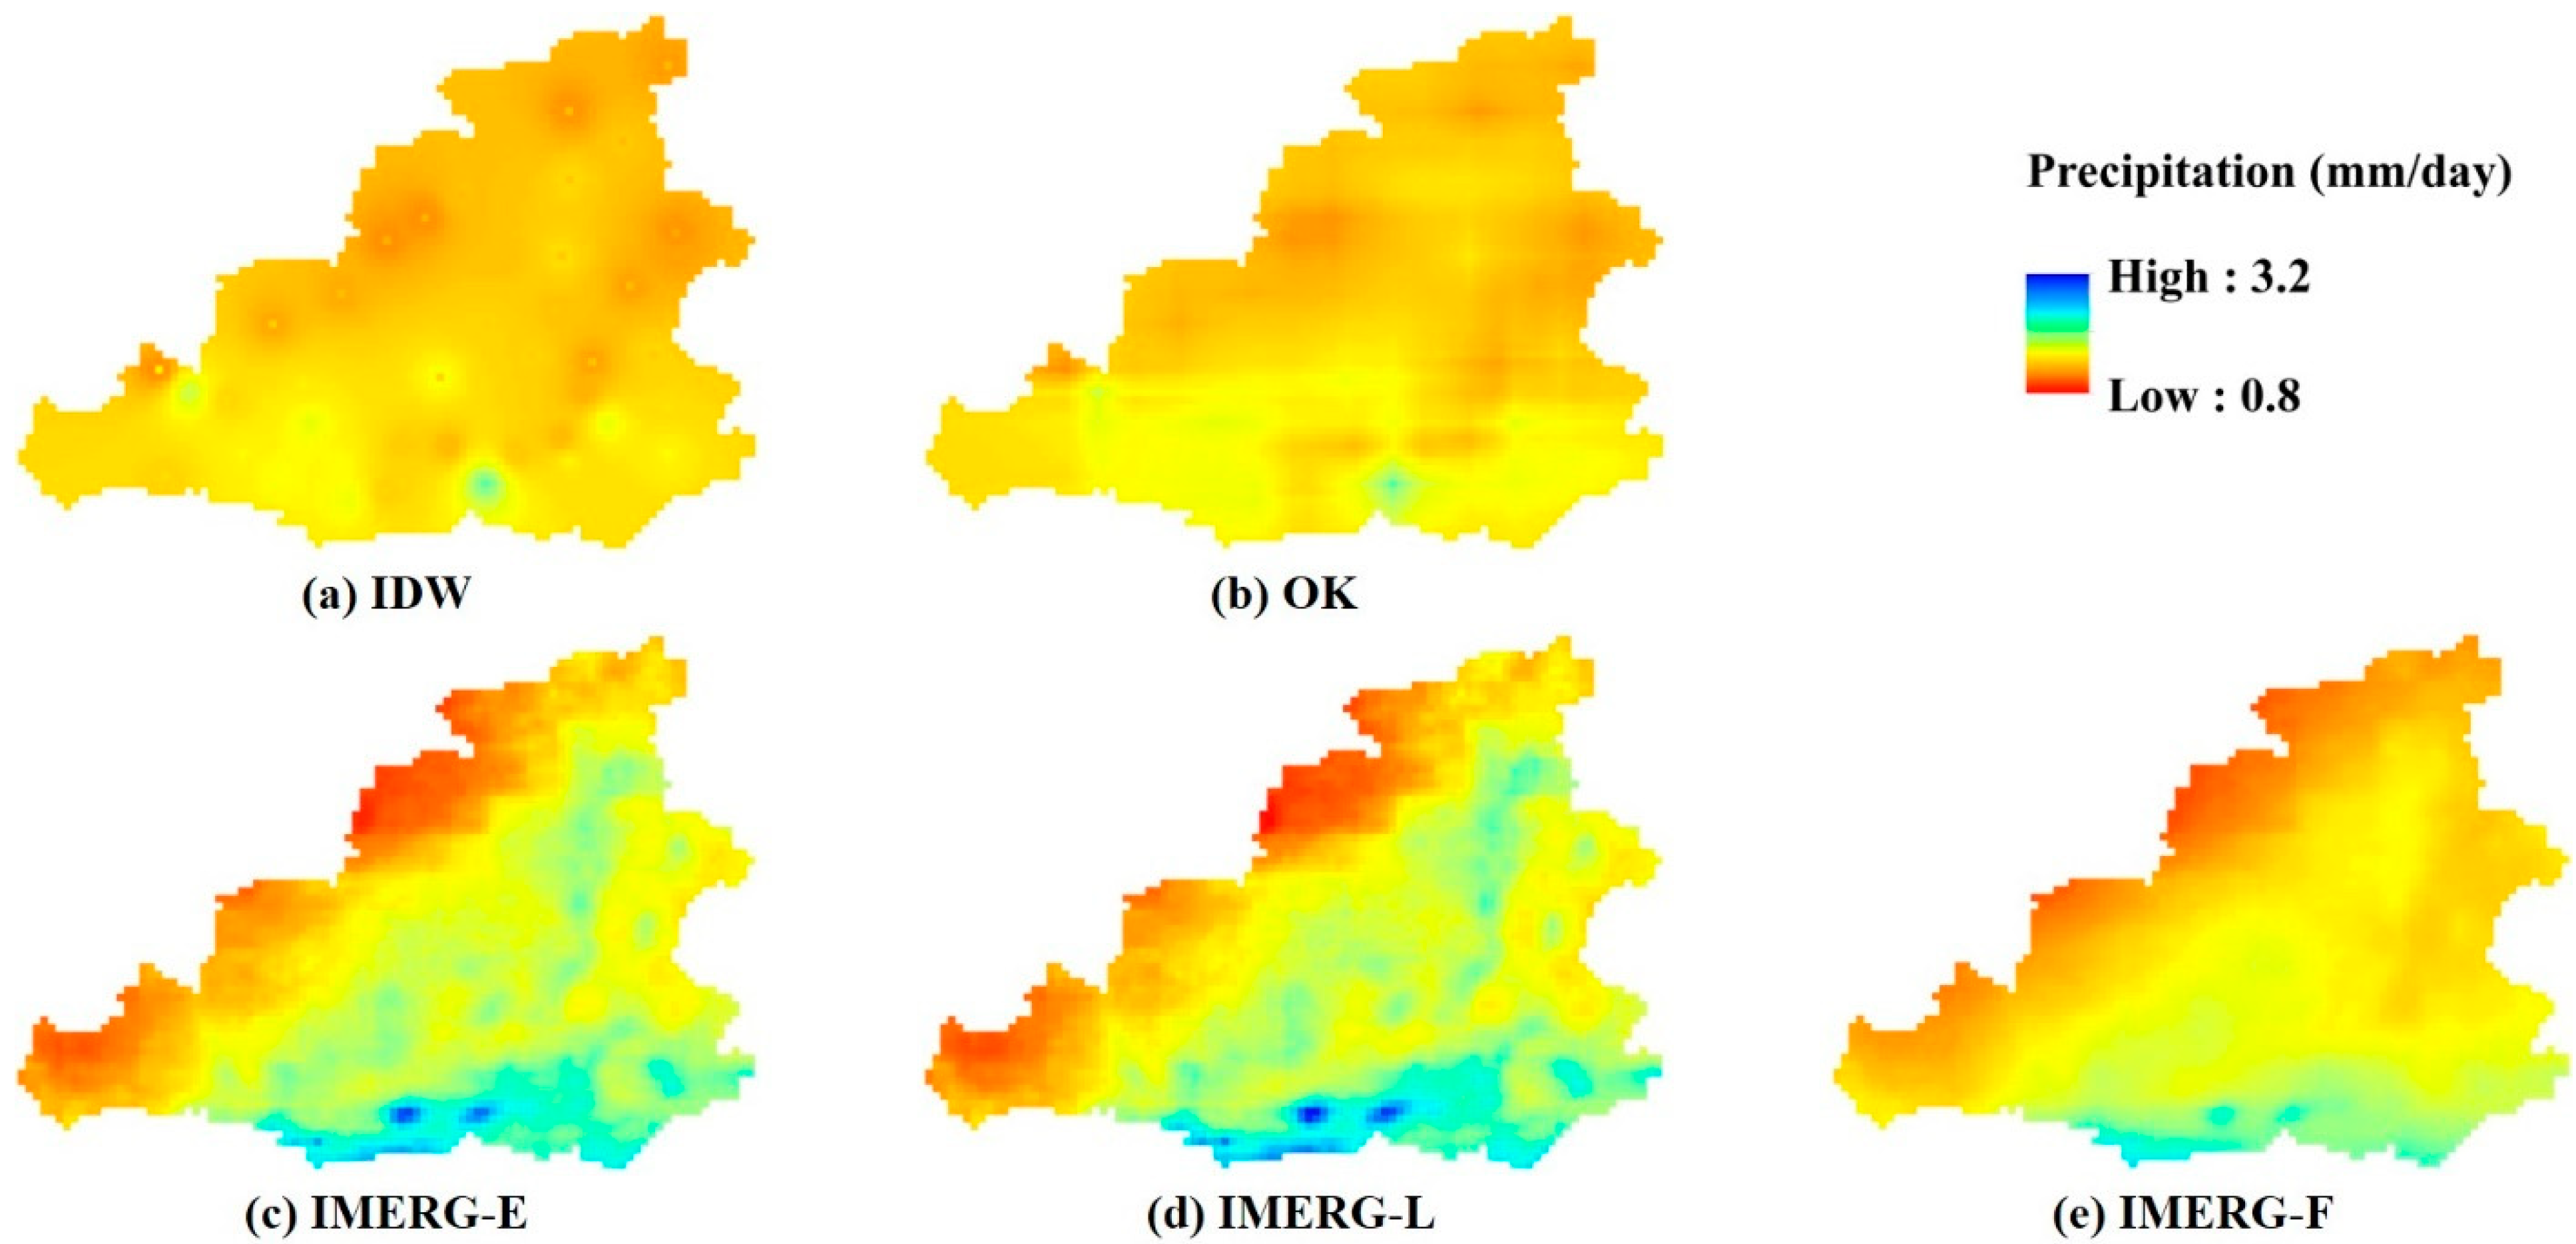
4.1.1. Spatial Patterns

Figure 2 shows the spatial patterns of the mean daily precipitation estimated from the two interpolation methods (IDW and OK) and the three IMERG SPPs (IMERG-E, IMERG-L, and IMERG-F) from 1 January 2008 to 31 December 2019. As shown in Figure 2, two gauge-based interpolated precipitation products demonstrate that precipitation in the MRYRB presents an apparent increasing trend from the north to the south. Note that the IDW-based precipitation presents the typical round artifacts that are commonly called “bulls-eye patterns”, while the precipitation distribution estimated from OK performed smoothly. The three IMERG SPPs present similar precipitation distribution patterns, which generally estimate a drier condition in the northwestern region and a wetter situation in the south part than the interpolated precipitation (Figure 2c–e). Correspondingly, higher spatial variability of SPP-based precipitation is observed in the MRYRB, with the minimum precipitation rate being 0.8 mm/d and the maximum being 3.2 mm/d. IMERG SPPs portray the high spatial heterogeneities of precipitation with more spatial details compared with the interpolated data. The mean daily precipitation of IMERG-F varies between 0.9 mm/d and 2.4 mm/d, which is smaller than that of IMERG-E (0.9 mm/d −3.0 mm/d) and IMERG-L (0.8 mm/d −3.2 mm/d).

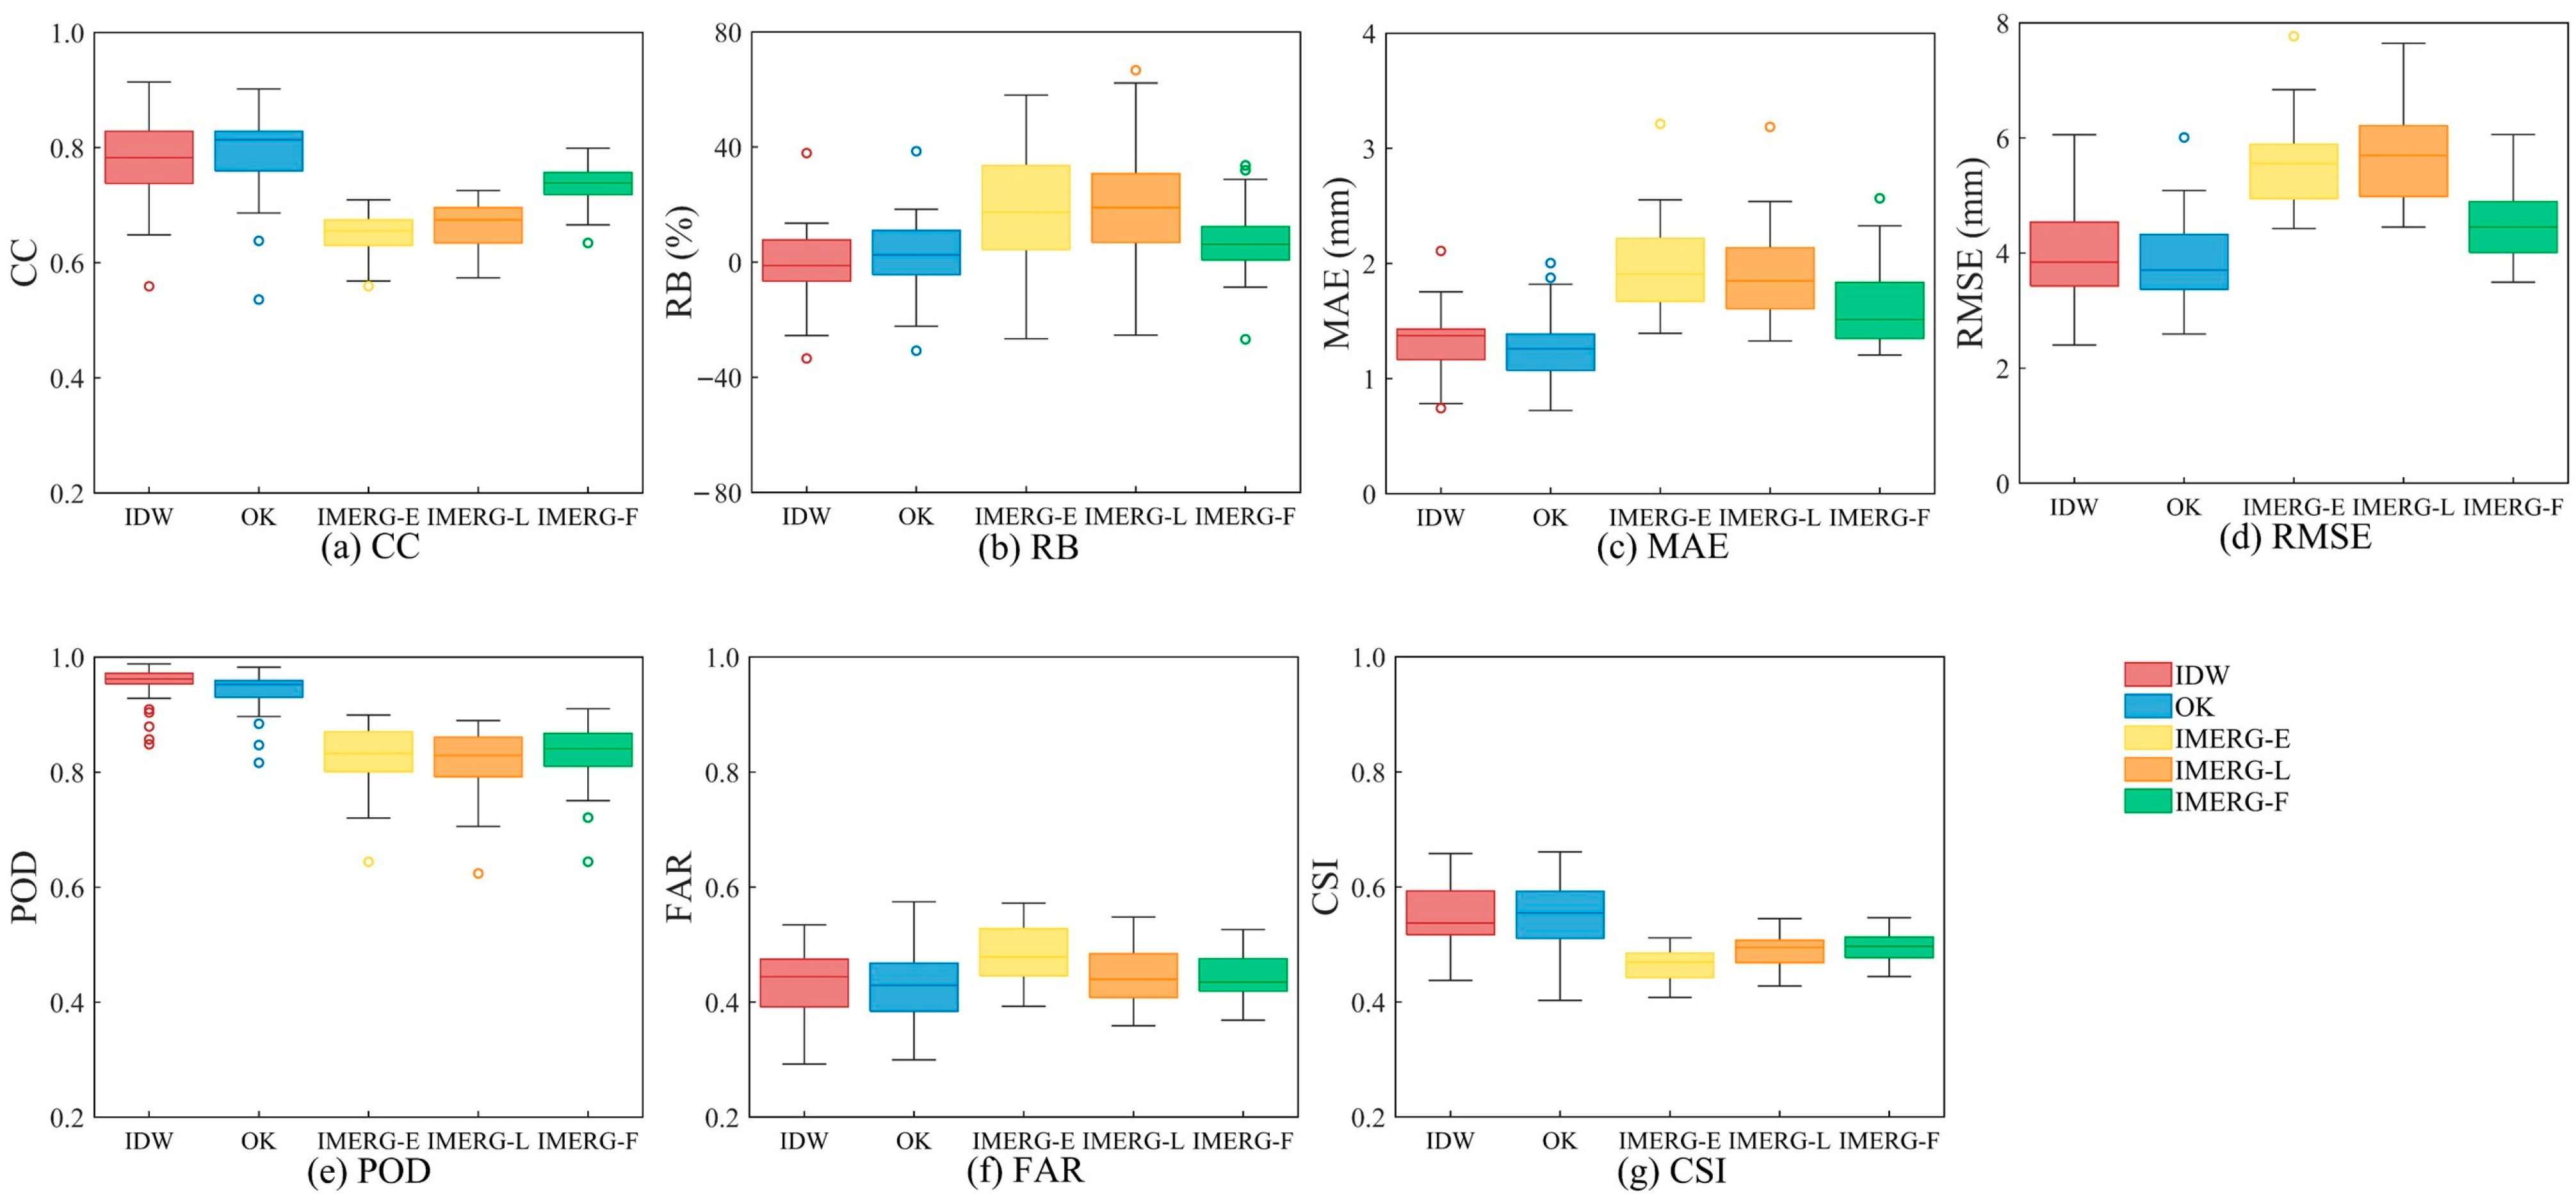
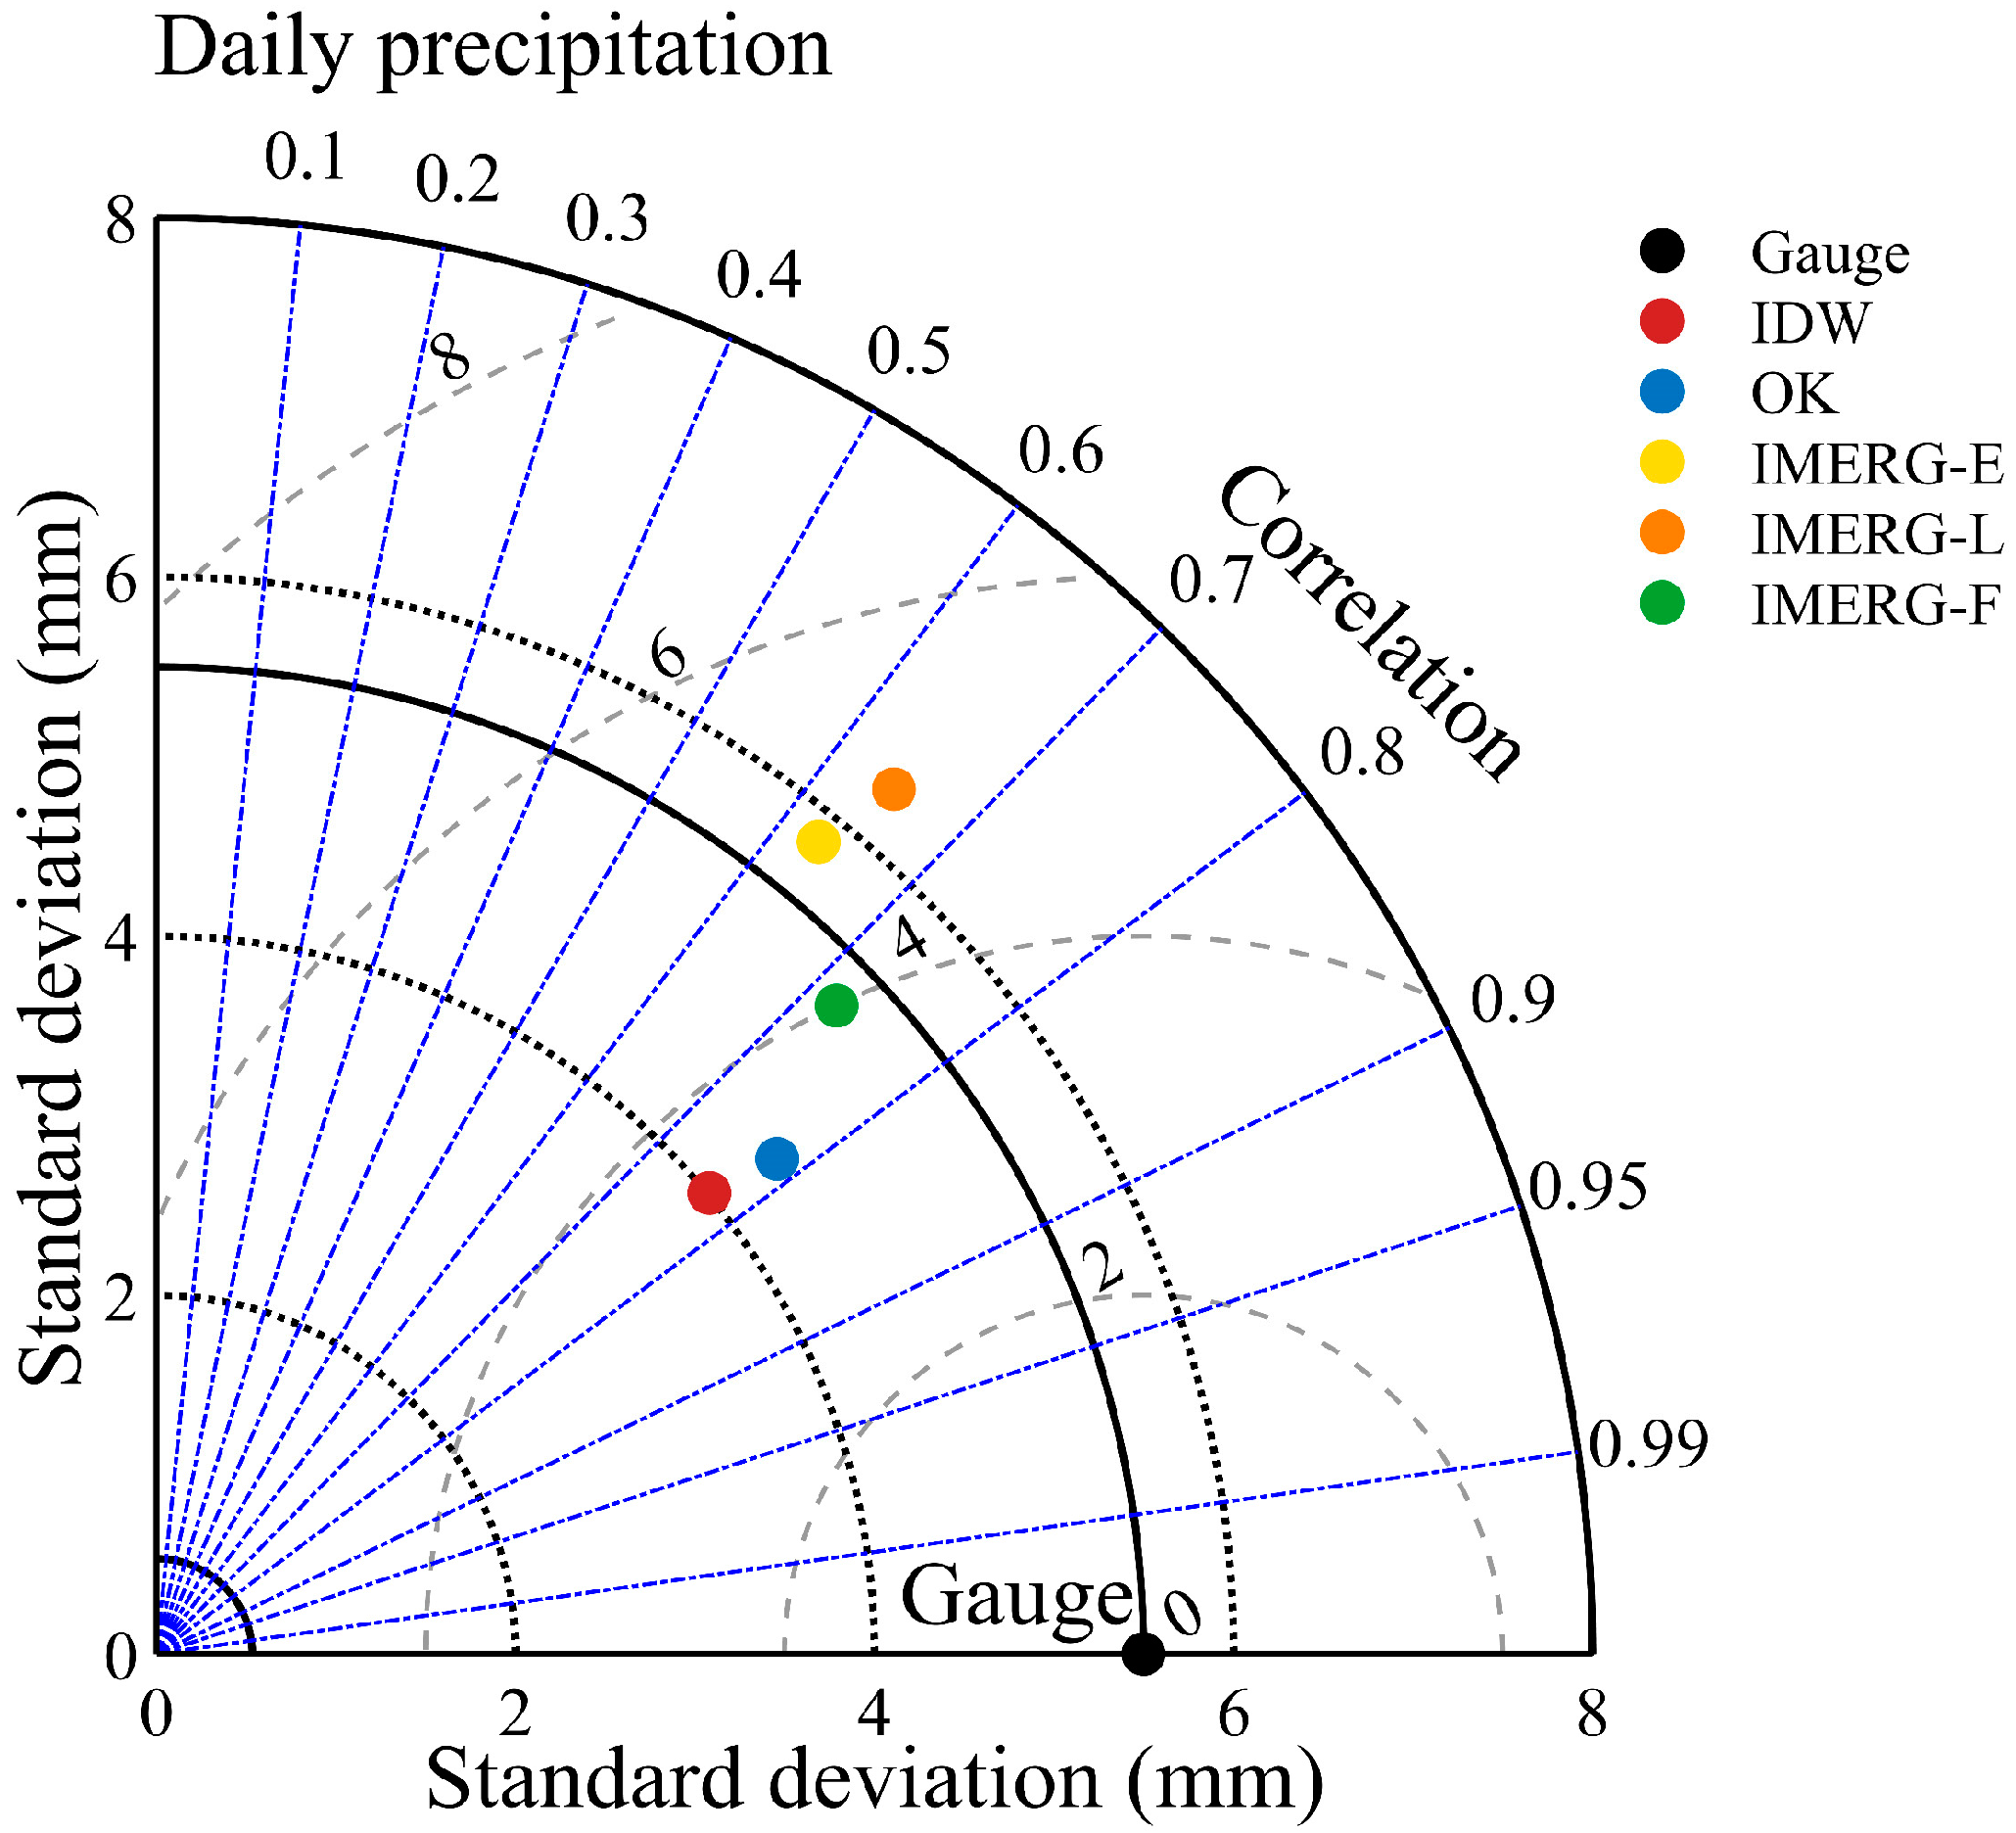
4.1.2. Validations on the IMERG SPPs and Interpolated Precipitation Estimates at a Daily Scale

The daily precipitation estimated from the two interpolation methods and three IMERG SPPs at the locations of the 43 rain gauges was statistically evaluated against the ground precipitation measurements during the period of 1 January 2008–31 December 2019 (Figure 3). The central mark of each box represents the median, while the bottom and top edges of the box indicate the 25% and 75% quartiles, respectively. In addition, the whiskers extend to the maximum and minimum, and the scattered points present outliers. The best overall correlation coefficient with the ground precipitation observations is achieved by OK (averaged CC = 0.78), followed by IDW (averaged CC = 0.79). IMERG-F exhibits moderate CC scores, ranging from 0.63 to 0.79, while IMERG-E and IMERG-L display similar magnitudes of CC (averaged CC = 0.64 and 0.66, respectively). Regarding the deviation metrics, IMERG-E and IMERG-L largely overestimate daily precipitation in the MRYRB, with mean RB values of 19.1% and 20.9%. The post-real-time IMERG-F obtains a substantially lower systematic RB (7.28%) due to the use of the GPCC monthly precipitation dataset with the help of the gauge calibration algorithm. Overall, the statistical performance of MAE and RMSE featured similar with RB, as shown in Figure 3b–d. IDW and OK exhibit the best overall performance among all five precipitation estimates, while the near-real-time IMERG-E and IMERG-L are generally inclined to overestimate daily precipitation, and IMERG-F obtains lower deviation of precipitation estimates.
Regarding the contingency of all five precipitation estimates, the two interpolation methods have evidently higher PODs (averaged POD = 0.95 and 0.94 for IDW and OK, respectively) than the three IMERG SPPs (0.82, 0.81, and 0.83 for IMERG-E, IMERG-L, and IMERG-F, respectively) (Figure 3e). It is worth noting that IDW and OK obtain extremely high POD scores but relatively poor FAR scores, reflecting the imbalance of the precipitation interpolated algorithm. More specifically, the frequency of precipitation occurrence is often overestimated in the precipitation interpolation process, resulting in high POD and low FAR. This phenomenon is hardly avoidable when using the interpolation algorithm merely considering the relative locations of stations. Among the three IMERG SPPs, IMERG-L has inferior performance, with higher FAR (0.48) and lower CSI (0.46) than IMERG-E and IMERG-F. Nevertheless, the three IMERG SPPs generally provide similar performance in terms of detection metrics. This finding indicates that the retrieval and calibration algorithms of IMERG have limitations in detecting precipitation for both near-real-time and post-real-time products.
The Taylor diagram of three IMERG SPPs and two interpolated precipitation estimates is illustrated to visualize the concise statistical summary on the performance of all five precipitation estimates in Figure 4. A Taylor diagram quantifies the degree of correspondence between the simulated and observed behavior in terms of three statistics: CC, centered RMSE, and standard deviation (STD) [38,39]. As shown in Figure 4, OK demonstrates the best overall performance in capturing the dynamic variation of precipitation, with the highest CC (0.79), the lowest centered RMSE (3.39 mm), and relatively closer STD (4.39 mm) to that of the observation. IDW, by contrast, demonstrates lower CC (0.77), higher centered RMSE (3.50 mm), and excessively low STD (3.99 mm). Although IDW and OK present slightly lower correlations with the observations than the three IMERG SPPs, IMERG-F simulates the amplitude of the variations (almost the same STD as the observed) much better than the two interpolated precipitation estimates, which is one of the advantages of satellite precipitation data. Meanwhile, as near-time SPPs, IMERG-E and IMERG-L feature inferior overall performance compared to IMERG-F.

4.2. Temporal and Spatial Variation of SPP-Based Precipitation Estimates

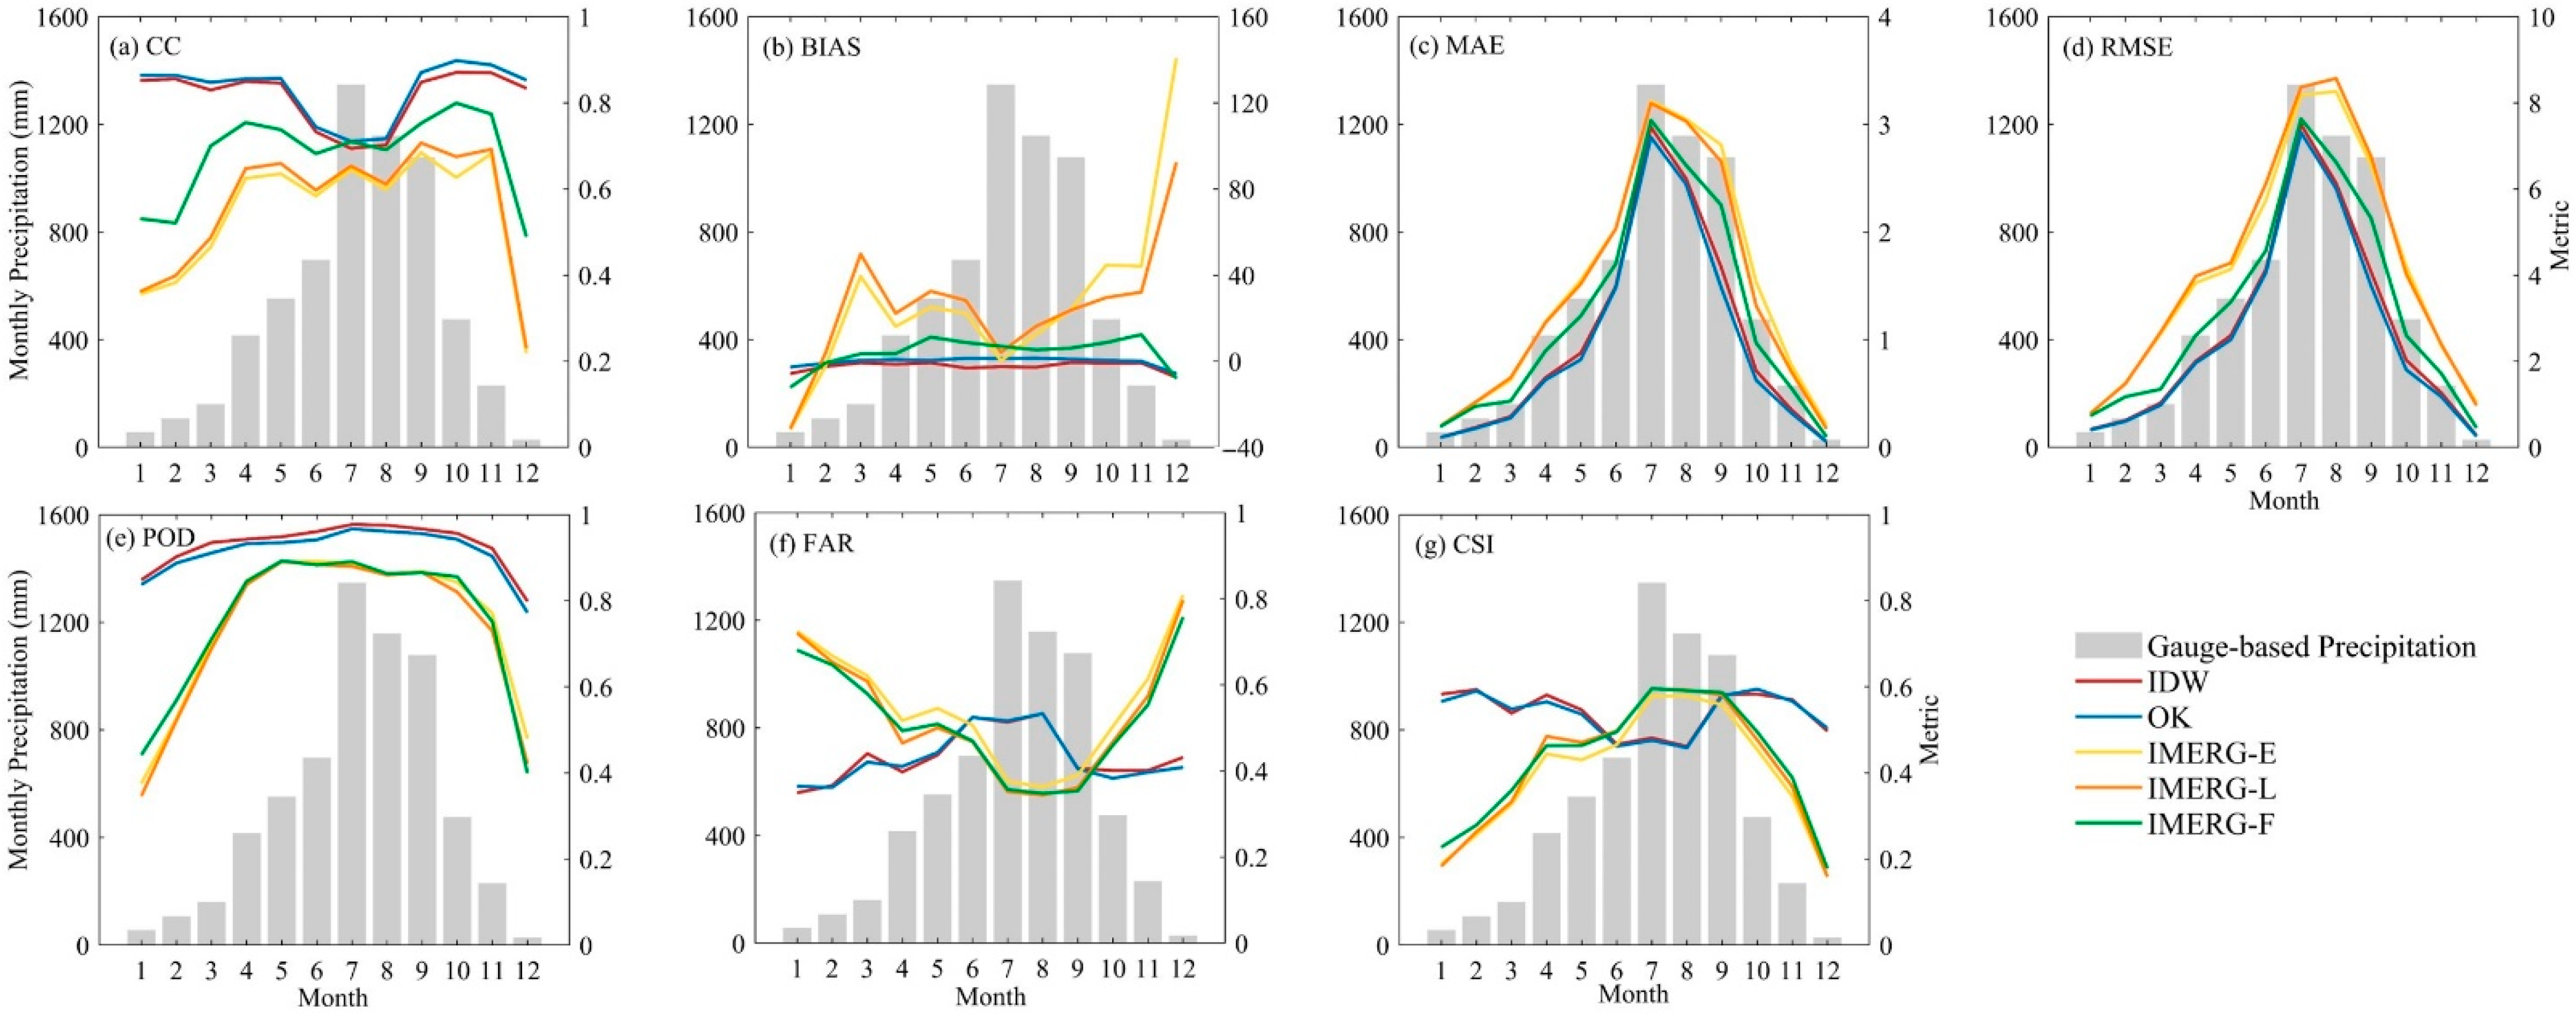
4.2.1. Temporal Variation of Metrics in MRYRB

Figure 5 provides a comparison of the monthly variations of the statistical metrics (CC, BIAS, MAE, RMSE, POD, FAR, and CSI) calculated by daily precipitation estimated from the two interpolation methods and the three IMERG SPPs. Meanwhile, intra-annual distribution of precipitation in the MRYRB is displayed as the gray columns in the left axis. Precipitation in the wet season (May–October) makes up about 75% of the total annual precipitation, while the precipitation in winter (December–January) merely accounts for less than 5%. As exhibited in Figure 5a, IDW and OK demonstrate a higher correlation with the gauge-based precipitation than the three IMERG SPPs. Nevertheless, IMERG-F appears to exceed the correlation of interpolated data in the rainiest month (July) in the course of a year. The sharp deterioration in the CC values of the interpolated data in July and August may be due to the fact that the interpolation algorithms hardly describe the specific spatial changes of precipitation. When the rainy season comes, it is difficult for gauge stations in the basin to capture all precipitation that occurs, leading to inaccurate estimation of precipitation. All IMERG SPPs demonstrate similar patterns of CC, with a significant deterioration in the winter season. For instance, IMERG-E provides CC values of 0.22, 0.36, and 0.38 in winter, whereas it provides a value of 0.69 in September. This is probably due to the strong scattering caused by snow cover on mountains in winter, and the light and solid precipitation plays an important role. Light precipitation in summer also has a certain effect on precipitation estimation, but it is not as serious as in winter. Although GPM extends the capabilities of the TRMM sensors to detect light and solid precipitation, snow cover interferes with microwave-based satellites’ ability to distinguish frozen snow surfaces and clouds, reducing the capacity to detect precipitation particles. In terms of BIAS, both IMERG-E and IMERG-L demonstrate remarkable underestimation (31.7% and 31.2%) in January and significant overestimation (140.7% and 92.3%) in December, presenting considerable uncertainties in estimating solid and light precipitation. MAE and RMSE show similar patterns to the intra-annual distribution of precipitation, exhibiting an apparent increase in deviation metrics with the increase in monthly precipitation. Compared with IMERG SPPs, IDW and OK have relatively smaller errors in precipitation estimation.
In terms of the capability of detecting precipitation events, IDW and OK demonstrate extremely accurate POD, ranging from 0.80 to 0.98, much more accurate than the three IMERG SPPs, especially in the winter. However, regarding the FAR values, the two interpolation methods obtain worse performance than the three IMERG SPPs from June to September. As mentioned before, the precipitation interpolated algorithm tends to overestimate the frequency of precipitation occurrence, leading to the increased PODs and FAR. Therefore, data users need to pay attention to the inherent defect of interpolated precipitation data when performing daily and hourly discharge simulations. It should be noted that all three IMERG SPPs failed to accurately detect winter precipitation. Specifically, the average POD, FAR, and CSI of the three IMERG SPPs in December and January are 0.41, 0.75, and 0.18, respectively. Despite being calibrated by the gauge-based calibration with the GPCC dataset, the capability of precipitation detection has barely improved. These findings in this section require the attention of algorithm developers to refine the IMERG algorithms in future versions.

4.2.2. Spatial Variation of Metrics in MRYRB

To investigate the accuracy of the interpolation methods and the IMERG SPPs in different terrains, the CC (representing the correlation with the gauge-based precipitation), RB (measuring the overall systematic bias), and RMSE (denoting the overall precipitation detection capability) values were computed at the locations of the 43 weather stations at a daily scale (Figure 6). Overall, the two interpolation methods, OK and IDW, present the best correlation with gauge-based measurements, followed by IMERG-F. IMERG-E and IMERG-L show the same spatial distribution pattern of CC, which demonstrates that CC values in the southwestern part of the basin (the highlands) are lower than those in the southeastern part (the lowlands). Despite OK and IDW showing better correlation at most stations, the CC values of the two interpolation methods are lower than those of IMERG-F at times for the gauge stations at the basin boundary. A possible reason for this is that the interpolation algorithms provide more accurate precipitation estimates for most points within the basin but tend to lose some accuracy at the boundary and periphery to some extent. As for the systematic deviation from the gauge observations, the two interpolation methods notably underestimate precipitation in the southwestern part of the basin. The near-real-time SPPs, IMERG-E and IMERG-L, prominently overestimate precipitation in most stations and present underestimation at some stations in the north and southwestern parts. IMERG-F demonstrates better performance than IMERG-E and IMERG-L and maintain a margin of RB between −10% and 10% at most stations. OK and IDW have relatively higher CSI values than the three IMERG SPPs and demonstrate a pattern of high south values and low north values. IMERG-L and IMERG-F present slightly superior performance than IMERG-E in detecting daily precipitation, with higher CSI values.

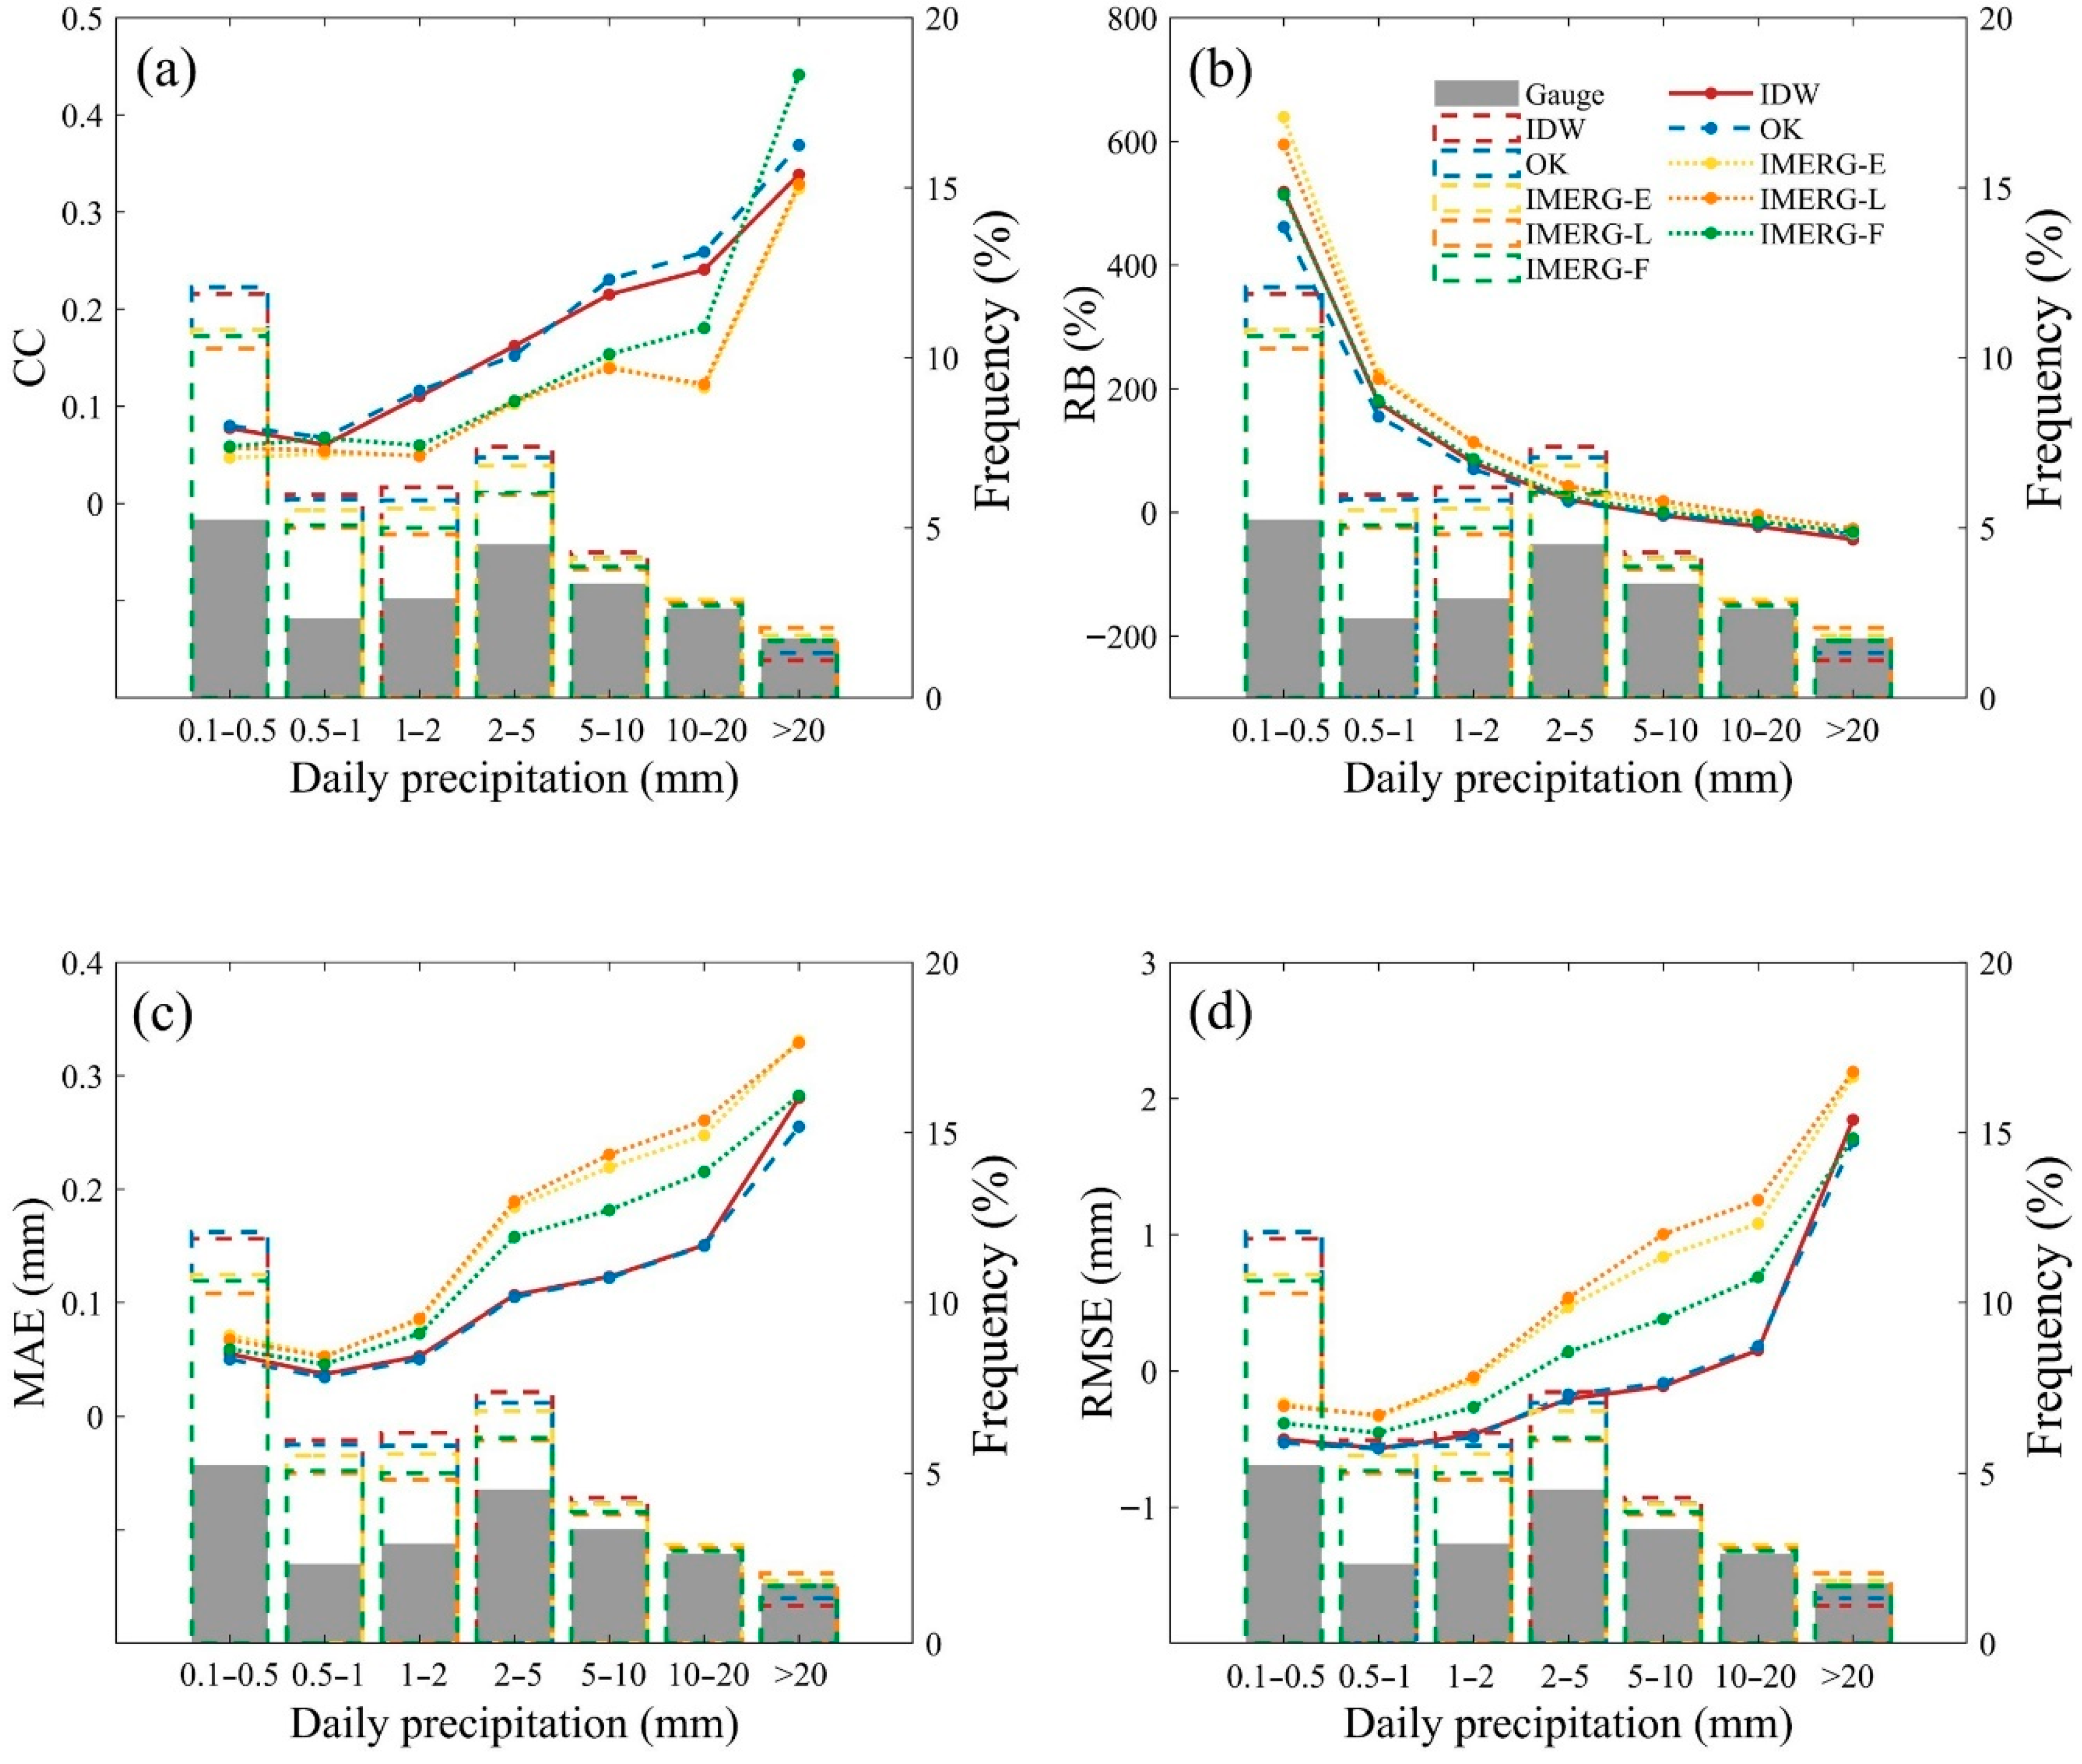
4.3. Metric Variation at Different Precipitation Intensities

Figure 7 illustrates the frequency distribution of precipitation estimates (the gray columns) and statistical metrics (CC, RB, MAE, and RMSE) under different precipitation intensities at a daily scale. Overall, both SPP-based and gauge-interpolated precipitation estimates overestimate the total frequency in varying degrees for precipitation in the range of 0.1–20 mm. Notably, IDW and OK present excessive underestimation of precipitation over 20 mm, while IMERG-F approximates the frequency distribution of the gauge observations. This finding indicates that IMERG-F possesses a better capability over IDW and OK in detecting heavy precipitation events. Interpolation algorithms tend to underestimate heavy precipitation events both in terms of quantity and frequency, which has been revealed in many previous studies [40,41]. The statistical metrics of all five precipitation estimates exhibit a strong dependence on precipitation intensities. The CC values increase with increasing daily precipitation intensities. More specifically, the correlations between the interpolated precipitation and gauge observations are basically similar to those of the IMERG SPPs for precipitation under 1 mm. The expansion of the advantage of the interpolated data occurs when the precipitation ranges from 1 to 20 mm, but when the precipitation is above 20 mm, the advantage is lost and even inferior to IMERG-F. With respect to the accuracy metrics, RB has an overall declining trend as precipitation intensity increases and tends to be close to zero. MAE and RMSE have a generally rising trend with the increase of precipitation, which coheres with the trend of CC variations. The deficiencies of interpolation algorithms in estimating precipitation intensity over 20 mm warrant the attention of hydrologists who concern themselves with the heavy precipitation events in hydrological simulation.

5. Discussion

This study first applied two interpolation methods (IDW and OK) to obtain precipitation estimation and subsequently compared the calculated interpolation data versus three IMERG SPPs (IMERG-E, IMERG-L, and IMERG-F) to determine the net effect of satellite precipitation products for hydrological applications. In terms of overall statistical metrics (Figure 3), IDW and OK generally provide better performance than the three IMERG SPPs at a daily scale. The post-real-time IMERG-F obtains lower deviation relative to gauge observations, while the near-real-time IMERG-E and IMERG-L are inclined to overestimate daily precipitation. It should be noted that the three IMERG SPPs present few gaps in terms of the capability of detecting precipitation events (POD, FAR, and CSI). This is consistent with the findings of Meng et al. [3]. Data users and algorithm developers need to pay attention to the phenomenon that IMERG SPPs have limitations in detecting precipitation events for both near-real-time and post-real-time products.
Precipitation patterns, climatic conditions, and topography grossly affect the precipitation estimates of SPPs [1,42,43]. Although the interpolation precipitation data are more accurate in terms of overall statistical metrics, the results considerably change when considering the spatial and temporal variation of metrics. In this study, IMERG-F presents a higher correlation with the ground observations than IDW and OK in July (Figure 5a). Tang et al. [2] noted that IMERG and 3B42V7 products tend to show better performance in relatively mild and wet climates. Their findings are consistent with the results of this study. The sharp deterioration of the CC values of the interpolated data in July and August needs to be noticed by users who apply interpolation algorithms. A possible reason for this phenomenon is that the interpolation algorithms hardly describe the specific spatial changes of precipitation. Moreover, the gauge stations, as the benchmark for interpolation, have no ability to capture all precipitation events that occur in the basin, which is another possible reason for the inaccurate estimation of precipitation. Interestingly, this study revealed that all IMERG SPPs demonstrate a significant deterioration in correlation with the gauge observations in the winter season (Figure 5a). A similar phenomenon occurred in the study of Meng et al. [3]. Solid and light precipitation events tend to occur, and snow cover on mountains shows a tendency to thicken in the winter season. In this context, the poor performance of IMERG SPPs in the winter season could be explained by the fact that strong scattering caused by snow cover on mountains interferes with the ability of microwave-based satellites to distinguish frozen snow surfaces from clouds. As for detection metrics, IDW and OK obtain higher FAR values than the IMERG SPPs from June to September (Figure 5f). In addition, the precipitation detection capability of three IMERG SPPs present similar characteristics and decline sharply in the winter season. This indicates that the solid and light precipitation detection capability of IMERG SPPs still needs to be improved to meet the requirements of use. Ma et al. [44] emphasized that the effects of local strong convectional weather and complex terrain grossly affect the capability of satellite precipitation retrieval and result in unexpected errors over the Tibetan Plateau. This study investigated the accuracy of interpolation methods and IMERG SPPs in different terrains and found that the qualities of all five precipitation estimates feature distinctive spatial variabilities (Figure 6). Moreover, the accuracy of both interpolated and satellite precipitation data is influenced by precipitation intensity (Figure 7). Previous studies have explored the relationship between precipitation intensity and various satellite precipitation products [45,46,47]. In this study, IMERG-F presents better performance than IDW and OK for precipitation above 20 mm. This is mainly due to the fact that interpolation algorithms tend to underestimate heavy precipitation events and overestimate light precipitation events [48]. The inherent deficiencies of interpolation algorithms in estimating heavy precipitation events need the attention of hydrologists.
The mainstream thoughts on the assessment of satellite precipitation products are based on the perspective of statistical and hydrological simulation application [12,47,49]. However, due to the inherent uncertainties of hydrological models and parameter estimations, there are non-negligible divergences in the accuracy of satellite precipitation products between the findings of different research studies. This study calculated interpolation data by the LOOCV for each gauge station and evaluated the accuracy of IMERG SPPs relative to interpolation data to determine the potential utilities for SPP-based hydrological applications. The assessment framework proposed in this study aims to eliminate the uncertainty in hydrological models and parameter estimates during satellite precipitation assessment and determine the net effect of satellite precipitation products for hydrological applications. To the best of our knowledge, few studies have been conducted on the comparison between satellite precipitation products and interpolation data at a grid-point scale. It is recommended for researchers to bring interpolated precipitation data into consideration in statistical and hydrological assessments as an important indication of the net utility of satellite products. It is worth noting that the ability to estimate spatially distributed precipitation from point measurements is heavily dependent on the density, location, and reliability of measurement stations [4,50]. Hence, further work is needed to investigate the effect of rain gauge network density and location on interpolation data for better evaluation of satellite precipitation products. Except for SPP-based and gauge-interpolated precipitation estimates, the weather radar and reanalysis data sets are considered as vital sources of precipitation estimation for a wide range of hydrological applications [14]. The accuracy of these precipitation estimates was not analyzed in this study, and they could be taken into account in future studies.
Most previous studies tended to use interpolation methods to obtain spatial precipitation in study areas with moderate or rich rain gauge network densities [51,52]. As demonstrated in this study, despite the overall accuracy of interpolated precipitation data being greater, satellite precipitation products offer superiority in some respects. It is recommended that researchers take advantage of the information from satellite products while using interpolation methods to generate more accurate precipitation estimates at the basin scale. Furthermore, precipitation data fusion techniques should be considered to utilize the advantages of the precipitation information of available gauge stations and SPPs, as mentioned in [53,54,55]. Chen et al. [56] used four satellite-based precipitation products (3B42RT, CMORPH, PERSIANN, and GSMaP-NRT) and gauge observations in the Xijiang Basin of China to derive daily precipitation estimates by applying a geographically weighted ridge regression method. The results indicated that the fusion scheme conspicuously improved the accuracy of precipitation estimates, and the application of multiple SPPs provided more reliable precipitation estimates than using a single SPP. Zhan et al. [11] assimilated satellite soil moisture retrievals by using the Variable Infiltration Capacity land surface model and particle filter to adjust TMPA precipitation estimates. They found that satellite soil moisture retrievals provide additional information in the fusion procedure, and the assimilation is more effective when correcting moderate precipitation under dry surface conditions to normal surface conditions. These fusion techniques could be adopted in the MRYRB in the future.

6. Conclusions

In this study, we assessed the performance of the latest IMERG products (IMERG-E, IMERG-L, and IMERG-F) against the calculated interpolation data and the ground precipitation observations at a daily scale in the MRYRB. Based on the obtained results, the main conclusions of this study are summarized as follows:
(1)
The overall assessment of IMERG SPPs versus interpolated precipitation estimates demonstrated that the two interpolation methods (IDW and OK) obtain the best overall performance at a daily scale in the MRYRB, followed by IMERG-F, whereas IMERG-E and IMERG-L have inferior performance.
(2)
IDW and OK obtain relatively lower CC values and higher FAR scores in the rainy season than IMERG-F, as it is difficult for gauge stations to capture all precipitation events when the rainy season comes. Considering the spatial variation of metrics, the CC values of OK and IDW are lower than those of IMERG-F for the gauge stations at the basin boundary. Furthermore, IMERG-F possesses a better capability over IDW and OK in detecting heavy precipitation events (over 20 mm). The inherent deficiencies of interpolation algorithms, which hardly describe the specific spatial changes of precipitation and tend to underestimate heavy precipitation events, warrant the attention of hydrologists.
(3)
The three IMERG SPPs generally provide similarly poor performance in terms of detection metrics, and they failed to accurately detect winter precipitation. The monthly bias-correction procedure for IMERG-F may not entirely reduce detection errors at a daily scale.
Overall, the interpolation methods provide an overall better performance than the IMERG SPPs, whereas the IMERG SPPs offer superiority in some respects. Data fusion techniques could be used to improve the performance of IMERG SPPs by combining the information of gauge observations and other precipitation products. This study proposed an assessment framework that comprehensively compares the accuracy of satellite precipitation with interpolated precipitation. It is recommended that researchers consider interpolated precipitation data in the statistical assessment process as an important reference of the net utility of satellite products.

Author Contributions

Conceptualization, G.W. and Z.B.; methodology, J.S.; writing—original draft preparation, J.S.; funding acquisition, Z.B.; investigation, J.Z., G.W. and Z.B.; data curation, C.L. and J.J.; visualization, J.S. and Z.B.; writing—review and editing, G.W., Z.B. and Y.L. All authors have read and agreed to the published version of the manuscript.

Funding

This work is supported by the National Key R&D Program of China (grant numbers 2017YFA0605002), National Natural Science Foundation of China (grant numbers 41961124007, 52121006, 41830863, 51879164), and “Six top talents” in Jiangsu province (grant no. RJFW-031).

Institutional Review Board Statement

Not applicable.

Informed Consent Statement

Not applicable.

Data Availability Statement

Not applicable.

Acknowledgments

We extend our sincere gratitude to the GPM research communities for making the satellite rainfall data available for this work. The authors extend their appreciation to the reviewers for their thoughtful comments and valuable advice.

Conflicts of Interest

The authors declare no conflict of interest.

References

  1. Dinku, T.; Chidzambwa, S.; Ceccato, P.; Connor, S.J.; Ropelewski, C.F. Validation of high-resolution satellite rainfall products over complex terrain. Int. J. Remote Sens. 2008, 29, 4097–4110. [Google Scholar] [CrossRef]
  2. Tang, G.; Ma, Y.; Long, D.; Zhong, L.; Hong, Y. Evaluation of GPM Day-1 IMERG and TMPA Version-7 legacy products over Mainland China at multiple spatiotemporal scales. J. Hydrol. 2016, 533, 152–167. [Google Scholar] [CrossRef]
  3. Meng, C.; Mo, X.; Liu, S.; Hu, S. Extensive evaluation of IMERG precipitation for both liquid and solid in Yellow River source region. Atmos. Res. 2021, 256, 105570. [Google Scholar] [CrossRef]
  4. Nikolopoulos, E.I.; Borga, M.; Creutin, J.D.; Marra, F. Estimation of debris flow triggering rainfall; influence of rain gauge density and interpolation methods. Geomorphology 2015, 243, 40–50. [Google Scholar] [CrossRef]
  5. Shi, J.; Wang, B.; Wang, G.; Yuan, F.; Shi, C.; Zhou, X.; Zhang, L.; Zhao, C. Are the Latest GSMaP Satellite Precipitation Products Feasible for Daily and Hourly Discharge Simulations in the Yellow River Source Region? Remote Sens. 2021, 13, 4199. [Google Scholar] [CrossRef]
  6. Joyce, R.J.; Janowiak, J.E.; Arkin, P.A.; Xie, P. CMORPH: A Method that Produces Global Precipitation Estimates from Passive Microwave and Infrared Data at High Spatial and Temporal Resolution. J. Hydrometeorol. 2004, 5, 287–296. [Google Scholar] [CrossRef]
  7. Hsu, K.-L.; Gao, X.; Sorooshian, S.; Gupta, H.V. Precipitation estimation from remotely sensed information using artificial neural networks. J. Appl. Meteorol. 1997, 36, 1176–1190. [Google Scholar] [CrossRef]
  8. Huffman, G.J.; Bolvin, D.T.; Nelkin, E.J.; Wolff, D.B.; Adler, R.F.; Gu, G.; Yang, H.; Bowman, K.P.; Stocker, E.F. The TRMM Multisatellite Precipitation Analysis (TMPA): Quasi-Global, Multiyear, Combined-Sensor Precipitation Estimates at Fine Scales. J. Hydrometeorol. 2010, 8, 38–55. [Google Scholar] [CrossRef]
  9. Kubota, T.; Shige, S.; Hashizume, H.; Aonashi, K.; Takahashi, N.; Seto, S.; Hirose, M.; Takayabu, Y.N.; Ushio, T.; Nakagawa, K. Global Precipitation Map Using Satellite-Borne Microwave Radiometers by the GSMaP Project: Production and Validation. IEEE Trans. Geosci. Remote Sens. 2007, 45, 2259–2275. [Google Scholar] [CrossRef]
  10. Smith, E.A.; Asrar, G.; Furuhama, Y.; Ginati, A.; Zhang, W. International Global Precipitation Measurement (GPM) Program and Mission: An Overview. In Measuring Precipitation from Space; Springer: Dordrecht, The Netherlands, 2007. [Google Scholar]
  11. Zhan, W.; Pan, M.; Wanders, N.; Wood, E.F. Correction of real-time satellite precipitation with satellite soil moisture observations. Hydrol. Earth Syst. Sci. 2015, 19, 4275–4291. [Google Scholar] [CrossRef] [Green Version]
  12. Yuan, F.; Zhang, L.; Win, K.; Ren, L.; Zhao, C.; Zhu, Y.; Jiang, S.; Liu, Y. Assessment of GPM and TRMM Multi-Satellite Precipitation Products in Streamflow Simulations in a Data-Sparse Mountainous Watershed in Myanmar. Remote Sens. 2017, 9, 302. [Google Scholar] [CrossRef] [Green Version]
  13. Islam, M.A.; Yu, B.; Cartwright, N. Assessment and comparison of five satellite precipitation products in Australia. J. Hydrol. 2020, 590, 125474. [Google Scholar] [CrossRef]
  14. Li, C.; Tang, G.; Hong, Y. Cross-evaluation of ground-based, multi-satellite and reanalysis precipitation products: Applicability of the Triple Collocation method across Mainland China. J. Hydrol. 2018, 562, 71–83. [Google Scholar] [CrossRef]
  15. Tan, J.; Huffman, G.J.; Bolvin, D.T.; Nelkin, E.J. IMERG V06: Changes to the Morphing Algorithm. J. Atmos. Ocean. Technol. 2019, 36, 2471–2482. [Google Scholar] [CrossRef]
  16. Moazami, S.; Najafi, M.R. A comprehensive evaluation of GPM-IMERG V06 and MRMS with hourly ground-based precipitation observations across Canada. J. Hydrol. 2021, 594, 125929. [Google Scholar] [CrossRef]
  17. Amjad, M.; Yilmaz, M.T.; Yucel, I.; Yilmaz, K.K. Performance evaluation of satellite- and model-based precipitation products over varying climate and complex topography. J. Hydrol. 2020, 584, 124707. [Google Scholar] [CrossRef]
  18. Le, M.; Lakshmi, V.; Bolten, J.; Bui, D.D. Adequacy of Satellite-derived Precipitation Estimate for Hydrological Modeling in Vietnam Basins. J. Hydrol. 2020, 586, 124820. [Google Scholar] [CrossRef]
  19. Kim, K.; Park, J.; Baik, J.; Choi, M. Evaluation of topographical and seasonal feature using GPM IMERG and TRMM 3B42 over Far-East Asia. Atmos. Res. 2017, 187, 95–105. [Google Scholar] [CrossRef]
  20. Fang, J.; Yang, W.; Luan, Y.; Du, J.; Lin, A.; Zhao, L. Evaluation of the TRMM 3B42 and GPM IMERG products for extreme precipitation analysis over China. Atmos. Res. 2019, 223, 24–38. [Google Scholar] [CrossRef]
  21. Yuan, F.; Zhang, L.; Soe, K.; Ren, L.; Zhao, C.; Zhu, Y.; Jiang, S.; Liu, Y. Applications of TRMM- and GPM-Era Multiple-Satellite Precipitation Products for Flood Simulations at Sub-Daily Scales in a Sparsely Gauged Watershed in Myanmar. Remote Sens. 2019, 11, 140. [Google Scholar] [CrossRef] [Green Version]
  22. Lu, D.; Yong, B. Evaluation and hydrological utility of the latest GPM IMERG V5 and GSMaP V7 precipitation products over the Tibetan Plateau. Remote Sens. 2018, 10, 2022. [Google Scholar] [CrossRef] [Green Version]
  23. Kumar, M.; Hodnebrog, Ø.; Sophie Daloz, A.; Sen, S.; Badiger, S.; Krishnaswamy, J. Measuring precipitation in Eastern Himalaya: Ground validation of eleven satellite, model and gauge interpolated gridded products. J. Hydrol. 2021, 599, 126252. [Google Scholar] [CrossRef]
  24. Samuel, A.; Stosic, B.; Menezes, R.C.; Singh, V.P. Comparison of Interpolation Methods for Spatial Distribution of Monthly Precipitation in the State of Pernambuco, Brazil. J. Hydrol. Eng. 2019, 24, 04018068. [Google Scholar]
  25. Zhao, G.; Tian, P.; Mu, X.; Jiao, J.; Wang, F.; Gao, P. Quantifying the impact of climate variability and human activities on streamflow in the middle reaches of the Yellow River basin, China. J. Hydrol. 2014, 519, 387–398. [Google Scholar] [CrossRef]
  26. Gao, P.; Mu, X.M.; Wang, F.; Li, R. Changes in streamflow and sediment discharge and the response to human activities in the middle reaches of the Yellow River. Hydrol. Earth Syst. Sci. 2011, 15, 1–10. [Google Scholar] [CrossRef] [Green Version]
  27. She, D.; Xia, J.; Zhang, Y. Changes in reference evapotranspiration and its driving factors in the middle reaches of Yellow River Basin, China. Sci. Total Environ. 2017, 607, 1151–1162. [Google Scholar] [CrossRef]
  28. Shi, C.; Zhou, Y.; Fan, X.; Shao, W. A study on the annual runoff change and its relationship with water and soil conservation practices and climate change in the middle Yellow River basin. Catena 2013, 100, 31–41. [Google Scholar] [CrossRef]
  29. Ying, M.; Zhang, W.; Yu, H.; Lu, X.; Feng, J.; Fan, Y.; Zhu, Y.; Chen, D. An Overview of the China Meteorological Administration Tropical Cyclone Database. J. Atmos. Ocean. Technol. 2014, 31, 287–301. [Google Scholar] [CrossRef] [Green Version]
  30. Huffman, G.J.; Bolvin, D.T.; Braithwaite, D.; Hsu, K.; Joyce, R.J.; Kidd, C.; Nelkin, E.J.; Sorooshian, S.; Stocker, E.F.; Tan, J. Integrated multi-satellite retrievals for the global precipitation measurement (GPM) mission (IMERG). In Satellite Precipitation Measurement; Springer: Cham, Switzerland, 2020; pp. 343–353. [Google Scholar]
  31. Tan, J.; Huffman, G.J.; Bolvin, D.T.; Nelkin, E.J. Diurnal Cycle of IMERG V06 Precipitation. Geophys. Res. Lett. 2019, 46, 13584–13592. [Google Scholar] [CrossRef]
  32. Li, J.; Heap, A.D. Spatial interpolation methods applied in the environmental sciences: A review. Environ. Modell. Softw. 2014, 53, 173–189. [Google Scholar] [CrossRef]
  33. Stisen, S.; Tumbo, M. Interpolation of daily raingauge data for hydrological modelling in data sparse regions using pattern information from satellite data. Hydrol. Sci. J. 2015, 60, 1911–1926. [Google Scholar] [CrossRef]
  34. Keblouti, M.; Ouerdachi, L.; Boutaghane, H. Spatial Interpolation of Annual Precipitation in Annaba-Algeria—Comparison and Evaluation of Methods. Energy Procedia 2012, 18, 468–475. [Google Scholar] [CrossRef] [Green Version]
  35. Jeffrey, S.J.; Carter, J.O.; Moodie, K.B.; Beswick, A.R. Using spatial interpolation to construct a comprehensive archive of Australian climate data. Environ. Model. Softw. Environ. Data News 2001, 16, 309–330. [Google Scholar] [CrossRef]
  36. Hu, Q.; Li, Z.; Wang, L.; Huang, Y.; Wang, Y.; Li, L. Rainfall Spatial Estimations: A Review from Spatial Interpolation to Multi-Source Data Merging. Water 2019, 11, 579. [Google Scholar] [CrossRef] [Green Version]
  37. Ly, S.; Charles, C.; Degre, A. Different methods for spatial interpolation of rainfall data for operational hydrology and hydrological modeling at watershed scale. A review. Biotechnol. Agron. Société Et Environ. 2013, 17, 392–406. [Google Scholar]
  38. Xu, Z.; Han, Y. Short communication comments on ‘DISO: A rethink of Taylor diagram’. Int. J. Climatol. 2020, 40, 2506–2510. [Google Scholar] [CrossRef]
  39. Taylor, K.E. Summarizing multiple aspects of model performance in a single diagram. J. Geophys. Res. Atmos. 2001, 106, 7183–7192. [Google Scholar] [CrossRef]
  40. Kurtzman, D.; Navon, S.; Morin, E. Improving interpolation of daily precipitation for hydrologic modelling: Spatial patterns of preferred interpolators. Hydrol. Process. 2009, 23, 3281–3291. [Google Scholar] [CrossRef]
  41. Haberlandt, U. Geostatistical interpolation of hourly precipitation from rain gauges and radar for a large-scale extreme rainfall event. J. Hydrol. 2007, 332, 144–157. [Google Scholar] [CrossRef]
  42. Satgé, F.; Defrance, D.; Sultan, B.; Bonnet, M.; Seyler, F.; Rouché, N.; Pierron, F.; Paturel, J. Evaluation of 23 gridded precipitation datasets across West Africa. J. Hydrol. 2020, 581, 124412. [Google Scholar] [CrossRef] [Green Version]
  43. Shi, J.; Yuan, F.; Shi, C.; Zhao, C.; Zhang, L.; Ren, L.; Zhu, Y.; Jiang, S.; Liu, Y. Statistical Evaluation of the Latest GPM-Era IMERG and GSMaP Satellite Precipitation Products in the Yellow River Source Region. Water 2020, 12, 1006. [Google Scholar] [CrossRef] [Green Version]
  44. Ma, Y.; Tang, G.; Long, D.; Yong, B.; Zhong, L.; Wan, W.; Hong, Y. Similarity and Error Intercomparison of the GPM and Its Predecessor-TRMM Multisatellite Precipitation Analysis Using the Best Available Hourly Gauge Network over the Tibetan Plateau. Remote Sens. 2016, 8, 569. [Google Scholar] [CrossRef] [Green Version]
  45. Tan, J.; Petersen, W.A.; Kirstetter, P.; Tian, Y. Performance of IMERG as a Function of Spatiotemporal Scale. J. Hydrometeorol. 2017, 18, 307–319. [Google Scholar] [CrossRef] [PubMed]
  46. Foelsche, U.; Kirchengast, G.; Fuchsberger, J.; Tan, J.; Petersen, W.A. Evaluation of GPM IMERG Early, Late, and Final rainfall estimates using WegenerNet gauge data in southeastern Austria. Hydrol. Earth Syst. Sci. 2017, 21, 6559–6572. [Google Scholar]
  47. Tang, G.; Clark, M.P.; Papalexiou, S.M.; Ma, Z.; Hong, Y. Have satellite precipitation products improved over last two decades? A comprehensive comparison of GPM IMERG with nine satellite and reanalysis datasets. Remote Sens. Environ. 2020, 240, 111697. [Google Scholar]
  48. Cheng, M.; Wang, Y.; Engel, B.; Zhang, W.; Peng, H.; Chen, X.; Xia, H. Performance Assessment of Spatial Interpolation of Precipitation for Hydrological Process Simulation in the Three Gorges Basin. Water 2017, 9, 838. [Google Scholar] [CrossRef] [Green Version]
  49. Yuan, F.; Wang, B.; Shi, C.; Cui, W.; Zhao, C.; Liu, Y.; Ren, L.; Zhang, L.; Zhu, Y.; Chen, T.; et al. Evaluation of hydrological utility of IMERG Final run V05 and TMPA 3B42V7 satellite precipitation products in the Yellow River source region, China. J. Hydrol. 2018, 567, 696–711. [Google Scholar] [CrossRef]
  50. Girons Lopez, M.; Wennerström, H.; Nordén, L.; Seibert, J. Location and density of rain gauges for the estimation of spatial varying precipitation. Geogr. Ann. Ser. A Phys. Geogr. 2015, 97, 167–179. [Google Scholar] [CrossRef] [Green Version]
  51. Zhang, X.; Liu, G.; Wang, H.; Li, X. Application of a Hybrid Interpolation Method Based on Support Vector Machine in the Precipitation Spatial Interpolation of Basins. Water 2017, 9, 760. [Google Scholar] [CrossRef] [Green Version]
  52. Garcia, M.; Peters-Lidard, C.D.; Goodrich, D.C. Spatial interpolation of precipitation in a dense gauge network for monsoon storm events in the southwestern United States. Water Resour. Res. 2008, 44, 2006WR005788. [Google Scholar] [CrossRef] [Green Version]
  53. Sreeparvathy, V.; Srinivas, V.V. A Bayesian Fuzzy Clustering Approach for Design of Precipitation Gauge Network Using Merged Remote Sensing and Ground-Based Precipitation Products. Water Resour. Res. 2022, 58, e2021WR030612. [Google Scholar] [CrossRef]
  54. Yumnam, K.; Kumar Guntu, R.; Rathinasamy, M.; Agarwal, A. Quantile-based Bayesian Model Averaging approach towards merging of precipitation products. J. Hydrol. 2022, 604, 127206. [Google Scholar] [CrossRef]
  55. Shen, Y.; Zhao, P.; Pan, Y.; Yu, J. A high spatiotemporal gauge-satellite merged precipitation analysis over China. J. Geophys. Res. Atmos. 2014, 119, 3063–3075. [Google Scholar] [CrossRef]
  56. Chen, S.; Xiong, L.; Ma, Q.; Kim, J.; Chen, J.; Xu, C. Improving daily spatial precipitation estimates by merging gauge observation with multiple satellite-based precipitation products based on the geographically weighted ridge regression method. J. Hydrol. 2020, 589, 125156. [Google Scholar] [CrossRef]
Figure 1. Location of the study area.
Water 14 01503 g001
Figure 2. Spatial distribution of mean daily precipitation estimated from two interpolation methods and three IMERG SPPs from 1 January 2008 to 31 December 2019.
Water 14 01503 g002
Figure 3. Box plot of the statistical metrics of daily precipitation estimated from two interpolation methods and three IMERG SPPs at the 43 weather stations in MRYRB (1 January 2008–31 December 2019).
Water 14 01503 g003
Figure 4. Taylor diagrams of the daily precipitation estimated from two interpolation methods and three IMERG SPPs in MRYRB from 1 January 2008 to 31 December 2019.
Water 14 01503 g004
Figure 5. Monthly precipitation in MRYRB and monthly variations of statistical metrics calculated by daily precipitation. The gray columns in the left axis demonstrate the monthly precipitation.
Water 14 01503 g005
Figure 6. Spatial distribution of CC (left), RB (middle), and CSI (right) of the daily precipitation estimated from two interpolation methods and three IMERG SPPs in MRYRB from 1 January 2008 to 31 December 2019.
Water 14 01503 g006
Figure 7. Variations in statistical metrics across increasing precipitation intensities: (a) Pearson correlation coefficient (CC), (b) relative bias (RB), (c) mean absolute error (MAE), and (d) root mean square error (RMSE). Columns in the right axis present the frequency of precipitation estimated from gauge stations, interpolation methods, and IMERG SPPs.
Water 14 01503 g007
Table 1. Brief information of the IMERG SPPs used in this study.
SPPsResolutionLatencyTime PeriodGauge-Based
Correction
IMERG-E0.1°, 0.5 h4 h1 January 2008 to 31 December 2019No
IMERG-L0.1°, 0.5 h14 h1 January 2008 to 31 December 2019No
IMERG-F0.1°, 0.5 h3.5 month1 January 2008 to 31 December 2019Yes
Table 2. List of the statistical metrics used in this study.
Statistic MetricsEquationsPerfect Value
Pearson correlation coefficient (CC) CC = i = 1 n ( G i G ¯ ) ( S i S ¯ ) i = 1 n ( G i G ¯ ) 2 i = 1 n ( S i S ¯ ) 2 1
Relative bias (RB) RB = i = 1 n ( S i G i ) i = 1 n G i × 100 % 0
Mean absolute error (MAE) MAE = 1 n i = 1 n | S i G i | 0
Root-mean-squared error (RMSE) RMSE = i = 1 n ( S i G i ) 2 n 0
Probability of detection (POD) POD = H H + M 1
False alarm ratio (FAR) FAR = F H + M 0
Critical success index (CSI) CSI = H H + M + F 1
Notation: n , sample size; G i , gauge-based precipitation; G ¯ , mean value of the gauge-based precipitation; S i , satellite-based precipitation; S ¯ , mean value of satellite-based precipitation; H , the number of precipitation events correctly detected; M , the number of precipitation events that satellites failed to detect; F , the number of false detections.
Publisher’s Note: MDPI stays neutral with regard to jurisdictional claims in published maps and institutional affiliations.

