
Application of Cosmic-Ray Neutron Sensor Method to Calculate Field Water Use Efficiency
by
Xiuhua Chen
1,2, 
Wenlong Song
1,2,*,
Yangjun Shi
3,
Weidong Liu
4,
Yizhu Lu
1,2,*,
Zhiguo Pang
1,2 and
Xiao Chen
3 1
Sate Key Laboratory of Simulation and Regulation of Water Cycle in River Basin, China Institute of Water Resources and Hydropower Research, Beijing 100038, China
2
Research Center on Flood & Drought Disaster Reduction of the Ministry of Water Resources, Beijing 100038, China
3
Weinan Donglei Phase II Yellow River Engineering Administration, Weinan 714000, China
4
Weinan Donglei Yellowing Project Management Center, Weinan 715300, China
*
Authors to whom correspondence should be addressed.
Water 2022, 14(9), 1518; https://0-doi-org.brum.beds.ac.uk/10.3390/w14091518
Submission received: 31 March 2022
/
Revised: 1 May 2022
/
Accepted: 6 May 2022
/
Published: 9 May 2022
(This article belongs to the Special Issue High-Resolution Monitoring and Modelling for Water Resources Management: New Sensors, New Approaches and Applications)
Abstract
:Field water use efficiency is an important parameter for evaluating the quality of field irrigation in irrigated areas, which directly affects the country’s food security and water resource allocation. However, most current studies use point-scale soil moisture (SM) or remote sensing water balance models to calculate the field water use coefficient, which cannot avoid errors caused by the spatial heterogeneity of SM and insufficient spatial resolution of remote sensing data. Therefore, in this study, the cosmic-ray neutron sensor (CRNS), Time-Domain Reflectometers (TDR) and Automatic Weather Stations (AWS) were used to monitor the meteorological and hydrological data such as SM, atmospheric pressure, and precipitation in the experimental area of Jinghuiqu Irrigation District for three consecutive years. The scale of the CRNS SM lies between the point and the remote sensing. Based on the CRNS SM, the calculation method for canal head and tail water was used to calculate the field water use efficiency to evaluate the level of agricultural irrigation water use in the experimental irrigation area. The results showed that CRNS could accurately detect the change in SM, and four irrigation events were monitored during the winter wheat growth period from October 2018 to June 2019; the calculation result of field water use efficiency in the experimental area was 0.77. According to the field water use efficiency of the same irrigation area from October 2013 to October 2015 in other studies, the field water use efficiency during the growing period of winter wheat in this area increased from 0.503 to 0.770 in 2013–2019, indicating a significant improvement in the field water use level. In general, this study not only solves the problem of low calculation accuracy of field water use efficiency caused by the mismatch of SM monitoring scales but also explores the application potential of CRNS in agricultural irrigation management and water resource allocation.
1. Introduction
Approximately 70% of the fresh water in the world is used for agricultural irrigation [1]. To save water resources and improve water use efficiency, it is necessary to reduce the water demand for crop production while ensuring crop yield [2,3,4,5]. Therefore, high-efficiency water-saving irrigation has been widely proposed and promoted. Many studies have used sprinkler irrigation, drip irrigation, and micro-sprinkler technology to achieve agricultural precision irrigation, saving agricultural water while increasing crop yields [6,7]. The Guanzhong Plain is one of the nine major grain-producing areas in China. As grain is a major product and heavy water user, it is necessary to pay attention to its field water use efficiency and yield [8].
Irrigation water use efficiency is an important index for measuring agricultural water use efficiency, which includes canal water use efficiency and field water use efficiency [9]. Currently, much research on canal water use efficiency has been developed, and it has mostly focused on the improvements of canal water use efficiency and how to transform the canal to increase the irrigation water use efficiency. However, field water use efficiency has not been thoroughly studied. The field water consumption coefficient reflects the amount of water used in a field. This is a useful indicator for assessing the quality of field engineering and irrigation technologies. Field water use efficiency in irrigated areas is an important component of the effective use efficiency of irrigation water. It is not only directly related to the amount of agricultural water consumption and the allocation of water resources in irrigated areas but also has important practical implications for the planning and design of water conservancy projects and the allocation of water resources in irrigated areas [10].
The field water use efficiency is the percentage of water that can be used in the field and the water released from the final fixed channel, that is, the ratio of the net irrigation water consumption to the water released from the final fixed channel. The most regular approach for calculating field water use efficiency is the calculation method for canal head and tail water [11,12], which relies on the measurement of net irrigation water consumption in the field. The commonly used calculation methods for net irrigation water use in the field include the direct calculation, field experiment, and crop water demand methods [13]. The direct calculation method is simple and convenient for calculating the net irrigation water volume in the irrigation area according to the irrigation quota in the system of crops in the area. However, it is prone to errors when determining the quota, which affects the calculation results [14]. The crop water requirement method is based on the water balance principle. The water required for crop evaporation comes from the actual use of irrigation water, effective use of precipitation, and recharge of groundwater. From this perspective, the net irrigation water use in crop fields can be expressed as crop evaporation minus the effective precipitation and groundwater recharge. The crop evaporation method calculates the net irrigation water consumption in the field using a combination of point and surface data, remote sensing technology, and statistical data. The computation findings are incorrect, even though remote sensing technology has a broad detection range and is less confined by the ground [15,16,17,18]. The net irrigation water volume in the field was calculated using the field test method by measuring the change in the field water volume before and after irrigation in typical fields. This method has a high level of accuracy and is a good method for determining field water use efficiency. However, the accuracy of farm soil moisture (SM) monitoring before and after irrigation must be ensured. [19,20,21].
Traditional SM monitoring methods are based on point-scale measurement methods, including the drying weighing method, neutron moisture meter method, and time-domain reflectometry method [22,23]. Although the traditional approach has a high monitoring accuracy, it has drawbacks such as a long time requirement and the inability to accomplish high-precision large-scale monitoring [24], which makes it unsuitable for farmland-scale SM monitoring. Remote sensing technology has been widely employed to retrieve SM because of its wide detection range, but it has never been able to overcome the technical challenges of measuring depths of less than 20 cm and low resolution [25,26]. The cosmic-ray neutron method is a new soil water monitoring tool that has emerged in recent years [27,28], and it is one of the few technologies that can directly measure the average SM of an area. The cosmic-ray neutron method calculates SM based on the inverse relationship between the intensity of moderated neutrons near the ground and SM content. Cosmic-ray primary particles and atmospheric particles continue to collide as they enter the Earth’s atmosphere, causing cascade reactions that dissipate energy into high-energy particles, which then enter the nucleus through a series of frictional collisions in the atmosphere, producing fast neutrons. When fast neutrons meet with nucleons on the surface or in the atmosphere, they progressively slow down [29]. The moderation effect of hydrogen atoms is the most important among all the elements in the soil that can slow down fast neutrons, and hydrogen atoms are mostly found in SM in the near-surface layer; therefore, SM can be analyzed as long as the intensity of fast neutrons near the ground is passively measured. This technology enables regional-scale monitoring and bridges the gap between point measurements and remote sensing monitoring. In addition, it has other advantages such as high monitoring frequency, automated measurement, nondestructive monitoring, and high accuracy [30,31,32,33].
The cosmic-ray neutron sensor (CRNS) can continuously monitor SM in a noncontact and nondestructive manner and has been applied to different ecosystems, such as forests [34], farmland [35], and grasslands [36]. With the deepening of research, CRNS has been widely used in agricultural management [37], hydrological research [38], vegetation biomass change assessment [39,40], and snow depth measurement [41] in recent years. At present, CRNS technology has been well-applied in different regions of the world, including the United States [27], the United Kingdom [42], Germany [43], and Australia [44], and more than 200 CRNS power stations have been installed [40]. The CRNS has also been successfully applied in different climatic zones, such as humid [45], semi-arid [33], arid, and extremely arid [46] regions. These studies laid the foundation for the application of the CRNS to evaluate the utilization rate of agricultural irrigation.
To obtain the field water use efficiency accurately and in a timely manner, the SM of farmland before and after irrigation was determined based on the cosmic-ray neutron method, and the field water use efficiency was calculated during the growth period of winter wheat by calculating the canal head and tail water. Combining the cosmic-ray neutron method with the calculation method for the canal head and tail water solves the problem of the low calculation accuracy of field water use efficiency caused by the mismatch of SM monitoring scales.
2. Study Site and Experimental Design
2.1. Study Site
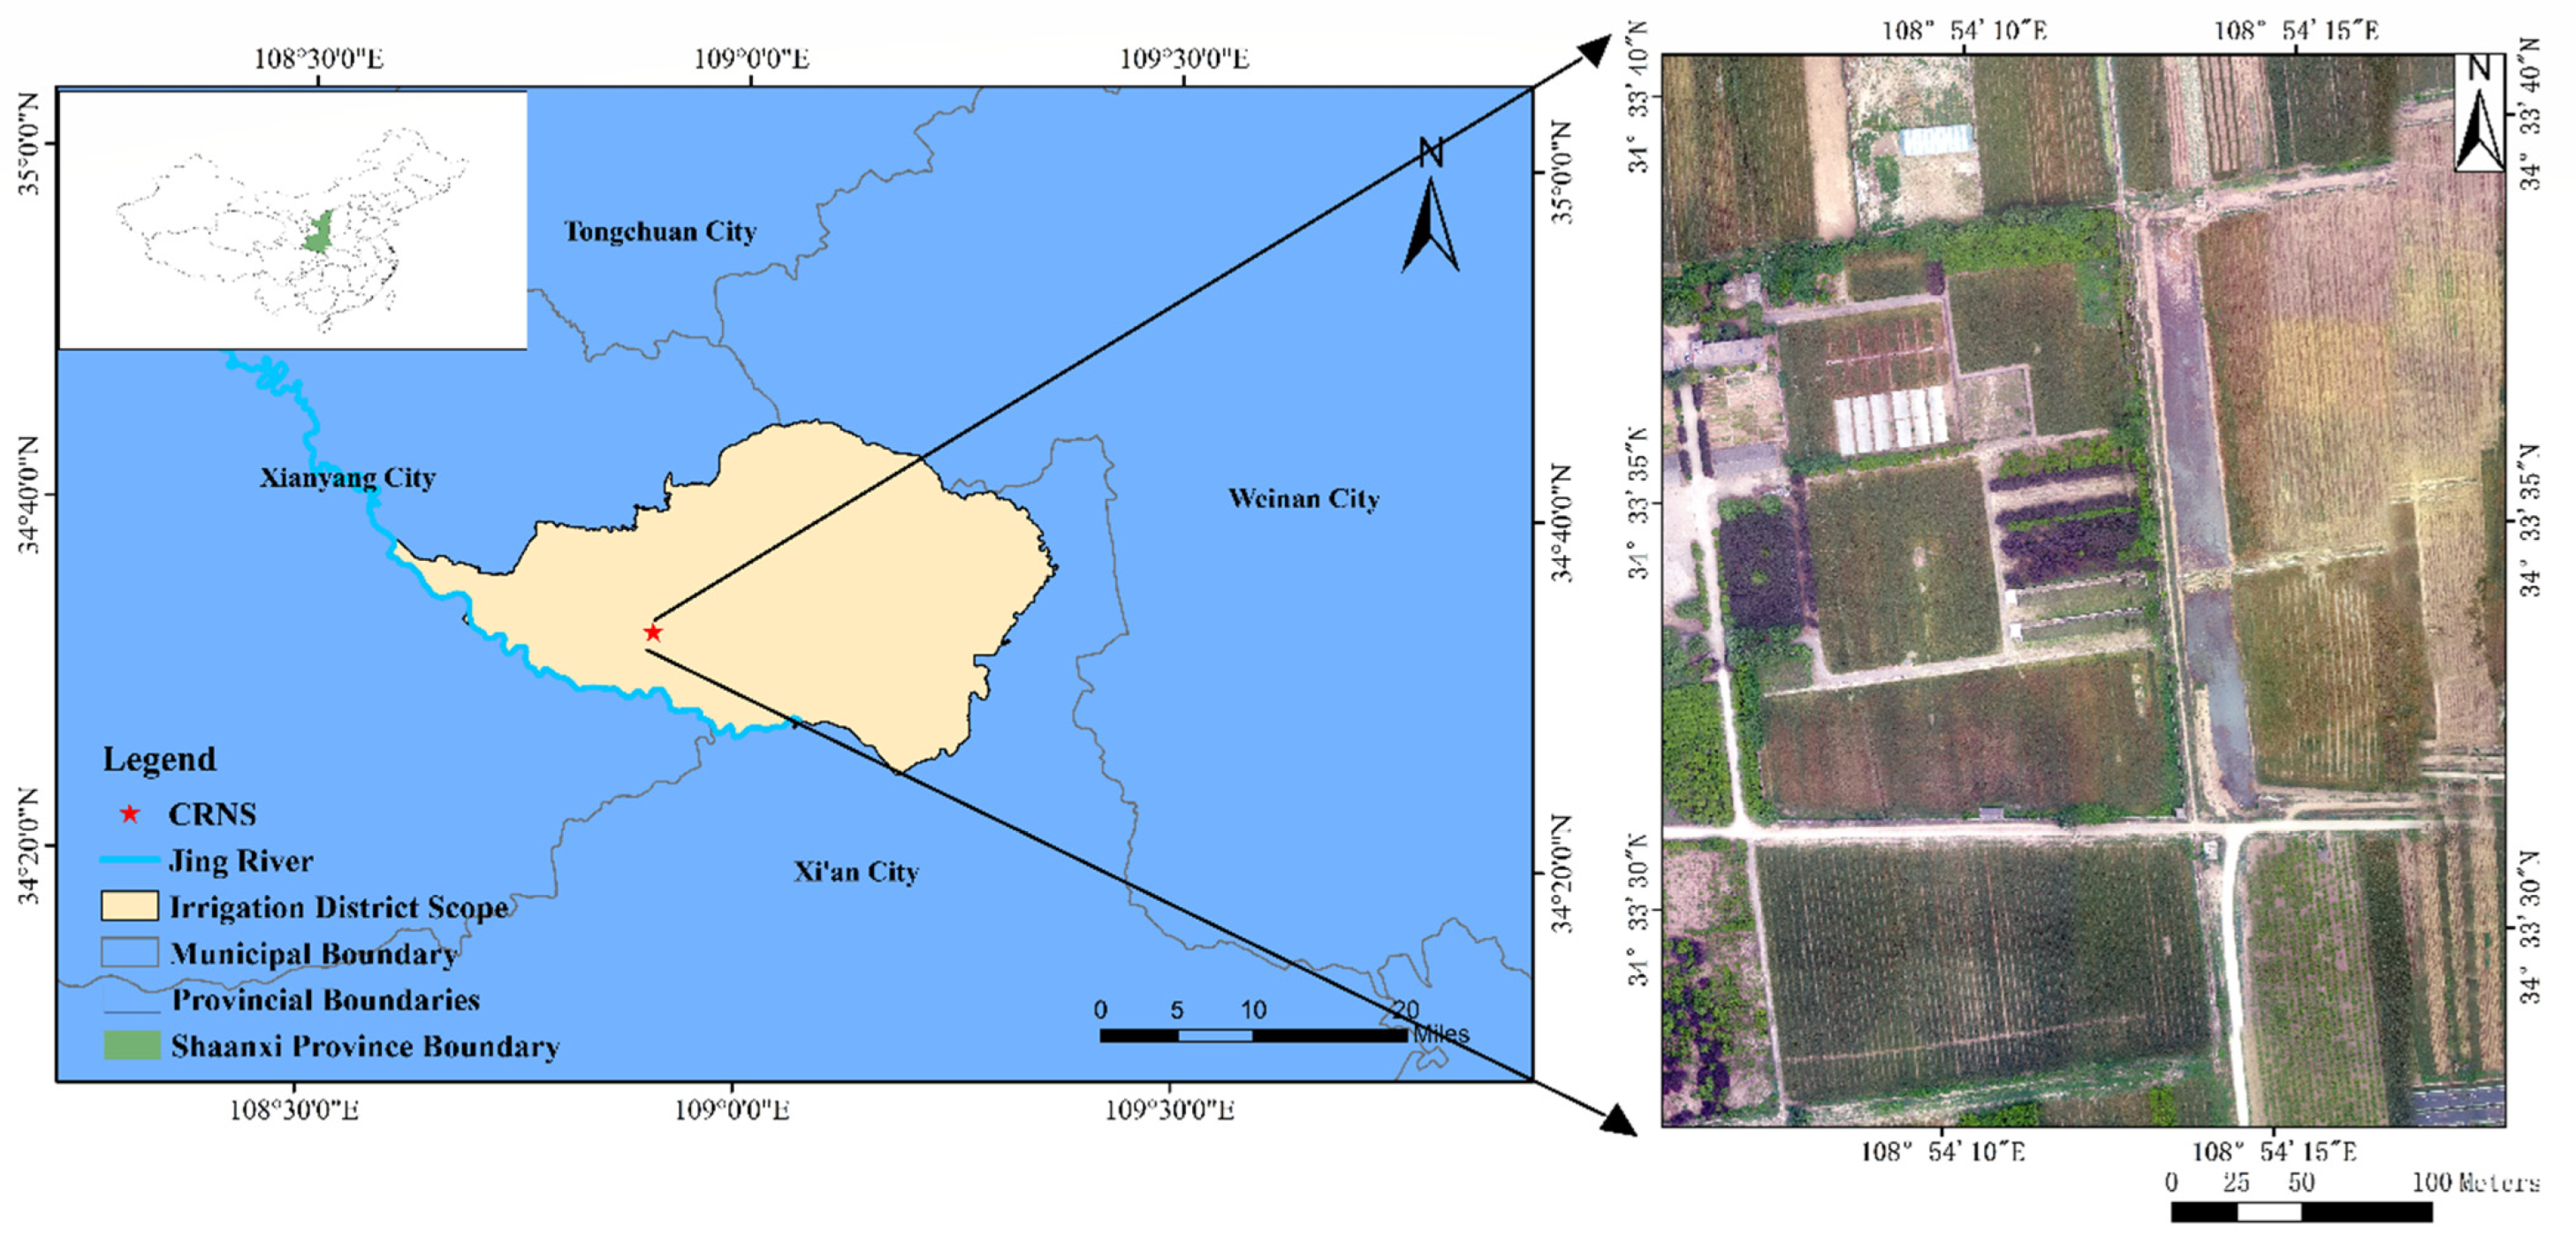
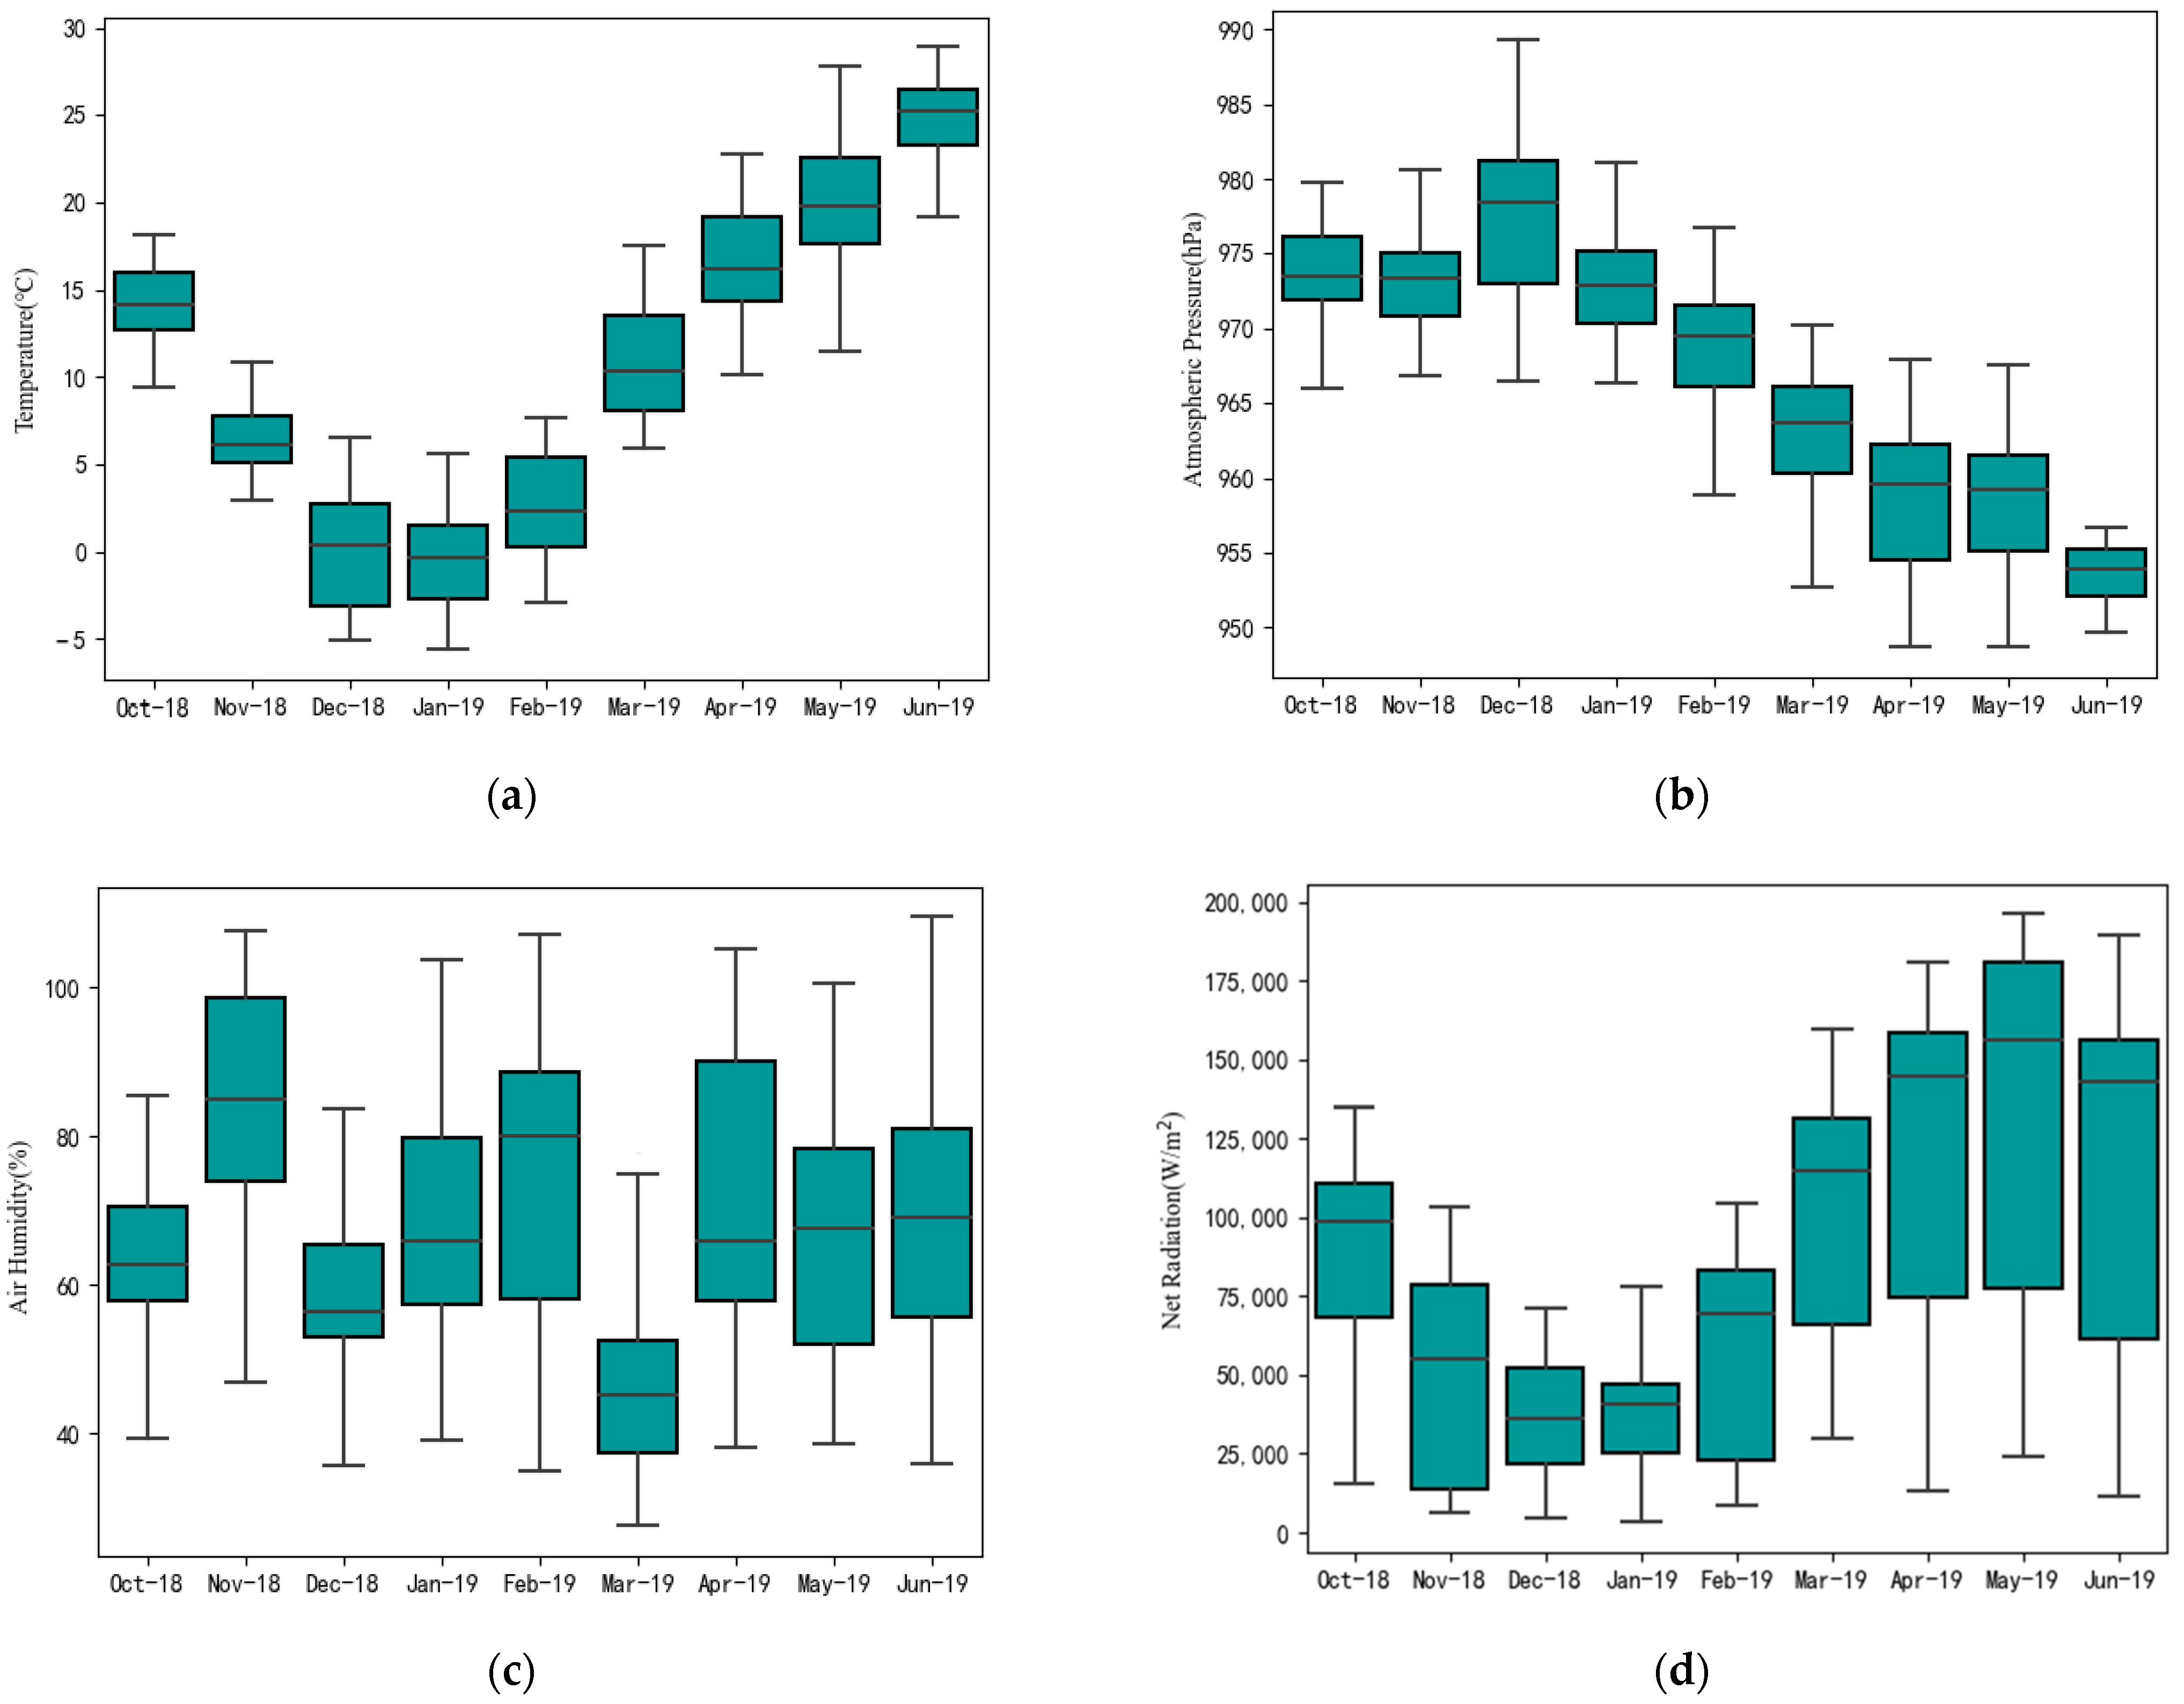
From May 2017 to March 2020, the monitoring and acquisition of experimental data were carried out at the Jinghuiqu Irrigation District Experimental Station (108°54′ E, 34°33′ N), Sanqu Town, Jingyang County, Xianyang City, Shaanxi Province, China. The Jinghuiqu Irrigation District is located in the middle of Guanzhong Plain, Shaanxi Province. As one of the nine major grain-producing areas in the country, it has a semi-arid monsoon climate and belongs to the continental semi-arid climate zone. There is an irrigation area of 1180 km2. As a result of several water-saving renovations, the area of the irrigation area facilities was 96,800 hectares, and the effective irrigation area was 87,900 hectares. Irrigation water is mainly diverted from the Jing River, and double irrigation is implemented by wells and canals. A schematic of the irrigation area is shown in Figure 1. In the irrigated area, the average annual rainfall is 565.4 mm, the average annual evaporation is 1178.3 mm, and the average annual temperature is 13.4 °C. The lowest temperature in January is −20.1 °C, while the highest temperature in August is 42.0 °C. Figure 2 shows the dynamic changes in meteorological data from October 2018 to June 2019, including the temperature, atmospheric pressure, net radiation, and air humidity.
Summer corn and winter wheat were the principal crops grown at the experimental station. The soil is primarily medium loam, with a bulk density of 1.43 g/cm3, porosity of 46%, infiltration coefficient of approximately 150 mm/hm2, and maximum field water retention capacity (moisture content) of 24.4%.
2.2. Experimental Design
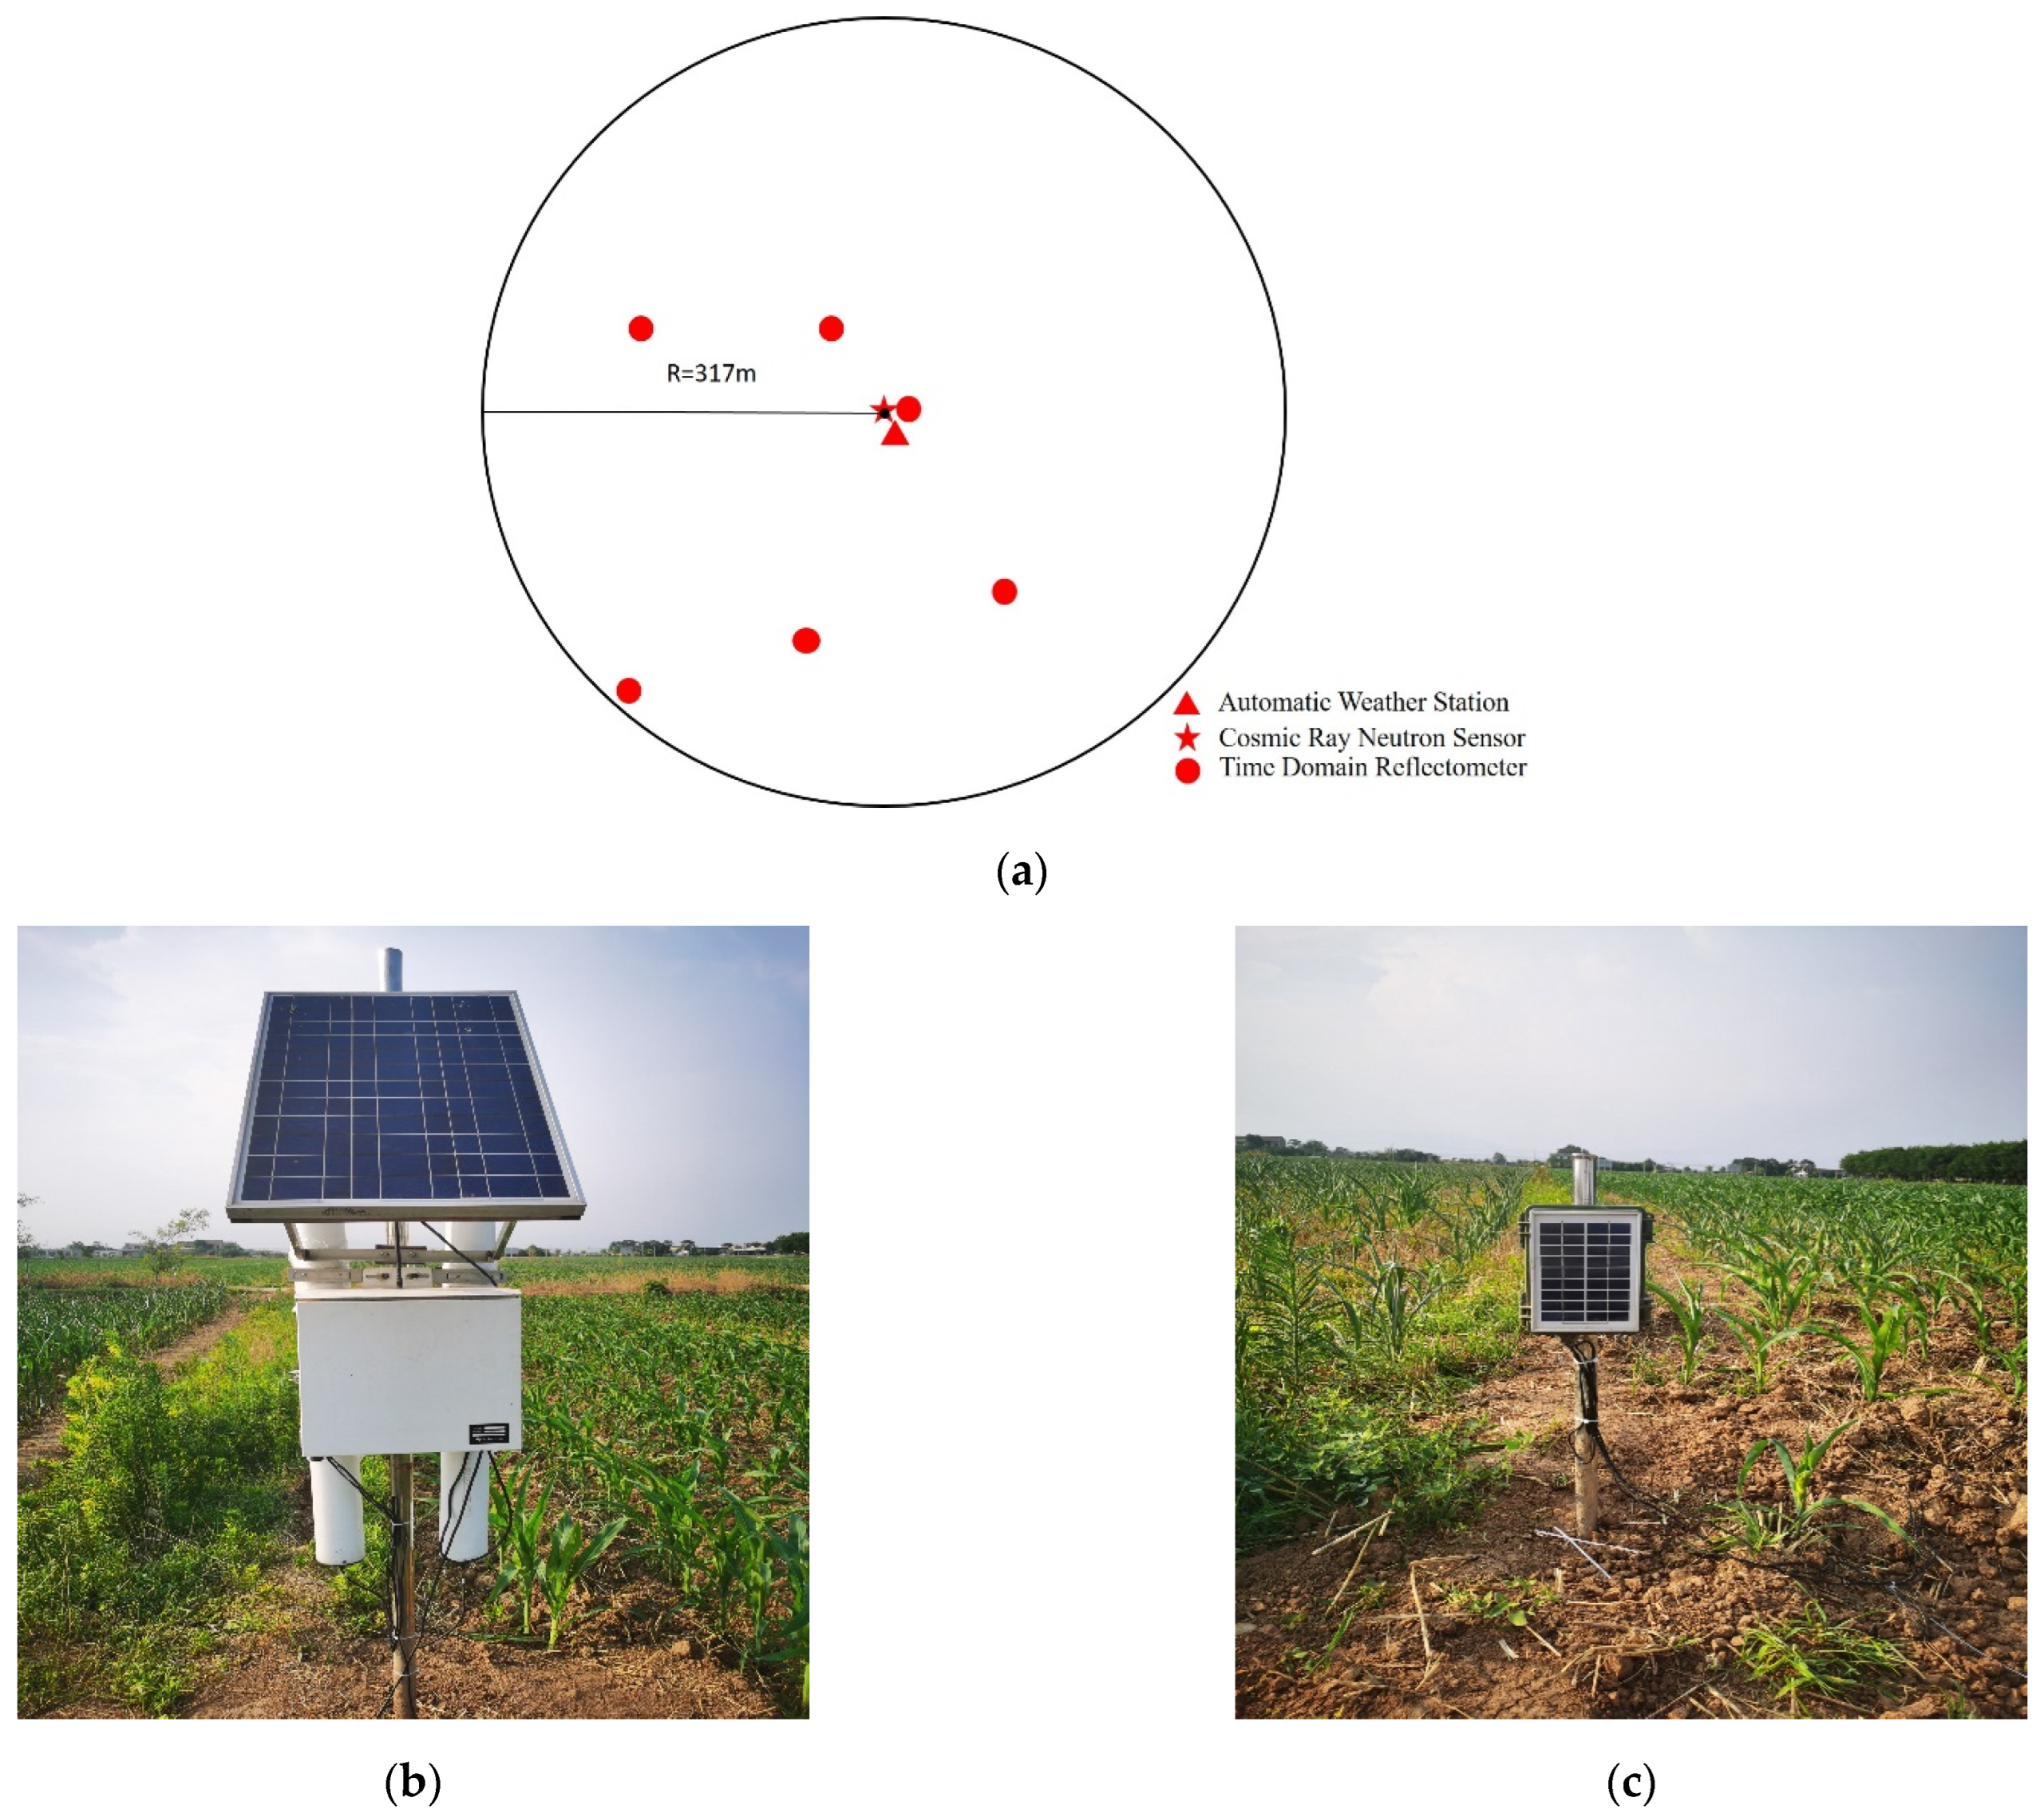
After considering crop types, irrigation methods, border field specifications, land level, soil type, and groundwater depth, a CRNS was placed in the plot (34 33′33.885″ N, 108 54′ 09.935″ E). An automatic weather station (AWS) was set up near the CRNS to collect meteorological data, such as atmospheric pressure, wind speed, wind direction, rainfall, net radiation, and soil heat flux. Furthermore, six time-domain reflectometers (TDR) were placed within the effective measurement radius of the cosmic-ray neutron sensor to obtain point-scale SM content. The measurement depths in the soil layer were 10, 20, and 40 cm. The locations of the instruments are shown in Figure 3. The collection frequency of CRNS and TDR is hourly, and the AWS records meteorological data every minute. The effective detection range of the CRNS in the horizontal and vertical directions is related to air pressure and SM, respectively [27,28,47]. In this study, using the measured air pressure, soil bulk, density, and other data in the experimental area, the effective measurement radius of the cosmic-ray neutron sensor erected in the experimental plot was 317 m, and the vertical detection depth was 27 cm. The average SM content of this cylindrical area was determined by the cosmic-ray neutron method. According to the local phenological data, the growth period of winter wheat was divided as shown in Table 1.
Winter wheat was planted in the experimental field. As the CRNS was in the commissioning period from May 2017 to mid-November 2018, the research period was selected from October 2018 to June 2019. Winter wheat was sown on 19 October 2018, and harvested on 9 June 2019. The irrigation method is channel irrigation, and the channel is anti-seepage, which is a means of high-efficiency water-saving irrigation. The irrigation time was uniformly arranged according to the irrigated area and the growth conditions of the crops. For example, when the seedling emergence rate was low, irrigation was arranged. In general, irrigation is performed during the greening and jointing stages of wheat. According to the official website of the irrigation area, from October 2018 to June 2019, the irrigation times of the fields in Jinghuiqu Irrigation District ranged from 1 to 4 times. The irrigation schedules are listed in Table 2. The quota of irrigation water per unit area adopts the value stipulated in the “Quota of Agricultural Irrigation Water: Wheat” formulated by the Ministry of Water Resources of the People’s Republic of China in 2020, which is 242 m3/mu.
3. Methods
3.1. Cosmic-Ray Neutron Method
The CRNS performance is influenced by a combination of climate, hydrology, soil, topography, and land use [48]. For example, further corrections are required when measuring relatively wet shallow surfaces [29] and areas with fragmented landscapes [33]. In this study, the air pressure, atmospheric water vapor, and neutron intensity were corrected primarily to increase the measurement accuracy of the neutron numbers.
3.1.1. Correction for the Number of Neutrons
- Correction for Air Pressure
- Correction for Atmospheric Water Vapor
The number of fast neutrons after the pressure correction and atmospheric water vapor correction can be calculated using Equation (3):
where is the corrected fast neutron number, and is the original fast neutron number, that is, the fast neutron number measured by the sensor.
- Correction for Incident Neutron Intensity
3.1.2. SM Calibration
When converting fast neutron numbers to volumetric water content, a functional relationship based on the Monte Carlo N-Particle extended Transport Code (MCNPX) [49] was used.
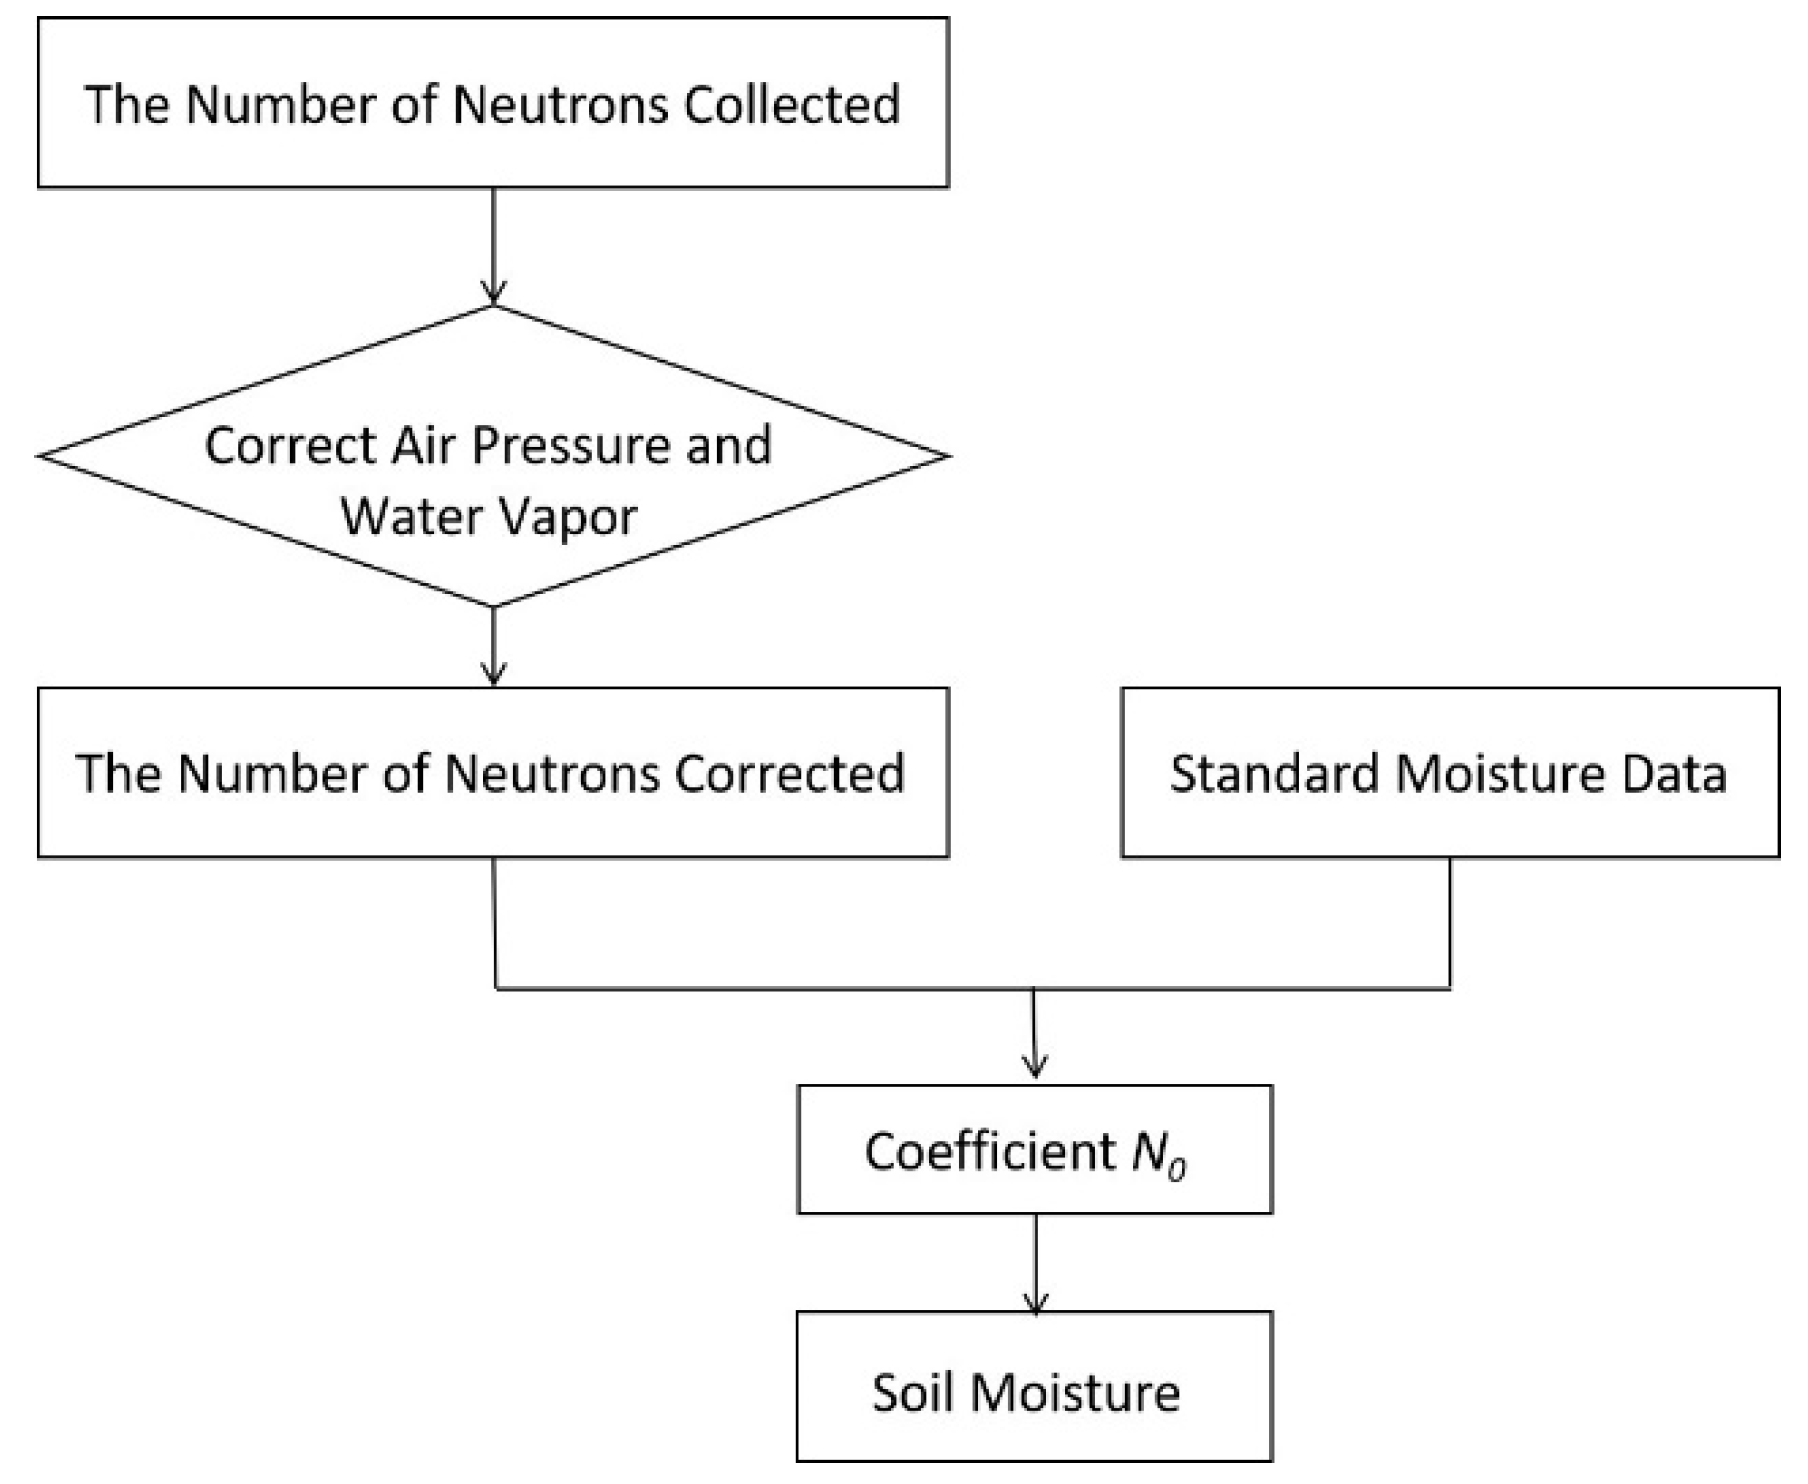
where θ(N) is the mass water content of the soil (kg/kg); , , and are the coefficients (under the condition that the SM is greater than 0.02 kg/kg (generally all soils are satisfied), = 0.0808, = 0.372, = 0.115); is the number of fast neutrons in the same source area and the soil does not contain water. In this study, the corrected average value of the number of fast neutrons and the SM obtained by the drying method during the test period were introduced into Equation (5) to calculate . Figure 4 shows the main process of calculating SM using the cosmic-ray neutron method.
The data were recorded by the CRNS, TDR, and AWS and converted into daily values. The majority of the processing work involves the daily value TDR data as the arithmetic mean of the SM content at 20 cm measured by six sets of TDR. The SM content obtained by the cosmic-ray monitoring is the volume water content, which is transformed into the daily average mass water content. This information will be utilized in subsequent calculations.
3.2. Calculation Method for Canal Head and Tail Water
In this study, the calculation method for canal head and tail water was used to calculate the field water use efficiency during the winter wheat growing period in the experimental plot from 2018 to 2019. The method for calculating canal head and tail water requires measuring and counting the net irrigation water volume and gross irrigation water volume in the irrigation area for a specific period of irrigation. The ratio of the two is calculated to obtain the effective use efficiency of irrigation water in the irrigation area for that period. The primary objective of this method is to calculate gross and net irrigation water consumption.
The amount of water released from the final fixed channel, that is, the amount of water entering the field, excluding the amount of water lost during conveyance, is referred to as the gross irrigation water consumption.
Net irrigation water consumption refers to the amount of water irrigated in the field that can be used by the crops. The SM content in the planned wet layer of the soil in the field before and after each irrigation of wheat was determined using the CRNS observation data, and then the net water consumption per unit area per irrigation was computed using Equation (6):
where is the net amount of water absorbed and utilized by crops per mu of a typical field, m3/mu; is the estimated soil wetting depth during irrigation, m; is the soil dry bulk density of a typical field, g/cm3; is the bulk density of water; is the expected SM content in the moist soil layer of a typical field before certain irrigation (%); and is the expected SM content in the moist soil layer of a typical field after certain irrigation (%).
The field water use efficiency was calculated using the following formula from the calculation method for canal head and tail water:
where is the field water use efficiency in a certain period, is the net water consumption of irrigation in a certain period, and is the gross irrigation water amount of irrigation in a certain period, m3.
4. Results and Discussion
4.1. Response of CRNS Data to Moisture Changes
Figure 5 shows the CRNS SM data, SM data measured by TDR, and precipitation data from October 2018 to June 2019. The soil water content data at 10, 20, and 40 cm measured by six TDRs were arithmetically averaged as the average soil water content of the experimental field measured by TDR and compared with the soil water content measured by CRNS. It can be seen in Figure 5 that the changing trend of SM measured by the two methods was the same, and CRNS was more sensitive to changes in SM content. The TDR data indicated only four sudden increases in SM content during the experiment, whereas the CRNS data recorded many (including changes represented by the TDR data) sudden increases in SM content, and the timing was extremely compatible with the precipitation event. Furthermore, the CRNS SM represents the average level within the valid range [50]. On the one hand, when the CRNS data is also used to continuously monitor SM content during the crop growth period over a long period, an irrigation plan can be developed before the crops display the “signal” of a water shortage, which is critical for agricultural production and food security. However, when combined with precipitation data, the irrigation duration of farms and the SM content before and after irrigation may be more precisely determined. This can provide a solid foundation for agricultural water usage planning and irrigation scheduling.
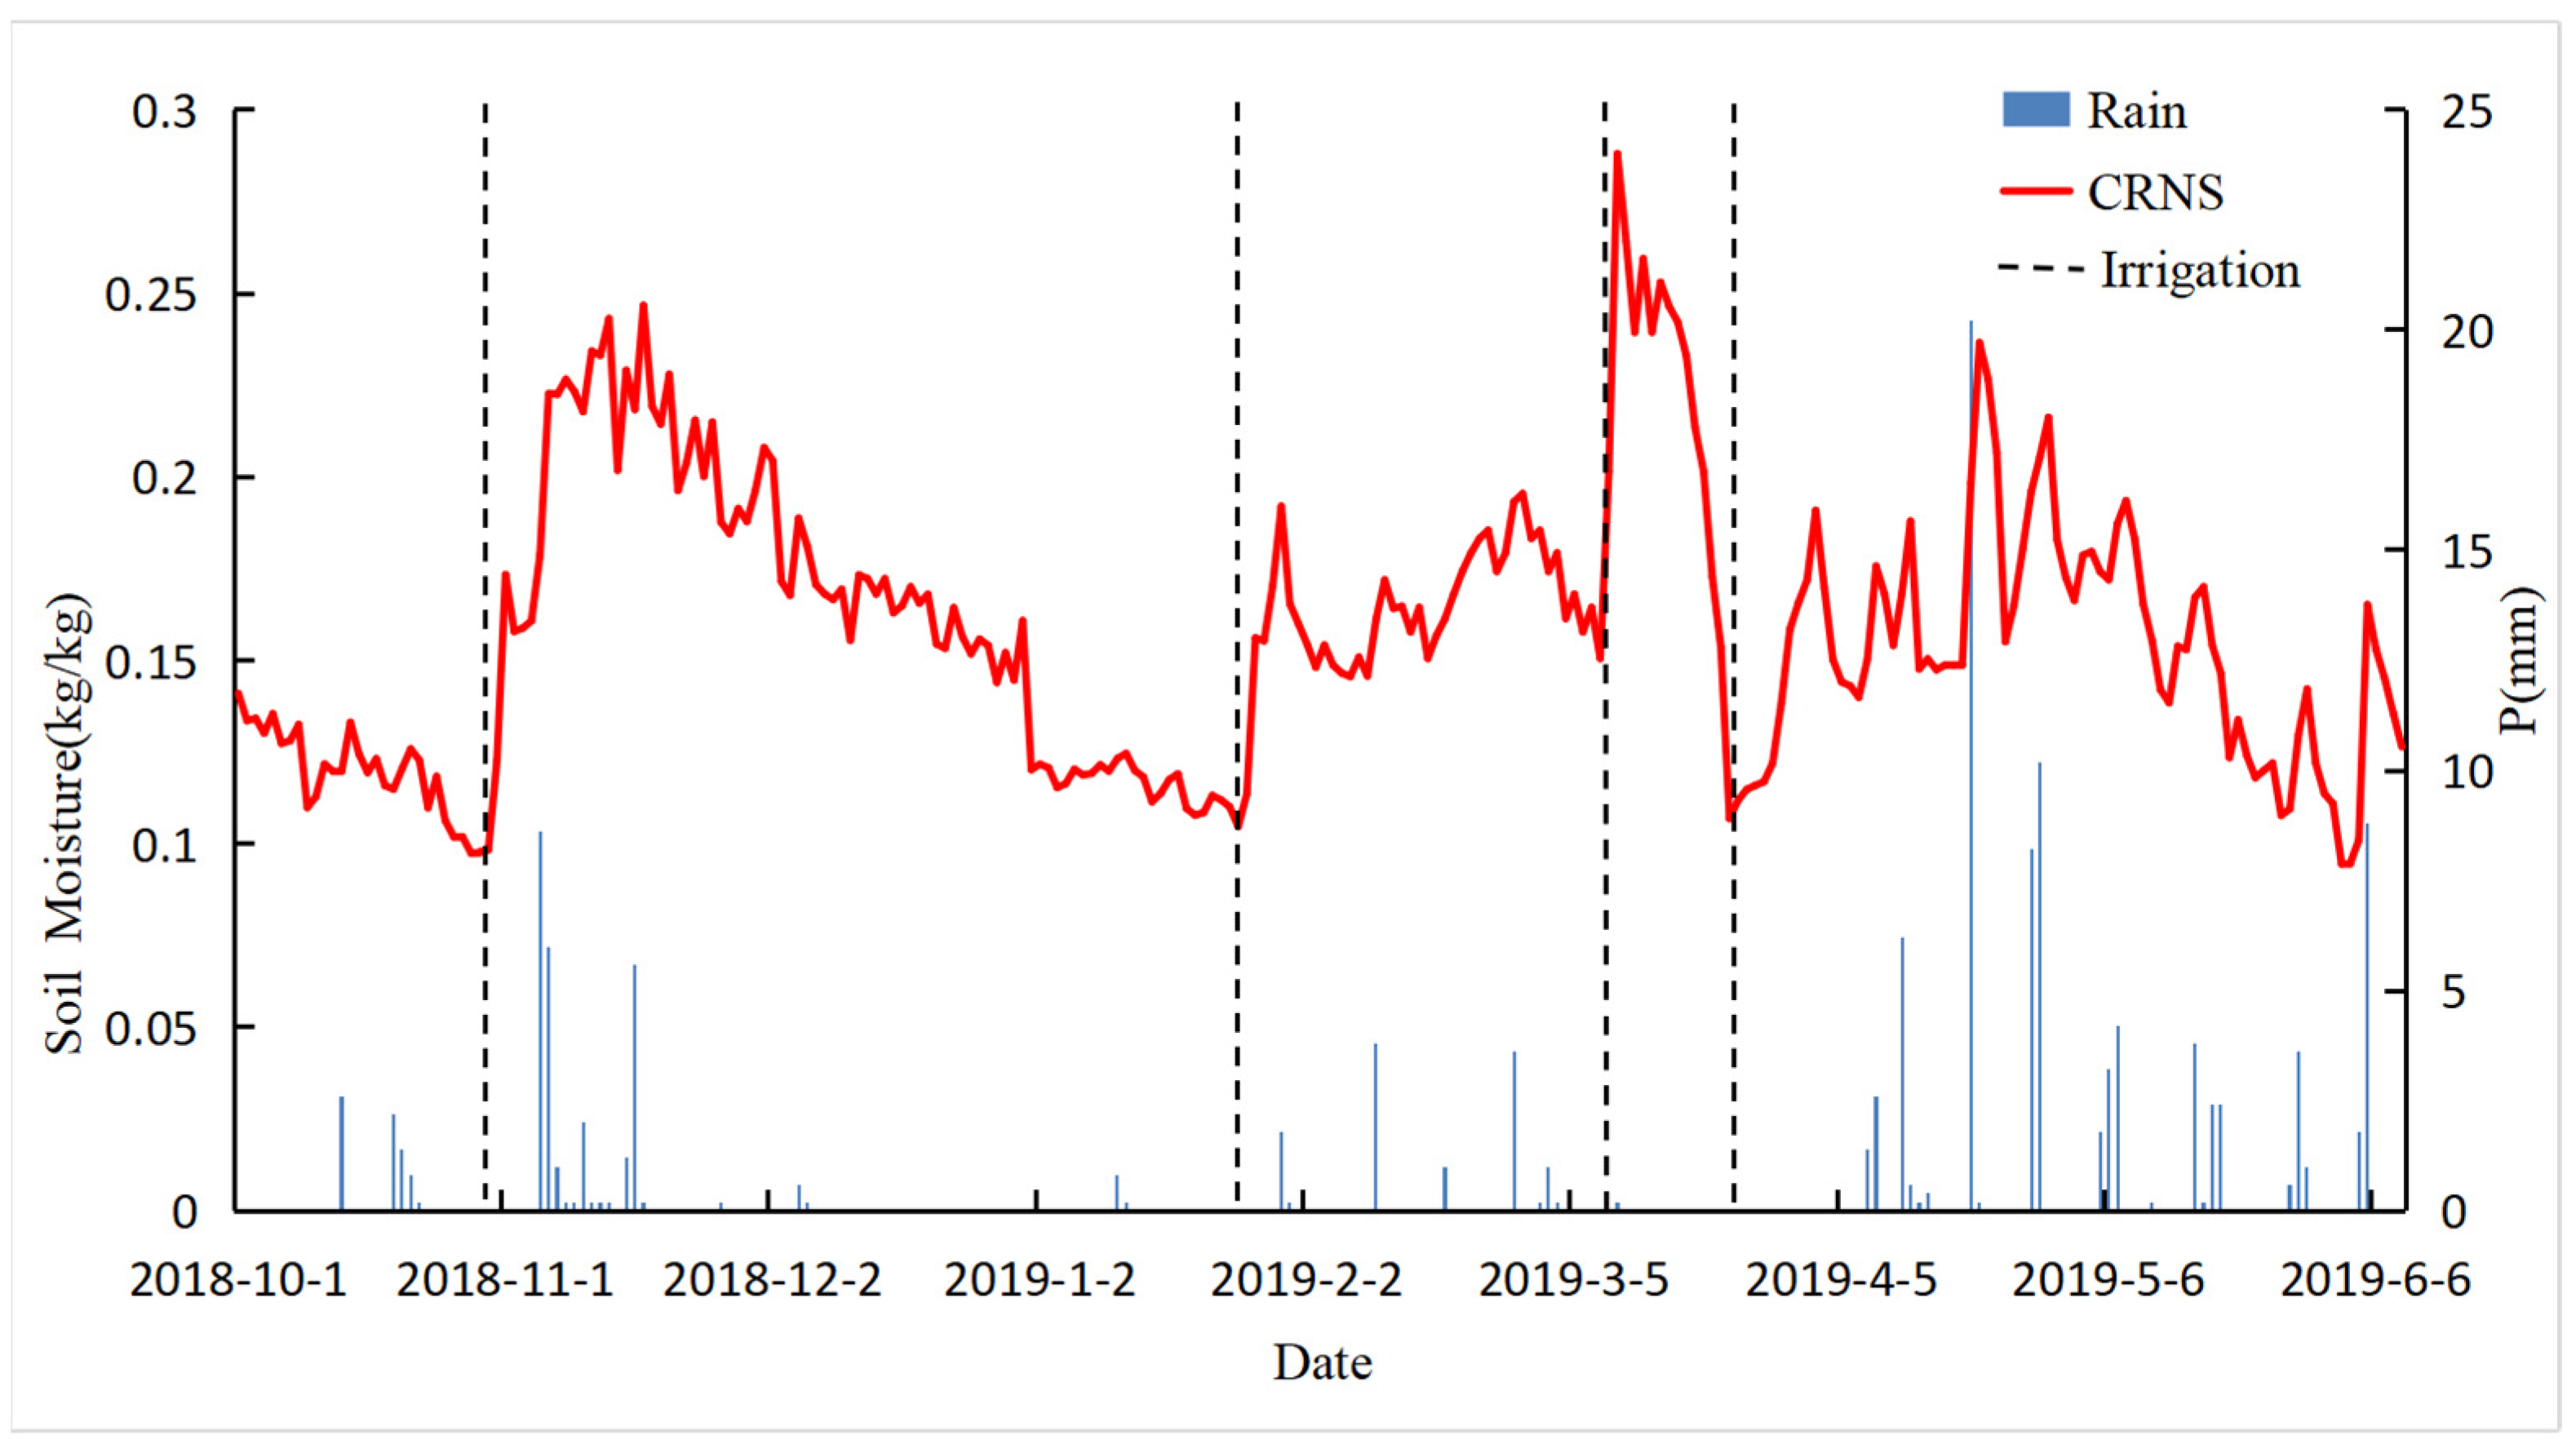
4.2. Irrigation Event Identification
Figure 6 shows the CRNS SM and precipitation data from October 2018 to June 2019. In the experimental plots, both precipitation and irrigation increased SM content. The CRNS can respond instantaneously to changes in SM content, as shown in Figure 6. Irrigation caused an increase in SM content in the absence of precipitation [51]. Consequently, by integrating the CRNS and precipitation data, the irrigation timing may be determined. From October 2018 to June 2019, four irrigation events were identified: 30 October 2018; 25 January 2019; 8 March 2019; and 23 March 2019. The irrigation time acquired from the CRNS monitoring findings was similar to the actual irrigation time in the irrigation area and the water demand stage of winter wheat growth, both of which were accurate. The CRNS recognized the irrigation period, and the change in SM content in the experimental farmland before and after irrigation was correctly monitored, which was used as the basis for the calculation method for canal head and tail water estimates of irrigation water consumption.
4.3. On-Farm Water Efficiency
Table 3 shows the change in SM after irrigation during the experiment as well as the calculated net irrigation water consumption per unit area and field water use efficiency. Among the four irrigation events using the CRNS, the third irrigation event had rather high intensity, and the SM increased from 15.06 to 28.81%. The fourth irrigation event lasted longer, lasting for 9 days, and the SM increased from 10.69 to 19.59%. The field water use efficiency calculated from the net irrigation water consumption per unit area of the four irrigations was 0.77, indicating that the agricultural water input into the experimental plot throughout the winter wheat growth period of 2018–2019 was successful. Wang Yiteng [52] conducted field experiments on crop water demand and field water use coefficient at the same experimental station from October 2013–October 2015 and obtained the results of field water use efficiency from 2013 to 2015. It is used to help verify the calculation results of field water use efficiency in this study. As the irrigation technology in Jinghuiqu Irrigation District is constantly improving, and the canals are being renovated every year, we believe that if the calculation results of this study are greater than or equal to the experimental results of Wang Yiteng, the exploration in this study is reasonable and effective. The results showed that the field water use efficiency during the growing period of winter wheat was between 0.507 and 0.663 under various irrigation regimes with different border lengths (excessive border length would increase the amount of irrigation water and irrigation time). It can be seen that from 2013 to 2019, the degree of field water utilization in Jinghuiqu Irrigation District significantly improved. The wheat yield at the experimental station in 2019 reached 552.71 kg/m2, while the average yield from 2013 to 2016 was 497.31 kg/m2. Yields have also increased, while water use efficiency has increased in the field. The results of the field water use efficiency derived from the SM measured using the cosmic-ray neutron technique are quite reliable. The adoption of the cosmic-ray neutron approach solves the problem of poor field water usage efficiency calculation accuracy caused by a mismatch in the soil water monitoring scale.
5. Conclusions
To solve the problem of low calculation accuracy of field water use efficiency caused by the mismatch of SM monitoring scales, this study proposes the application of CRNS, a regional-scale SM monitoring method, to calculate field water use efficiency. The CRNS is suitable for arid and semi-arid regions and can accurately monitor regional-scale changes in average SM, identifying irrigation time and SM changes before and after irrigation. This means that the selected method is suitable for evaluating the level of field water use in irrigated areas. Based on the CRNS SM, the field water use efficiency is representative of the regional scale. This research applied CRNS SM to identify the date and SM changes of the four irrigations of winter wheat in the experimental field from October 2018–June 2019, and the calculated result of field water use efficiency was 0.77. These results corroborate with the irrigation schedule information released by the irrigation district, the results of field water use efficiency in previous years, and the trend of yield decoration, proving the feasibility of the application method. The CRNS will play a greater role in the future determining irrigation area, agricultural water use, and irrigation management.
Author Contributions
X.C. (Xiuhua Chen) and W.S. designed the experiments; X.C. (Xiuhua Chen), W.S., Y.L., Y.S., W.L. and X.C. (Xiao Chen) performed the experiments; X.C. (Xiuhua Chen) and Y.L. processed the CRNS data; Z.P. participated in the data analysis; X.C. (Xiuhua Chen), W.S. and Y.L. wrote the paper. All authors have read and agreed to the published version of the manuscript.
Funding
This work was supported by the National Key Point Research and Invention Program of the Thirteenth Five Year Plan (2017YFA0605000), the Natural Science Foundation of China (42142029, 51609259), and the Jiangsu Water Conservancy Science and Technology Project (20211081).
Institutional Review Board Statement
Not applicable.
Informed Consent Statement
Not applicable.
Data Availability Statement
The data presented in this study are available on request from the first author.
Acknowledgments
We would like to thank the Weinan Donglei Phase II Yellow River Engineering Administration, Weinan Donglei Yellowing Project Management Center, and Shaanxi Jinghui Canal Irrigation Administration for providing the research field and field working conditions.
Conflicts of Interest
The authors declare no conflict of interest.
Abbreviations
| CRNS | Cosmic-Ray Neutron Sensor |
| SM | Soil Moisture |
| TDR | Time-Domain Reflector |
| AWS | Autonomous Weather Station |
References
- Rehana, S.; Mujumdar, P.P. Regional impacts of climate change on irrigation water demands. Hydrol. Process. 2013, 27, 2918–2933. [Google Scholar] [CrossRef]
- Waqas, M.S.; Cheema, M.J.M.; Hussain, S.; Ullah, M.K.; Iqbal, M.M. Delayed irrigation: An approach to enhance crop water productivity and to investigate its effects on potato yield and growth parameters. Agric. Water Manag. 2021, 245, 106576. [Google Scholar] [CrossRef]
- Wallace, J.S. Increasing agricultural water use efficiency to meet future food production. Agric. Ecosyst. Environ. 2000, 82, 105–119. [Google Scholar] [CrossRef]
- Yang, C.; Huang, G.; Chai, Q.; Luo, Z. Water use and yield of wheat/maize intercropping under alternate irrigation in the oasis field of northwest China. Field Crops Res. 2011, 124, 426–432. [Google Scholar] [CrossRef]
- Babaeian, E.; Paheding, S.; Siddique, N.; Devabhaktuni, V.K.; Tuller, M. Estimation of root zone soil moisture from ground and remotely sensed soil information with multisensor data fusion and automated machine learning. Remote Sens. Environ. 2021, 260, 112434. [Google Scholar] [CrossRef]
- Waqas, M.S.; Cheema, M.J.M.; Waqas, A.; Hussain, S. Enhancing Water Productivity of Potato (Solanum tuberosum L.) Through Drip Irrigation System. In Proceedings of the Pakistan Society for Horticultural Science, Faisalabad, Pakistan, 18–20 February 2016; Volume 18–20, pp. 249–256. [Google Scholar]
- Aslam, F.; Nawaz, G.; Hussain, S.; Ahmed, S. Investigating MAD and Fertigation Effects on Tomato Under Drip Irrigation System in Greenhouse. In Proceedings of the Pakistan Society for Horticultural Science, Faisalabad, Pakistan, 18–20 February 2016; pp. 264–270. [Google Scholar]
- Zhang, C.; Xie, Z.; Wang, Q.; Tang, M.; Feng, S.; Cai, H. AquaCrop modeling to explore optimal irrigation of winter wheat for improving grain yield and water productivity. Agric. Water Manag. 2022, 266, 107580. [Google Scholar] [CrossRef]
- Lankford, B. Localising irrigation efficiency. Irrig. Drain. J. Int. Comm. Irrig. Drain. 2006, 55, 345–362. [Google Scholar] [CrossRef]
- Wang, Z.; Zerihun, D.; Feyen, J. General irrigation efficiency Management for field Water. Agric. Water Manag. 1995, 30, 123–132. [Google Scholar] [CrossRef]
- Gao, F.; Zhao, J.; Xu, J.; Huang, X.; Ni, W.; Li, Y.; Wang, J. Study on measuring method of use efficiency of irrigation water. J. Irrig. Drain. 2004, 23, 14–20. [Google Scholar] [CrossRef]
- Ma, W.B.; Lai, B.; Luan, Q.H.; He, S. Determination and Analysis of Effective Use efficiency of Well Irrigation Water in the Eastern Plain of Handan. J. Irrig. Drain. 2020, 39 (Supp. 2), 45–49. [Google Scholar] [CrossRef]
- Shen, P.P.; Yang, L.H.; Xie, X.T.; Ren, X.W. Research on the connotation and measurement method of the effective use efficiency of irrigation water in irrigation areas. China Rural. Water Resour. Hydropower 2013, 6, 73–75. [Google Scholar] [CrossRef]
- Cai, S.H.; Zhang, Z.Y.; Zhang, D.Q. Modified index system for utilization efficiency of irrigation water. J. Hydraul. Eng. 2004, 35, 111–115. [Google Scholar] [CrossRef]
- Zhou, Q.; Zhang, Y.; Wu, F. Evaluation of the most proper management scale on water use efficiency and water productivity: A case study of the Heihe River Basin, China. Agric. Water Manag. 2021, 246, 106671. [Google Scholar] [CrossRef]
- Ma, Y.; Liu, S.; Song, L.; Xu, Z. Estimation of daily evapotranspiration and irrigation water efficiency at a Landsat-like scale for an arid irrigation area using multi-source remote sensing data. Remote Sens. Environ. 2018, 216, 715–734. [Google Scholar] [CrossRef]
- Kang, S.; Do, N.; Hong, S. Assessing Drought Vulnerability using Soil Moisture-based Water Use Efficiency in Northeast Asia dryland regions. In Proceedings of the 2016 IEEE International Geoscience and Remote Sensing Symposium (IGARSS), Beijing, China, 10–15 July 2016. [Google Scholar]
- Karatas, B.S.; Akkuzu, E.; Unal, H.B.; Asik, S. Using satellite remote sensing to assess irrigation performance in Water User Associations in the Lower Gediz Basin, Turkey. Agric. Water Manag. 2009, 96, 982–990. [Google Scholar] [CrossRef]
- Qiu, G.Y.; Wang, L.; He, X.; Zhang, X.; Chen, S.; Chen, J.; Yang, Y. Water use efficiency and evapotranspiration of winter wheat and its response to irrigation regime in the north China plain. Agric. For. Meteorol. 2008, 148, 1848–1859. [Google Scholar] [CrossRef]
- Meng, G.; Wang, Y.; Qiu, Y.; Chen, X.; Wu, H. Experimental Study on Water Use efficiency of Middle Rice Fields in Gaoguan Irrigation District. J. Irrig. Drain. 2019, 38, 102–106. [Google Scholar] [CrossRef]
- Li, J.; Rao, M.; Zhang, J. A Field Test Study on the Use efficiency of Spraying Water in Arid Areas. Chin. J. Agric. Eng. 2002, 18, 42–45. [Google Scholar] [CrossRef]
- Bell, J.P.; Dean, T.J.; Hodnett, M.G. Soil moisture measurement by an improved capacitance technique, Part II. Field techniques, evaluation and calibration. J. Hydrol. 1987, 93, 79–90. [Google Scholar] [CrossRef]
- Lu, Y.; Song, W.; Lu, J.; Wang, X.; Tan, Y. An examination of soil moisture estimation using ground penetrating radar in desert steppe. Water 2017, 9, 521. [Google Scholar] [CrossRef] [Green Version]
- Wu, L.; Zhang, Y.; Xie, W.; Li, Y.; Song, J. Summary of remote sensing methods for monitoring soil moisture. Remote Sens. Land Resour. 2014, 26, 19–26. [Google Scholar] [CrossRef]
- Babaeian, E.; Sadeghi, M.; Jones, S.B.; Montzka, C.; Vereecken, H.; Tuller, M. Ground, proximal, and satellite remote sensing of soil moisture. Rev. Geophys. 2019, 57, 530–616. [Google Scholar] [CrossRef] [Green Version]
- Tavakol, A.; McDonough, K.R.; Rahmani, V.; Hutchinson, S.L.; Hutchinson, J.S. The soil moisture data bank: The ground-based, model-based, and satellite-based soil moisture data. Remote Sens. Appl. Soc. Environ. 2021, 24, 100649. [Google Scholar] [CrossRef]
- Zreda, M.; Shuttleworth, W.J.; Zeng, X.; Zweck, C.; Desilets, D.; Franz, T.; Rosolem, R. COSMOS: The cosmic-ray soil moisture observing system. Hydrol. Earth Syst. Sci. 2012, 16, 4079–4099. [Google Scholar] [CrossRef] [Green Version]
- Zreda, M.; Desilets, D.; Ferré, T.P.A.; Scott, R.L. Measuring soil moisture content non-invasively at intermediate spatial scale using cosmic-ray neutrons. Geophys. Res. Lett. 2008, 35, 35655. [Google Scholar] [CrossRef] [Green Version]
- Schrön, M.; Zacharias, S.; Womack, G.; Köhli, M.; Desilets, D.; Oswald, S.E.; Dietrich, P. Intercomparison of cosmic-ray neutron sensors and water balance monitoring in an urban environment. Geoscientific Instrumentation. Methods Data Syst. 2018, 7, 83–99. [Google Scholar] [CrossRef] [Green Version]
- Han, X.; Franssen, H.J.H.; Bello, M.Á.J.; Rosolem, R.; Bogena, H.; Alzamora, F.M.; Chanzy, A.; Vereecken, H. Simultaneous soil moisture and properties estimation for a drip irrigated field by assimilating cosmic-ray neutron intensity. J. Hydrol. 2016, 539, 611–624. [Google Scholar] [CrossRef]
- Tian, Z.; Li, Z.; Liu, G.; Li, B.; Ren, T. Soil water content determination with cosmic-ray neutron sensor: Correcting aboveground hydrogen effects with thermal/fast neutron ratio. J. Hydrol. 2016, 540, 923–933. [Google Scholar] [CrossRef]
- Baroni, G.; Scheiffele, L.M.; Schrön, M.; Ingwersen, J.; Oswald, S.E. Uncertainty, sensitivity and improvements in soil moisture estimation with cosmic-ray neutron sensing. J. Hydrol. 2018, 564, 873–887. [Google Scholar] [CrossRef]
- Wang, Q.; Fan, J.; Wang, S.; Yong, C.; Ge, J.; You, W. Application and accuracy of cosmic-ray neutron probes in three soil textures on the Loess Plateau, China. J. Hydrol. 2019, 569, 449–461. [Google Scholar] [CrossRef]
- Nguyen, H.H.; Kim, H.; Choi, M. Evaluation of the soil water content using cosmic-ray neutron probe in a heterogeneous monsoon climate-dominated region. Adv. Water Resour. 2017, 108, 125–138. [Google Scholar] [CrossRef]
- Han, X.; Jin, R.; Li, X.; Wang, S. Soil moisture estimation using cosmic-ray soil moisture sensing at heterogeneous farmland. IEEE Geosci. Remote Sens. Lett. 2014, 11, 1659–1663. [Google Scholar] [CrossRef]
- Zhu, X.; Cao, R.; Shao, M.; Liang, Y. Footprint radius of a cosmic-ray neutron probe for measuring soil-water content and its spatiotemporal variability in an alpine meadow ecosystem. J. Hydrol. 2018, 558, 1–8. [Google Scholar] [CrossRef]
- Finkenbiner, C.E.; Franz, T.E.; Gibson, J.; Heeren, D.M.; Luck, J. Integration of hydrogeophysical datasets and empirical orthogonal functions for improved irrigation water management. Precis. Agric. 2019, 20, 78–100. [Google Scholar] [CrossRef] [Green Version]
- Franz, T.E.; Wahbi, A.; Zhang, J.; Vreugdenhil, M.; Heng, L.; Dercon, G.; Strauss, P.; Brocca, L.; Wagner, W. Practical data products from cosmic-ray neutron sensing for hydrological applications. Front. Water 2020, 2, 9. [Google Scholar] [CrossRef] [Green Version]
- Baroni, G.; Oswald, S.E. A scaling approach for the assessment of biomass changes and rainfall interception using cosmic-ray neutron sensing. J. Hydrol. 2015, 525, 264–276. [Google Scholar] [CrossRef]
- Tan, X.; Zhang, L.; He, C.; Zhu, Y.; Han, Z.; Li, X. Applicability of cosmic-ray neutron sensor for measuring soil moisture at the agricultural-pastoral ecotone in northwest China. Sci. China Earth Sci. 2020, 63, 1730–1744. [Google Scholar] [CrossRef]
- Schattan, P.; Baroni, G.; Oswald, S.E.; Schöber, J.; Fey, C.; Kormann, C.; Huttenlau, M.; Achleitner, S. Continuous monitoring of snowpack dynamics in alpine terrain by aboveground neutron sensing. Water Resour. Res. 2017, 53, 3615–3634. [Google Scholar] [CrossRef]
- Evans, J.G.; Ward, H.C.; Blake, J.R.; Hewitt, E.J.; Morrison, R.; Fry, M.; Ball, L.A.; Doughty, L.C.; Libre, J.W.; Hitt, O.E.; et al. Soil water content in southern England derived from a cosmic-ray soil moisture observing system—COSMOS-UK. Hydrol. Process. 2016, 30, 4987–4999. [Google Scholar] [CrossRef] [Green Version]
- Baatz, R.; Bogena, H.R.; Franssen, H.J.H.; Huisman, J.A.; Qu, W.; Montzka, C.; Vereecken, H. Calibration of a catchment scale cosmic-ray probe network: A comparison of three parameterization methods. J. Hydrol. 2014, 516, 231–244. [Google Scholar] [CrossRef]
- Hawdon, A.; McJannet, D.; Wallace, J. Calibration and correction procedures for cosmic-ray neutron soil moisture probes located across Australia. Water Resour. Res. 2014, 50, 5029–5043. [Google Scholar] [CrossRef]
- Bogena, H.R.; Huisman, J.A.; Baatz, R.; Hendricks Franssen, H.J.; Vereecken, H. Accuracy of the cosmiche cosmicconter content probe in humid forest ecosystems: The worst case scenario. Water Resour. Res. 2013, 49, 5778–5791. [Google Scholar] [CrossRef] [Green Version]
- Jakobi, J.; Huisman, J.A.; Vereecken, H.; Diekkrüger, B.; Bogena, H.R. Cosmic ray neutron sensing for simultaneous soil water content and biomass quantification in drought conditions. Water Resour. Res. 2018, 54, 7383–7402. [Google Scholar] [CrossRef] [Green Version]
- Franz, T.E.; Zreda, M.; Ferre, T.P.A.; Rosolem, R.; Zweck, C.; Stillman, S.; Zeng, X.; Shuttleworth, W.J. Measurement depth of the cosmic ray soil moisture probe affected by hydrogen from various sources. Water Resour. Res. 2012, 48, 1–9. [Google Scholar] [CrossRef] [Green Version]
- Pang, Z.; Jia, Y.; Peng, X.; Ju, X.; Gao, L. Applicability of cosmic-ray neutron sensing for measuring soil water content to heterogeneous landscapes under subtropical hydroclimatic conditions. J. Hydrol. 2021, 596, 126068. [Google Scholar] [CrossRef]
- Desilets, D.; Zreda, M.; Ferré, T.P.A. Nature’s neutron probe: Land surface hydrology at an elusive scale with cosmic rays. Water Resour. Res. 2010, 46, W11505. [Google Scholar] [CrossRef]
- Franz, T.E.; Zreda, M.; Rosolem, R.; Ferre, T.P.A. Field validation of a cosmic-ray neutron sensor using a distributed sensor network. Vadose Zone J. 2012, 11, vzj2012.0046. [Google Scholar] [CrossRef] [Green Version]
- Shi, J.; Wu, X.; Zhang, M.; Wang, X.; Zuo, Q.; Wu, X.; Ben-Gal, A. Numerically scheduling plant water deficit index-based smart irrigation to optimize crop yield and water use efficiency. Agric. Water Manag. 2021, 248, 106774. [Google Scholar] [CrossRef]
- Wang, Y.T. Research on Crop Water Requirement and Field Water Use Efficiency in Jinghui Canal Irrigation Area. Masters’ Thesis, Northwest A&F University, Beijing, China, 2019. [Google Scholar]
Figure 1.
The location of the study area.

Figure 2.
Meteorological data of the study area from October 2018 to June 2019. (Temperature (a), Atmospheric pressure (b), Air humidity (c), Net radiation (d)).
Figure 2.
Meteorological data of the study area from October 2018 to June 2019. (Temperature (a), Atmospheric pressure (b), Air humidity (c), Net radiation (d)).

Figure 3.
Instrument layout drawing and instruments (diagram showing instrument placement (a), cosmic-ray neutron sensor (b), and time-domain reflectometer (c)).
Figure 3.
Instrument layout drawing and instruments (diagram showing instrument placement (a), cosmic-ray neutron sensor (b), and time-domain reflectometer (c)).

Figure 4.
The data processing flow chart.

Figure 5.
SM was measured by CRNS and TDR and precipitation data were measured by a meteorological station during the experiment period.
Figure 5.
SM was measured by CRNS and TDR and precipitation data were measured by a meteorological station during the experiment period.

Figure 6.
Irrigation event identification based on the cosmic-ray neutron method.


Table 1.
The growth period of winter wheat from 2018 to 2019.
| Stage | Sowing | Overwinter | Rejuvenation Period | Jointing Period | Heading Date | Maturity |
|---|---|---|---|---|---|---|
| Starting Time | 17 October 2018 | 16 December 2018 | 1 March 2019 | 26 March 2019 | 28 April 2019 | 9 June 2019 |
Table 2.
The irrigation time in the experimental field from October 2018 to June 2019.
| Time | Type | Times of Irrigation in This Round | Irrigation Period |
|---|---|---|---|
| Irrigation Time | Autumn Irrigation | 1 | 11 October 2018–19 November 2018 |
| Winter Irrigation | 1 | 24 December 2018–1 February 2019 | |
| Spring Irrigation | 2 | 12 February 2019–12 April 2019 |
Table 3.
Calculation table of net irrigation water consumption per unit area.
| Date | Irrigation Times | Irrigation Time Identified | SM Content before Irrigation (%) | SM Content after Irrigation (%) | Net Irrigation Water Consumption per Unit Area (m3/mu) | On-Farm Water Efficiency |
|---|---|---|---|---|---|---|
| October 2018–June 2019 | 1 | 30 October 2018 | 9.84 | 17.34 | 35.77 | 0.77 |
| 2 | 25 January 2019 | 10.47 | 19.55 | 43.30 | ||
| 3 | 8 March 2019 | 15.06 | 28.81 | 65.57 | ||
| 4 | 23 March 2019 | 10.69 | 19.59 | 42.44 |
Publisher’s Note: MDPI stays neutral with regard to jurisdictional claims in published maps and institutional affiliations. |
© 2022 by the authors. Licensee MDPI, Basel, Switzerland. This article is an open access article distributed under the terms and conditions of the Creative Commons Attribution (CC BY) license (https://creativecommons.org/licenses/by/4.0/).
Share and Cite
MDPI and ACS Style
Chen, X.; Song, W.; Shi, Y.; Liu, W.; Lu, Y.; Pang, Z.; Chen, X. Application of Cosmic-Ray Neutron Sensor Method to Calculate Field Water Use Efficiency. Water 2022, 14, 1518. https://0-doi-org.brum.beds.ac.uk/10.3390/w14091518
AMA Style
Chen X, Song W, Shi Y, Liu W, Lu Y, Pang Z, Chen X. Application of Cosmic-Ray Neutron Sensor Method to Calculate Field Water Use Efficiency. Water. 2022; 14(9):1518. https://0-doi-org.brum.beds.ac.uk/10.3390/w14091518
Chicago/Turabian StyleChen, Xiuhua, Wenlong Song, Yangjun Shi, Weidong Liu, Yizhu Lu, Zhiguo Pang, and Xiao Chen. 2022. "Application of Cosmic-Ray Neutron Sensor Method to Calculate Field Water Use Efficiency" Water 14, no. 9: 1518. https://0-doi-org.brum.beds.ac.uk/10.3390/w14091518
Note that from the first issue of 2016, this journal uses article numbers instead of page numbers. See further details here.