
Sustainable Development and Efficiency Analysis of the Major Urban Water Utilities in Spain


Dpto. Organización Industrial y Gestión de Empresas II, Escuela Técnica Superior de Ingeniería, Universidad de Sevilla, Camino de los Descubrimientos S/N, 41092 Seville, Spain
*
Author to whom correspondence should be addressed.
Water 2022, 14(9), 1519; https://0-doi-org.brum.beds.ac.uk/10.3390/w14091519
Submission received: 28 March 2022
/
Revised: 28 April 2022
/
Accepted: 29 April 2022
/
Published: 9 May 2022
(This article belongs to the Special Issue Increasing the Efficiency of Urban Water Supply)
Abstract
:In Spain, the water supply service is a municipal responsibility and in general is a sector without competitors. For this reason, an efficiency analysis attains greater significance. This study uses Data Envelopment Analysis (DEA) to estimate the efficiency of different urban water utilities. An extensive data search, where several variables such as the capital expenditure, the cost of material, or the labor have been recorded, has allowed evaluating the relative efficiency of the most important Spanish water distribution networks in using their resources. Furthermore, their sustainable efficiency has also been evaluated by including a variable representing the percentage of water losses. Results reveal the weaknesses of inefficient utilities and help to detect potential aspects that these companies should improve. For instance, there is an evident incorrect management of the costs of material by many urban water utilities, which does not happen with the labor. Additionally, the most efficient water utilities regarding the sustainable efficiency help to discover target percentages of water losses for the inefficient ones.
1. Introduction
The access to drinking water and sanitation are human rights recognized by the United Nations [1], since both are essential for people to have a dignified life. Although the duty to ensure the water supply is placed on governments, companies are usually in charge of managing the infrastructures involved in the entire water cycle such as water treatment plants, water distribution networks, etc. Obviously, water governance has a considerable impact on water resource utilization and on water consumption habits of the population. However, there are other factors that influence the resource sustainability, for instance water loss, which mainly depends on the management company and on the state of the infrastructure.
This study aims to evaluate the efficiency of an extended number of Spanish UWUs, all of them with public management, in order to propose potential improvements by analyzing the characteristics of the most efficient ones. Although the study of the efficiency of public utilities has a long tradition [2], in the last decade the available data has increased drastically, allowing a much deeper and realistic analysis. In a previous study developed by Suárez-Varela et al. [3], 77 small Spanish utilities were analyzed, all of them managing water distribution networks that supply drinking water to less than 43,000 inhabitants. In our study, we analyze the major companies of the country, where the smallest served population has 70,000 inhabitants and the largest one more than six million. Furthermore, we employ updated data from 2019 instead of 2013.
Finally, it has been observed that there are a lack of theoretical approaches concerning the sustainable development theory and efficiency analysis of water distribution networks that include data related to water losses. In our study, we develop a sustainable efficiency analysis of UWUs by including data related to the water losses of the water distribution networks. The proposed sustainable efficiency analysis is recommended to attain the companies’ sustainable development goals stablished by the United Nations in 2015 [4], concretely, the target 6.4, which mentions the necessity of an efficient use of water resources in all sectors.
Based on this objective, the main contributions of the study are:
- The analysis of the largest water Spanish companies that have public ownership. These analyzed companies supply drinking water to cities with a population average of 860,000 inhabitants.
- The sustainable efficiency analysis of the water distribution networks by including the percentage of water losses as an output variable to be minimized.
2. Materials and Methods
This section starts with an extensive literature review about efficiency analyses of water companies. Then, an economical and financial analysis of the main water companies in Spain is performed. Finally, the methodology employed and the data description is presented in Section 2.3.
2.1. Theoretical Frameworks of Efficiency Analyses of Water Companies
The importance of analyzing the efficiency of water companies becomes more obvious as they work in environments without competitors. There exist several methods to evaluate efficiency such as econometric analyses using cost and production functions, the use of stochastic frontier measures (SFA), or the use of Data Envelopment Analysis [5]. As this study focuses on DEA, a brief contextualization on the use of this methodology in the water sector is presented below.
Productivity analyses using DEA are useful when the decision units (DMUs) have the ability to modify either the amount of resources used or the amount of results produced. In the case of water management companies, a different perspective can be taken according to the process or stage that is being analyzed. A popular option is to analyze the efficiency of water distribution networks using their resources (the entire infrastructure, the company assets, the labor force, etc.). This approach can be extended to perform temporary analyses, which consist of making dynamic or long-term analyses by including data from several years. The Malmquist index is often used to evaluate the productivity variances for consecutive periods of time. In the study developed by García-Valiñas and Muñiz [6], they assess the efficiency of three Spanish companies in a period of 15 years in order to propose fair regularization of water prices. The study includes an input variable related to the density of rainfall in the different territories. In general, the lack of available data causes most studies that implement temporary analyses to use short periods of time covering no more than three years [7,8].
When an input or output variable presents a zero, traditional DEA models do not give reliable information because many DMUs are benchmarked as efficient. In these cases, it is a typical procedure to remove the DMU that presents this zero or to delete the variable. Due to these kinds of anomalies and the appearance of new challenges and applications, nowadays there are various extensions of the standard DEA models. For instance, in the study of Gidion et al. [7] they use a network DEA to benchmark urban water utilities (UWUs) under the Yardstick Competition (YC) regime. Suarez-Varela et al. [3] study the efficiency of a battery of Spanish water companies, focusing not only on the radial efficiency but on the efficiency managing specific inputs such as the labor costs or the operational costs.
Table 1 presents different studies published in the scientific literature from 2007 to 2019 that use DEA models to analyze the efficiency of UWUs and the case studies that they employ. As can be seen, both constant (CCR) and variable (BCC) returns to scale are used depending on the characteristics of the organizations that are being analyzed.
Some studies focus on analyzing medium-size economy environments such as provinces or cities instead of UWUs, which are typically associated with micro-economies. For example, Hu et al. [9] and Song et al. [10] evaluate the water resource utilization efficiency and the environmental efficiency of water consumption in multiple Chinese provinces using DEA models. They conclude that the water pollution is a more serious problem than the water consumption since the environmental efficiencies of the provinces are generally lower than the resource efficiencies. Consequently, the country should focus its efforts on reducing industrial wastewater.
In order to identify the most common variables, Table 2 gathers the inputs and outputs used in the studies presented in Table 1, as well as the model orientation (input or output). As can be appreciated, most studies use input orientation in order to evaluate the ability to reduce the inputs for a given volume of outputs. Moreover, multi-output models are also common, being the main output variables, the volume of water supplied, and the population served. Variables related to resources such as fixed assets, labor force, costs of material, or investments are usually employed as input variables. However, some studies include other variables as the electricity consumption (elec. cons.) of both the water distribution and sewer networks (WDN and WSN) or the sludge production in order to analyze the UWUs sustainability [13].
In a previous study developed by Abbot and Cohen [5], they analyzed the inputs and outputs of many studies, all published before 2006, that evaluate the efficiency of water companies. They determine that the ones employing DEA generally use a small number of variables, the most common ones being: the volume of water supplied, the number of connections, and the operating expenditure.
Hu et al. [9] utilize an adaptation of the traditional DEA-CCR model to include undesirable outputs without transforming them, for example, the Gross Domestic Product. This model was firstly proposed by Chen and Delmas [14] and calculates the inefficiency of DMUs by allowing them to choose their own direction of improvement.
A recurrent aspect to be analyzed is the existence of differences between efficiencies of public and private managements. In an extended literature review developed by Romano and Guerrini [11], they conclude that there is no evidence about which management is more efficient. However, some studies defend that public companies attain higher efficiencies [8,15]. In the study of Suarez-Varela et al. [3], private companies seem to be more efficient in labor management, while public companies present higher efficiencies at managing operational costs.
Regarding the size of the companies, there is no unanimous opinion either. Some studies suggest that smaller companies have better performances and others that larger companies highlight.
2.2. Economical and Financial Analysis of the Main Water Companies in Spain
In Spain, the water supply and sewer services are a municipal responsibility. Consequently, the municipalities are the institutions in charge of guaranteeing the water access for the citizens. They can provide the service directly with their own staff or indirectly through companies. According to the report presented by AEAS (Asociación Española de Abastecimientos de Agua y Saneamiento) in 2020 [16], only 10% of this service is provided directly by municipalities and the remaining 90% is provided by companies. Within this 90%, there are three possible management models: (1) public management, which is typically done by private companies with public capital, i.e., private companies whose shareholder is a municipality or a group of them; (2) private management, i.e., companies with private capital; and (3) mixed management enterprises, whose shareholders are both public and private organizations. The same report informs that 35% of the water management is performed by companies with public capital, 33% by private companies, and 22% by mixed (private–public) enterprises. It needs to be mentioned that the rubbish collection in Spain is also a municipal responsibility that is commonly provided by the same company that manages the water supply and sewer services.
The authors have recently developed a study to characterize the Spanish water sector by analyzing different economic and financial ratios of the main water companies [17]. Concretely, the main companies that work in 46 of the 52 provinces of Spain have been studied. The results indicate that no type of management clearly outperforms the others according to the revised rates. Additionally, the water tariffs, which include charges of water supply, sanitation, and rubbish collection, are also reviewed in the aforementioned study. The supply charge is divided into a fixed quote and a variable quote that increases in accordance with the water consumption. According to the obtained results, there is no significant correlation between the tariffs and the management form, i.e., none of the management forms is clearly more advantageous.
According to AEAS [18], in Spain there are 4.6 m of drinking water pipes per capita and 3.5 m of sewer pipes. These networks have ensured the safe and continuous access to drinking water to 100% of the Spanish population for a long period of time, at least all the historical data published by the World Health Organization [19]. In 2016, more than 50% of the water distribution network in metropolitan areas was older than 30 years [20], which revealed the necessity to increase the investments in the renovation of these networks in order to ensure the quality and sustainability of the sector. One of the problems that results from the aging of the infrastructure is the appearance of pipe leaks and breakages. This fact evidently affects the percentage of non-registered water. On the one hand, water losses associated only with pipe leaks, breakages, and other failures supposed 15.4% of the total water supplied to the network in 2018 [21]. On the other hand, water losses associated with frauds, measurement errors, and non-measured supplies added another 7%. The percentage of non-registered water has considerably decreased in recent years (see Figure 1). Nevertheless, this problem still compromises the sustainability of the service, since many Spanish regions have severe water stress problems.
2.3. Efficiency Analysis: Methodology and Data Description
In this section, the methodology used to evaluate the water companies’ efficiency is described. Afterwards, the input and output variables related to the companies analyzed are presented.
2.3.1. Data Envelopment Analysis (DEA)
DEA is a non-parametric approach for evaluating the performance of a set of decision-making units (DMUs). These DMUs must be homogeneous units, i.e., companies, organizations, countries, etc., that convert one or various inputs into one or multiple outputs. DEA methodology was initially presented by Charnes, Cooper, and Rhodes [22] and is based on the research developed by Farrell [23]. This method uses the concept of efficiency as a simple coefficient between production () and resources () of the kth DMU.
DEA uses linear programming models to estimate the inefficiency of DMUs, determining whether it is possible for an operative unit to obtain more outputs with the same inputs (output-oriented) or to obtain the same outputs using fewer inputs (input-oriented) [11], which is referred to as model orientation.
The first proposed model assumes constant returns to scale (CRS) and it was named DEA-CCR in honor of its authors Charnes, Cooper, and Rhodes. This model seeks to establish which DMUs determine the efficient production frontier. Thus, the radial distance of a DMU towards the frontier provides the measure of its efficiency. This model was extended by Banker, Charnes, and Cooper in 1984 [24] by assuming variable returns to scale (VRS) and it was called DEA-BCC. As DEA-BCC models address efficiencies not influenced by scale effect, the efficiencies obtained are usually higher than those obtained by using DEA-CCR models.
In our study, we use a DEA-CCR model to evaluate the efficiency of different Spanish UWUs. As all the companies analyzed operate in large Spanish cities, it was firstly understood that there was constant return to scale, i.e., all the UWUs could achieve the efficiency of the most efficient ones. However, after analyzing the results it was not so clear, therefore we decided to implement both environments, CRS and VRS. Moreover, two cases that differ on the factors used as input and output variables have required the use of both exiting orientations.
DEA-CCR input-oriented and output-oriented models are presented below. In addition, the DEA-BCC input-oriented model is also included. Let be the total number of UWUs (our DMUs), be the number of input variables, and the number of output variables, the following DEA-CCR input-oriented model (Equations (1)–(4)) is solved for each UWU:
The DEA-CCR output-oriented model (Equations (5)–(8)) has the following structure:
In both cases, the variables to be estimated are the weights and of the outputs and the inputs that maximize the efficiency of the target UWUo as calculated in Equation (9). Furthermore, the models force the weights to be positive as defined by Equations (4) and (8), where is an infinitesimal number (positive and close to zero).
In order to obtain the ranking of the efficient UWUs, super efficiency is allowed by removing the constraint (2) or (6) from the model for , i.e., for the target UWUo which is represented by Equation (10):
With this adaptation of the model, the UWUs may obtain efficiencies higher than 100%. In this sense, we can identify the most efficient one.
Finally, the DEA-BCC models differ from the DEA-CCR models in that the projection of the target UWUo is done on the hyperplane formed by the UWUs of its size. Consequently, the objective function only includes UWUs of the target UWU size.
2.3.2. Data Description
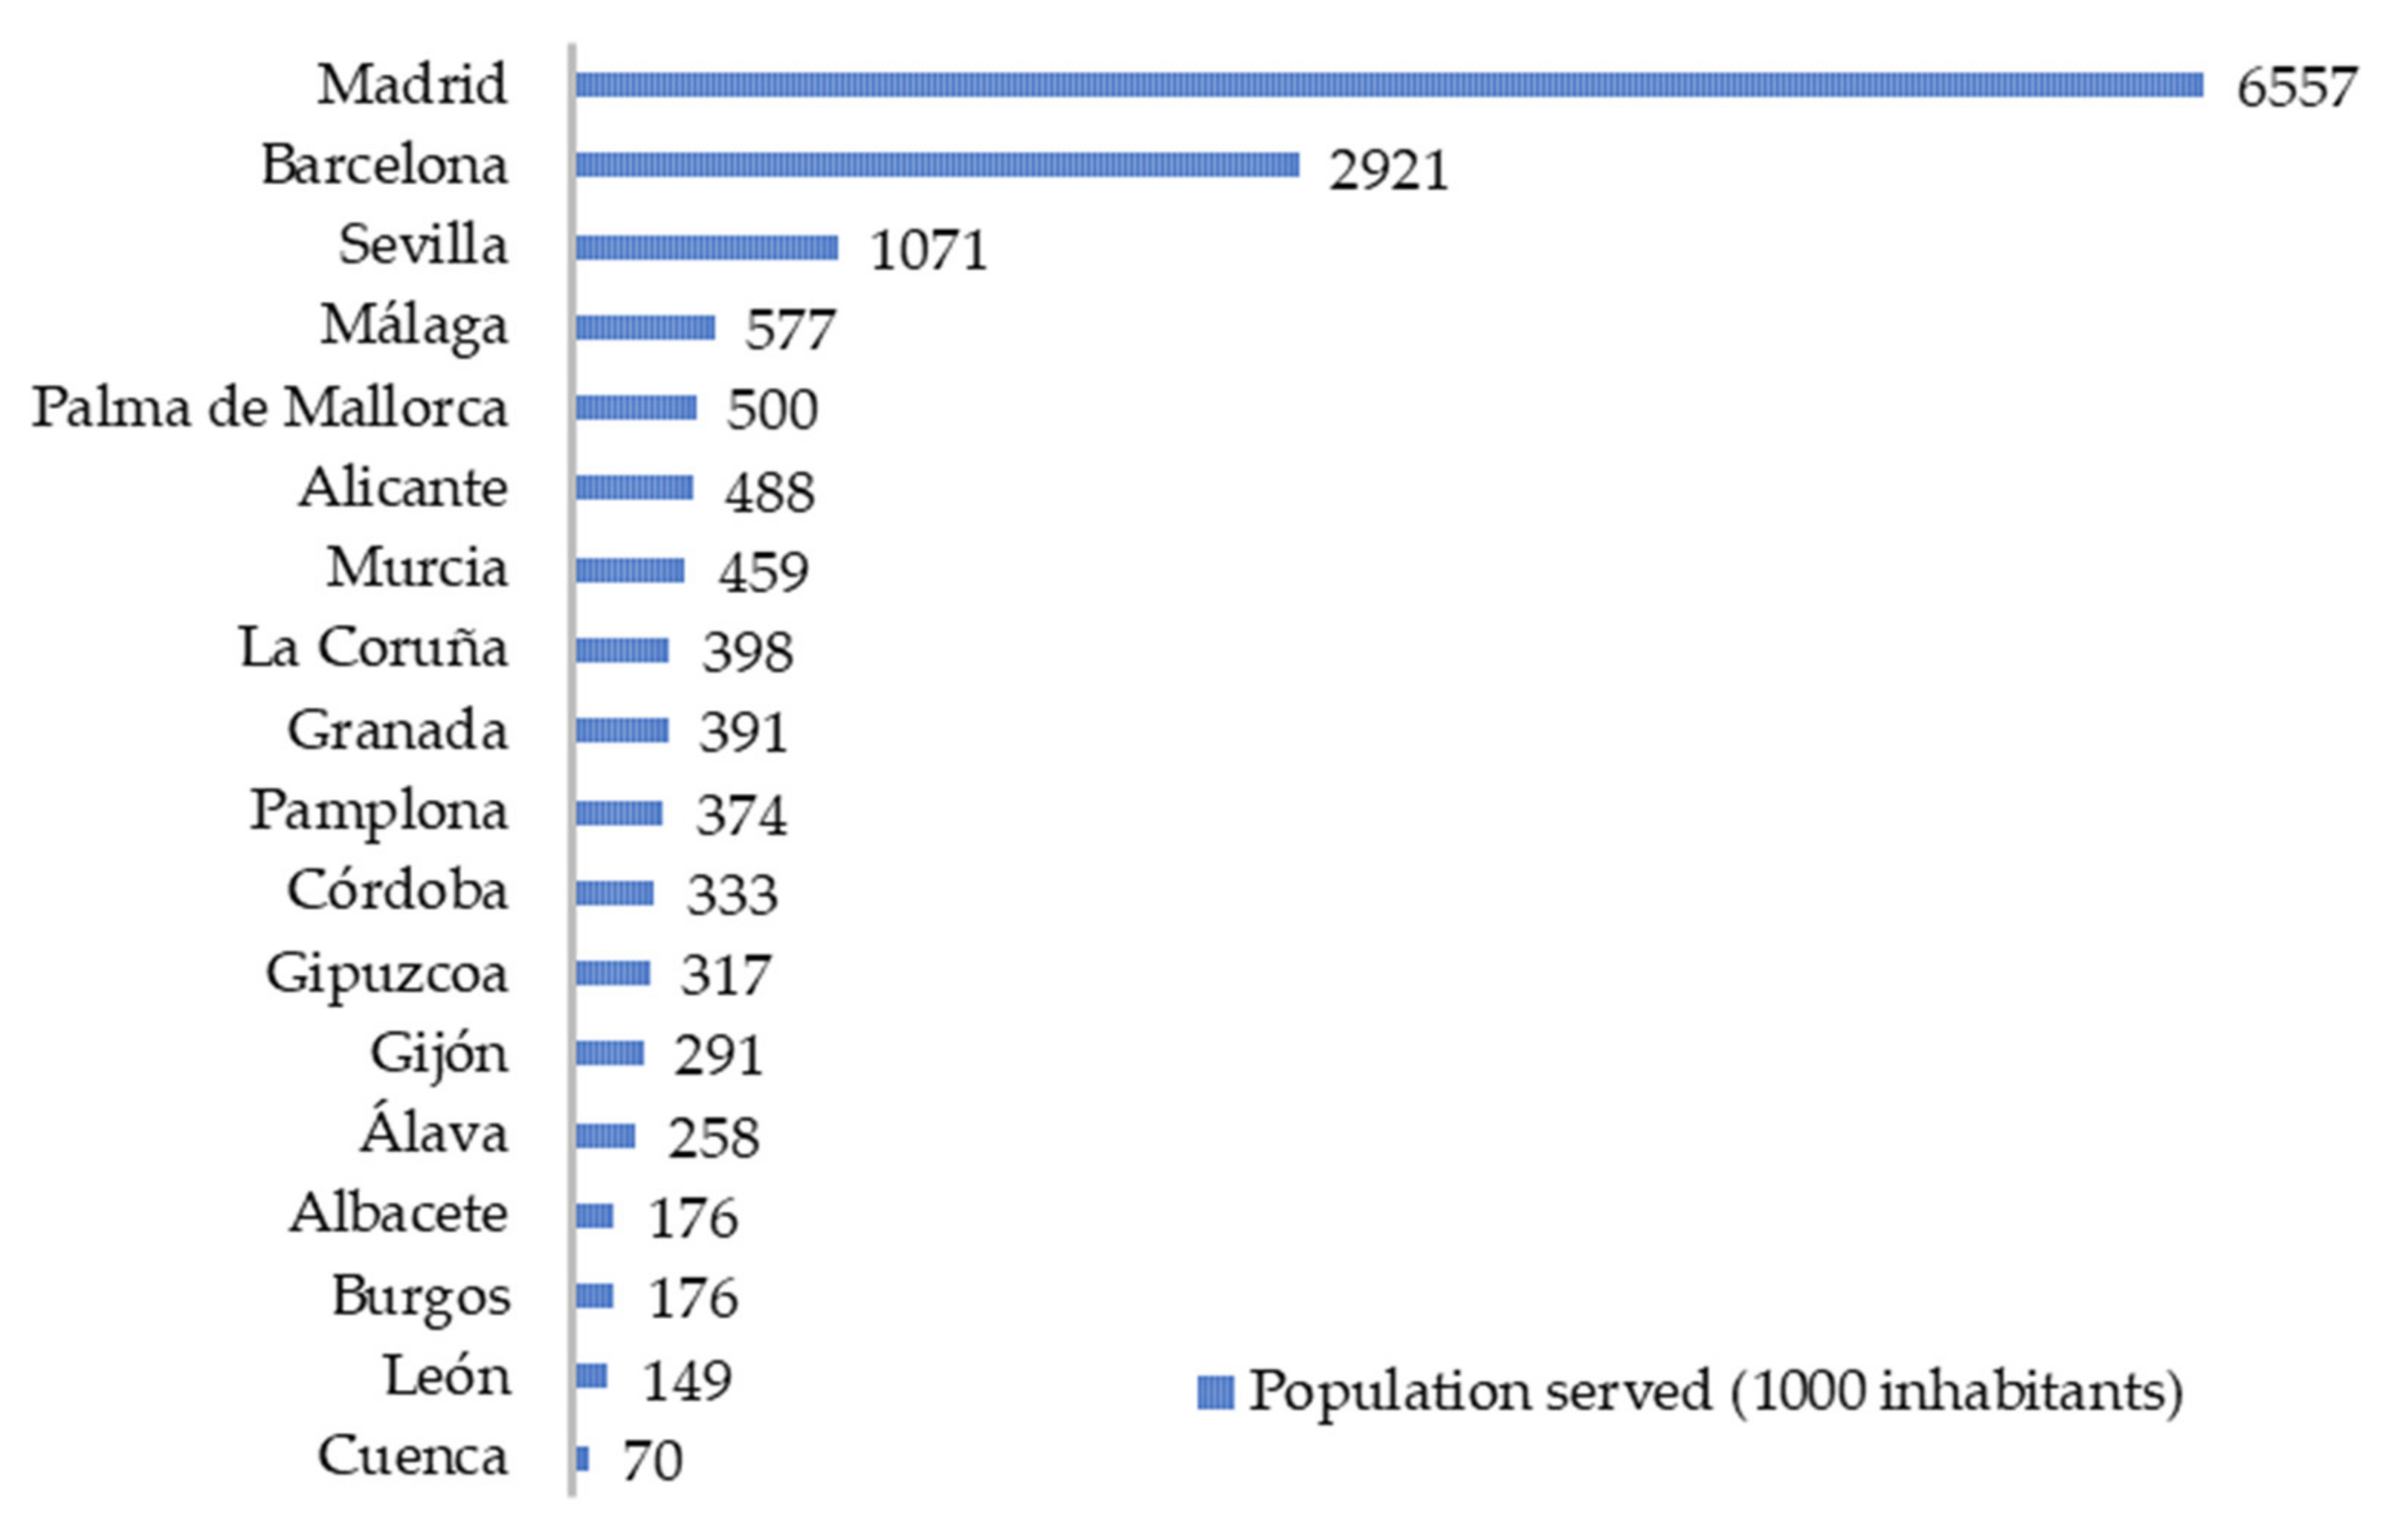
As previously mentioned, this study analyzes 18 water utilities that operate in the most important Spanish cities, among which are the water distribution networks of Madrid, Barcelona, and Sevilla. Figure 2 shows the population served by each of the analyzed water distribution networks. It can be seen that most of them have populations between 200 and 600 thousand inhabitants. Nevertheless, the city of Madrid presents an enormous number in comparison with the rest.
Table 3 presents the acronyms and definition of the variables used as inputs or outputs in the implemented models. Most variables have been taken from the companies’ websites and a balance analysis system [25] has been used to obtain the economic variables. All these data are from 2019.
Table 4 shows the descriptive statistics of the recorded data. The network length analyzed corresponds to 17.2% of the total Spanish supply network. Additionally, the companies supply water to 33.0% of the Spanish population. Therefore, this is a highly representative study.
According to our data, the annual water consumption per capita is 70.3 m3 on average, which corresponds to 192.7 L per person per day (this quantity includes industrial and other uses of the water). For the variable volume of water delivered (xWDEL), the two missing values are estimated using the volume of water taken and the average percentage of water losses in Spain in 2018, i.e., 22%.
All variables achieve their maximum value for the city of Madrid, which is the Spanish capital. This water distribution network encompasses 41.4% of the analyzed kilometers, supplying water to 42.3% of the population included in the study. The capital expenditures vary from −3,623,237 € to 58,036,000 €, revealing that not all companies are investing enough to increase its fixed assets. The cost of material moves in a wide range. The company that works in Cuenca spends the lowest quantity; however, its network is also small, having 93 km of pipes.
Instead of using the percentage of water losses, we have decided to include the percentage of water delivered (last variable in the table) as an output variable that characterizes the sustainability of the companies. For instance, if a distribution network has water losses that equal 15%, the value of variable x% would be 85. The higher the value of this variable the better the UWU performance.
It is noticed that only the companies with reasonably good water loss percentages publish this data. In fact, in the sample this percentage varies from 9% (La Coruña) to 23% (Alicante) with an average of 15%, which is really low in comparison with the national average presented in Figure 1.
2.3.3. DEA Input/Output Selection
In this section, the input and output variables related to the companies analyzed are presented. According to the available data, we have decided to implement two different models. The first one aims to evaluate the efficiency of the companies using their resources; consequently, DEA input-oriented models (CRS and VRS technologies) are employed. In this case, some economic indicators are used as input variables, concretely, the cost of material (xCOST) and the fixed asset investment (xCAPEX). Furthermore, the company labor (xLABOR) is also introduced to represent the size of a company and its labor costs. Finally, the water network length (xLEN) represents the assets of the companies to perform their activities. Regarding the output variables, this model uses the water supplied (yWDEL) and the population served (yPOP), which are understood as constant variables since the companies must offer the service to all their customers.
The second model evaluates the sustainable efficiency of the companies by including the percentage of water losses as the only output variable. In this case, the DEA model is output oriented. This model is implemented with 12 UWUs associated to the companies that make this data available. The input variables that are now stablished as constant are the water network length (xLEN), the population served (xPOP), the volume of water delivered (xWDEL), and the fixed asset investment (xCAPEX).
Table 5 gathers the aforementioned information, i.e., the input and output variables used in each model. Although all variables have initially been defined using ‘x’, the ones that act as output variables are now represented by the letter ‘y’.
3. Results and Discussion
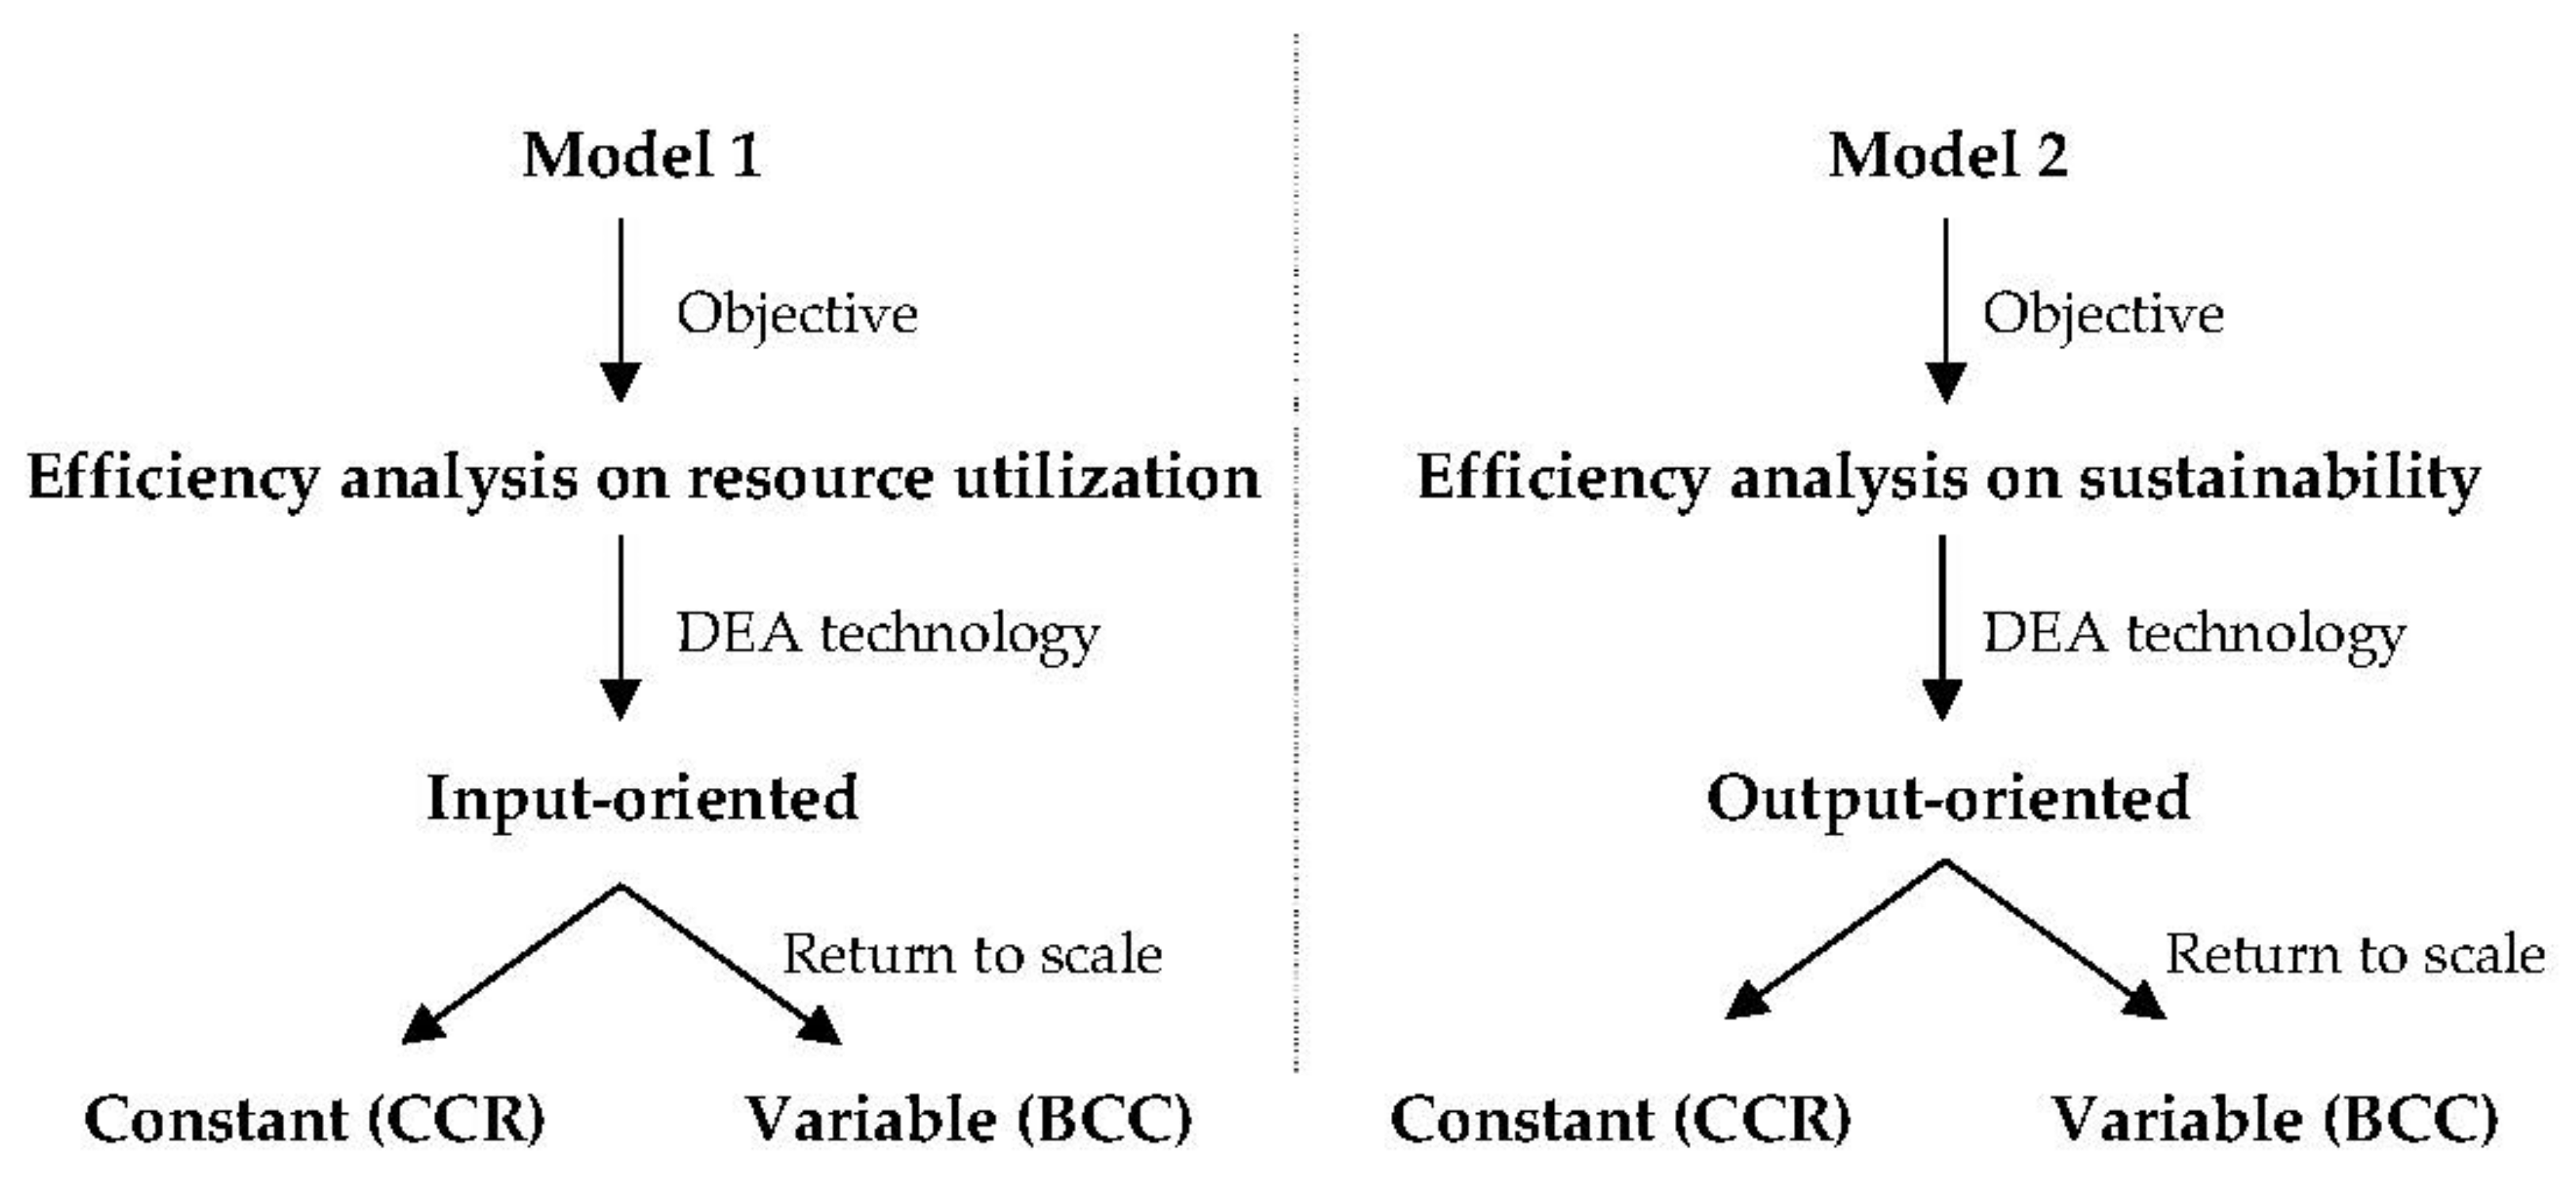
Two efficiency analyses are developed in this section based on the results of two different DEA models. To facilitate the understanding of the results, the main characteristics of the proposed models are summarized in Figure 3.
3.1. Efficiency Analysis on Resource Utilization
Table 6 presents the super efficiencies achieved by the different UWUs when Model 1, which is input oriented, is employed and both constant and variable returns to scale are considered. The UWUs are ordered according to the efficiency attained by the DEA-CCR model; nevertheless, this ranking coincides in many cases with that obtained by using the DEA-BCC model. The scores of efficient units (marked in bold) are measures of how much the inputs could increase radially without the units becoming inefficient. Furthermore, efficiencies of 100% are assigned to these UWUs whose super efficiency cannot be measured since they are in one end of the border, for example, Palma de Mallorca in both models.
As expected, there are more efficient units in the case of DEA-BCC than in the case of DEA-CCR. Specifically, by using the DEA-CCR model, 33.3% of the UWUs are efficient; meanwhile, this percentage increases to 55.5% when variable return to scale is considered. For example, Granada is inefficient by using DEA-CCR, but it becomes efficient when variable return to scale is considered.
On the one hand, the most efficient water utility according to both models is the one located in Sevilla. This water utility is the third largest in terms of population served and WDN length. By analyzing the available data, we have discovered that this UWU presents the lowest operational costs per water distribution network length. Additionally, it counts with a small staff (826 employees) in comparison with the rest. The solution of the DEA-BCC model informs that three inefficient UWUs, concretely, Pamplona, Córdoba, and Gijón should be projected in some scale in Sevilla. According to this criterion, Coruña is the utility where a higher number of inefficient utilities should be projected, meaning that the company is making an exemplary use of its resources.
On the other hand, the most inefficient UWU is the Pamplona water distribution network. This UWU presents the highest CAPEX per population served. For the investment that the UWU makes, it is not obtaining the results (or outputs) that others can achieve. To be efficient, this company should be able to obtain the same outputs by using a lower investment. Moreover, its operational costs per population served are also really high. In general, the company should contemplate reducing its resources, without reducing the provided service (volume of water distributed and population served). As this UWU is projected on Coruña and Cuenca, Pamplona should copy some of their behaviors regarding their operation and resource utilization.
According to the analysis of the slacks, the costs of material is the most influential variable for almost all the inefficient units, which means that most inefficient UWUs have excessive costs of material. On the contrary, the labor does not seem to be a problem among the inefficient units.
3.2. Efficiency Analysis on Sustainability
Table 7 shows the super efficiencies achieved by the UWUs when Model 2, which is output oriented, is solved. It needs to be mentioned that only 12 UWUs are analyzed by this model. Again, the UWUs are ordered according to the DEA-CCR scores, which do not always correspond to the scores obtained by the DEA-BCC model. In this model, the necessity for using variable return to scale becomes more obvious. As the unique output variable moves in a small range (from 77 to 91, as can be seen in Table 4), the differences among the input ranges have significant effects on the efficiencies. For instance, Coruña seems to be inefficient when DEA-CCR is used, but it becomes the most efficient UWU when DEA-BCC is employed. In fact, this water network has the highest output value (91), meaning that it presents the lowest water losses percentage (9%).
The efficient units, those with scores lower or equal to 100%, have been marked in bold in the table. If constant return to scale is considered, 25% of the UWUs result efficient; meanwhile, this percentage is 33% for contemplating variable return to scale. León, Albacete, and Palma de Mallorca clearly outperform regarding the sustainable efficiency, Leon being the UWU in which more inefficient units are projected, followed by Coruña in the case of DEA-BCC.
On the contrary, Madrid and Sevilla are the most inefficient ones when constant return to scale is considered and Alicante obtains the worst performance in the case of using variable return to scale. The scores of inefficient units quantify how much the outputs must increase radially to become efficient. For example, according to the score attained by the DEA-BCC model, Alicante should proportionally increase its output by 16.1%, i.e., from 77 to 77 + (77 × 0.16) = 89, and correspondingly reduce its water losses from 23% to 11%. Additionally, the analysis of the slacks reveals that inefficient UWUs are making an inadequate use of their investments.
The water utilities that publish their water losses usually present relatively good water losses percentages compared with the national average; in fact, while the Spanish water losses average is 22%, our sample group presents an average of 15%. As DEA measures relative efficiencies among a sample group, it needs to be mentioned that the inefficient UWUs according to the results presented here are inefficient inside a group of quite good utilities.
3.3. Comparison of Both Models
The two relative efficiencies obtained by the DEA-BCC models are scaled and plotted in Figure 4 in order to have a clearer overview of the UWUs performances. For instance, León presents a really good productivity since it is on the top of resource utilization efficiency ranking and on the sustainable efficiency ranking too. Another UWU that outperforms is Coruña, about which some comments have already been done. By analyzing the virtual inputs of León, we have discovered that the CAPEX is influencing on the good results of this UWU. The water utility of León had a CAPEX equal to 314 thousand € in 2019 and its water losses percentage was 14%.
On the opposite side, Alicante attains the worst results regarding the sustainable efficiency and is at the bottom of the resource utilization ranking. The study reveals that this water company should try to reduce its water losses, since it presents the highest water losses percentage of the group: 23%.
3.4. Discussion
The initial objectives of the study, which were described in the Introduction, have been satisfactorily fulfilled. A battery of 18 UWUs that operate in some of the most important Spanish cities has allowed performing a robust efficiency analysis. Regarding the sustainable analysis, it needs to be mentioned that collecting information on water losses has not been an easy task. Nevertheless, reliable data from 12 water utilities have made it possible to perform a valuable analysis.
The results of both models have revealed the suitability of using variable return to scale instead of constant return to scale. In the case of Model 2, it would be interesting to include some additional output variables that represent the sustainability of the UWU; for example, some parameters related to the energy recovery that are present in some water distribution networks.
4. Conclusions
The scientific novelty of the research lies in the performance of an efficiency analysis regarding the resource utilization of the most important water companies in Spain. In addition, the introduction of the water losses into the analysis has allowed evaluating the sustainable efficiency of the companies.
Urban water networks provide an essential service to society, public utilities management and efficiency being an actual trendy topic. The UWUs efficiency regarding the management and their concern about sustainability highly influence the waste of a valuable resource such as the water is and the tariff that the customers have to pay for its consumption. Furthermore, reducing the water losses as well as the water consumption is a key to facing the severe water shortage problem in Spain. This study addresses the first issue by evaluating the sustainable efficiency of companies in charge of the urban water network maintenance. Moreover, the weaknesses and potential aspects that the companies should improve are detected by the analysis of the resource utilization efficiency.
For the development of both analyses, data from the major urban water utilities in Spain have been recorded. Firstly, the resource management is evaluated, concluding that the cost of material needs to be revised since it seems to be a cause for inefficiency; however, it does not happen with the labor. Secondly, the sustainable efficiencies reveal the necessity of some utilities for reducing their losses as well as for making a better management of their investments.
As previously mentioned, public companies publish more data than private ones. However, they do not provide all the most relevant information (for example, regarding the leaks). If all companies committed to digitizing their networks and making the data collected public, this would allow a deeper and more detailed analysis of them. In consequence, more realistic measures to improve their efficiency could be stated.
Nevertheless, it is also a duty of the governments to support the digitalization of the sector [26]. Some examples of digitalization in this sector are the network sectorization to control flows and pressures, the installation of digital meters to have updated information about the water consumption, or the use of risk analysis methods [27]. Digitalization covers all the uses of digital technology to organize the operational processes and make them more efficient. In general, the service quality improves when companies are digitalized, because decision making is supported by more data that are constantly updated. Finally, these data are more beneficial when used in combination with mathematical models [28], as is the case of this study.
The key stockholders that can benefit from the results presented in this study are the analyzed companies. Moreover, other water companies can also compare the value of their variables with the ones of the most efficient UWUs of this study regarding the use of their resources and their sustainability. On the one hand, the most efficient urban water utility according to the resource management is the one located in Sevilla. On the other hand, the water distribution networks of León and Coruña outperform in terms of sustainable efficiency.
As future lines of research, we propose to expand the present study by:
- Analyzing data from public versus private management, since the research carried out by the authors show that there is a need for research on the efficiency analysis of the major urban water companies. For this purpose, data from private companies must be added to the study.
- Introducing data from sewer networks and wastewater plants in order to assess the sustainability of companies from a wider perspective.
Additionally, these analyses could be performed for the companies working in other countries, for example, using data from the major cities of different countries. The authors of this study would like to encourage companies to make more data available in order to ease future analyses.
Author Contributions
Conceptualization, A.R.-V., M.R.-P. and L.O.; methodology, A.R.-V., M.R.-P. and J.M.; software, A.R.-V. and M.R.-P.; validation, A.R.-V. and M.R.-P.; formal analysis, A.R.-V. and M.R.-P.; investigation, A.R.-V.; resources, M.R.-P.; data curation, M.R.-P.; writing—original draft preparation, A.R.-V.; writing—review and editing, J.M.; supervision, J.M.; project administration, L.O.; funding acquisition, L.O. All authors have read and agreed to the published version of the manuscript.
Funding
This research was funded by the Consejería de Economía, Conocimiento, Empresas y Universidad (Junta de Andalucía) and the European Regional Development Fund (ERDF), grant number PYC20-RE082 USE.
Informed Consent Statement
Not applicable.
Acknowledgments
The authors wish to acknowledge the Consejería de Economía, Conocimiento, Empresas y Universidad (Junta de Andalucía) and the European Regional Development Fund (ERDF) for their financial support through the Actuaciones de Transferencia UNIVERSIDADES-CEI-RIS3 of the project “Gestión de redes de abastecimiento y saneamiento de agua mediante técnicas de Inteligencia Artificial (GRIAL)”.
Conflicts of Interest
The authors declare no conflict of interest.
References
- United Nations Development Programme. Human Development Report 2019: Beyond Income, Beyond Averages, Beyond Today; United Nations Development Programme: New York, NY, USA, 2019. [Google Scholar]
- Picazo-Tadeo, A.J.; González-Gómez, F.; Fernandez, F.J.S. Accounting for operating environments in measuring water utilities’ managerial efficiency. Serv. Ind. J. 2009, 29, 761–773. [Google Scholar] [CrossRef]
- Suárez-Varela, M.; García-Valiñas, M.A.; González-Gómez, F.; Picazo-Tadeo, A.J. Ownership and Performance in Water Services Revisited: Does Private Management Really Outperform Public? Water Resour. Manag. 2017, 31, 2355–2373. [Google Scholar] [CrossRef]
- United Nations. Sustainable Development Goals. Available online: https://www.un.org/sustainabledevelopment/water-and-sanitation/ (accessed on 19 April 2022).
- Abbott, M.; Cohen, B. Productivity and efficiency in the water industry. Util. Policy 2009, 17, 233–244. [Google Scholar] [CrossRef]
- García-Valiñas, M.A.; Muñiz, M.A. Is DEA useful in the regulation of water utilities? A dynamic efficiency evaluation (a dynamic efficiency evaluation of water utilities). Appl. Econ. 2007, 39, 245–252. [Google Scholar] [CrossRef] [Green Version]
- Gidion, D.K.; Hong, J.; Adams, M.Z.; Khoveyni, M. Network DEA models for assessing urban water utility efficiency. Util. Policy 2019, 57, 48–58. [Google Scholar] [CrossRef]
- Lombardi, G.; Stefani, G.; Paci, A.; Becagli, C.; Miliacca, M.; Gastaldi, M.; Giannetti, B.; Almeida, C. The sustainability of the Italian water sector: An empirical analysis by DEA. J. Clean. Prod. 2019, 227, 1035–1043. [Google Scholar] [CrossRef]
- Hu, P.; Chen, N.; Li, Y.; Xie, Q. Efficiency Evaluation of Water Consumption in a Chinese Province-Level Region Based on Data Envelopment Analysis. Water 2018, 10, 793. [Google Scholar] [CrossRef] [Green Version]
- Song, M.; Wang, R.; Zeng, X. Water resources utilization efficiency and influence factors under environmental restrictions. J. Clean. Prod. 2018, 184, 611–621. [Google Scholar] [CrossRef]
- Romano, G.; Guerrini, A. Measuring and comparing the efficiency of water utility companies: A data envelopment analysis approach. Util. Policy 2011, 19, 202–209. [Google Scholar] [CrossRef]
- Singh, M.; Mittal, A.K.; Upadhyay, V. Efficient water utilities: Use of performance indicator system and data envelopment analysis. Water Supply 2014, 14, 787–794. [Google Scholar] [CrossRef]
- Dong, X.; Du, X.; Li, K.; Zeng, S.; Bledsoe, B.P. Benchmarking sustainability of urban water infrastructure systems in China. J. Clean. Prod. 2018, 170, 330–338. [Google Scholar] [CrossRef]
- Chen, C.-M.; Delmas, M.A. Measuring Eco-Inefficiency: A new frontier approach. Oper. Res. 2012, 60, 1064–1079. [Google Scholar] [CrossRef] [Green Version]
- Buafua, P.M. Efficiency of urban water supply in Sub-Saharan Africa: Do organization and regulation matter? Util. Policy 2015, 37, 13–22. [Google Scholar] [CrossRef]
- AEAS-AGA. XVI Estudio Nacional de Suministro de Agua Potable y Saneamiento en España 2020; AEAS-AGA: Madrid, Spain, 2020. [Google Scholar]
- Rodríguez-Palero, M.; Robles Velasco, A.; Barbadilla-Martín, E.; Ruiz, P.A.; Martín, J.G. Análisis económico y de tarifas del sector de aguas urbanas en España. In Proceedings of the 15th International Conference on Industrial Engineering and Industrial Management—XXV Congreso de Ingeniería de Organización, Burgos, Spain, 8–9 July 2021; pp. 205–206. [Google Scholar]
- AEAS-AGA. XV Estudio Nacional de Suministro de Agua Potable y Saneamiento en España; AEAS-AGA: Madrid, Spain, 2018; Available online: https://www.aeas.es/images/publicaciones/estudios-suministros/xv-notadeprensa.pdf (accessed on 20 February 2022).
- World Health Organization. Available online: https://www.who.int/data/gho (accessed on 7 March 2022).
- AEAS. XIV Estudio Nacional de Suministro de Agua Potable y Saneamiento en España; AEAS: Madrid, Spain, 2014; Available online: http://www.aeas.es/servlet/mgc?pg=ListNews&ret=next&news_id=1249&areaCode=publicarea&newsCategory=Noticias (accessed on 3 January 2019).
- INE. Estadística sobre el Suministro y Saneamiento del Agua; INE: Madrid, Spain, 2018. [Google Scholar]
- Charnes, A.; Cooper, W.W.; Rhodes, E. Measuring the efficiency of decision making units. Eur. J. Oper. Res. 1978, 2, 429–444. [Google Scholar] [CrossRef]
- Farrell, M.J. The Measurement of Productive Efficiency. J. R. Stat. Soc. Ser. A Gen. 1957, 120, 253–290. [Google Scholar] [CrossRef]
- Banker, R.D.; Charnes, A.; Cooper, W.W. Some Models for Estimating Technical and Scale Inefficiencies in Data Envelopment Analysis. Manag. Sci. 1984, 30, 1078–1092. [Google Scholar] [CrossRef] [Green Version]
- Bureau van Dijk. SABI: Sistema de Análisis de Balances Ibéricos. Available online: https://0-sabi-bvdinfo-com.brum.beds.ac.uk/version-2022221/home.serv?product=sabineo& (accessed on 1 February 2022).
- Khalid, B.; Naumova, E. Digital transformation SCM in view of Covid-19 from Thailand SMEs perspective. Glob. Chall. Digit. Transform. Mark. 2021, 2021, 49–66. [Google Scholar]
- Pietrucha-Urbanik, K.; Rak, J. Consumers’ Perceptions of the Supply of Tap Water in Crisis Situations. Energies 2020, 13, 3617. [Google Scholar] [CrossRef]
- Barykin, S.Y.; Kapustina, I.V.; Sergeev, S.M.; Kalinina, O.V.; Vilken, V.V.; de la Poza, E.; Putikhin, Y.Y.; Volkova, L.V. Developing the physical distribution digital twin model within the trade network. Acad. Strateg. Manag. J. 2021, 20, 1–18. [Google Scholar]
Figure 1.
Average percentage of water losses in Spain from 1992 to 2018. Data source: AEAS-AGA [18].
Figure 1.
Average percentage of water losses in Spain from 1992 to 2018. Data source: AEAS-AGA [18].

Figure 2.
Population served by the water companies analyzed. Source: water companies’ websites.

Figure 3.
Scheme of the proposed models.

Figure 4.
Representation of both scaled efficiencies for the 12 UWUs whose sustainable efficiency is calculated.
Figure 4.
Representation of both scaled efficiencies for the 12 UWUs whose sustainable efficiency is calculated.


Table 1.
List of references using DEA models to analyze the efficiency of the water industry.
| Reference | Case study | No. DMUs | Methodology | |
|---|---|---|---|---|
| [6] | García-Valiñas and Muñiz (2007) | Spain, 1985–2000 | 3 | DEA-CCR |
| [2] | Picazo-Tadeo et al., (2009) | Spain, 2001 | 34 | DEA-BCC and SFA |
| [11] | Romano and Guerrini (2011) | Italy, 2007 | 43 | DEA-CCR and BCC |
| [12] | M. Singh et al., (2014) | India, 2005 | 13 | DEA-CCR |
| [3] | Suárez-Varela et al., (2017) | Spain, 2013 | 77 | DEA and others |
| [9] | Hu et al., (2018) | China, 2014 | 31 * | Adaptation of DEA-CCR |
| [10] | Song et al., (2018) | China, 2006–2015 | 30 * | DEA |
| [13] | Dong et al., (2018) | China, 2014 | 157 * | DEA-BCC |
| [8] | Lombardi et al., (2019) | Italy, 2011–2013 | 68 | DEA-CCR and BCC |
| [7] | Gidion et al., (2019) | Tanzania, 2014–2015 | 40 | Network DEA-BCC |
* The DMUs of these references are regions instead of urban water utilities.
Table 2.
Inputs and outputs used in the studies presented in Table 1.
Table 2.
Inputs and outputs used in the studies presented in Table 1.
| Ref. | Orientation | Inputs (Number: Description) | Outputs (Number: Description) |
|---|---|---|---|
| [6] | Input | 2: Operational costs and density of rainfall | 3: WDN length, water supplied, and population served |
| [2] | Input | 4: WDN length, WSN length, labor, and operational costs | 3: Water supplied, collected, and treated wastewater |
| [11] | Input | 4: Cost of material, labor, services, and leases | 2: Water supplied and population served |
| [12] | Input | 2: Expenditure and labor | 2: Water supplied and no. connections |
| [3] | Input | 3: WDN length, labor, and operational costs | 2: Water supplied and population served |
| [9] | Radial (ratio model) | 5: Domestic water cons., industrial water cons., agricultural water cons., fixed assets, and labor | 2: GDP 3 and COD 4 |
| [10] | Output | 3: Fixed asset investment, labor, and water cons. | 2: GDP 3 and COD 4 |
| [13] | Input | 7: Fixed asset investment (WTP 1), fixed asset investment (WWTP 2), WDN length, WSN length, WDN elect. cons., WWTP elect. cons., and sludge production | 5: Water supplied, wastewater treated, COD 4, suspended solids removed, and nitrogen removed |
| [8] | Input and Output | 5: Capital expenditure, cost of material, labor, services, and leases | 3: WDN length, water supplied, and % of water delivered |
| [7] | N.M. 5 | 3: Percentage of non-revenue water, labor costs, and labor per connections. | 3: Population served, service continuity, and no. connections. |
1 WTP–Water Treatment Plants; 2 WWTP–Wastewater Treatment Plants; 3 GDP–Gross Domestic Product; 4 COD–Chemical Oxygen Demand; 5 N.M.–Non-Mentioned.
Table 3.
Definition of potential variables.
| Variable | Description |
|---|---|
| xLEN | Total length of the water distribution network |
| xCAPEX | Capital expenditure |
| xCOST | Cost of material |
| xLABOR | Number of employees or staff |
| xPOP | Population served |
| xWDEL | Volume of treated water delivered |
| x% | Percentage of water delivered (1% of water losses or non-registered water) |
Table 4.
Descriptive statistics of the variables.
| Variable | Units | No. Samples | Mean | Std | Min | Max |
|---|---|---|---|---|---|---|
| xLEN | km | 18 | 2376 | 3901 | 54 | 17,699 |
| xCAPEX | 103 € | 18 | 10,800 | 15,339 | −3623 | 58,036 |
| xCOST | 103 € | 18 | 31,878 | 57,470 | 410 | 209,054 |
| xLABOR | persons | 18 | 494 | 692 | 30 | 2924 |
| xPOP | persons | 18 | 861,584 | 1,513,735 | 70,000 | 6,556,593 |
| xWDEL | 103 m3 | 16 | 68,147 | 116,932 | 10,257 | 488,270 |
| x% | % | 12 | 85 | 4 | 77 | 91 |
Table 5.
Definition of DEA input and output variables.
| Model and DEA-Technology | Inputs | Outputs |
|---|---|---|
| Model 1 (input-oriented) | xLEN xCAPEX xLABOR xCOST | yPOP yWDEL |
| Model 2 (output-oriented) | xLEN xPOP xWDEL xCAPEX | y% |
Table 6.
Resource utilization efficiencies according to Model 1.
| UWU | DEA-CCR | DEA-BCC | Ranking | |
|---|---|---|---|---|
| DEA-CCR | DEA-BCC | |||
| Sevilla | 136.1% | 869.9% | 1 | 1 |
| León | 130.6% | 393.7% | 2 | 4 |
| Coruña | 125.4% | 134.6% | 3 | 6 |
| Gipuzkoa | 100.0% | 832.1% | 4 | 2 |
| Palma de Mallorca | 100.0% | 100.0% | 5 | 9 |
| Cuenca | 100.0% | 690.0% | 6 | 3 |
| Burgos | 96.4% | 99.1% | 7 | 11 |
| Álava | 85.9% | 88.2% | 8 | 13 |
| Barcelona | 83.7% | 157.9% | 9 | 5 |
| Madrid | 79.5% | 100.0% | 10 | 10 |
| Granada | 76.6% | 102.2% | 11 | 8 |
| Murcia | 76.3% | 113.9% | 12 | 7 |
| Albacete | 73.5% | 75.0% | 13 | 15 |
| Gijon | 62.7% | 65.4% | 14 | 16 |
| Alicante | 53.8% | 85.5% | 15 | 14 |
| Málaga | 51.4% | 93.5% | 16 | 12 |
| Córdoba | 49.7% | 59.4% | 17 | 17 |
| Pamplona | 25.4% | 28.9% | 18 | 18 |
Table 7.
Sustainable efficiencies according to Model 2.
| UWU | DEA-CCR | DEA-BCC | Rankings | |
|---|---|---|---|---|
| DEA-CCR | DEA-BCC | |||
| León | 47.4% | 100.0% | 1 | 2 |
| Albacete | 80.9% | 100.0% | 2 | 3 |
| Palma de Mallorca | 100.0% | 100.0% | 3 | 4 |
| Burgos | 118.9% | 101.3% | 4 | 6 |
| Álava | 132.4% | 100.8% | 5 | 5 |
| Coruña | 142.2% | 95.4% | 6 | 1 |
| Gijon | 161.6% | 102.3% | 7 | 9 |
| Córdoba | 179.4% | 101.4% | 8 | 8 |
| Pamplona | 208.8% | 101.3% | 9 | 7 |
| Alicante | 278.3% | 116.1% | 10 | 12 |
| Sevilla | 644.8% | 103.8% | 11 | 10 |
| Madrid | 3764.6% | 105.4% | 12 | 11 |
Publisher’s Note: MDPI stays neutral with regard to jurisdictional claims in published maps and institutional affiliations. |
© 2022 by the authors. Licensee MDPI, Basel, Switzerland. This article is an open access article distributed under the terms and conditions of the Creative Commons Attribution (CC BY) license (https://creativecommons.org/licenses/by/4.0/).
Share and Cite
MDPI and ACS Style
Robles-Velasco, A.; Rodríguez-Palero, M.; Muñuzuri, J.; Onieva, L. Sustainable Development and Efficiency Analysis of the Major Urban Water Utilities in Spain. Water 2022, 14, 1519. https://0-doi-org.brum.beds.ac.uk/10.3390/w14091519
AMA Style
Robles-Velasco A, Rodríguez-Palero M, Muñuzuri J, Onieva L. Sustainable Development and Efficiency Analysis of the Major Urban Water Utilities in Spain. Water. 2022; 14(9):1519. https://0-doi-org.brum.beds.ac.uk/10.3390/w14091519
Chicago/Turabian StyleRobles-Velasco, Alicia, María Rodríguez-Palero, Jesús Muñuzuri, and Luis Onieva. 2022. "Sustainable Development and Efficiency Analysis of the Major Urban Water Utilities in Spain" Water 14, no. 9: 1519. https://0-doi-org.brum.beds.ac.uk/10.3390/w14091519
Note that from the first issue of 2016, this journal uses article numbers instead of page numbers. See further details here.