2.1. Adjacent Streams and Aquifers
In order to assess how far U is present in water and sediment of the study area, a screening survey was conducted. Apart from sampling the GMB peatland itself this also included samples taken from adjacent rivers and aquifers as potential pathways for surface or underground transport of U into the wetland. Grab samples of water have a very limited temporal representivity, given the highly dynamic nature of U pollution. Where possible the obtained results were, therefore, compared to existing secondary data (
Table 1).
Table 1.
Uranium (U) concentrations in stream water of the Wonderfonteinspruit (WFS), Mooi River and groundwater from the Boskop-Turffontein Compartment as found in a screening survey (‘own data’) in comparison to other studies (n—number of samples; av.—average weighted according to underlying number of samples; min.—minimum, max.—maximum).
The spatial distribution of above U levels is shown in
Figure 1.
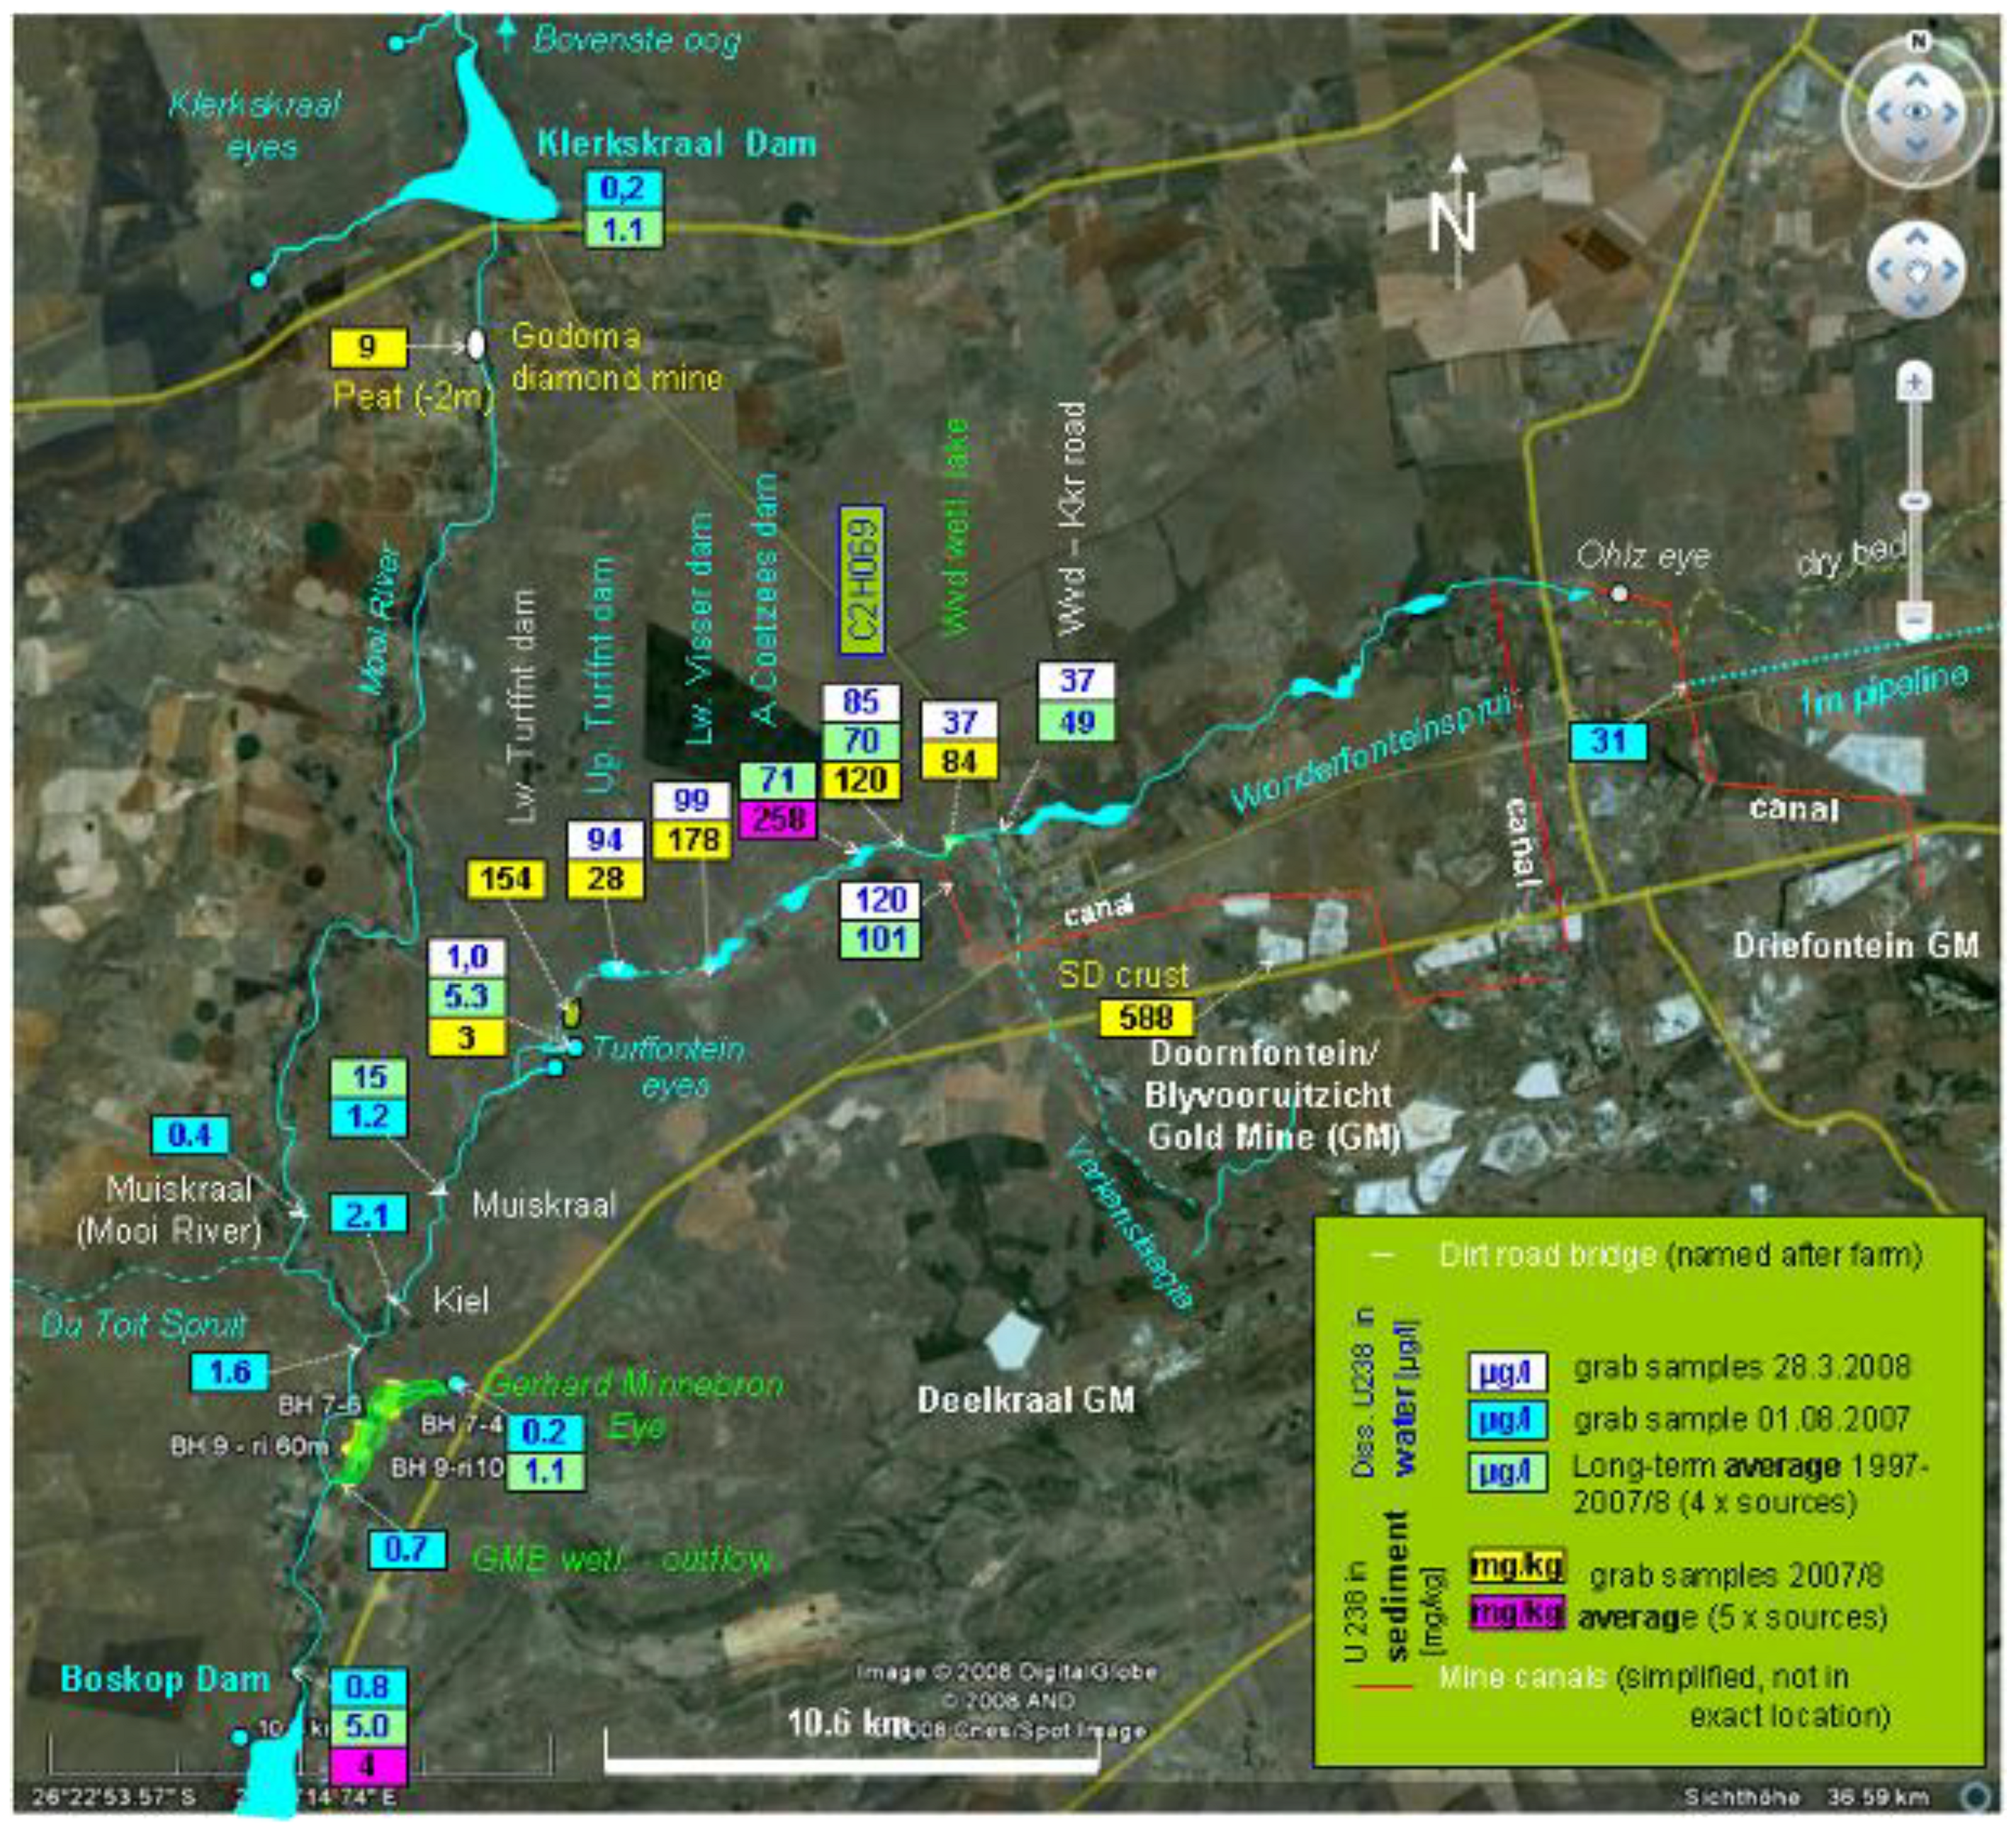
Figure 1.
Uranium (U) concentration in water and sediments in and around the Gerhard Minnebron wetland as found in different studies (map based on satellite image of the study area as retrieved from Google Earth).
Figure 1.
Uranium (U) concentration in water and sediments in and around the Gerhard Minnebron wetland as found in different studies (map based on satellite image of the study area as retrieved from Google Earth).
Table 1 shows that most of the screening data fall within the range of U concentration values found by other analyses conducted between 1997 and 2008. Compared to the most recent data [
2,
3] (while ignoring the older data [
1]) the screening results appear to be an order of magnitude lower than the calculated averages (especially at low-concentration sites such as Boskop Dam, GMB Eye, Mooi River upstream of confluence with the WFS, the WFS at Muiskraal bridge and the Turffontein Eye) illustrating the considerable fluctuations of U levels in surface water. However, most screening values fall at least into the min-max. range measured for the respective sampling sites. Using the U levels in the WFS at Muiskraal bridge (DWA station C2H161) as found in three different studies, as an example the temporal fluctuations of in-stream U concentration are displayed in
Figure 2.
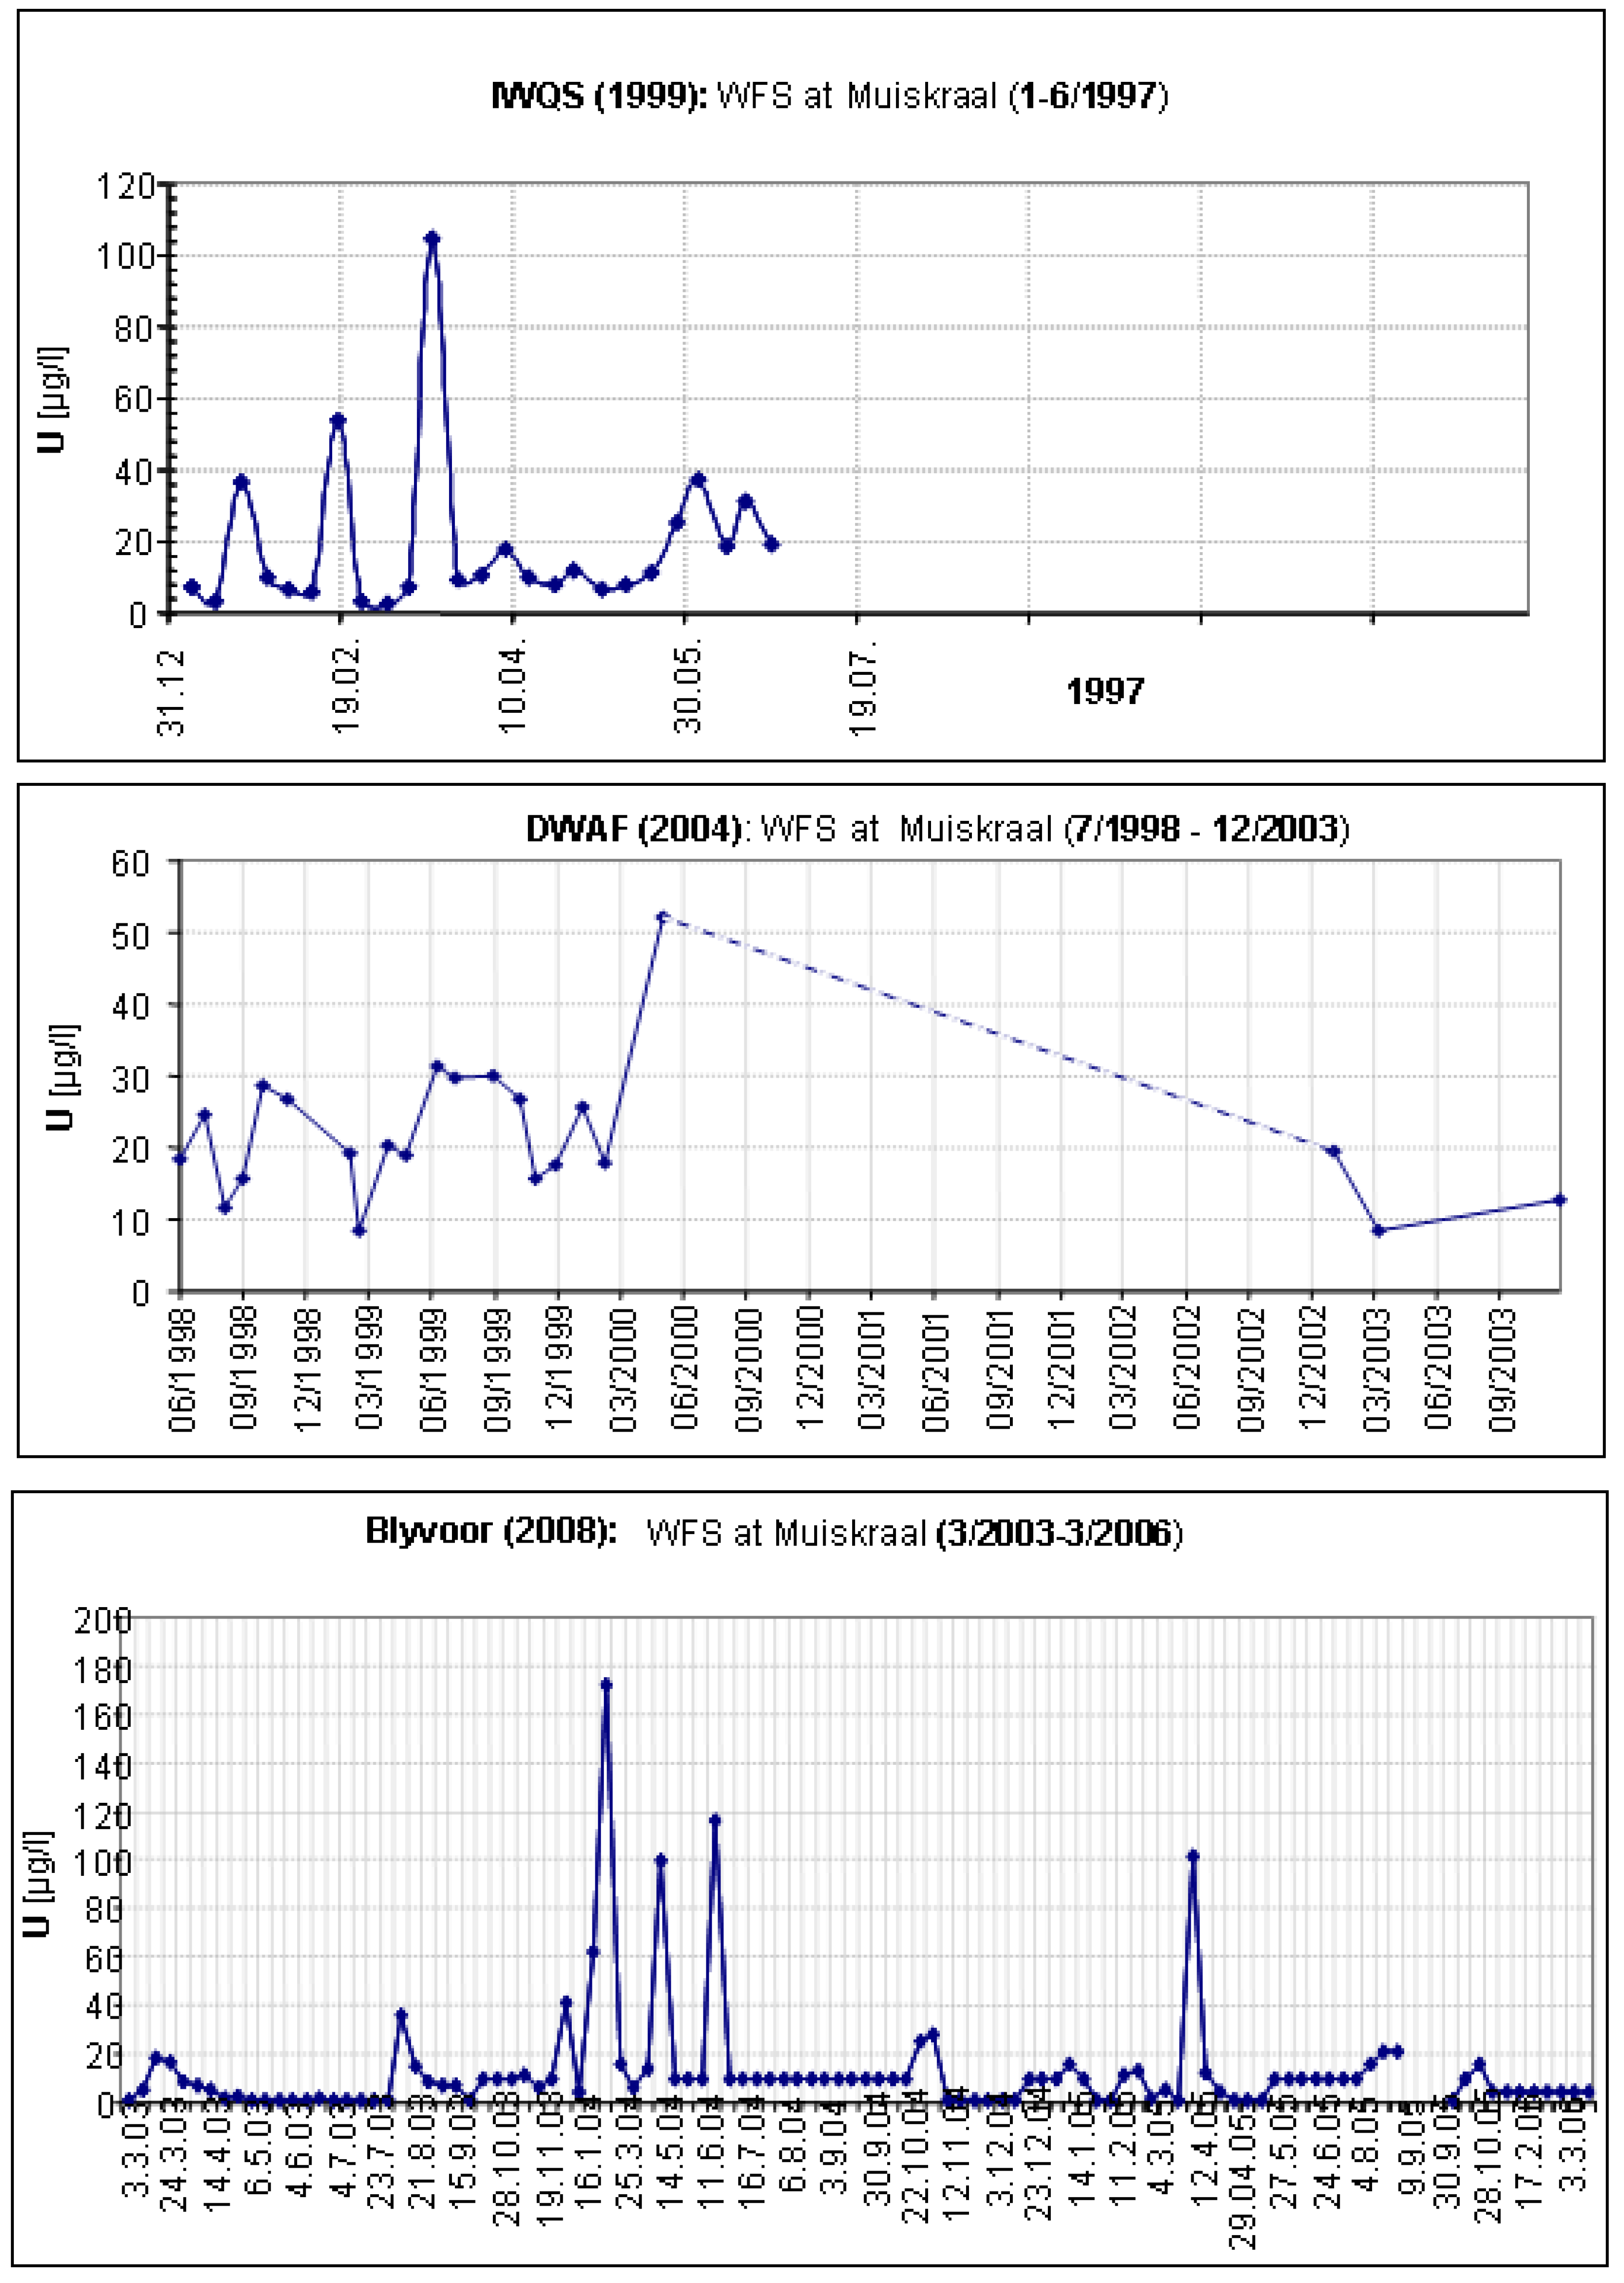
Figure 2.
Dynamic of U concentration of exfiltrating groundwater (baseflow feeding the lower WFS at Muiskraal bridge) as found in three different studies between January 1997 and March 2006 (DWA code of Muiskraal bridge: C2H161; Data sources: [
1,
2,
3]).
Figure 2.
Dynamic of U concentration of exfiltrating groundwater (baseflow feeding the lower WFS at Muiskraal bridge) as found in three different studies between January 1997 and March 2006 (DWA code of Muiskraal bridge: C2H161; Data sources: [
1,
2,
3]).
A max/min-ratio of 172 (
Table 1) illustrates the large extent by which U levels may fluctuate even in a comparatively low energy reach, which is mainly fed by a continuous flow of spring water and baseflow. Compared to ratios in the WFS (222-2830,
Table 1), however, this is still relatively low. The much higher amplitude of U fluctuations in the WFS reflects the dynamic nature of U pollution caused by, among others, day-night pumping regimes of gold mines, rain events, sporadic spills as well as diurnal oscillations of (quasi-natural) U immobilization [
4,
5]. Compared to the WFS, U levels in the upper Mooi River are significantly less variable even though the maximum U concentration is still more than 100-times higher than the minimum (
Table 1). Since highly fluctuating U levels seem to be associated with known (mining-related) U pollution (nearly pristine streams exhibit much lower amplitudes of U fluctuations) it should be explored how far the variability of U levels, rather than only averages, could be used as an (additional) indicator for anthropogenic pollution. For the GMB eye, for example, with a max.-min. ratio of 1,200 (
i.e., close to the amplitude observed in the WFS and an order of magnitude higher than in the unpolluted Mooi River) this would suggest the presence of anthropogenic U contamination, in spite of the relatively low absolute U levels.
Survey data in
Table 1 indicate that the WFS (before it dries up upstream of the Turffontein springs) displays elevated U levels in stream water ranging from 31 µg/L (at the end of 1 m pipeline) to 99 µg/L (at the lower Visser Dam) (
Figure 1). Long-term monitoring data for this reach show even higher U levels reaching peaks of up to 220 µg/L in 1997. It also appears that U levels increase significantly after the WFS receives mining effluents from the Doornfontein/Blyvooruitzicht gold mine containing 120 µg/L U (8–360 µg/L) via the Blyvooruitzicht canal (
Table 1). Exceptionally high U concentrations in sediments of the A Coetzee Dam detected by several studies [
6,
7,
8,
9] were mainly attributed to the latter discharge [
7]. While the pollution levels of sediments in this dam (reaching several hundred mg/kg U) drew much attention, several dams located further downstream have so far been largely ignored, especially the lower Visser dam and the upper and lower Turffontein dams (
Figure 1). Since April 2003, when the average stream flow in the WFS at C2H069 dropped from around 60 ML/d to some 20 ML/d, remaining more or less at this level ever since, these dams have only sporadically be filled following isolated storm events with high runoff volumes. Sediment sampled from the lower Turffontein dam, which is only filled in very exceptional cases and often acts as final reservoir where the first flush water is collected, showed a significantly elevated U concentration of 154 mg/kg. This suggests that the sporadic runoff events flush significant amounts of U from mining-related sources in the stormwater catchment downstream. This is supported by flood water that collected in the upper Turffontein dam after series of intense rainfall events in February–March, 2008, containing 94 µg/L U (
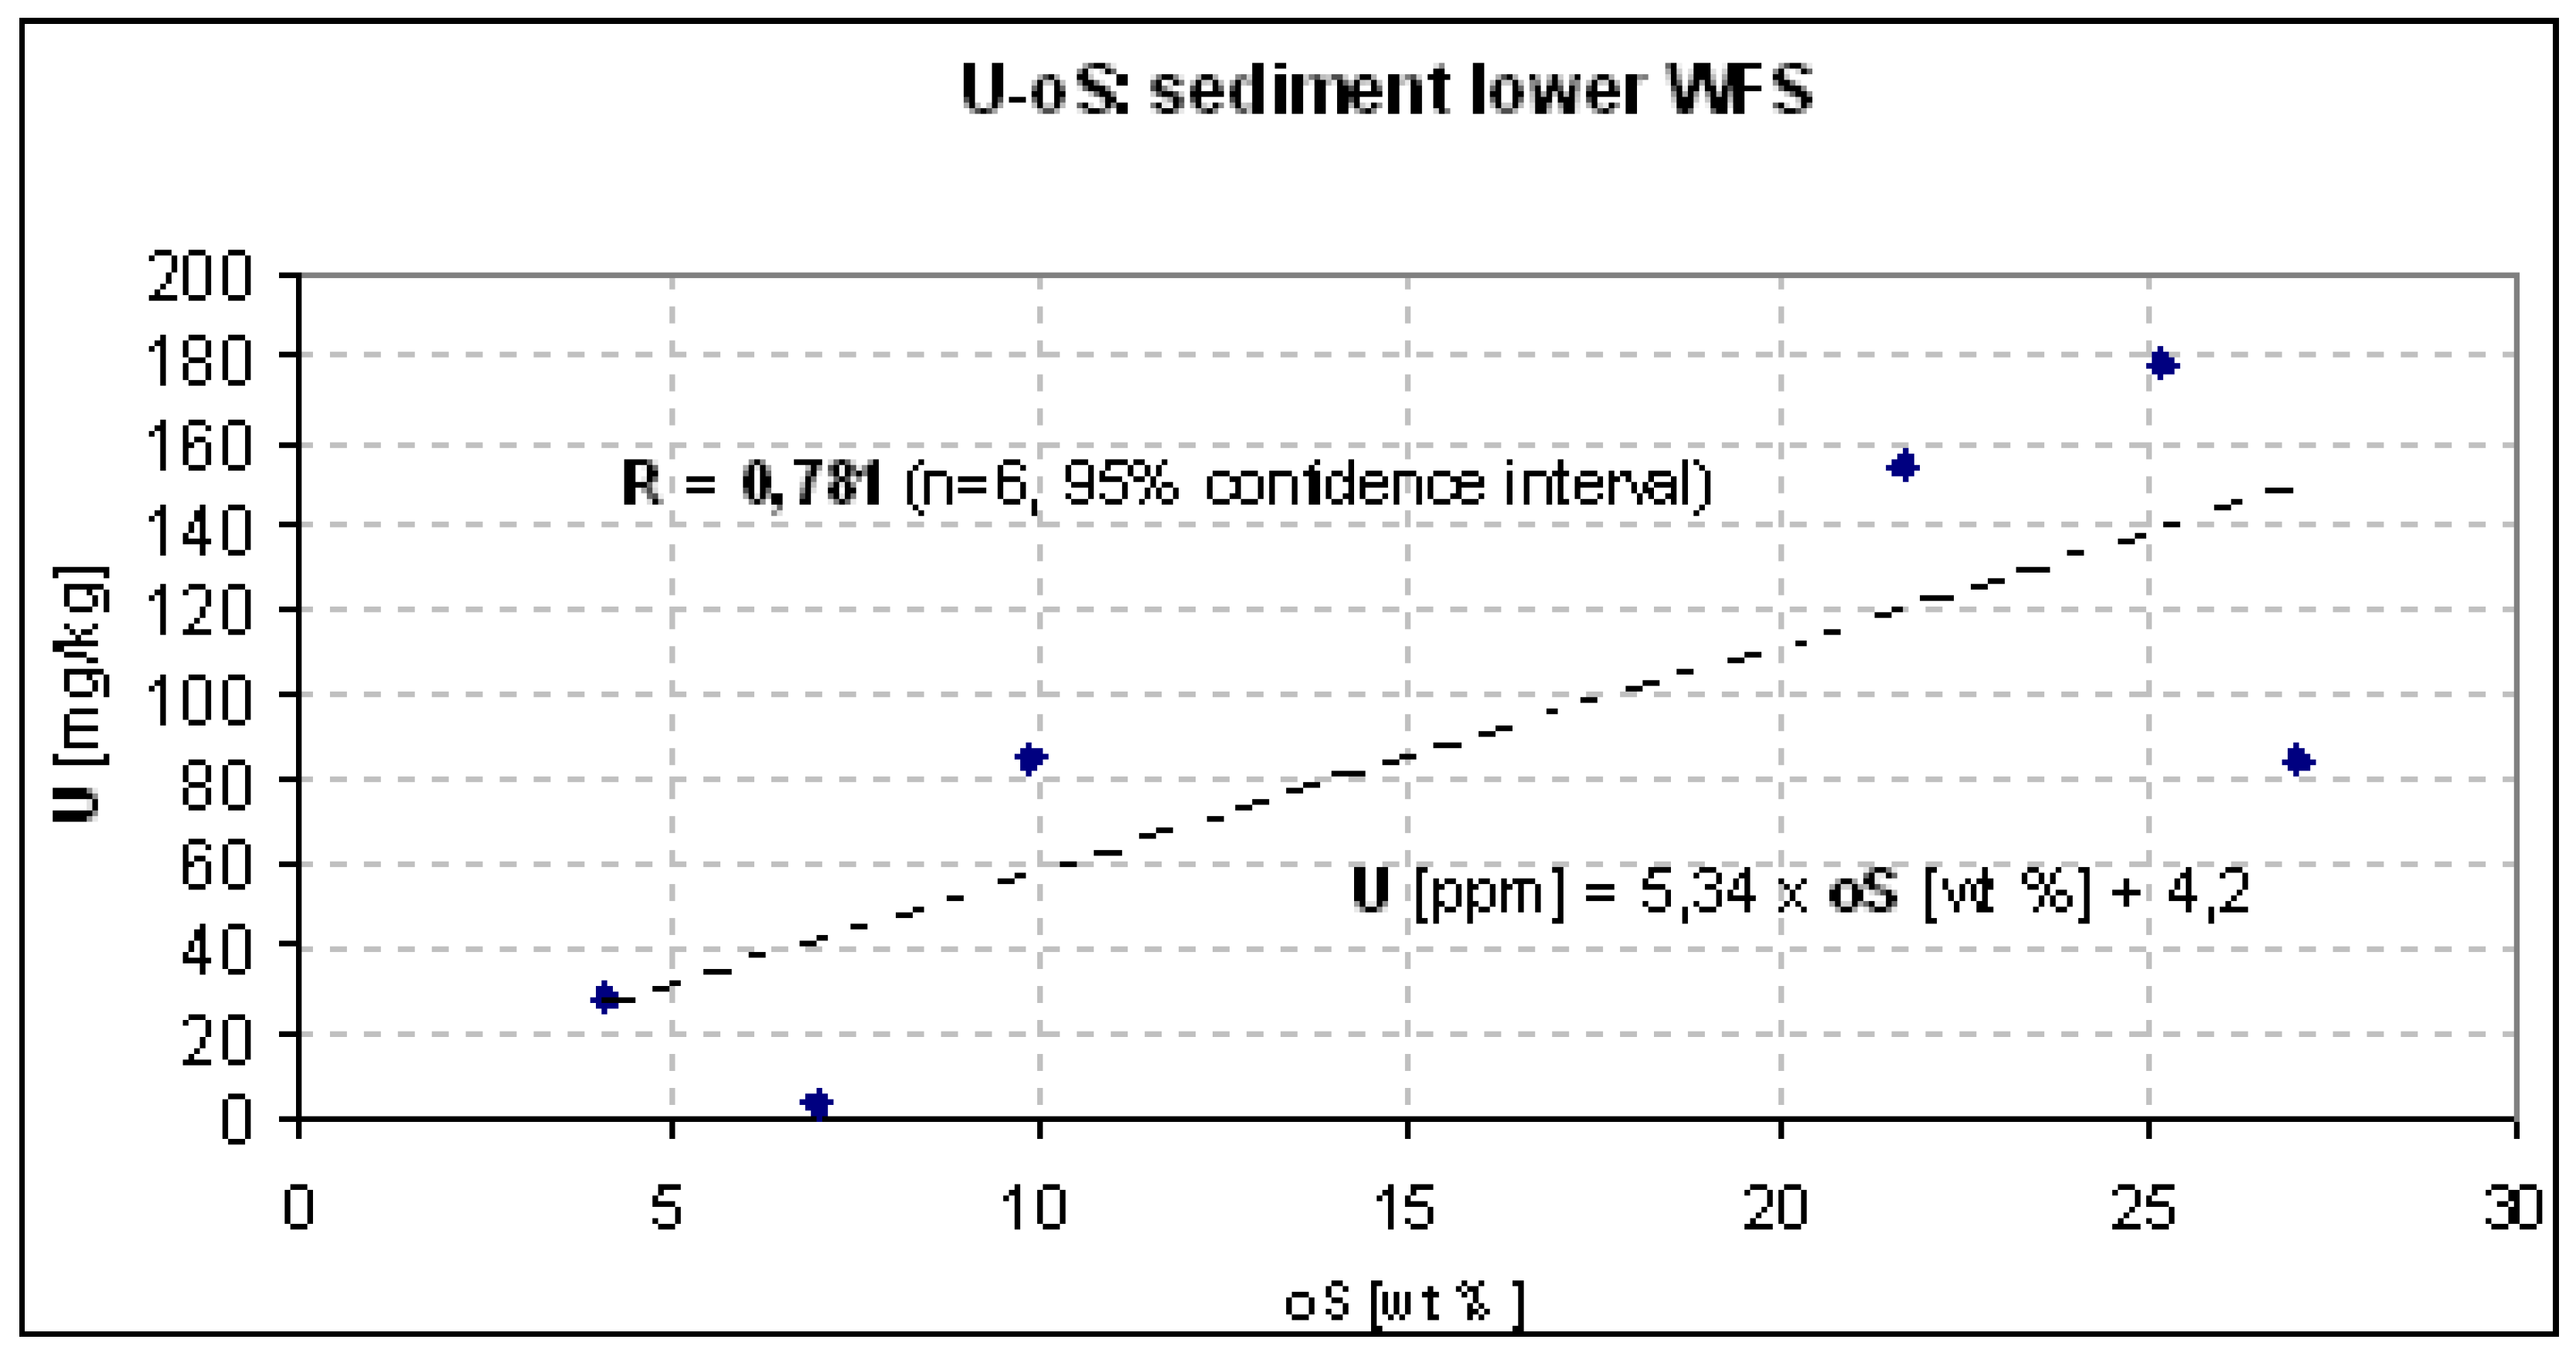
Figure 1). The comparatively low corresponding U concentration of 22 mg/kg in the upper Turffontein dam is somewhat misleading as this sediment sample contained exceptionally low levels of organic substances that (for fluvial sediments from the stream bed of the WFS) was found to positively correlate with U (
Figure 3).
Figure 3.
Relationship between the concentration of U and organic substance in sediments of the WFS stream bed (correlation coefficient, r2 = 0.781).
Figure 3.
Relationship between the concentration of U and organic substance in sediments of the WFS stream bed (correlation coefficient, r2 = 0.781).
Normalized for the organic contents, this sediment sample results in an U level of 150 mg/kg comparable to those in sediments of the dams up- and downstream from the site.
Much lower U levels occur in water of the lowest part of the WFS where flow resumes only due to the inflow of spring water from the two Turffontein springs (upper and lower eye) (
Figure 1). While the spring water sampled during the screening survey only displays a slightly elevated U level (1 µg/L) the U concentration more than doubles while the water flows towards the confluence with the Mooi River, where it reaches 2.1 µg/L. Based on longer-term average data compiled in
Table 1, the U level even triples (from 5.1 µg/L at the Tfnt. eye to 15 µg/L instream at the Muiskraal bridge). Since no surface water inflow occurs between the Turffontein springs and the confluence with the Mooi River this increase is only attributable to exfiltrating groundwater (baseflow) feeding into the stream from the underlying karst aquifer (Boskop-Turffontein Compartment, BTC). The fact that such baseflow obviously increases the U concentration indicates that the groundwater downstream of the Turffontein eyes shows higher U levels than the spring water, even though both waters originate from the same dolomitic compartment. While U levels in sediments deposited right at the eye are close to the global average of the continental crusts they are somewhat higher than typically found in the region. This reflects the low, but still higher than natural, U input at the eye (
Figure 1).
The low U levels found in the upper Mooi River are to be expected, as the stream is presumed to be unaffected by gold mining activities. One should, however, be cognisant of the fact that the long-term average U concentration of 1.1 µg/L in the upper Mooi River is almost three-times above the global natural background for freshwater. The measured maximal U concentration of 11 µg/L is almost two orders of magnitude higher (
Table 1). In this context it is to be noted that peat sampled 2 m below surface at a diamond mine operating in the stream bed a few hundred meters downstream of Klerkskraal dam (
i.e., well above the confluence area) also showed an elevated U level of 9 mg/kg (n = 3; 6–12 mg/kg), perhaps reflecting the slightly elevated natural U level in the stream. The increase from 0.2 µg/L of water in Klerkskraal dam to 0.4 µg/L just above the confluence with the WFS, observed in the survey, indicates some U input along this reach that could perhaps be related to polluted baseflow feeding the lower WFS. Since the stream channel of the Mooi River also intersects the groundwater table at the confluence zone, some of the (polluted) baseflow may find its way into the Mooi River too. After receiving water from the lower WFS the U level of the Mooi River increases four-fold to 1.6 µg/L. Receiving relatively large volumes of low U containing water from the GMB wetland (0.7 µg/L) further downstream the U level in the Mooi River finally drops to 0.8 µg/L at the inflow into Boskop Dam. However, comparing our screening results with the long-term monitoring data (
Table 1) indicates that the average U concentration is almost an order of magnitude higher (5.0 µg/L) (
Figure 1).
2.2. U levels in the GMB Wetland: Water
U levels found in different waters of the GMB wetland are displayed in
Figure 4.
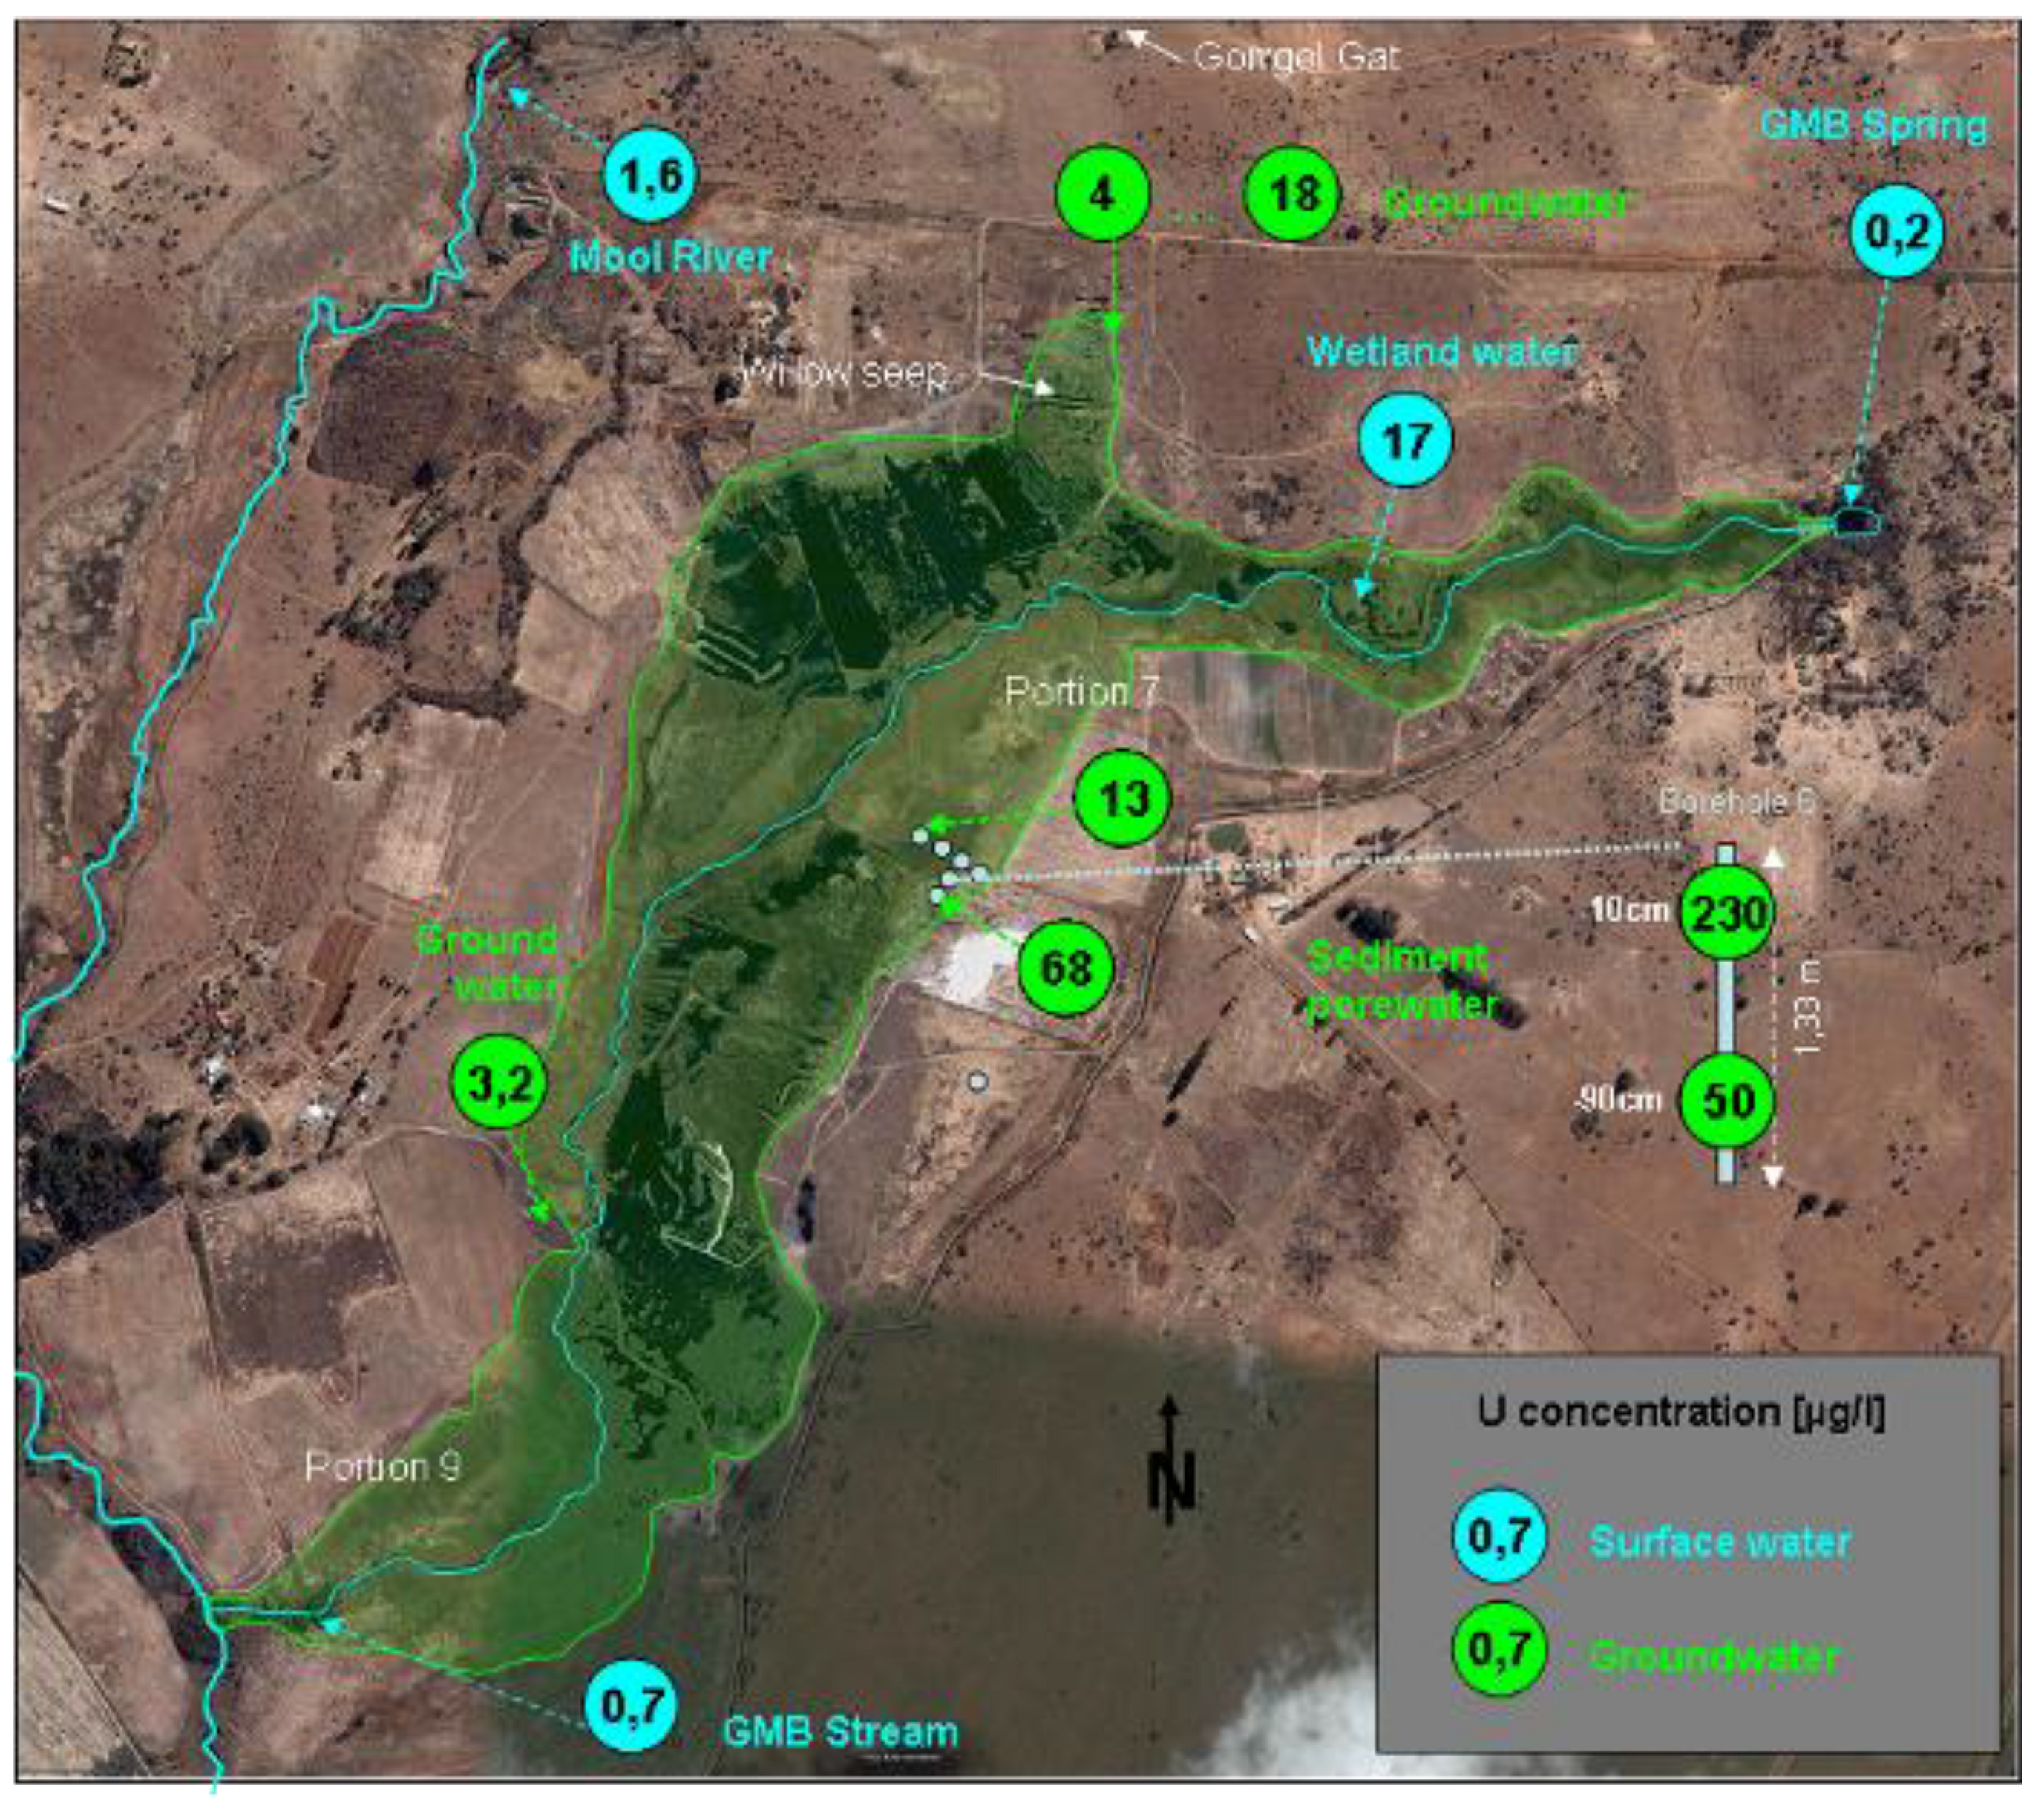
Figure 4.
U concentration in surface- and groundwater from the Gerhard Minnebron wetland as found in a screening survey (grab sampling) (map based on satellite image of the study area as retrieved from Google Earth).
Figure 4.
U concentration in surface- and groundwater from the Gerhard Minnebron wetland as found in a screening survey (grab sampling) (map based on satellite image of the study area as retrieved from Google Earth).
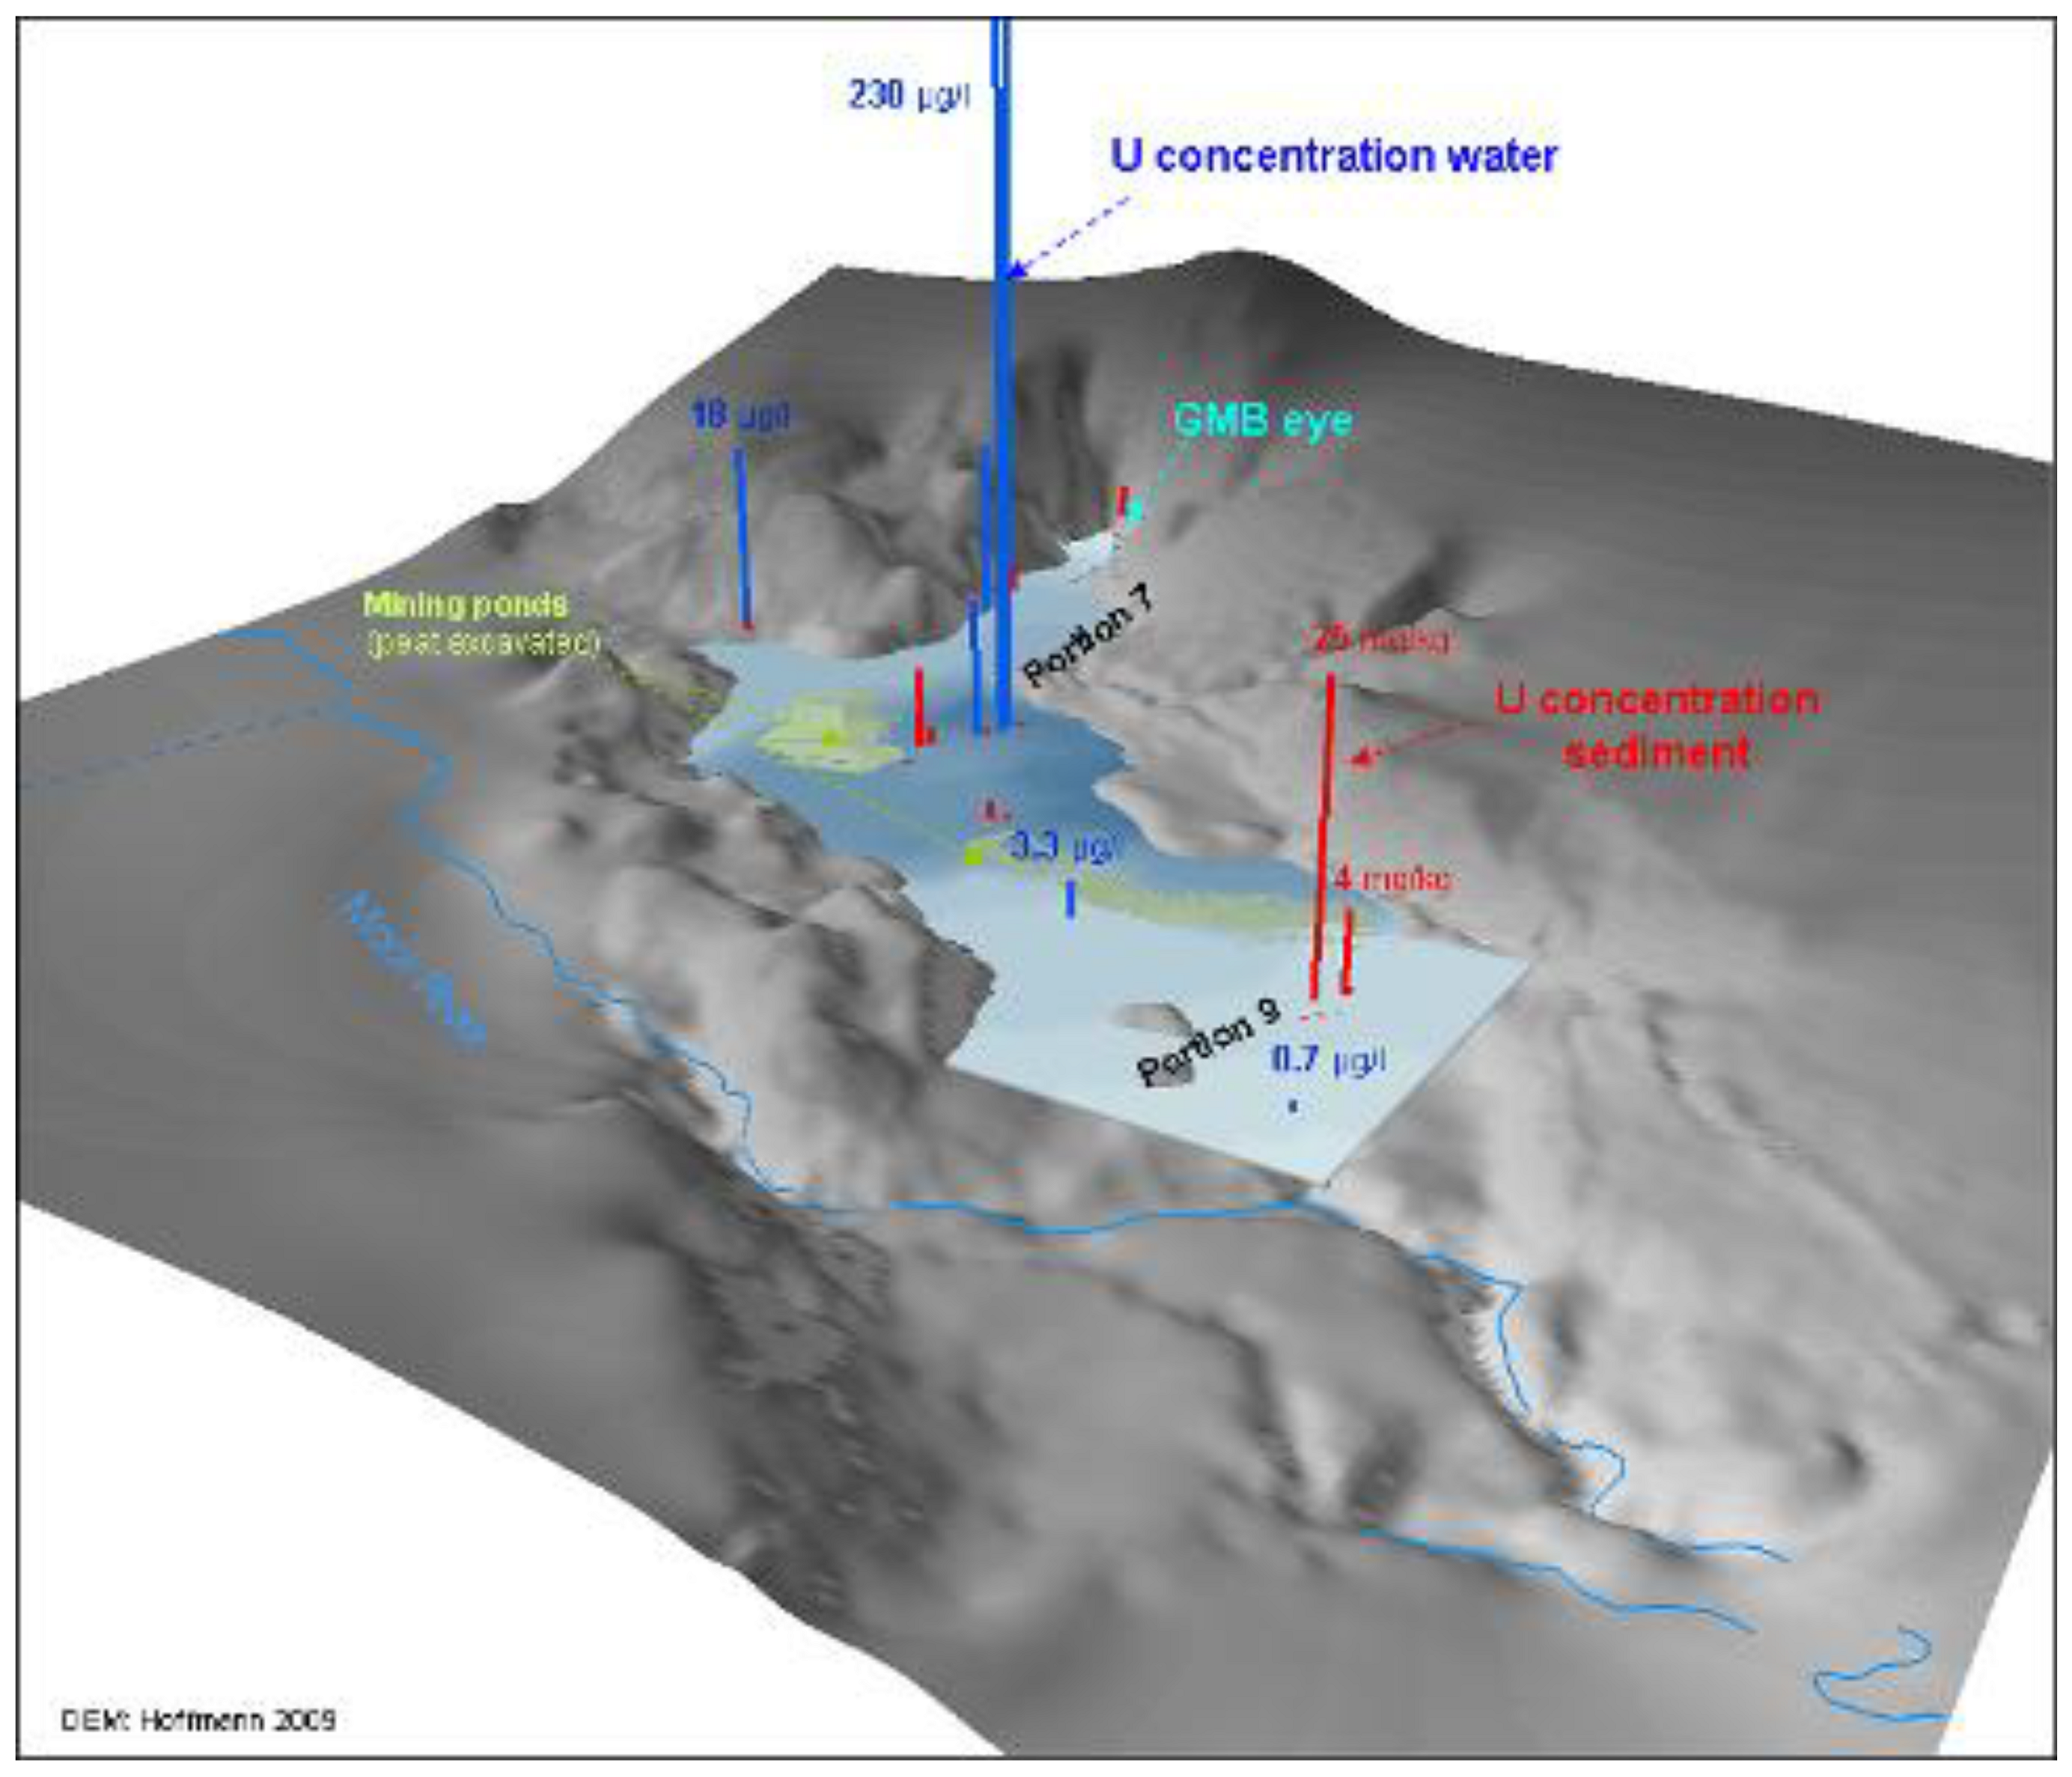
Figure 4 indicates that water flowing from the eye at the day of sampling showed U levels at natural background (0.2 µg/L) and increased to 0.7 µg/L after having flown through the peatland. While this may not appear to be much in terms of the absolute concentration change it does require a significant U input since the flow volume simultaneously increases between 5- and 10-fold from the eye to the outflow. Based on the associated U loads, this means that up to 35-times more U flows out of the wetland than it receives from the spring (2 g/d at the eye compared to 35–70 g/d U, respectively, at the outflow depending on t flow rate).
The earlier mentioned inflow of polluted groundwater displaying U levels from 3 µg/L to 230 µg/L is the most probable source of this U. The highest U concentrations are reached in boreholes sampled at portion 7 immediately upstream of the Middleground peat mining pond, where shallow alluvial groundwater displays an average of 90 µg/L (n = 4; 13–230 µg/L). Comparing near surface water (10 cm below surface) with deeper groundwater (90 cm below surface) a distinct vertical U gradient was found with U concentrations decreasing with depth (
Figure 4). To what extent this points to a concentration effect caused by evaporation, or to a possible stratification of the plume moving into the wetland or the dissolution of surface salt crusts on the sediments, needs to be determined. Horizontally, the maximal U concentration was reached in boreholes closest to the edge of the wetland, decreasing towards the GMB stream in the center. This gradient confirms that U migrates into the wetland from an unknown source outside the wetland. Less high, but still somewhat elevated U levels were found in the upper part of the GMB wetland just below the dam wall where polluted groundwater was found to migrate into the wetland from the right-hand side. While U levels of groundwater collecting in nearby depressions and trenches ranges from 4 to 18 µg/L the shallow surface water in the wetland itself sampled next to the right bank displayed 17 µg/L compared to 0.2 µg/L in the eye (
Figure 4). A possible source of this pollution is polluted groundwater feeding into the WFS upstream of the Muiskraal bridge that may arrive via underground karst channels. According to residents at GMB such subsurface water influx is audible during high-flow conditions at a site known as ‘Gorrgel Gat’—(Afrikaans for gurgling hole) located approximately halfway between the Willow Seep and the Mooi River-WFS confluence (
Figure 4).
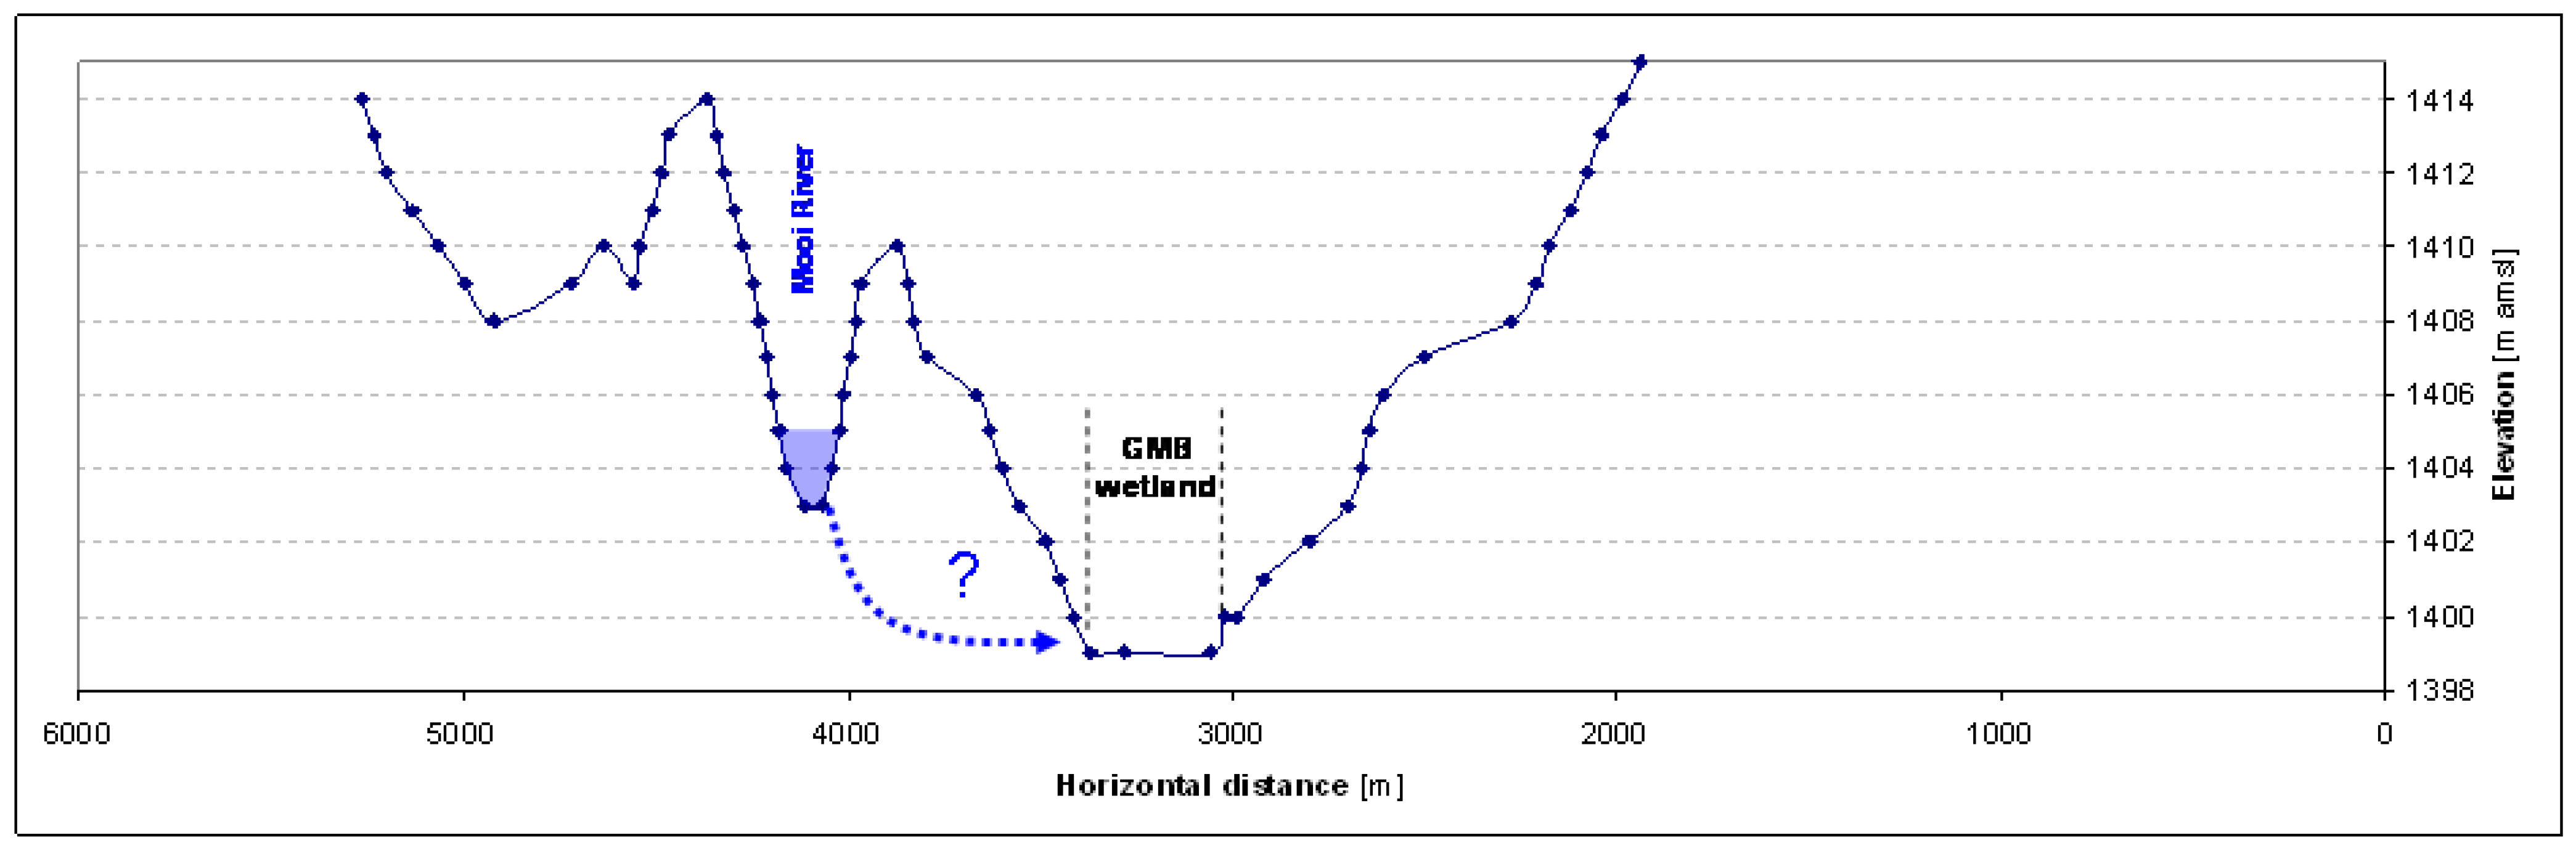
With some 3 µg/L the detected groundwater inflow at portion 9 showed the lowest U level of all three inflow sites. The relative low U level and the fact that a hydraulic gradient exists between the stream channel of the adjacent Mooi River and the lower lying wetland (
Figure 5) suggest that such influx may be fed by bed loss from the Mooi River, possibly concentrated in the wetland through subsequent evaporation.
Figure 5.
Relief cross section indicating a hydraulic gradient between the upper Mooi River and the lower part of the GMB wetland that may possibly drive subterraneous bed loss from the Mooi River into the wetland (100-times vertical exaggeration).
Figure 5.
Relief cross section indicating a hydraulic gradient between the upper Mooi River and the lower part of the GMB wetland that may possibly drive subterraneous bed loss from the Mooi River into the wetland (100-times vertical exaggeration).
It is assumed that all three inflow sites contribute to the increase in U load of the GMB stream passing through the wetland by adding some 33–68 g U per day (12–25 kg U per year). Data from [
1] suggest that U levels at GMB in 1997 were still mostly around 0.4 µg/L and thus in the region of global U background values for (discharge-unweighted) freshwater [
10]. However, on at least two occasions U levels in the weekly samples increased significantly reaching a maximum of 2 µg/L (
i.e., 500% of its normal U concentration) (
Figure 6).
Figure 6.
U concentration at the GMB eye between January and December, 1997 (data: [
1]) indicating sporadic peaks at otherwise low (natural background concentration) U levels.
Figure 6.
U concentration at the GMB eye between January and December, 1997 (data: [
1]) indicating sporadic peaks at otherwise low (natural background concentration) U levels.
While the isolated peaks could possibly be ascribed to analytical errors and treated as irrelevant outliers in real time
in situ observations of water quality in the spring suggest that such peaks may indeed occur as a result of storm events in the area. Changes in pH and EC at the GMB eye in response to a storm event recorded by an
in situ datalogger clearly indicate a drop in pH and a corresponding rise in EC some six days after the rain storm occurred. Given that acid mine drainage could explain the observed changes (dropping pH due to high acidity and rising EC due to high salt load, especially sulfates) this could well indicate a rainfall-triggered impact by upstream mines. Acid rainfall, which also lead to declining pH values even in well-buffered dolomitic water [
11], can be eliminated as possible cause, as the drop in pH would be accompanied by declining EC values (due to the dilution by the influx of clean quasi ‘distilled’ rain water).
These relatively low U concentrations at GMB are confirmed by Grundling (2002) reporting the U levels in grab samples of water from the GMB wetland ranging from 0 to 1.5 µg/L (n = 5), which corresponds with in- and near-stream sediment (not peat, however) concentrations from 4–40 ppm U (n = 3) [
12]. Analyzing the U levels in a vertical peat profile, Smuts (1997) found considerably higher U concentrations ranging from 35 mg/kg in 2.8 m depth below surface to 5 mg/kg (at 3.25 m) and 15 mg/kg at 4 m depth [
13]. With 18.3 mg/kg the average U content in peat from GMB coincides almost exactly with the average Smuts (1999) reports for 18 different reed/sedge-peatlands in the Transvaal (South African Highveld) (18 mg/kg) [
13]. When comparing U concentration data from different studies it needs to be considered that some U analyses may have been conducted using semi-quantitative ICPMS scans which were found to frequently exhibit a significant margin of error [
14].
2.3. U levels in the GMB Wetland: Sediment
The U concentration found in different types of sediments of the wetland is displayed in
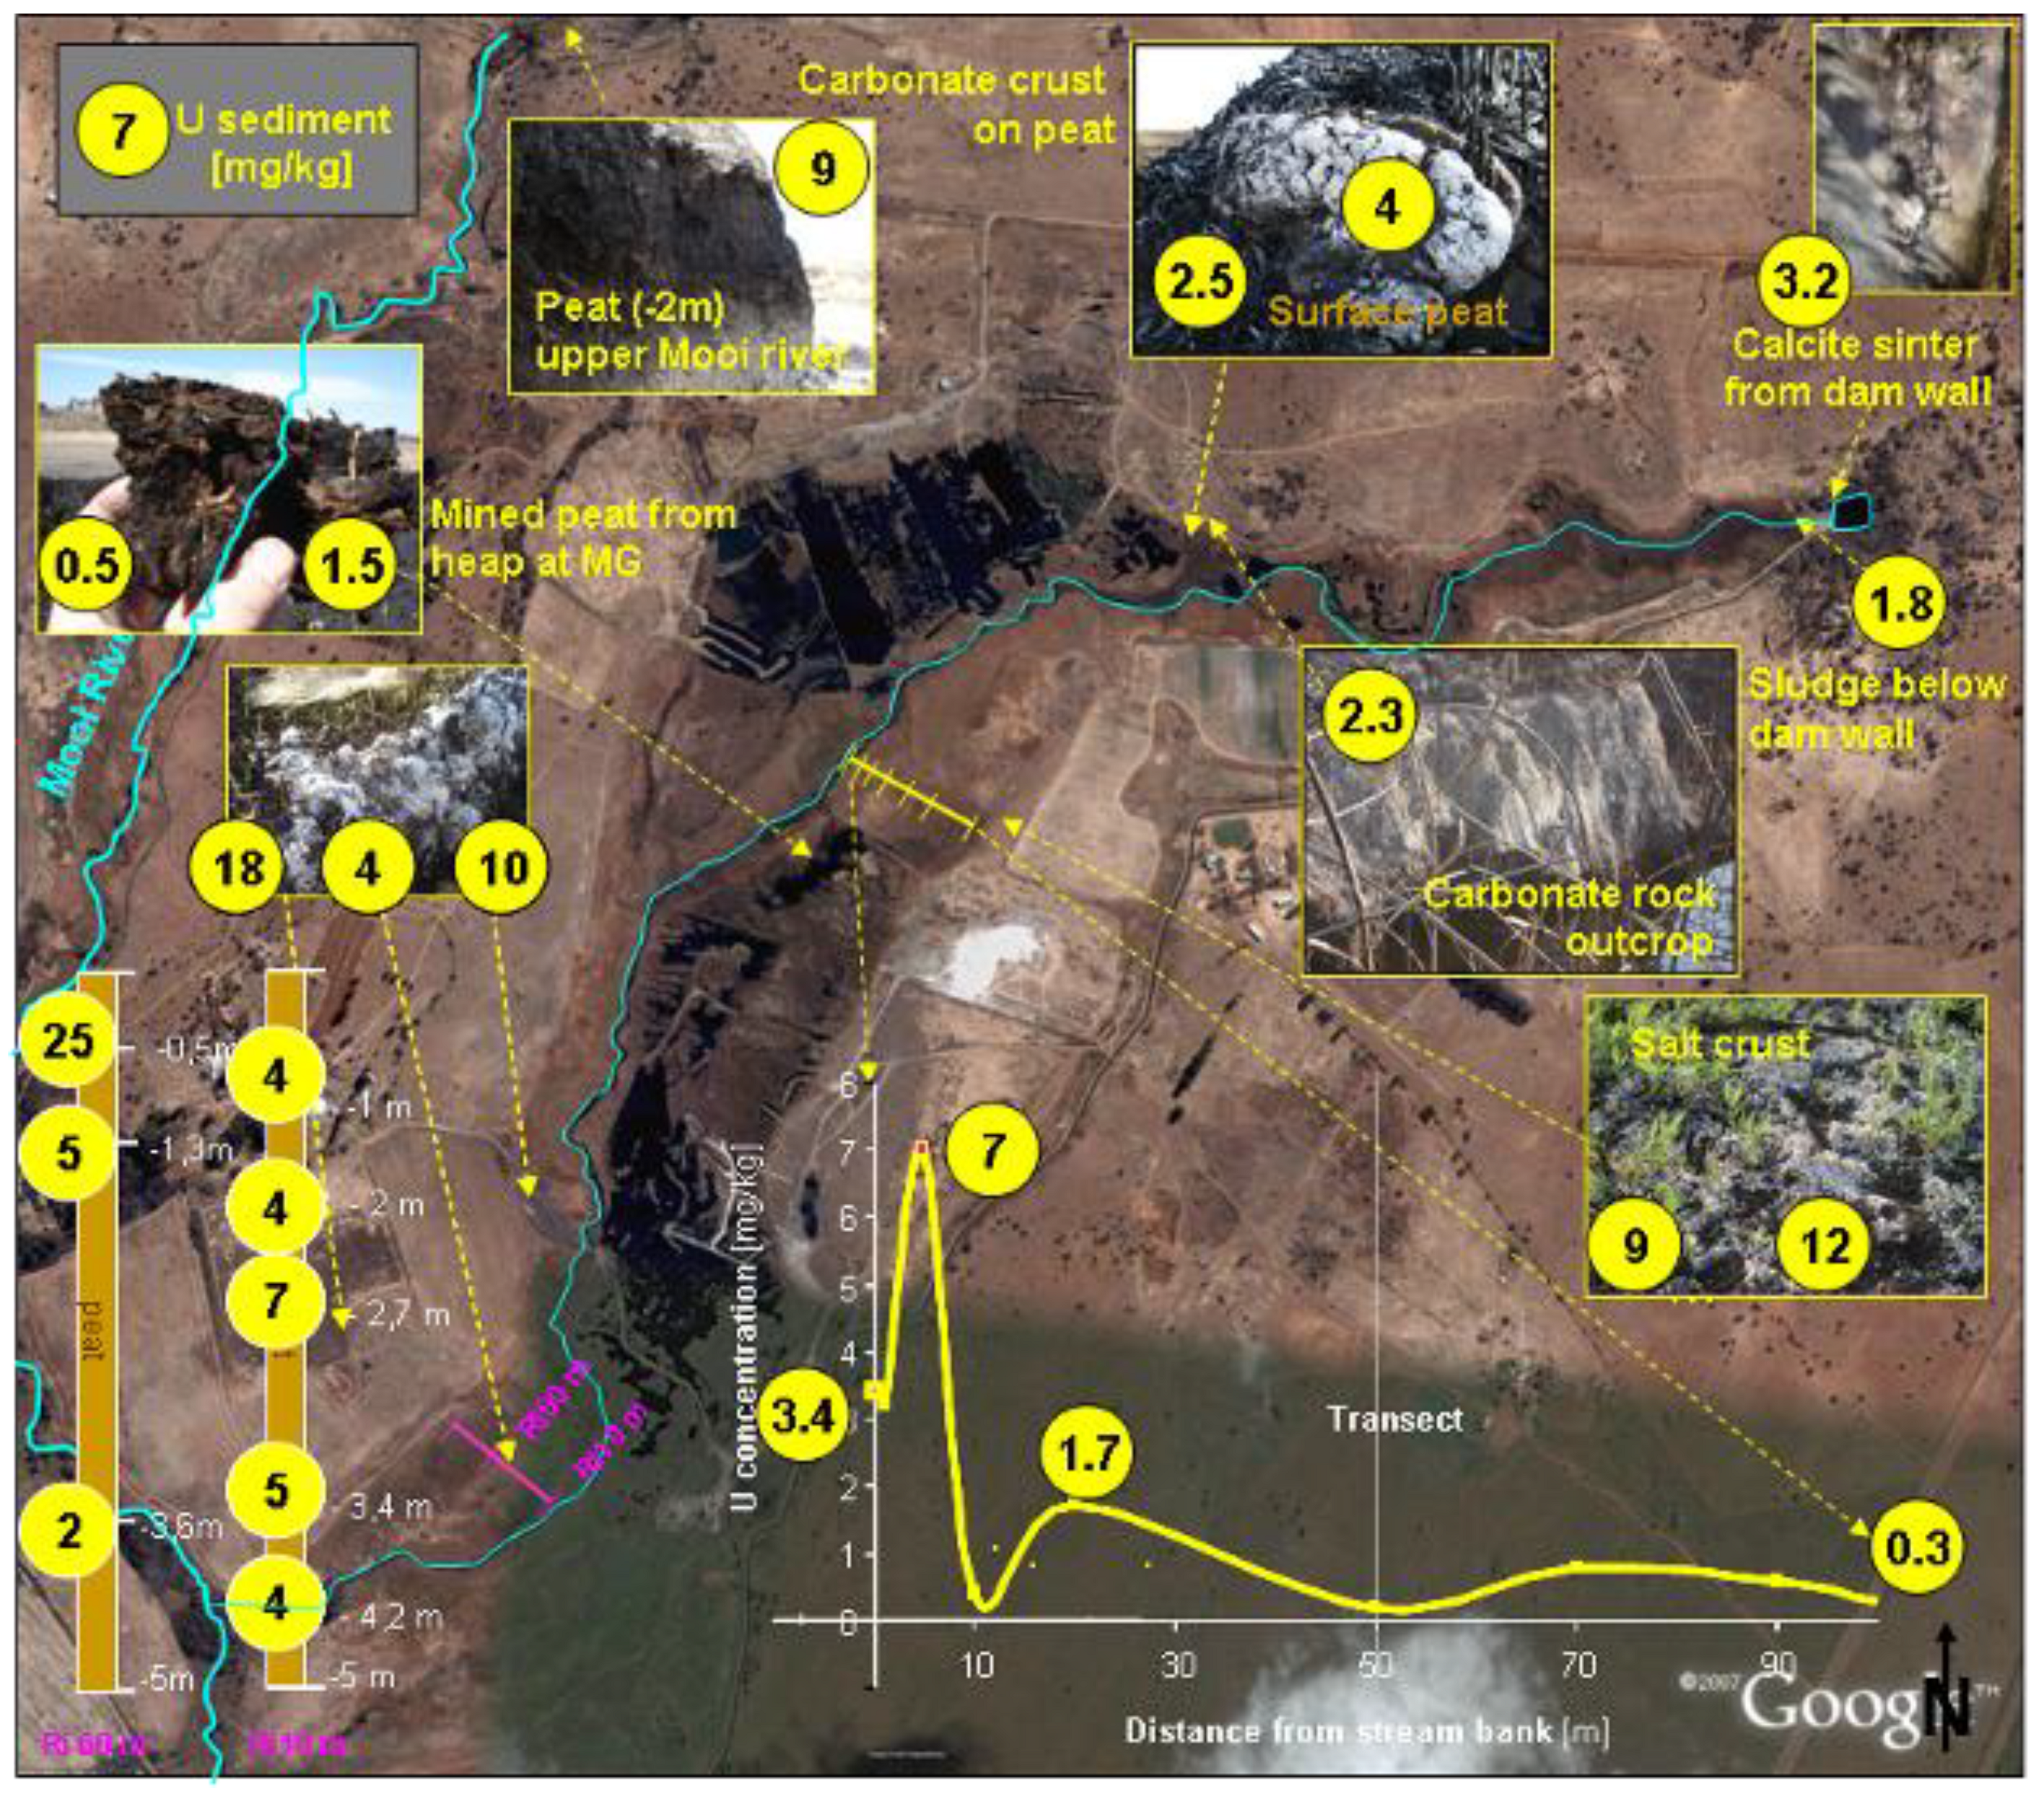
Figure 7.
Figure 7.
U concentration in different types of sediments of the Gerhard Minnebron Wetland as found in screening survey (grab samples) (map based on satellite image of the study area as retrieved from Google Earth).
Figure 7.
U concentration in different types of sediments of the Gerhard Minnebron Wetland as found in screening survey (grab samples) (map based on satellite image of the study area as retrieved from Google Earth).
Sampled sediments comprised of different types of material including carbonate crusts that formed on peat, calcite sinter formed by spring water seeping through the dam wall, alluvial wetland sediments (fine grained, organic rich sludge-like soil), evaporative salt crusts on top soil and vegetation, recently excavated peat (stored on a heap) as well as in situ peat (portion 9: transect and vertical profiles).
With an overall average of 4.7 mg/kg U (n = 33, 0.3–25 mg/kg) wetland sediments at GMB generally display significantly lower U levels than fluvial sediments from the WFS (average 106 mg/kg; n = 5; normalizing the upper Tfnt. dam sample for the contents of organic substance the average U conc. would be 130 mg/kg).
However, comparing the various types of sediments at the GMB wetland with each other as well as sediments from the two upstream rivers (Mooi River and WFS) indicates that significant differences regarding the U contents between the sediments exists (
Table 2).
Table 2.
U levels for different sediment types in the Gerhard Minnebron wetland in comparison to U concentrations in peat from the upper Mooi River and fluvial sediments from the Wonderfonteinspruit as found in the survey (n—number of samples).
Table 2.
U levels for different sediment types in the Gerhard Minnebron wetland in comparison to U concentrations in peat from the upper Mooi River and fluvial sediments from the Wonderfonteinspruit as found in the survey (n—number of samples).
| Location/ Type of sediment | n | U concentration [mg/kg dry substance] |
| Average | Median | Minim. | Maxim. |
| Wetland sediments at GMB: |
| Salt crusts (portions 7 and 9) | 5 | 10.6 | 10 | 4 | 12 |
| Peat (in situ, portion 9; −0.5…−4.5 m) | 10 | 6.3 | 5 | 0.6 | 25 |
| Carbonates (crust on peat; sinter) | 4 | 3.2 | 3 | 2.4 | 4 |
| Peat (upper part of wetland near eye) | 1 | 2.5 | | | |
| Alluvial sediments (transect portion 7) | 8 | 2.2 | 1.3 | 0.3 | 7 |
| Peat (mined at Middleground) | 3 | 1.1 | 1.2 | 0.5 | 1.5 |
| All peat samples (GMB) | 14 | 4.9 | 4 | 0.5 | 25 |
| All samples GMB | 33 | 4.7 | 3.2 | 0.5 | 25 |
| River sediments (outside GMB): |
| Peat (in situ, upper Mooi River, −2 m) | 3 | 9.3 | 10 | 6 | 12 |
| Fluvial/dam sediments (WFS) | 5 | 106 | 85 | 28 | 178 |
Salt crusts: The highest average U levels in the GMB wetland were found in salt crusts that temporarily occurred during the dry winter months on topsoil in the floodplain and bank areas as well as on remains of burnt vegetation such as reed stems. Consisting partly of sulfate minerals (e.g., gypsum) some of these crusts seem to indicate mining-related water pollution (SO4 is derived from the oxidization of pyrite contained in the mined ore). However, despite increasing distance from the mining area, no clear down-gradient trend seems to exist, as similar U levels were found at portion 7 and downstream at portion 9. Since some of the water found in the crust-covered areas displayed EC values which even exceeded those of undiluted seepage from mine tailings, it is unlikely that the nearest mining sources some 10 km upstream could possibly be the source of pollution as some form of dilution would have taken place if water was transported over such a long distance. Therefore, it is more likely that a non-mining related source closer to the wetland is in fact responsible for the elevated U levels. This is also supported by the fact that the chemical composition of the salt crusts differ between the different parts of the wetland (displaying a gradual downstream increase of Na, Cl and SO4 while Mg, Ca and carbonates decrease), rendering mining unlikely to be the only source of pollution. Possible alternative explanations, which are currently being investigated, include the in situ weathering of a highly weathered outcrop of possibly re-crystallized dolomite displaying some 3 mg/kg U that may result in the pollution of associated groundwater.
Since the salt crusts were found to be readily soluble on contact with water, the first spring rains may result in peaks of U following their dissolution by rainwater. The dissolution of crusts impacts also on the porewater quality of the underlying peat as indicated by distinct EC-increases following rain events observed by in situ sensors. Since the crusts contain U the rise in EC is likely to be accompanied by increasing U levels too. This, however, still needs to be confirmed.
Un-mined (in situ) peat: The second highest average U concentration was found in up to 5 m-deep peat cores taken from the lower part of the wetland (portion 9) along a transect running perpendicular to the adjacent stream. Except for one sample taken at 50 cm below surface at 60 m distance from the stream displaying the highest U concentration found in the entire GMB wetland (25 mg/kg), the undisturbed peat at portion 9 contained between 2 mg/kg and 7 mg/kg averaging 4.2 mg/kg (omitting the outlier of 25 ppm). This is below the U level found in peat deposits from the upper Mooi River (average 9.3 mg/kg, maximum 12 mg/kg), which is presumed to be not impacted on by gold mining activities. The fact that peat in unpolluted rivers displays higher U levels than peat in the alledgedly polluted GMB peatland questions the legitimacy of the current court action initiated by one of the peat mining operators against an upstream gold mine seeking compensation for economic losses owing to gold mining-related U pollution of the mined peat. With U levels falling into the range observed at portion 9, the peat sampled upstream of the mining ponds of the claimant and downstream (at a mining site of the second peat mining operator, Middleground), further weakens the argument of massive U pollution of the mined peat (
Table 2). The three samples of peat from the Middleground site are all low in U when compared to the other peat samples (0.5–1.5 mg/kg). Since these samples were taken from a heap on which mined peat was stored prior to transportation, possible impacts of the mining procedure on U levels in peat cannot
a priory be excluded. This could include partial oxidation that may release U along with drained water as soon as the peat is removed from the subaquatic, reducing environment and stored under aerobic conditions. This assumption, however, is purely speculative and needs to be tested.
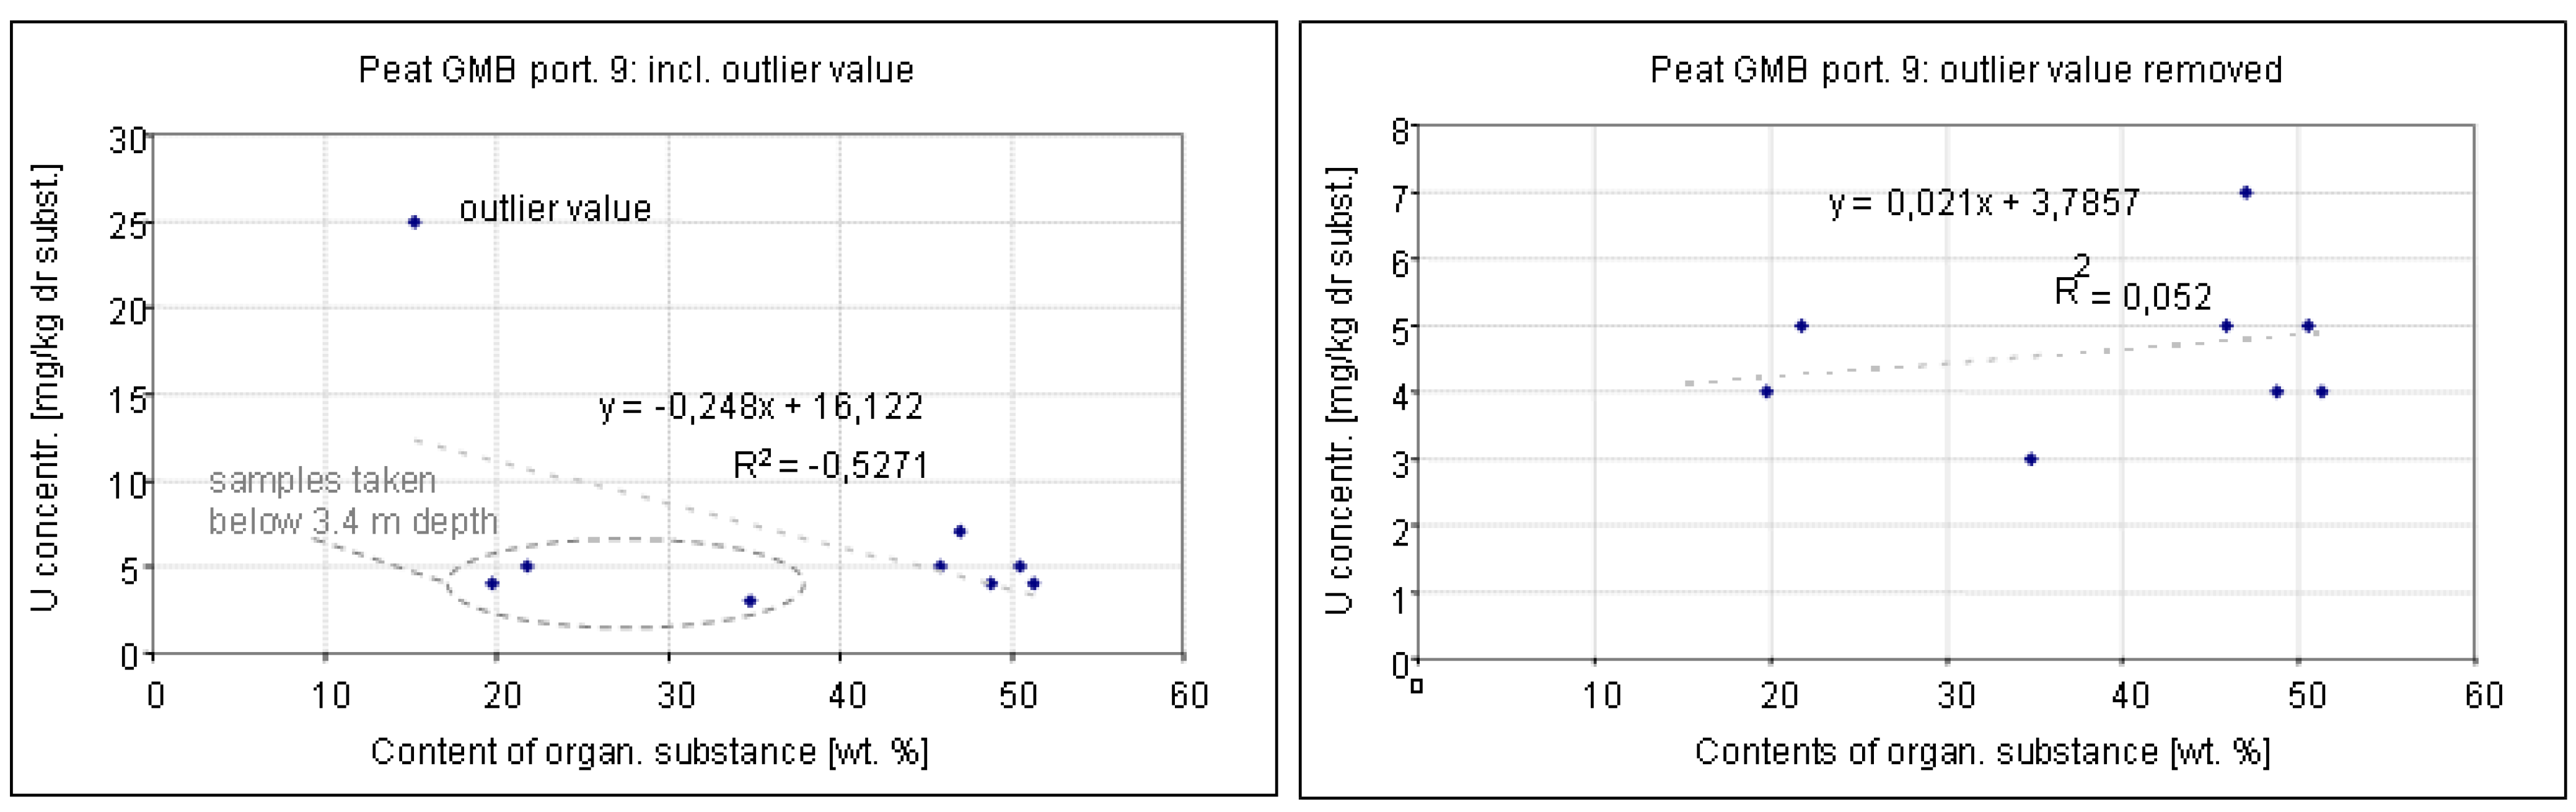
In contrast to stream and dam sediments from the WFS where U correlated positively with the content of organic substance (determined as loss on ignition) no such relationship was found for the peat at portion 9. In fact, using the whole data set, quite the opposite occurred, indicating a weak inverse relation between U and organic substance content was found (r
2 = −0.5271; n = 9),
i.e., U levels decrease as the content of organic substance (known to be a strong sorbent) increases. An analysis of the associated scatter plot shows, however, that this inverse relationship is only present due to one outlying value (25 mg/kg U) (
Figure 8, left hand side). Once this is removed no significant correlation occurs (
Figure 8, right hand side).
Figure 8.
Impact of a possible outlier values on the relationship between the concentration of U and organic substance in peat samples from different depths. Including the outlier value of 25 ppm U results in a weak but still significant correlation (r2 = 0.527; left diagram) which disappears completely when the unusually high U value is left out (right diagram; r2 = 0.0052).
It appears, however, that the three samples below the straight trendline in the left plot of
Figure 8 all pertain to samples taken in depths greater than 3.4 m. If these three samples are removed (two of which are not classical peat according to their relatively low organic content of about 20 weight−%), a highly significant negative relationship between U levels and the content of organic substance re-occurs (r
2 = −0.9821) for the sampled upper 2.7 m of peat (
Figure 9).
Figure 9.
Relationship between U concentration and content of organic substance in peat samples taken at portion 9 above a depth of 3.4 m (Please note: the inclusion of the outlier value does not change the linear nature of the relationship which persists when it is removed.).
Figure 9.
Relationship between U concentration and content of organic substance in peat samples taken at portion 9 above a depth of 3.4 m (Please note: the inclusion of the outlier value does not change the linear nature of the relationship which persists when it is removed.).
While the number of samples on which the latter relationship is based is limited (n = 6), it may indicate a trend that processes such as sorption and water flow taking place in the upper (organic-rich peat) may differ from those in the lower, more mineral-rich, peat. Why, however, an inverse relation could possibly exist between the organic substance as a strong heavy metal sorbent and the heavy metal U can currently only be speculated on. One possible scenario could be that U in the peat does not originate from dissolved U sorbed from the water phase (allochthone origin) but is contained naturally in the mineral fraction of the peat (e.g., carbonates, clay
etc.,
i.e., being autotochthone in origin). With increasing contents of organic substance, the proportion the uraniferous mineral fraction would decrease resulting in an inverse relation between the organic substance and U. This is supported by the fact that carbonates sampled in the wetland, indeed, showed slightly elevated U levels (up to 4 mg/kg,
Table 1). To confirm, or disprove this assumption, the U levels in the different peat constituents would need to be analyzed.
Analyzing samples for a possibly existing vertical concentration gradient of U, no clear consistent pattern was discernable for the totality of peat samples. While the same applies to the near-stream peat core (10 m stream distance), this was different for the far-stream core (60 m distance) for which a consistent increase of U levels towards the surface was found (
Figure 10).
Figure 10.
Vertical U distribution in near-stream peat (upper diagram, 10 m distance) and far-stream peat (lower diagram, 60 m distance) of portion 9.
Figure 10.
Vertical U distribution in near-stream peat (upper diagram, 10 m distance) and far-stream peat (lower diagram, 60 m distance) of portion 9.
However, being based on only three samples, of which one represents an outlier, this trend should, at best, be regarded as tentative.
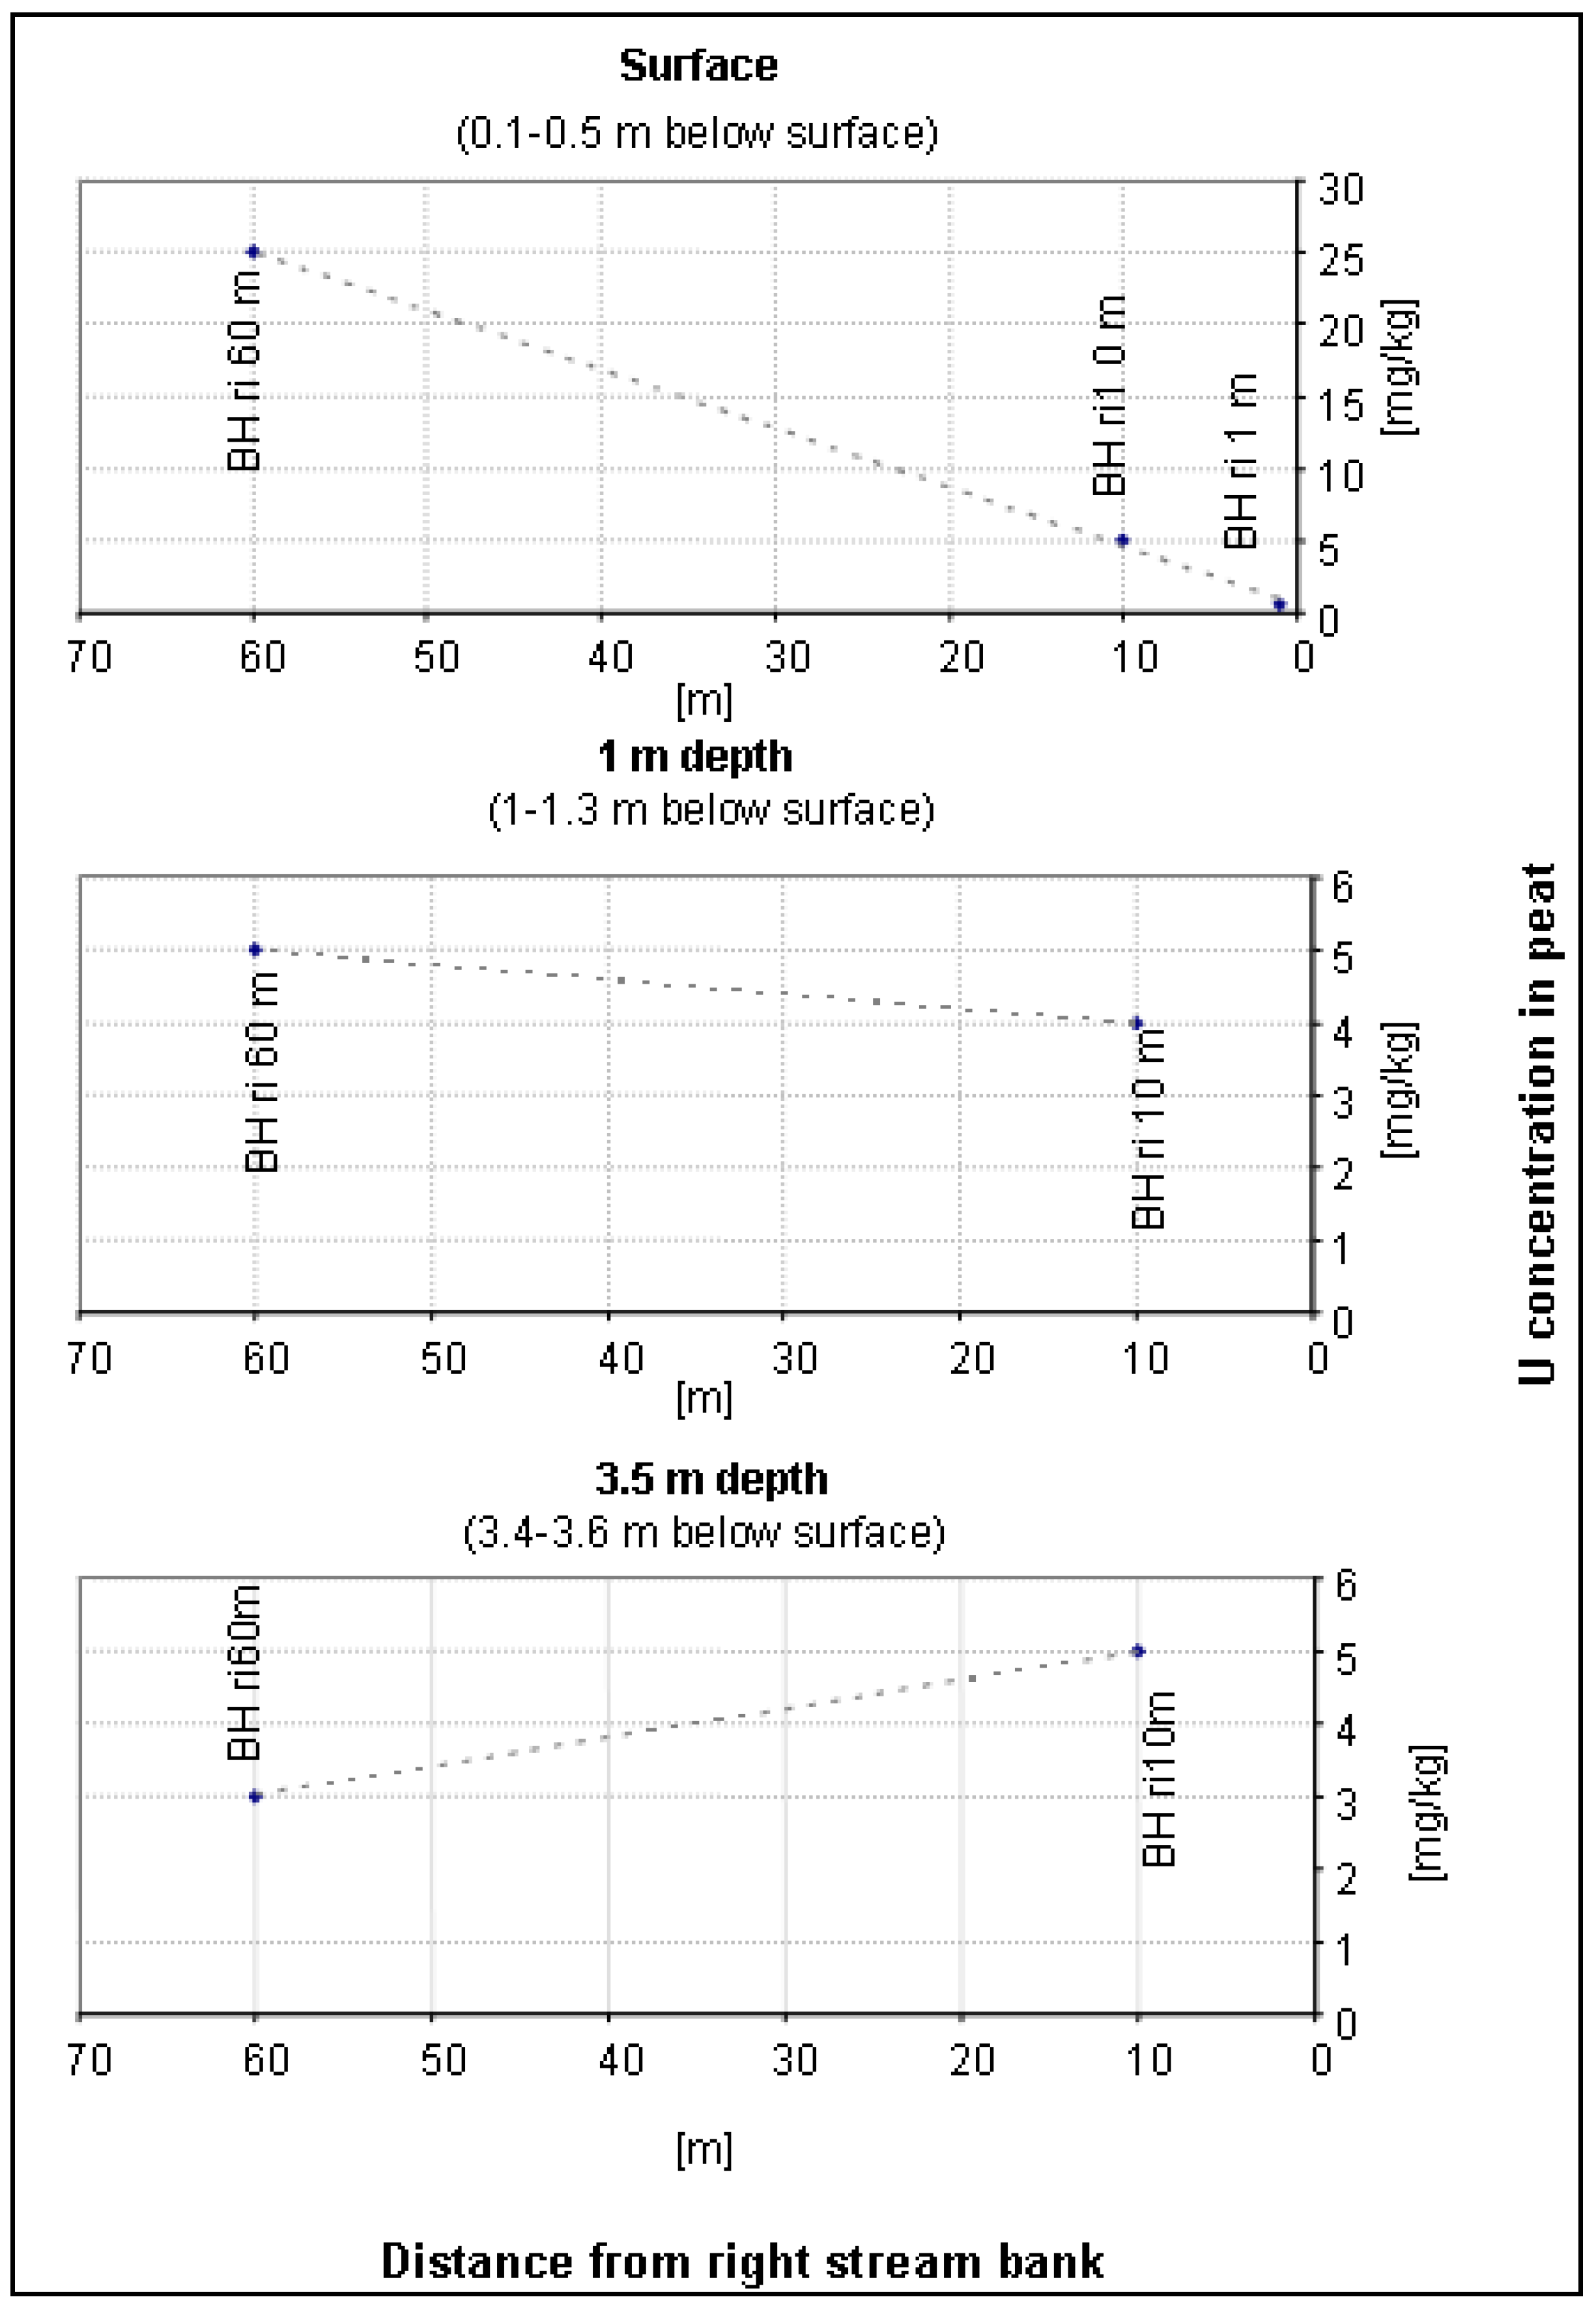
With low sample numbers, this also applies to the horizontal U gradients found for the different points along the borehole transect. Data for three different depth categories (near-surface, 1 m and 3.5 m) for the three analyzed sites (1 m, 10 m and 60 m distance from the stream) indicate for the upper (near–surface) layer, a distinct increase of U levels away from the stream (
Figure 11, top diagram
).
Figure 11.
Horizontal stream distance gradients of U concentration in peat at different depths (GMB, portion 9).
Figure 11.
Horizontal stream distance gradients of U concentration in peat at different depths (GMB, portion 9).
Although weaker, this trend is mirrored in the 1 m-depth layer (
Figure 11, middle diagram). For the deeper peat (below 3.4 m) a weak inverse trend was found (
i.e., U increases towards the stream) indicating that, again, the deeper (mineral rich) peat may behave differently from the organic-rich upper peat (
Figure 11, bottom diagram). The decrease of U levels towards the stream in the upper 3 m of peat may indicate that the stream is not a major source of U but rather the polluted groundwater that was found to migrate through the wetland towards the GMB stream into the wetland from the direction of the Mooi River in the west.
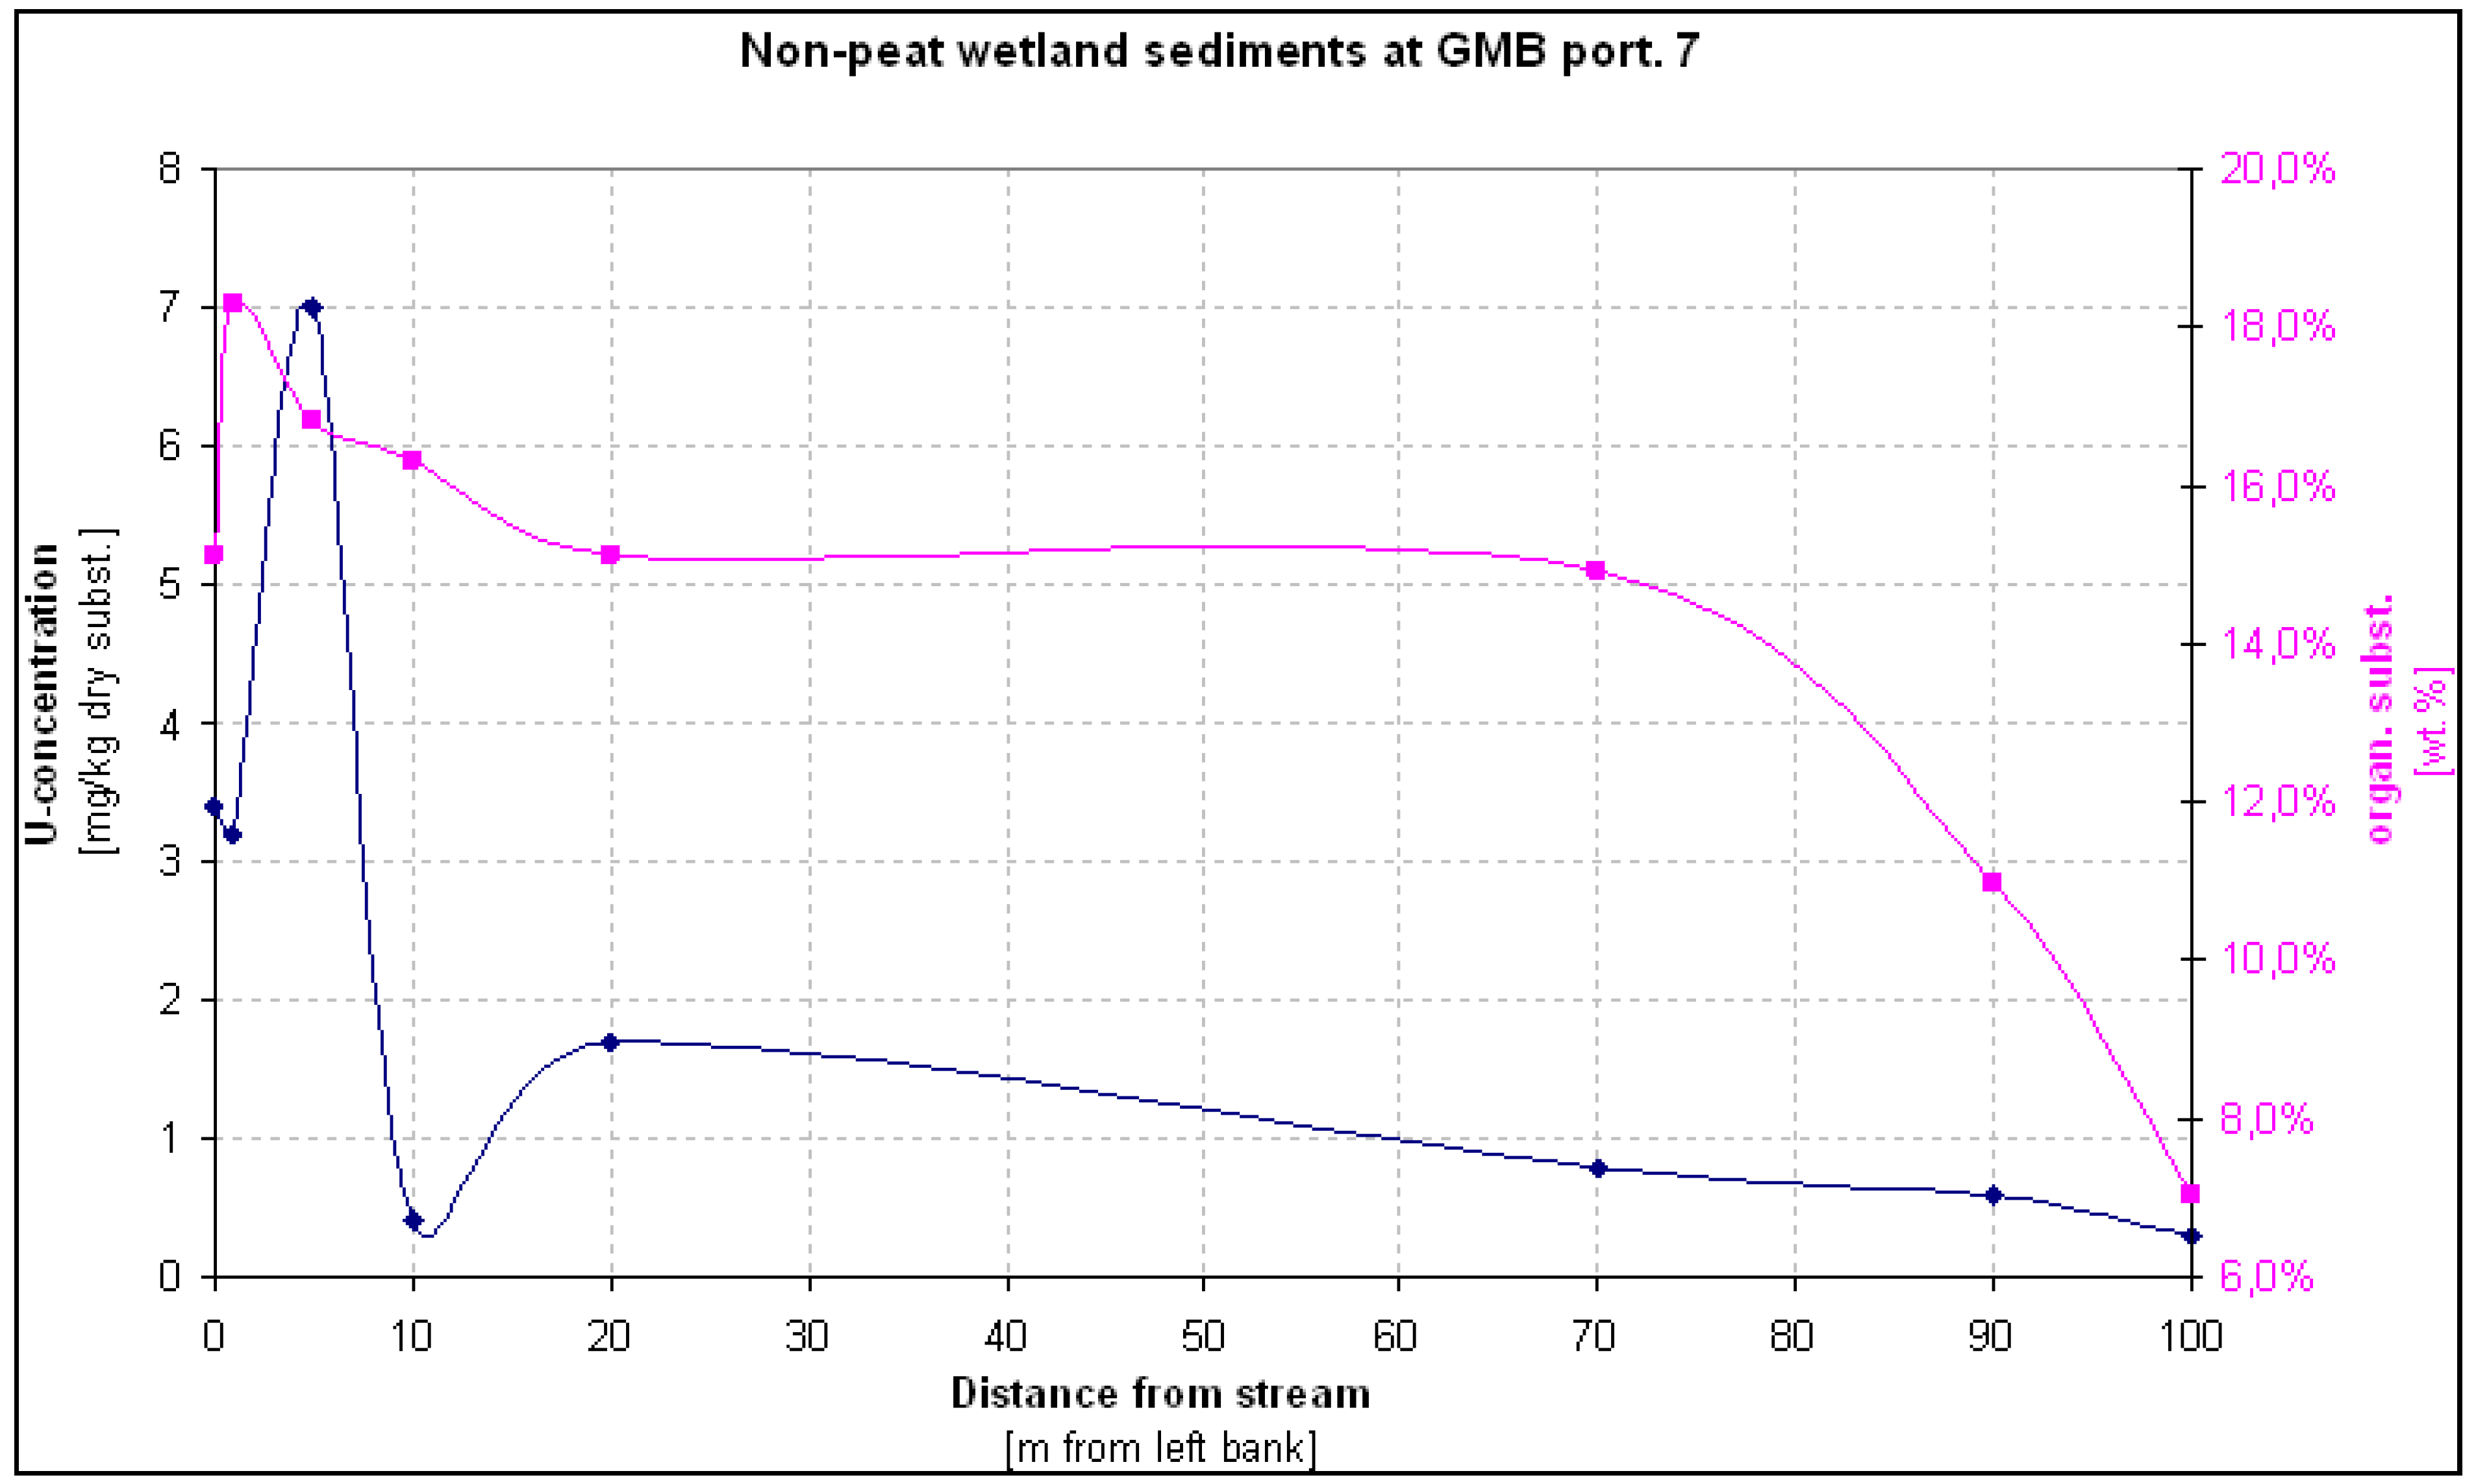
A different pattern was found for the upstream transect at portion 7, where typical fine-grained and organic rich floodplain soils were sampled (with most material displaying organic substance concentrations of below 20% in this area contains no peat). The U concentration in relation to the distance from the GMB stream is displayed in
Figure 12.
Figure 12.
Stream-distance gradients of U in non-peat sediments at üortion 7 in relation to the associated contents of organic substances.
Figure 12.
Stream-distance gradients of U in non-peat sediments at üortion 7 in relation to the associated contents of organic substances.
In contrast to portion 9, where U levels in near-surface peat increased with distance from the stream floodplain, soil at portion 7 showed the opposite,
i.e., the highest U concentration occurs close to the stream (0–5 m) and decreases continuously towards the edge of the wetland where it reaches a minimum that may represent the local natural U background concentration (0.3 mg/kg). For the alluvial soil a weak correlation between U and the contents of organic substance was found (r
2 = 0.5347) explaining why the organic substance behaves similar (although not identical) to the U concentration (
Figure 12).
The fact that the U concentration increases toward the stream suggest that in this part of the wetland the stream may be the primary source from where U is spread across the floodplain during sporadic floods and the associated inundation. This is despite the fact that the alluvial groundwater at portion 7 showed the highest U levels increasing from the edge of the wetland towards the stream (
i.e., pointing to external influx rather than the stream as a major U source) [
15]. Apart from differences in the degree to which fluvially transported material is deposited, less frequent inundations of the increasingly higher lying far-stream areas may also contribute to generate pollutant gradients across the floodplain. Assuming that much of the suspended material is of organic nature, this would explain the observed gradient of the organic substance largely mirroring the U gradient. In flood events where heavy metals are not only transported as solid phases (suspended particles) but are also present in dissolved form the gradient of organic substance and the associated differences in the capacity of floodplain soil to bind dissolved metals from the flood water may also contribute to the generation of bank gradients for heavy metals.
2.4. Water-Sediment Interactions
Comparing the U levels in water and sediments within the GMB wetland indicates, somewhat surprisingly, that areas with relatively high U concentrations in water show comparably low U enrichment in associated sediments and
vice versa.
Figure 13 shows the U concentration in water interpolated between the individual point measurements in comparison with point measurements of U levels in associated sediments.
Figure 13.
GIS-extrapolated U concentration in water of the GMB wetland in comparison to U levels in associated sediments (darker blue tones of the water indicate increasing U concentration).
Figure 13.
GIS-extrapolated U concentration in water of the GMB wetland in comparison to U levels in associated sediments (darker blue tones of the water indicate increasing U concentration).
In order to quantify the visual perception the geochemical enrichment factors (GEF) have been determined for selected water-sediments systems in the GMB wetland (
Table 3).
Table 3.
Geochemical enrichment factors (GEF) for different water-sediment systems in the GMB wetland. GEFs printed in italics are based on single grab water sample rendering them unreliable. Where available, therefore, long-term average U concentrations in the corresponding water body are preferentially used for interpretation (GEFs are printed in bold).
| Sampled sediment-water system | U-sediment | | | U-water | | | GEF |
| Sediment: stream - site - medium - date - source | [mg/kg dry susbtance] | | [µg/L] | | | | |
| Water: stream - site - medium - date - source | av. | n | min. | max. | av. | n | min | max | (=av-sed/ |
| | (single samples are not bold) | (single samples are not bold) | ![Water 03 00391 i005]() ) ) |
| GMB - eye - dam wall - calcite sinter - 6/08 - grab FW | 3.2 | 1 | | | | | | | |
| GMB - eye - dam wall - 8/07 - grab FW | | | | | 0.2 | 1 | | | 16,000 |
| GMB - eye - wetl infl./ eye - av. 1/97-8/07 | | | | | 1.1 | 48 | 0.02 | 24 | 2,909 |
| GMB - d/s dam wall - sludge - 6/08 - grab FW | 1.8 | 1 | | | | | | | |
| GMB - eye - dam wall - 8/07 - grab FW | | | | | 0.2 | 1 | | | 9,000 |
| GMB - eye - wetl infl./ eye - av. 1/97-8/07 | | | | | 1.1 | 48 | 0.02 | 24 | 1,636 |
| GMB - willow seep - sludge - 6/08 - grab FW | 1.2 | 1 | | | | | | | |
| GMB - willow seep - groundwater - 6/08 - grab FW | | | | | 18.0 | 1 | | | 67 |
| GMB - willow seep - groundwater - 13.5.07 - grab FW | | | | | 3.6 | 1 | | | 333 |
| GMB - up wetl - carbonate crust on peat - 5/08 - grab FW | 4 | 1 | | | | | | | |
| GMB - eye - wetl infl./eye - av. 1/97-8/07 | | | | | 1.1 | 48 | 0.02 | 24 | 3,636 |
| GMB - up wetl ri - in-situ peat - 12.6.08 - grab FW | 2.5 | 1 | | | | | | | |
| GMB - eye - dam wall - 12.6.08 - grab FW | | | | | 16.9 | 1 | | | 148 |
| GMB - eye - wetl infl./eye - av. 1/97-8/07 | | | | | 1.1 | 48 | 0.02 | 24 | 2,273 |
| GMB - port 7 - alluv soil (le 1-5 m) - 12.6.08 - grab FW | 5.2 | 3 | 3.2 | 7 | | | | | |
| GMB - eye - wetl infl./eye - av. 1/97-8/07 | | | | | 1.1 | 48 | 0.02 | 24 | 4,727 |
| GMB - port 7 - alluv soil (BH3 - le 70 m) - 12.6.08 - grab FW | 0.8 | 1 | | | | | | | |
| GMB - port 7 BH 3 - groundw. after spring rain - 12.6.08 - grab FW | | | | | 12.7 | 1 | | | 63 |
| GMB - port 7 - alluv soil (BH5 - le 110 m) - 13.5.08 - grab FW | 0.6 | 1 | | | | | | | |
| GMB - port 7 BH 3 - groundw. after spring rain - 12.6.08 - grab FW | | | | | 12.7 | 1 | | | 47 |
| GMB - port 7 - sulfate crust wetl edge - 13.5.08 - grab FW | 10.5 | 2 | 9 | 12 | | | | | |
| GMB - port 7 BH 3 - groundw. after spring rain - 12.6.08 - grab FW | | | | | 230 | 1 | | | 46 |
| GMB - port 9 - sulfate crust veg - puddle - 13.5.08 - grab FW | 10 | 1 | | | | | | | |
| GMB - port 9 - groundw - puddle - 1.8.07 - grab FW | | | | | 3.2 | 1 | | | 3,125 |
| GMB - port 9 - peat ri 10 m -50 cm, - 7.9.07 - grab FW | 4 | 1 | | | | | | | |
| GMB - port 9 - wetl outflow - 1.8.07 - grab FW | | | | | 0.7 | 1 | | | 5,714 |
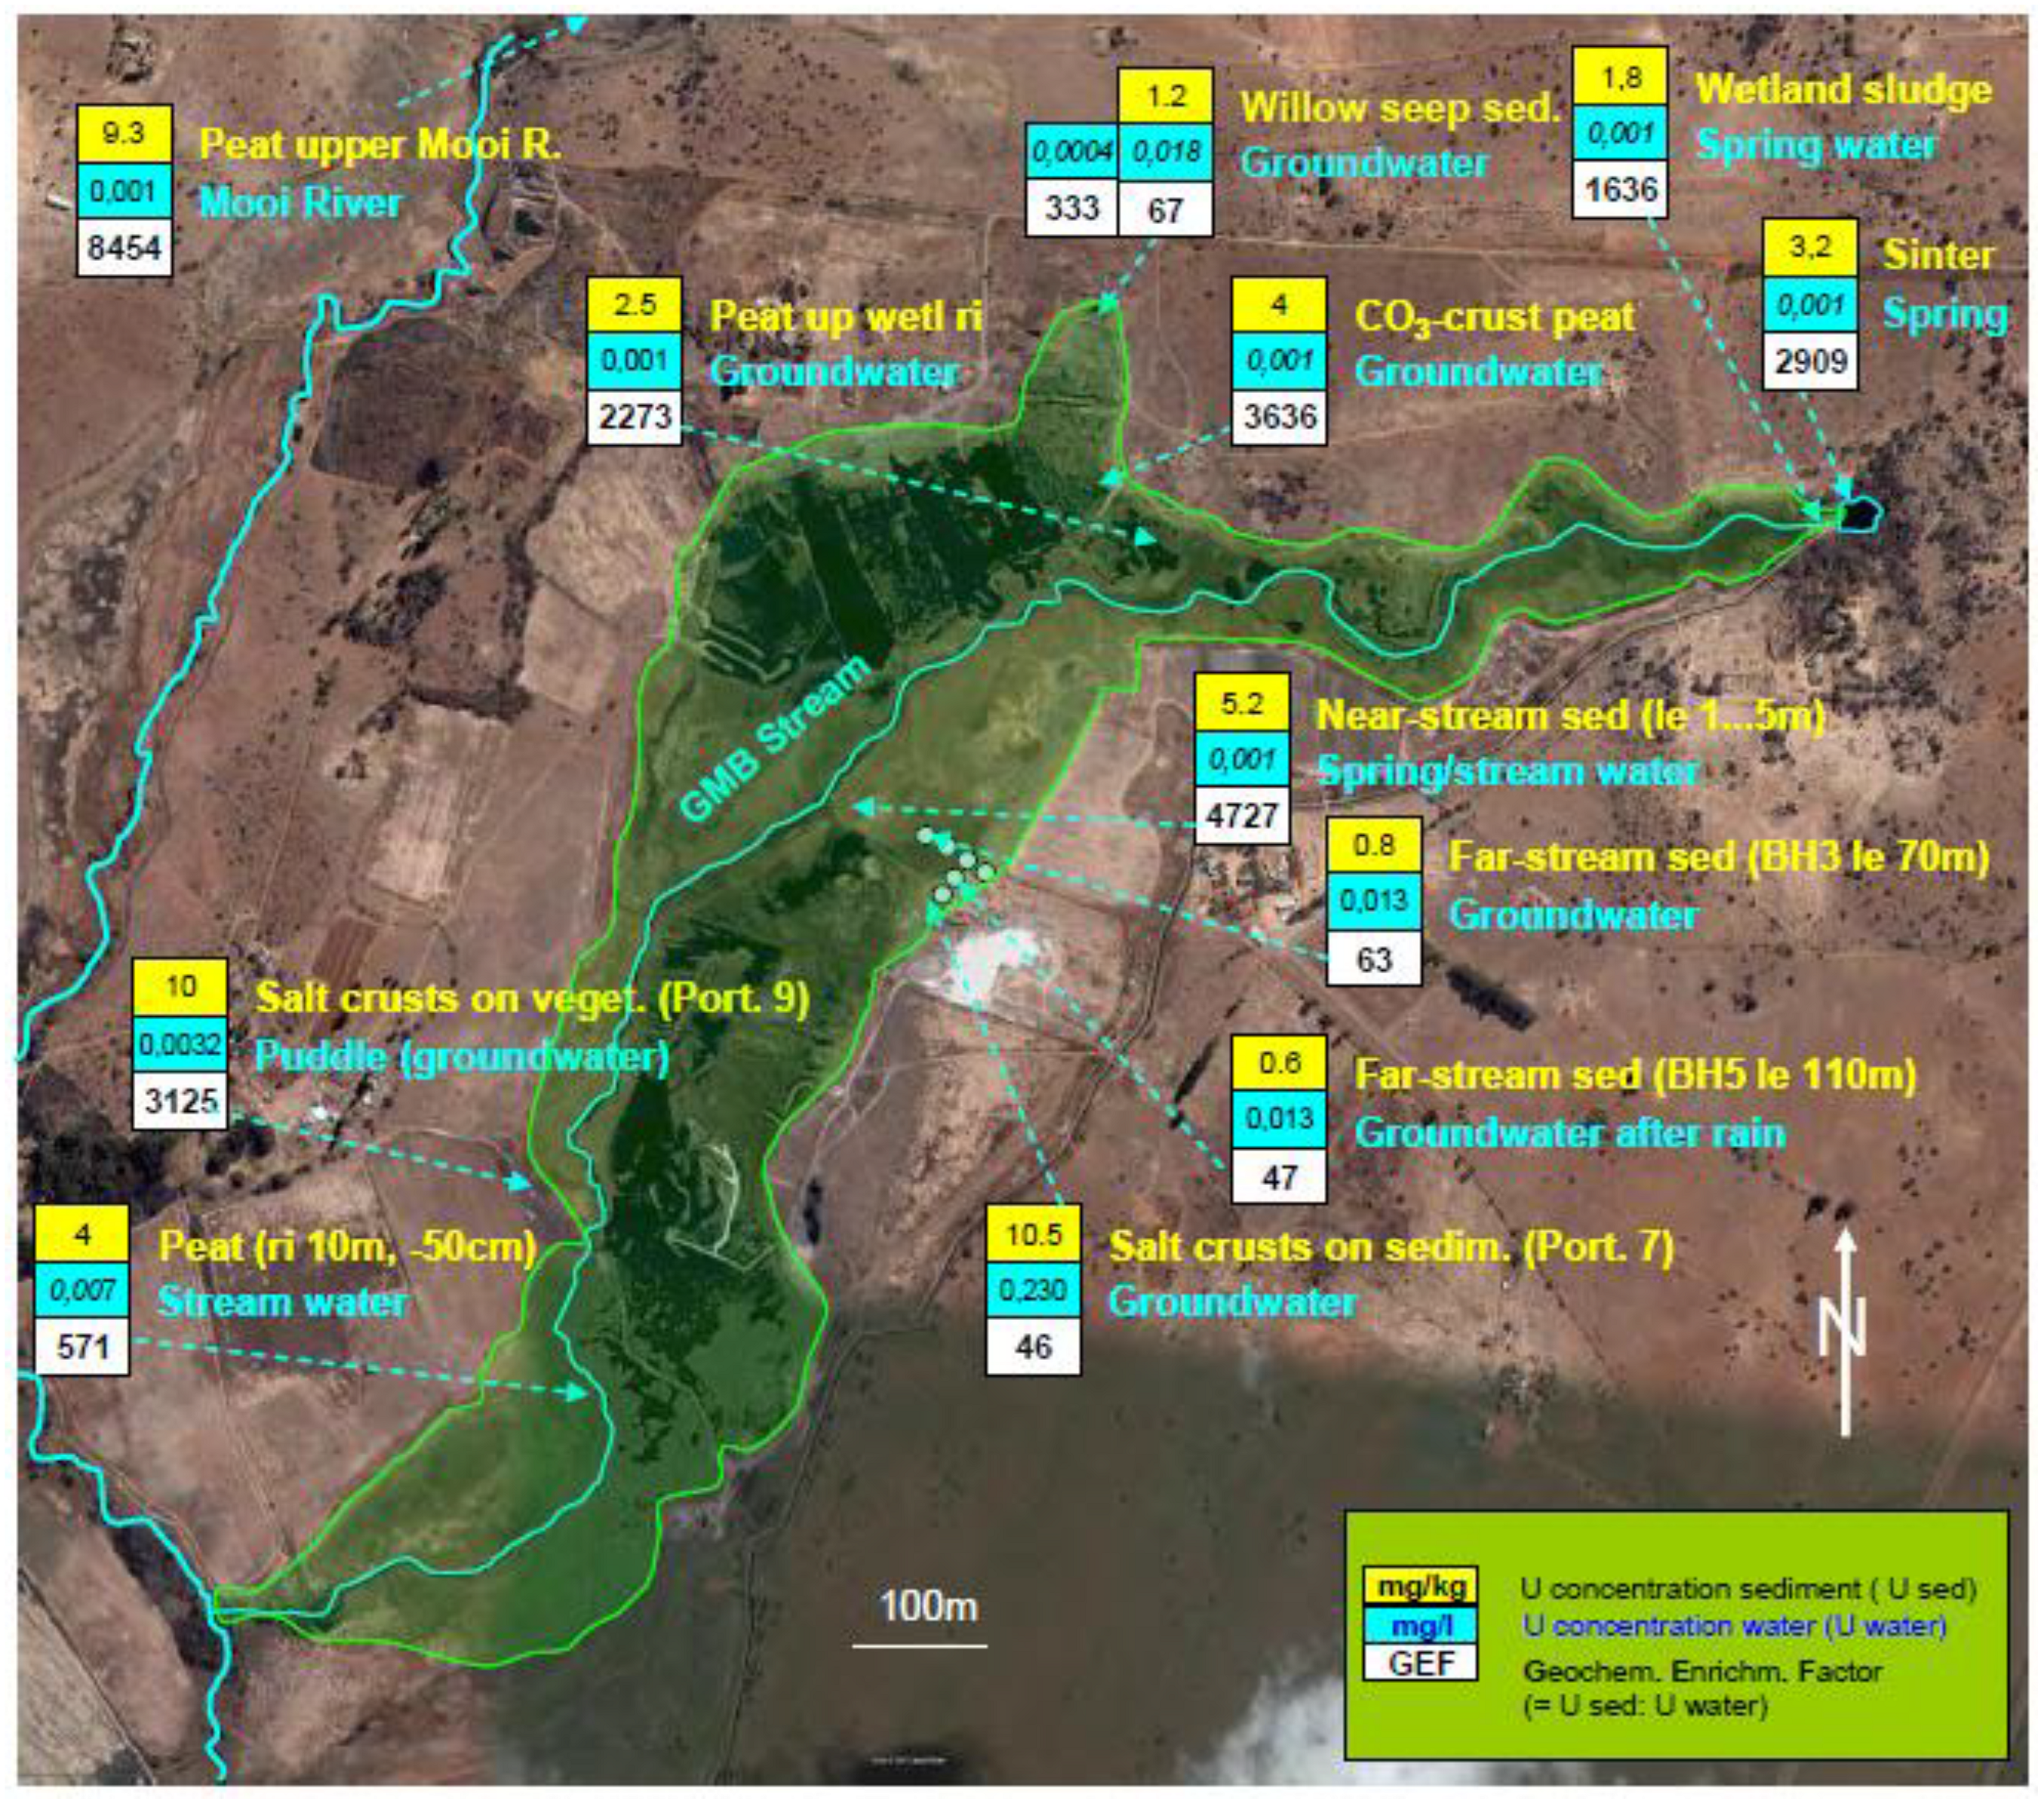
The spatial distribution of the sampled sediment-water systems within the GMB peatland is shown in
Figure 14.
Figure 14.
U concentrations and geochemical enrichment factors (GEF) for selected sediment-water systems in the Gerhard Minnebron wetland (map based on satellite image of the study area as retrieved from Google Earth).
Figure 14.
U concentrations and geochemical enrichment factors (GEF) for selected sediment-water systems in the Gerhard Minnebron wetland (map based on satellite image of the study area as retrieved from Google Earth).
As ratio between the U concentration in sediments (expressed in mg/kg = ppm) and in the corresponding water body (in mg/L = ppm), the GEF indicate how much more U is accumulated in the sediment compared to surrounding water. Since the GEF thus indicates the ratio between dissolved and solid U in a sediment-water system it is also referred to as distribution factor (Kd). With the latter concept originating in chemistry the Kd assumes an equilibrium between (dissolved) U from the water being sorbed onto the sediment (and thus immobilized) and solid U phases from the sediment being released into the water. Owing to comparably slow kinetics of many of the involved reactions and processes (e.g., dissolution of solid precipitates) such equilibria are seldom reached under natural conditions, especially not in highly dynamic environments such as fluvial systems where contact times between a certain unit of flowing water and sediments are limited. Owing to this, it might be helpful to introduce a directional component that would indicate whether polluted water is contaminating associated sediments through metal immobilization, or whether the water is contaminated by contaminants released from a solid phase (
i.e., peat or sediment). Under most environmental conditions the dominant direction of contamination is easy to determine, especially where such processes are one-directional. Examples for the latter are the formation and dissolution of uraniferous salt crusts. When crusts form through the evaporation of water and the subsequent precipitation of all contained substances, salt crusts concentrate all previously dissolved U in solid form, while the reverse process occurs when the crusts dissolve again, e.g., through contact with rain water. Since no further interaction between the dissolved phase and the solid phase can take place after the crusts formed and all the water has evaporated, the equilibrium concept would not be applicable. This also applies to the dissolution of the crusts by rain water, which again is a one-directional process. However, with regard to sediments such as peat that are in long-term contact with porewater, sorption of U from the water may be counterbalanced by the release of U due to changing chemical conditions such as pH and redox fluctuations or changing ionic composition. To compare U mobility across the GMB wetland only the geochemical enrichment of U (GEF) in the different types of sediments as depicted in
Figure 14 is interpreted. In this context GEFs calculated for sediment-water systems of the Mooi River and the WFS are used as benchmarks to evaluate the U accumulation found in sediments and peat of the GMB wetland (
Table 4).
Table 4.
Geochemical enrichment factors (GEF) for different water-sediment systems in the lower Wonderfonteinspruit and upper Mooi River. GEFs printed in italics are based on single grab water sample rendering them unreliable. Where available, therefore, long-term average U concentrations in the corresponding water body are preferentially used for interpretation (GEFs are printed in bold).
| Sampled sediment-water system | U-sediment | | | U-water | | | | GEF |
| Sediment: stream - site - medium - date - source | [mg/kg dry susbtance] | | [µg/L] | | | | (=av-sed/ |
| Water: stream - site - medium - date - source | av. | n | min. | max. | av. | n | min | max | ![Water 03 00391 i005]() ) ) |
| | (single samples are not bold) | | (single samples are not bold) | | |
| WFS - Wvd lake - sludge - 28.3.08 - grab FW | 84 | 1 | | | | | | | |
| WFS - stream - WvD-Kkr bridge - 28.3.08 - grab FW | | | | | 37 | 1 | | | 2,270 |
| WFS - stream - Wvd Kkr bridge - av. 1/97-3/08 | | | | | 49 | 133 | 1 | 222 | 1,714 |
| WFS - C2H069 - sludge - 28.3.08 - grab FW | 120 | 1 | | | | | | | |
| WFS - stream - C2H069 - 28.3.08 - FW | | | | | 85 | 1 | | | 1,412 |
| WFS - stream - C2H069 - av. 1/97-3/08 | | | | | 70 | 393 | 0.2 | 566 | 1,714 |
| WFS - A Coetzee dam - sludge - av. 8/99-6/08 | 258 | 153 | 47 | 925 | | | | | |
| WFS - A Coetzee dam - infl + outfl.- av. | | | | | 71 | 305 | 1 | 566 | 3,634 |
| WFS - lw Visser dam - sludge - 28.3.08 - grab FW | 178 | 1 | | | | | | | |
| WFS - lw Visser dam - outfl. - 28.3.08 - grab FW | | | | | 99 | 1 | | | 1,798 |
| WFS - up Tfnt dam - dry sed - 28.3.08 - grab FW | 28 | 1 | 150 | corrected for oS | | | | | |
| WFS - up Tfnt dam - mid dam - 28.3.08 - grab FW | | | | | 94 | 1 | | | 1,596 |
| WFS - up Tfnt eye - sludge - 28.3.08 - grab FW | 3.2 | 1 | | | | | | | |
| WFS - up Tfnt eye - sludge - 28.3.08 - grab FW | | | | | 1.0 | 1 | | | 3,200 |
| WFS - up Tfnt eye - sludge - av 01/97-3/07 | | | | | 5.3 | 48 | 0.4 | 43 | 604 |
| up Mooi R - peat diam mine - 2m - 3.4.08 - grab FW | 9.3 | 3 | 6 | 12 | | | | | |
| up Mooi R - Kkl dam/ Bov oog - in/outfl. - av. 1/97-8/07 | | | | | 1.1 | 33 | 0.1 | 11 | 8,455 |
| Boskop dam - DWAF site - av. | 4 | 4 | | | | | | | |
| Boskop dam - infl bridge- 1.8.08 - grab FW | | | | | 0.8 | 1 | | | 5,000 |
| Boskop dam - DWAF site - av. 1/97-8/07 | | | | | 5.0 | 83 | 0.4 | 142 | 800 |
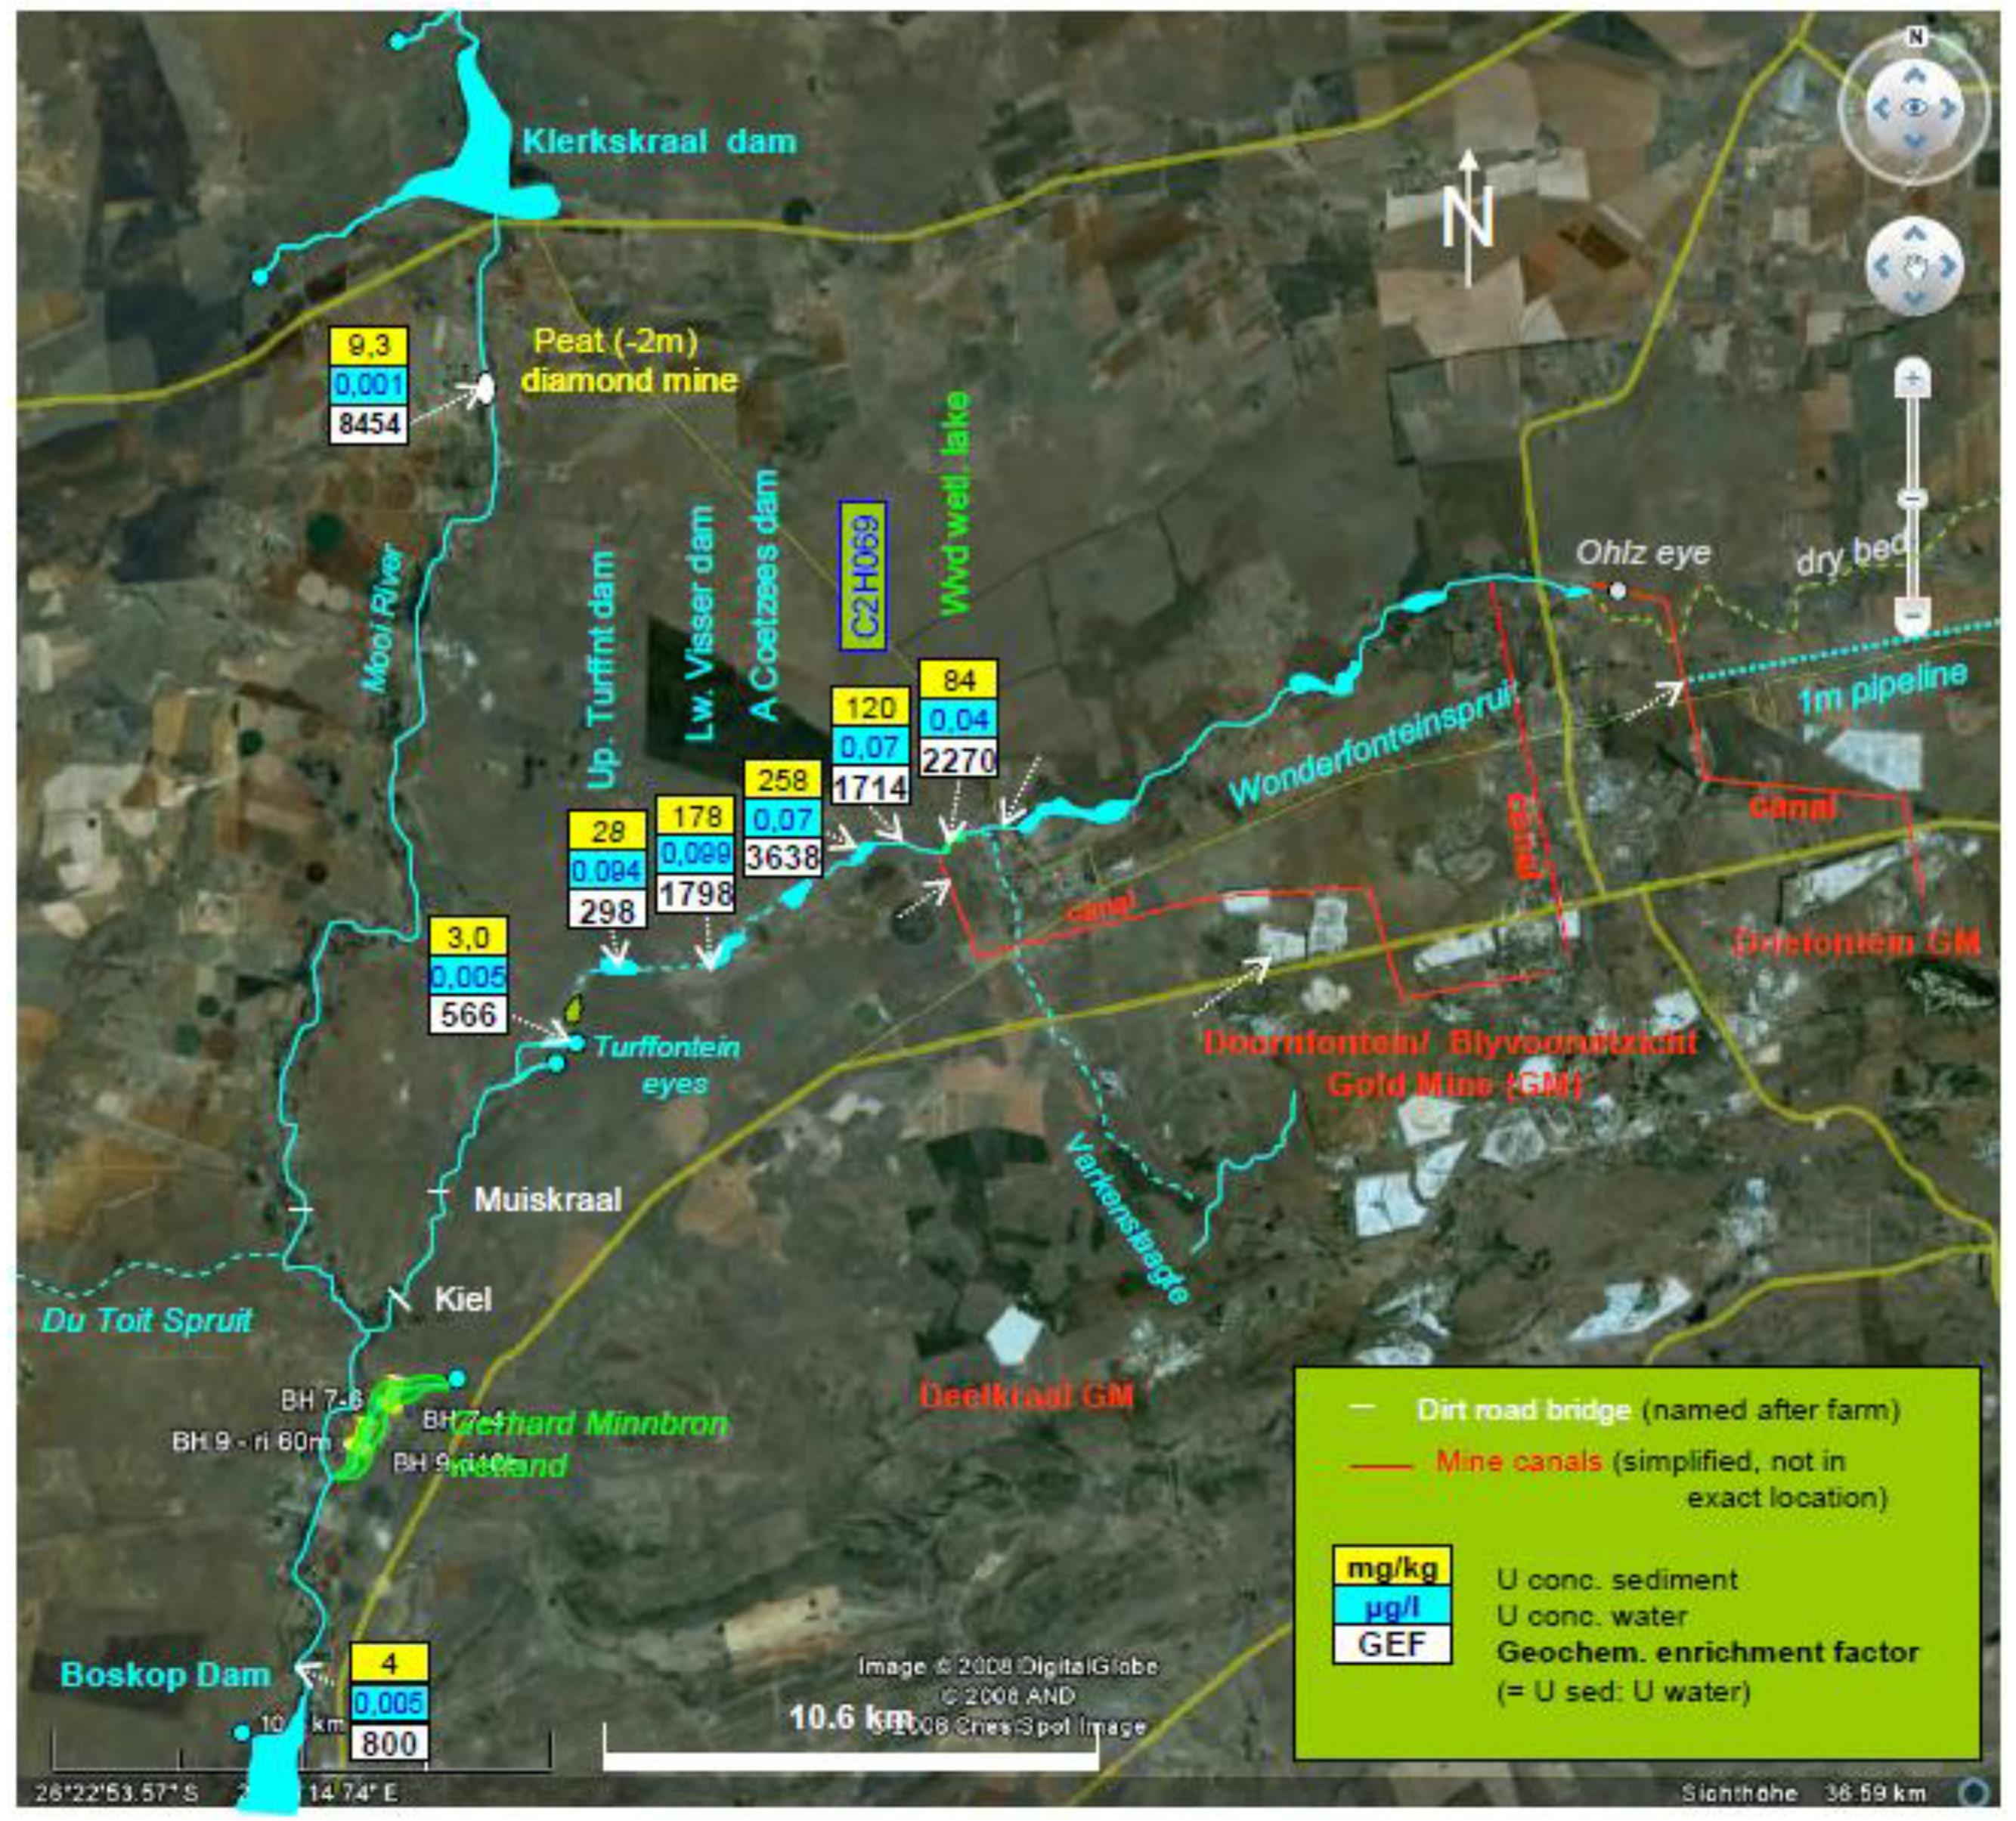
The location of the different sediment-water systems sampled in the lower WFS and upper Mooi River is displayed
Figure 15.
Figure 15.
U concentrations and geochemical enrichment factors (GEF) for selected sediment-water systems in the lower Wonderfonteinspruit and upper Mooi River (map based on satellite image of the study area as retrieved from Google Earth).
Figure 15.
U concentrations and geochemical enrichment factors (GEF) for selected sediment-water systems in the lower Wonderfonteinspruit and upper Mooi River (map based on satellite image of the study area as retrieved from Google Earth).
When interpreting the calculated GEFs it needs to be taken into consideration that not all samples of a specific sediment-water system have been collected at the same time. While the U concentration in sediments was found to vary little over time, the same is not true for the concentration of dissolved U in water. With the latter varying significantly, more water samples than sediment samples are normally available for a certain site. Hence, for sediments at many sites, more than one U concentration value is available for the corresponding water body to calculate the GEF. Wherever possible, GEF based on longer-term average data (printed in
bold in
Table 4) have been preferred for interpretation over GEFs based on a single grab sample (printed in
italic) owing to the improved temporal representivity of the water data.
U enrichment factors calculated for the different sediments in the study area vary by two orders of magnitude and range from a minimum of 46 in salt crusts in the GMB wetland at portion 7 (indicating a relatively high mobility of U, with much of the U being present in the aqueous phase and comparably little contained in the sediment) to a maximum of 8,450 in peat from the upper Mooi River (indicating a relatively low U mobility, with much of the U being accumulated in the peat while only a low proportion is dissolved in surrounding water).
Grouped according to the different water bodies, sediments in the Mooi River display the highest relative enrichment for U with an average GEF of 4,627 while the absolute U concentration levels in the sediments rank amongst the lowest. The high GEF value results mostly from the peat sample and is in good agreement with the frequently reported ability of peat to accumulate and re-concentrate U even from waters with very low U levels.
In contrast, the relative U accumulation in the highly polluted sediments of the lower WFS is only half of this value (average GEF: 2,091; 6 systems). (In this context it is to be noted that sediment in the upper Turffontein (up Tfnt dam) displayed a relatively low U concentration [28 mg/kg] resulting in a low GEF [298 compared to 1,700–3,600 in other adjacent dams]. In order to avoid skewing the GEF average for the WFS sediments the U concentration was normalized for the contents of organic substances which resulted in an equivalent U level of 150 mg/kg and an associated GEF of 1,596. The latter value was then used for calculating the average GEF of dam sediments from the WFS.)
Compared to peat samples from the GMB wetland and the upper Mooi River, the ability of the fluvial sediments (which mainly consist of organic rich sludge from shallow farm dams) to immobilize U is between 2- and 4-times lower (average GEF of peat from the GMB wetland: 3,994; peat from the Mooi River: 8,455). Alluvial sediments from the GMB-wetland (average GEF: 1,146; 6 systems) show that the WFS—dam sediments are almost double as effective in U removal. This may be due to the higher contents of organic substance in sediments from the WFS dams (up to 27 wt%) as well as a more frequent exposure to U contaminated water. The latter is supported by the profound differences at the transect of portion 7 between near-stream soil that is relatively often inundated (GEF: 4,727) and soil well away from the stream, near the (dry and seldom flooded) edge of the wetland (GEF: 63) (
Figure 14). The fact that U levels at the far-stream area, which is affected by an uraniferous groundwater plume migrating into the wetland, are over 10-times higher than in the stream, which suggests that higher U levels in water do not necessarily result in high U concentrations in corresponding sediments (
Figure 14). In addition, there are a number of mechanisms specific to shallow farm dams (including, for example, eutrophication-related, algae-induced pH-fluctuations that trigger co-precipitation of U along with iron hydroxides and calcite) which explain their higher removal efficiency compared to wetlands [
5].
A similar high rate of U enrichment is displayed in carbonates forming crusts on the surface of previously mined peat heaped up in the wetland as well as in precipitated calcite (sinter) sampled at the downstream side of the dam wall at the eye. At comparatively low absolute U levels (3–4 mg/kg) both carbonates show relatively high GEFs ranging from 2,909 for the sinter to 3,636 for the carbonate crust on the peat surface (average GEF: 3,273). If this GEF is applied to scales sampled from 10 water kettles of the downstream municipality of Potchefstroom, this shows an average of 20 mg/kg U, the corresponding (long-term) average U concentration in the boiled tap water can be calculated as 6.1 µg/L (20 mg/kg: 3,273 = 0.0061 mg/L).


 upstr. of Blyvoor. canal
  (upper)
 upstr. of confluence with WFS


 )
)


