Framework for Enhancing the Supply-Demand Balance of a Tri-Supply Urban Water Scheme in Australia


Abstract
:1. Introduction
2. Research Method
- (1)
- Population at 2056: 120,000 to 150,000 (3 values used): the three values were taken from Australian Government Statistical population forecasts for the region under examination.
- (2)
- Peak day factor: 1.8 to 2.3 (2 values used). The typical design value applied in network design in the region is 2.3 (e.g., Gold Coast Planning Scheme Policies, 2008), but this is considered conservative based on current peaking levels thus a lower 1.8 factor was considered as well.
- (3)
- Increment of recycled water used for irrigation: 0% to 100% (5 values used). There are a number of reasons for the large range for increasing irrigation demand. Firstly, the end use values underpinning the base case recycled water irrigation value was lower than that recorded historically (i.e., pre-2005). Moreover, there is potential for a rebound in irrigation due unpredictable future climate change causing dryer seasons and behavioural changes.
- (4)
- Percentage of cold water used by washing machines: 70% to 90% (3 values used). This range of values was based on a market survey on the current cold water consumption of washing machines of different brands.
- (5)
- Percentage of recycled water used for washing clothes: 50% to 100% (4 values used). This value was difficult to accurately quantify due to the lack of existing available evidence on potential uptake of recycled water for clothes washing. Therefore, a relatively large interval range was considered appropriate.
3. Results
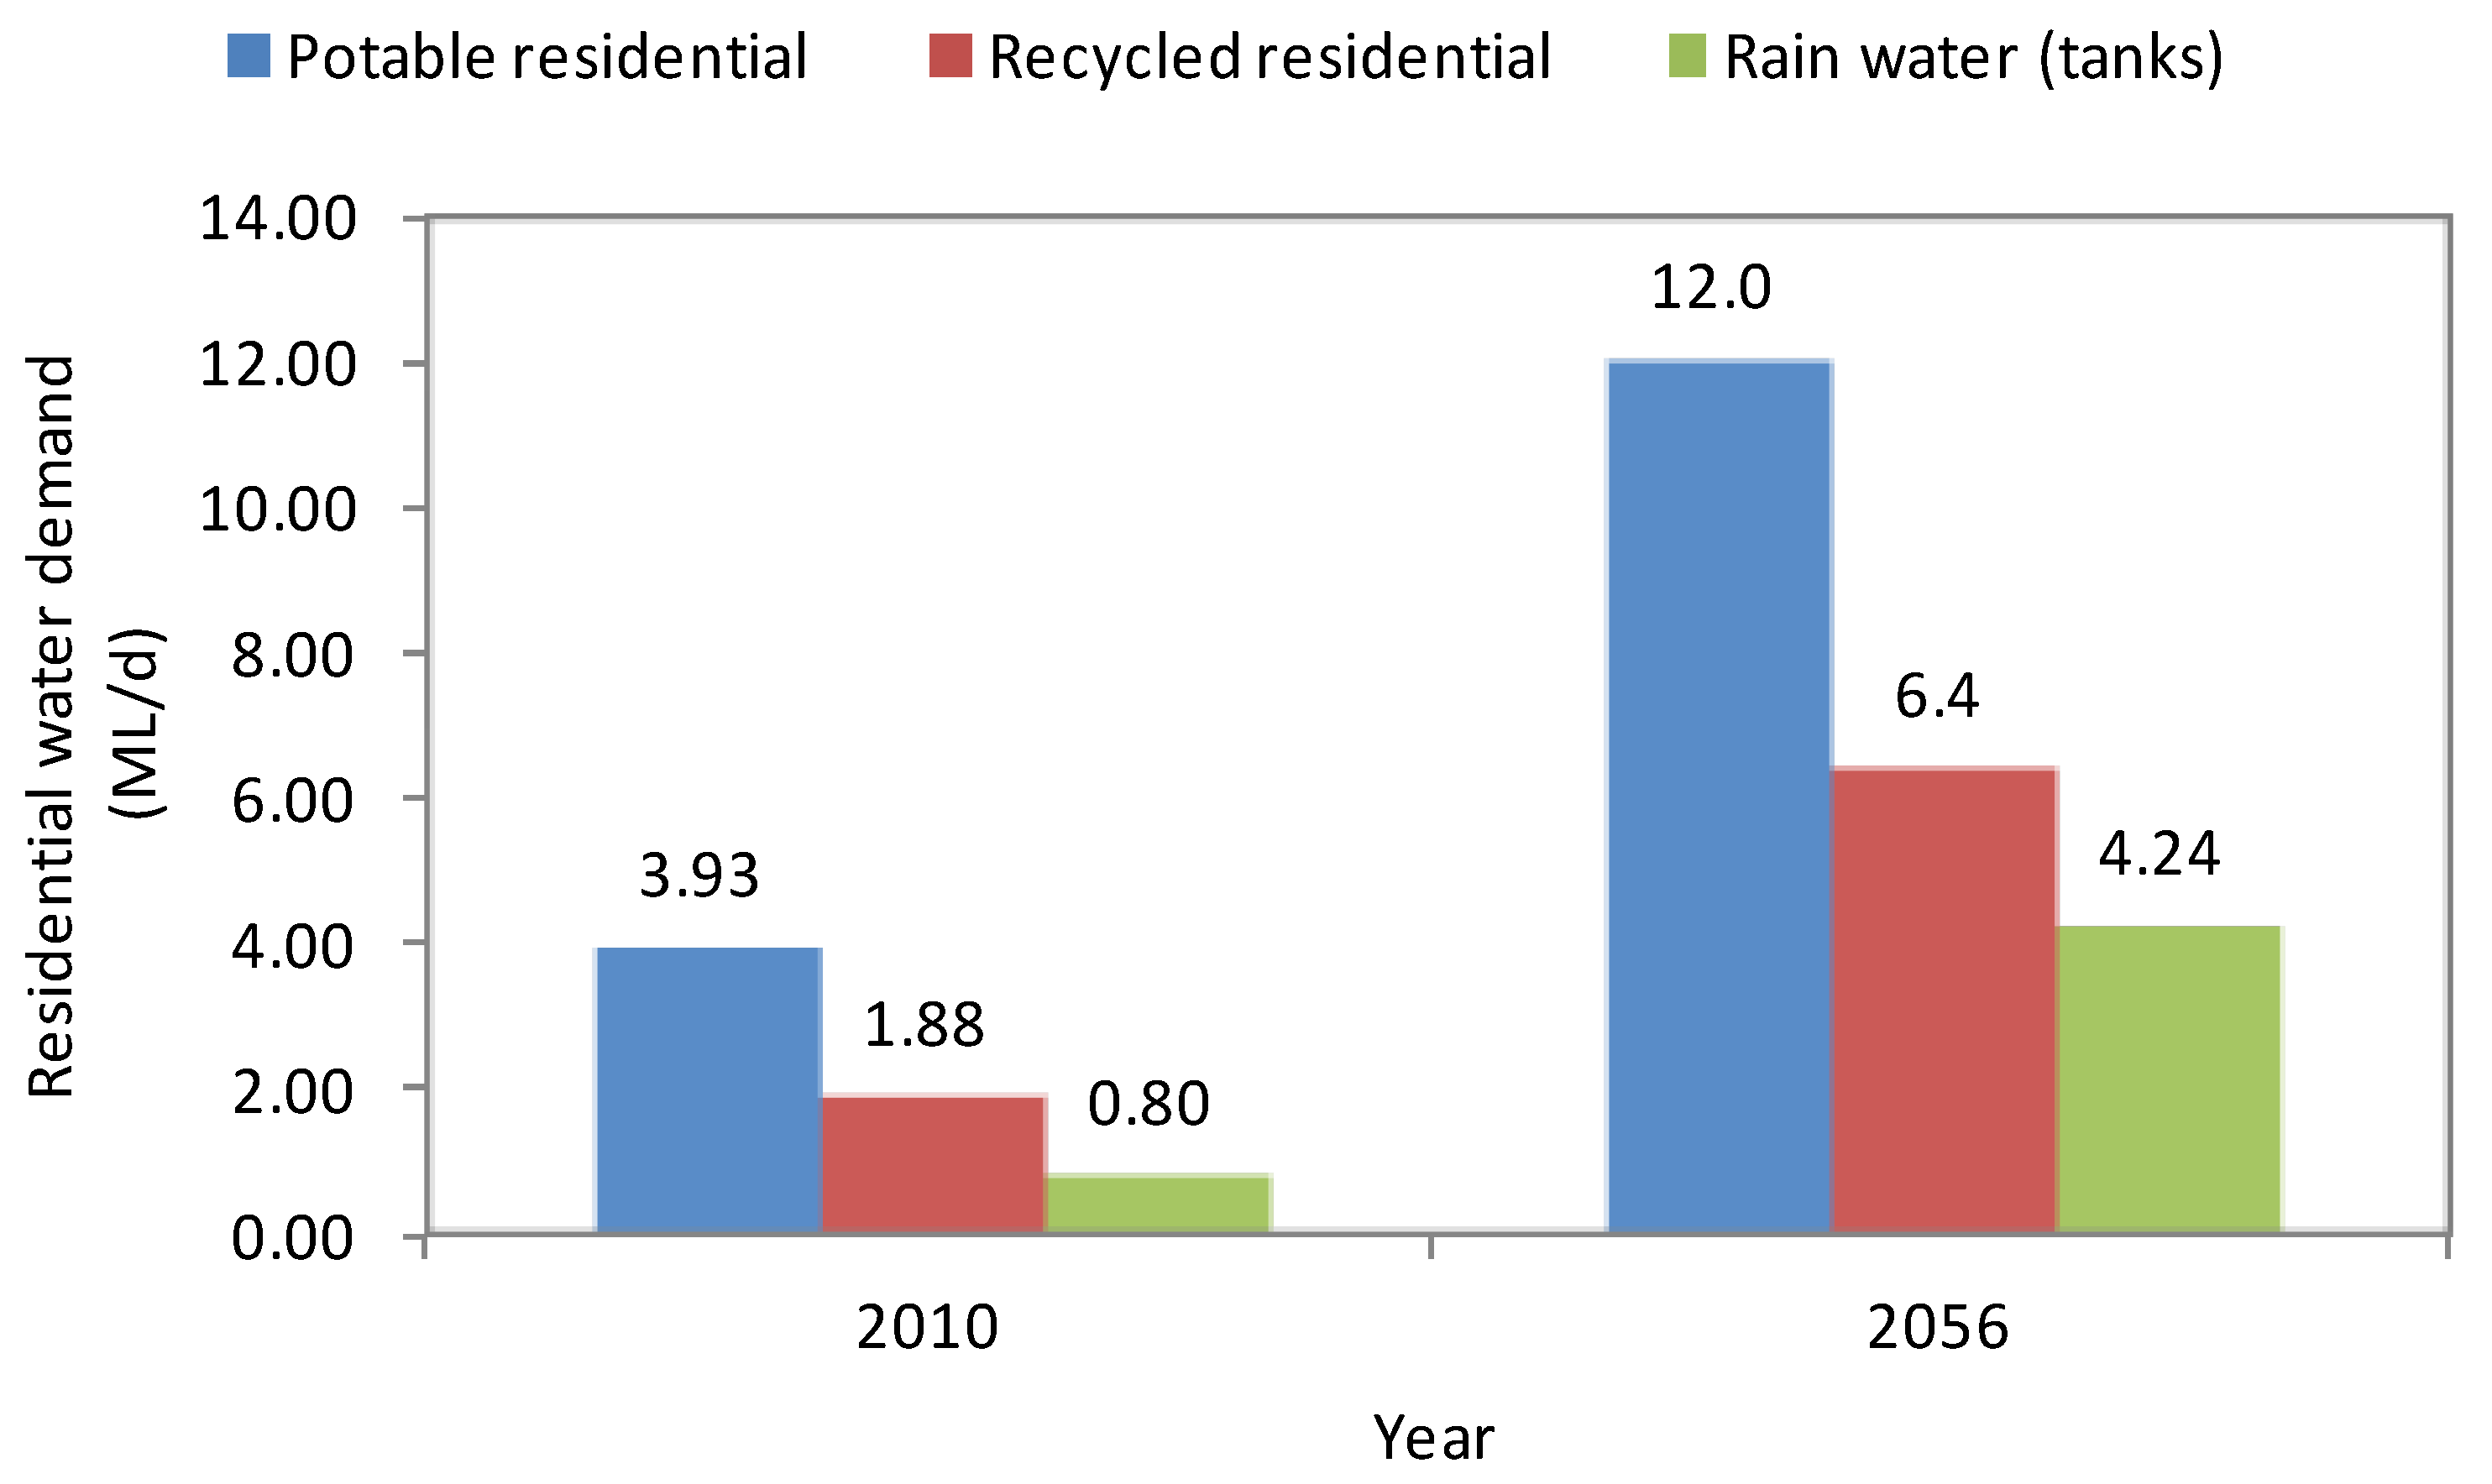
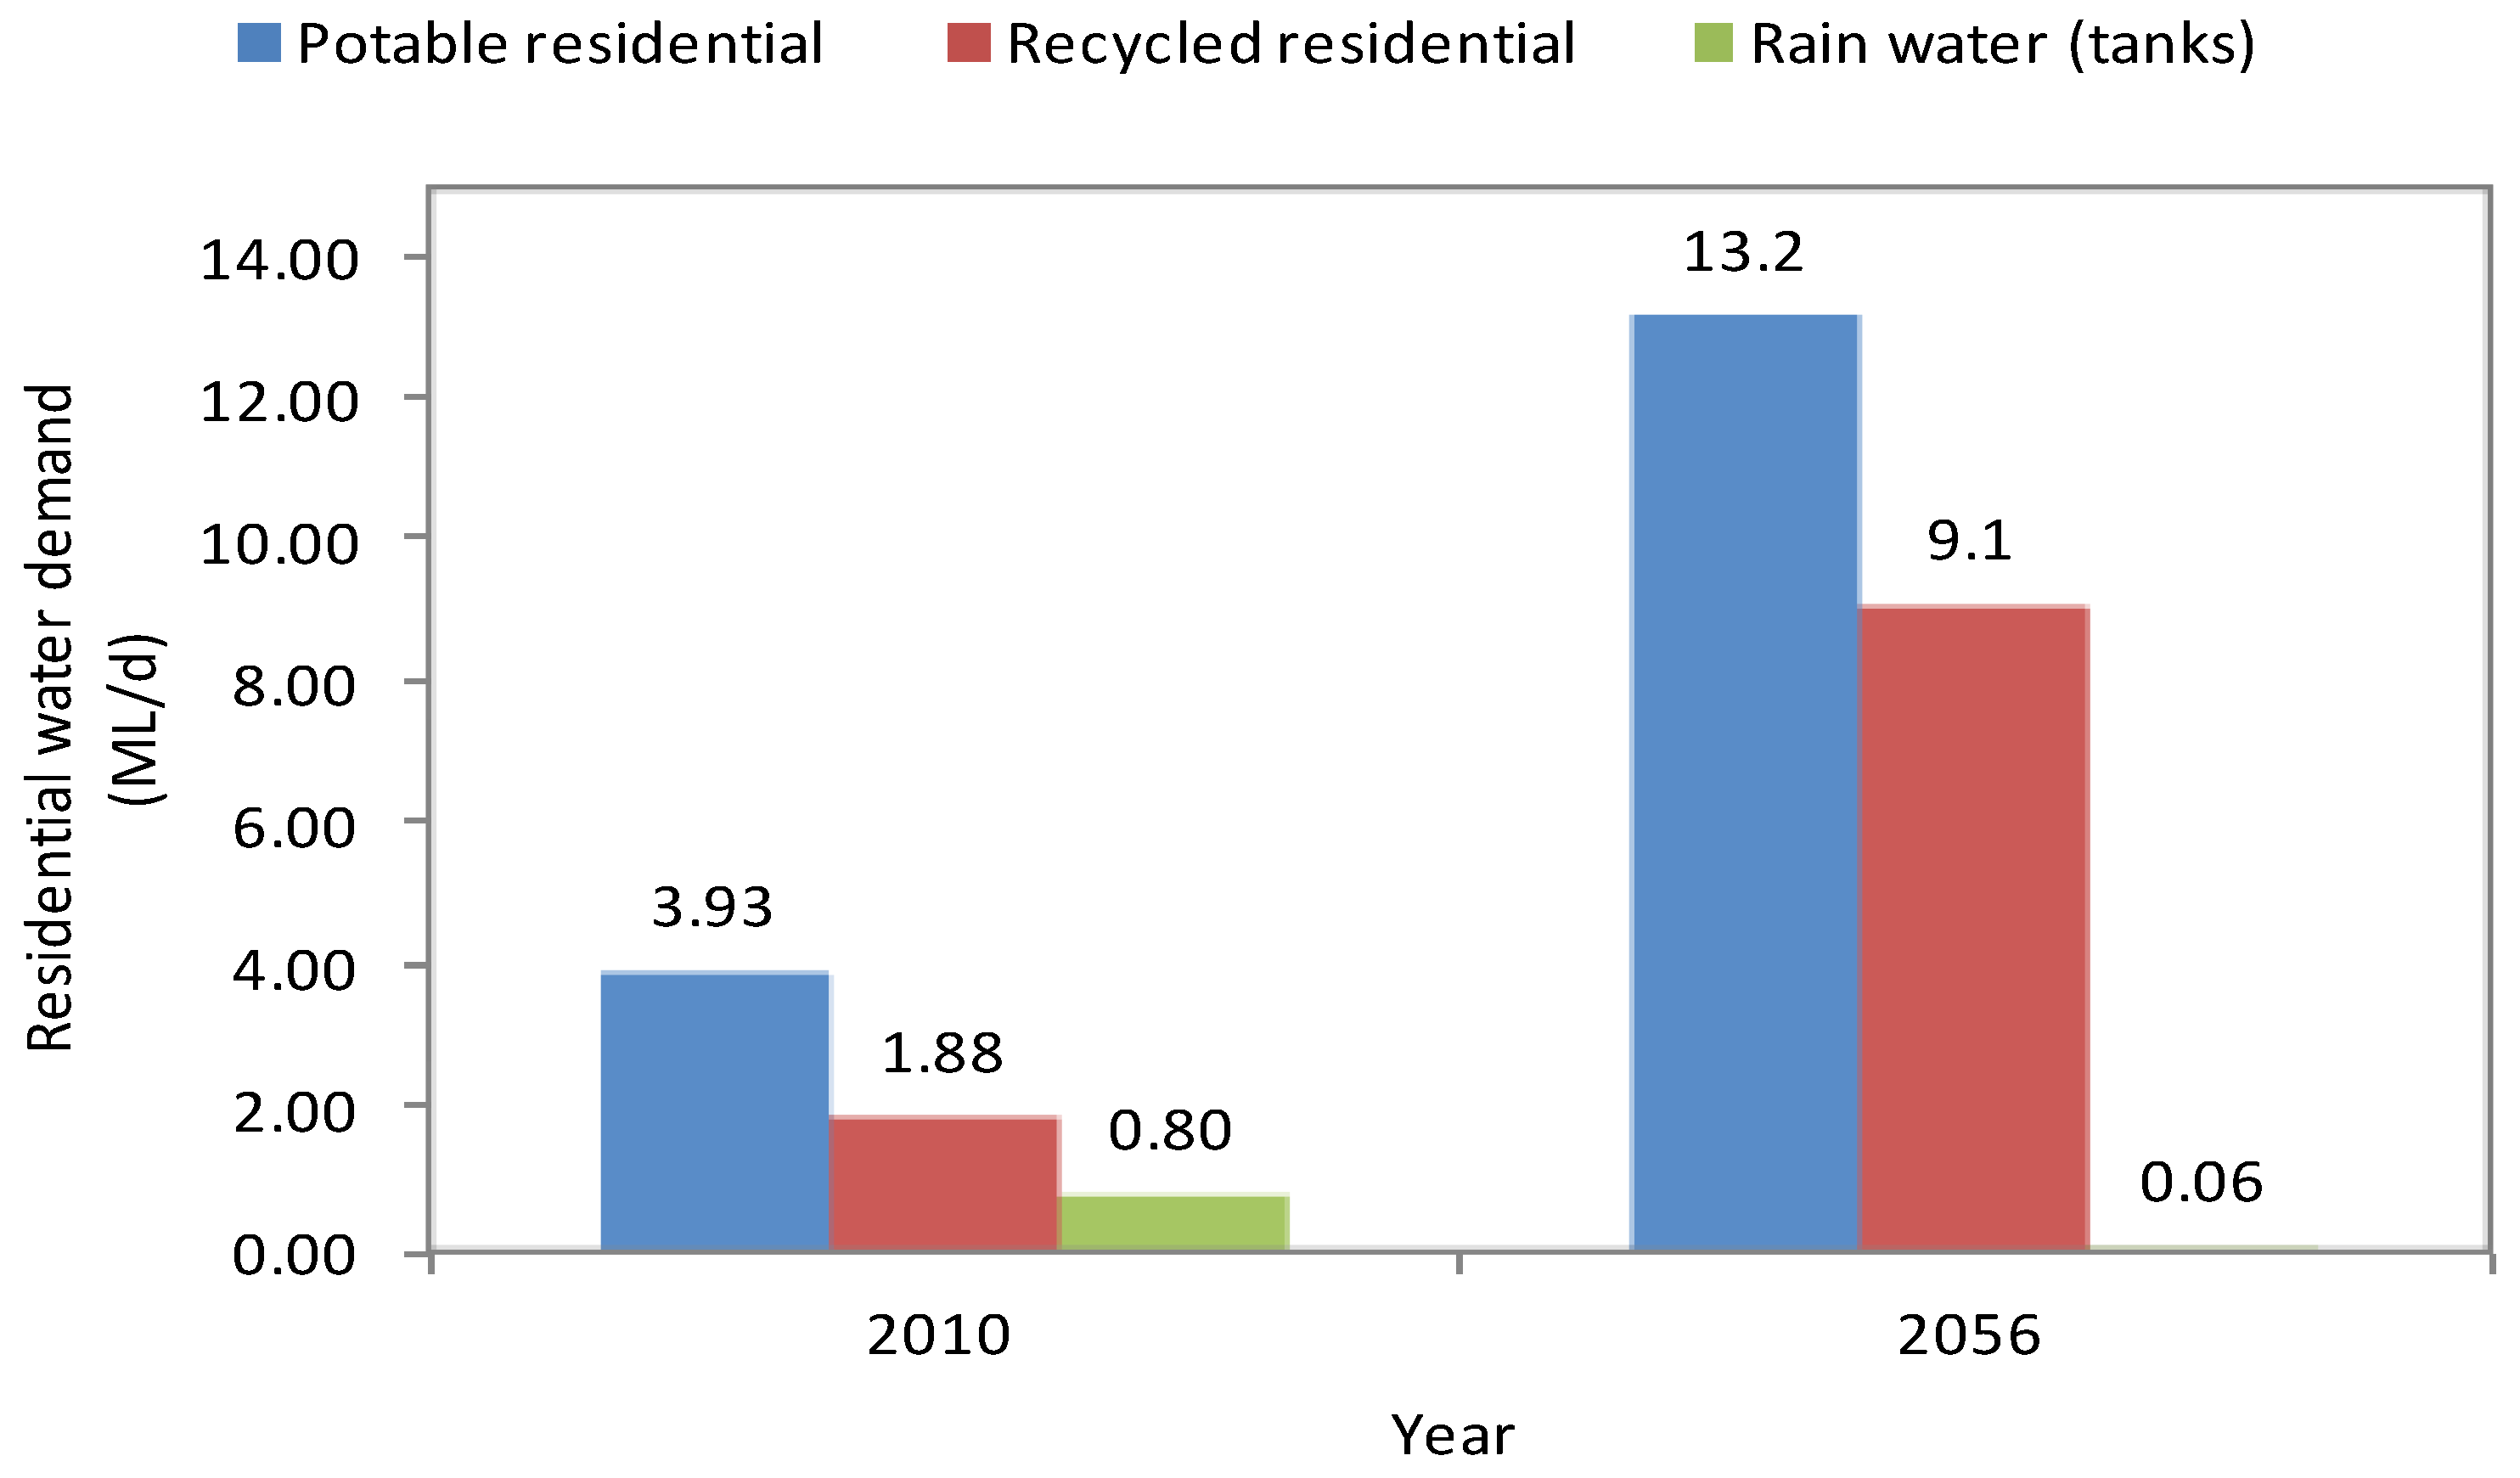
3.1. Current Demand

| Factor | Dual supply | Tri-supply | Total |
|---|---|---|---|
| Inhabitants | 15,942 | 23,810 | 39752 |
| Residential: potable | 1.86 | 2.08 | 3.93 |
| Residential: recycled | 0.76 | 1.13 | 1.88 |
| Residential: rainwater | 0.00 | 0.80 | 0.80 |
| Non-Residential: potable | 0.66 | ||
| Non-Residential: recycled | 0.08 | ||
| Total potable | 4.60 | ||
| Total recycled | 1.96 | ||
| Total rain water | 0.80 |
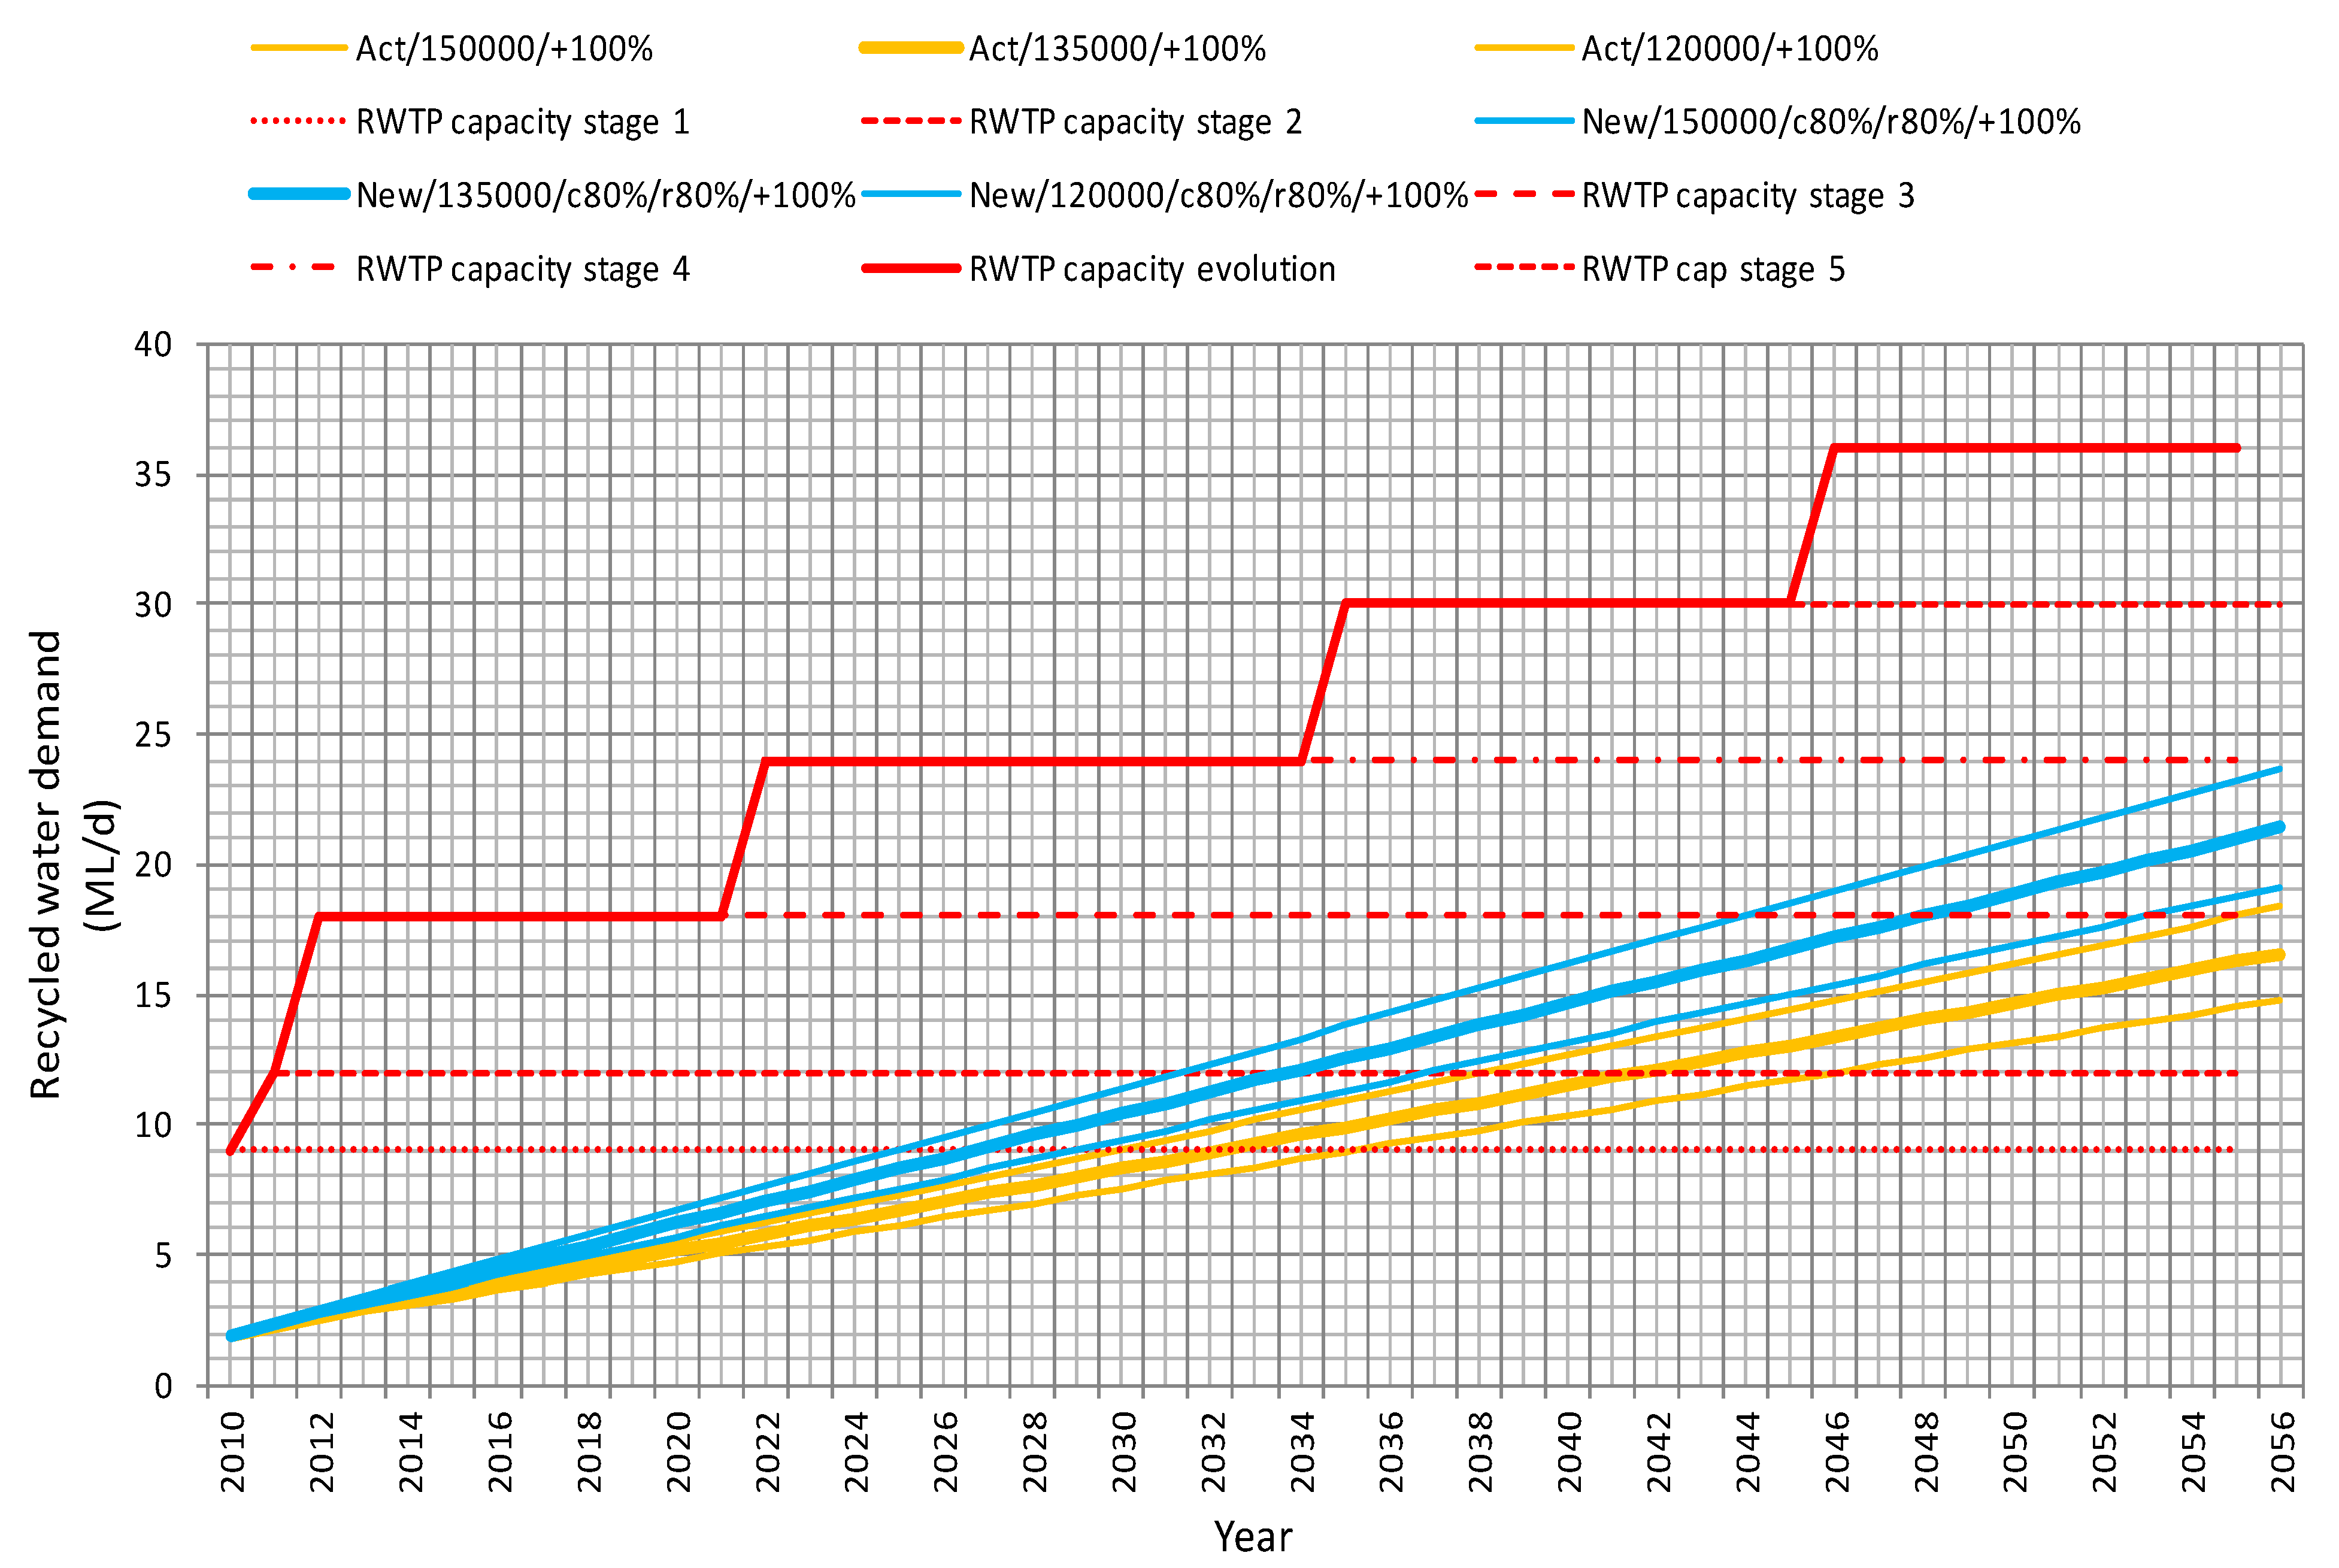
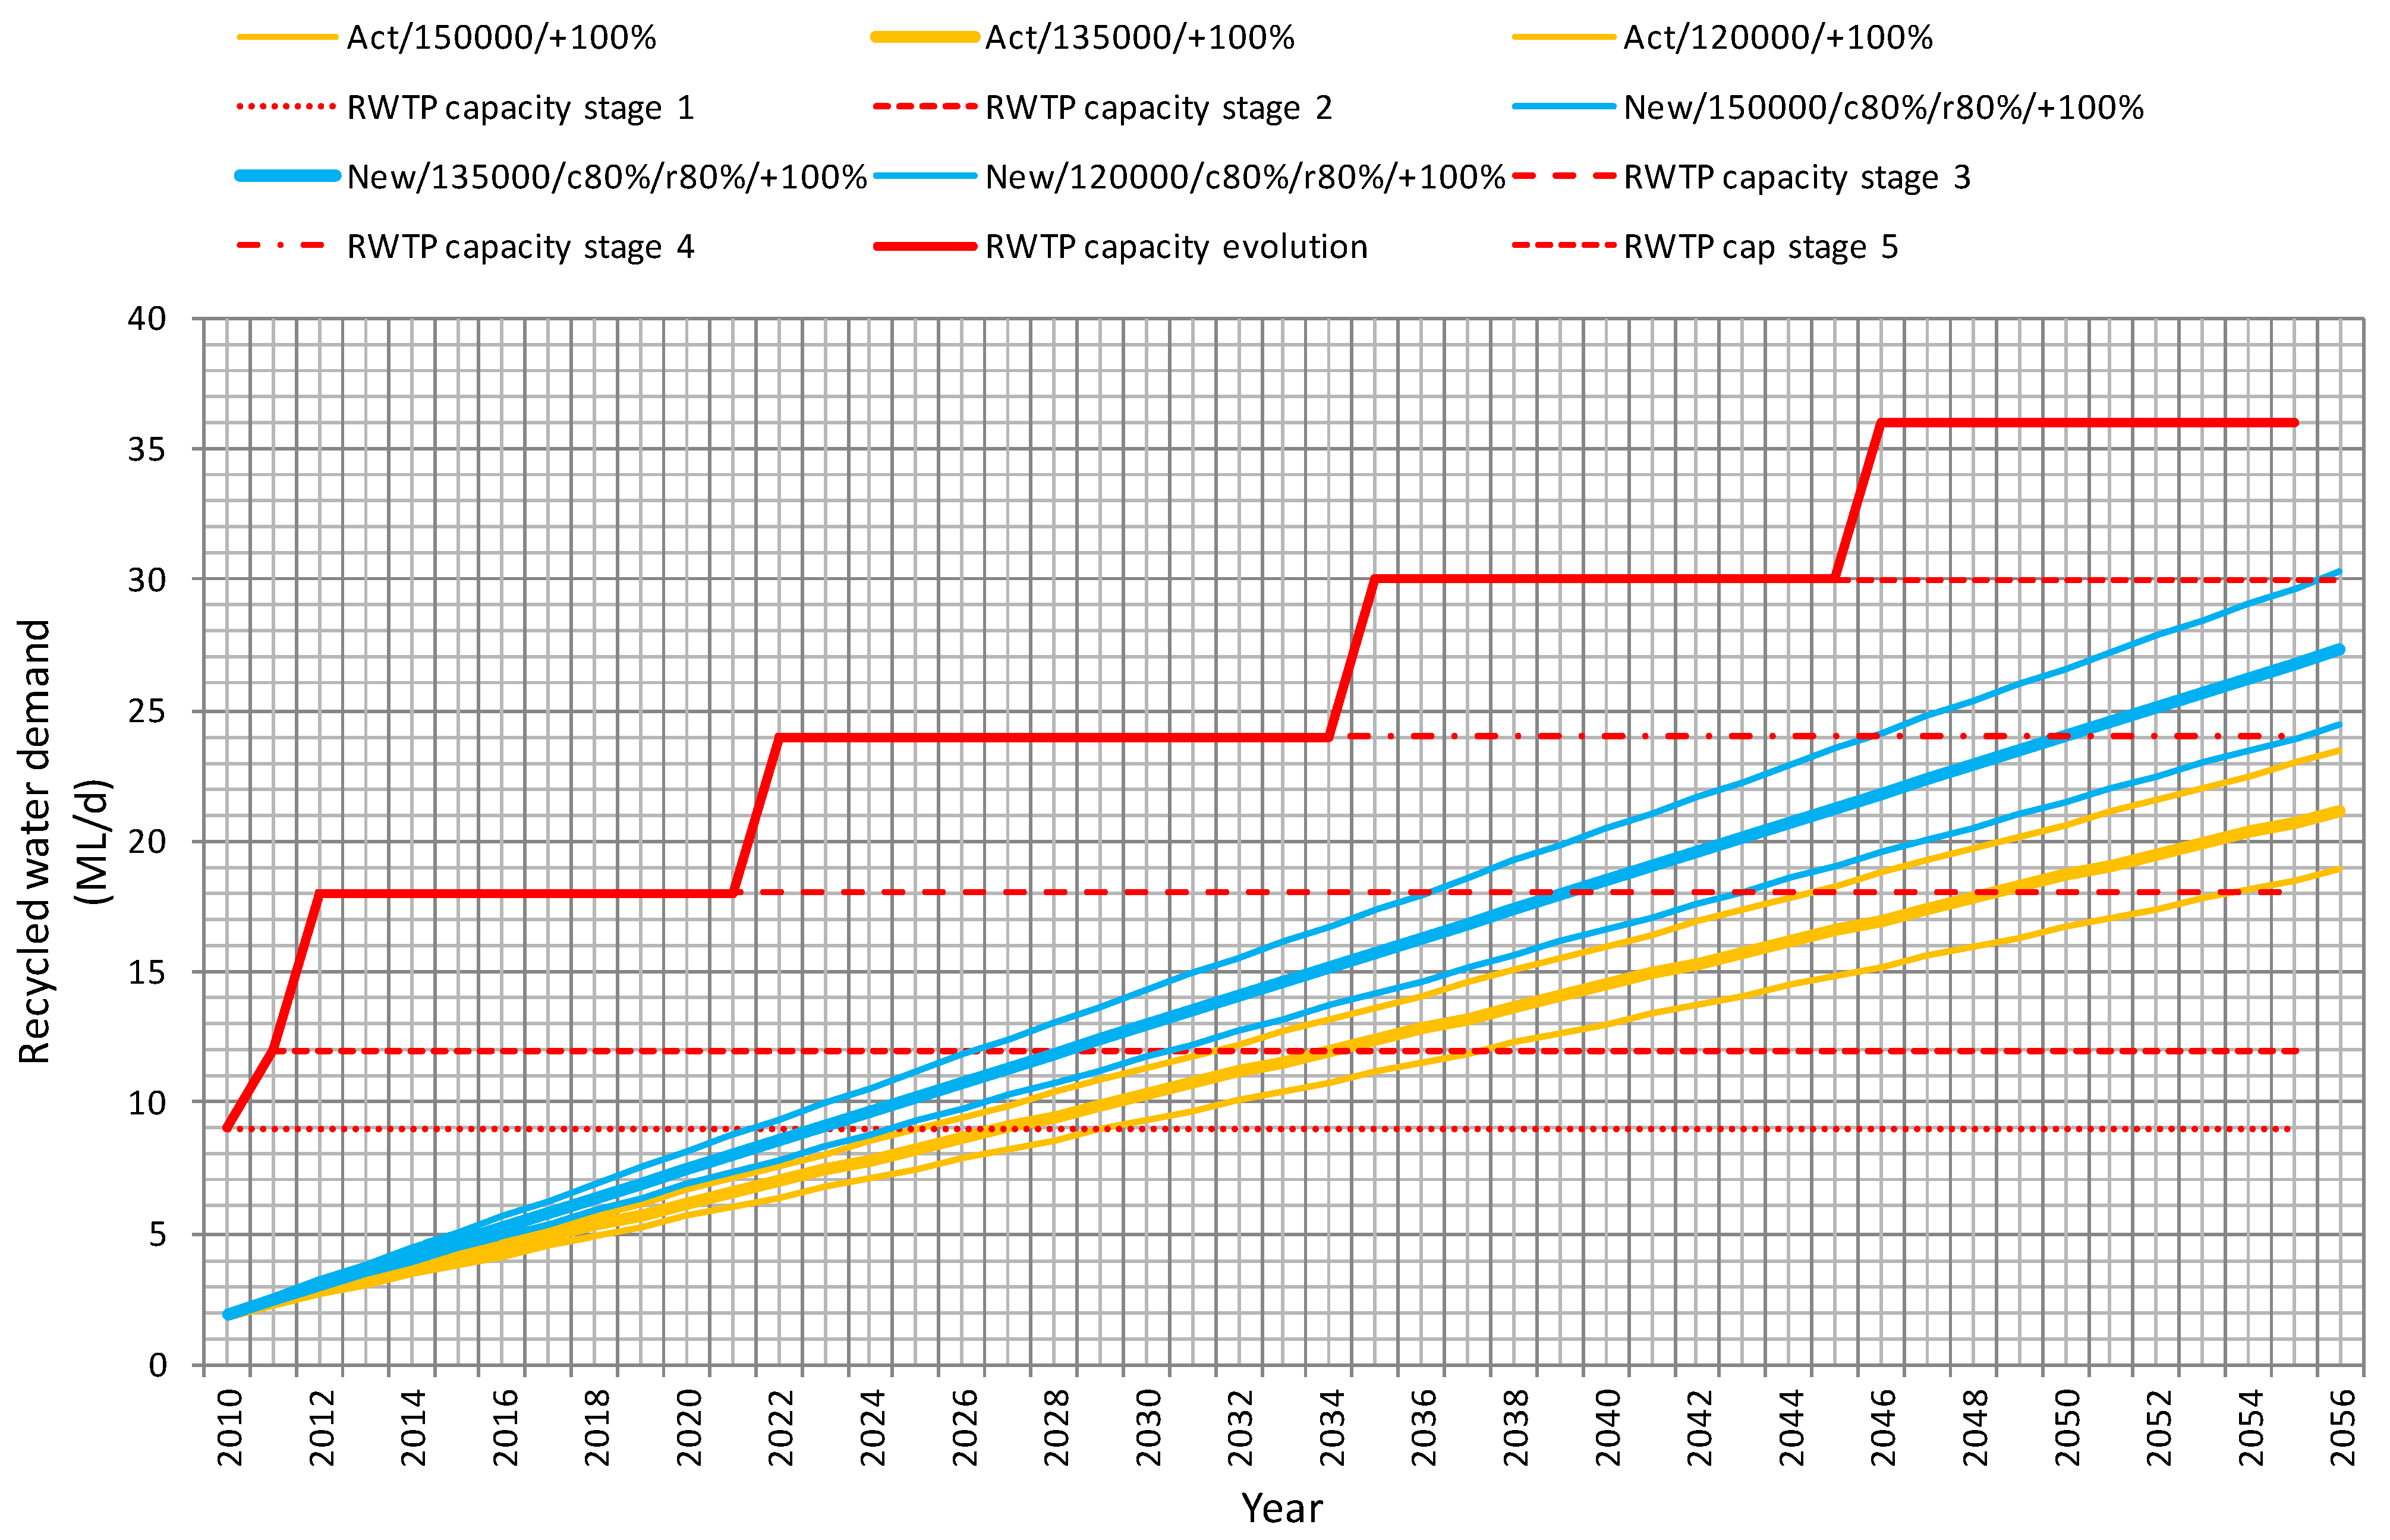
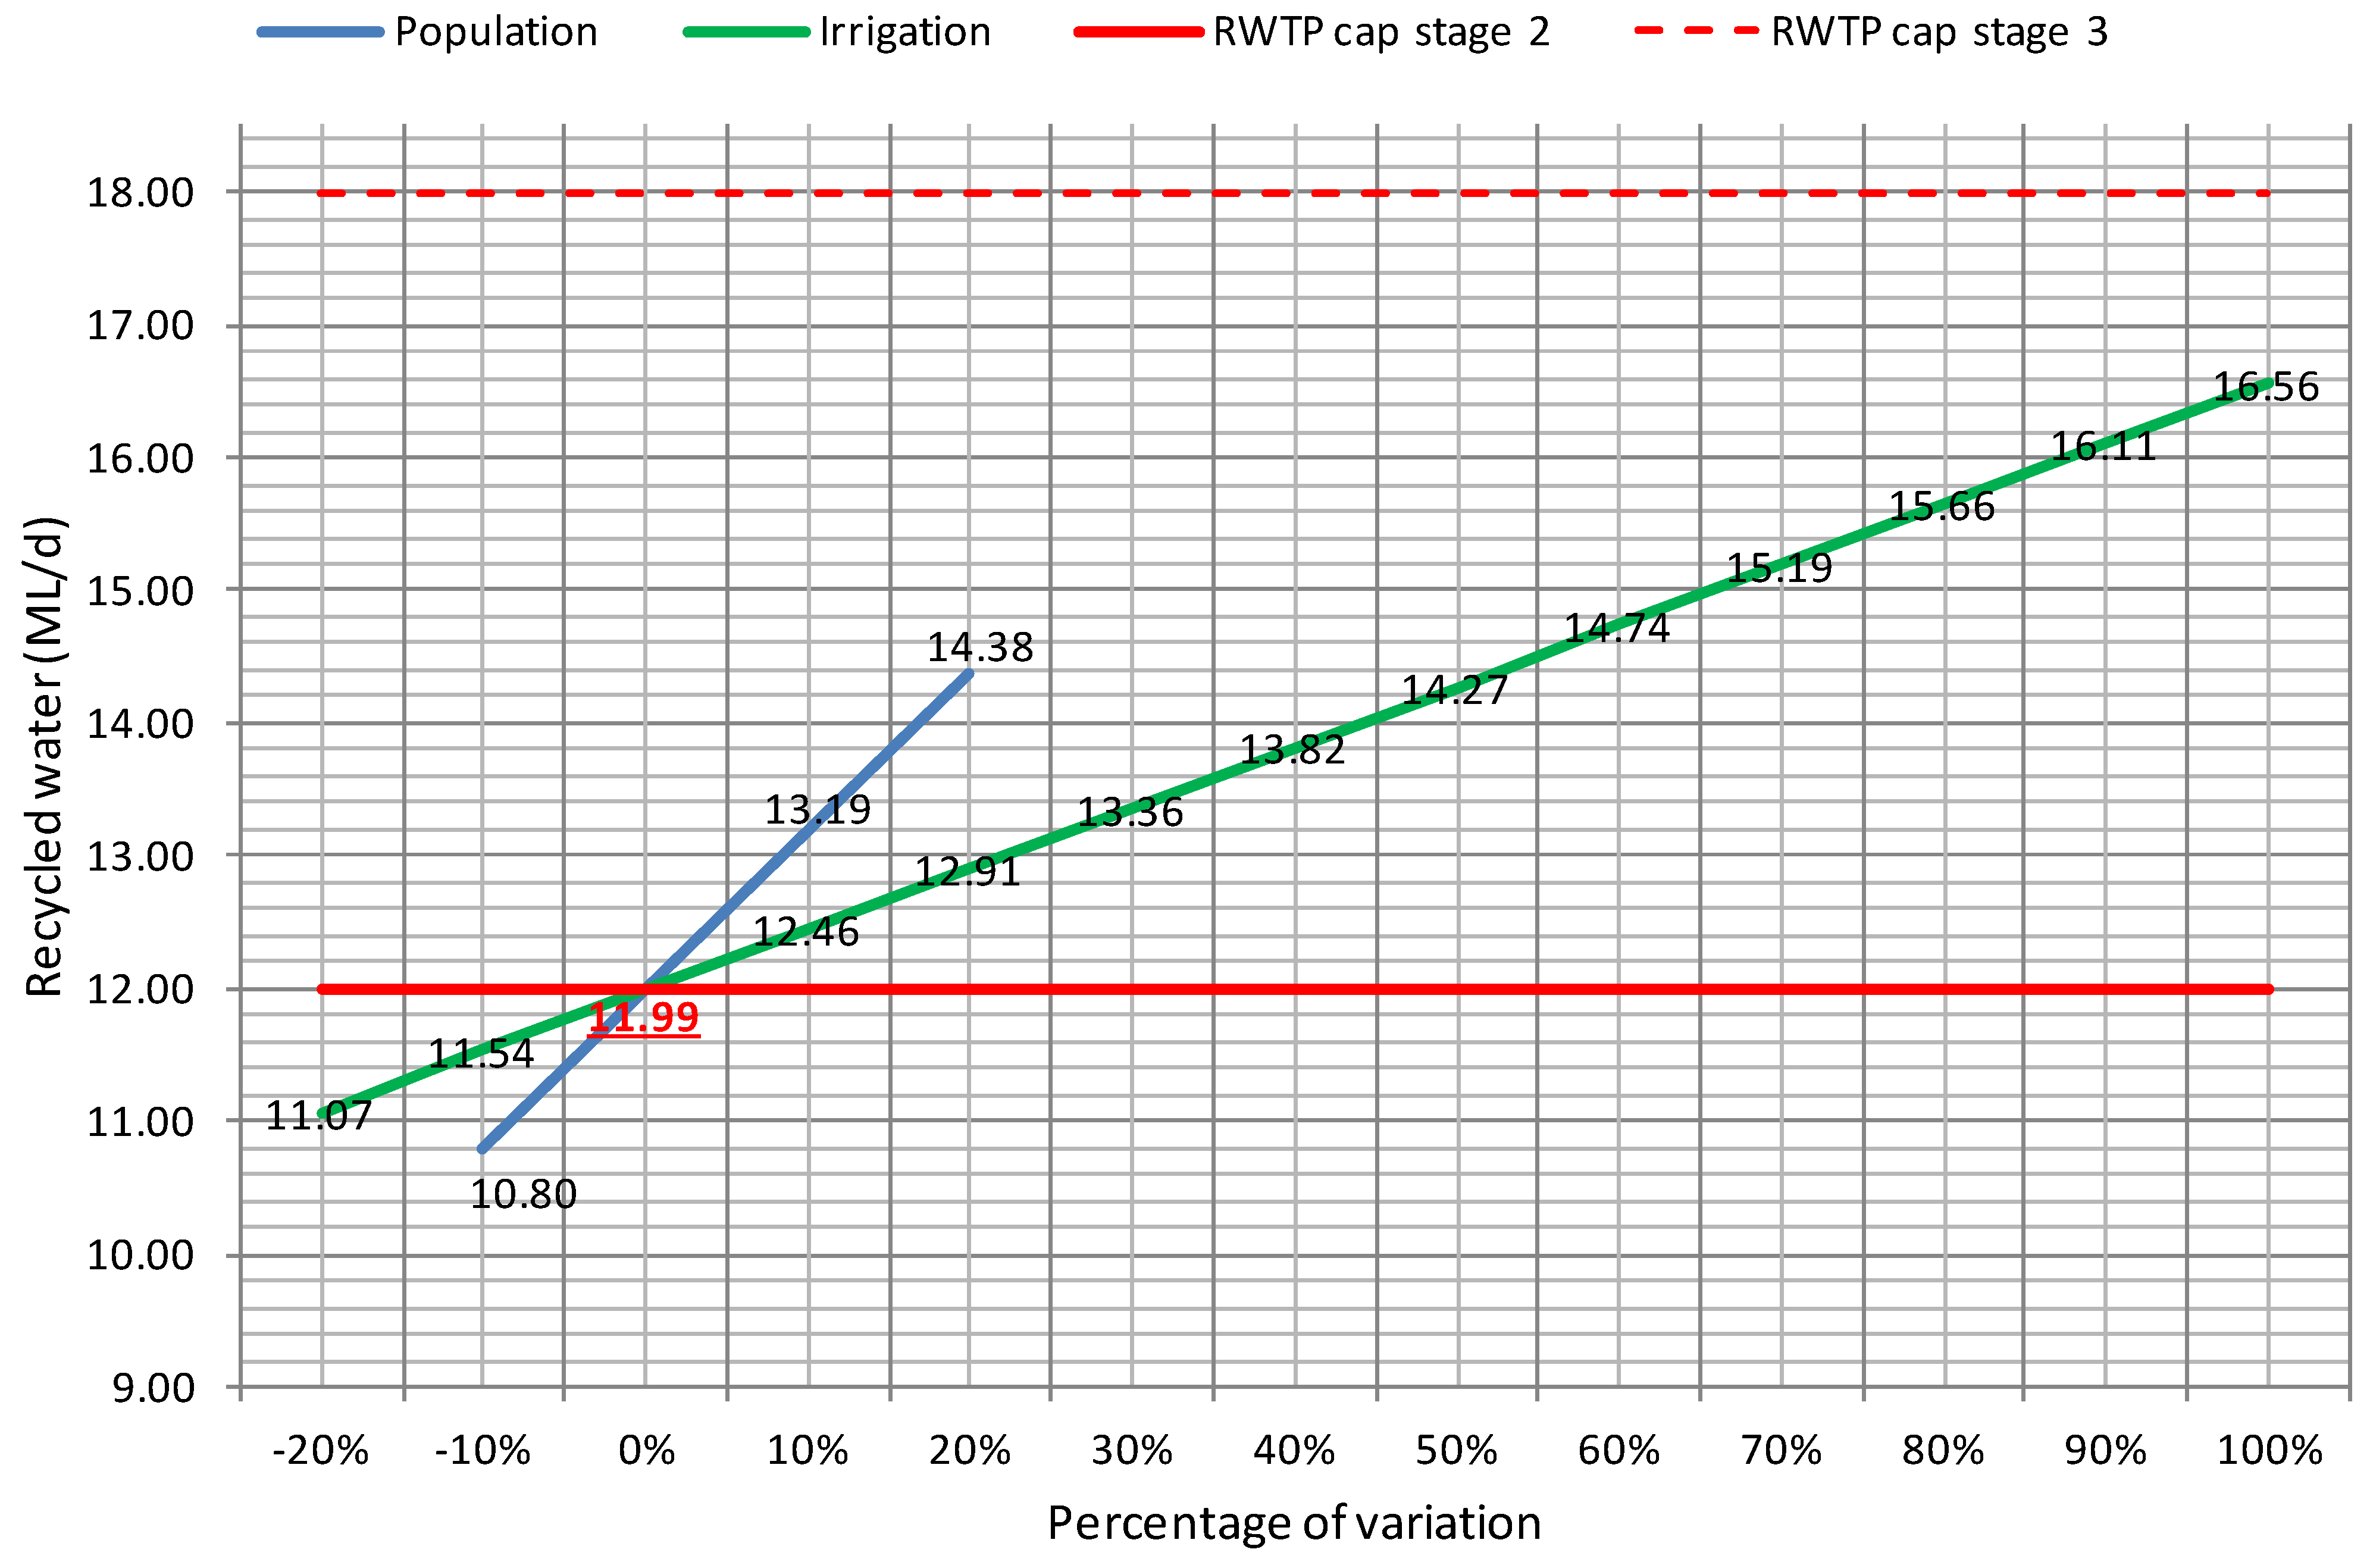
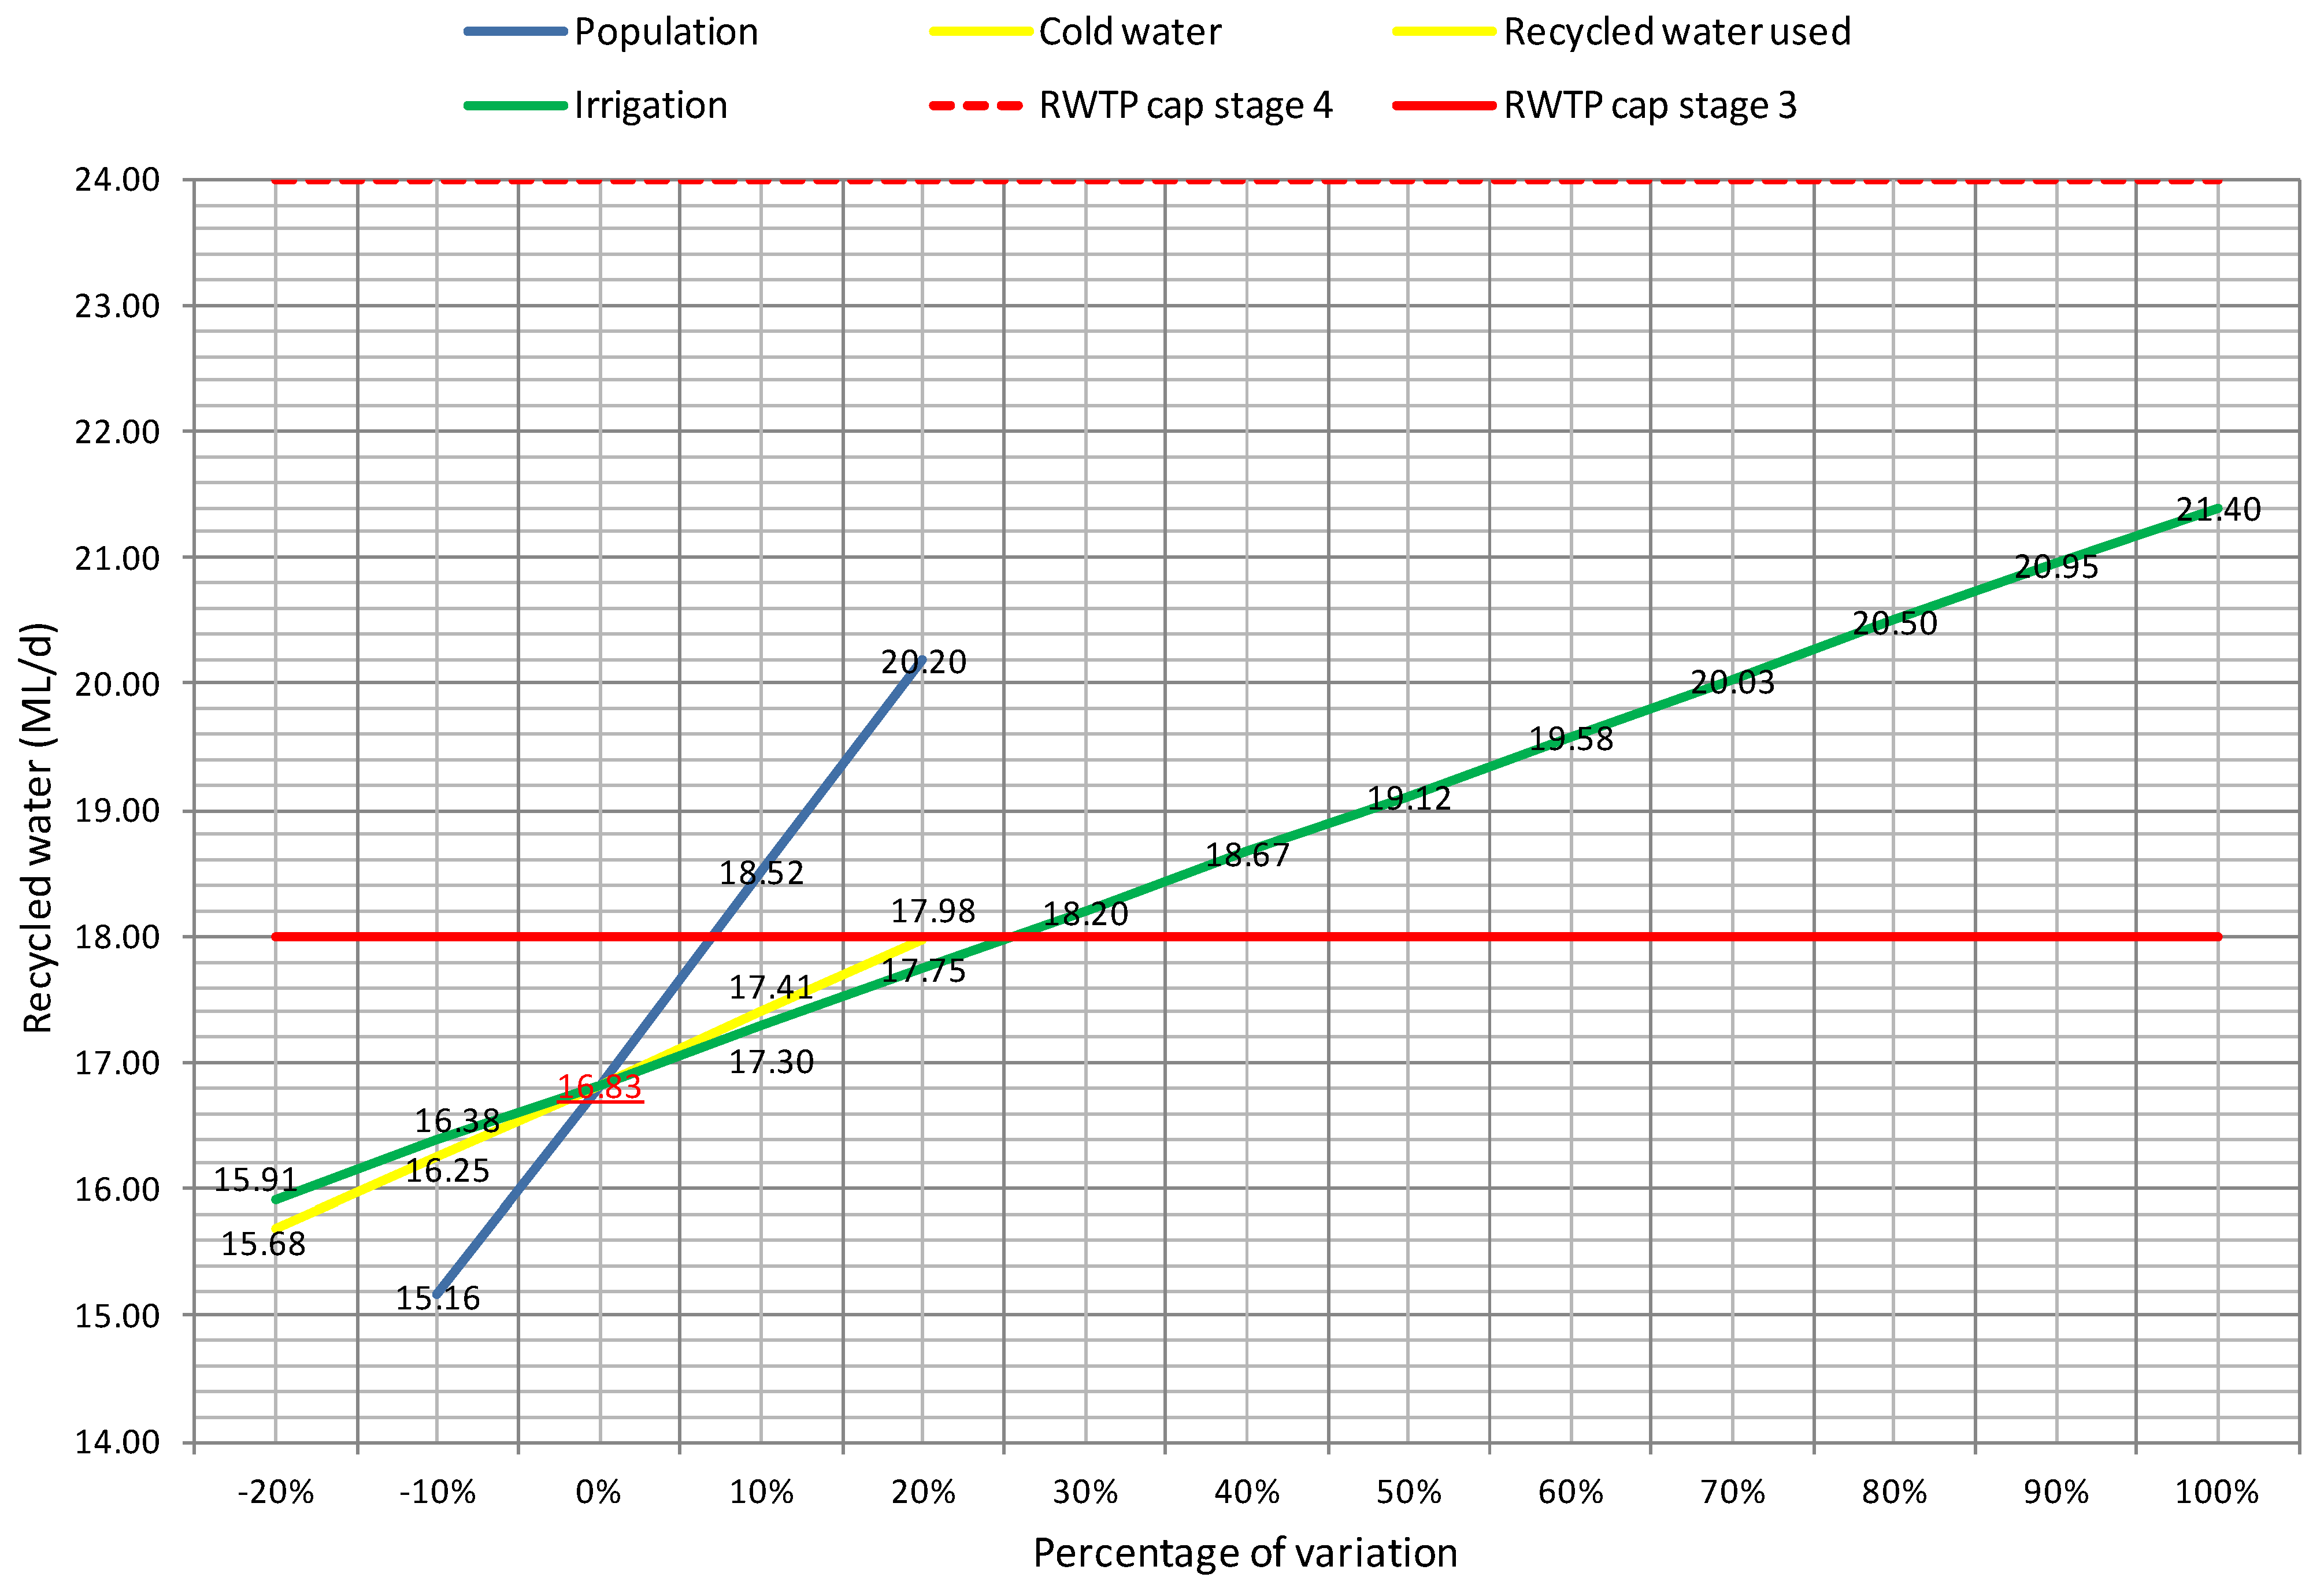
3.2. Future Demand


4. Discussion
| Scheme Variables | Current scheme (RWTP stage needed) | Proposed scheme (RWTP stage needed) | ||||||||||
| Scenario type | Lower | Base case | Upper | Lower | Base case | Upper | ||||||
| Peak factor applied | 1.8 | 2.3 | 1.8 | 2.3 | 1.8 | 2.3 | 1.8 | 2.3 | 1.8 | 2.3 | 1.8 | 2.3 |
| % change in population | 2 | 3 | 2 | 3 | 3 | 3 | 3 | 4 | 3 | 4 | 4 | 4 |
| % change in cold water utilised for clothes washer | 2 | 3 | 2 | 3 | 2 | 3 | 3 | 4 | 3 | 4 | 3 | 4 |
| % change in recycled water utilised for clothes washer | 2 | 3 | 2 | 3 | 2 | 3 | 3 | 4 | 3 | 4 | 3 | 4 |
| % change in irrigation | 2 | 3 | 2 | 3 | 3 | 4 | 3 | 4 | 3 | 4 | 4 | 5 |
5. Conclusions
References
- Bates, B.; Kundzewicz, Z.W.; Wu, S.; Palutikof, J. Climate Change and Water; Technical Paper of the Intergovernmental Panel on Climate Change; IPCC Secretariat: Geneva, Switzerland, 2008. [Google Scholar]
- Australian Bureau of Statistics. Regional Population Growth. Catalogue no. 3218.0; Gold Coast, Australia, 30 March 2010. [Google Scholar]
- Willis, R.M.; Stewart, R.A.; Panuwatwanich, K.; Williams, P.R.; Hollingsworth, A.L. Quantifying the influence of environmental and water conservation attitudes on household end use water consumption. J. Environ. Manag. 2011, 92, 1996–2009. [Google Scholar] [CrossRef]
- Willis, R.M.; Stewart, R.A.; Emmonds, S. Pimpama-Coomera dual reticulation end use study: Pre-commission baseline, context and post-commission end use prediction. Water Sci. Technol. 2010, 10, 302–314. [Google Scholar]
- Willis, R.M.; Stewart, R.A.; Panuwatwanich, K.; Jones, S.; Kyriakides, A. Alarming visual display monitors affecting shower end use water and energy conservation in Australian residential households. Resour. Conserv. Recycl. 2010, 54, 1117–1127. [Google Scholar] [CrossRef]
- Gold Coast Water. In Rainwater, an Essential Ingredient in Pimpama-Coomera; Gold Costal City Council: Queensland, Australia, 2007.
- Beal, C.; Gardner, T.; Sharma, A. A Preliminary Analysis of Potable Water Savings from Mandated Rainwater Tanks in New Residential Properties in SEQ. In Presented at the Urban Water Security Research Alliance Science Forum, Brisbane, Australia, 24–25 August 2009.
- Went, D. The Gold Coast Experience: Pimpama-Coomera Waterfuture Master Plan; Gold Costal City Council: Queensland, Australia, 2008. [Google Scholar]
- Hurlimann, A. Community Attitudes to Recycled Water Use: An Urban Australian Case Study; Research Report Number 56; Cooperative Research Centre for Water Quality and Treatment: Mt Barker, SA, Australia, 2008. [Google Scholar]
- Pham, T.; Ngo, H.; Guo, W.; Dung Dang, H.P.; Mainali, B.; Johnston, A.; Listowski, A. Responses of community to the possible use of recycled water for washing machines: A case study in Sydney, Australia. Resour. Conserv. Recycl. 2011, 55, 535–540. [Google Scholar] [CrossRef]
- Willis, R.M. Residential Water End Use Consumptions Analysis: An Investigation of the Water Savings Attributed to Demand Management Strategies and Dual Reticulated Recycled Water Systems. Ph.D. Dissertation, Griffith University, Gold Coast, Australia, 2010. [Google Scholar]
- Stewart, R.A. Verifying the End Use Potable Water Savings From Contemporary Residential Water Supply Schemes; Waterlines Report for the National Water Commission: Gold Coast, Australia, 2011. [Google Scholar]
- Willis, R.M.; Stewart, R.A.; Williams, P.; Hacker, C.; Emmonds, S.; Capati, G. Residential potable and recycled water end uses in a dual reticulated supply system. Desalination 2011, 272, 201–211. [Google Scholar] [CrossRef]
© 2011 by the authors; licensee MDPI, Basel, Switzerland. This article is an open access article distributed under the terms and conditions of the Creative Commons Attribution license (http://creativecommons.org/licenses/by/3.0/).
Share and Cite
Bertone, E.; Stewart, R.A. Framework for Enhancing the Supply-Demand Balance of a Tri-Supply Urban Water Scheme in Australia. Water 2011, 3, 976-987. https://0-doi-org.brum.beds.ac.uk/10.3390/w3040976
Bertone E, Stewart RA. Framework for Enhancing the Supply-Demand Balance of a Tri-Supply Urban Water Scheme in Australia. Water. 2011; 3(4):976-987. https://0-doi-org.brum.beds.ac.uk/10.3390/w3040976
Chicago/Turabian StyleBertone, Edoardo, and Rodney A. Stewart. 2011. "Framework for Enhancing the Supply-Demand Balance of a Tri-Supply Urban Water Scheme in Australia" Water 3, no. 4: 976-987. https://0-doi-org.brum.beds.ac.uk/10.3390/w3040976