Review

Intelligent Metering for Urban Water: A Review

1
Institute for Sustainable Futures, University of Technology, Sydney, P.O. Box 123, Broadway, NSW 2007, Australia
2
Centre for Infrastructure Engineering and Management, Griffith University, PMB 50 Gold Coast Mail Centre, Queensland 9726, Australia
*
Author to whom correspondence should be addressed.
Submission received: 19 April 2013 / Revised: 14 May 2013 / Accepted: 18 June 2013 / Published: 11 July 2013

Abstract

:
This paper reviews the drivers, development and global deployment of intelligent water metering in the urban context. Recognising that intelligent metering (or smart metering) has the potential to revolutionise customer engagement and management of urban water by utilities, this paper provides a summary of the knowledge-base for researchers and industry practitioners to ensure that the technology fosters sustainable urban water management. To date, roll-outs of intelligent metering have been driven by the desire for increased data regarding time of use and end-use (such as use by shower, toilet, garden, etc.) as well as by the ability of the technology to reduce labour costs for meter reading. Technology development in the water sector generally lags that seen in the electricity sector. In the coming decade, the deployment of intelligent water metering will transition from being predominantly “pilot or demonstration scale” with the occasional city-wide roll-out, to broader mainstream implementation. This means that issues which have hitherto received little focus must now be addressed, namely: the role of real-time data in customer engagement and demand management; data ownership, sharing and privacy; technical data management and infrastructure security, utility workforce skills; and costs and benefits of implementation.

1. Introduction

The water industry is confronted by changing drivers in the sustainable management of urban water. External factors, including the impacts of climate change, drought, population growth and consolidation in urban centres [1,2,3] have all been increasing the onus on water service providers to adopt more sustainable approaches to urban water management as the era of cheap water fades [4,5,6,7]. Covering costs, monitoring non-revenue water and meeting customer demands for equity in billing in the face of rising water prices are some of the core challenges [8,9].
While financial sustainability remains critical, the accompanying challenge to achieve sustainable urban water management (SUWM) has also become a goal of strategic planning for water utilities. Indeed, many water service providers have been gradually evolving from their traditional supply oriented role as providers of water to embrace a variety of demand management strategies towards more sustainable urban water management [10] including the use of distributed and decentralised systems [11]. Measures that have been implemented to manage water demand include metering, water accounting and loss control, pricing and education. However, the success of these strategies critically requires accurate, adequate and reliable data that can be meaningfully and cost-effectively interpreted to help utilities improve customer services, reduce water losses and manage demand [12,13]. Add to this public discourse that suggests resource consumption and management is not only the responsibility of industry and governments, but also the responsibility of the individual, and the need for improved information at the consumer level becomes apparent [14]. To promote individual responsibility (whilst noting that context, culture and water-use habits are also important), residential customers in particular need access to timely, relevant and comprehensible information that can assist daily decision-making processes around resource use [9,15]. Whilst recent developments in mobile computing and telecommunications (e.g., smartphones, 4G networks) are improving this situation, the usefulness of this feedback is ultimately constrained by the frequency and resolution of data generated at the source, in this case, water meters.
Enter intelligent water metering (IM) which offers the potential to transform urban water management. IM enables the determination, in real-time or near real-time, of water consumption, and provides the possibility to read consumption both locally and remotely. Both in Australia and internationally, the discourse and the use of IM technology are being shaped by the interests of a number of key social, economic and political actors, with water service providers, consumers, technology vendors and regulators, in particular, contributing to the development agenda. This paper reviews the global development of intelligent metering for urban water with a particular focus on Australia. Whilst review studies have been undertaken in relation to use of intelligent metering in the electricity sector (e.g., [15,16,17,18,19,20,21]) and in water end-use analysis [22], a review of intelligent metering in urban water service provision, with an eye to perceived prospects, trials and deployments, has been lacking. The aim of the paper is to provide an overview of practices, prospects and pitfalls based on a review of IM deployments in Australia and abroad—from both the customer and utility perspective—and in doing so, identify a research agenda to ensure IM makes a purposeful contribution to SUWM.
The paper is arranged in five sections. The remainder of the introduction outlines the historical development of water metering, including intelligent metering. Given the differences in definitions and use of the term, the following section reviews and reconciles definitions of intelligent metering. We then synthesise applications of IM in the water sector with an Australian focus, but global outlook, to better understand the rationale for its adoption. Drawing on perspectives from the energy sector and the goal of SUWM, we conclude by outlining future challenges and opportunities for intelligent water metering.

1.1. A Brief History of Metering

Early interest in measuring water can be seen in first century writings on the urban supply of water in Rome by water commissioner, Sextus Julius Frontinus. His texts included details on the sources, length and function of each of the city’s aqueducts, yet struggled with the critical issue of measuring water flow [23]. Important contributions by engineers in Western Europe and the U.S. beginning from the 18th century to the present day have aided progressive developments in water flow measurement, allowing the science and technology for water supply, distribution and measurement to reach its present state [23].
There has been a gradual development in the deployment and use of customer flow registration meters. Since the mid 1900s economists have argued for water service providers to move towards a more commercial approach to water service delivery through dedicated water bills rather than the recovery of supply costs through rates and taxes [24]. The main drivers for this were the need to recover costs directly from the customer, to cut out an intermediary body and to ring fence the financial operations from other government activities. Secondly, it was viewed to be more equitable to the customer, where the associated water bill was linked to the volume consumed, rather than a flat rate or a fee based on the size of property serviced [24,25]. Individual metering also allowed the introduction of rising block tariffs based on a differentiated volume of consumption to firstly allow for cross-subsidisation of poorer low users by the usually wealthy high users, and secondly to encourage the high end users to reduce their consumption in resource constrained regions through market forces [26]. Empirical analysis has shown that in developed countries such as Canada, USA, Australia, UK and Israel, the price elasticity of demand for water by households is between −0.3 and −0.7 (i.e., a doubling of the price of water would reduce the consumption by between 30% and 70%) [27].
The gradual realisation of the true value of potable water to society has made water metering a critical activity for many water utilities, integral to the management of both water resources and infrastructure. Water metering essentially offers the opportunity to improve the balance between providing access to potable water, a utility’s right to receive payment for services rendered, and the joint responsibility of all to preserve scarce water resources [28].
More recently, utilities have become interested in demand side management and water efficiency in an attempt to delay expensive capital investments for supply options [29,30]. Just as in the electricity industry, where “least cost planning” and “integrated resource planning” were developed to compare energy conservation to increased supply, so too have these principles been emerging as priorities and are now widely applied the water sector [10].
Despite the increasing recognition of its value, there are wide variations in the penetration of customer water metering internationally. For example, two-thirds of homes in the UK remain unmetered for water consumption, although the Environment Agency wants all homes in Britain metered by 2030 [24,31]. In the U.S. water metering is widespread and there are plans for universal upgrades to intelligent metering [32]. In Australia, water metering has now been present for more than a century and residential metering is almost universal in the country’s major urban centers for single detached dwellings [33]. Important exclusions remain however, including the majority of established multi-unit dwellings (apartments). Multi-residential blocks generally have a single water meter which captures aggregate usage across all apartments. Sub-metering for individual units/apartments is on the rise however, bolstered by the recent introduction of legislative requirements in some Australian states. For example, sub-metering is now compulsory for all new residential multi-unit developments in Queensland [34], and in New South Wales, the Residential Tenancies Act 2010 allows landlords to charge tenants for water usage on sub-metered units [35].
It is this history and familiarity with metering, together with the push for sustainable urban water management, which primes Australia for the next generation of metering: technology premised on more frequent, higher resolution, remotely accessible data generation. As with any new technology, many issues remain to be negotiated, particularly concerning costs. Hence, this paper ensues with a discussion surrounding the prospects and pitfalls of IM technologies in this new frontier of digital water resource management.

1.2. The Arrival of Intelligent Metering

Developments in intelligent water metering technology have evolved to a large extent from the energy sector, where smart electricity and gas meters and communications infrastructure have already been more widely introduced [36,37,38,39]. In 2009, intelligent water metering projects accounted for only around 18% of the total number of intelligent metering projects across water and energy worldwide [40]. In recognition of the value of conventional metering and tempted by the opportunities presented by the new technology (e.g., reduced labour costs for meter reading), utilities are progressively turning towards the consideration of intelligent metering as a potential way to secure water supply, minimise waste and control costs in addition to transforming the customer-utility relationship. It is within this context that an assortment of intelligent metering technologies have emerged to accommodate a diverse range of applications (e.g., households, schools, industrial, municipal) and varying geographical, technical and resource constraints [41]. Whilst a comprehensive review of IM technologies is beyond the scope of this paper, the following section introduces some fundamental terminologies of IM to frame subsequent discussion around the uptake of the technology in Australia and abroad. We then turn to unpack rationale for the uptake of IM.

2. Technology and Terminology

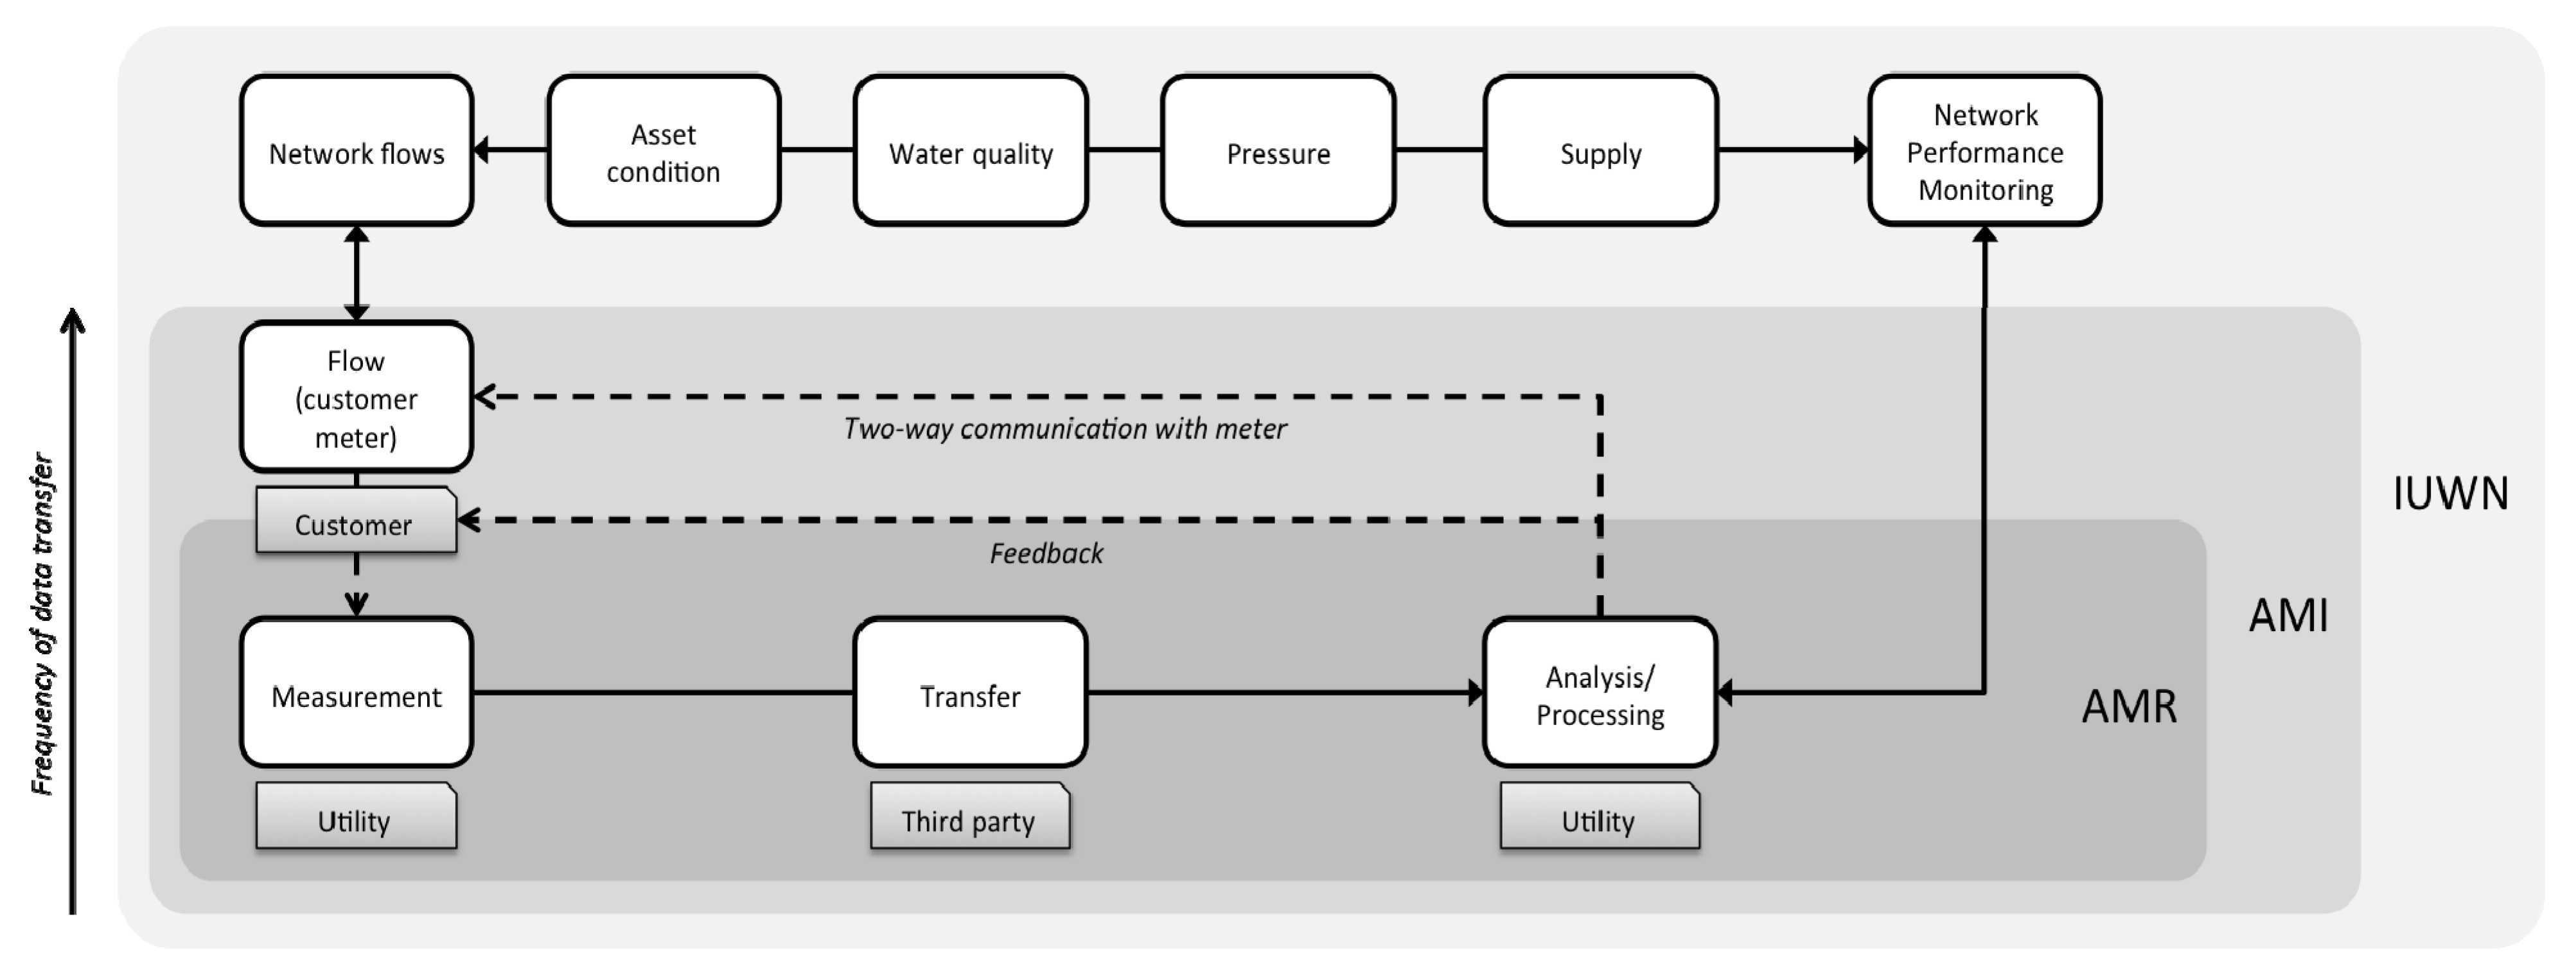
2.1. Intelligent Metering: A Data Generation and Management System

The terms “intelligent” and “smart” metering are often haphazardly deployed with reference to some combination of technology that is superior to conventional metering. This inherent ambiguity is, however, indicative of the plethora of technological configurations which intelligent metering covers, and its relevance to both the energy and water sectors. Intelligent metering may refer to any “new systems employing the latest in communication capabilities and enhanced functionality” for monitoring water use [42]. Taking stock of its component parts provides further clarification: “(it) embraces two distinct elements; meters that use new technology to capture water use information and communication systems that can capture and transmit water use information as it happens, or almost as it happens” [43]. That is, a standard or high resolution water meter linked to a data logger that allows for the continuous reading of water consumption by the utility and/or third party [44]. Critically, it allows for remote meter reading by the water service provider. The data may also be provided in a more accessible format to the customer through a range of feedback channels. In essence, IM signals an intention to better integrate improved data sets into water planning processes, and in doing so, improve customer engagement and the management of precious water resources [45].
Intelligent metering is, in effect, an assortment of components and procedures configured for the on-going monitoring and evaluation of water use to inform strategic planning processes. Put simply, IM is an information feedback system, a tool to aid decision-making. This system is bound by four key processes: the (i) measurement; (ii) data transfer; (iii) processing and analysis; and (iv) feedback of water use data, as described in Table 1. Between these processes also lies the storage of data. The means by which these processes unfold is best described in terms of mode (means of measurement or delivery), resolution (granularity or density of data) and frequency (regularity of data). Data resolution is typically a function of mode, and the relationship between mode and frequency is generally one of interdependence. Together these elements provide a framework to assess the opportunities provided by IM through an enhanced understanding of how and when water is used [46]. This conceptualisation illuminates the role of the IM “information supply chain” and the various technologies and stakeholders that operate within this system (the utility, third parties, regulators, telecommunication companies, data management firms, and the customer) [47].

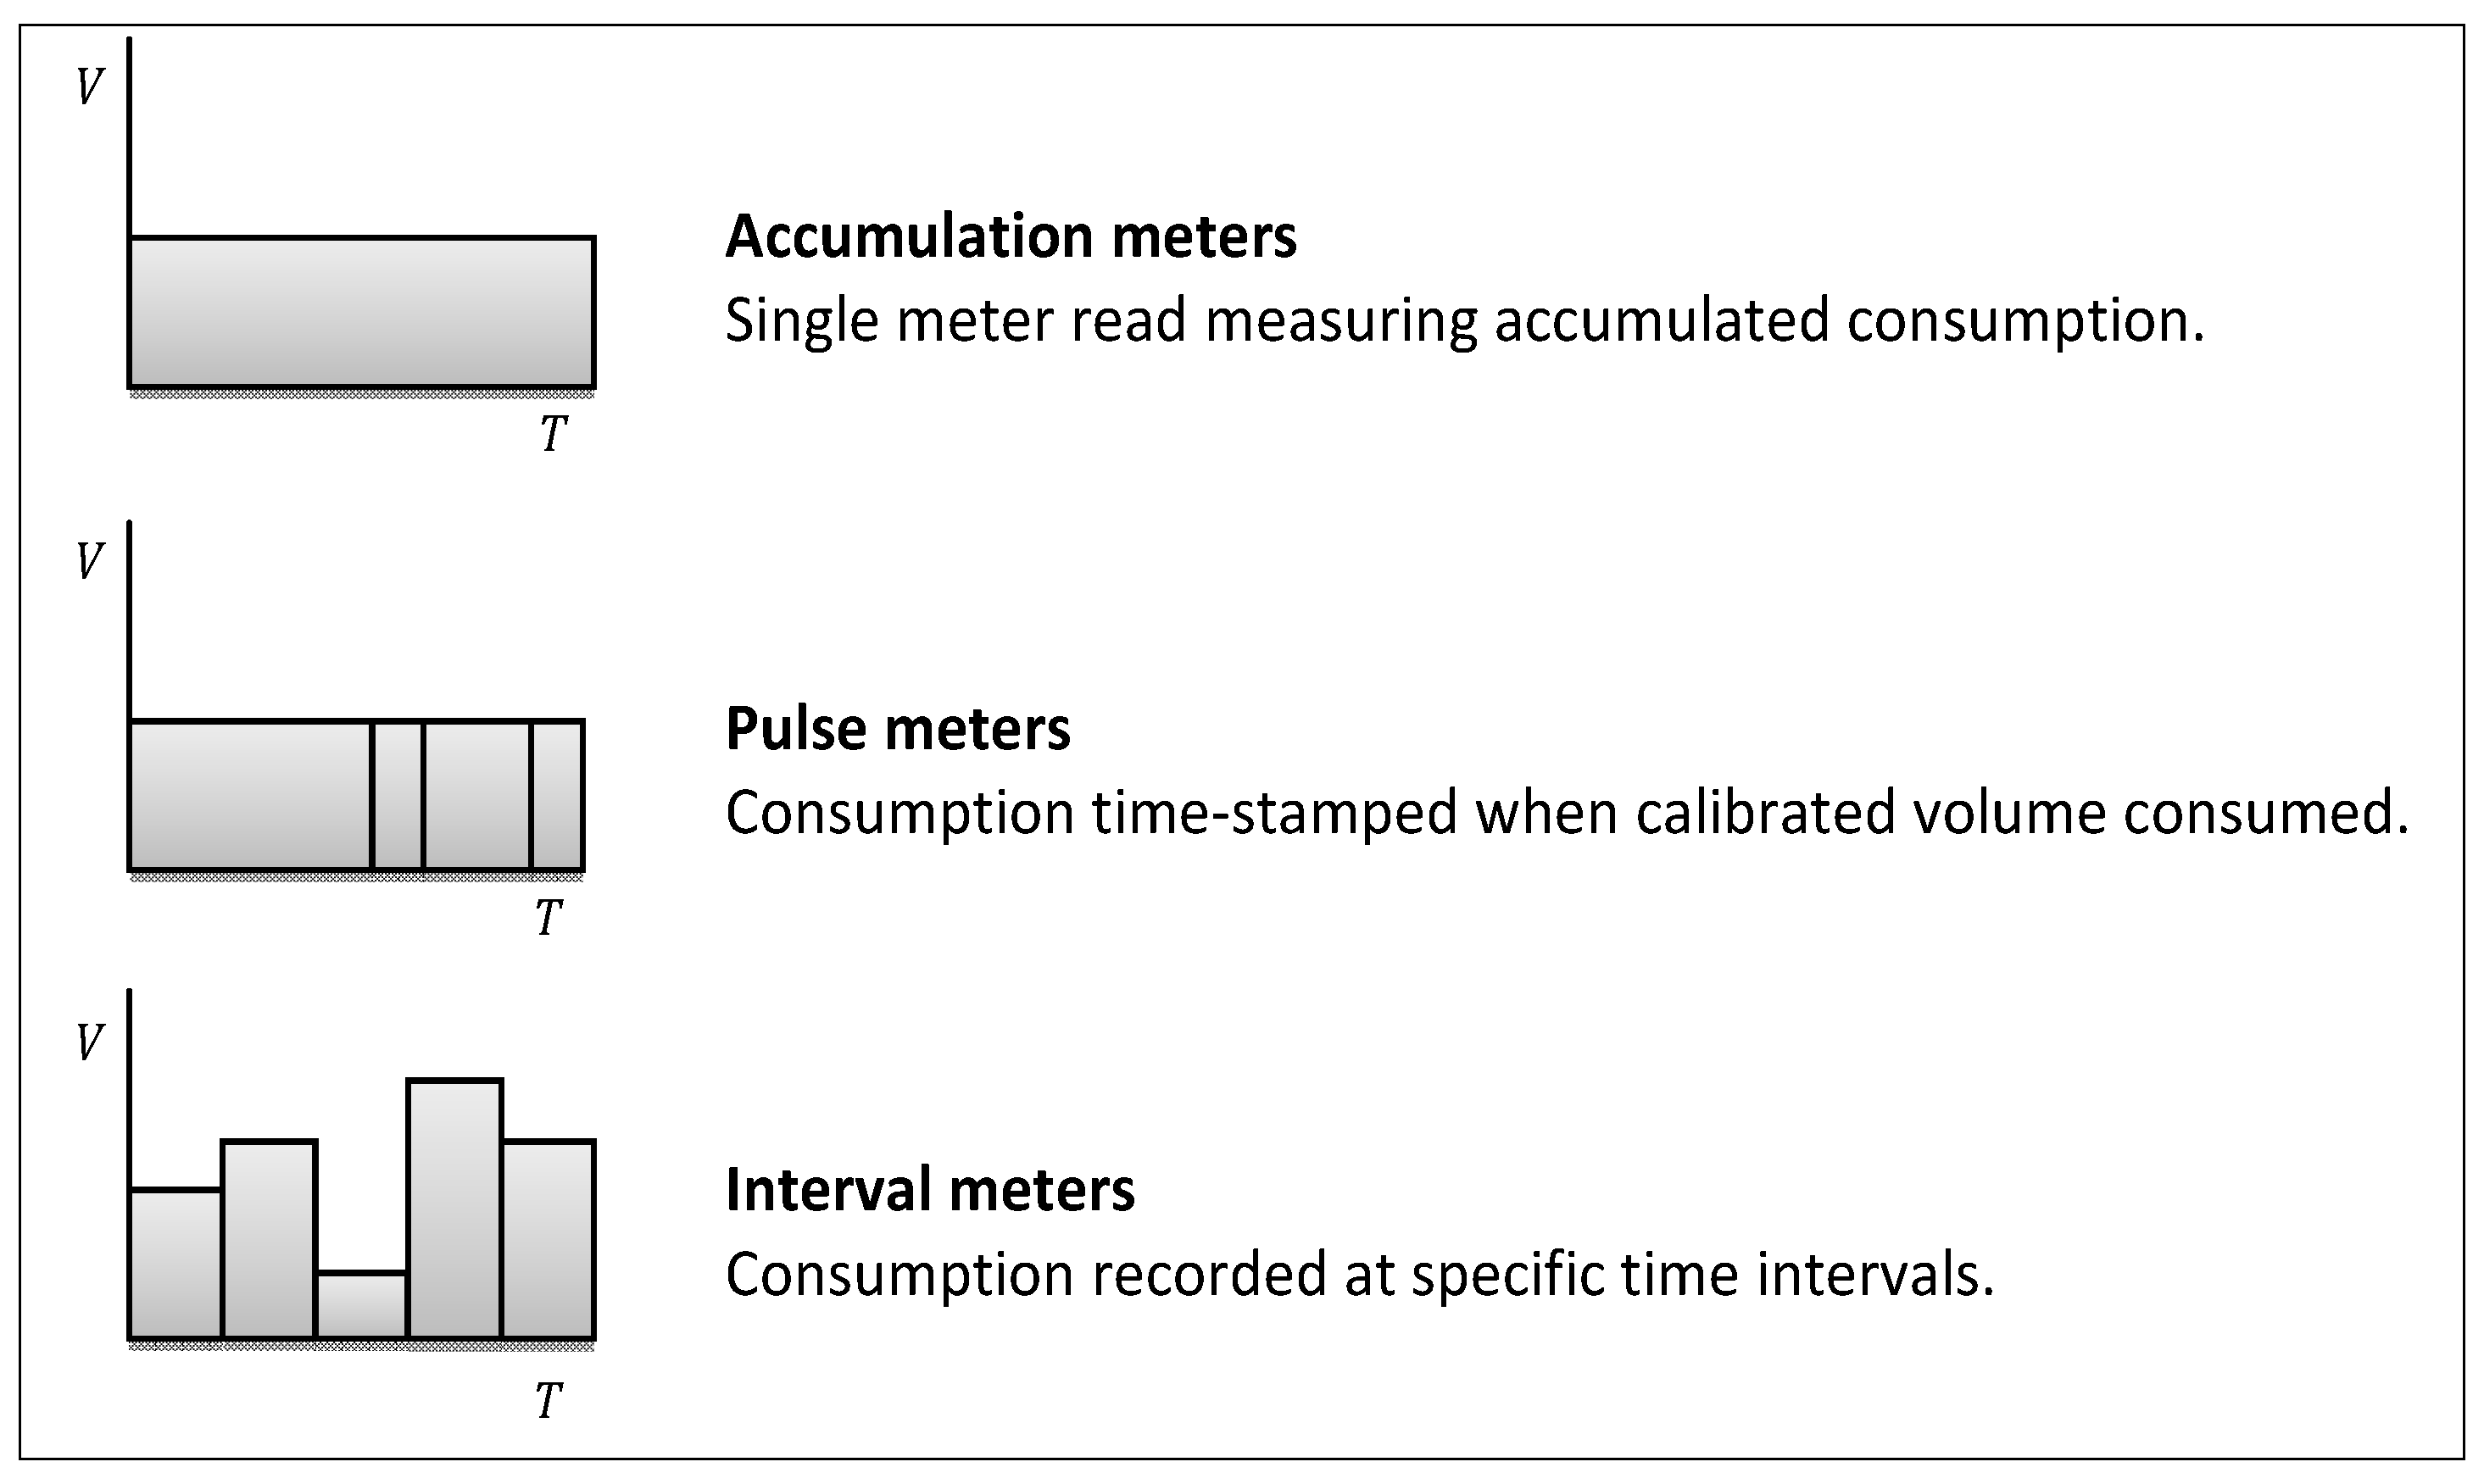
2.2. Metering Technologies

There are a range of metering technologies, employing different principles to capture and record water use (see [48] for a comprehensive introduction). Common technologies broadly fall within one of four categories: (i) displacement meters; (ii) velocity meters; (iii) compound (or combination); or (iv) electromagnetic meters [48,49]. Displacement (or mechanical) meters require the movement of water to mechanically displace components within the meter to record water flow. They have the advantage of being inexpensive and accurate at low to moderate flow rates. Velocity meters, such as multi-jet, magnetic flow and ultrasonic measure the velocity of flow through a meter of a known internal capacity. Speed of flow is then converted into volume of flow for usage [50]. Combination meters utilise the strengths of displacement and velocity technologies in the one meter, in cases of variable flow rates (i.e., both high and low flow rates need to be recorded accurately). Electromagnetic flow meters harness the electromagnetic properties of water, which, as it flows, generates voltage as it crosses the force lines of a magnetic field [49]. With no moving parts, these meters are well-suited to flows with contaminants or debris that could otherwise damage a mechanical meter [49].
Table 1. Processes of an intelligent metering system.
ParameterMeasurementTransferProcessing/AnalysisFeedback
ModeWater meter and data logger technology combinations used to capture information about water consumption. Residential intelligent metering typically uses displacement meters which generate a pulse signal after a set volume passes through the meter. Means by which data is transferred from meters to utilities, customers and back. Data is transferred from the data logger via broadband, cable or wireless (e.g., radio, GSM, CDMA *). May be fully remote or require near range collection (e.g., “drive-by” download).Means by which a utility/third party stores (e.g., data servers) and manipulates (e.g., end-use analysis software package) water use data. Implications for third party access.Method by which data is provided to customers for interpretation, e.g., postal bill, email, web interface, smart phone application. Behaviour change may/may not ensue.
FrequencyThe specified time intervals at which (i) water use is recorded by the meter/between number of pulses; and (ii) data from the meter is collected by the data logger, e.g., 15 min intervals. How often data is sent or collected by the utility/third party, e.g., daily, half hourly, “real-time”. Will vary depending on the type of meter, e.g., pulse versus interval. The frequency at which water use information is used to update utility operations (e.g., for pressure management). The frequency at which water use information is communicated to the customer (e.g., quarterly, monthly, daily, real-time, etc.).
ResolutionThe granularity of water flow detected by a water meter (e.g., L/pulse). Determined by the purpose, capabilities and settings of the water meter. Resolution of the recorded data by the data logger, e.g., L/15 min (i.e., frequency of measurement, above).Resolution of data remains unchanged, though quality of data (i.e., complete/partial) may suffer from disruptions to transmission process. Data may be aggregated or manipulated to analyse trends (e.g., leak assessment; end-use analysis). The level of detail of information provided to the customer, such as usage per unit of time and/or end use breakdown. Comparative framing and benchmarking may aid legibility and comprehension. Content and framing should be informed by behaviour change theory, information about target audience and tailored to the mode in question.
Notes: * N.B. CDMA = Code Division Multiple Access; GSM = Global System for Mobile communications—both are technology platforms for mobile/cellular telephones.
There are three methods for recording the volumes measured: accumulation, pulse and interval, which differ in how consumption is recorded (Figure 1). Australian domestic water meters typically comprise of 20 mm mechanical accumulation meters (some can also be reconfigured to give a pulse). The accuracy of these meters in terms of measurement of flow is typically 0.25%–0.50% [51], however the frequency at which they are read is generally on a monthly or quarterly basis. Hence, while inexpensive, they offer little data to assist in urban water management other than for monitoring cumulative total water use—a practice with its roots in supplier revenue generation and demand management through consumer price signaling [52,53].
Figure 1. Displacement meters [54].
Water 05 01052 g001
Pulse and interval meters are commonly associated with residential IM. Pulse meters record a pulse when a (configurable) quantum of water (e.g., 1–100 L) passes through the meter. The number of pulses recorded by a meter and the time at which these pulses are recorded are stored in an integrated or attached data logger. Residential pulse meters 20 and 25 mm in diameter commonly pulse at every 5 L, whilst large pulse meters capable of recording high volume flows may produce a pulse every 100 L. More advanced meters are capable of recording higher granularity of water use at reduced and programmed intervals, but this spectrum of granularity varies considerably. A high resolution pulse meter, for example, will generate more than 20 pulses per litre (0.05 L/pulse), a low resolution pulse meter 1–2 pulses per litre [55].
Interval or time-of-use meters are comparatively more expensive than pulse meters as the meter is required to constantly monitor the water flows through the meter [54]. After a certain time period (e.g., 15 min) the volume of water that has passed through the meter is recorded.

2.3. System Sophistication

Intelligent metering may be classified as Automated Meter Reading (AMR) or Advanced Metering Infrastructure (AMI). The fundamental difference lies in the level of sophistication of measurement and control, or operability. AMR, also known as remote meter reading, involves the automated transfer of recorded water consumption data, typically via public (e.g., GPRS, CDMA, GSM) or private radio transmission, to servers for the storage and subsequent processing of data by the utility and/or third party [56]. Usually, this involves the manipulation or “smartening” of existing compatible “dumb” meters (e.g., mechanical accumulation meters) [57], resulting in “smart enabled meters” [32,36,58], although pulse/interval meters may also be used in an AMR scenario. Whilst AMR results in improved timeliness and accuracy of data, it is said to only offer a notional increase in data density, e.g., one read per month, although higher frequencies are possible [59]. Hence, some authors do not even grant AMR the status of “intelligent metering” [60].
AMI similarly involves these steps, but also allows for two-way communication between the meter and utility or other third party via the data logger and critically, much higher data density. AMI effectively creates a data stream (termed by the industry as “big data” [47,61]) that enables real-time monitoring and analysis, although end-use analysis at present still requires retrospective examination using trace software (e.g., TraceWizard™) to produce meaningful insights [44,55]. In addition to more data, the Victorian Water Trust adds that AMI also provides a higher granularity of consumption data (i.e., a greater number of pulses recorded in smaller intervals by the data logger) [54]. Two-way communication denotes the ability of the meter operator to “at a minimum, obtain meter reads on demand, to ascertain whether water has recently been flowing through the meter and onto the premises, and to issue commands to the meter to perform specific tasks such as disconnecting or restricting water flow” [62]. In the energy sector, AMI is said to enable communication between all hardware, software, associated data retrieval and data management systems, though it is unclear whether AMI speaks to this level of integration in the water sector. Put simply, AMI offers more control, more information, more often. Both AMI and AMR are not without their pitfalls however, with numerous studies encountering issues with the emerging technology, particularly concerning data continuity as a result of disruption at generation and transfer points [63,64,65,66]. As will be revisited, the transition from a “data poor” to “data rich” environment requires a significant paradigm shift for water service providers [59].
Whilst AMR and AMI can be distinguished in theory, the level of advancement of IM can be likened more to a spectrum as opposed to a binary due to the range of technological variants and communication pathways that fall under the banner of intelligent metering. Second, this continuum is blurred by the pros and cons of these variants relative to context—what works in one situation may be less effective, or less cost-effective, in another (e.g., the geographical implications of urban/semi-rural settings for data transmission, or the type of premises being metered and extent of water use). Third, the terms AMR and AMI have essentially been borrowed from the energy sector, where two-way communication pathways are of more strategic significance in regulation of peak demand [16]. Nonetheless, as the technology matures so will its associated lexicon, as water service providers come to identify configurations conducive to their needs. What seems clear, however, is an apparent vision of increased connectivity and system flexibility. To this end, IM is also positioned as an integral component of the intelligent urban water network (IUWN). An IUWN may be defined as “a network management system that exploits new technologies to monitor performance, remotely sense asset condition, assess water availability and monitor real time water use to improve delivery of water, wastewater and stormwater services for the benefit of all stakeholders” [67]. The IUWN model signals a higher level of sophistication in monitoring not only of water use, but also water quality, pressure and asset condition that enables for the more efficient and sustainable management and delivery of urban water [68]. It may be likened to the “smart grid” of the energy sector, which speaks to the concept of the integrated “smart city”—a complex, yet manageable and adaptable system of fine grained monitoring, automation and control of distributed infrastructure, enabled by advanced telecommunications infrastructure [21,59,69]. Figure 2 illustrates the relationship between AMR, AMI and an IUWN.
Figure 2. Conceptualising intelligent metering as Automated Meter Reading (AMR), Advanced Metering Infrastructure (AMI) and within an intelligent urban water network (IUWN).
Water 05 01052 g002

3. Deployments

We now turn to examine the uptake of IM both in Australia and abroad. The purpose of this exercise is one of navigation, to explore the objectives of IM deployments and in doing so arrive at a more nuanced understanding of drivers underpinning the adoption of the technology. This allows us to locate the significance and use of IM relevant to broader utility operations and consider the potential opportunities and limitations of IM in the following section.
Table 2 provides an overview of IM deployments. The list is not intended to be an exhaustive account of every installation, but rather a comprehensive snapshot of an evolving sector. Australian applications of IM vary in scope and scale, though most have been limited to small-scale pilot projects with only a few larger scale roll-outs (for example, 13,800 in Kalgoorlie-Boulder, Western Australia, 20,000 AMR meters in Wide Bay Water, Queensland and 30,000 currently being installed in Mackay, Queensland). The majority of projects sampled in this paper are residential-focused, however the number of industrial, municipal and commercial deployments is also rising. Internationally, many jurisdictions are pushing ahead with large-scale roll-outs of many thousands of meters following small-scale trials, typically rationalised in terms of remote access benefits (e.g., reduced labour costs for meter reading, reduced health and safety risks from hard-to-access properties requiring reaching over fences or confronting pet dogs) and enabling improvements to network efficiency. Most IM deployments to date have occurred in Europe and North America, with these two regions accounting for 89% of the global IM market in terms of module shipments [32]. For example, New York has 834,000 m, while Global Water in Arizona has many thousands and has recently entered into a partnership with Thames Water in the UK to extend roll-out there [70]. More widespread implementation appears to be on the horizon and market forecasts predict large-scale adoption in urban centres internationally, including developing economies such as India and Africa [32].
Table 2. Intelligent water metering (IM) deployments.
LocationAttributes (no. meters, sector, AMR/AMI, IM supplier)ReferenceCost benefit analysis (trials)End-use/ demand analysisFeedback & customer serviceNetwork efficiencyRemote accessPricing reform
Australia and New Zealand
Alice Springs, NT650 m on households and businesses (large and small), IHD with 15–60 min updates[71]
Currumbin, South East Qld 5 households; energy, gas and water feedback inc. PV generation, tank and recycled water, via IHD[72]
Gold Coast, Qld 151 households[73]
Gold Coast, Qld 44 households; alarming visual display monitor for showers[74]
Griffith, NSW6 residential and commercial properties, focus on irrigation[75]
Hervey Bay, Qld 20,000 drive-by AMR meters; primarily residential, some commercial[64,76]
Kalgoorlie-Boulder, WA 13,800 AMI meters (Iltron)[44,77]
Lower Hunter, NSW 57 schools; AMR (Watersave Australia)[66]
Logan City, Qld High using residential and commercial customers[78]
MackayInitial trial of 700+ households, with the majority of the Mackay Regional Council water network to be covered within 3 years (40,000 connections); AMR (Taggle Systems)[79]
Melbourne, Vic 50 household; energy, gas and water feedback via IHD[72]
Melbourne, VicHigh water using businesses[80]
Mid North Coast, NSW(a) 10–15 industries, feedback via online interface (Outpost Central); [81]
(b) ~220 households, feedback via smart bill, online interface (Outpost Central)[82]
Perth, WA120 detached households (Phase 1); 124 multi-unit households (Phase 2)[83]
Pilbara, WA13,100 m, aims to save 57.5 million lL of mains water (Iltron)[84]
South East Qld20 households[65]
Sydney, NSW 160 households with IHDs; 468 meters installed; 7%–10% (~16 kL) reduction in mains water use[85]
Tea Gardens, NSW 141 households; AMR (Datamatic)[86]
Toowoomba, Qld10 households (Monatec)[87]
Australia and New Zealand
Townsville, Qld474 households with some IHDs [88]
Wyong, NSW1 household (Rosemount magnetic flow, Gemini Tiny Tag)[89]
Yarra Valley, Vic(a) 100 single detached households[90]
(b) 65 schools; 10%–29% reduction in mains water use (Hydroshare)[91]
International
Abbotsford, Canada25,000 AMR m (Iltron)[92]
Bristol, UK(a) 3600 AMR meters (1989–1993); AMR (Accessplus);[93]
(b) £2 m (2005–2010) trial cancelled following Office of Water pricing determination[94]
Chicago, US162,000 AMR m (Badger Meter Orion)[95]
Detroit, USLarge-scale roll-out[54]
Delhi, India250,000 AMR m (Iltron)[96]
KuwaitLarge-scale roll-out[32]
Malta120,000 m (Iltron, IBM, Ondeo Systems)[97]
Mumbai, India150,000 m (Iltron)[32]
New York, US834,000 m; AMR[98]
Ottawa, CN210,000 m; AMI (Iltron)[99]
San Marcos, USCity-wide installation; AMI (Eka Systems)[100]
Scotland, UK3,000 meters in municipal buildings (hospitals, schools, prisons); AMR[101]
SingaporeReal-time network monitoring (Xylem, Visenti)[102]
Spanish Fork, US10,000 electricity and 16,000 water customers (Sensus FlexNet)[103]
Tallahassee110,000 electricity meters and 85,000 water meters (AMI) with IHD’s (Honeywell)[104]
Tampa, US26 households[105]
Thames Water(a) Trial of 1500 m; AMR (SmartReach)[106]
(b) large-scale rollout; AMR (Global Water Resources)[70]
Toronto, CNCity-wide installation[107]
As many of the deployments in Australia to date may be classified as “trials”, quantifiable water savings achieved as a result of efficiency gains made with the introduction of IM (explored below) are not always available, as trials are on-going or in the process of being evaluated. For example, the two-year Kalgoorlie-Boulder trial of 13,800 m is “on track” to achieve annual savings of 900 million L or a 12% reduction in water use through leak detection and more detailed water use feedback to the customer [77]. In an 18 month long trial conducted by Sydney Water, water savings water calculated at an average reduction of 7%–10% or 16 kL per property [85]. These and other trials are considered in the following section in relation to the objectives of IM deployments (also noted in Table 2) and a discussion of technology drivers and opportunities.

4. Drivers

Utilities stand to benefit from enhanced water meter data for a two key reasons. Firstly, it provides the necessary security of supply through demand-side management when confronted by seasonal variations in rainfall, and secondly, it provides a mechanism to defer capital investments through demand reduction mechanisms [42,85]. These include scarcity based pricing and education and awareness programs [76,108,109,110]. Higher resolution metering data would provide the utility with insights into how customers are using water and therefore be in a position to target specific discretionary end uses, such as outdoor use, with the aim of changing consumer water conservation and consumption attitudes and behaviours [111,112]. This data can also be conveyed back to the customer in the interests of improving water literacy and prompting behaviour change. However, assuming that increased water-use information being available for customers will necessarily result in changed behaviours is simplistic. Notwithstanding, improved frequency of data collection, together with higher resolution of volumetric flow capture, would allow utilities to better identify and reduce water losses within the system network and low level leaks beyond the customer meter [113]. A reduction in customer and network leaks would further reduce the overall water demand on supplies as well delay any network capacity upgrades [102,114].
These “IM-enabled” water management strategies are considered further below, drawing on the objectives of IM deployments. Objectives allude to rationale for the adoption of the technology, providing a window into its perceived potential benefits. Here we consider those opportunities, first situating them within the broader discursive framing of sustainable urban water management and the financial operability of water service provision.

4.1. IM as a Tool for Achieving Demand-Side Management

Interest in SUWM reflects a more recent and progressive shift in Australia’s cultural and political discourse that continues to emphasise an environmentally responsible use of water [115]; a product of Australia’s growth with respect to environmental constraints, principally that of an erratic, drought prone climate, marginal rainfall and limited fresh water resources [116,117]. SUWM thus introduces the concept of scarcity and associated responses [118,119]. Accordingly, the central tenet of SUWM is for the efficient use of water resources. The use of planning instruments that balance supply augmentation and demand-side management (DSM) options in terms of costs, yield and environmental and social externalities, such as integrated resource planning (IRP) and least cost planning, is therefore implicit in the pursuit of SUWM [120]. IM provides the necessary data to both query and progress DSM in this regard. The Australian pursuit of SUWM reflects an international trend in continued efforts to minimise environmental and social costs associated with securing water supply via demand management techniques [120,121].
SUWM is said to be one of two overarching “strategic imperatives” of utilities; the other being financial viability. Ensuring financial viability is inherent to the provision of water fit for purpose and forms the fundamental operating logic of enterprise: the need to secure supply via the efficient allocation of capital. Most water service providers today “operate in the reality of decreasing supplies, increasing costs and revenue reductions” [9].
DSM strategies may be characterised as technical, behavioural or managerial responses. Technical changes such as improvements in end-use (appliances, fixtures and fittings) and network efficiency through active leak detection and repair for example, and behavioural changes such as shorter showers or mulching the garden to reduce moisture loss, are examples of direct strategies that can be progressed with the analysis of high data resolution provided by intelligent metering. Indirect strategies concerned with managerial responses relate to planning, monitoring and evaluation, and subsequently inform the execution of direct strategies. These include demand forecasting and improved modelling using enhanced end-use datasets provided by IM, integrated resource planning (IRP), and on-going monitoring and evaluation and refinement of demand management programs [10]. Central to the rhetoric of IM is thus the claim of the technology as a necessary (if not inevitable) tool for strengthening demand management strategies and in achieving the broader strategic aims of water service providers. As more accurate information on how and when water is consumed is critical to effective demand management [69], the provision of more frequent, higher resolution data—the core promise of IM—positions the technology as the essential tool for achieving the directives of water service providers as shown in Figure 3.

4.1.1. Limitations of Focusing on Individuals When Considering Water Use Behaviours

Supporters of IM technology, including those within utilities and those researching their use often put great focus on the functionality of the technology and too little on the context in which the technology and water itself is used. Assumptions that householders receiving information about patterns of water use may lead to a change in awareness and behavior are contested in practice-centred approaches (see for example [122]). The authors recognize that understanding the cultural, historical and emotional variables that drive water use is essential to gain insight into how and why water is used. Presenting consumption information offered by intelligent meters is only one approach within a suite of methods to work towards sustainable water use futures. Engagement with household water technologies needs to be contextualized within the broader social and cultural environment to maximize changes towards more sustainable water use. These issues are explored further in a companion paper [123].
Figure 3. Locating rationale for IM.
Water 05 01052 g003

4.2. Objectives of IM Deployments

With these DSM strategies in mind, the objectives of IM deployments can be more clearly articulated and their relevance to SUWM or financial viability noted (Table 3).
Table 3. Objectives of IM deployments.
ObjectiveSUWMFinancial operability
Cost benefit analysis (IM trials)
Improve end-use analysis and end-use efficiency
Improve feedback and/or customer service and stimulate behaviour change
Implement pricing reform to manage peak demand (and associated behavioural response)
Improve network efficiency (leaks, pressure, illegal use and non-revenue water management)
Enable remote accessibility

4.2.1. Cost Benefit Analysis (IM Trials)

Commonplace of IM trials is an exploration of costs and benefits as an overarching objective. Often however, costs and benefits are problematised in discussion rather than value weighted. This may be owing to the fact that many benefits of IM are of non-market value and thus require imputed valuation. Whilst the cost-effectiveness of IM remains in a state of flux [54] it is important to note the technology continues to evolve and its potential value will be subject to the context of application (i.e., cost of DSM relative to supply) and on-going research (e.g., in the field of feedback and behaviour change).

4.2.2. End-Use Analysis and Efficiency

Use of IM for end use analysis purposes reflects a growing interest in improving end use efficiency over the last decade and more recently, to evaluate the savings of DSM [55,81,90,93,124] and alternative supply programs (such as the performance of rainwater tanks) [65,125]. Studying appliance efficiencies and “water behaviours” is core to demand forecasting and evaluation as water use patterns change over time with demographic shifts and the introduction of new technologies [10]. The use of IM to provide end-use level detail has the potential to provide rich information to both the utility as well as the consumer. By capturing high resolution data from individually metered households and network zone meters, utilities have been able to gain an understanding of daily and seasonal residential consumption patterns. This information is useful for optimising operational processes and planning for network improvements [47]. The data is also critical for integrated resource planning, which benefits from end-use modelling for demand forecasting and the design, implementation and refinement of demand management programs. This provides the opportunity for the utility to reduce its operational costs through asset management efficiency and upgrade deferrals [24]. In other words, the upsizing of the network due to increases in the number of customers due to population growth and influx can be delayed through the offsetting of increased demand through demand reduction mechanisms.

4.2.3. Feedback and Customer Service

To date, end-use data collected has typically been for the sole benefit of utilities and the information has not been made available to customers, other than in the form of their periodic bill. There is increasingly a view that by empowering customers with information about their consumption patterns and uses will allow them to make informed decisions about how they use water in future. Water utilities recognise the importance of meeting growing customer expectations, which are inextricably linked with technological innovation, in promoting utility reputations that are consumer-focused. By providing more information about water use, which can then be filtered into more meaningful information for the customer, IM presents an opportunity to improve water literacy within the community and to empower households to develop a greater understanding of their consumption. For instance, rather than estimated (average) daily use based on historical consumption data, IM can potentially offer real-time monitoring of consumption and anything in-between, e.g., monthly, weekly, daily.
Few projects have tested the role and potential for behaviour change through “IM-enabled” feedback to date however. A study funded through the European Union FP7 (2012–2015) will potentially fill this gap in knowledge [126]. It aims to develop customised intervention and awareness campaigns to influence behavioural change through the use of intelligent metering and data [126]. In Australia, residential trials include several hundred households in Melbourne, Sydney and the Mid North Coast of NSW [72,81,85,127]. Sydney Water’s 18 month trial involving 468 AMR fitted properties, 161 of which were equipped with a simple in-home display (IHD) providing customers with near real time information about their water use, found an average reduction of 7%–10% or 16 kL per property for example. A number of school programs have also involved usage feedback to staff and students [91,128,129,130], although the relationship between reduced consumption and feedback in this instance is more complex, with savings largely hinged upon effective leak management [66]. One Melbourne study, for example, calculated savings of between 10% and 29% as a result of the introduction of IM [91].
The provision of more detailed water use information to customers is gaining traction, drawing on developments in the energy sector [131]. Research into electricity use feedback, for example, suggests a 5%–15% reduction in demand is achievable [15]. The US has been particularly active within the energy sector and has already adopted some highly developed customer feedback methods. For example, Opower, a U.S. software company, has partnered with some 75 utilities to create individualised home energy reports for utility customers that analyse their energy usage and offer tips on how to achieve cost and energy savings [132]. In late 2012, Opower announced a new partnership with an Australian energy retailer to provide households with hourly consumption feedback via an online interface [133].
Advancements in mobile computing are making it easier for the management of personal and household activities, which are dependent on the delivery of relevant and useful information, accessible at the discretion of the individual. The increased availability of this type of information in conjunction with the emergence of the “internet of things” [134] is shifting cultural expectations of the convenience, detail and accessibility of consumption information. Such advancements are set to shape the future of consumer access to information, a future that will necessarily draw the attention of water utilities and in doing so, potentially alter the nature of the customer-utility relationship. An implicit belief in this scenario, at times unquestioningly, is a critical factor underpinning the uptake of IM.

4.2.4. Pricing Reform

Whilst the elastic range of various end-uses remains the subject of on-going deliberation [135,136,137], the role of water pricing in regulating water consumption behaviours is well established. Australian electricity retailers already employ time of use tariffs (TOUTs) in their pricing structures and in helping to regulate peak demand. IM offers this same potential for the water sector—by shifting consumption from peak periods to non-peak periods through information access and peak usage pricing such as TOUTs based on hourly consumption data, infrastructure constraints can be avoided and infrastructure upsizing can be further delayed [58,76]. TOUT regimes can also be used to reduce peak day and peak month consumptions, thereby further reducing overall demand on supply and also contributing to reducing the required network infrastructure to meet these peaks [76].

4.2.5. Network Efficiency: Leak Management, Illegal Use and Asset Management

Network efficiency encompasses a suite of DSM strategies targeted at reducing system losses (non-revenue water). Improved leak management in homes, the commercial and industrial sector, municipal buildings (particularly schools) and the water supply network is at the core of improving network efficiency, to which IM for mitigating and reducing losses is essential [42,47,56,93,102,138]. Network water losses may vary between 5% and 55% of total supply and is dependent on many factors such as number of connections, geography of the water supply network, asset condition and climate [139]. Sydney Water’s IM trial identified leaks in 80% of households, with 10%–17% of households having a leak at any given time and leakage accounting for 3% of total usage [85]. In a study of leakage in 52 Australian schools equipped with IM, the top ten highest consuming schools were found to account for 77% of total leakage [66]. Given the significance of leakage, it is not surprising the majority of IM deployments reviewed identified leak management as a key justification for adopting the technology.
A related aspect of leak management is pressure management. Water pressure can fluctuate with reservoir levels and when high, the risk of leakage may increase. IM can be employed to help understand and manage network pressure and mitigate leakage. One Australian study found reduced pressure had a positive impact on leaks, with savings of 2 ML/year across 141 households from reductions in long-term leaks [86].
Beyond leak management, a number of other elements to network efficiency have been identified. For example, the need to better manage and improve response times to issues of non-compliance (illegal use), particularly during times of water shortage [45,61,140]. Core to network efficiency is also the monitoring of asset condition, with IM having the ability to provide data on meter performance and failure [45] and broader network operations [101].

4.2.6. Remote Access

Remote access to water use data was identified as a core objective of many IM deployments, particularly in large high density urban centres [88,141]. Remote accessibility attempts to address issues of inaccessibility, labour costs and occupation health and safety risks associated with manual meter reading, and the constraints manual reading places on data frequency [45,102].

5. Challenges

5.1. Meeting Water Supply-Demand Balance Objectives: The Role of Demand-Side Management

As discussed earlier, intelligent metering provides an opportunity for water service providers to manage the consumption patterns of customers with the view of saving operating and capital expenditure, whilst at the same time meeting their supply objectives. However, a key barrier to this strategy in areas where drought or population growth put focus on water efficiency and demand side management programs have been implemented (and indeed the role which smart metering could play) is that water planners often believe that the potential for DSM to achieve further savings has reached practical limits and therefore supply side options are better to pursue. In Australia, for example, a number of water utilities have in the past invested large amounts of money in demand management programmes because of the high costs of bulk water supply, economic benefits of deferring large capital works, and notably in some cases due to regulatory requirements. In Sydney, the Sydney Water Corporation was regulated to reduce demand per capita by 25% in 2001 and 35% by 2011 from 1991 levels [29]. However, even with a long history of demand side management in Australia, there is limited evidence of real long-term commitment as drought eases [142]. Further, the most prominent lesson from the demand management literature is that programmes to encourage DSM activities do not guarantee that the desired activities will actually take place or be maintained. Many programme plans will assume a high uptake of an initiative, when in practice DSM programmes have lower uptake rates [143]. A shift in behaviour patterns is difficult irrespective of the level of education, wealth or size of the domestic unit. All water saving measures are not applicable to everyone, since their attitudes towards water differ [144]. Therefore the probability of success is a very important consideration in determining the cost effectiveness of an intervention. Considerations of customer behaviour, bounce back and tariff structures are necessary to make an informed decision.
A key challenge is ensuring that there is benefit for both the utility and the customer. During the historical introduction of water metering of unmetered consumption, both utility and customer clearly benefited. For most customers (except the profligate users), the result was a reduced bill and for the utility much more information becomes available for understanding water use, which is essential for effective future planning. However, it is currently not clear what the benefit to customer is with the introduction of intelligent metering. Unless tariff structures change or intelligible feedback mechanisms lead to customers becoming more aware of their usage and reducing it, the bill may stay the same (or perhaps even rise to cover the cost of the technology). Where tariff structures do change (as in the case of the electricity sector in Victoria, Australia) a mix of customers were adversely affected, rather than a minority. A potential advantage is the ability to have more information about water use patterns in closer to real time—is this likely to be perceived as a benefit which all customers will appreciate? Certainly identifying leaks early and having them repaired before they cost lots of money would be useful, but more research is required. As digital natives become the next generation of bill payers the question is whether customers will come to expect to be able to access online billing with detailed water use information, not unlike online banking allows a detailed transaction history. Now, enter issues of privacy and use of data.

5.2. Privacy Issues

The collection and distribution of user behaviour patterns as they relate to water use, will introduce the need for regulations that govern the privacy of customer information and data, and the levels of third party access permissible. The area of privacy with respect to smart metering has been identified as needing further attention by Giurco et al. [111]. Whilst there may be fewer concerns when the data is owned by the utility, one could imagine further potential concerns if there data were managed by a third party. There could also be unintended consequences of giving householders (e.g., in a share house) access to their own data, which could then be downloaded and posted on the internet or social media (“John has the 30 min shower...”). Alternatively water utilities themselves may use the intelligent metering data to undertake data mining and customer profiling. If water efficiency is being pursued and this leads to reduced revenues, an entrepreneurial chief executive may look to augment revenue streams through targeted advertising. This could be for items such as garden products for high garden water users, beauty products for high shower users, health products for high toilet users, cleaning products for high clothes washer users. Alternatively, IM data could be for services at the suburb or street level, even if household level data is not given, for example plumbers could be alerted to the fact that this area / street has a high prevalence of water leaks and the plumbers may choose to target their advertising in this area or water utility customers may even be offered a discount. The use of data from intelligent metering will have implications for potential data mining business opportunities, to the foreseeable aversion of some customers.

5.3. Costs and Benefits of IM

Whilst some studies have occurred [54] the full implications of IM are not yet fully understood and the cost-benefit ratio for IM is not yet viable for large-scale roll-outs. Indeed, the adoption of IM technologies has been relatively slow in the water sector. This is mainly a consequence of the lower unit cost of water and, until recently, the high costs of the technology. It is currently cheaper for Australian water service providers to manually read customer water meters, for example [42]. As a result, water consumption is generally only read monthly or quarterly and accepted as an accumulation for this period. However, water prices and labour costs for meter reading are rising whilst costs for technology and data transfer are coming down which will see changes to the cost-benefit equation for utilities over the next decade.
Importantly, the cost and benefits (including non-monetary costs and benefits) for customers need to be carefully elaborated. For example, the use of smart meters to manipulate the time of water use by consumers, for example, in order to reduce peak demand has the potential to alter social norms regarding water use (e.g., time of showering, irrigation and clothes washing).

5.4. Ownership

Regulations will be needed that cover the rights of the customer as well the utility, specifically around issues of ownership of the assets and associated data. Regulators will need to consider the merits of passing the costs of the intelligent metering onto the customer or whether it is viewed as an investment that results in efficiency gains that therefore make the business case viable. Currently in Australia, water service providers often purchase water meters outright, which an employee or contractor will be required to read. If intelligent metering is introduced, the setup may involve logging equipment (one company) and then a telecommunications provider to transfer the data (second company). A third party may also be involved in the storage and/or processing of data, whilst a fourth may be may assist in targeted advertising, as noted above. The transaction costs of dealing with multiple parties—especially when things go wrong for the customer—become more involved and may require more specialised skills sets to undertake repairs.

5.5. Technology Challenges

Intelligent metering networks would require the ability to transfer thousands of data packets per day. Whilst these transmission networks are available, issues with respect to wireless network reliability, black spots, power source and battery life, damage by users, water proofing, cross connections, to name a few, could pose reliability problems [63,66,112]. To a large extent, the reliability of the technology and communication between the various components has been addressed, however there is a point of distinction between using mobile telephone frequencies versus unlicensed radio frequencies and the long term stability of both systems differs, as does data security.
The key obstacle from a technological perspective is the relative cost in comparison to the do nothing approach. This is likely to change in the future as other customer services (electricity, gas, telephone, broadband, etc.) see value in higher resolution data, the pooling of resources may see these costs come down. This is however, also linked to the effectiveness of the intelligent metering to save both water service providers and customers money in order for the business case to stack up. Further research in this field is also required as discussed above.

5.6. Data Management

Information systems that can store and manage large volumes of data do not pose as much of problem as does the question of what water service providers will do with all this data. Representative samples are sufficient for infrastructure planning purposes and trend analysis. The challenge for water service providers is to be clear what data is needed for operational and planning requirements, and to elicit from customers what type and frequency of information is best suited for their needs. Based on this the appropriate storage and management processes can be designed.

5.7. Data Analysis and Reporting

The development of automated reporting tools that utilise the processed data to create tailored reports at the request of the water service provider and/or customer on issues such as peak hourly consumption, end-uses, or comparative analysis, is still at the formative stage.
Automated and reliable processing of flows into end use data categories require further development. Pattern matching algorithms need to be written and tested to achieve highly accurate categorisation. This is the most critical challenge requiring urgent research attention as the current approach to water end use analysis requires time consuming manual processing [112].

5.8. Customer Buy in

Following on from the previous point, for DSM to be successful and for customers to utilise the information, customer buy-in is imperative. A core obstacle to IM uptake is consumer back-lash as a result of misinformation and concerns of privacy, health and costs. The extent of public unease is reflected in the rise of community “anti-smart meter” groups in the UK, the U.S. and Australia, be they for electricity or water [145,146]. Issues featured on these websites related to cost, privacy and health effects from electromagnetic radiation. Public engagement is thus a critical element of successful IM adoption. Customer benefits need to be clearly articulated and information platforms should cater for the vast majority of customer preferences if successful uptake is to achieved. Water service providers must take heed of a fast-changing landscape of personal and mobile communications technologies (e.g., the rise of smart phones), whilst concurrently negotiating the role of traditional modes of communication pathways (such as postal quarterly bills). Customer preferences vary from region to region and therefore, customer preference and information needs surveys should be undertaken for each proposed implementation. The concept of “social license in design” [147], which has been applied in heavy industry to anticipate social issues associated with the development and deployment of disruptive technology and revising the technology design to overcome them, may also be helpful to address the future social challenges and opportunities of the IM technologies.

5.9. Technical Capacity

Intelligent metering will increase the diverse training and education requirements of utilities, specifically the up-skilling of the maintenance staff with regard to this new electronic and technological field. The review of literature to date shows that few of these fields have been comprehensively analysed. We therefore conclude with an exploration of future opportunities and a research agenda to guide intelligent metering to hold a useful place in SUWM.

6. Conclusions

Intelligent metering should not be viewed as an end in itself, but has the potential to meet supply and end-use information needs, which in turn can satisfy sustainable urban water management objectives.
More detailed, more frequent and more accessible data opens up the potential to support SUWM. The higher resolutions offered by IM allows for water use to be interpreted in terms of end-use, that is, the water consumed by a particular appliance for a specific activity. End-use detail is critical to refining demand forecasting models and in identifying opportunities for improving efficiency [148]. Whilst offering greater flexibility, improved resolution and higher frequencies of data collection and communication present new and complex challenges for the water sector, in particular, data management, interpretation and analysis requirements. The issue of data privacy is also of mounting contention and one that will demand the attention of utilities and regulators.
There appears to also be some incentive for technology vendors to drive the use of smart metering. Besides the obvious drive for technology vendors to capture a portion of the market in this field and further improve their product through monitoring the effectiveness and user needs based on real-time field trials, vendors may see some future business potential in gaining customer profiles and usage patterns in a world hungry for potential market information.
Consequently, it can be concluded that intelligent metering will be a larger and more influential presence in the urban water sector over the coming decade than it is presently. The challenge is to ensure that its broad scale introduction occurs with a focus on the needs of both customers and utilities and that, in the longer term, public good must prevail over shorter term profits for vendors of technology and data.

Acknowledgments

This research has been supported by funding from the Australian Research Council, Linkage Project LP110200767. Thank you to three anonymous reviewers for their detailed comments, in particular to the reviewer who highlighted the need to consider water use practices in context, now discussed in Section 4.1.1.

Conflict of Interest

The authors declare no conflict of interest.

References

  1. Jackson, S.; Morrison, J. Managing Water for Australia: The Social and Institutional Challenges; Hussey, K., Dovers, S., Eds.; CSIRO Publishing: Collingwood, Australia, 2007; pp. 1–176. [Google Scholar]
  2. Willis, R.M.; Stewart, R.A.; Panuwatwanich, K.; Williams, P.R.; Hollingsworth, A.L. Quantifying the influence of environmental and water conservation attitudes on household end use water consumption. J. Environ. Manag. 2011, 92, 1996–2009. [Google Scholar]
  3. Muthukumaran, S.; Baskaran, K.; Sexton, N. Quantification of potable water savings by residential water conservation and reuse—A case study. Resour. Conserv. Recycl. 2011, 55, 945–952. [Google Scholar] [CrossRef]
  4. Mukheibir, P.; Mitchell, C.; Mckibbin, J.; Ryan, H.; Komatsu, R.; Fitzgerald, C. Adaptive Planning for Resilient Urban Water Systems under an Uncertain Future. In Proceedings of OzWater’12; Australian Water Association (AWA), Sydney, Australia, 8–10 May 2012; pp. 1–18.
  5. Van de Meene, S.J.; Brown, R.R.; Farrelly, M.A. Towards understanding governance for sustainable urban water management. Glob. Environ. Chang. 2011, 21, 1117–1127. [Google Scholar] [CrossRef]
  6. Rosegrant, M.W. Food, Agriculture, and the Environment Discussion. In Water Resources in the Twenty-First Century: Challenges and Implications for Action; International Food Policy Research Institute: Washington, DC, USA, 1997; Paper 20; pp. 1–24. [Google Scholar]
  7. Deloitte Touche Tohmatsu Limited, Water Tight 2012: The Top Issues in the Global Water Sector; Deloitte Touche Tohmatsu Limited: London, UK, 2012; pp. 1–24.
  8. Mukheibir, P.; Stewart, R.; Giurco, D.; O’Halloran, K. Non-registration in domestic water meters customer meter inaccuracies component of non-revenue water understanding non-registration of domestic water meters. Water 2012, 32, 95–100. [Google Scholar]
  9. Hill, T.; Symmonds, G. Sustained Water Conservation by Combining Incentives, Data and Rates to Effect Consumer Behaviour Change. In Water and Society; Pepper, D.W., Brebbia, C.A., Eds.; WIT Press: Southhampton, UK, 2011; pp. 409–420. [Google Scholar]
  10. Turner, A.; Willetts, J.; Fane, S.; Giurco, D.; Chong, J.; Kazaglis, A.; White, S. Guide to Demand Management and Integrated Resource Planning (Update on Original 2008 Guide); Association of Australia (WSAA): Sydney, Australia, 2010; pp. 1–174. [Google Scholar]
  11. Gregory, A.; Hall, M. Urban Water Sustainability. In Water; Prosser, I., Ed.; CSIRO: Collingwood, Australia, 2011; pp. 75–88. [Google Scholar]
  12. Godwin, A. Advanced Metering Infrastructure: Drivers and Benefits in the Water Industry. Available online: http://www.waterworld.com/articles/print/volume-27/issue-8/editorial-features/special-section-advanced-metering-infrastructure/advanced-metering-infrastructure-drivers-and-benefits-in-the-water-industry.html (accessed on 20 August 2012).
  13. Australian Water Association, What Are Smart Meters? Fact Sheet; Australian Water Association: St Leonards, Australia, 2010; pp. 1–4.
  14. Davison, G. Down the Gurgler: Historical Influences on Australian Domestic Water Consumption. In Troubled Waters: Confronting the Water Crisis in Australia’s Cities; Troy, P., Ed.; Australian National University Press: Canberra, Australia, 2008; pp. 37–65. [Google Scholar]
  15. Darby, S. The Effectiveness of Feedback on Energy Consumption: A Review for DEFRA on the Literature on Metering, Billing and Direct Displays; Environmental Change Institute, University of Oxford: Oxford, UK, 2006; pp. 1–24. [Google Scholar]
  16. Van Gerwen, R.; Jaarsma, S.; Wilhite, R. Smart Metering–Briefing Paper; Leonardo Energy; Arnhem: Gelderland, The Netherlands, 2006; pp. 1–9. [Google Scholar]
  17. Owen, G.; Ward, J. Smart Meters: Commercial, Policy and Regulatory Drivers; Sustainability First: London, UK, 2006; pp. 1–54. [Google Scholar]
  18. Owen, G.; Ward, J. Smart Meters in Great Britain: The Next Steps? Sustainability First: London, UK, 2007; pp. 1–68. [Google Scholar]
  19. Derbel, F. Trends in Smart Metering. In Proceedings of the 6th International Multi-Conference on Signals, Systems and Devices, Djerba, Tunisia, 23–26 March 2009; Derbel, N., Kanoun, O., Eds.; Institute of Electrical and Electronics Engineers: New York, NY, USA, 2009. [Google Scholar]
  20. Wolfs, P. Potential Barriers to Smart Grid Technology in Australia. In Proceedings of the Australasian Universities Power Engineering Conference, University of Adelaide, Adelaide, Australia, 27–30 September 2009.
  21. Dunstan, C.; Boronyak, L.; Langham, E.; Ison, N.; Usher, J.; Cooper, C.; White, S. Think Small: The Australian Decentralised Energy Roadmap: Issue 1, December 2011; Institute for Sustainable Futures, University of Technology, Sydney: Sydney, Australia, 2011; pp. 1–110. [Google Scholar]
  22. Heinrich, M. Residential Water End Use Literature Survey; Branz Study Report No. 149; Branz Ltd: Judgeford, New Zealand, 2006; pp. 1–25. [Google Scholar]
  23. American Water Works Association (AWWA), Water Meters–Selection, Installation, Testing and Maintenance, 5th ed.; AWWA: Denver, CO, USA, 2012; pp. 1–121.
  24. Barraqué, B. Is individual metering socially sustainable? The case of multifamily housing in France. Water Altern. 2011, 4, 223–244. [Google Scholar]
  25. Bakker, K. Paying for water: Water pricing and equity in England and Wales. Trans. Inst. Br. Geogr. 2001, 26, 143–164. [Google Scholar]
  26. Baumann, D.; Boland, J.; Hanemann, W.M. Urban Water Demand Management Planning; McGraw-Hill: New York, NY, USA, 1998. [Google Scholar]
  27. Warford, J.J. Marginal Opportunity Cost Pricing for Municipal Water Supply; International Development Research Centre: Ottawa, Canada, 1997; pp. 1–22. [Google Scholar]
  28. Thornton, J.; Sturm, R.; Kunkel, G. Water Loss Control, 2nd ed.; McGraw-Hill: New York, NY, USA, 2008. [Google Scholar]
  29. White, S.B.; Fane, S. Designing cost effective water demand management programs in Australia. Water Sci. Technol. 2002, 46, 225–232. [Google Scholar]
  30. Turton, A. Water Scarcity and Social Stability: Towards an Understanding of the Social Dynamics of Water Demand Management in Developing Countries. In Proceedings of Sustainability, Risk and Nature: The Political Ecology of Water in Advanced Societies, Oxford, UK, 15–17 April 1999; pp. 1–23.
  31. Ofwat, Exploring the Costs and Benefits of Faster, More Systematic Water Metering in England and Wales; UK Office of Water: Birmingham, UK, 2011; pp. 1–31.
  32. Loeff, B.; Fox, J. Advanced Metering Infrastructure for Water Utilities: Market Drivers, Technology Issues, Deployment Case; Pike Research LLC: Boulder, CO, USA, 2010. [Google Scholar]
  33. McKay, J. Issues for CEOs of water utilities with the implementation of australian water laws. J. Contempor. Water Res. Educ. 2006, 135, 115–130. [Google Scholar] [CrossRef]
  34. Department of Infrastructure and Planning (DIP), Sub-Meter Guidelines; Department of Infrastructure and Planning, Queensland Government: Brisbane, Australia, 2008; pp. 1–15.
  35. Residential Tenancies Act 2010; New South Wales Government: Sydney, Australia, 2010.
  36. Torriti, J.; Hassan, M.G.; Leach, M. Demand response experience in Europe: Policies, programmes and implementation. Energy 2010, 35, 1575–1583. [Google Scholar] [CrossRef]
  37. Marvin, S.; Chappells, H.; Guy, S. Pathways of smart metering development: Shaping environmental innovation. Comput. Environ. Urban Syst. 1999, 23, 109–126. [Google Scholar] [CrossRef]
  38. Smart World, Smart Utilities; Ernst & Young Global Limited: London, UK, 2010; pp. 1–52.
  39. AusGrid, Smart Grid, Smart City Monitoring and Measurement Report III: Customer Applications Stream: Smart Meter Infrastructure; AusGrid: Sydney, Australia, 2012; pp. 1–22.
  40. Sydney Water, National Smart Metering Program Discussion Paper for the Requirements Work Stream; Sydney Water: Paramatta, Australia, 2009; pp. 1–22.
  41. Giurco, D. Innovative Smart Water Metering: Potential & Policy. In Proceedings of Measurements and Metering Innovation Conference, Sydney, Australia, 19–21 May 2008.
  42. Idris, E. Smart Metering: A Significant Component of Integrated Water Conservation Systems. In Proceedings of the 1st Australian Young Water Professionals Conference, Sydney, Australia, 15–17 February 2006.
  43. Pataki, G. A Primer on Smart Metering; New York State Energy Research and Development Authority: New York, NY, USA, 2003; pp. 1–4. [Google Scholar]
  44. Stewart, R.A.; Willis, R.; Capati, B. Closing the Loop on Water Planning: An Integrated Smart Metering and Web-Based Knowledge Management System Approach. In Proceedings of the 10th IWA International Conference on Instrumentation Control and Automation, Cairns, Australia, 14–17 June 2009; Yuan, Z., Ed.; IWA Publishing: London, UK, 2009. [Google Scholar]
  45. Water Corporation. Frequently Asked Questions Kalgoorlie Smart Metering Trial. Available online: http://www.watercorporation.com.au/_files/PublicationsRegister/12/Kalgoorlie_SMT_FAQs.pdf (accessed on 21 January 2013).
  46. Gleick, P. Roadmap for sustainable water resources in southwestern North America. Proc. Natl. Acad. Sci. USA 2010, 107, 21300–21305. [Google Scholar] [CrossRef]
  47. Beal, C.; Stewart, R.; Giurco, D.; Panuwatwanich, K. Intelligent Metering: Enabling a Paradigm Shift to Sustainable Urban Water Planning and Management. In Water Efficiency in Buildings: A Review of Theory and Practice; Adeyeye, K., Ed.; Wiley-Blackwell: Oxford, UK, 2013. [Google Scholar]
  48. Arregui, F.; Enrique, E.; Cobacho, R. Integrated Water Meter Management; IWA Publishing, Alliance House: London, UK, 2006. [Google Scholar]
  49. Georgia Environmental Protection Division (GEPD), Water Meter Calibration, Repair and Replacement Program, EPD Guidance Document; Georgia Environmental Protection Division: Atlanta, GA, USA, 2007; pp. 1–8.
  50. Satterfield, Z.; Bhardwaj, V. Water Meters; Technical Brief; National Environmental Services Center, West Virginia University: Morgantown, WV, USA, 2004; Volume 2, pp. 1–4. [Google Scholar]
  51. Commonwealth of Australia, NMI R 49-1 Water Meters Intended for the Metering of Cold Potable Water and Hot Water Part 1: Metrological and Technical Requirements; National Measurement Institute: Lindfield, Australia, 2009; pp. 1–49.
  52. Hoffmann, M.; Worthington, A.C.; Higgs, H. Urban water demand with fixed volumetric charging in a large municipality: The case of Brisbane, Australia. Aust. J. Agirc. Resour. Econ. 2006, 50, 347–359. [Google Scholar] [CrossRef]
  53. Rogers, P.; de Silva, R.; Bhatia, R. Water is an economic good: How to use prices to promote equity, efficiency, and sustainability. Water Policy 2002, 4, 1–17. [Google Scholar] [CrossRef]
  54. Marchment Hill Consulting, Smart Water Metering Cost Benefit Study, Final Report; Prepared for the Department of Sustainability and Environment: Melbourne, Australia, 2010; pp. 1–94.
  55. Institute for Sustainable Futures; CSIRO. Innovative End-Use Measurement Techniques: Literature and Experience Review Plus Technology List; Prepared for the Victorian Smart Water Fund: Melbourne, Australia, 2006; pp. 1–34. [Google Scholar]
  56. Readdy, A. Overview of Automatic Meter Reading for the Water Industry. In Proceedings of 31st Annual Qld Water Industry Workshop—Operations Skills, Rockhampton, Australia, 4–6 July 2006; pp. 1–7.
  57. Hauber-Davidson, G.; Idris, E. Smart water metering. Water 2006, 33, 38–41. [Google Scholar]
  58. UK Office of Water, Push, Pull, Nudge: How Can We Help Customers Save Water, Energy and Money? UK Office of Water: London, UK, 2011; pp. 1–32.
  59. Hill, T. The smart grid for water. Water Effic. 2011, May, 50–51. [Google Scholar]
  60. Hauber-Davidson, G. The 101 of Smart Metering: Easier and Harder than You Think; Water Conservation Group Pty Ltd: Sydney, Australia, 2009; pp. 1–8. [Google Scholar]
  61. Little, L.; Flynn, J. Big Data, Smart Meters & Australian Water Utilities; Smart Water Research Centre: Griffith, Australia, 2012; pp. 1–13. [Google Scholar]
  62. Oracle, Smart Metering for Water Utilities—An Oracle White Paper; Oracle: North Ryde, Australia, 2009; pp. 1–15.
  63. Sydney Water Corporation, Smart Metering Residential Project 2008–2010; Sydney Water Corporation: Parramatta, Australia, 2011; pp. 1–157.
  64. Turner, A.; Retemal, M.; White, S.; Palfreeman, L.; Panikkar, A. Third Party Evaluation of Wide Bay Water Corporation Smart Metering; Institute for Sustainable Futures, University of Technology, Sydney: Sydney, Australia; Snowy Mountains Engineering Corporation: North Sydney, Australia, 2010; pp. 1–62. [Google Scholar]
  65. Umapathi, S.; Chong, M.N.; Sharma, A.K. Evaluation of plumbed rainwater tanks in households for sustainable water resource management: A real-time monitoring study. J. Cleaner Prod. 2012, 42, 204–214. [Google Scholar] [CrossRef]
  66. Turner, A.; Boyle, T.; Mohr, S.; Fyfe, J.; Bruck, J. Quantitative Evaluation of Residential and School Water Efficiency Programs 2012; Prepared by the Institute for Sustainable Futures, University of Technology, Sydney: Sydney, Australia, 2012; pp. 1–225. [Google Scholar]
  67. Seale, A. Intelligent Water Networks. In Proceedings of the Networks VicWater Conference, Melbourne, Australia, 8 September 2011.
  68. Commonwealth Scientific and Industrial Research Organisation (CSIRO), Intelligent Networks; Urban Water Research Theme—Water for A Healthy Country Flagship; Commonwealth Scientific and Industrial Research Organisation: Canberra, Australia, 2010; pp. 1–2.
  69. Marchment Hill Consulting, WSAA Position Paper No. 4: Intelligent Networks Urban Water Industry Requirements of Communications National Broadband Network; Prepared for the Water Services Association of Australia: Sydney, Australia, 2010; pp. 1–18.
  70. Global Water Resources, Media Release: Global Water and Thames Water extend partnership to research improved service for residential and commercial customers with a bespoke FATHOM offering. Global Water Resources: Phoenix, AZ, USA, 19 December 2012; 1–2.
  71. Power and Water Corporation, Smart Metering; Power and Water Corporation: Darwin, Australia, 2012; pp. 1–2.
  72. Strengers, Y. Smart Metering Demand Management Programs: Challenging the Comfort and Cleanliness Habitus of Households. In Proceedings of OzCHI 2008 Design, Culture and Interaction, Cairns, Australia, 8–12 December 2008; pp. 1–5.
  73. Willis, R.; Stewart, R.A.; Panuwatwanich, K.; Capati, B.; Giurco, D. Gold coast domestic water end use study. Water 2009, 36, 79–85. [Google Scholar]
  74. Willis, R.M.; Stewart, R.A.; Panuwatwanich, K.; Jones, S.; Kyriakides, A. Alarming visual display monitors affecting shower end use water and energy conservation in Australian residential households. Resour. Conserv. Recycl. 2010, 54, 1117–1127. [Google Scholar] [CrossRef]
  75. Pezzaniti, D. Smart Irrigation Metering Technology: Identifying the Potential Benefits and Uptake Issues; Technical Report No. 04/09; CRC Irrigation Futures, National Water Commission: Canberra, Australia, 2009; pp. 1–56. [Google Scholar]
  76. Cole, G.; O’Halloran, K.; Stewart, R.A. Time of use tariffs: Implications for water efficiency. Water Sci. Technol. 2012, 12, 90–100. [Google Scholar]
  77. Water Corporation. Media Release: Smart Meter Trial Proves Successful. Available online: http://www.watercorporation.com.au/about-us/media/current-media-releases/media-release?id=%7BEFC2BE66-EEE3-4F69-B8AC-AB7FD93D93CD%7D (accessed on 24 February 2013).
  78. ICLEI Oceania, Water Campaign Actions Profile 2009; ICLEI Oceania: Melbourne, Australia, 2009; pp. 1–12.
  79. Mackay Regional Council, Mackay Regional Council Final Minutes; Mackay Regional Council: Mackay, Australia, 2012; pp. 1–44.
  80. Beaton, R. Personal communication, Yarra Valley Water: Melbourne, Australia, 26 June 2012.
  81. Watkins, G. Personal communication, MidCoast Water: Taree, Australia, 5 January 2012.
  82. Institute for Sustainable Futures, Expanding the Digital Frontier of Sustainable Urban Water Management; Institute for Sustainable Futures, University of Technology, Sydney: Sydney, Australia, 2012; pp. 1–2.
  83. Loh, M.; Coghlan, P. Domestic Water Use Study: Perth 1998–2001; Water Corporation: Perth, Australia, 2003; pp. 1–36. [Google Scholar]
  84. Water Corporation. Pilbara Smart Metering Program. Available online: http://www.watercorporation.com.au/P/pilbara_smart_metering.cfm/ (accessed on 16 February 2013).
  85. Doolan, C. Sydney Water’s Smart Metering Residential Project: An insight into the benefits, costs and challenges of smart metering. Water 2011, 38, 77–80. [Google Scholar]
  86. MidCoast Water, Smart Meter Water Usage Study Report for Pressure Management Group: Tea Gardens and Hawks Nest; MidCoast Water: Taree, Australia, 2012; pp. 1–22.
  87. Mead, N. Investigation of Domestic Water End Use. Master’s Dissertation, University of Southern Queensland, Toowoomba, Australia, 30 October 2008. [Google Scholar]
  88. Townsville City Council, Media Release: Smart Meters to Monitor Water Usage; Townsville City Council: Townsville, Australia, 2007.
  89. Foody, C. Domestic Potable Water Demand on the Central Coast, New South Wales. Master’s Dissertation, University of Newcastle, Newcastle, Australia, October 2006. [Google Scholar]
  90. Roberts, P. Yarra Valley Water 2004 Residential End Use Measurement Study; Yarra Valley Water: Melbourne, Australia, 2005; pp. 1–77. [Google Scholar]
  91. South East Water, Schools Hydroshare Pilot Program: Final Evaluation Report; South East Water: Melbourne, Australia, 2008; pp. 1–21.
  92. Government of Canada, Media Release: Government of Canada Invests in New Smart Meters for Abbotsford; Government of Canada: Victoria, Canada, 9 April 2010.
  93. Giurco, D.; Carrard, N.; McFallan, S.; Nalbantoglu, M.; Inman, M.; Thornton, N.; White, S. Residential End-Use Measurement Guidebook: A Guide to Study Design, Sampling and Technology; CSIRO, Institute for Sustainable Futures, University of Technology, Sydney: Sydney, Australia, 2008; pp. 1–56. [Google Scholar]
  94. Bristol Water, Bristol Water Plc Final Business Plan—Part A; Bristol Water: Bristol, UK, 2010.
  95. Chicago Awards Automatic Meter Reading Contract. Available online: http://www.digitalcommunities.com/articles/Chicago-Awards-Automatic-Meter-Reading-Contract.html (accessed on 20 January 2013).
  96. Iltron Media Release: Itron Awarded Major Water Meter Contract in Delhi, India. Available online: http://investors.itron.com/releasedetail.cfm?ReleaseID=595740 (accessed on 14 January 2013).
  97. Iltron Media Release: Itron Delivers Smart Water Meters for Nation-Wide Grid in Malta. Available online: https://www.itron.com/newsAndEvents/Pages/Itron-Delivers-Smart-Water- Meters-for-Nation-Wide-Grid-in-Malta.aspx (accessed on 14 January 2013).
  98. City of New York about Automated Meter Reading. Available online: http://www.nyc.gov/html/dep/html/customer_services/amr_about.shtml (accessed on 21 January 2013).
  99. City of Ottawa Water Meters. Available online: http://ottawa.ca/en/residents/water-and-environment/water-and-sewer-bills/water-meters (accessed on 21 January 2013).
  100. City of San Marcos, Media release: City of San Marcos “Smart Meter” AMI Project Wins National Award; City of San Marcos: San Marcos, TX, USA, 19 February 2009.
  101. Parsons, W. Water Meter Initiative to Save Scottish Public Sector £2.7m. Available online: http://www.edie.net/news/4/Water-meter-initiative-to-save-Scottish-public-sector-27m/21283/ (accessed on 21 January 2013).
  102. Net Resources Interntional. Xylem and Visenti Partner to Improve Water Distribution in SINGAPORE. Available online: http://www.water-technology.net/news/newsxylem-visenti-improve-water-distribution-singapore (accessed on 21 January 2013).
  103. Utah town selects smart meter solution from Sensus. Available online: http://www.smartmeters.com/the-news/274-utah-town-selects-smart-meter-solution-from-sensus.html (accessed on 23 February 2013).
  104. Smart grid technology. Available online: http://www.talgov.com/you/you-learn-energy-smart-grid.aspx (accessed on 23 February 2013).
  105. Mayer, P.; DeOreo, W.; Towler, E.; Martien, L.; Lewis, D.M. Tampa Water Department Residential Water Conservation Study: The Impacts of High Efficiency Plumbing Fixture Retrofits in Single-Family Homes; Tampa Water Department, United States Environmental Protection Agency: Tampa, FL, USA, 2004; pp. 1–211. [Google Scholar]
  106. Thames Water, Taking Care of Water: The Next 25 Years; Thames Water: London, UK, 2007; pp. 1–72.
  107. Neptune Technology Group. Toronto Water Meter Program. Available online: http://torontowatermeterprogram.ca/ (accessed on 22 January 2013).
  108. Frontier Economics, Efficient Water Resource Pricing in Australia: An Assessment of Administered Scarcity Pricing in Urban Areas; Waterlines Report No. 44; National Water Commission: Canberra, Australia, 2011.
  109. Hughes, N.; Hafi, A.; Goesch, T.; Brownlowe, N. Urban Water Management: Optimal Price and Investment Policy Under Uncertainty. In Proceedings of the Australian Agricultural and Resource Economics Society 52nd Annual Conference, Canberra, Australia, 5–8 February 2008; pp. 1–24.
  110. Productivity Commission, Towards Urban Water Reform: A Discussion Paper; Productivity Commission: Melbourne, Australia, 2008; pp. 1–163.
  111. Giurco, D.; White, S.; Stewart, R. Smart metering and water end-use data: Conservation benefits and privacy risks. Water 2010, 2, 461–467. [Google Scholar] [CrossRef]
  112. Stewart, R.A.; Willis, R.; Giurco, D.; Panuwatwanich, K.; Capati, G. Web-based knowledge management system: Linking smart metering to the future of urban water planning. Aust. Planner 2010, 47, 66–74. [Google Scholar] [CrossRef]
  113. Britton, T.; Stewart, R.A.; Halloran, K.O. Smart Metering: Providing the Foundation for Post Meter Leakage Management 2009. In Proceedings of the 5th International Water Association (IWA) Efficient, Sydney, Australia, 25–28 October 2009; pp. 1–8.
  114. Mukheibir, P. Less Water Loss—An Integrated Approach for Small Water Supply Systems. In Proceedings of OzWater’10, Brisbane, Australia, 8–10 March 2010; pp. 1–8.
  115. Allon, F.; Sofoulis, Z. Everyday water: Cultures in transition. Aust. Geographer 2006, 37, 45–55. [Google Scholar] [CrossRef]
  116. Dong, J. Splintering Urbanism and Sustainable Urban Water Management. In Proceedings of the 2nd State of Australian Cities Conference, Brisbane, Australia, 30 November–2 December 2005; pp. 1–14.
  117. Chartres, C.; Williams, J. Can Australia overcome its water scarcity problems? J. Dev. Sustain. Agric. 2006, 1, 17–24. [Google Scholar]
  118. Keath, N.A.; Brown, R.R. Extreme events: Being prepared for the pitfalls with progressing sustainable urban water management. Water Sci. Technol. 2009, 59, 1271–1280. [Google Scholar] [CrossRef]
  119. Turton, A.; Meissner, R. The Hydrosocial Contract and Its Manifestation in Society. In Hydropolitics in the Developing World: A South African Perspective; Turton, A., Henwood, R., Eds.; African Water Issues Research Unit, Centre for International Political Studies: Pretoria, South Africa, 2002; p. 269. [Google Scholar]
  120. Fane, S.; Turner, A.; McKibbin, J.; May, D.; Fyfe, J.; Chong, J.; Blackburn, N.; Patterson, J.; White, S. Integrated Resource Planning for Urban Water—Resource Papers; Waterlines Report No. 41; National Water Commission: Canberra, Australia, 2011; pp. 1–206. [Google Scholar]
  121. Postel, S. Entering an era of water scarcity: The challenges ahead. Ecol. Appl. 2000, 10, 941–948. [Google Scholar] [CrossRef]
  122. Shove, E. Beyond the ABC: Climate change policy and theories of social change. Environ. Plan. A 2010, 42, 1273–1285. [Google Scholar] [CrossRef]
  123. Moy, C.; Giurco, D.; Boyle, T. Can Smart Meters Create Smart Behaviour? In Proceedings of the International Conference on Sustainable Water Resource Management, Stockholm, Sweden, 16 July 2013.
  124. Roberts, P.; Manager, D.F. Residential End Use Research to Support Demand Management and Forecasting; Yarra Valley Water: Melbourne, Australia, 2005; pp. 1–40. [Google Scholar]
  125. Coombes, P. Effectiveness of Rainwater Harvesting for Management of the Urban Water Cycle in South East Queensland; Urban Water Cycle Solutions: Carrington, Australia, 2012; pp. 1–34. [Google Scholar]
  126. Savic, D. Improved Water Efficiency through ICT Technologies for Integrated Supply-Demand Side Management, iWIDGET. In Proceedings of WssTP COST Strategic Conference, Lisbon, Portugal, 22 April 2013.
  127. Strengers, Y. Challenging Comfort & Cleanliness Norms through Interactive In-Home Feedback Systems. In Proceedings of Green Pervasive Workshop at Pervasive Persuasive 2008, Sydney, Australia, 19–22 May 2008.
  128. Sydney Water Corporation, Every Drop Counts in Schools 2010; Sydney Water Corporation: Paramatta, Australia, 2010; pp. 1–4.
  129. Smart Metering for Schools. Available online: http://www.hunterwater.com.au/Save-Water/Education/Smart-Metering-for-Schools/Smart-Metering-for-Schools.aspx (accessed on 21 January 2013).
  130. My SWEP. Available online: http://www.myswep.com.au/register/about (accessed on 21 January 2013).
  131. Hallinan, K.; Enns, H.; Ritchey, S.; Brodrick, P.; Lammers, N.; Hanus, N.; Rembert, M.; Rainsberger, T. Energy information augmented community-based energy reduction. Sustainability 2012, 4, 1371–1396. [Google Scholar] [CrossRef]
  132. OPower Company Homepage. Available online: http://opower.com/company (accessed on 23 January 2013).
  133. Origin Energy Origin Smart. Available online: http://www.originenergy.com.au/originsmart (accessed on 21 January 2013).
  134. Atzori, L.; Iera, A.; Morabito, G. The internet of things: A survey. Comput. Netw. 2010, 54, 2787–2805. [Google Scholar] [CrossRef]
  135. Hoffman, M.; Worthington, A.; Higgs, H. Modelling Residential Water Demand with Fixed Volumetric Charging in a Large Urban Municipality: The Case of Brisbane, Australia; School of Economics and Finance, Queensland University of Technology: Brisbane, Australia, 2005. [Google Scholar]
  136. Nataraj, S. Do residential water consumers react to price increases? Evidence froma natural experiment in Santa Cruz. Agric. Resour. Econ. Update 2007, 10, 9–11. [Google Scholar]
  137. Nauges, C.; Thomas, A. Long-run study of residential water consumption. Environ. Resour. Econ. 2003, 26, 25–43. [Google Scholar] [CrossRef]
  138. Britton, T.; Cole, G.; Stewart, R.; Wiskar, D. Remote diqagnosis of leakage in residential households. Water 2008, 35, 56–60. [Google Scholar]
  139. Taylor, P.; Germanopoulos, G. Network models: A technical note on the inclusion of pressure dependent demand and leakage terms in water supply network models. Civil Eng. Syst. 1985, 2, 171–179. [Google Scholar] [CrossRef]
  140. Hope, R.; Foster, T.; Money, A.; Rouse, M.; Money, N.; Thomas, M. Smart Water Systems; Project Report to UK DFID; Oxford University: Oxford, UK, 2011; pp. 1–14. [Google Scholar]
  141. Mackay Regional Council Real time metering. Available online: http://www.mackay.qld.gov.au/__data/assets/pdf_file/0014/130460/120912-Ordinary_Meeting_FINAL_Minutes_-_WEBSITE.pdf (accessed on 26 February 2013).
  142. Water Wise Dollar Dumb: Sydney Morning Herald. Available online: http://www.smh.com.au/environment/water-issues/water-wise-dollar-dumb-20130220-2erql.html (accessed on 21 February 2013).
  143. Terrebonne, R.P. Residential Water Demand Management Programs: A Selected Review of the Literature; Water Policy Working Paper #2005–002; Georgia Soil and Water Conservation Commission: Athens, GA, USA, 2005. [Google Scholar]
  144. Yurdusev, M.; Kumanhoglu, A. Survey-based estimation of domestic water saving potential in the case of Manisa City. Water Resour. Manag. 2008, 22, 291–305. [Google Scholar] [CrossRef]
  145. Koehle, O. Just Say No to Big Brother’s Smart Meters; ARC Reproductions: Rohnert Park, CA, USA, 2011; p. 155. [Google Scholar]
  146. Stop Smart Meters! Homepage. Available online: http://stopsmartmeters.org/ (accessed on 20 January 2013).
  147. Franks, D.; Cohen, T. Social Licence in Design: Constructive technology assessment within a mineral research and development institution. Technol. Forecast. Soc. Change 2012, 79, 1229–1240. [Google Scholar] [CrossRef]
  148. White, S.; Robinson, J.; Cordell, D.; Jha, M.; Milne, G. Urban Water Demand Forecasting and Demand Management: Research Needs Review and Recommendations; Occasional Paper No. 9; Institute for Sustainable Futures, University of Technology, Sydney: Sydney, Australia, 2003; pp. 1–56. [Google Scholar]

