1. Introduction
Hydrologic regime is an important regulator of ecological processes in rivers [
1]. River systems may undergo hydrologic alteration from land-use, drainage and/or climate change in a variety of ways. The hydrologic response of rivers to change may include alteration of stream flow magnitude, duration, timing, frequency and variability all of which can alter a river’s geomorphologic and riparian characteristics in various ways with consequences for stream biota [
2]. Hydrologic and geomorphic change can affect aquatic biota in numerous ways since their life cycles are often tied to the variability of water level in rivers. For instance, many migratory fish swim upstream to spawn in the spring when water levels are high. Changes in stream flow can affect the availability of different in-stream habitat features for fish [
3] and turtles [
4]. Similarly, certain turtle species require stream flow levels below a certain threshold to allow for nesting. Lotic (river) species are influenced more by hydrologic changes than further upland or lentic species that live in lakes or ponds. Aquatic organisms are particularly at risk to hydrologic change since there are a large number of threatened or endangered aquatic species in rivers, including fish, mussels, and riverine turtles [
5]. Some studies have been done quantifying eco-hydrological interactions mostly focusing on how flow magnitude change impacts fish or invertebrate species [
3]. Very few studies exist that relate changes in the duration and timing of stream flow change to the life cycles of riverine amphibians or reptiles.
Although flooding is widely recognized to play an important role in shaping aquatic ecosystems, recent research on hydrologic alteration in the Upper Midwestern United States has shown that increased low and mean flows may have important impacts on river ecological processes as well. In recent decades, the hydrologic regime of many Upper Midwest streams has changed, particularly in the agricultural regions of Iowa, southern Minnesota and the eastern Dakotas [
6]. Increases in stream flow volume are thought to be primarily due to expansion of subsurface soil drainage pipes and changes in vegetative cover, while extreme flood events are often attributed to climate change [
6]. For instance, Ashmore and Church found that climate change would affect flood flows more than mean annual flows in Canadian Rivers [
7]. In contrast with climate-driven changes, annual mean flows have increased by two to three times in many Upper Midwestern rivers while the magnitude of large floods has not changed significantly in many cases. These flow increases have caused channel evolutionary changes in many rivers. While rivers naturally migrate over time across their valley, they go through an accelerated process of evolution in response to flow changes and related erosional and depositional shifts [
8]. Recent stream flow increases in agricultural regions of the Upper Midwest have thrown these rivers out of equilibrium [
6] causing widening in many streams [
9] and entrenchment in some cases.
Point bar formation is integrally related to stream hydrology and hydraulics. Point bars form on the inside of river meanders as sediment deposits in lower velocity areas. Finer sediments tend to be carried downstream while coarse sediment is dropped out on the point bar, resulting in sand or gravel deposits [
8], and leading to point bars being referred to as sandbars instead. Increased stream flow can reduce sandbar deposition in higher gradient streams while potentially promoting sandbar growth in low-gradient, depositional reaches. For normal hydrological conditions, water levels at sandbar locations are highly variable submerging sandbars at high flows and then leaving them dry for extended periods of low flow. Ecologically, sandbars are dynamic locations of vegetation establishment and primary succession on bare soil. Many wildlife species utilize sandbars for parts of their life cycle. The lack of vegetation allows sandbars to receive full sun exposure which is critical to ectothermic reptiles that need sun to maintain their internal temperatures and to enhance egg development. While sediment mobilization during high flows and subsequent deposition plays an important role in the formation and migration of sandbars, the effect of water level “drawdown” during low flow is important for sandbar exposure during the nesting season and successful turtle reproduction. Yet, few studies have assessed the consequences of increased low and mean flows on turtle habitat availability and nesting success.
For example, many rivers in the north-eastern and north central United States have a spring peak flow followed by falling water levels through the summer and early fall. Turtles require falling water levels during the summer to avoid flooding of their nests since most eggs cannot survive more than two days of submergence. The smooth softshell turtle A. mutica remains close to the water at all times and relies on falling spring to summer water levels for nesting. The wood turtle (G. insculpta) and A. mutica have become increasingly rare in Minnesota due to harvesting, predation and changes to aquatic and upland habitat. These two river-dependent turtles are classified as Species in Greatest Conservation Need (SGCN) by the Minnesota Department of Natural Resources (DNR), with the wood turtle also listed as threatened and the smooth softshell as a special concern species on the state Endangered Species list.
The smooth softshell is a riverine turtle found in large river systems. The subspecies found in Minnesota is the midland smooth softshell (
A. mutica). Based on available data, the distribution of this species in Minnesota is limited to the lower St. Croix River, portions of the Minnesota River, and the Mississippi River downstream of the Twin Cities (
Figure 1) [
10]. Smooth softshell turtles prefer large unpolluted rivers with sandy substrates although they can also be found in lakes, ponds and bogs [
11]. In Minnesota, the smooth softshell turtle has been found in large rivers with moderate to fast currents [
10]. In terms of bed materials, they prefer sand or mud, without rocky areas or dense vegetation [
10,
12].
The wood turtle is found throughout the northeast United States, parts of the Upper Midwestern United States and eastern Canada (
Figure 1). In Minnesota, wood turtle distribution is sparse and focused primarily within the eastern forested regions [
10,
13]. The preferred habitat of wood turtles can be defined by three main components: coarse-bottom rivers with fairly swift moving currents, partially shaded herbaceous vegetation within the river floodplain, and an abundance of sandy substrate within a few hundred meters of the river [
14,
15,
16]. Since the wood and smooth softshell turtles are riverine species, their habitat, population traits, and distribution are directly linked to fluvial geomorphology and river hydrology characteristics. The types of nesting features used by wood turtles include those areas of bare sand formed by fluvial process (
i.e., sandbars and cut-banks) but also anthropogenic features such as gravel road shoulders. Smooth softshell turtles are more dependent on the river corridor and will not bask, nest or feed far from water.
Figure 1.
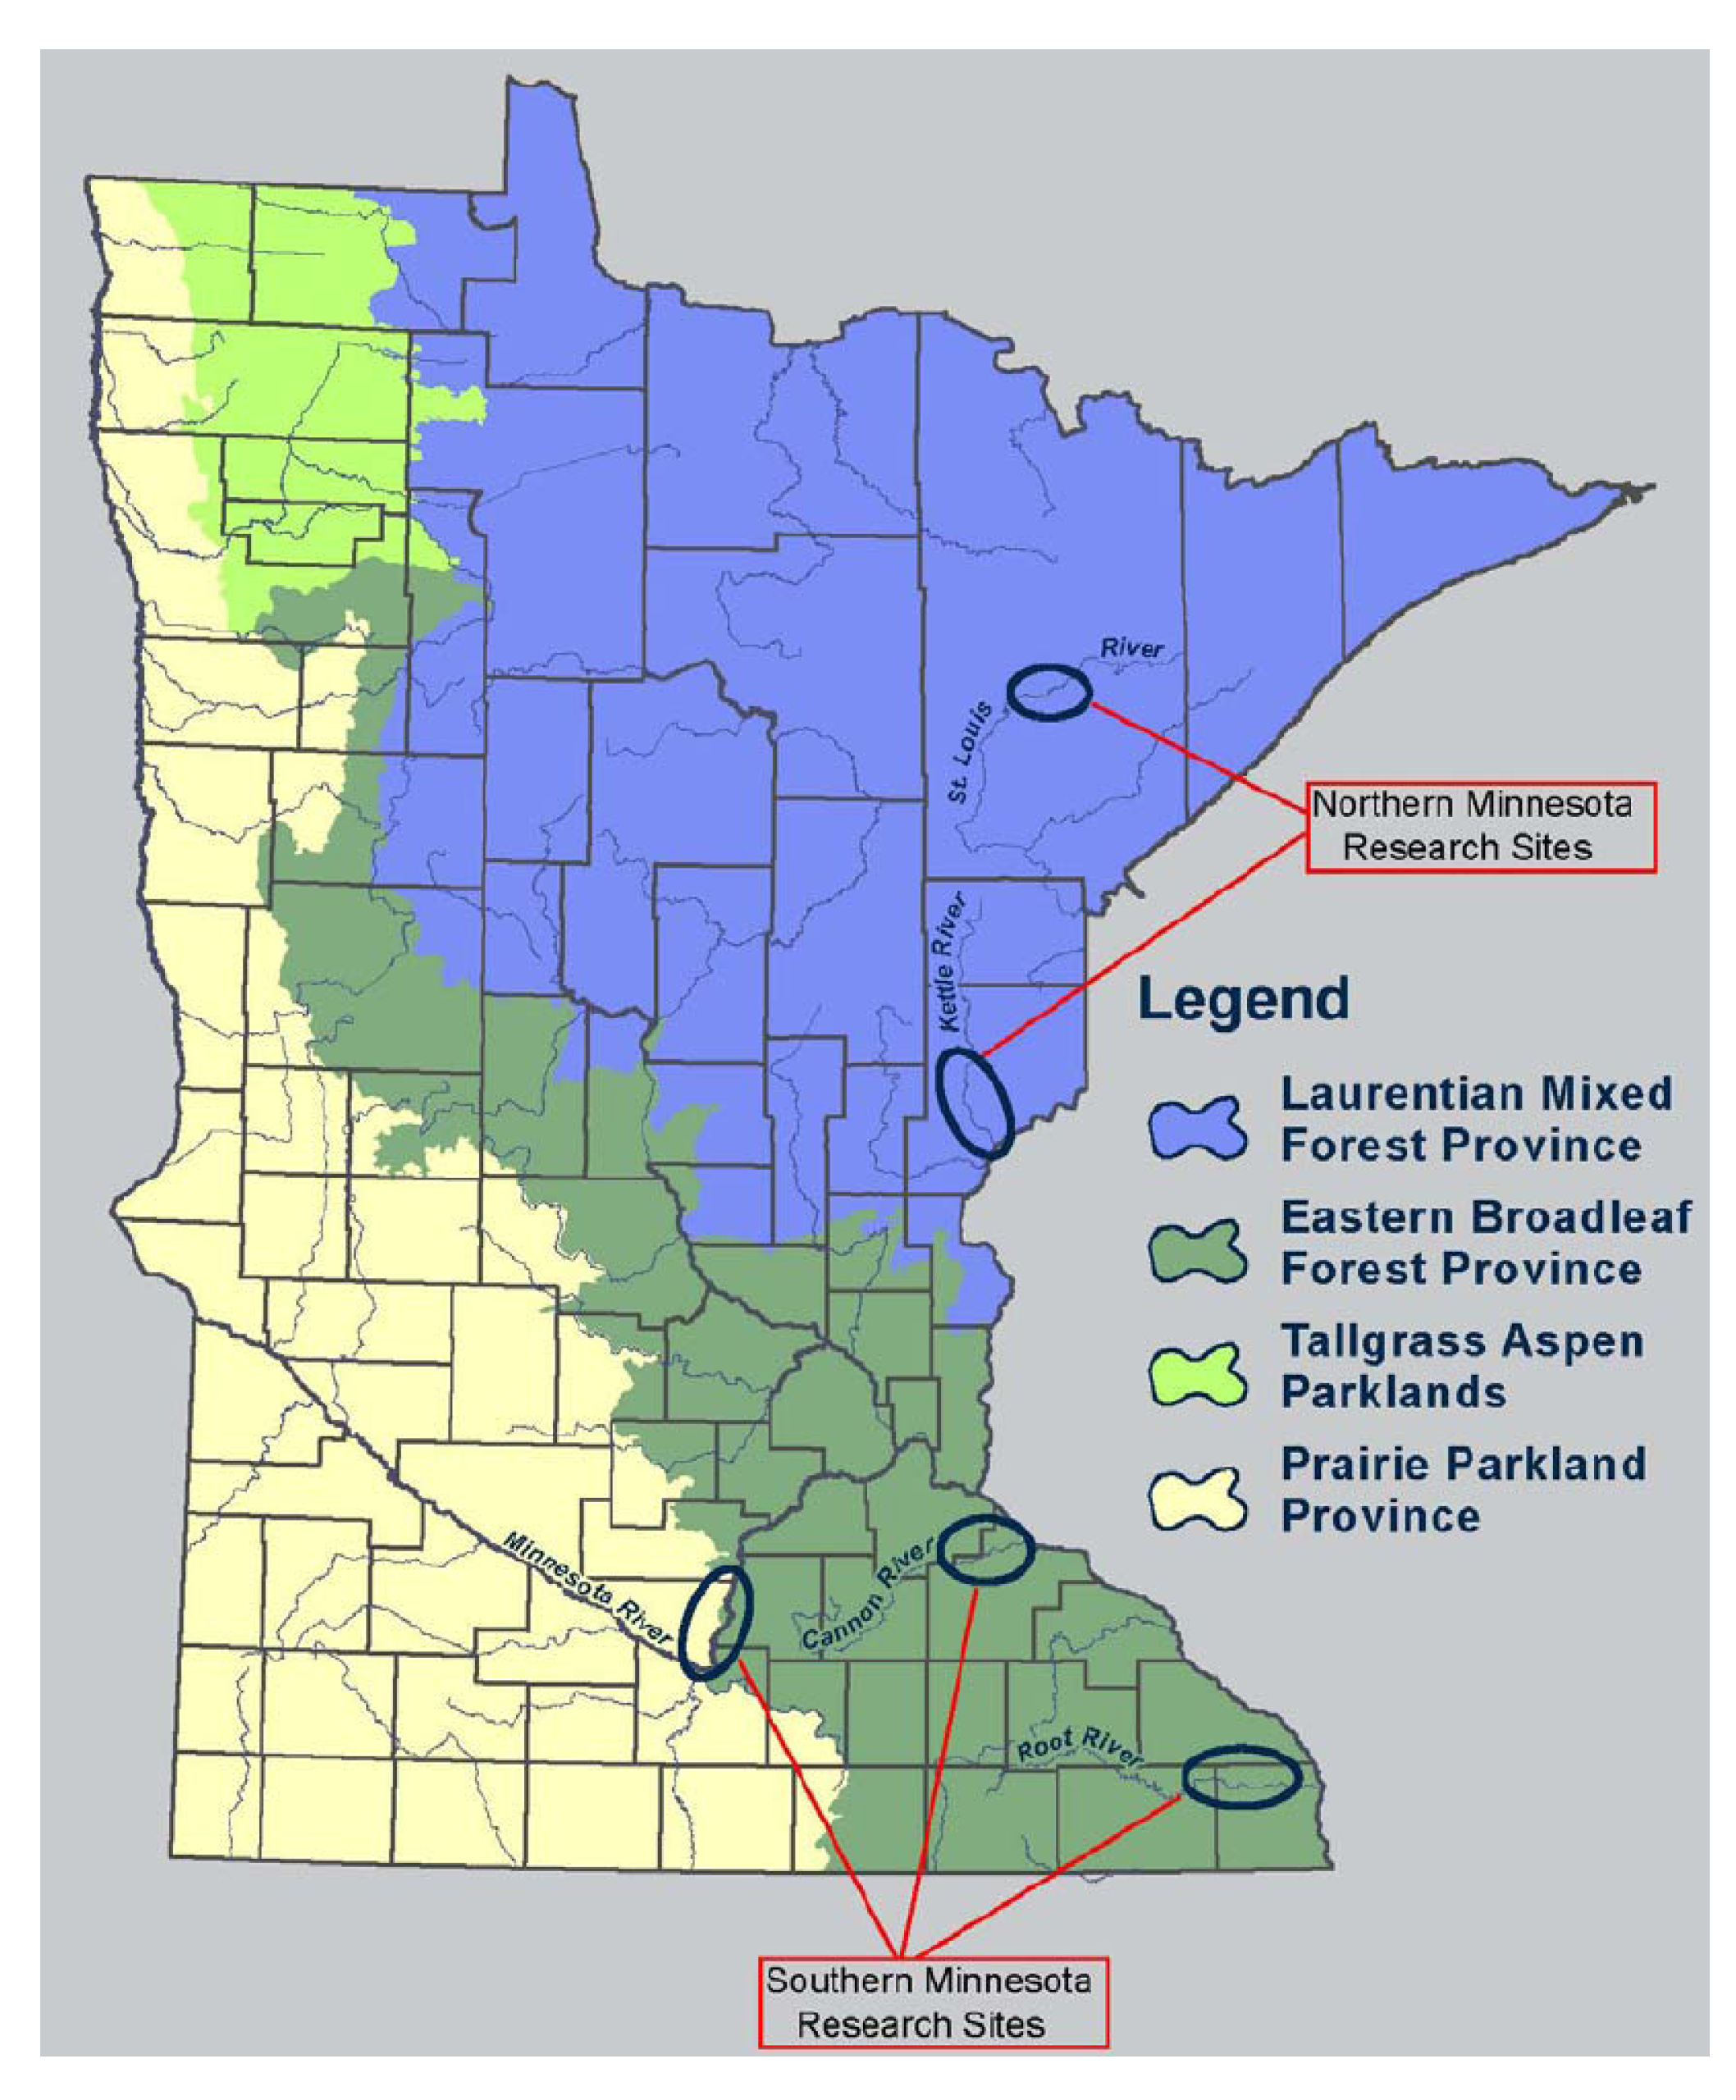
Location of study reaches on five Minnesota Rivers. From north to south the rivers are: the St. Louis, Kettle, Cannon, Minnesota, and Root Rivers.
Figure 1.
Location of study reaches on five Minnesota Rivers. From north to south the rivers are: the St. Louis, Kettle, Cannon, Minnesota, and Root Rivers.
The project was conducted to gain a better understanding of human impacts and environmental change on the river habitat of two rare or declining aquatic turtle species. In particular, the impact of hydrologic change on river turtle habitat was assessed, focusing on reduction of sandbar area and nest inundation from increased stream flow. (The study did not include the anthropogenic nesting features such as sand/gravel pits that are sometimes used by turtles for nesting.) Secondly, the Minnesota DNR wanted a survey of the five rivers to gain information on the location of the rare turtles’ nests. This project relied on hydrologic analyses done with a grant from the Minnesota Water Resources Center and U.S. Geological Survey from 2009 to 2010 which showed that there had been substantial summer stream flow increases in many Upper Midwestern rivers. A grant was then obtained from the Minnesota Department of Natural Resources to assess potential impacts of stream flow increases on riverine turtles listed as threatened or endangered within the state. Our primary hypothesis was that there has been a reduction in the duration and frequency of sandbar exposure needed for river turtle nesting including wood turtle and smooth softshell turtle. We presumed that this increased duration of sandbar submergence would decrease the ability of these turtle species to successfully nest. We did not attempt to assess actual turtle nesting success in this study.
2. Materials and Methods
2.1. Study Area
The study sites were located in the eastern forested region of Minnesota in areas supporting known smooth softshell or wood turtle populations (
Figure 1). The smooth softshell is only known to occur in the Minnesota River of the five study sites, while the wood turtle range historically includes all the study rivers except the Minnesota River. The sites were selected to consider a range of watershed land use conditions. These included rivers in the south with >67% agricultural land use and northern rivers with >67% forest cover.
2.2. Collection of Field Data
Sandbars were surveyed for turtle nesting activities and geomorphic measurements were taken between June and September 2010 on five rivers within Minnesota. Turtle nest sites are visible after hatching has occurred since a small number of relict egg pieces are left behind. We conducted a turtle survey of species and active nest sites observed at eight to 20 sandbars within the study reaches listed in
Table 1. Data on the physical properties of sandbars was collected at five to eight of these sites and is described below.
Table 1.
Characteristics of study rivers. (a) location along river; (b) presence of wood turtle (G. sculpta) and smooth softshell (A. mutica) known to exist in river; (c) stream bed type; (d) ecological province; and (e) annual mean discharge of the river since 1980.
Table 1.
Characteristics of study rivers. (a) location along river; (b) presence of wood turtle (G. sculpta) and smooth softshell (A. mutica) known to exist in river; (c) stream bed type; (d) ecological province; and (e) annual mean discharge of the river since 1980.
| River | Study reach | Species of interest occurring in river | Stream bed type | Ecological province | Annual mean discharge since 1980 (m3/s) |
|---|
| Cannon | Lower river | G. sculpta, A. mutica | sand, gravel | Eastern broadleaf forest | 26 |
| Kettle | Lower river | G. sculpta | cobble, gravel, sand | Laurentian mixed forest | 19 |
| Minnesota | Middle-lower | A. mutica | sand | Prairie parkland | 156 |
| Root | Lower river | G. sculpta, A. mutica | sand, gravel | Eastern broadleaf | 30 |
| St. Louis | Upper river | G. sculpta | cobble, gravel, sand | Laurentian mixed forest | 73 |
A survey of turtle nesting and other activity such as basking was conducted noting turtle tracks, nest signs, turtle eggs or shells and other indicators within the study reaches. Approximately 15 min was spent by two people looking for nesting activity on each sandbar. Potential nesting sites were selected remotely using recent aerial photography and then field surveyed. Nesting activity was recorded when signs of recently laid eggs or depredated nest sites were observed. Turtles were identified to the species level when possible; however, it was not possible to distinguish the smooth softshell (A. mutica) from the more common spiny softshell (Apalone spinifera) from a distance over 10–15 m.
Physical sandbar characteristics measured included slope, particle size distribution, temperature and plant coverage and type. Eight to 20 sandbars were surveyed per river with three to six soil samples collected per river in the vicinity of turtle nesting sites. Soil samples were sieved in the lab and grouped into the following particle size classes: silt and clay (<0.0625 mm); fine and very fine sand (0.0625–0.25 mm); medium to coarse sand (0.25–2.0 mm); and gravel or larger (>2 mm).
Temperature data was recorded at the surface and at 15 cm depth (the approximate depth at which turtle eggs are deposited) both at the peak elevation of the unvegetated portion of a sandbar and at the water’s edge during the late morning to early afternoon to assess suitability for egg incubation. Temperature was considered important since smooth softshell turtle eggs are known to develop optimally with temperatures in the range of 28.5–32.5 °C [
17]. Differences in the means of the recorded temperatures for the two locations on each sandbar were tested for significance using a paired
t-test.
2.3. Hydrologic Analysis
The Indicators of Hydrologic Alteration (IHA) statistical software program was used to assess changes in hydrologic regime of rivers in Minnesota during the time period of 1980–2009 compared to the previous time period of 1940–1979. A variety of statistical measures of stream flow change were compared at United States Geological Survey (USGS) stream gauge sites with flow records of >60 years (except the Kettle River where records began in the 1960s). The year 1940 was used as the cutoff for the earlier time period since few stream gauges were in operation prior to that time. The 1980 to present time period was used because large stream flow changes were observed in many southern Minnesota Rivers during this time period and substantial land-use, tile-drainage and precipitation increases also occurred during that time, as summarized by Lenhart
et al. [
6]. For consistency in methods, we then compared all sites using these time periods for 16 different rivers across Minnesota. The IHA software tests for significant differences using a Monte Carlo simulation whereby a large data set is randomly generated from the existing stream flow data set. The means of the simulated data sets are compared to test for significance in differences between the means, using alpha = 0.05. Changes to flow magnitude, duration, frequency and timing were assessed with IHA to better understand the impacts of hydrologic change on the life cycles of turtles. This analysis focused on the duration of flow levels that would submerge the sandbars during the nesting and hatching months of June–August. We also looked at annual mean flow and variability in flow using the coefficient of variation (C.V.), defined as the standard deviation of mean annual flows divided by the annual mean flow. In all five rivers, the flow required to submerge the sandbar was close to the annual mean flow level and therefore the annual mean flow or monthly median flow is used in several of the analyses.
We also examined an earlier period of stream flow record (1900–1940 for streams where data was available) to identify the earliest possible dates available for turtle nesting on each river based on the timing of sandbar emergence. This data was used to determine whether the availability of sandbar nesting sites had been delayed in the summer due to the hydrologic regime change. We used data prior to 1940 in this analysis to examine sandbar exposure during the dry period of the late 1920s and 1930s which was the longest prolonged drought in the 20th century.
2.4. Geomorphic Assessment of Sandbar Exposure/Discharge Relationships
Since active sandbars are located below the bankfull elevation, increased duration of flows in the low to annual mean flow range was expected to decrease the period of time that sandbars were exposed. To document changes in sandbar availability we measured the changes in areal extent and duration of sandbar exposure in study reaches of five rivers (
Table 1) using aerial photos and GIS. The surface area of exposed sandbar habitat was digitized in aerial photos using GIS from all five rivers dating back to 1938. USGS streamflow data was collected from their archived data for the same days the aerial photos were taken. Based on eight to 12 years of aerial photography with paired stream discharge data, a relationship between stream discharge and area of exposed sandbars was developed; this is referred to as the
discharge-sandbar area relationship. Then, the USGS stream gauge record for each site was analyzed to calculate the frequency and duration of exposed sandbars, in days before and after 1980. Sandbars were also surveyed in the field at three to five sites on each river to establish the elevation of turtle nests relative to the overbank flow and annual mean flow elevations.
The timing and availability of turtle nesting sites based on flow levels were calculated by identifying the earliest date when flow dropped below the sandbar inundating flow level. If this flow level was exceeded for two days or more during a period of 75 days between 1 June and 15 August any laid eggs would be submerged and were assumed to be dead. If sandbar exposure did not occur until after 15 August, it was assumed to be too late for successful nesting to occur. Very low nesting success was considered to occur between 1 and 15 August; marginal nesting success from 15 to 31 July and good nesting success from 1 June to 14 July. These dates were used as cutoff points for the sake of data analysis. In reality, the turtle nest time periods may be more variable due to differences in egg development time and susceptibility to flooding as the eggs develop.
Change in river width was examined in two rivers, the Minnesota and Kettle Rivers. These rivers were thought to be typical of rivers in the two different regions of the state, the lower Minnesota in the south-central region and the Kettle representative of the northern forested region. River width change was examined because several rivers in southern Minnesota are known to have widened in response to flow increases [
9,
18,
19]. Ten sites were selected within our study reaches and widths measured on 1991 and 2009 aerial photos at the same locations. Measurement error was estimated to be about ±10%. Differences were tested for significance using a paired
t-test.
There were several sources of uncertainty in our analyses. Stream flow data is naturally highly variable and decades may be required to observe significant trends. However, statistics used in this study that utilize monthly or annual mean or median flow integrate large quantities of data. Therefore, when significant differences are found in comparing periods of many decades with these metrics they tend to represent meaningful hydrologic changes and not just transient weather-related impacts.
The development of the sandbar-area discharge relationship involved the greatest potential source of error in this study. Some years lacked aerial photos with exposed sandbars to quantify their area. This created a lack of data at certain stream flow levels. However, the error is limited to a small range of flows near the incipient point of sandbar emergence. This is because all sandbars are clearly under water at higher stream flows, while at low stream flows the sandbars are clearly exposed. In the middle stream flow ranges near the incipient point of sandbar emergence, there was potential error in estimating the sandbar-submerging discharge possibly in the range of 10%–30%. While this error may appear large, it did not substantially change the results for the number of days of sandbar exposure in a given year. This was because flows related to the point of incipient sandbar exposure have a short-lived duration, lasting just hours to days depending on the size of the river and the rate of hydrograph decline.
4. Discussion and Conclusions
In this study, we examined whether there was a change in available turtle nesting habitat caused by increased duration of sandbar submerging flows. However, the correlation between reduction in nesting sites and population levels is complex and includes a host of natural and anthropogenic factors that could not all be addressed in this study. Still, many things were learned from this study involving the importance of hydrologic and geomorphic change for turtle habitat. Natural flow variability in eastern to central Minnesota rivers is such that suitable nesting conditions do not occur every year. Changes in flow around the middle ranges (the 25th–75th percentile flows) may have more impact than changes in peak flows for certain ecological functions such as riverine turtle nesting. Increased magnitude and duration of summer flows in the southern rivers (Cannon, Minnesota and Root) have reduced nesting opportunity both in terms of sandbar exposure frequency and duration in the summer. The average earliest available nesting date during the 1980–2010 time period has been delayed by two to four weeks compared to the pre-1980 time period. This likely causes turtle nesting to be higher up on the sandbar in sub-optimal locations in terms of temperature and exposure to predators. Delay in nesting may also result in eggs incubating in the colder ground temperatures found in September, reducing their viability.
All these watersheds experienced human impacts on land cover since European settlement in the late 1800s. However, the northern forested watersheds have experienced little hydrologic change in recent decades. They were logged heavily in the late 1800s to early 1900s and have since reforested and now are fairly stable. Housing development and mining impacts may become of increasing importance in the St. Louis basin. However, the northern forest region including much of northern Minnesota, Wisconsin and Michigan have actually undergone a process of watershed stabilization from reforestation after the peak logging period in the late 1800s to early 1900s.
In contrast, flow magnitude, duration and timing have changed greatly in the past 30 years in the southern Minnesota rivers. This is in addition to any earlier impacts that are still influencing the river such as channelization. There is still debate as to whether these observed increases in magnitude, duration and timing are a result of the observed increases in precipitation that have occurred, or whether it is caused more by human activities including land cover changes and/or increased tile drainage [
3]. However, it is clear that many of the hydrologic changes observed in Minnesota such as increased and prolonged stream flow volume and decreased C.V. are not consistent with observed changes in climate which show more extreme events.
While there has been a substantial increase in the annual mean flow in many of the streams in southern Minnesota, summer stream flow increase most directly impacts turtle nesting. The nesting-related metrics include the date of earliest sandbar exposure; the duration of continual sandbar emergence; and the occurrence of mid-summer hydrograph pulses. In a broader ecological sense, this analysis illustrates the sporadic, cyclical nature of turtle recruitment in rivers that have naturally variable flow levels (
Table 4).
Smaller rivers and those with more rapid runoff response (such as urban watersheds or those with shallow bedrock) would leave river turtles more susceptible to rapid summer increases in water levels that destroy nests. This may be a factor in explaining why certain turtle species like the smooth softshell are only found on larger rivers, such as the Minnesota and Mississippi Rivers in the Midwestern United States. Data collected on sandbar temperatures showed that it is strongly influenced by the water level in the stream, as sand temperature was lower at the stream edge during warm summer months. Aside from submergence, saturation of sandbars reduces solar heating of sand which delays and/or inhibits development of turtle eggs, reducing survival rates. If nesting is delayed until later summer because of high flows, fall sand temperatures may be less than optimal for egg development. Temperature is also known to influence sex ratios, though a study of this was beyond the scope of this study.
Channels at some of our sites have widened in response to increased flow. Yet, the Minnesota River has large areas of exposed sandbars that are submerged at the mean annual flow level at sites observed in this study. Consequently, open nesting areas are located at higher locations that are sub-optimal since they are usually in vegetated areas and are more susceptible to predation, unlike the bare sandy areas preferred for turtle nesting. The other four rivers in this study had many sandbar surfaces located above the annual mean flow level which appear to be more suitable for riverine turtle nesting.
4.2. Management and Restoration Recommendations
There are numerous threats to the maintenance of healthy wood and softshell turtle populations. Some problems are universal to all riverine turtles. However, by more clearly identifying threats to the species, management resources can be targeted more precisely to help stem the decline of these rare turtle species. Given what is known about the life history of these turtle species, it appears that smooth softshells are more susceptible to summer flow increases in rivers because they are more aquatic, spending most of their lives in or adjacent to rivers. In contrast, wood turtles have a more terrestrial habitat [
7] and nest higher up on stream banks and sandbars. Consequently, wood turtles may be less susceptible to hydrologic change in rivers.
Other factors that have the potential to affect or alter riparian turtle habitat include dredging, channel armoring/stabilization, stream channelization, hydrologic and hydraulic manipulations to streams and riparian vegetation alterations. While dredging is not frequently conducted in the rivers we studied, channelization did occur on the lower 30 km of the Root River decades ago greatly reducing the sandbar areas in that reach. While point bar deposits are forming in the channelized reach, their elevation appears well below the water surface at most river levels. Besides predation, other factors that directly affect turtles’ reproduction include human collection/trapping and anthropogenic hazards such as road crossings. In northern Minnesota, mining activities such as dewatering of quarry areas may cause a large increase in late spring to early summer flow that could impact turtle nesting.
A number of management actions could be undertaken to help reduce the impacts of hydrologic and geomorphic alteration on river turtles. Sinuosity could be restored in channelized stream channels to re-establish point bar nesting habitat. In this study, the lower Root River would benefit from such efforts. Steps could be taken to improve connectivity between viable turtle populations and upland or floodplain habitat areas within suitable riverine corridors [
21]. Known nesting sites should be protected from off-road vehicles, large gatherings of people, camp fires and other disturbances. In rivers where threatened or rare turtles are found, sandbar vegetation could be managed to promote survival of young turtles. Small to medium sized predators, such as raccoons could be controlled at important nest sites to reduce predation. More intensive actions could include steps to expedite channel evolution and the process of sandbar vertical growth on smaller rivers to establish suitable elevations relative to the water level. This is unlikely to be feasible in most cases, but in some reaches where intensive river restoration is being done already, turtle nesting could be incorporated into stream restoration goals. Finally, restoration of hydrologic regimes characteristic of a given river system prior to alteration is important for more thorough restoration. This would be more difficult to achieve given that it requires whole watershed management.
4.3. Recommendations for Future Research
The findings of this study indicate that reduced frequency of nesting opportunity and/or delayed nesting in the southern Minnesota Rivers was a consequence of recent hydrologic changes. However, this needs to be confirmed by actual measures of nesting success, although Spradling
et al. [
22] made a similar observation in northeastern Iowa. Additional observations of nesting location, timing and predation are needed. It is likely that many turtles are able to nest higher up on sandbars and streambanks in response to increase flows. However, these areas are generally less suitable for nesting due to shading, which reduces temperatures, and increased predation by raccoons and other small omnivores. Further research is needed on predation in the upper sandbar areas using radio tagging, wildlife cameras or by trap/mark/recapture studies.
The impact of altered sediment dynamics on turtle nesting is likely important but little is known about this, particularly in streams undergoing active channel widening that may experience high rates of sandbar deposition. Changes in sandbar particle size and sandbar elevation relative to stream water level are both important for nesting success. Increased bank erosion could potentially provide alternative nesting areas, although streambanks are smaller in area and more marginal in terms of temperature/sun exposure than sandbars. Moreover, since some turtles spend much of their lives within a fairly small area, they may not be very adaptable to changes in local conditions.
It would be helpful to know what the most limiting factors in these turtles’ life cycles are, whether it is nesting, overwintering, feeding or dispersal and/or juvenile rearing. There is also limited information on these species’ dispersal after nesting, their range from their nest sites and where they spend the most time [
22,
23]. Even less is known about their overwintering behavior and how hydrologic and geomorphic changes may impact overwintering habits. It is not known whether delayed-overwinter emergence occurs frequently in Minnesota. Changes in the supply and removal of large woody debris impact turtles’ ability to bask which is thought to be important for temperature regulation and possibly other functions. It is not known how the supply and removal practices of large woody debris have changed over time at our study sites, but it could be an important variable. Finally, increased turbidity in many Midwestern rivers may impact riverine turtles such as
A. mutica, which are known to feed by sight within the water column of large rivers.


