3.1. Recent and Seasonal Condition of the LCR Watershed
Total phosphorus (TP) varied from below detection limits (<0.02 mg/L P, used in mean as 0.01 mg/L P) in the summer of 2008 at site 9 to 0.62 mg/L P at site 8 during the first sampling which occurred in the fall of 2007. Of 48 samples taken at 12 sites over four seasons, only two were found to have concentrations below the U.S. EPA recommended criteria (0.0365 mg/L P) for this region, and six samples were found with a concentration below the eutrophic level as suggested by Dodds
et al. [
17] (0.075 mg/L P). Yearly TP means (using half the detection limit for numbers recorded below detection limits) by site ranged from 0.091 mg/L P at site 9 to 0.367 mg/L P at site 8, with an overall mean of 0.175 mg/L P for the entire study (mean of four sampling events over all sites) (
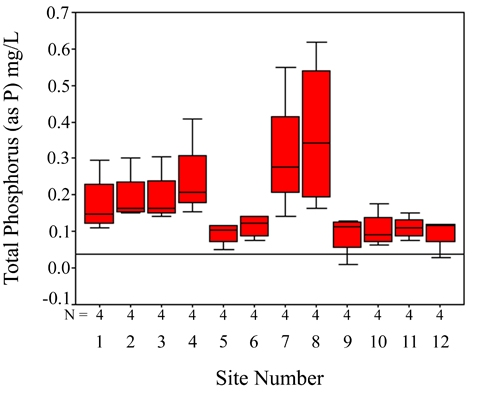
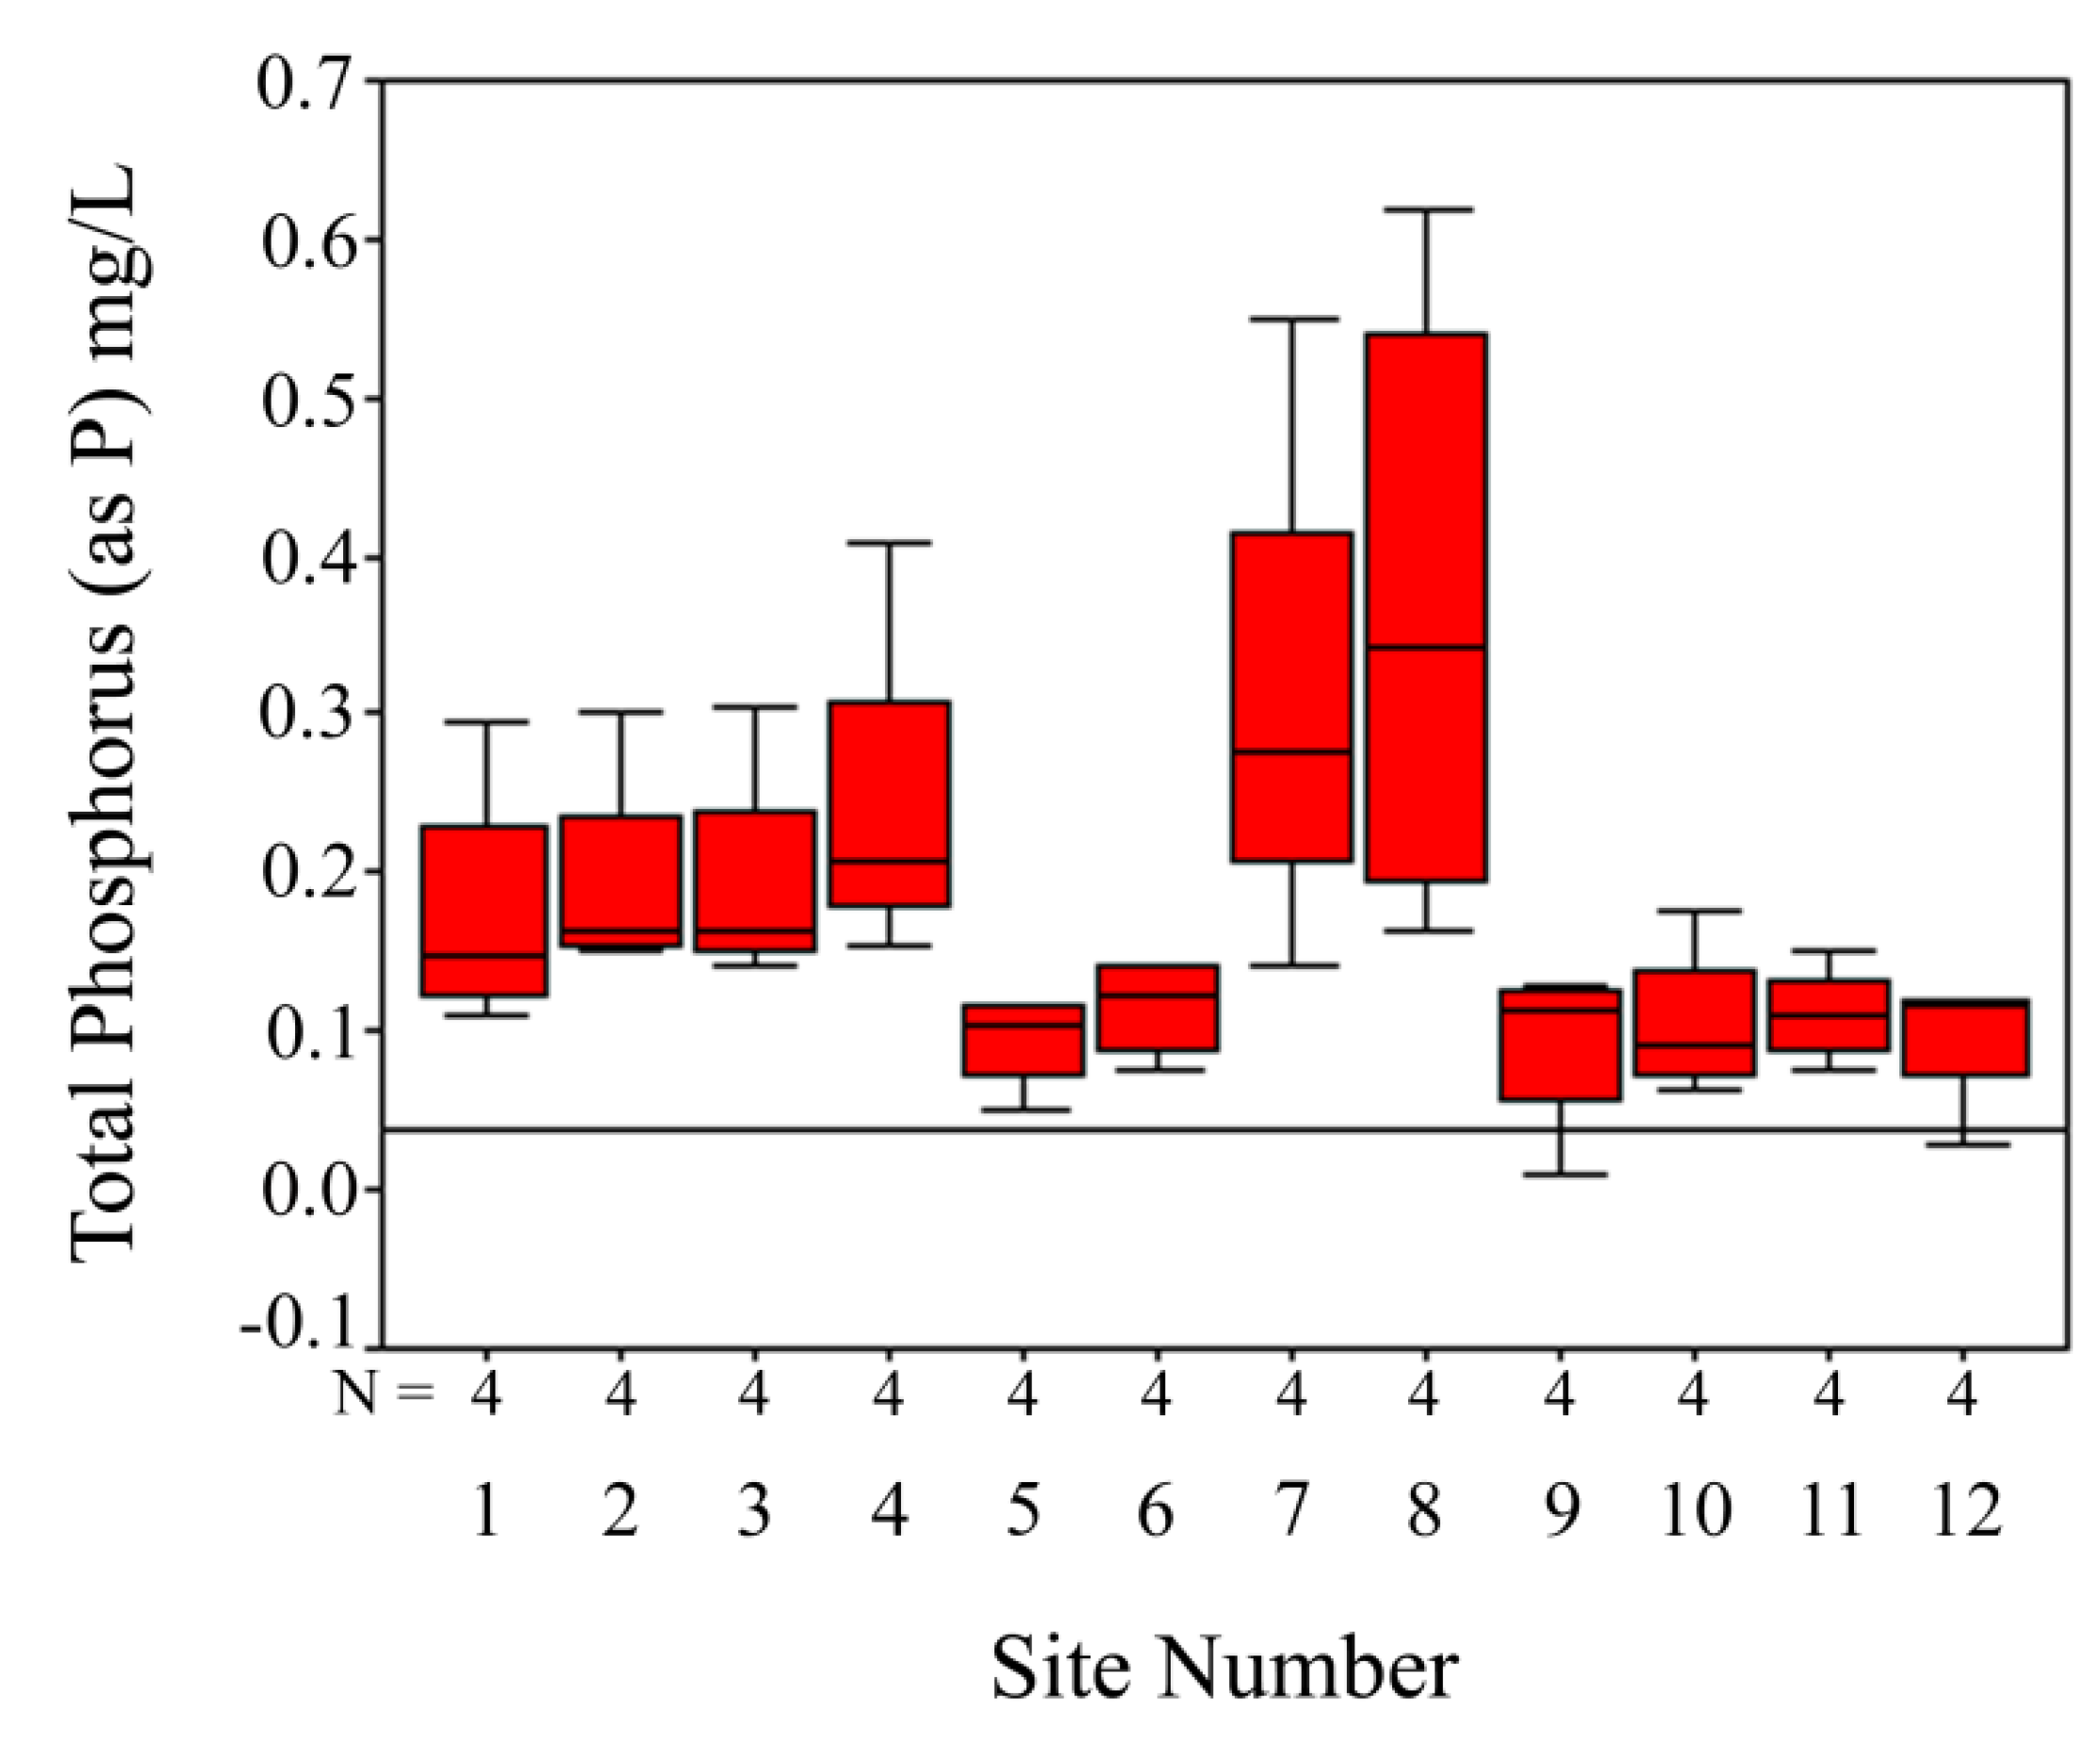
Table 1). Total phosphorus concentrations over the entire year were much higher at sites 7 and 8 (sites below wastewater treatment plants), and lowest at sites 5, 6, 9, 10, 11, and 12 (
Figure 3). The site most directly downstream of the proposed dam location (site 3) had a mean TP concentration of 0.194 mg/L P, over five times the U.S. EPA recommended criterion for rivers and streams and almost ten times the criterion for lakes and reservoirs (0.020 mg/L P) [
16].
Table 1.
Mean, median, variance, minimum, and maximum total phosphorus (TP), orthophosphate (OP), and nitrate (NO
3) concentrations in mg/L by season (
n = 12) and for the year. TP recommended stream criteria: U.S. Environmental Protection Agency (EPA) [
16], 0.0365 mg/L P; Dodds
et al. [
17], 0.075 mg/L P.
Table 1.
Mean, median, variance, minimum, and maximum total phosphorus (TP), orthophosphate (OP), and nitrate (NO3) concentrations in mg/L by season (n = 12) and for the year. TP recommended stream criteria: U.S. Environmental Protection Agency (EPA) [16], 0.0365 mg/L P; Dodds et al. [17], 0.075 mg/L P.
| Nutrients by Season | Mean (mg/L) | Median (mg/L) | Variance (mg/L) | Minimum (mg/L) | Maximum (mg/L) |
|---|
| Fall (7 October 2007) | | | | |
| TP | 0.274 | 0.236 | 0.031 | 0.09 | 0.62 |
| OP | 0.146 | 0.103 | 0.019 | 0.01 | 0.39 |
| NO3 | 0.838 | 0.825 | 0.230 | 0.05 | 1.71 |
| Winter (8 January 2008) | | | | |
| TP | 0.135 | 0.139 | <0.001 | 0.10 | 0.16 |
| OP | 0.049 | 0.033 | 0.002 | <0.01 | 0.12 |
| NO3 | 0.618 | 0.630 | 0.138 | 0.10 | 1.47 |
| Spring (4 April 2008) | | | | |
| TP | 0.150 | 0.134 | 0.004 | 0.08 | 0.28 |
| OP | 0.100 | 0.096 | 0.004 | <0.01 | 0.23 |
| NO3 | 0.552 | 0.510 | 0.126 | 0.20 | 1.50 |
| Summer (29 June 2008) | | | | |
| TP | 0.141 | 0.093 | 0.016 | <0.02 | 0.46 |
| OP | 0.093 | 0.059 | 0.009 | 0.01 | 0.33 |
| NO3 | 0.864 | 0.710 | 0.347 | 0.16 | 2.25 |
| Mean/Year 2007–2008 | | | |
| TP | 0.1750 | 0.142 | 0.015 | <0.02 | 0.62 |
| OP | 0.0969 | 0.059 | 0.009 | <0.01 | 0.39 |
| NO3 | 0.7177 | 0.600 | 0.216 | 0.05 | 2.25 |
Figure 3.
Box plot of total phosphorus (TP) concentrations (as P) in mg/L by site (4 samples/site) in the Little Choctawhatchee River watershed from October 2007 to June 2008. Reference line indicates U.S. EPA suggested criteria for TP as P (0.0365 mg/L as P).
Figure 3.
Box plot of total phosphorus (TP) concentrations (as P) in mg/L by site (4 samples/site) in the Little Choctawhatchee River watershed from October 2007 to June 2008. Reference line indicates U.S. EPA suggested criteria for TP as P (0.0365 mg/L as P).
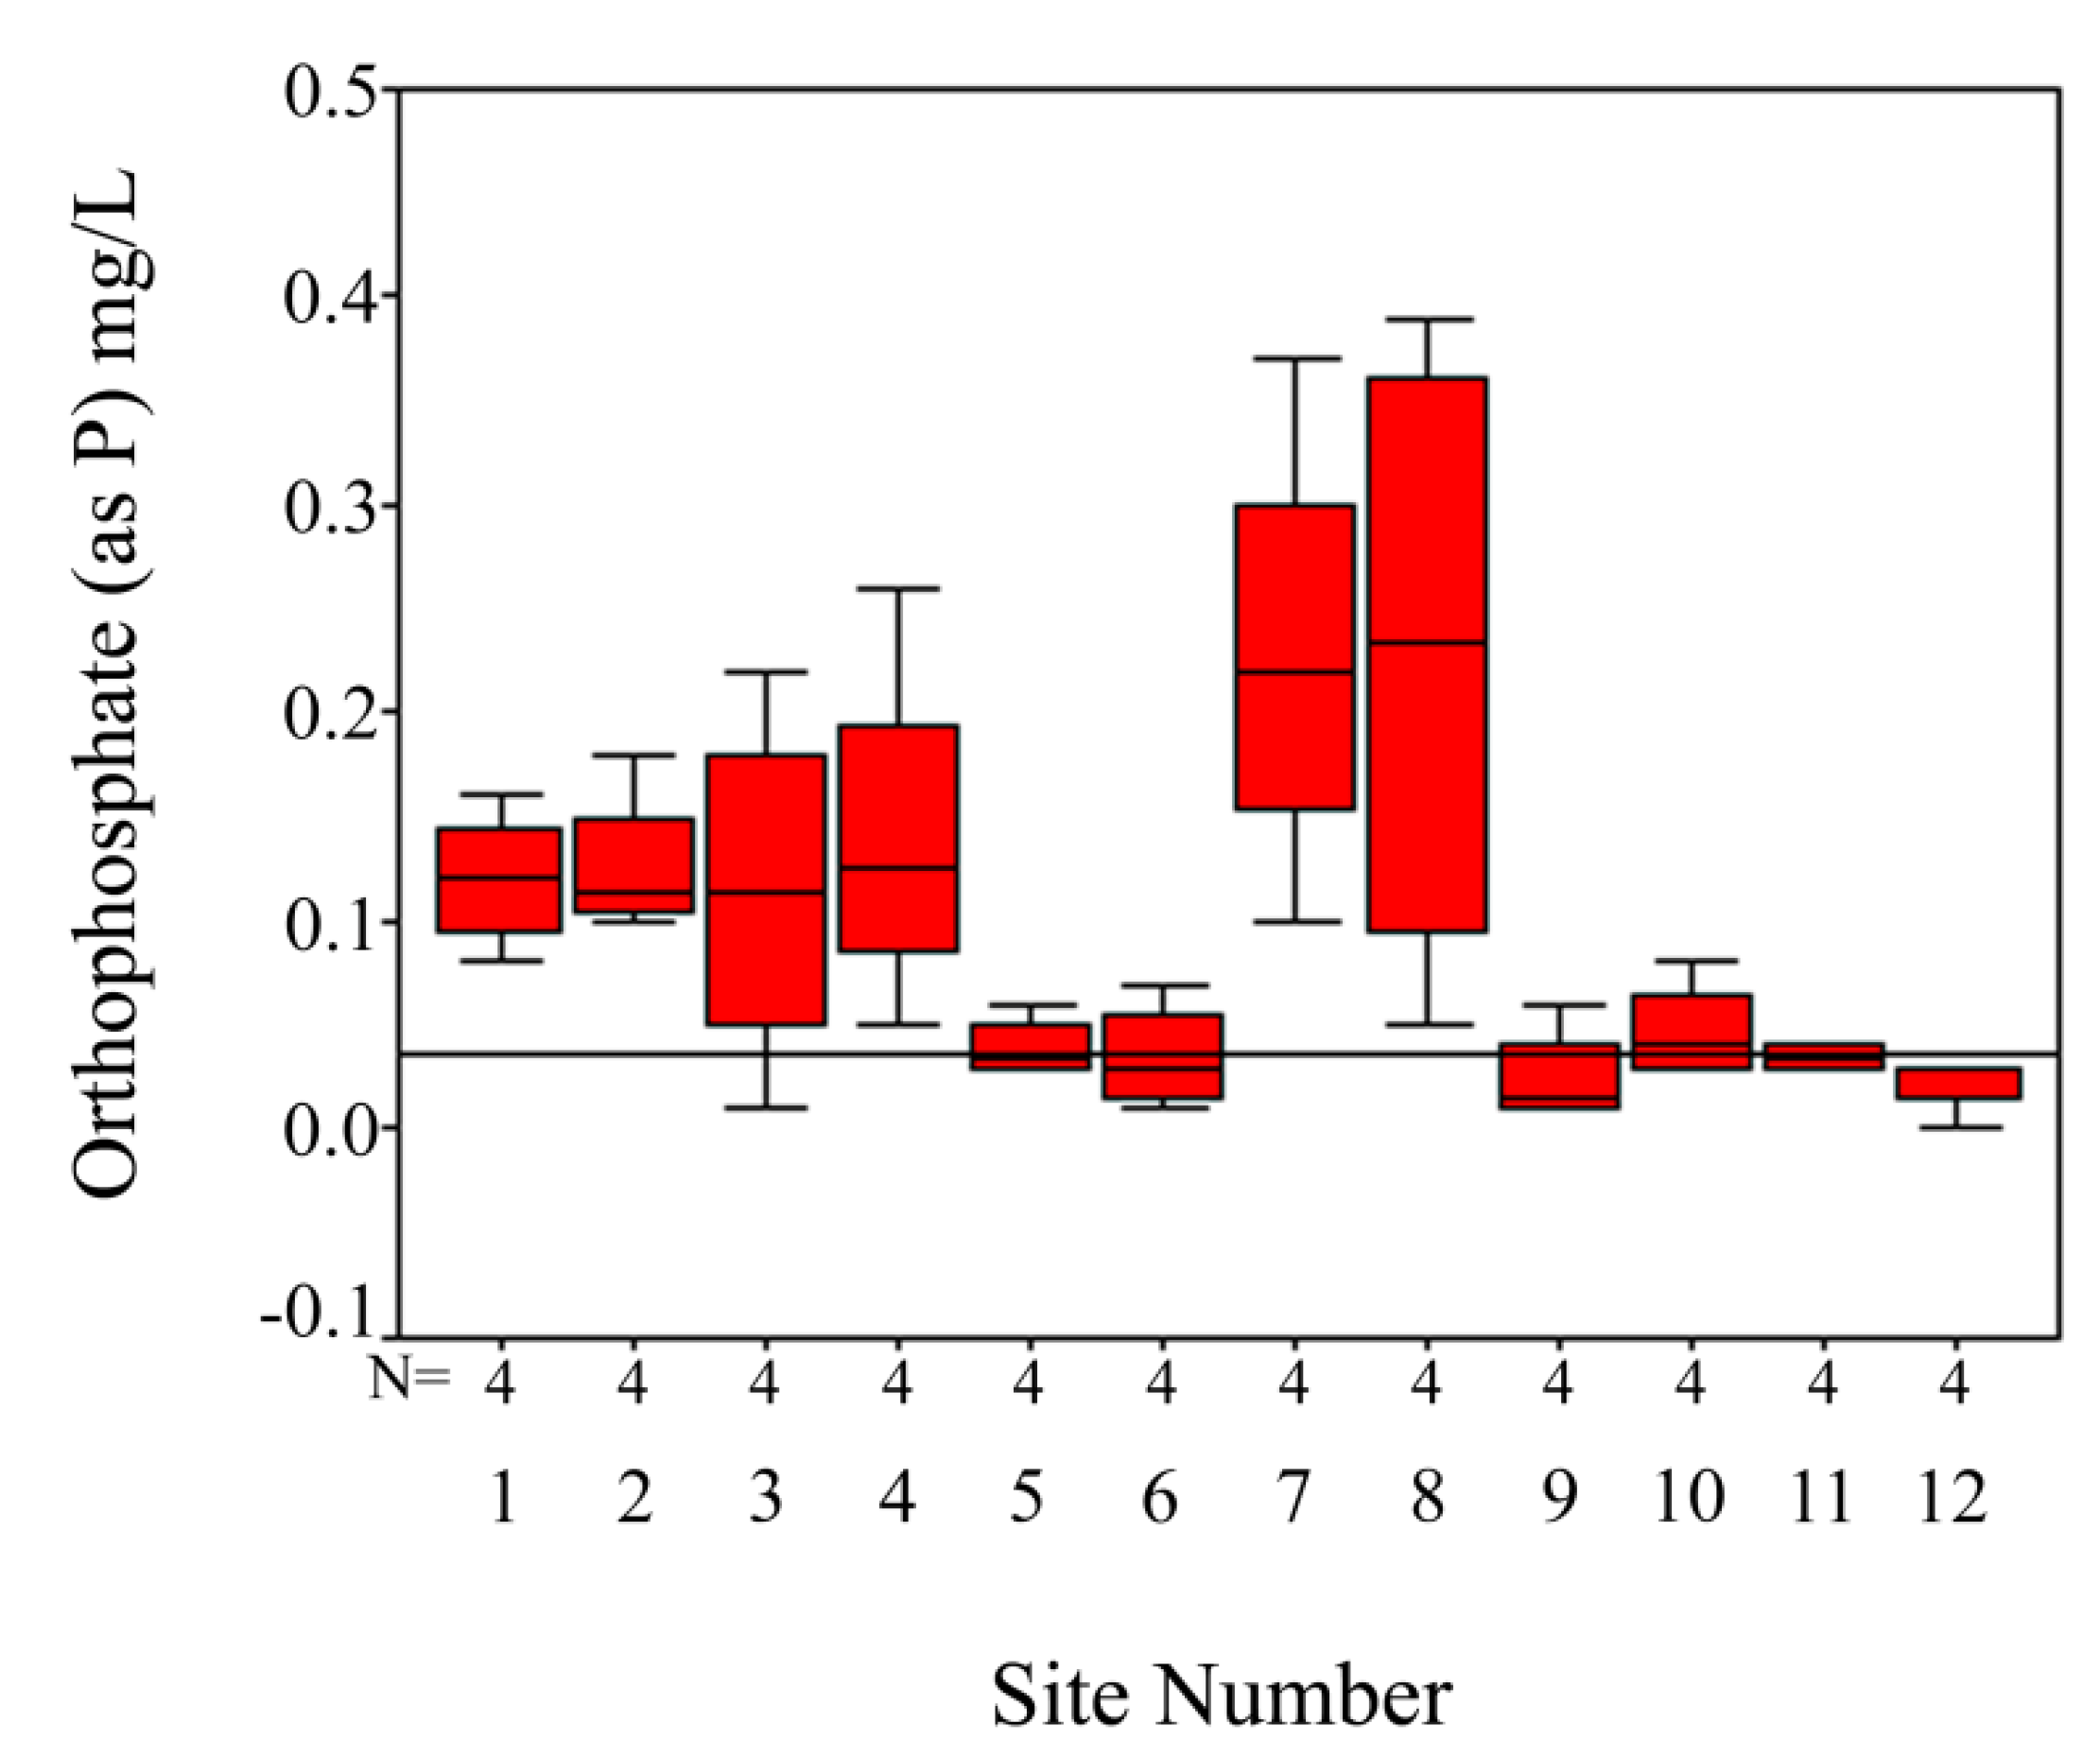
Orthophosphate (OP) ranged from below detection limits (0.01 mg/L P, reported as 0.005 mg/L P) in the spring at site 12 and the lowest detectable limit in winter at site 3 (0.01 mg/L), to 0.39 mg/L at site 8 during fall 2007. Yearly OP means by site ranged from 0.025 mg/L at sites 9 and 12 to 0.231 mg/L at site 7 (site below a WWTP). The overall mean for all samples for the year was 0.097 mg/L (
Table 1). As with TP, OP at sites 7 and 8 (both below WWTPs) was highest for the year, and lowest at 5, 6, 9, 10, 11, and 12 (
Figure 4).
Figure 4.
Box plot of orthophosphate (OP) concentrations in mg/L by site (4 samples/site) in the Little Choctawhatchee River watershed from October 2007 to June 2008. Reference line indicates U.S. EPA suggested criteria for TP as P (0.0365 mg/L as P).
Figure 4.
Box plot of orthophosphate (OP) concentrations in mg/L by site (4 samples/site) in the Little Choctawhatchee River watershed from October 2007 to June 2008. Reference line indicates U.S. EPA suggested criteria for TP as P (0.0365 mg/L as P).
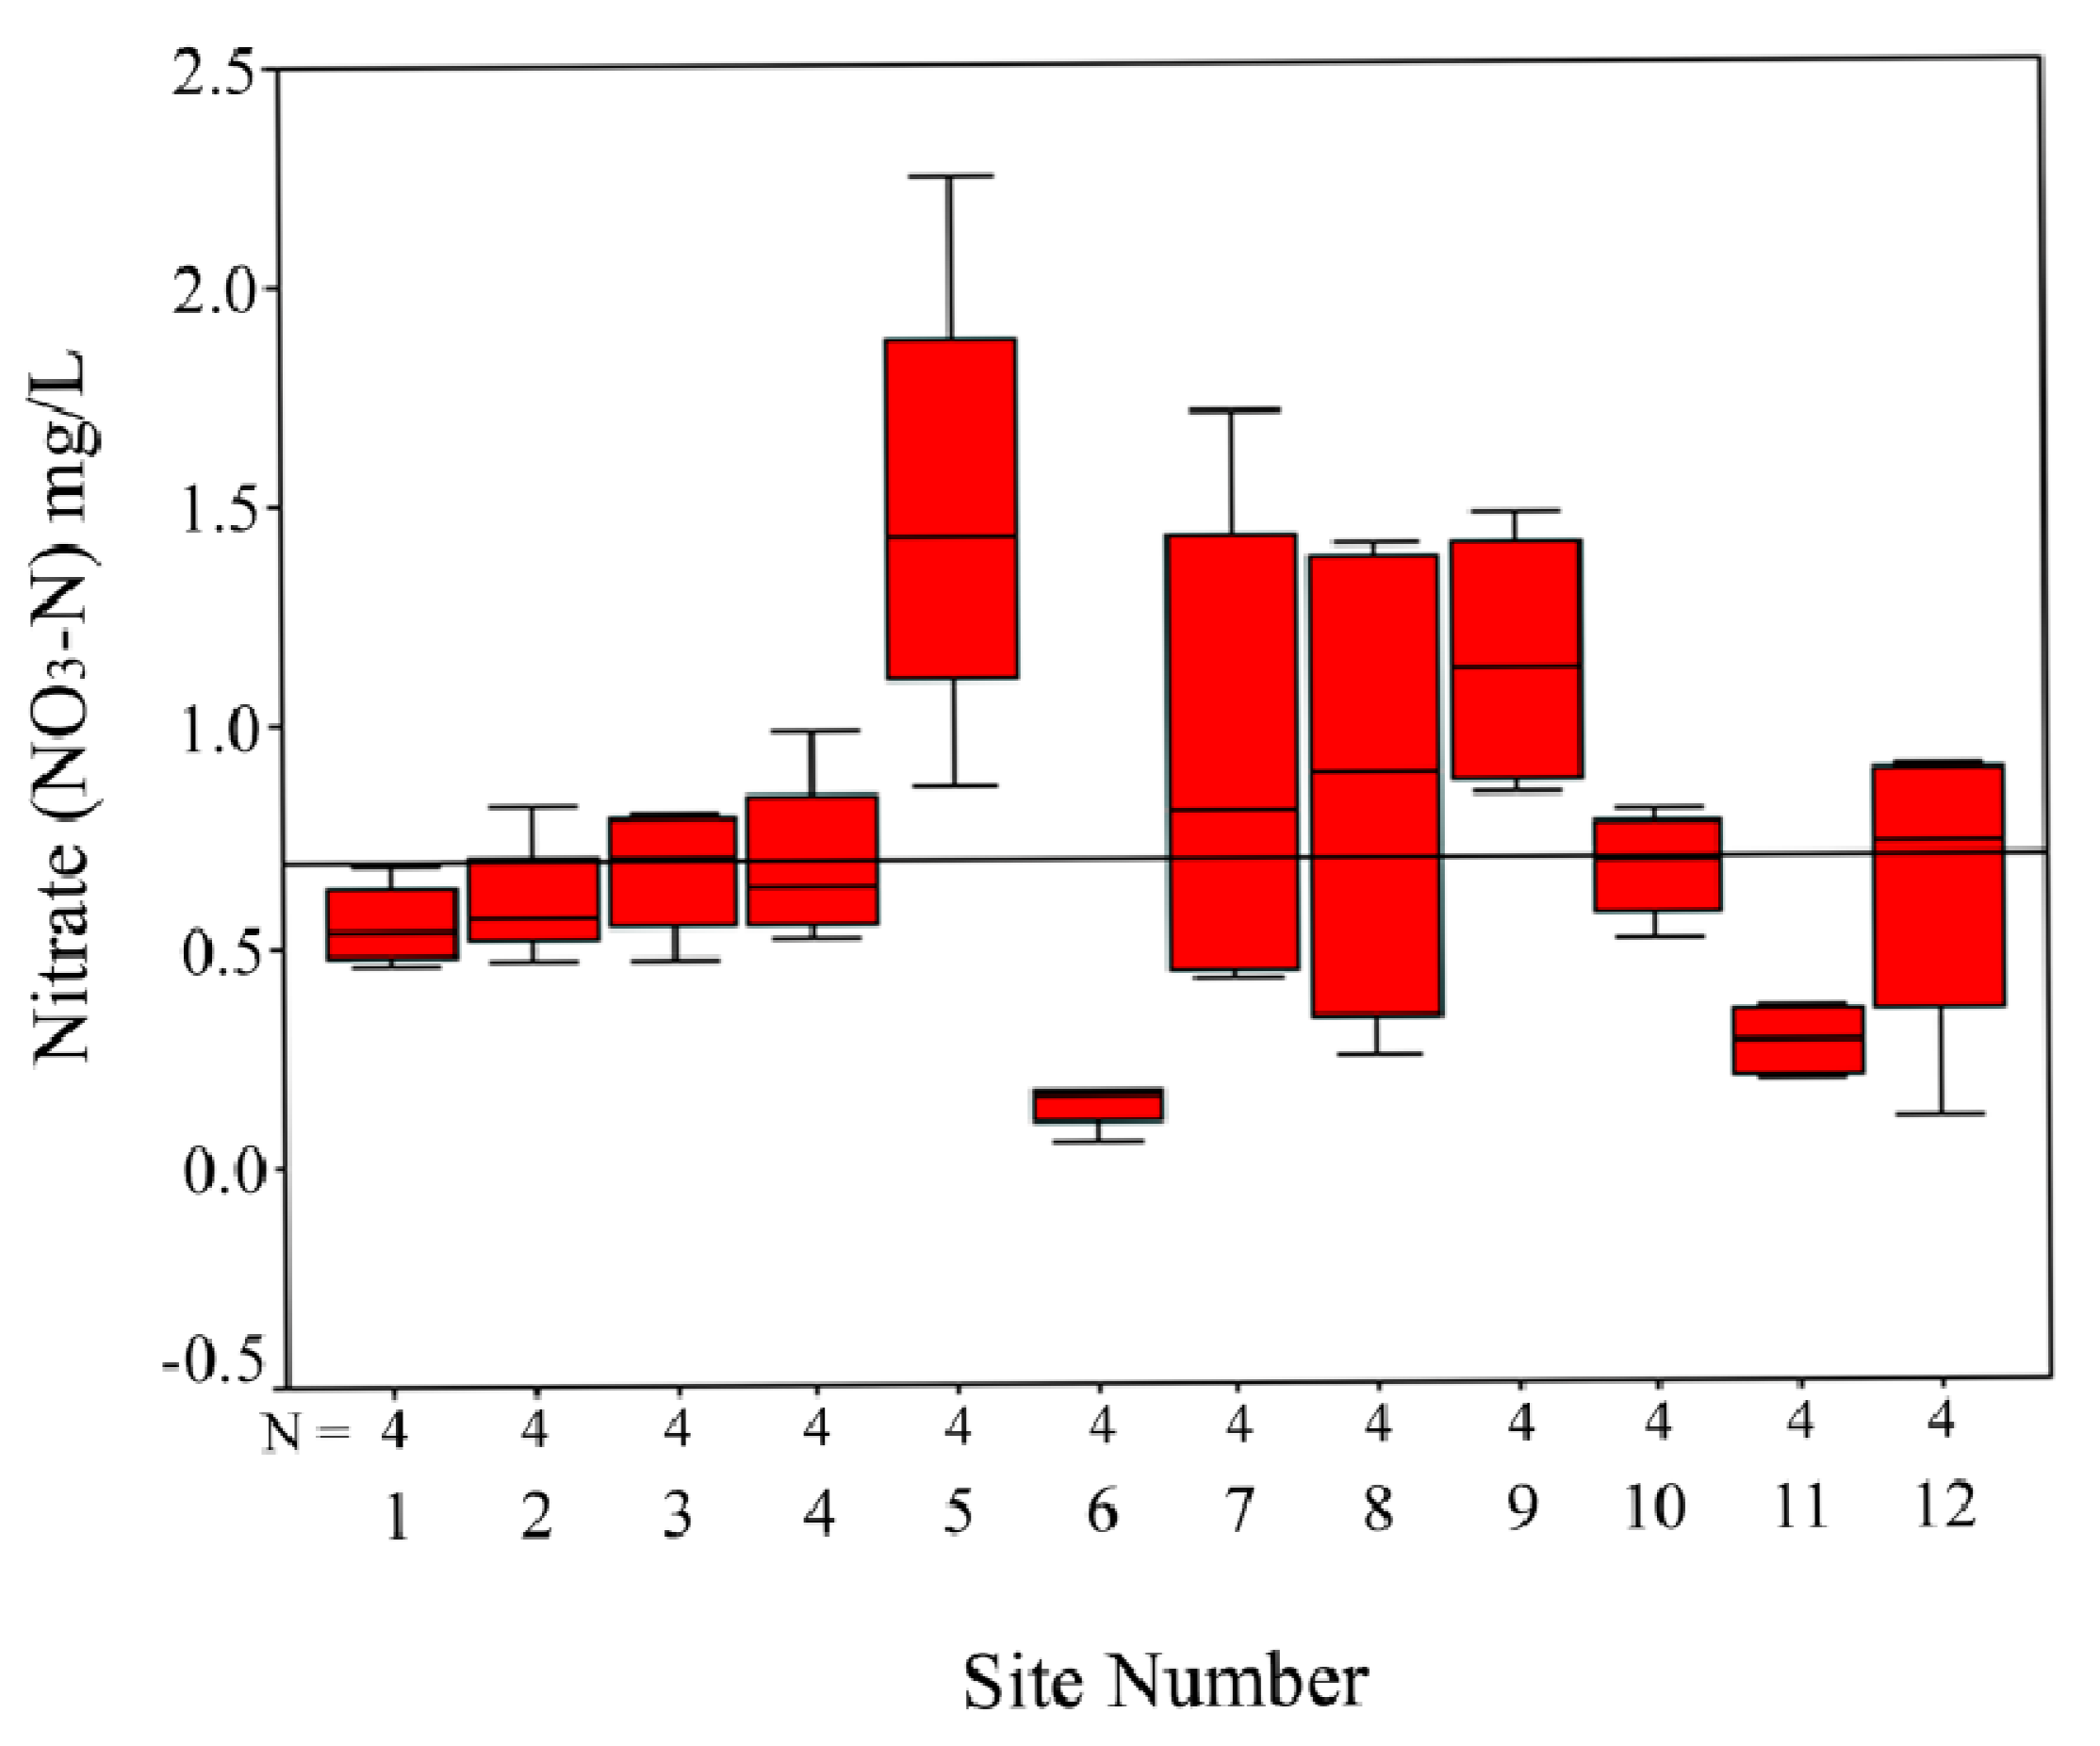
Nitrate (NO
3) was lowest during fall at site 6 with 0.05 mg/L N, and highest in summer at site 5, measuring 2.25 mg/L N (
Figure 5). Yearly NO
3 means ranged from 0.128 mg/L N at site 6 to 1.490 mg/L N at site 5 (
Table 1). The yearly overall mean from all sites for NO
3 for the watershed was 0.718 mg/L N (
Table 1). The highest yearly means were at sites 5 and 9 while the lowest were found at sites 6 and 11. The site most directly downstream of the proposed dam location had a mean NO
3 concentration of 0.668 mg/L N, which almost exceeds the total nitrogen (TN) U.S. EPA recommended criterion for rivers and streams (0.69 mg/L N) and is almost twice the TN criterion for lakes and reservoirs (0.36 mg/L N) [
16].
By season, TP mean was highest at 0.274 mg/L P during fall and lowest at 0.135 mg/L P during winter. Orthophosphate had the highest seasonal mean of 0.146 mg/L P in fall and lowest at 0.049 mg/L P in winter. The mean NO
3 by season was highest (0.864 mg/L N) in summer and lowest (0.552 mg/L N) in spring (
Table 1).
Elevated TP, OP, and NO3 were found throughout the year at sites 1, 2, 3, 4, 7, and 8 (primarily main channel sites downstream of WWTPs). Of all sites, the top five highest nutrient concentrations for all three nutrients almost always included sites 4, 7, and 8 for each sample and for means in this study. Site 8 always had high TP, and only during one sampling event did it not record the highest TP of all sites. Site 6 had the lowest NO3 levels, except for winter sampling, where site 6 was second lowest behind site 12.
Figure 5.
Box plot of nitrate (NO3) concentrations in mg/L by site (4 samples/site) in the Little Choctawhatchee River watershed from October 2007 to June 2008. Reference line indicates U.S. EPA suggested criteria for TN as N (0.69 mg/L as P).
Figure 5.
Box plot of nitrate (NO3) concentrations in mg/L by site (4 samples/site) in the Little Choctawhatchee River watershed from October 2007 to June 2008. Reference line indicates U.S. EPA suggested criteria for TN as N (0.69 mg/L as P).
3.2. Comparison to Past LCR Nutrient Data
Data were retrieved from other studies on the LCR to compare these values to past and more recent conditions (
Table 2,
Table 3,
Table 4,
Table 5). These data were examined to determine whether water quality was changing throughout the watershed and at individual sites. Site 8 TP had been decreasing over time in regards to historical data, until this study indicated an increase in TP (
Table 2). Total phosphorus at sites 5 and 12 appeared to be lower in this and the Geological Survey of Alabama (GSA) study [
19] than in the past, while site 11 showed a substantial increase from 2007–2008 to 2009–2010 [
10,
19,
20]. Data published by Mullen [
21] from 1999 to 2003 were lower than recent findings for OP at sites 4 and 8, while most other data suggested that OP was similar to the recent findings for most sites where data were found (
Table 3).
A comparison of NO
3 concentrations suggested that these concentrations have been quite high in the past (ranging from 0.17 to 4.09 mg/L) and remain so with site means in our study ranging from 0.13 to 1.49 mg/L (
Table 4), and 0.3 to 2.2 mg/L in the GSA study [
19]. Site 5 had elevated NO
3 concentrations for all samples in the our study, and these values were similar to results from Sawyer
et al. [
10] and Cook
et al. [
19] that found concentrations ≥ 2.0 mg/L N (
Table 4). Further, nutrient data collected from multiple subwatersheds within the Choctawhatchee River basin suggested that our LCR TP concentrations were lower than most, OP concentrations were in the middle of the range, and NO
3 concentrations were somewhat similar, though all were elevated (
Table 5; [
10,
20,
22,
23]).
Table 2.
Minimum, maximum, and mean (if available) of total phosphorus (TP) concentrations from historical sources in chronological sampling order, with coinciding sites, along with our data.
Table 2.
Minimum, maximum, and mean (if available) of total phosphorus (TP) concentrations from historical sources in chronological sampling order, with coinciding sites, along with our data.
| Source | Sample Year | TP | Site 1 | Site 4 | Site 5 | Site 6 | Site 8 | Site 10 | Site 11 | Site 12 |
|---|
| ADEM [24] | 1999 | Min | | | | | 0.19 | | | |
| Max | | | | | 0.91 | | | |
| Mean | | | | | 0.48 | | | |
| Mullen (PE) [21] | 1999–2003 | Min | BDL | 0.02 | | 0.03 | 0.15 | BDL | | |
| Max | 0.22 | 0.18 | | 0.12 | 0.24 | 0.13 | | |
| Mean | 0.13 | 0.14 | | 0.08 | 0.19 | 0.06 | | |
| Mullen (CERS) [21] | 1999–2003 | Min | 0.15 | 0.20 | | 0.11 | 0.23 | 0.07 | | |
| Max | 0.54 | 0.58 | | 0.21 | 0.31 | 0.18 | | |
| Mean | 0.29 | 0.32 | | 0.17 | 0.26 | 0.13 | | |
| Sawyer et al. [10] | 2001 | Value | | | 0.73 | | | | | |
| Heath [20] | 2004 | Value | | | | | | | 0.61 | 0.76 |
| ADEM [24] | 2004 | Min | | | | | 0.04 | | | |
| Max | | | | | 0.29 | | | |
| Mean | | | | | 0.18 | | | |
| ADEM [24] | 2005 | Min | | | | | 0.03 | | | |
| Max | | | | | 0.26 | | | |
| Mean | | | | | 0.16 | | | |
| Chakravarty [23] | 2006–2007 | Min | 0.12 | 0.20 | | | | 0.09 | | |
| Max | 0.36 | 0.34 | | | | 0.38 | | |
| Mean | 0.23 | 0.27 | | | | 0.18 | | |
| Our Study | 2007–2008 | Min | 0.11 | 0.15 | 0.05 | 0.08 | 0.16 | 0.06 | 0.08 | 0.03 |
| Max | 0.30 | 0.41 | 0.12 | 0.14 | 0.62 | 0.18 | 0.15 | 0.12 |
| Mean | 0.18 | 0.24 | 0.10 | 0.12 | 0.37 | 0.11 | 0.11 | 0.10 |
| Cook et al. [19] | 2009–2010 | Min | BDL | | BDL | BDL | | | BDL* | BDL* |
| Max | 0.13 | | 0.06 | 0.05 | | | 0.74 | 0.04 |
| Mean | 0.06 | | 0.02 | 0.02 | | | 0.36 | 0.02 |
Table 3.
Minimum, maximum, and mean (if available) of orthophosphate (OP) concentrations from historical sources in chronological sampling order, with coinciding sites, along with our data.
Table 3.
Minimum, maximum, and mean (if available) of orthophosphate (OP) concentrations from historical sources in chronological sampling order, with coinciding sites, along with our data.
| Source | Sample Year | OP | Site 1 | Site 4 | Site 5 | Site 6 | Site 8 | Site 10 | Site 11 | Site 12 |
|---|
| Mullen [21] | 1999–2003 | Min | BDL | BDL | | BDL | 0.08 | BDL | | |
| Max | 0.22 | 0.14 | | 0.11 | 0.23 | 0.10 | | |
| Mean | 0.08 | 0.07 | | 0.06 | 0.14 | 0.04 | | |
| Sawyer et al. [10] | 2001 | Value | | | 0.11 | | | | | |
| Heath [20] | 2004 | Value | | | | | | | 0.11 | 0.09 |
| Our Study | 2007–2008 | Min | 0.08 | 0.05 | 0.03 | 0.01 | 0.05 | 0.03 | 0.03 | BDL |
| Max | 0.16 | 0.26 | 0.06 | 0.07 | 0.39 | 0.08 | 0.04 | 0.03 |
| Mean | 0.12 | 0.14 | 0.04 | 0.04 | 0.23 | 0.05 | 0.03 | 0.03 |
Table 4.
Minimum, maximum, and mean (if available) of nitrate (NO2 + NO3) concentrations from historical sources in chronological sampling order, with coinciding sites, along with our data.
Table 4.
Minimum, maximum, and mean (if available) of nitrate (NO2 + NO3) concentrations from historical sources in chronological sampling order, with coinciding sites, along with our data.
| Source | Sample Year | NO3 | Site 1 | Site 4 | Site 5 | Site 6 | Site 8 | Site 10 | Site 11 | Site 12 |
|---|
| ADEM [24] | 1999 | Min | | | | | 0.17 | | | |
| Max | | | | | 2.56 | | | |
| Mean | | | | | 1.33 | | | |
| Mullen (PE) [21] | 1999–2003 | Min | 0.82 | 0.72 | | 0.90 | 1.12 | 0.98 | | |
| Max | 3.58 | 4.09 | | 1.06 | 1.69 | 3.42 | | |
| Mean | 1.80 | 1.81 | | 0.97 | 1.42 | 1.96 | | |
| Mullen (CERS) [21] | 1999–2003 | Min | 0.40 | 0.80 | | 0.30 | 1.00 | 0.80 | | |
| Max | 1.70 | 1.70 | | 0.50 | 1.30 | 1.30 | | |
| Mean | 1.20 | 1.30 | | 0.40 | 1.20 | 0.90 | | |
| Sawyer et al. [10] | 2001 | Value | | | 2.00 | | | | | |
| Heath [20] | 2004 | Value | | | | | | | 0.30 | 1.10 |
| ADEM [24] | 2004 | Min | | | | | 0.50 | | | |
| Max | | | | | 3.40 | | | |
| Mean | | | | | 1.60 | | | |
| ADEM [24] | 2005 | Min | | | | | 0.29 | | | |
| Max | | | | | 2.12 | | | |
| Mean | | | | | 0.95 | | | |
| Our Study | 2007–2008 | Min | 0.46 | 0.52 | 0.86 | 0.05 | 0.24 | 0.51 | 0.18 | 0.10 |
| Max | 0.68 | 0.99 | 2.25 | 0.16 | 1.41 | 0.80 | 0.35 | 0.90 |
| Mean | 0.56 | 0.69 | 1.49 | 0.13 | 0.86 | 0.67 | 0.27 | 0.61 |
| Cook et al. [19] | 2009–2010 | Min | BDL | | 0.7 | 0.3 | | | 0.1* | 0.4* |
| Max | 5.7 | | 2.3 | 1.9 | | | 3.6 | 1.5 |
| Mean | 1.7 | | 1.9 | 0.6 | | | 1.3 | 1.0 |
Table 5.
Historical means of total phosphorus (TP), orthophosphate (OP), and nitrate (NO3) in studies on the Choctawhatchee River watershed. Note: Our study in one watershed (LCR), others within multiple watersheds within the Choctawhatchee River drainage.
Table 5.
Historical means of total phosphorus (TP), orthophosphate (OP), and nitrate (NO3) in studies on the Choctawhatchee River watershed. Note: Our study in one watershed (LCR), others within multiple watersheds within the Choctawhatchee River drainage.
| Source | Sample Year | TP | OP | NO3 | No. Sites |
|---|
| Mullen [22] | 1999–2003 | 0.29 | 0.07 | 0.74 | 10 |
| Sawyer et al. [10] | 2001 | 0.77 | 0.13 | 0.66 | 49 |
| Heath [20] | 2004 | 0.60 | 0.29 | 0.54 | 44 |
| Chakravarty [23] | 2006–2007 | 0.24 | N/A | N/A | 48 |
| Our Study | 2007–2008 | 0.18 | 0.10 | 0.72 | 12 (4 seasons) |
3.4. Comparison to Nutrient Criteria
Nutrient criteria were established by the U.S. EPA to control excess nutrients and associated problems. Total phosphorus levels exceeding the U.S. EPA ecoregional nutrient criterion (0.0365 mg/L as P) were found in historical data at most sites. Specifically, site 8 by the Alabama Department of Environmental Management (ADEM) [
24], site 5 by Sawyer
et al. [
10], sites 1, 4, 6, 8, 9, and 10 by Mullen [
21], sites 11 and 12 by Heath [
20], and sites 1, 4, and 10 by Chakravarty [
23] (
Table 2). The mean TP concentrations of historical data ranged from almost two times to well over an order of magnitude higher than the recommended criterion. Sawyer
et al. [
10] also found elevated TP levels throughout the Choctawhatchee River watershed in 2001 (mean = 0.76 mg/L), along with Mullen [
22] finding elevated levels throughout the Little Choctawhatchee (mean = 0.44 mg/L) and Choctawhatchee River (mean = 0.29 mg/L) watersheds.
All samples in our study exceeded the U.S. EPA nutrient criterion for TP except for site 9 and 12 in June 2008, in which site 9 was below the detection limit of 0.02 mg/L P. Forty four of the 48 samples collected during this study exceeded the TP nutrient criterion by two times or more, the highest TP concentration found exceeded the criterion by nearly 17 times, and the overall mean of TP exceeded the criterion by almost five times.
The mean yearly value for TP was more than two times the eutrophic level as reported by Dodds
et al. [
17]. The yearly OP mean for all samples for the year was 0.0969 mg/L, which was more than the TP level determined to be eutrophic by Dodds
et al. [
17]. The U.S. EPA ecoregional nutrient criterion for total nitrogen (TN) in streams and rivers is 0.69 mg/L N [
16], meanwhile Maidment [
18] reported that 0.5 mg/L NO
3-N was indicative of excess algal growth. Nitrate (nitrate + nitrite) concentrations alone in this study exceeded TN criteria limits in 20 samples, and exceeded 0.5 mg/L in 31 of the 48 samples. Eight of these NO
3 samples were almost, if not more than, twice the TN criterion. The highest measured NO
3 concentration was over three times the TN criterion, and over four times Maidment’s [
18] criteria. Two of the seasonal means of the 12 sites, along with the overall mean, exceeded the TN criterion as well (
Table 1). In addition to NO
3 concentrations in our study exceeding U.S. EPA TN criterion levels, levels exceeding nutrient criterion were also found by ADEM [
24] (site 8), Mullen [
21] (sites 1, 4, 6, 8, and 10), and Cook
et al. [
19] (sites 1, 5, 6, 11, and 12) (
Table 4).


