Article

Effects of Water Velocity and Specific Surface Area on Filamentous Periphyton Biomass in an Artificial Stream Mesocosm

1
Environmental Engineering Research Division, Water Resource & Environment Research Department, Korea Institute of Construction Technology, Goyang-Si 411-712, Republic of Korea
2
Construction Environment Division, Korea Land & Housing Corporation, Land & Housing Institute, Daejeon Metropolitan 305-731, Republic of Korea
*
Author to whom correspondence should be addressed.
Submission received: 3 September 2013 / Revised: 11 October 2013 / Accepted: 17 October 2013 / Published: 24 October 2013

Abstract

:
To evaluate the effects of water velocity and artificial substratum characteristics on the growth rate and biomass accumulation of periphyton, an artificial stream mesocosm experiment was conducted using alternative water sources collected from the Mangwall Stream (MW), the Han River (HR), and bank filtration water (BFW) from the Han River in the Republic of Korea. The measured concentrations of organic matter and inorganic nutrients in the MW were higher than in the HR and BFW. The surface of tile is relatively smooth and nonporous, whereas the surfaces of concrete and pebble are rough with numerous isolated pores in which filamentous periphyton become immobilized against hydrodynamic shear stress and mat tensile strength. Compared with the periphyton biomass of the HR and BFW, the peak biomass in the MW was significantly higher due to higher nutrient concentrations in the MW. Reasonable linear relationships (R2 ≥ 0.69) between water velocity and total periphyton biomass/growth rate were obtained, indicating that water velocities above critical values can cause a reduction in biomass accrual. In addition, reasonable relationships (R2 ≥ 0.58) between specific surface area and total periphyton biomass were obtained for the HR and BFW, indicating that an increase in the specific surface area of the substratum can lead to an increase in periphyton biomass in a nutrient-poor water body. Principal components analysis (PCA) results indicate that nutrient concentrations were the first dominant limiting factor for the growth and accumulation of periphyton, and water velocity and the specific surface area of the substratum were determined to be potential limiting factors. Consequently, the growth rate and biomass accumulation of periphyton were considered to be a complex function of nutrient concentrations, water velocities, and substratum characteristics.

1. Introduction

Periphyton and phytoplankton are dominant producers of organic matter and are responsible for carbon fixation and the sequestration of essential nutrients, such as nitrogen and phosphorus, in the aquatic ecosystem [1,2,3]. Periphyton have been reported to attach to various substrata and to form various types of biofilm [4,5]. Because periphyton can remain attached to various substrata for an extensive period, they can be used as a biological indicator to evaluate water quality by monitoring changes in biomass or species composition [6,7].
Although periphyton can serve as an important food source for invertebrates, tadpoles, and some fish and as natural habitats for benthos [8], periphyton also exhibit potential adverse effects or impairments of designated uses of rivers and streams. For example, high levels of periphyton growth and accumulation have impaired the use of rivers and streams for drinking water [9], damaged aquatic habitat [10], and degraded the aesthetic and recreational uses of rivers and streams [11]. Because many factors (i.e., water velocity, nutrient concentration, light intensity, substratum availability, and water temperature) have been reported to affect the growth and accumulation of periphyton, numerous established criteria and thresholds have been suggested to prevent the excessive growth and accumulation of periphyton in various environments [12,13].
Among many factors impacting the growth rate and biomass accumulation of periphyton, water velocity has been demonstrated to be an important factor in determining the ecological distribution of aquatic ecosystems and to affect the growth rate and biomass accumulation of periphyton [14,15]. For example, periphyton biomass increases as water velocity increases until critical velocities are reached (20–50 cm s−1) [13,16,17,18]. As the water velocity increases, the enhancement of nutrients and metabolite uptakes by periphyton accelerates the growth of periphyton communities and increases biomass accumulation. However, above critical velocities, both the physical disruption and displacement of periphyton communities result in a reduction of biomass accumulation [19,20].
Both the quality and stability of substrata have also been demonstrated as potential limiting factors, as evidenced by differences in periphyton biomass accumulation according to the characteristics of substrata. For example, a higher growth rate and biomass accumulation of periphyton has been observed on stones, cobbles, and gravel than on sand, clay, and organic materials [21,22,23]. The loss of periphyton from substrata can be enhanced by substratum instability and high water velocity. Thus, the integration of water velocity and substratum characteristics is required to estimate the periphyton biomass levels in rivers and streams.
The majority of urban rivers and streams in the Republic of Korea are closely connected to urban areas by drainage and discharge networks, which results in greater stormwater runoff and loading of contaminants [24]. Thus, the water quality of urban rivers and streams has deteriorated, and aquatic ecosystems have been impaired [25,26,27]. During the dry season in the Republic of Korea, which occurs from February to May, water flow significantly decreases and excessive nutrient concentrations persist, resulting in excess growth of periphyton, phytoplankton, and macrophytes. This excessive growth of algae directly impairs the habitat for aquatic organisms and degrades the aesthetic and recreational uses of urban rivers and streams.
For urban rivers and streams with low water flow or excessively deteriorated water quality, the augmentation of new water sources should be considered for the preservation and sustainability of urban environments [28]. Thus, alternative water sources with improved accessibility should provide sufficient amounts of water, especially during the dry season, and should not cause problems such as an excessive growth of algae, increased turbidity, and a reduction in the perceived aesthetic value of recreational water uses [29,30,31,32].
In the present study, an artificial stream mesocosm experiment was conducted to evaluate the effects of water velocity and substratum characteristics on the growth rate and biomass accumulation of periphyton. The experiment employed alternative water sources collected from the Mangwall Stream, the Han River, and bank filtration water from the Han River. The specific objectives of this study were as follows: (1) to investigate the water quality of alternative water sources; (2) to evaluate the effect of water velocity on the growth rate and biomass accumulation of periphyton; (3) to evaluate the effect of substratum characteristics on the biomass accumulation of periphyton; and (4) to define the mutual correlations of nutrient concentration, water velocity, and substratum characteristics with the growth rate and biomass accumulation of periphyton.

2. Materials and Methods

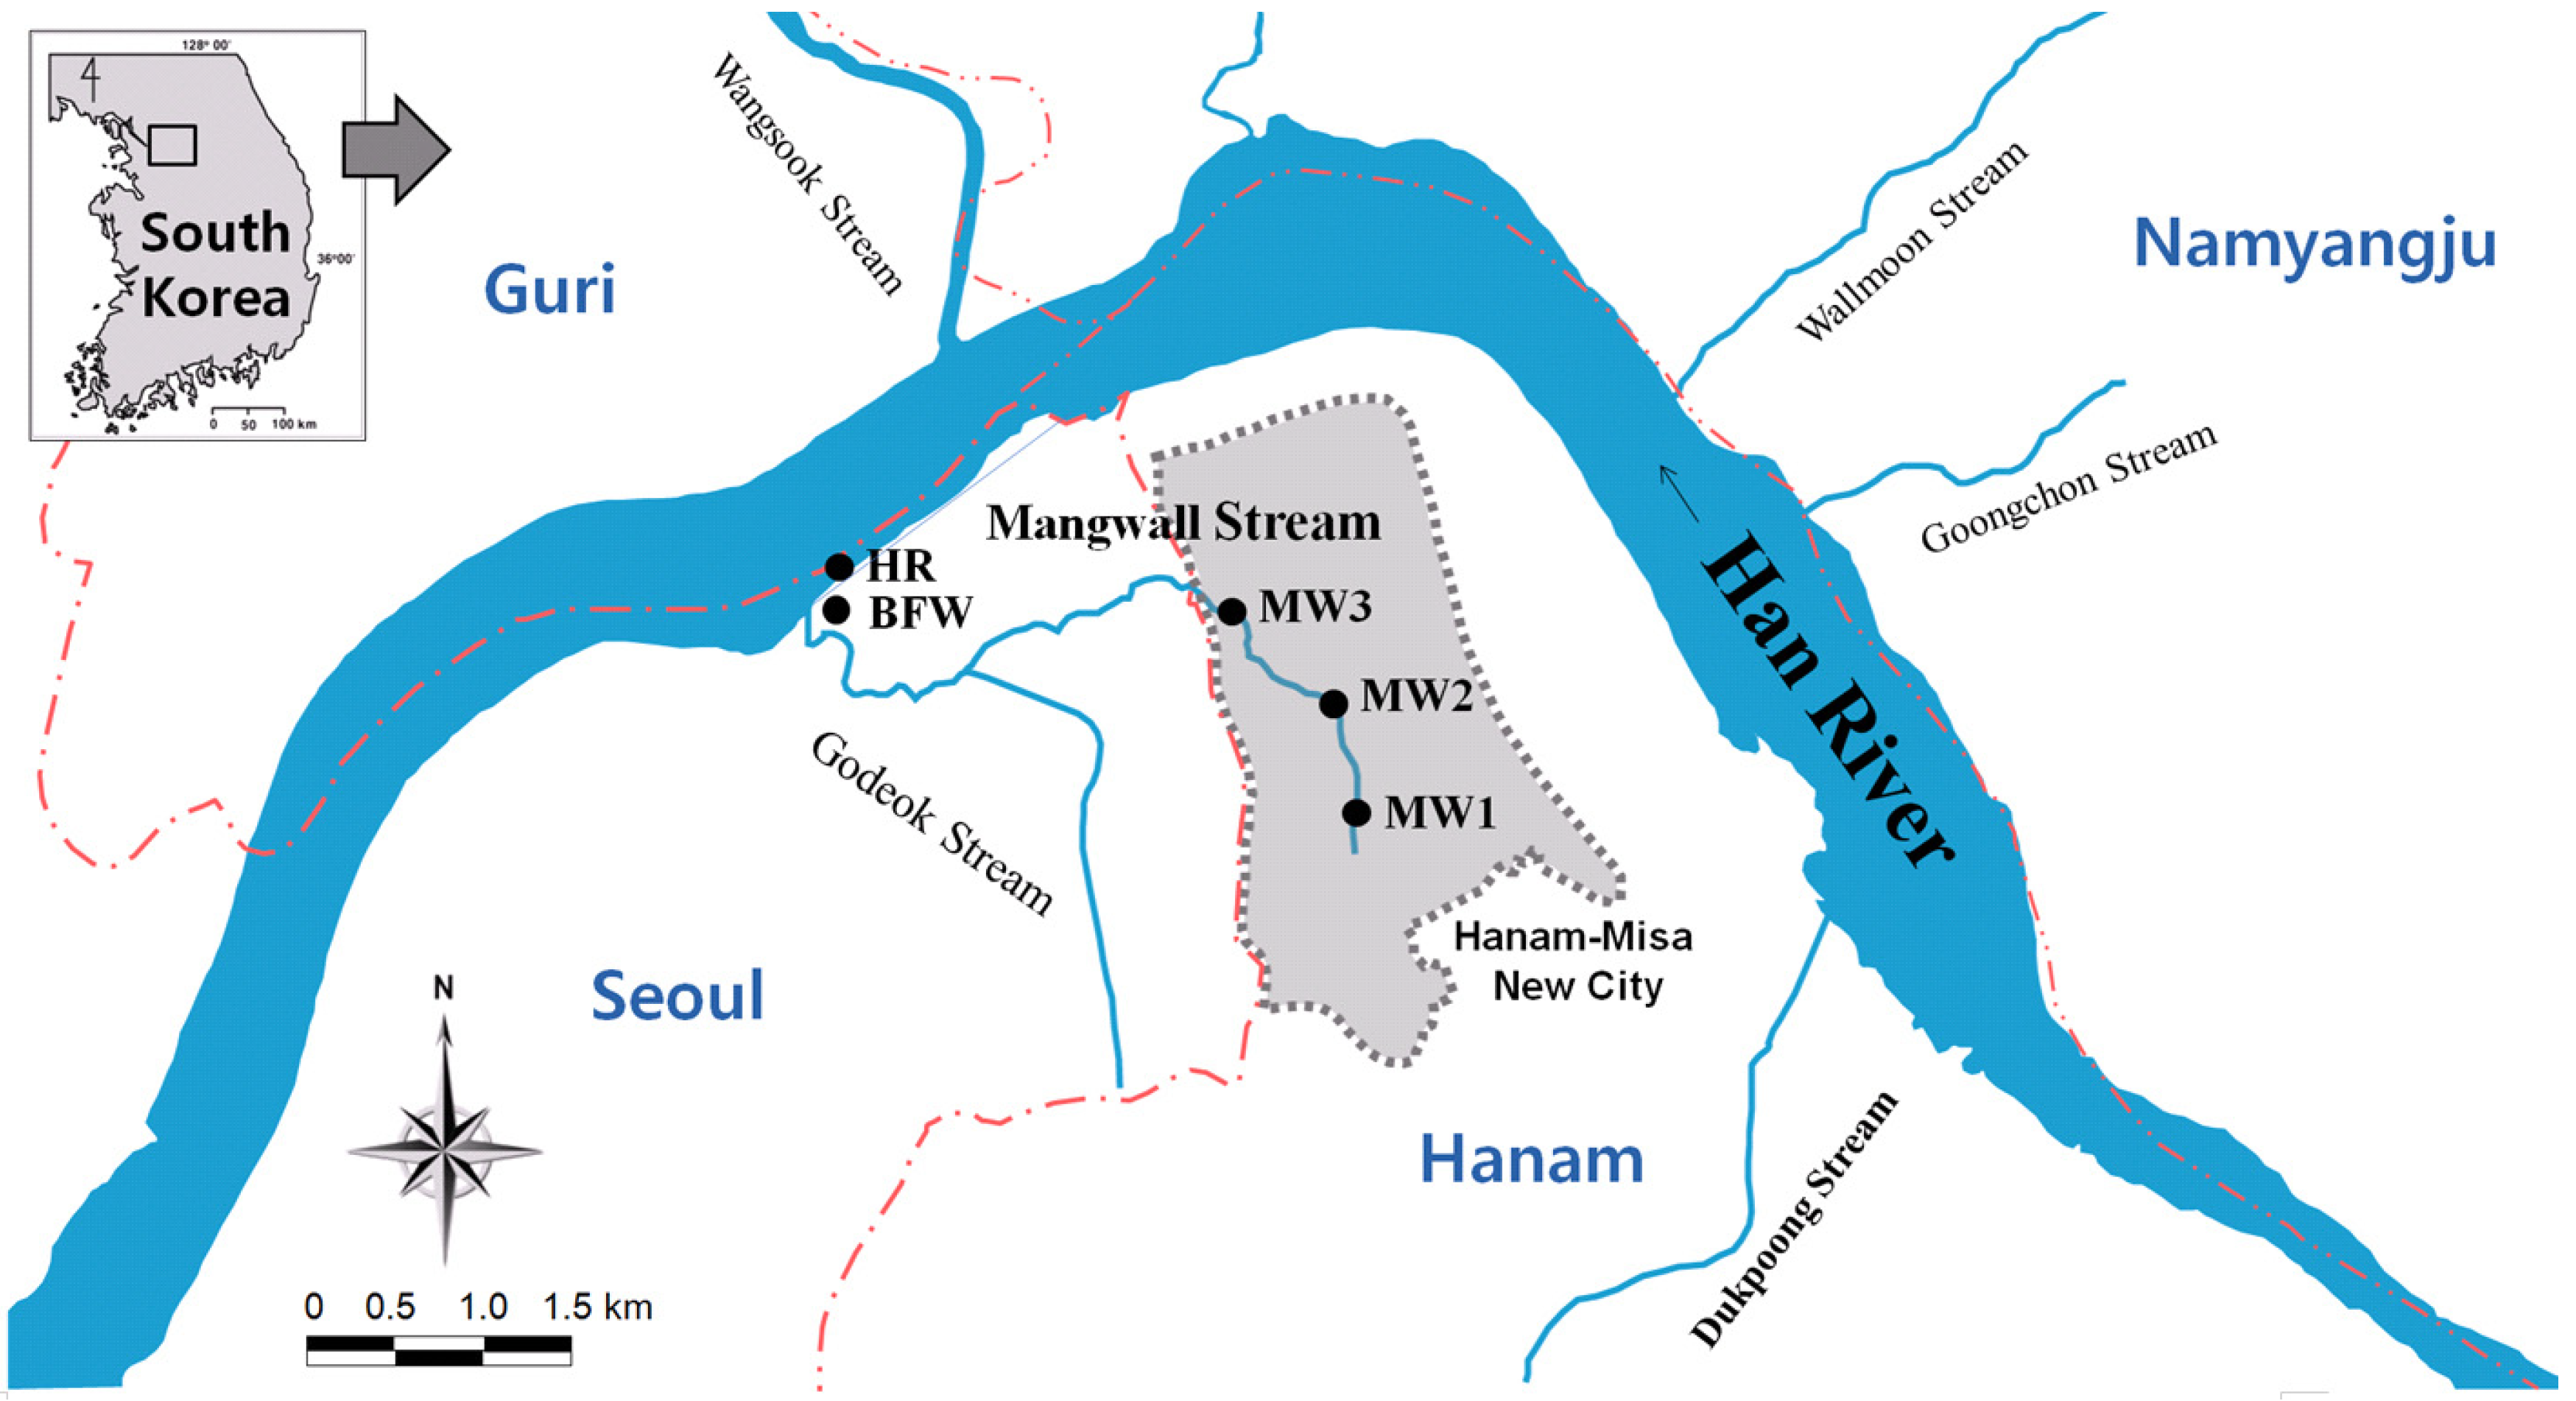
2.1. Research Site Overview

The Mangwall (MW) Stream is a stagnant urban stream that exhibits a relatively low flow rate (i.e., 7603 m3 d−1). As shown in Figure 1, the extended flow path of MW is 5.7 km; it interflows with the Godeok Stream downstream and ultimately flows into the Han River (HR). The slope of the bed is approximately 0.02%–0.033%, the average width is 4.0 m, and the average depth is 0.32 m. To augment the water supply of MW to prevent the excessive growth and accumulation of periphyton, three different water sources [i.e., Mangwall Stream (MW), Han River (HR), and bank filtrate water (BFW) from the HR] were considered.
Figure 1. Site description and sampling points investigated in this study (gray area: Hanam-Misa New City, located in Hanam-si, South Korea; MW: Mangwall Stream; HR: Han River; BFW: bank filtration water).
Water 05 01723 g001

2.2. Artificial Stream Mesocosm Apparatus

In this study, an artificial stream mesocosm apparatus that brings stagnant artificial stream under controlled conditions was developed to investigate the variation in the grow rate and biomass accumulation of periphyton in terms of different water velocities and substrata for the three water sources. As shown in Figure 2, the artificial stream mesocosm apparatus consisted of a flow rate adjustor, waterway, pumping and reservoir facility, and temperature controller. Four flow rate adjustors with lengths of 20 cm, widths of 25 cm, and depths of 30 cm were utilized. The flow rate adjustor was connected with four waterways for which the water velocity could be adjusted, and a v-notch weir was installed to enable water velocity adjustments. The flow-rate estimation using the v-notch weir was based on Equation (1), proposed by Kindsvater and Carter [33], and the different water velocities were adjusted based on Equation (2) when passing through the waterway with a width of 5 cm and a depth of 1 cm.
Q (cm3 s−1) = 15.5·H2.47
V = Q/A
where Q denotes the flow rate (cm3 s−1); H denotes the height of the v-notch weir (cm); V denotes the water velocity in the waterway (cm s−1); and A denotes the cross-sectional area of the waterway (cm2).
A total of 12 waterways, with lengths of 100 cm, widths of 5 cm, and depths of 5 cm, were prepared. The waterways were composed of transparent acrylic to enhance light transmissivity. Water that passed through the waterway was transferred to a 25-L reservoir and subsequently pumped to the temperature controller for recycling. To adjust and control the light intensity during the artificial stream mesocosm experiment, a lighting device was installed on the upper part of the apparatus.

2.3. Experimental Procedures

The experimental procedures were conducted in the following order: (1) water sampling from the three water sources; (2) periphyton inoculation; (3) cultivation; (4) harvesting; and (5) analysis. As shown in Figure 1, sampling was initially conducted based on a total of five points (MW1 to BFW) for the three water sources (i.e., MW, HR, and BFW). A Van Dorn sampler was used for sampling, and the collected water was transported to the lab in a 2 L polyethylene bottle. Samples from the MW were collected from three different points (MW1–MW3). However, only MW1 (upstream of the MW) was used for periphyton cultivation. Samples from the HR were collected from one designated point, and samples from the BFW were directly collected from the BFW facility, which was located 20 m below ground level.
For three water sources, three different types of artificial substrata (i.e., tile, concrete, and pebble) were deployed with four different water velocities, as displayed in Figure 2. Artificial substrata of specific sizes (2.5 cm × 2.5 cm) were prepared and stored in distilled water for 48 hours. The substrata were rinsed several times using distilled water and air dried. The periphyton used for inoculation was collected from the sediments in MW1. To promote the attachment of periphyton, the artificial substrata were arranged in the artificial stream mesocosm apparatus and the periphyton was seeded for 24 hours under dark conditions.
Figure 2. The artificial stream mesocosm apparatus used for periphyton cultivation.
Water 05 01723 g002
Cultivation was performed for 30 days. The collected MW1 for periphyton cultivation was screened with a 60-µm mesh to exclude interference by zooplankton and other suspended solids. In the artificial stream mesocosm experiment, water velocities of 5 cm s−1 (HRT = 3.4 s & Re = 50,000), 10 cm s−1 (HRT = 5.2 s & Re = 100,000), 20 cm s−1 (HRT = 10.1 s & Re = 200,000), and 30 cm s-1 (HRT = 20.6 s & Re = 300,000) with different substrata were applied. Other experimental conditions that were consistently maintained included a light intensity of 100 µmol m−2 s−1, light:dark intervals of 14:10, and water temperatures of 20 °C. The three water sources were continuously recycled with pumps, and approximately 1 L of water was supplemented daily to compensate for the evaporated water.
Harvesting was periodically performed by detaching periphyton from the artificial substrata using soft brushes. The periphyton biomass was analyzed by separating it into chlorophyll-a (chl-a) and phaeopigment, which was extracted from periphyton per area of substrata. The chl-a of the periphyton was extracted using the acetone method, and the phaeopigment was measured using a 2N HCl application [34,35]. The growth rate (µ) of periphyton was calculated using Equation (3):
µ (day1) = ln(X2/X1)/(T2 − T1)
where µ is the growth rate of periphyton (day−1); X2 is the periphyton chl-a concentration at time T2 (mg chl-a cm−2); and X1 is the initial periphyton chl-a concentration at time T1 (mg chl-a cm−2).
Water temperature, pH, DO, and electrical conductivity were measured on site using a DO device (YSI 85, Yellow Springs, OH, USA) and a conductivity device (YSI 63, Yellow Springs, OH, USA), and additional water quality analyses were performed in the lab according to standard methods [34,35]. An optical microscope (Zeiss Axioplan, Oberkochen, Germany) was used to observe the periphyton, and the specific surface area of the substratum was measured using the BET method (BELSORP–mini II, Osaka, Japan) [36].

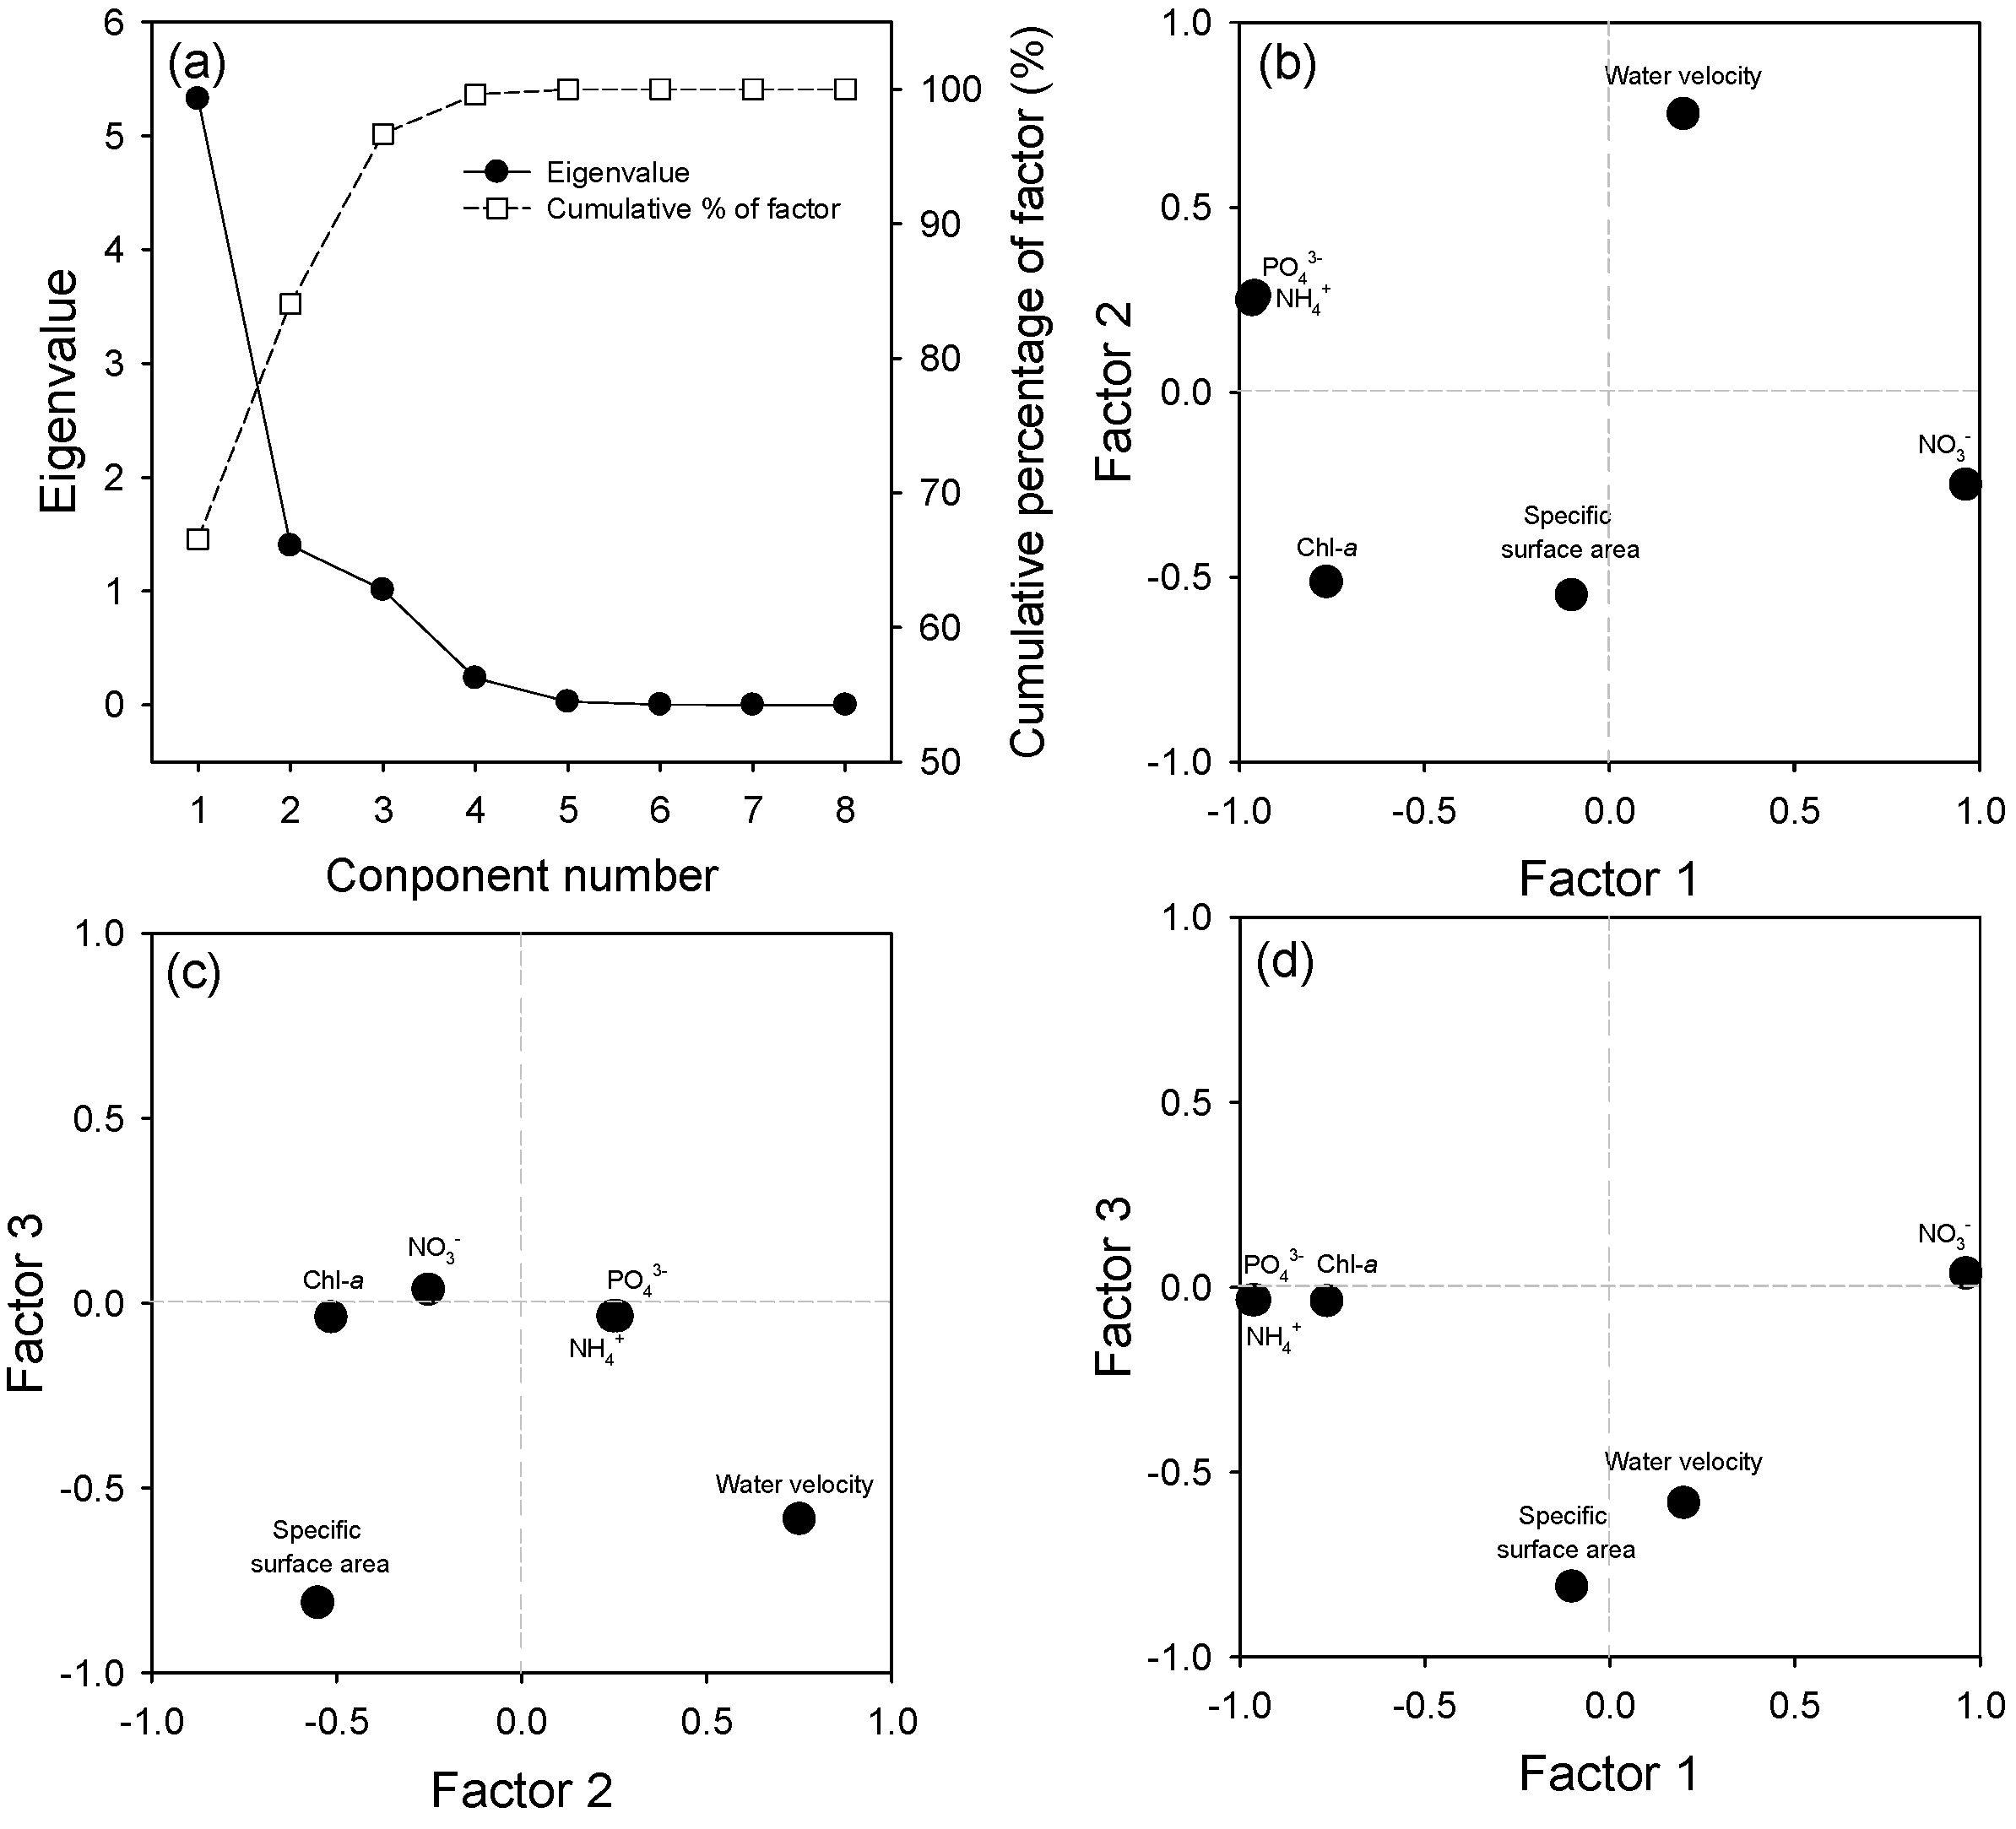
2.4. Principal Components Analysis (PCA)

To interpret the quantitative results of the experimental data, a Principal Components Analysis (PCA) was performed. Because PCA is a method for expressing multiple information with mutual correlations with few principal components [1], mutually independent and unique patterns can be constructed for both the growth rate and biomass accumulation of periphyton. In this study, the PC-ORD program V. 5.0 was used for the PCA, and the eigenvalue and factor loadings for each variable (i.e., NH4+, NO3, PO43−, chl-a, water velocity, and specific surface area) were used to quantify the data.

3. Results and Discussion

3.1. Water Quality

The results of the annual water quality analysis are summarized in Table 1. The measured concentrations of organic matter and inorganic nutrients for the MW were greater than the measured concentrations of organic matter and inorganic nutrients for the HR and BFW. The flow regime and characteristics differed among the potential water sources.
No considerable difference was observed in the water quality of the MW among the three sampling points (i.e., MW1–3). The MW exhibited water depths ranging from 5 to 34 cm and water velocities ranging from 0 to 12 cm s−1. The average water temperature of the MW was approximately 24.4 °C, which was approximately 2.9–7.1 °C higher than the average water temperature of other water sources. The MW exhibited relatively high organic matter (i.e., BOD and CODMn), inorganic nutrient (i.e., NH4+, NO3 and PO43−), and periphyton concentrations. Table 1 illustrates the excessive growth of periphyton stimulated by high nutrient levels and low water velocities.
Table 1. Summary of annual water quality analysis results for three water sources from January to December in 2010 (n = 4).
DescriptionMWaHRbBFWc
MW1MW2MW3
Water depth (cm)6.3 ± 1.5d20.5 ± 1.731.5 ± 1.985.3 ± 9.1N.De
Water velocity (cm s−1)1 ± 16 ± 47 ± 416 ± 4N.D
Temperature (°C)24.4 ± 6.824.4 ± 6.924.4 ± 6.521.5 ± 5.517.3 ± 3.8
pH7.6 ± 0.47.6 ± 0.47.6 ± 0.37.8 ± 0.37.4 ± 0.5
DO (mg O2 L−1)6.5 ± 1.36.7 ± 1.36.5 ± 1.38.1 ± 0.47.0 ± 0.1
Conductivity (µS cm1)674 ± 93670 ± 95722 ± 74167 ± 34156 ± 29
Salinity (‰)0.5 ± 0.10.5 ± 0.00.5 ± 0.00.1 ± 0.00.1 ± 0.0
SS (mg L−1)4.3 ± 1.25.3 ± 1.55.2 ± 1.25.2 ± 1.7N.D
BOD (mg O2 L−1)6.3 ± 1.96.4 ± 2.06.6 ± 1.42.0 ± 0.70.9 ± 0.6
CODMn (mg O2 L−1)7.3 ± 1.16.9 ± 1.17.0 ± 1.13.1 ± 0.62.1 ± 0.6
TN (mg N L−1)6.9±1.57.1±1.67.0±1.52.6±0.72.2 ± 0.6
NH4+ (µg N L−1)1241 ± 1211384 ± 981395 ± 96258 ± 55183 ± 52
NO3 (µg N L−1)716 ± 121720 ± 128707 ± 1501644 ± 1421649 ± 56
TP (µg P L−1)632 ± 160605 ± 192620 ± 18874 ± 7.759 ± 12.7
PO43− (µg P L−1)425 ± 43417 ± 50413 ± 4034 ± 828 ± 4
Phytoplankton (µg chl-a L−1)2.0 ± 0.04.1 ± 1.85.6 ± 1.59.9 ± 0.0N.D
Periphyton (mg chl-a cm2)7.0 ± 1.66.7 ± 1.36.5 ± 1.71.2 ± 8.3N.D
Notes: a MW: Mangwall Stream; b HR: Han River; c BFW: Bank filtration water; d average ± standard deviations for four measured data; e N.D: No data.
Compared with the MW, the HR exhibited relatively deep water depths of 85.3 ± 9.1 cm and faster water velocities of 16 ± 4 cm s−1. The concentrations of organic matter consisted of a BOD of 2.0 mg O2 L−1 and a CODMn of 3.1 mg O2 L−1, and the concentrations of inorganic nutrients consisted of 258 µg N L−1 (NH4+), 1644 µg N L−1 (NO3), and 74 µg P L−1 (PO43−). These values indicate that the average concentrations of contaminants in the HR ranged from 57.5% to 92.0%, which were lower than the average concentrations of contaminants in the MW. In contrast with the MW, the HR exhibited higher concentrations of phytoplankton than periphyton. Due to the bank filtration through the sediments to remove both organic and inorganic contaminants, the concentrations of organic matter in the BFW were significantly lower than the concentrations of organic matter for other water sources, whereas the concentrations of inorganic nutrients for BFW were slightly lower than the concentrations of inorganic nutrients for other water sources. No algae were observed in the BFW.
Samples from the three water sources used in the artificial stream mesocosm experiment were collected in April 2010. Similar to the results of the annual water quality analysis summarized in Table 1, the nutrient concentrations related to periphyton growth and biomass accumulation were in the increasing order of BFW < HR < MW, as summarized in Table 2. No considerable difference in water quality of the MW was observed for the three sampling points (i.e., MW1–3); thus, MW1, near the headwaters, was used for the artificial stream mesocosm experiment.
Table 2. Summary of water quality analysis results for three water sources sampled in April 2010 (n = 1).
DescriptionMWaHRbBFWc
MW1*MW2MW3
Water depth (cm)7223485N.Dd
Water velocity (cm s−1)07515N.D
Temperature (°C)19.218.919.118.713.3
pH8.17.97.98.78.4
DO (mg O2 L−1)7.37.27.78.37.2
Conductivity (µS cm1)92511611079220147
Salinity (‰)0.50.50.60.10.1
SS (mg L−1)10.313.06.15.4N.D
BOD (mg O2 L−1)4.04.66.12.40.5
CODMn (mg O2 L−1)6.36.77.03.20.9
TN (mg N L−1)9.710.59.62.31.8
NH4+ (µg N L−1)151217501664302189
NO3 (µg N L−1)77142050215501610
TP (µg P L−1)8238427905245
PO43− (µg P L−1)6146886522116
Phytoplankton (µg chl-a L−1)2.55.26.09.9N.D
Periphyton (mg chl-a cm2)8.88.38.22.3N.D
Notes: * Water sources for artificial stream mesocosm experiment; a MW: Mangwall Stream; b HR: Han River; c BFW: Bank filtration water; d N.D: No data.

3.2. Species Composition

The species compositions of periphyton that were collected from the sediments in the three water sources are summarized in Table 3. Although filamentous Cyanophyceae were dominant in all sections of the MW, Bacillariophyceae of diverse species were dominant in the HR. In particular, the dominant species Phormidium sp. (family Oscillatoriaceae) formed a thick algal mat in the MW. Similar studies have reported that Phormidium sp. is a filamentous cyanophyte that is known to rapidly settle in polluted and stagnant water bodies [37] and dominates stagnant freshwater lentic systems with high temperatures and high nutrient concentrations [29] and freshwater environments with low depths and high nutrient concentrations [38,39]. In the present study, the periphyton inoculated in the artificial stream mesocosm experiment was composed of mixed cultures collected in MW1.

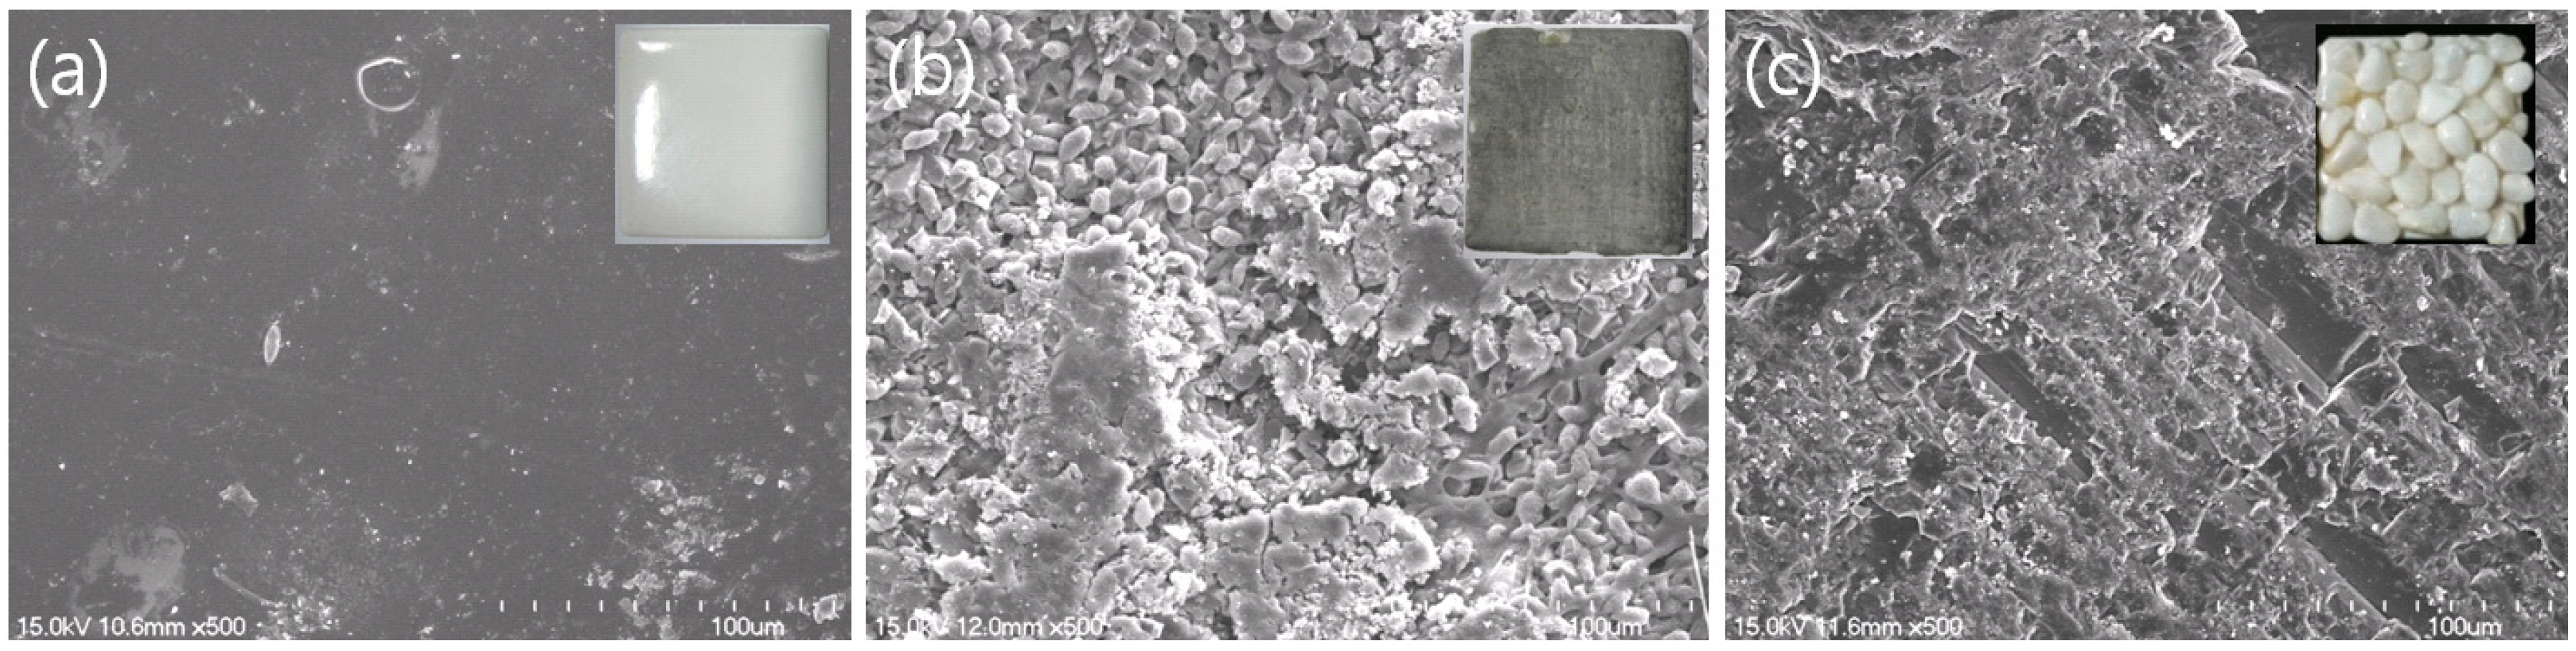
3.3. Surface Characteristics of Artificial Substrata

The specific surface areas of artificial substrata used in this study ranged from 0.004 to 6.8 m2 cm−2. For example, the specific surface areas of tile, concrete, and pebble were 0.004 ± 0.0001 m2 cm−2, 2.1 ± 0.2 m2 cm−2, and 6.2 ± 0.4 m2 cm−2, respectively. The SEM images of the evaluated substrata are shown in Figure 3. As shown in Figure 3a, the surface of tile is relatively smooth and nonporous. Therefore, limited space was available for periphyton immobilization, and the periphyton easily sloughed when mature periphyton decayed. Compared with tile, concrete exhibits rough surfaces and contains numerous isolated pores with diameters ranging from 10 to 50 µm, in which filamentous periphyton become strongly immobilized on the surface (see Figure 3b). Similar to concrete, pebble exhibits rough surfaces and contains numerous isolated small pores with diameters ranging from 10–100 µm (see Figure 3c), which enable filamentous periphyton to inhabit the pores. Considering that the diameter of filamentous periphyton is approximately 10 µm, the pore sizes of concrete and pebble were sufficient to support filamentous periphyton against both hydrodynamic shear stress and mat tensile strength.
Table 3. Summary of species compositions (%) for periphyton collected from the sediments in three water sources sampled in April 2010.
ClassSpeciesMWaHRbBFWc
MW1*MW2MW3
CyanophyceaeMicrocystis aeruginosaN.Dd+e++N.D
Phormidium sp.92.085.077.0N.D
ChlorophyceaeClosterium sp.N.DN.D3.04.0N.D
Oedogonium sp.N.DN.D4.0+N.D
Scenedesmus acuminatus5.05.0+13.0N.D
BacillariophyceaeAchnanthidium sp.N.DN.DN.D+N.D
Asterionella formosaN.DN.D5.023.5N.D
Cymbella minutaN.DN.DN.D5.5N.D
Fragilaria rumpensN.DN.DN.D9.0N.D
Melosira variansN.DN.D+5.2N.D
Navicula cryptocephalaN.DN.DN.D+N.D
Nitzschia amphibia+10.04.022.5N.D
Stephanodiscus hantzschiiN.DN.D4.06.3N.D
Synedra ulna Ehrenberg3.0+3.011.0N.D
Total (%)100.0100.0100.0100.0N.D
Notes: * Periphyton biomass inoculated in artificial stream mesocosm experiment; a MW: Mangwall Stream; b HR: Han River; c BFW: Bank filtration water; d N.D: No data; e Species identified with trace amounts.
Figure 3. The SEM images of three substrata: (a) tile; (b) concrete; and (c) pebble.
Water 05 01723 g003

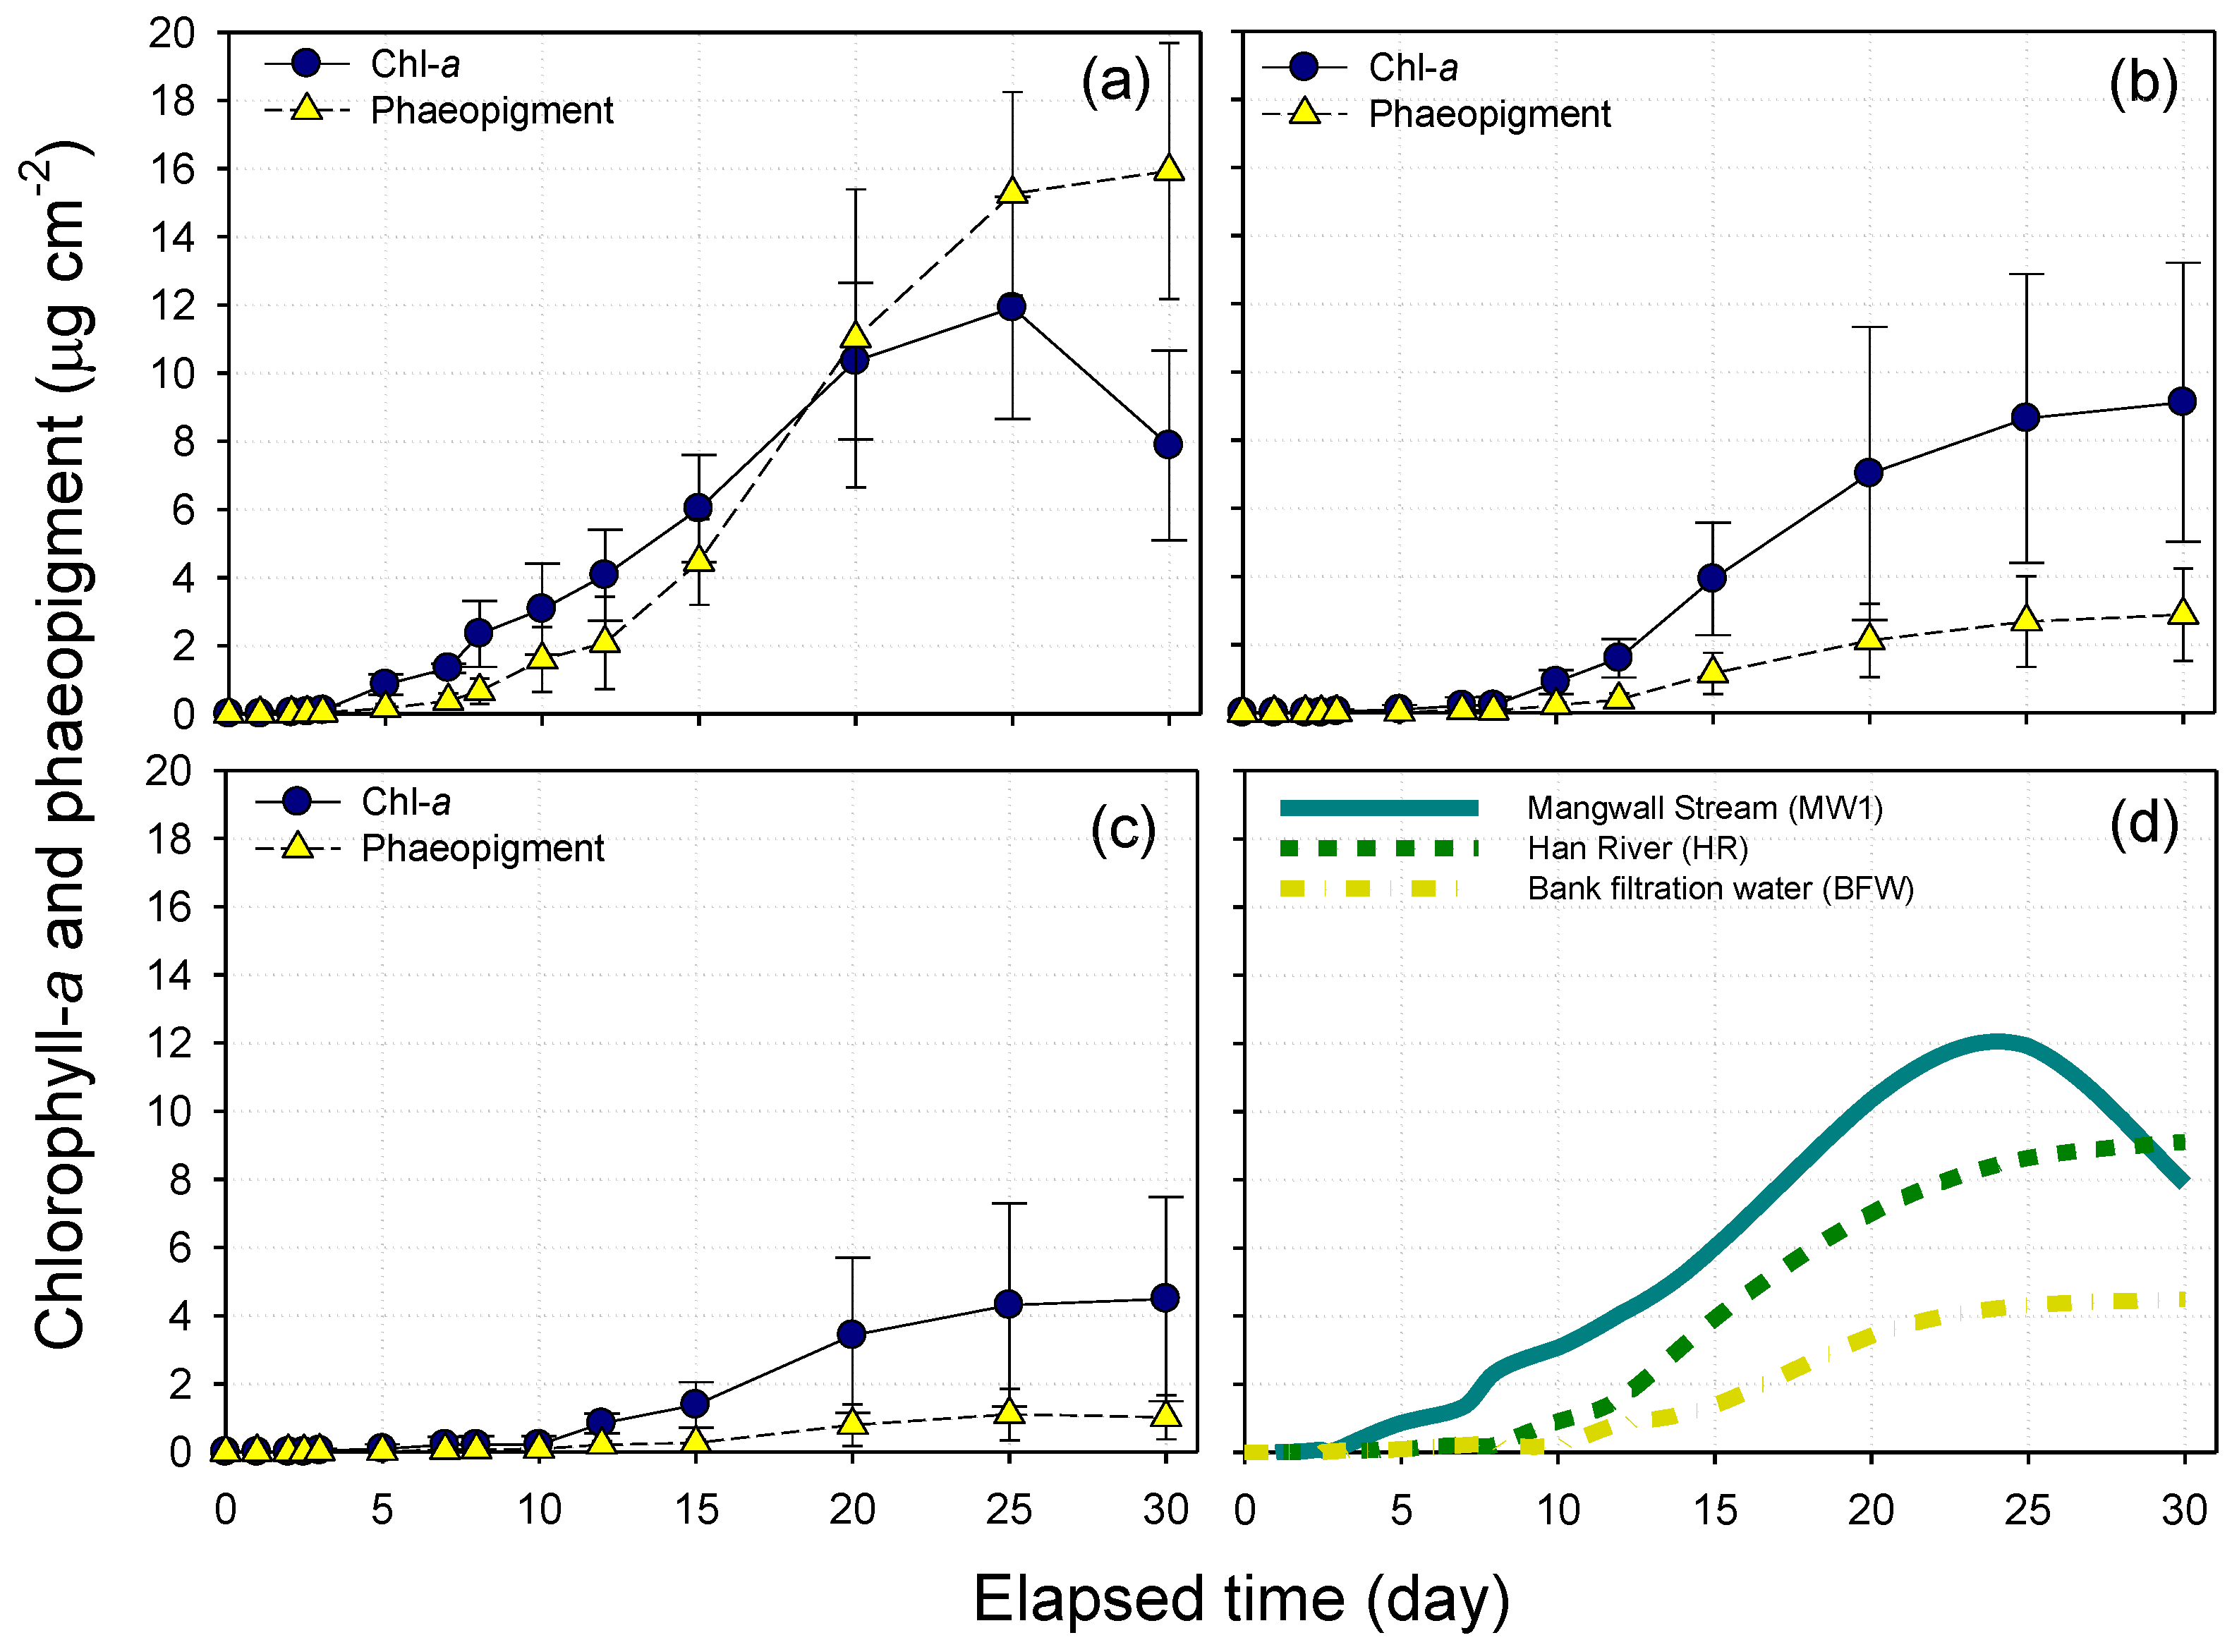
3.4. Periphyton Biomass Accrual Curves

During the artificial stream mesocosm experiment, periphyton biomass accrual curves with different water sources were constructed in terms of chl-a and phaeopigment concentrations. As shown in Figure 4, the periphyton biomass accrual via colonization occurred in the initial phase followed by exponential growth limited by nutrients, light, and temperatures. The periphyton biomass naturally began autogenic sloughing in the loss phase [19]. The time to attain peak periphyton biomass varied from 23 to 30 days depending on the water resources. Similar studies have reported that the time to achieve peak periphyton biomass was approximately 30 days [4,19]. Compared with the biomass of the HR and the BFW, a faster and larger peak periphyton biomass of MW1 resulted due to the higher nutrient concentrations of MW1 under identical light intensity and water velocity conditions.
Figure 4 also reveals that the growth trend of phaeopigment is similar to the growth trend of chl-a. Periphyton exhibited excessive growth due to the high nutrient concentrations in MW1 and were quickly deposited on the substrata, whereas periphyton developed slowly due to the low nutrient concentrations in the HR and the BFW. The phaeopigment values of MW1, the HR, and BFW measured 25 days after cultivation were 15.3 ± 3.0 µg cm−2, 2.7 ± 1.4 µg cm−2, and 1.1 ± 0.8 µg cm−2, respectively, and the ratios of phaeopigment concentration to chl-a concentration for MW1, the HR, and BFW were 128.6%, 31.4% and 25.6%, respectively. The differences in ratios may be attributed to the fact that higher inactive pigment concentrations in MW1 were caused by higher nutrient concentrations in MW1 [40]. In nutrient-enriched MW1, periphyton biomass increased significantly and produced a thick algal mat. Thus, periphyton biomass repeated cycles of accrual and loss more quickly, and phaeopigment continued to deposit in the substrata. As a result, relatively high concentrations of phaeopigment were measured in nutrient-enriched MW1 [41,42,43].
Figure 4. The periphyton biomass accrual curves in terms of chl-a and phaeopigment concentrations for 30 days with different water sources: (a) MW1; (b) HR; (c) BFW; and (d) trend lines of chl-a for MW1, HR, and BRW (Experimental conditions: water velocity = 5 − 30 cm s−1, type of substratum = tile, concrete, and pebble, and number of observation for each water source = 12).
Water 05 01723 g004

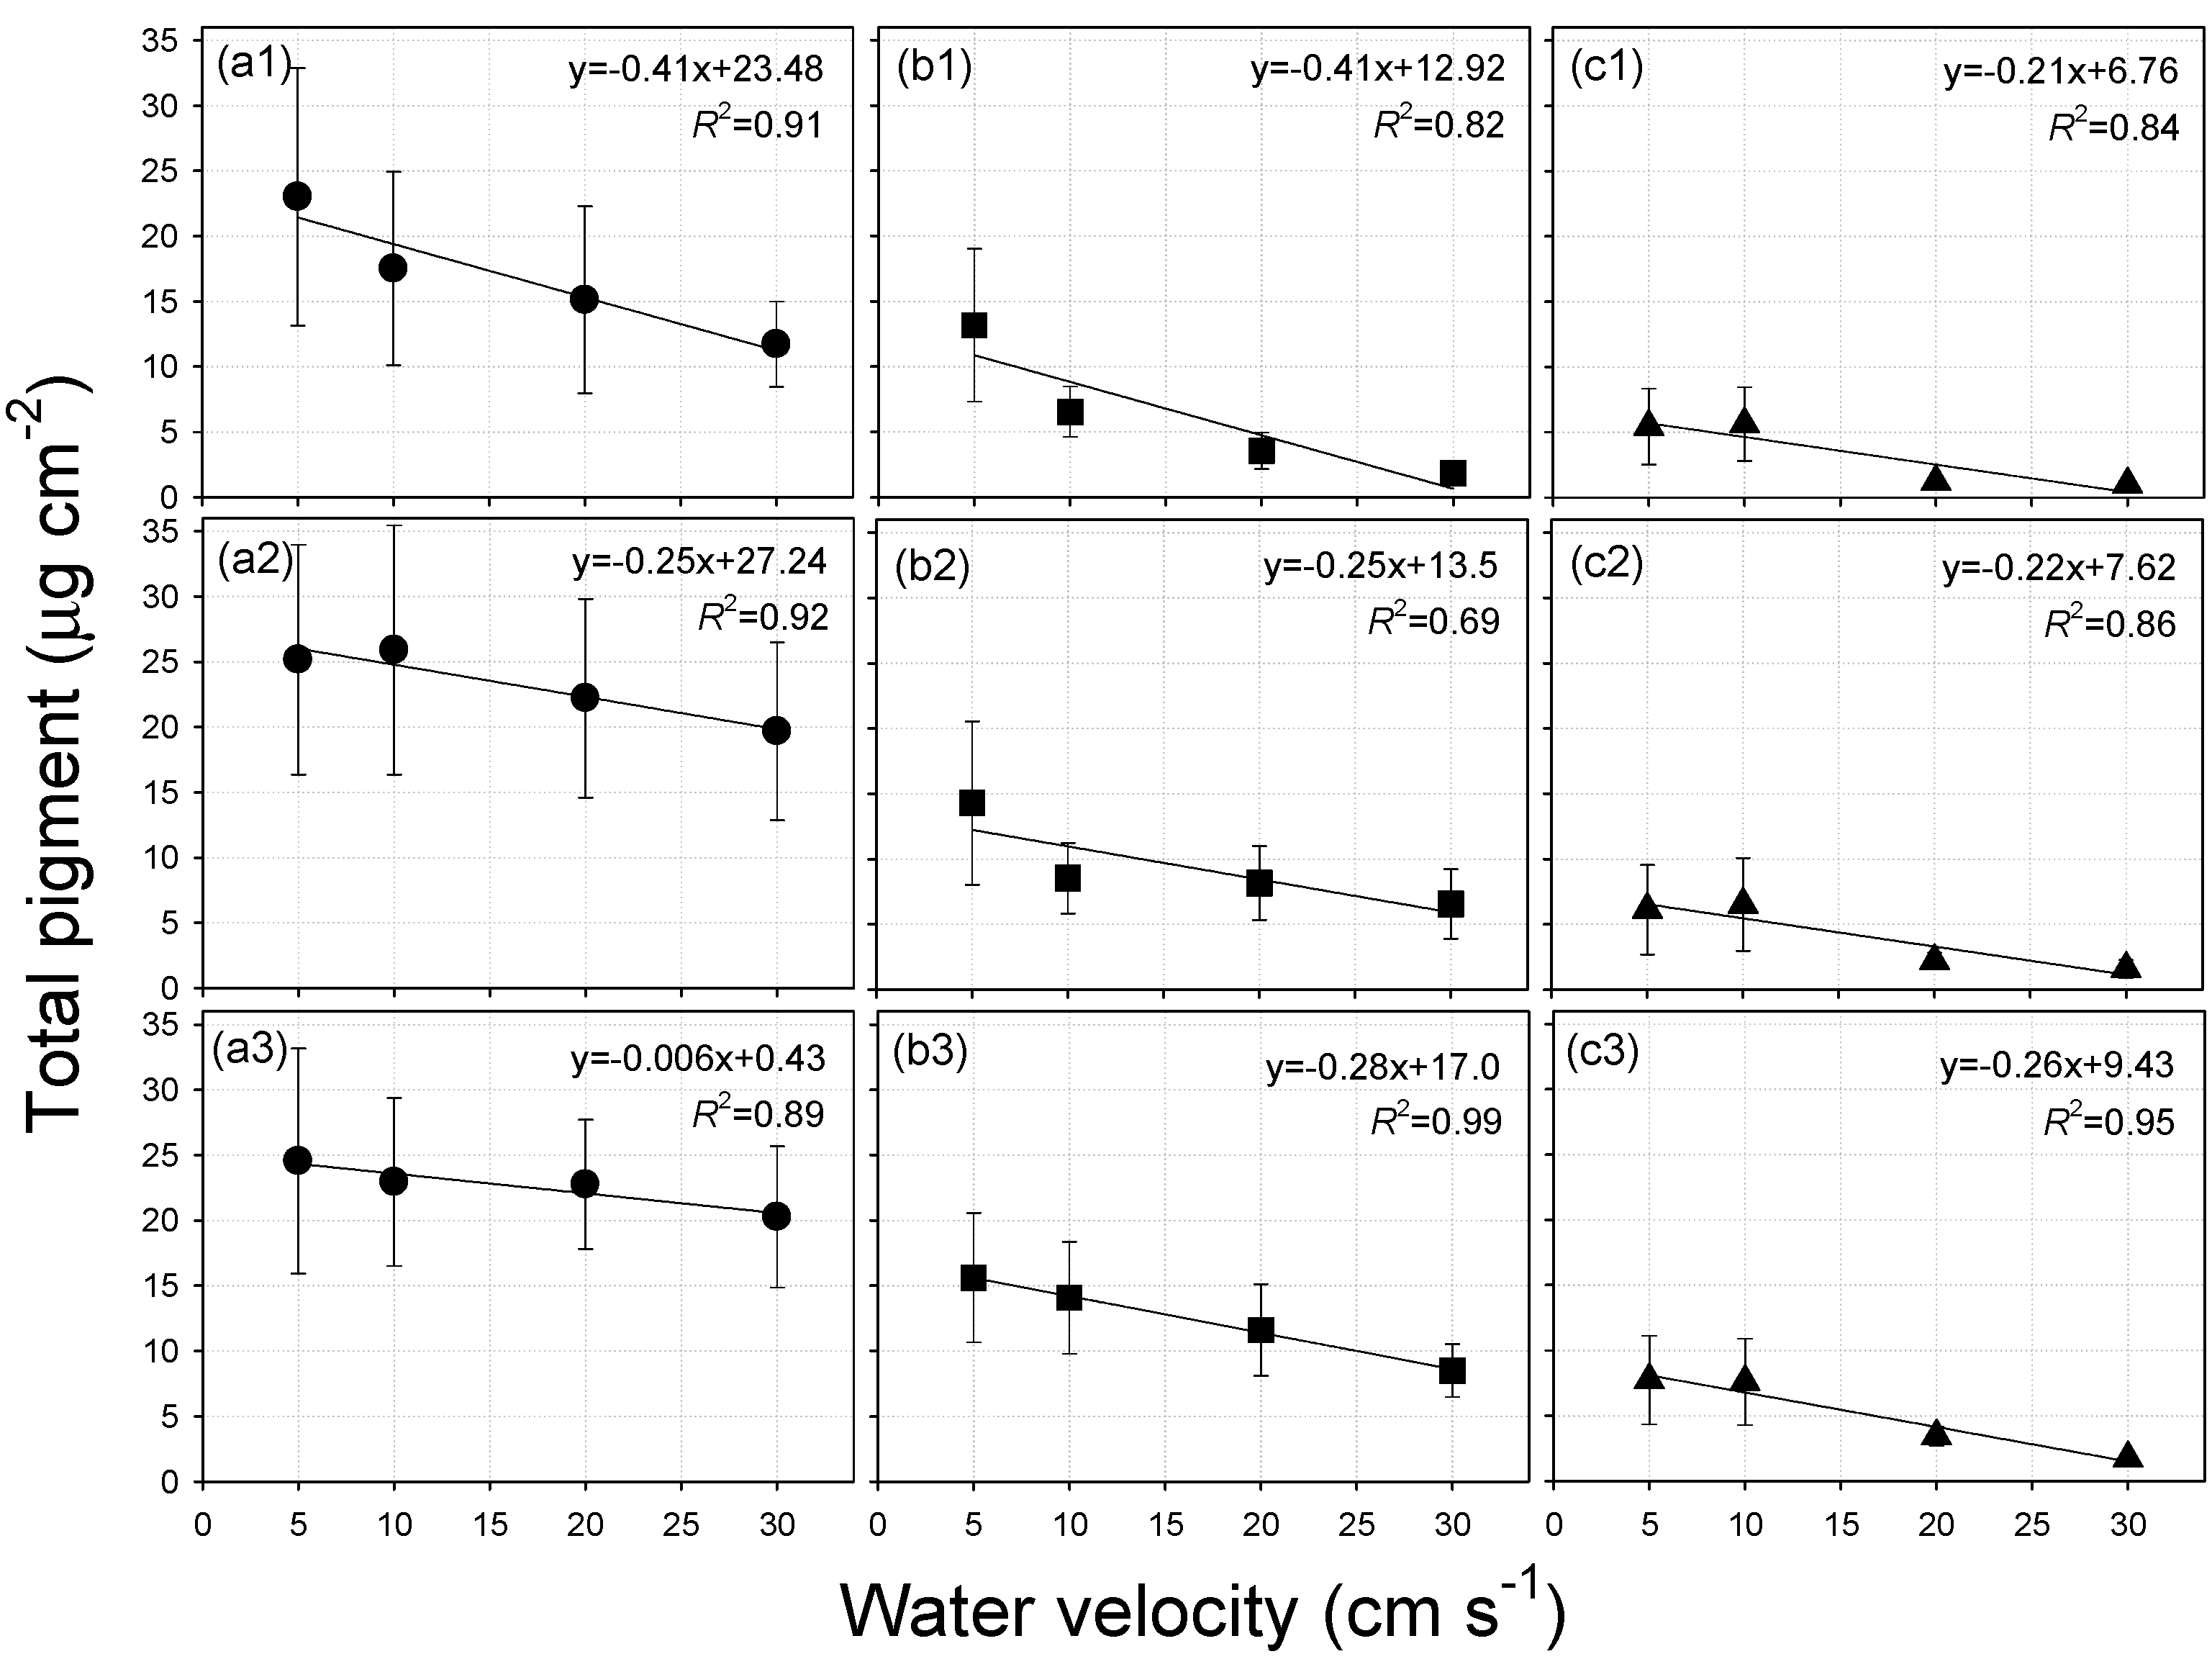
3.5. Relationships between Water Velocity and Periphyton Biomass

Because relatively high concentrations of phaeopigment were measured in nutrient-enriched MW1, the periphyton biomass was calculated based on the total periphyton biomass (total pigment = chl-a + phaeopigment). As shown in Figure 5 and Figure 6, the total periphyton biomass and growth rate were greater when the water velocity was lower, regardless of the characteristics of water sources and substrata. For example, the largest periphyton biomass observed was 23.0 ± 9.9 µg cm−2 for a water velocity of 5 cm s−1, whereas the smallest biomass observed was 1.0 ± 0.1 µg cm-2 for a water velocity of 30 cm s−1. Consistent with this study, in previous studies, the appropriate range of water velocity for various filamentous algae, as measured both in the field and the laboratory, was in the range of 5.5–14 cm s−1, and the majority of filamentous algae preferred low water velocities [6,19,29,44,45]. Based on the data from 16 duplicate experiments, relatively robust linear relationships (R2 ≥ 0.69) between water velocity and the total periphyton biomass/growth rate were obtained, which indicates that increased water velocity can reduce biomass accrual.
When the water velocity increases, nutrient transport to the periphyton mat accelerates by thinning the existing boundary layer between the periphyton mat and the nutrient-poor water body. Thus, an increase in water velocity causes an increase in biomass accrual by enhancing nutrients and metabolite uptake in a nutrient-poor water body [17,46,47]. However, water velocities higher than critical values can also induce the loss of periphyton biomass, such as the physical disruption and displacement of the algal mat. In addition, the loss of periphyton due to high water velocities can be enhanced by substratum instability and associated abrasion.
Figure 5. Relationships between water velocity and periphyton biomass with different water sources and substrata (a): MW1; (b): HR; (c): BFW; (1: tile; 2: concrete; 3: pebble; n = 16).
Water 05 01723 g005
Figure 6. Relationships between water velocity and periphyton growth rate with different water sources and substrata (a): MW1; (b): HR; (c): BFW; (1: tile; 2: concrete; 3: pebble; n = 16).
Water 05 01723 g006
As shown in Figure 5 and Figure 6, under conditions of identical water velocity and/or substratum, the periphyton biomass and growth rate demonstrated the increasing order of BFW < HR < MW1 due to the greater concentrations of nutrients in MW1. Because increasing nutrient concentrations in water cause increased diffusive transport to periphyton mats, biomass accrual rates increased in response to enhanced nutrient uptake, regardless of water velocity and type of substrata. In a nutrient-enriched water body, greater periphyton biomass and growth rates resulted primarily from the greater concentrations of nutrients, which indicates that nutrient level is the dominant factor affecting periphyton accrual rates in a nutrient-enriched water body.

3.6. Relationships between Specific Surface Area of Substratum and Periphyton Biomass

Filamentous periphyton exhibit different inhabitation densities depending on the type of substratum [48]. In particular, the biomass exhibited close relationships with specific surface areas, which can immobilize the algal mat. As shown in Figure 7, relatively weak relationships (R2 = 0.24) between specific surface area and total periphyton biomass were obtained for MW1, whereas stronger relationships (R2 ≥ 0.58) between specific surface area and total periphyton biomass were obtained for the HR and BFW. These results indicate that an increase in the specific surface area of the substratum can increase periphyton biomass in a nutrient-poor water body, whereas increasing the specific surface area of the substratum does not significantly affect periphyton biomass in a nutrient-enriched water body. MW1 exhibited high nutrient levels, which facilitated sufficient growth and biomass accumulation for periphyton, especially in low-surface-area substrata. However, the HR and BFW exhibited relatively low nutrient levels, and an increase in the specific surface area of the substratum resulted in a significant increase in periphyton biomass.
Figure 7. Relationships between specific surface area of substratum and periphyton biomass with different water sources and substrata. (a): MW1; (b): HR; (c): BFW; (d): box plot results for different substrata (n = 12).
Water 05 01723 g007

3.7. Species Composition of Periphyton after the Artificial Stream Mesocosm Experiment

An analysis of the dominant species of periphyton after the artificial stream mesocosm experiment, in which an optical microscope was utilized, revealed the dominance of cyanophyceae such as Phormidium sp. (family Oscillatoriaceae) (>98%); bacillariophyceae such as Nitzschia amphibia, Navicula cryptocephala, and Achnanthidium sp. were also observed (<2%). Phormidium sp., which was dominant in this study, frequently appeared in eutrophic stagnant waters, and Phormidium sp. rapidly formed colonies and reproduced well under low-light intensities [49,50]. Higher reproduction capacities have been reported for Phormidium sp. compared with other species [50].

3.8. PCA Results

Multivariate statistical approaches, such as PCA, are extensively used to identify significant factors for characteristics of environmental conditions [51]. In the present study, the variation for a correlation matrix was generated, and three factors were extracted by rotating Varimax by the centroid method. According to Figure 8a, the first three eigenvalues were extracted for significant factors (i.e., eigenvalue >1), which explained 96.7% of the total variation.
Generally, the factor loadings can be classified into three types, including “strong (>0.75)”, “moderate (0.50–0.75)”, and “weak (0.30–0.50)” [52]. Factor 1 explained 66.6% of the total variation and exhibited a high negative loading in NH4+, PO43−, and chl-a and a high positive loading in NO3 (absolute values in the range of 0.76–0.97) (Figure 8b). Because high loading values indicated a robust linear correlation between the factors and parameters [53], nutrient salts (i.e., NH4+, NO3, and PO43−) were determined to be the most dominant limiting factor for developing filamentous periphyton. Factor 2 explained 17.5% of the total variation and exhibited a high positive loading in water velocity (absolute value of 0.75) (Figure 8c). Factor 3 explained 12.6% of the total variance and was negatively correlated with the specific surface area of the substratum (absolute value of 0.81) (Figure 8d). Therefore, the water velocity and specific surface area of the substratum should be considered as potential limiting factors for the growth and accumulation of periphyton.
Figure 8. Principal components analysis (PCA) results using the experimental data from this study: (a) Extracted eigenvalues and cumulative percentage of factors by PCA; (b) Rotated factor loading matrix for factors 1 and 2; (c) Rotated factor loading matrix for factors 2 and 3; (d) Rotated factor loading matrix for factors 1 and 3.
Water 05 01723 g008
Consequently, the growth rate and biomass accumulation for periphyton were considered to be complex functions of nutrient concentrations, water velocities, and substratum characteristics. Even in the same streams and rivers, variations in these factors affecting periphyton accrual and loss may produce heterogeneity in periphyton biomass levels in space and time.

4. Conclusions

For urban rivers and streams with low water flow or excessively deteriorated water quality, the augmentation of new water sources for the preservation and sustainability of urban environments should be considered. In this study, an artificial stream mesocosm experiment was performed to evaluate the effects of water velocity and substratum characteristics on the growth rate and biomass accumulation of periphyton. The experiment was conducted using alternative water sources collected from the Mangwall Stream (MW), the Han River (HR), and bank filtration water (BFW) from the Han River. Based on the results of the annual water quality analysis, the measured concentrations of organic matter and inorganic nutrients in the MW were greater than the measured concentrations of organic matter and inorganic nutrients in the HR and BFW. The specific surface areas of tile, concrete, and pebble were 0.004 ± 0.0001 m2 cm−2, 2.1 ± 0.2 m2 cm−2, and 6.2 ± 0.4 m2 cm−2, respectively. The surface of tile is relatively smooth and nonporous, whereas concrete and pebble exhibit rough surfaces and contain numerous isolated pores with diameters ranging from 10 to 50 µm, in which filamentous periphyton become strongly immobilized on the surface against hydrodynamic shear stress and mat tensile strength.
Based on the results of the artificial stream mesocosm experiment, the periphyton biomass accrual via colonization occurred in the initial phase, followed by exponential growth limited by nutrients, light, and temperature. Compared with the biomass of the HR and BFW, the faster and greater peak periphyton biomass in the MW can be attributed to the higher nutrient concentrations in the MW. Acceptable linear relationships (R2 ≥ 0.69) between water velocity and the total periphyton biomass/growth rate were obtained, which suggests that an increase in water velocity greater than critical values can cause a reduction in biomass accrual. Relatively weak relationships (R2 = 0.24) between specific surface area and total periphyton biomass were obtained for MW1, whereas stronger relationships (R2 ≥ 0.58) between specific surface area and total periphyton biomass were obtained for the HR and BFW. These results indicate that an increase in the specific surface area of the substratum can cause an increase in periphyton biomass in a nutrient-poor water body, whereas an increase in the specific surface area of the substratum does not significantly affect periphyton biomass in a nutrient-enriched water body. Based on the PCA results, nutrient salts (i.e., NH4+, NO3, and PO43−) were the most dominant limiting factor for the growth and accumulation of periphyton, and the water velocity and specific surface area of the substratum should be considered as potential limiting factors. Consequently, the growth rate and biomass accumulation for periphyton were considered to be a complex function of nutrient concentrations, water velocities, and substratum characteristics. The potential relationships between water velocity/substratum characteristics and the biomass accumulation of periphyton should be considered in the selection of alternative water sources.

Acknowledgments

This research was supported by a grant from the Management Plan for the Water Environment of the Detention Reservoir in the Seokmun Industrial Complex and the River Restoration Program for Developing Coexistence between Nature and Humans (Green River) (12technological innovationC02), which were funded by the Korea Land & Housing Corporation and the Korea Institute of Construction & Transportation Technology Evaluation and Planning, respectively.

Conflicts of Interest

The authors declare no conflict of interest.

References

  1. Sun, C.C.; Wang, Y.S.; Wu, M.L.; Dong, J.D.; Wang, Y.T.; Sun, F.L.; Zhang, Y.Y. Seasonal variation of water quality and phytoplakton response patterns in Daya Bay, China. Int. J. Environ. Res. Public Health 2011, 8, 2951–2966. [Google Scholar] [CrossRef]
  2. McCormick, P.V. Soil and periphyton indicators of anthropogenic water-quality changes in a rainfall-driven wetland. Wetl. Ecol. Manag. 2011, 19, 19–34. [Google Scholar] [CrossRef]
  3. McIntire, C.D. Periphyton dynamics in laboratory streams: A simulation model and its implications. Ecol. Mon. 1973, 43, 399–420. [Google Scholar] [CrossRef]
  4. Dos Santos, T.R.; Ferragut, C.; Bicudo, C.E.M. Does macrophyte architecture influence periphyton? Relationships among Utricularia foliosa, periphyton assemblage structure and its nutrient (C, N, P) status. Hydrobiologia 2013, 714, 71–83. [Google Scholar] [CrossRef]
  5. Ishida, C.K.; Arnon, S.; Peterson, C.G.; Kelly, J.J.; Gray, K.A. Influence of algal community structure on denitrification rates in periphyton cultivated on artificial substrata. Microb. Ecol. 2008, 56, 140–152. [Google Scholar] [CrossRef]
  6. Ghosh, M.; Gaur, J.P. Current velocity and the establishment of stream algal periphyton communities. Aquat. Bot. 1998, 60, 1–10. [Google Scholar] [CrossRef]
  7. Montuelle, B.; Dorigo, U.; Bérard, A.; Volat, B.; Bouchez, A.; Tlili, A.; Gouy, V.; Pesce, S. The periphyton as a multimetric bioindicator for assessing the impact of land use on rivers: An overview of the Ardières-Morcille experimental watershed. Hydrobiologia 2010, 659, 123–141. (in France). [Google Scholar]
  8. Dempster, P.W.; Beveridge, M.C.M.; Baird, D.J. Herbivory in tilapia Oreochromis niloticus: acomparison of feeding rates on phytoplankton and periphyton. J. Fish Biol. 1993, 43, 385–392. [Google Scholar] [CrossRef]
  9. Kersters, I.; Vooren, L.V.; Huys, G.; Janssen, P.; Kersters, K.; Verstraete, W. Influence of temperature and process technology on the occurrence of Aeromonas species and hygienic Indicator organisms in drinking water production plants. Microb. Ecol. 1995, 30, 203–218. [Google Scholar]
  10. Serra, A.; Guasch, H.; Admiraal, W.; van der Geest, H.G.V.; van Beusekom, S.A.M. Influence of phosphorus on copper sensitivity of fluvial periphyton: The role of chemical, physiological and community-related factors. Ecotoxicology 2010, 19, 770–780. [Google Scholar] [CrossRef]
  11. Baffico, G.D. Variations in the periphytic community structure and dynamics of Lake Nahuel Huapi (Patagonia, Argentina). Hydrobiologia 2001, 455, 79–85. [Google Scholar] [CrossRef]
  12. Flum, T.; Huxel, G.L.; LaRue, C.S.; Hardison, B.; Duncan, J.R.; Drake, J.A. A closed artificial stream for conducting experiments requiring a controlled species pool. Hydrobiologia 1993, 271, 75–85. [Google Scholar] [CrossRef]
  13. Horner, R.R.; Welch, E.B.; Seeley, M.R.; Jacoby, J.M. Responses of periphyton to changes in current velocity, suspended sediment and phosphorus concentration. Freshw. Biol. 1990, 24, 215–232. [Google Scholar] [CrossRef]
  14. Biggs, B.J.F.; Goring, D.G.; Nikora, V.I. Subsidy and stress responses of stream periphyton to gradients in current velocity as a function of community growth form. J. Phycol. 1998, 34, 598–607. [Google Scholar]
  15. Sekar, R.; Nandakumar, K.; Venugopalan, V.P.; Nair, K.V.K.; Rao, N.R. Spatial variation in microalgal colonization on hard surfaces in a lentic freshwater environment. Biofouling 1998, 13, 177–195. [Google Scholar] [CrossRef]
  16. Godillot, R.; Caussade, B.; Ameziane, T.; Capblancq, J. Interplay between turbulence and periphyton in rough open-channel flow. J. Hydraul. Res. 2001, 39, 227–239. [Google Scholar]
  17. Horner, R.R.; Welch, E.B. Stream periphyton development in relation to current velocity and nutrients. Can. J. Fish. Aqut. Sci. 1981, 38, 449–457. [Google Scholar] [CrossRef]
  18. McIntire, C.D. Some effects of current velocity on periphyton communities in laboratory streams. Hydrobiologia 1966, 27, 559–570. [Google Scholar] [CrossRef]
  19. Labiod, C.; Godillot, R.; Caussade, B. The relationship between stream periphyton dynamics and near-bed turbulence in rough open-channel flow. Ecol. Model. 2007, 209, 78–96. [Google Scholar] [CrossRef]
  20. Dodds, W.K.; Biggs, B.J.F. Water velocity attenuation by stream periphyton and macrophytes in relation to growth form and architecture. J. North. Am. Benthol. Soc. 2002, 21, 2–15. [Google Scholar] [CrossRef]
  21. Herder-Brouwer, S.J. The development of periphyton on artificial substrates. Hydrobiol. Bull. 1975, 9, 81–86. [Google Scholar]
  22. Cullinane, J.; Maguire, D.; Whelan, P. The importance of substrate type in colonization by Cryptonemia hibernica Guiry et Irvine and its associated algae. Hydrobiologia 1984, 116, 438–442. [Google Scholar] [CrossRef]
  23. Zhang, N.; Li, H.; Jeppesen, E.; Li, W. Influence of substrate type on periphyton biomass and nutrient state at contrasting high nutrient levels in a subtropical shallow lake. Hydrobiologia 2013, 710, 129–141. [Google Scholar] [CrossRef]
  24. Lee, J.S. Measuring the economic benefits of residential water quality improvement in Ulsan, Korea using a contingent valuation. Urban Water J. 2013, 10, 1–8. [Google Scholar] [CrossRef]
  25. Jeong, D.I. Trends and multi-decadal variability of annual maximum precipitation for Seoul, South Korea. Urban Water J. 2009, 9, 431–439. [Google Scholar] [CrossRef]
  26. Clinton, B.D.; Vose, J.M. Variation in stream water quality in an urban headwater stream in the southern Appalachians. Water Air Soil Pollut. 2006, 169, 331–353. [Google Scholar] [CrossRef]
  27. Paul, M.J.; Meyer, J.L. Streams in the urban landscape. Ann. Rev. Ecol. Syst. 2001, 32, 333–365. [Google Scholar] [CrossRef]
  28. Magoulick, D.D. Spatial and temporal variation in fish assemblages of drying stream pools: The role of abiotic and biotic factors. Aquat. Ecol. 2000, 34, 29–41. [Google Scholar] [CrossRef]
  29. Kim, B.-H. Ecology of a cyanobacterial mat community in a Korean thermal wastewater stream. Aquat. Ecol. 1999, 33, 331–338. [Google Scholar] [CrossRef]
  30. Harada, S.; Wagatsuma, R.; Koseki, T.; Aoki, T.; Hashimoto, T. Water quality criteria for water bodies in urban areas and accompanying changes in surrounding and in-situ vegetation: considerations from the landscape aspect of planning water recreational areas. J. Water Resour. Prot. 2013, 5, 156–163. [Google Scholar] [CrossRef]
  31. Kumar, S.; Tripathi, V.R.; Garg, S.K. Physicochemical and microbiological assessment of recreational and drinking waters. Environ. Monit. Assess. 2012, 184, 2691–2698. [Google Scholar] [CrossRef]
  32. Massoud, M.A. Assessment of water quality along a recreational section of the Damour River in Lebanon using the water quality index. Environ. Monit. Assess. 2012, 184, 4151–4160. [Google Scholar] [CrossRef]
  33. Kindsvater, C.E.; Carter, R.W.C. Discharge characteristics of rectangular thin-plate weirs. J. Hydro. Div. 1957, 83, 1–36. [Google Scholar]
  34. Wetzel, R.G.; Likens, G.E. Limnological Analysis, 3rd ed.; Springer-Verlag: New York, NY, USA, 2000; pp. 1–429. [Google Scholar]
  35. American Public Health Association (APHA). Standard Methods for the Examination of Water and Wastewater, 21th ed.; APHA: Washington, DC, USA, 2005; pp. 9–72. [Google Scholar]
  36. LeBouf, R.F.; Ku, B.K.; Chen, B.T.; Frazer, D.G.; Cumpston, J.L.; Stefaniak, A.B. Measuring surface area of airborne titanium dioxide powder agglomerates: Relationships between gas adsorption, diffusion and mobility-based methods. J. Nanopart. Res. 2011, 13, 7029–7039. [Google Scholar] [CrossRef]
  37. Talbot, P.; de la Noüe, J. Tertiary treatment of wastewater with Phormidium bohneri (Schmidle) under various light and temperature conditions. Water Res. 1993, 27, 153–159. [Google Scholar] [CrossRef]
  38. Biggs, B.J.F. New Zealand Periphyton Guidelines: Detecting, Monitoring and Managing the Enrichment of Rivers. Background and Guidelines; Ministry for the Environment: Wellington, New Zealand, 2000; pp. 1–122. [Google Scholar]
  39. Scheffer, M.; Rinaldi, S.; Gragnani, A.; Mur, L.R.; Nes, E.H.V. On the dominance of filamentous cyanobacteria in shallow, Turbid Lakes. Ecology 1997, 78, 272–282. [Google Scholar] [CrossRef]
  40. Azim, M.E.; Milstein, A.; Wahab, M.A.; Verdegama, M.C.J. Periphyton-water quality relationships in fertilized fishponds with artificial substrates. Aquaculture 2003, 228, 169–187. [Google Scholar] [CrossRef]
  41. Yentsch, C.S. Distribution of chlorophyll and phaeophytin in the open ocean. Deep Sea Res. 1965, 12, 653–666. [Google Scholar]
  42. Carpenter, S.R.; Leavitt, P.R.; Elser, J.J.; Elser, M.M. Chlorophyll budgets: Response to food web manipulation. Biogeochemistry 1988, 272, 79–90. [Google Scholar]
  43. Alfi, R.; Guiral, D. Chlorophyll budget in a productive tropical pond: Algal production, sedimentation, and grazing by microzooplankton and rotifers. Hydrobiologia 1994, 272, 239–249. [Google Scholar] [CrossRef]
  44. Fovet, O.; Belaud, G.; Litrico, X.; Charpentier, S.; Bertrand, C.; Dauta, A.; Hugodot, C. Modelling periphyton in irrigation canals. Ecol. Model. 2010, 221, 1153–1161. [Google Scholar] [CrossRef]
  45. Whitford, L.A.; Schumacher, G.J. Effect of current respiration and mineral uptake in Spirogyra and Oedogonium. Ecology 1964, 45, 168–170. [Google Scholar] [CrossRef]
  46. Borchardt, M.A.; Hoffman, P.; Cook, P.W. Phosphorus uptake kinetics of Spirogyra fluviatilis (Charophyseae) in flowing water. J. Phycol. 1994, 30, 403–417. [Google Scholar]
  47. Stevenson, R.J. Effects of current and conditions simulating autogenically changing microhabitats on benthic diatom immigration. Ecology 1983, 64, 1514–1281. [Google Scholar] [CrossRef]
  48. Sumina, E.L. Behavior of filamentous cyanobacteria in laboratory culture. Microbiology 2006, 75, 459–464. [Google Scholar] [CrossRef]
  49. Smith, V.H. Low nitrogen to phosphorus ratios favor dominance by blue-green algae in lake phytoplankton. Science 1983, 221, 669–671. [Google Scholar]
  50. Laliberté, G.; Lessard, P.; Noüe, J.; Sylvestre, S. Effect of phosphorus addition on nutrient removal from wastewater with the cyanobacteriom Phormidium bohneri. Bioresour. Technol. 1997, 59, 227–233. [Google Scholar] [CrossRef]
  51. Maria, J.B.; Graca, C. Identification of similar environmental areas in Tagus Estuary by using multivariate analysis. Ecol. Ind. 2006, 6, 508–515. [Google Scholar] [CrossRef]
  52. Liu, C.W.; Lin, K.H.; Kuo, Y.N. Application of factor analysis in the assessment of groundwater quality in a blackpoot disease area in Taiwan. Sci. Tot. Environ. 2003, 313, 77–89. [Google Scholar] [CrossRef]
  53. Yerel, S.; Ankara, H. Application of multivariate statistical techniques in the assessment of water quality in Sakarya River, Turkey. J Geol Soc India 2012, 79, 89–93. [Google Scholar]

