1. Introduction
The operation of multipurpose reservoirs is a challenging task due to the conflicting objectives and uncertainties involved [
1,
2,
3]. Should flood control be involved, the operation is of special interest. There are many techniques which may help dam operators to address this task, including simulation of predefined rules, optimization programming, and combined approaches [
1,
4]. Simulation models are usually more flexible than optimization programming and allow for what-if analyses. Regarding the detail of the simulation model, they enable highly realistic representation of the system. When subjected to forced stochastic inflows, such models, which facilitate risk analysis, may be useful in assisting dam managers in the decision-making process. It should be noted, however, that they require predefined operating rules [
1,
4,
5].
On the one hand, many dams are still operated based on such fixed predefined rules [
2,
6,
7], despite the development of novel optimization techniques, especially evolutionary algorithms. Oliveira and Loucks [
2] and Labadie [
4] offered an explanation for the gap between theory and practice. They showed that dam managers may feel more comfortable with simulation models than optimization models, given that results are easier to interpret, apply and explain to society. In addition, the variety of optimization techniques and need for customization of many such models may discourage dam operators from using them. Operating rules should appear as user-friendly to dam operators as possible in order to be properly applied [
8].
On the other hand, dam operators often apply instructions and targets that are different from those recommended by operating rules, with such modification being based on personal judgment and experience [
2]. Therefore, it is necessary to improve the effectiveness of reservoir operations to optimize the benefits of existing systems [
4]. It is important to perform this task within a more systematic and analytical framework [
7].
Many studies have focused on multipurpose reservoir flood control operations, such as Ngo
et al. [
7], Tavares and Kelman [
9], Guariso
et al. [
10], Lara [
11], Marien
et al. [
12], Turgeon [
13] and De Paes and Brandão [
14], among others.
Many of these studies consider reservoir operation during the entire flood season (in months), and operate at a monthly-to-daily scale [
9,
10,
12,
13,
15,
16]. Given that the flood events that occur in semiarid regions or countries, such as Spain, are relatively short, dams are operated in a short-term framework (days to weeks).
Most of the dams in Spain and other countries are still managed during floods through following predefined operating rules without considering any inflow forecast. The reasons exposed by Oliveira and Loucks [
2] and Labadie [
4] cited above may explain the fact that dam operators prefer predefined rules. Spanish regulations related to dam projects, construction and operation set limits on the released outflows so that they do not exceed inflows, which reduces the effectiveness of optimization algorithms based on inflow forecasts. On the other hand, reservoir operation involving inflow forecasting is a complex problem because of the difficulty in obtaining reliable forecasts [
17]. Additionally, dam operators may be reluctant to incorporate uncertainty of forecasts in the decision-making process because of legal considerations. They may feel better protected legally if mandatory rules, such as the Dam Master Plan and the technical regulations, are followed [
18]. Only a few of the cited papers analyze the short-term operation during flood events, with most being oriented to real-time operation, including inflow forecasting [
19,
20,
21]. Thus, these methodologies, it could be argued, may be inappropriate in evaluating the performance of predefined strategies such as those considered in this work.
Additionally, many of the studies conducted in this research area used a relative short inflow series to assess the behavior of a certain operating rule ([
7,
14,
16,
22], among others). The conclusions achieved regarding the performance of flood control strategy may be limited to similar hydrological scenarios. To tackle this issue, Bianucci
et al. [
23] proposed a risk-based approach for calibrating the parameters of a flood control operation optimization model. The philosophy of that methodology is applied in this paper for comparing hydropower reservoir flood control operating rules. An explicit multiobjective approach, based on dominance criteria, is used here instead of an aggregation method.
The main question we tackled was how to compare flood control policies for hydropower reservoirs, in order to select the most suitable one, considering the uncertainty associated with flood determination. The specific aim was to compare user-defined flood control operating rules for a hydropower reservoir, incorporating the multiobjective and stochastic nature of the problem. Additionally, the parameterization of these strategies was carried out in order to improve the current reservoir operation. The goal of this paper was to combine existing methodologies to provide a systematic tool for assessing and comparing, in a multiobjective and probabilistic framework, predefined or user-defined short-term flood control operating rules which do not include flood forecasting.
In this work, it should be noted that the terms “strategy,” “operating rule” and “policy” are considered to have a certain degree of overlap.
2. Methodological Framework
The shape of inflow hydrographs affects the peak outflow reduction with regard to inflow hydrograph volume and flood control storage capacity [
24]. As the flood event that will force the system is not known a priori, a probabilistic procedure is proposed to assess the overall functioning of predefined operating rules. Their performances are evaluated not for a particular event but for an ensemble of hydrographs, considering an implicit approach. If a deterministic approach is used, the conclusions obtained regarding the operation’s performance are limited to similar hydrological scenarios (stochastic nature).
Operation of a reservoir is a multivariate problem. Since such a system is fed with a representative ensemble of hydrographs, a complex data structure is obtained as a result. To characterize some aspects of its functioning, some variables of interest should be defined. Thus, of the question is which variable may characterize the model’s behavior to compare different operating rules. For example, peak flow released, maximum water level, or energy produced, among others, may be chosen.
Under a deterministic analysis, one strategy may perform better in terms of the maximum water level, while another operating rule, for the same flood event, may provide a safer released flow. On the other hand, selection of only one variable to characterize the functioning of the policy would be an inefficient manner of comparing operating rules in a stochastic framework. The reason would be that while a given operating rule offers a lower maximum reservoir level than another strategy for a certain flood episode, it could produce worse behavior under a different scenario.
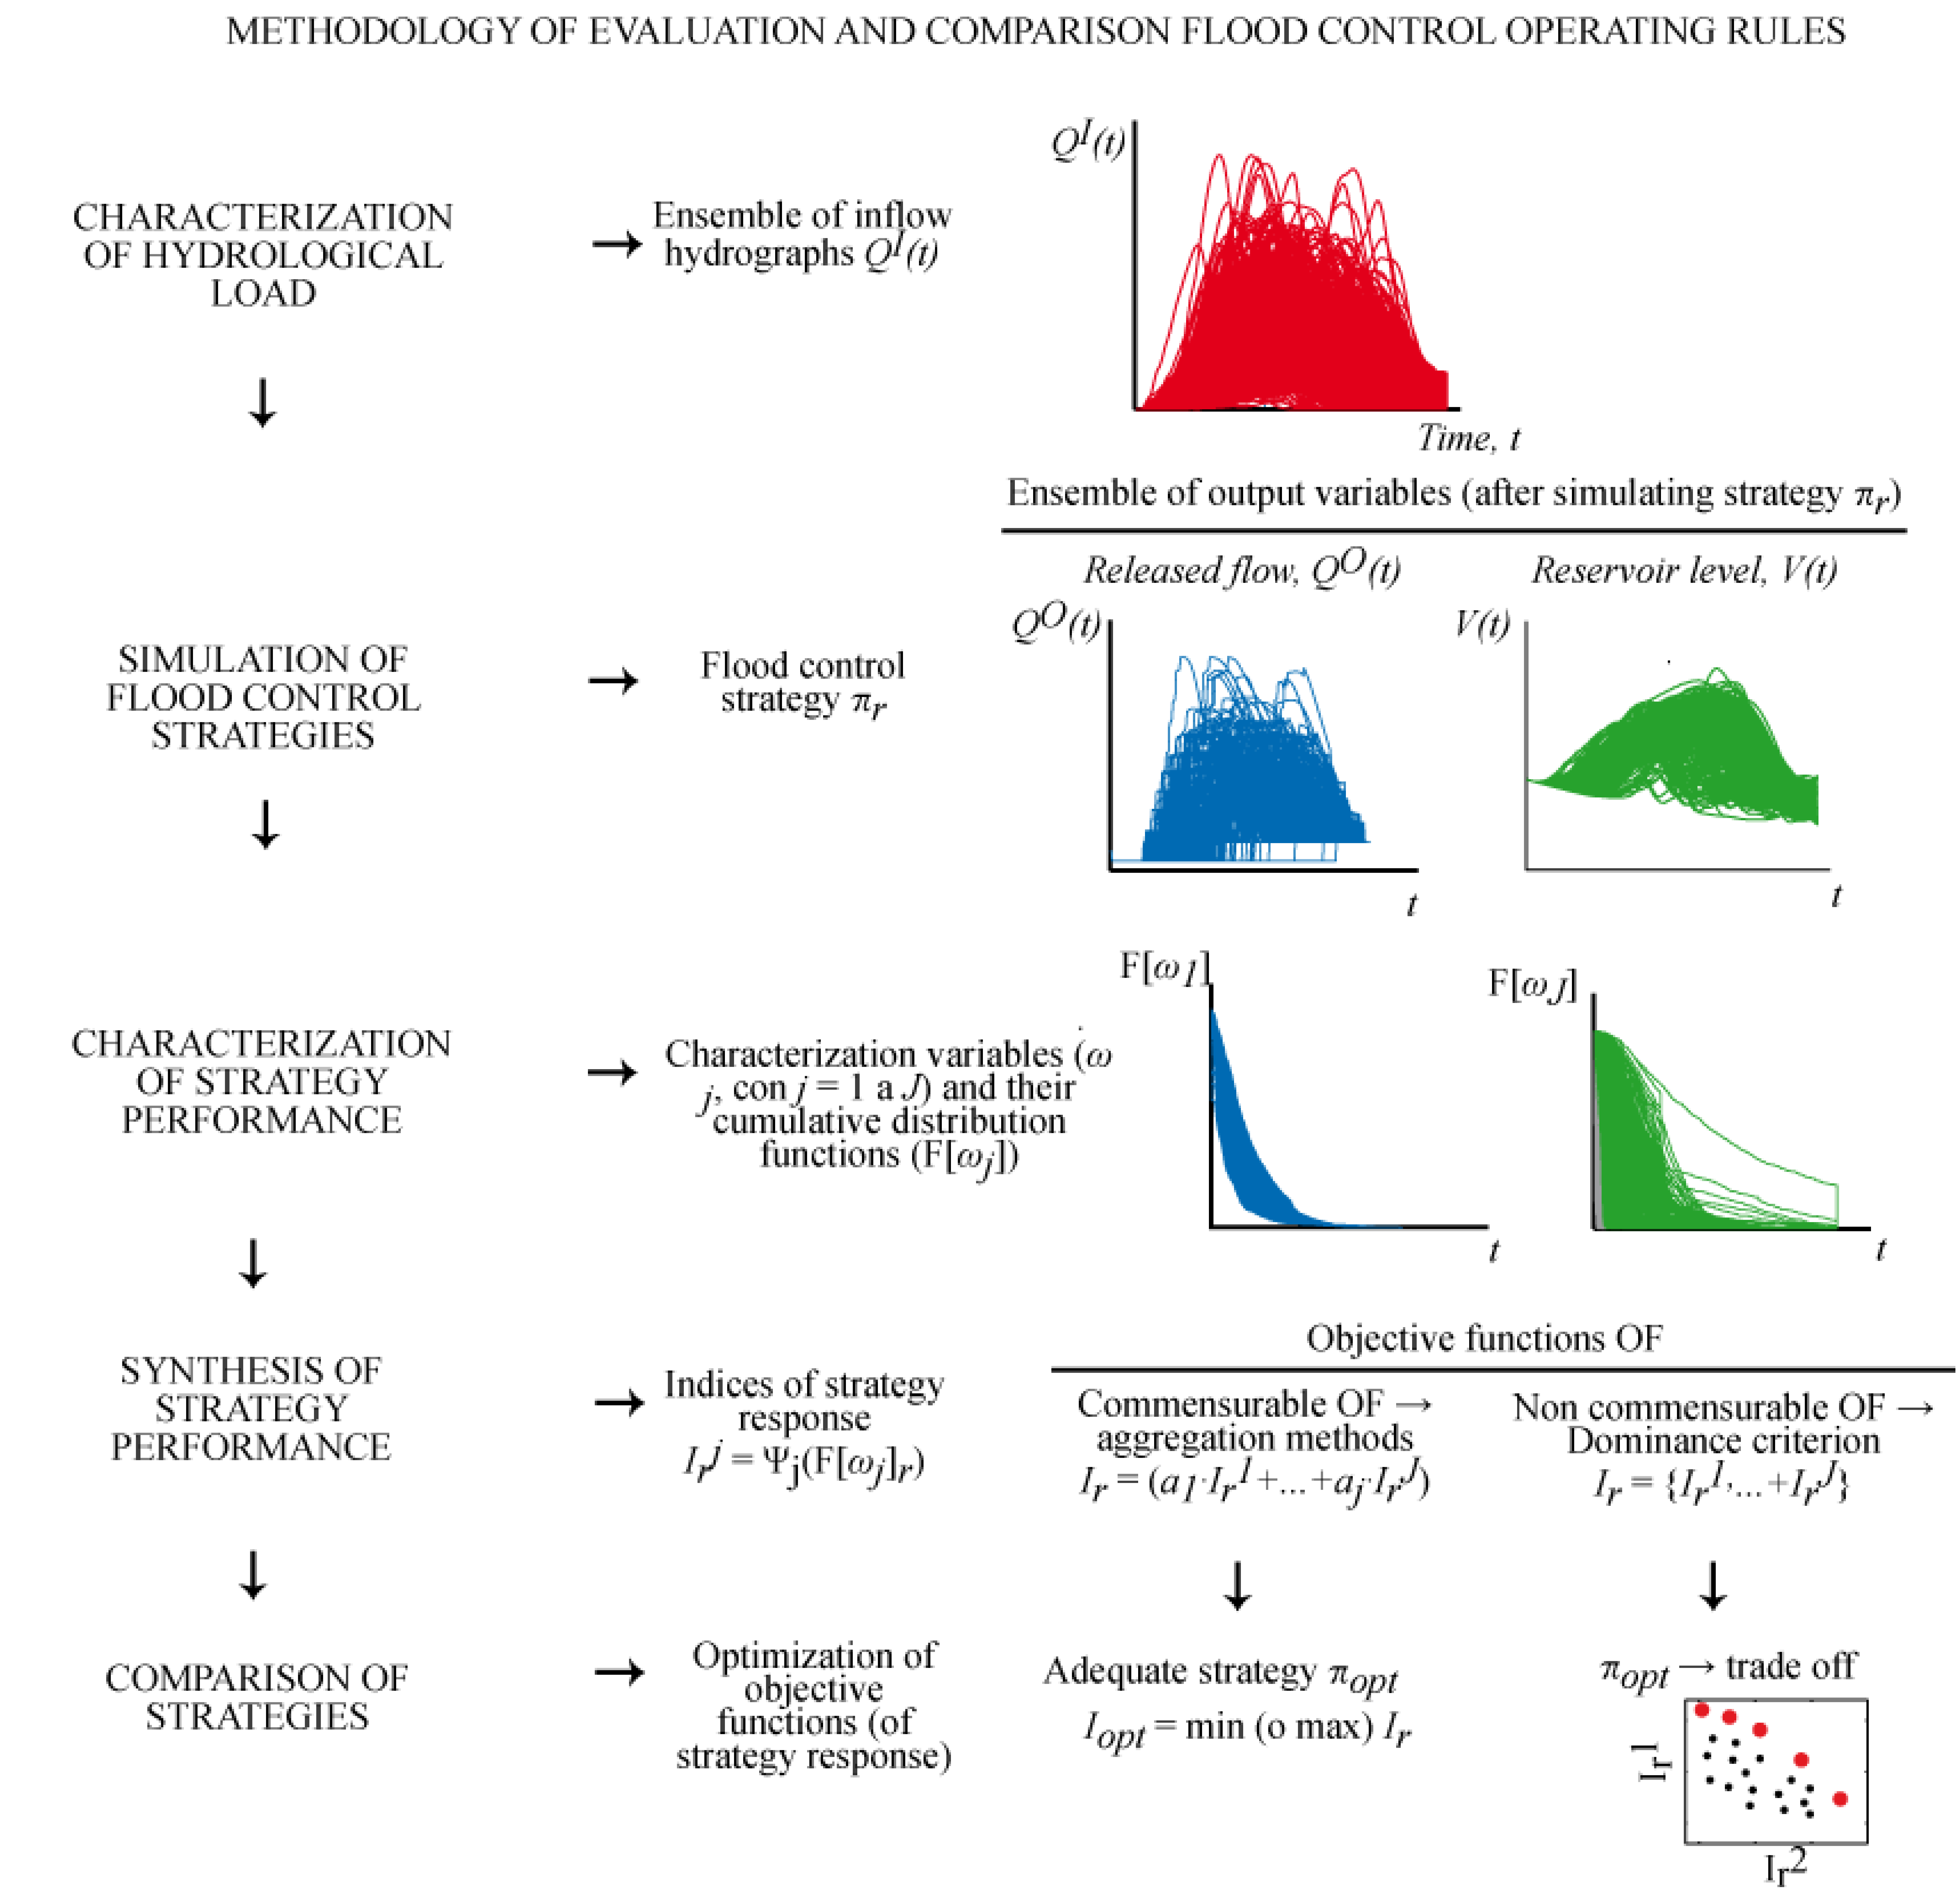
Under the stochastic approach (
Figure 1), the probability distribution function of the characterization variables may be determined. Although this reduces the dimension of the data structure, it is still difficult to manage and, consequently, to be used for comparing operating rules. Then, the relevant information of those distribution functions should be synthesized in one (aggregated method) or a few indices (Pareto criterion). Objective functions (OF) are defined based on these indices. If the multiobjective approach is applied, compromise solutions (Pareto front) arise from contrasting the different OFs. The Pareto fronts provide a rational basis for decision-makers.
Figure 1.
Conceptual framework.
Figure 1.
Conceptual framework.
3. Methodology Implementation
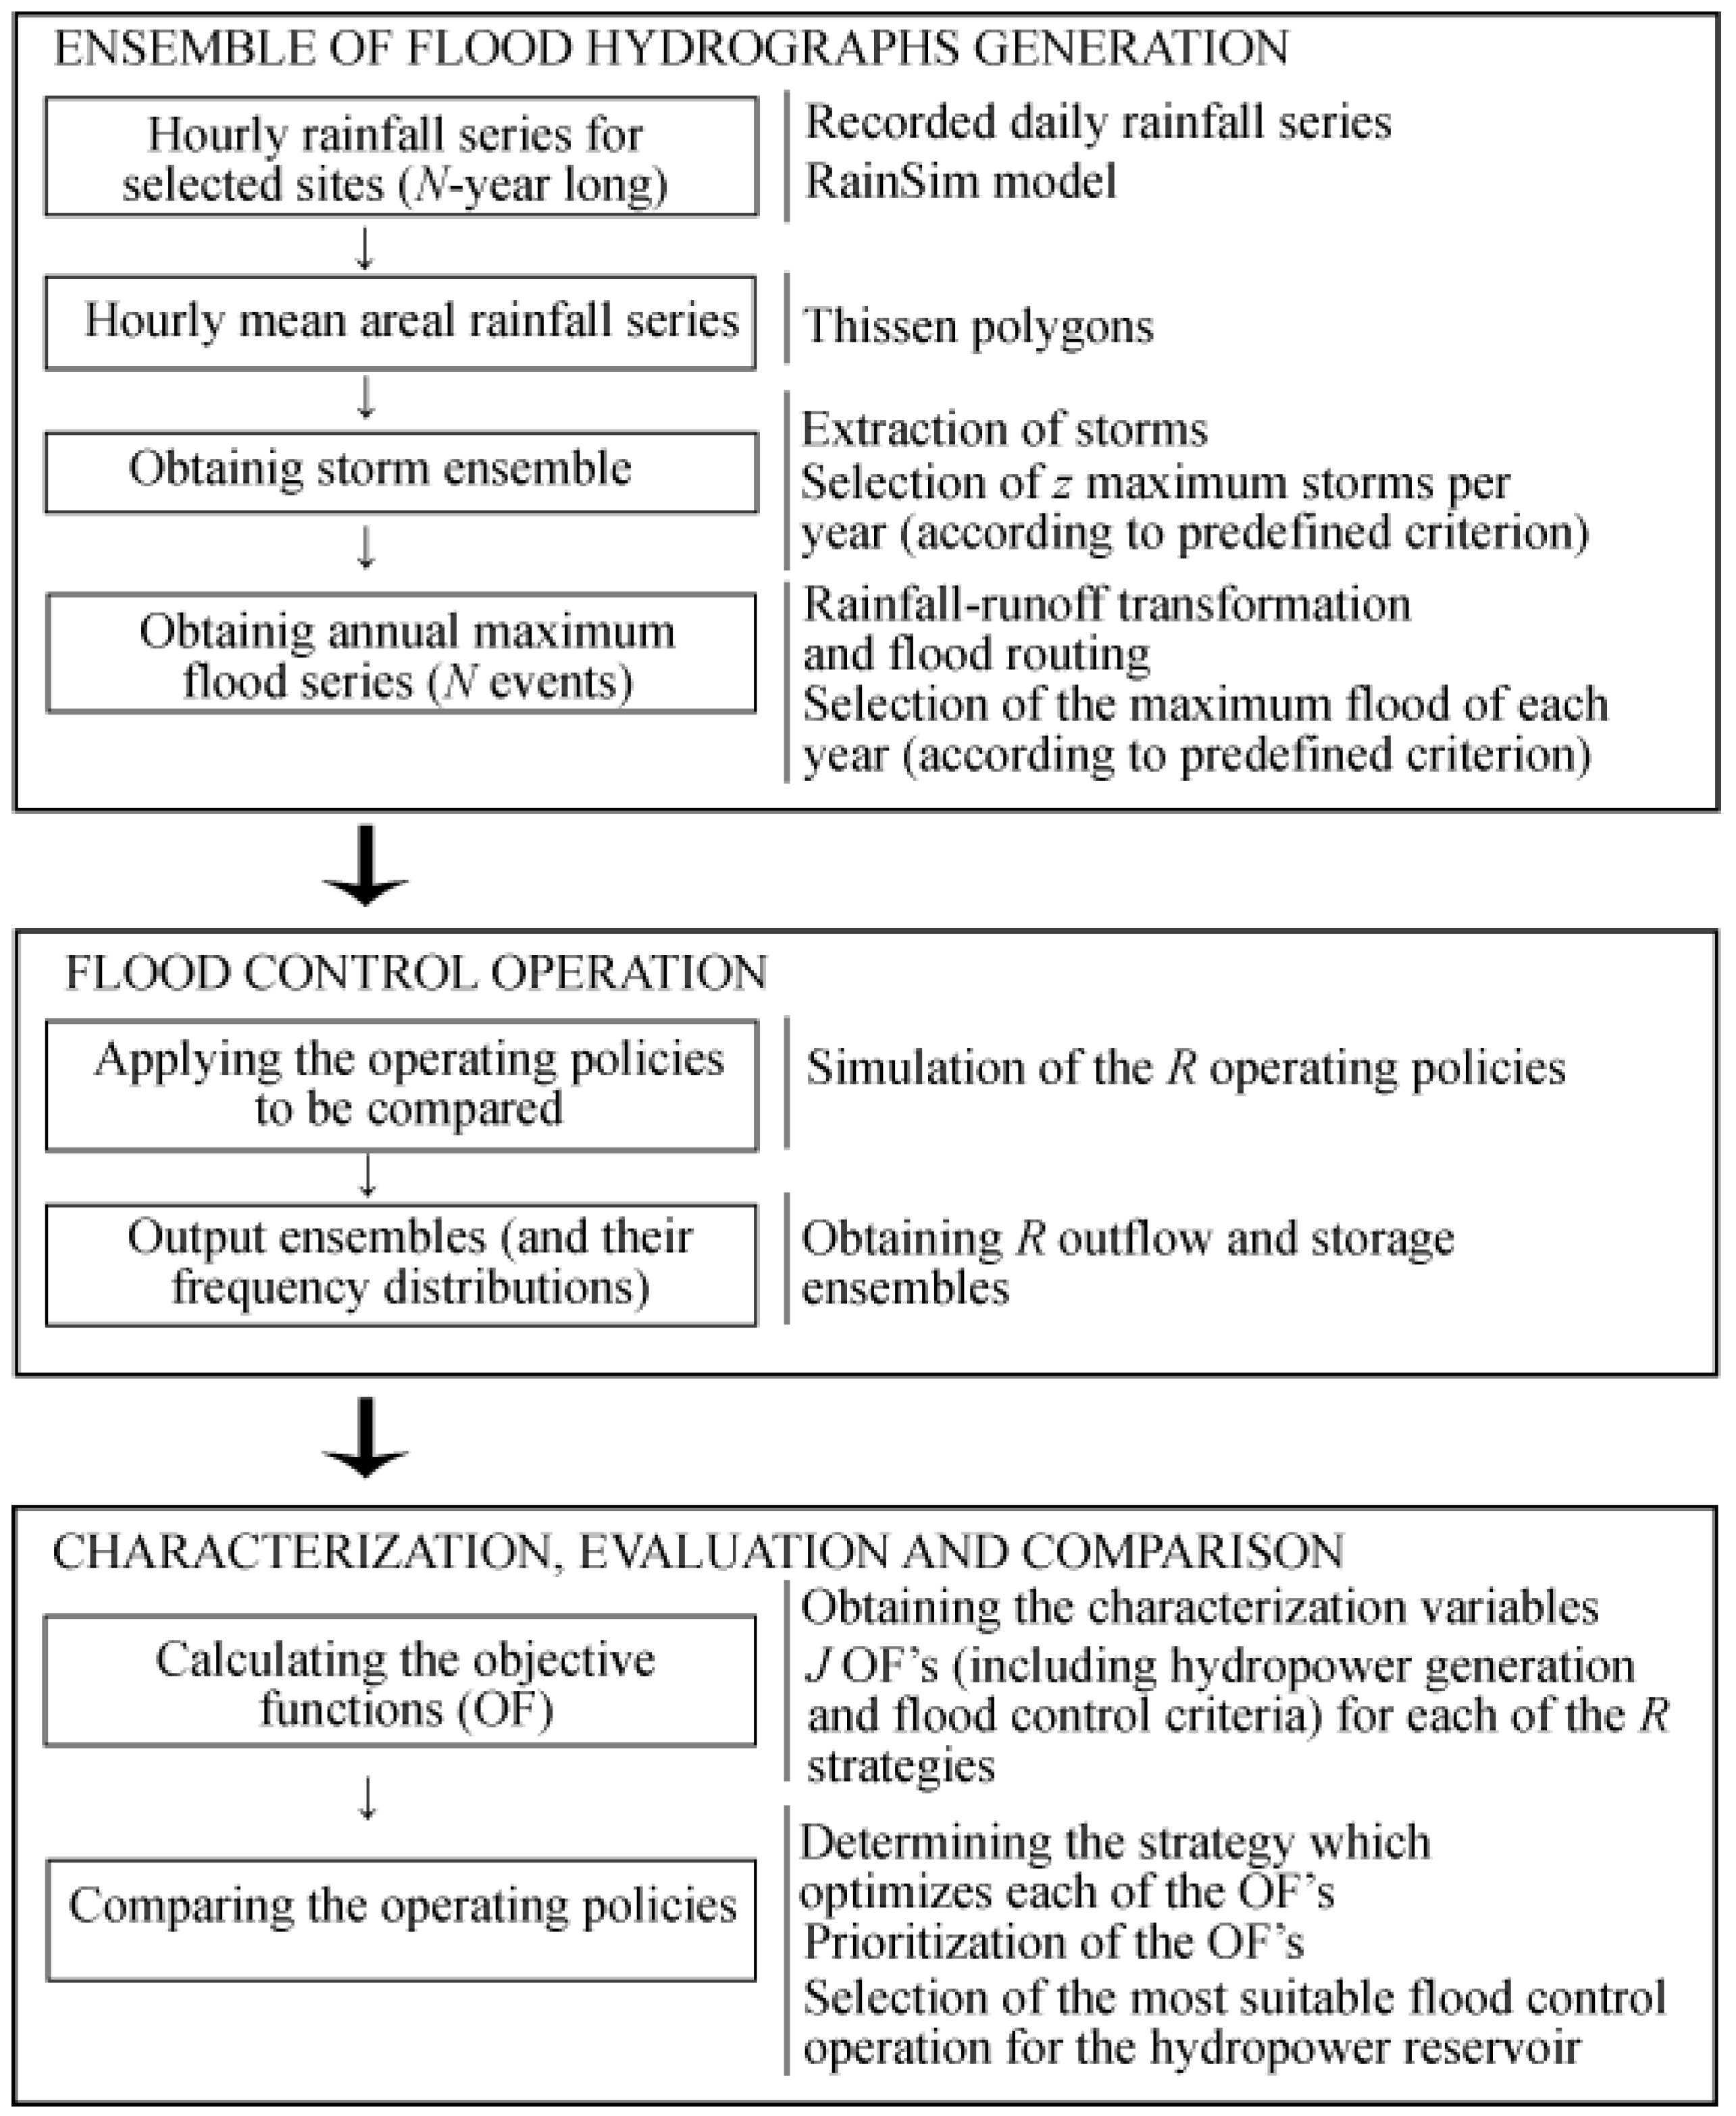
The methodology was implemented in three modules (
Figure 2): Generation of the hydrological load, simulation of flood control operations, and evaluation of these strategies from a multiobjective and probabilistic perspective.
3.1. Ensemble of Flood Hydrograph Generation
Given that hydrological load is one of the main sources of uncertainty, determination of the ensemble of flood hydrographs is essential. The series of annual maximum floods is considered to evaluate the performance of the respective operating rules. Each flood event belonging to that series is independent from the others and is assumed to be the most severe event of the corresponding year.
Figure 2.
Scheme of the evaluation and comparison procedure.
Figure 2.
Scheme of the evaluation and comparison procedure.
The mean areal rainfall series, having a length of
N years and an hourly time step, was determined by means of applying the Thiessen polygon method to the hourly rainfall series of selected rainfall gauge sites. These hourly rainfall series were generated by applying the RainSim v3 model [
25,
26] to the recorded daily series of the corresponding sites. Such a procedure allows the generation of an arbitrarily long continuous rainfall series. One series of
N years of duration per rainfall gauge site was generated. Observed rainfall series should be long enough to ensure an appropriate representation of the actual hydrological conditions. The minimum required length is 40 years, but this figure depends on the characteristics of the particular catchment. The stationarity assumption is adopted in this work, since there is no clear evidence of trends in the main statistical properties of rainfall series. Potential nonstationarity of rainfall data can be addressed through the transient rainfall simulation methodology presented by Burton
et al. [
27], where they used the RainSim model to combine dynamical and statistical downscaling techniques to produce transient climate change scenarios.
Then, the
z maximum storms were extracted every year from the mean areal rainfall series. The storm events are multivariate entities, and may be characterized by the total depth, storm duration, and mean intensity, among others. Therefore, to determine the “maximum” storm, a criterion must be established, with the value of
z depending on this criterion. As the objective of this is to generate the annual maximum flood series, two criteria were chosen: total depth and mean intensity. All these events (2·
z·
N) were transformed into flood hydrographs through applying a hydrological model (rainfall-runoff transformation and flood routing) based on the framework proposed by Sordo-Ward
et al. [
28,
29,
30].
This procedure proposed a Monte Carlo environment to define the storm events, which were coupled with the hydrological model to obtain the corresponding hydrographs. This is a semi-distributed (sub-catchment based) event-based model. While a detailed description may be found in Sordo-Ward
et al. [
28,
29,
30], in this paper only a brief explanation is provided.
First, a random sample of
N values of probability of occurrence (
p) is generated (to obtain N events, one per year of the series). The maximum daily precipitation associated with each value of
p for each sub-catchment is estimated according to the extreme value distribution SQRT-ETmax [
31,
32]. For a selected storm duration
D, the corresponding values of total rainfall volume are determined and based on the regionalized intensity-duration-frequency curves (IDF) proposed by the Spanish Ministry of Public Works [
33] and recommended by the Spanish National Committee on Large Dams [
34]. These rainfall volumes are distributed within the duration
D by applying an autoregressive moving average (ARMA) model. Therefore, a sample of
N storm events with duration
D and probability of occurrence
p is obtained.
Then, these hyetographs are transformed into flood hydrographs through the hydrological model. The rainfall-runoff transformation is conducted by the curve number method [
35]. In order to generate the hydrographs, the soil conservation service (SCS) dimensionless unit hydrograph procedure [
35] is applied. The respective flood routing is performed by applying the Muskingum method [
36] to obtain an ensemble of
N hydrographs at the catchment outlet. The whole procedure is repeated by using selected values of
D to estimate the storm events which cause the maximum flood each year.
In this work, the RainSim model was used to avoid the need for assumptions related to storm duration and shape. This procedure (hyetographs extracted from a rainfall series generated by using the RainSim model) replaced the process proposed by Sordo-Ward
et al. [
28] based on the SQRT distribution and the ARMA model. Then, the obtained hyetographs were transformed into hydrographs by applying the hydrological model mentioned above.
Finally, the maximum flood event of each year was selected. Analogously to the storm events, flood hydrographs are multivariate (peak flow, flood volume, and total duration, among others). The annual maximum flood series may be defined by using a univariate variable (peak flow, flood volume,
etc.) regarding the characteristics of the dam-reservoir system [
37].
3.2. Flood Control Operating Policies
R strategies were implemented through if-then-else statements. These involve either inflow-driven strategies, reservoir level-driven rules or both. The action (gate opening) proposed by the models at any time interval is based on the recent (previous interval) information about the reservoir level and/or inflows. Simulations were conducted by forcing the system with the generated flood ensemble and following the predefined operating policies.
These rules were evaluated by applying the procedure presented in the next section, which is based on the distribution functions of the characterization variables.
The operating policies were then parameterized through varying some key parameters within a given range. Each “new” strategy was simulated and evaluated by using the same procedure as that explained to assess the two “original” rules. The parameterization and subsequent assessment enabled definition of an alternative operating rule. This alternative strategy should improve some aspects of dam operations without making other aspects worse.
3.3. Characterization, Evaluation and Comparison
As previously stated, the evaluation procedure seeks to address the stochastic and multiobjective nature of the flood control problem in hydropower reservoirs rather than assess performance for reduced number of flood hydrographs [
7,
14,
16,
22,
38].
In order to address such issues, the empirical distribution functions of variables of interest (characterization variables) were calculated. Each characterization variable describes a selected part of the problem (
Table 1).
Table 1.
Variables considered that characterize aspects of the hydropower flood control operations.
Table 1.
Variables considered that characterize aspects of the hydropower flood control operations.
| Characterization Variable | Objective Function |
|---|
| Peak released flow (Qmax) | Minimize risk of flooding downstream (R1) |
| Maximum level in the reservoir (Nmax) | Minimize risk of overtopping (R2) |
| Mean daily number of gate maneuvers (during the flood peak) (M) | Minimize gate operations during the flood peak (EV1) |
| Released volume through spillways (U) | Minimize unproductive spillages (EV2) |
| Gross generated energy (E) | Maximize hydropower (EV3) |
Then, five indices were defined with each assessing one particular part of the problem (Equations (1)–(5)). They were formulated, regarding the characterization variable considered, as risk of failure or expected values [
10,
13,
15]. The definition of risk considered here refers to the probability of loading exceeding the system resistance [
39]. In short, each index summarized one aspect of the behavior of the strategy for the whole ensemble of flood hydrographs.
The index
i indicates the position of the variables in the corresponding ordered series,
N represents the length of the series (in years), with
prob meaning probability. The remaining variables were previously defined (see
Table 1).
The operating rules were then compared by contrasting these indices. If one single operating rule optimizes (maximizing/minimizing) the five objective functions simultaneously, it may be considered the most suitable one. However, in practice, one strategy may improve one or a certain number of objectives while worsening the others. Thus, as a set of compromise solutions arises, further prioritization among the objectives should be established by decision-makers in order to select one operating policy.
The aspects to be assessed responded to Belesar Dam managers’ interests. Also, they agreed with the critical values for defining R1 and R2.
This methodology provides a systematic procedure in evaluating and comparing flood control operations in hydropower reservoirs. It also allows for a rational basis in the decision-making process for the dam managers.
4. Case Study
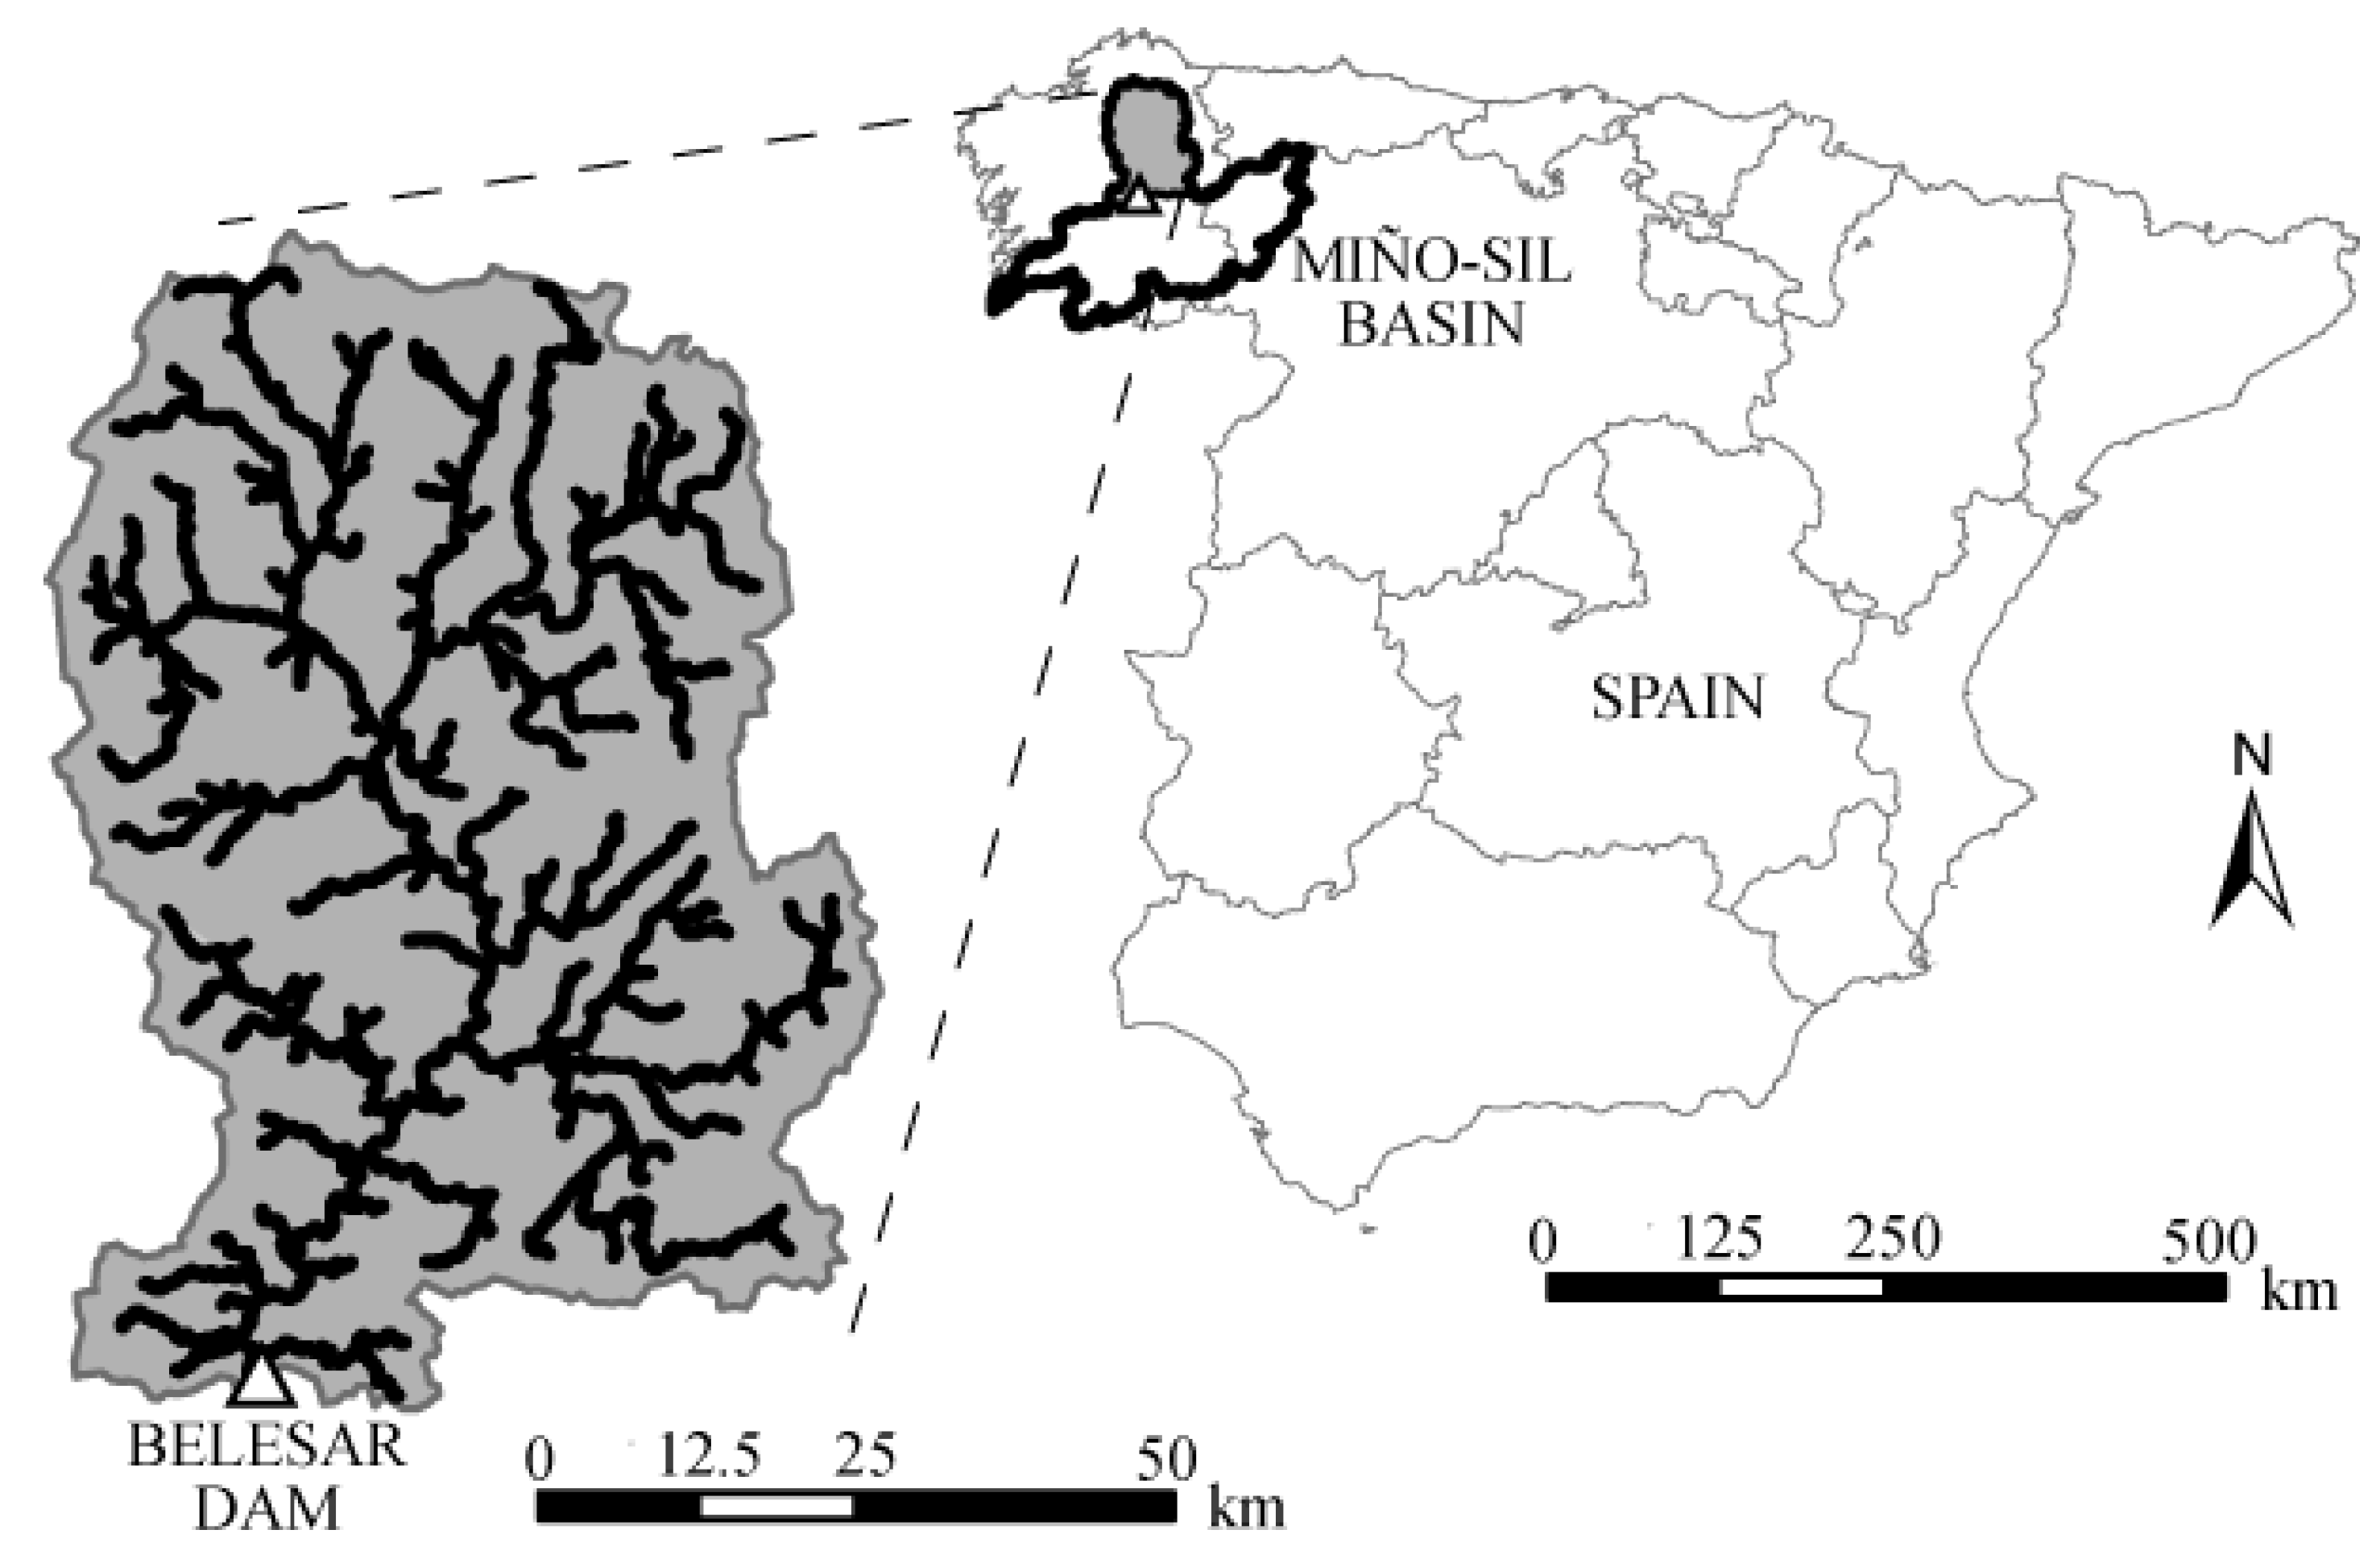
The Belesar Dam was chosen as a case study. It is located on the Miño River, Miño-Sil Basin in northwest Spain (
Figure 3). Administratively, Spain is divided into autonomous regions, which are shown in the map. The Miño-Sil Basin covers part of three autonomous regions. Its catchment has an area of 4200 km
2 and the mean annual flow is 100 m
3/s. Observed rainfall series of 24 to 67 years long were used to generate the synthetic rainfall series by means of the RainSim model.
Figure 3.
Case study location.
Figure 3.
Case study location.
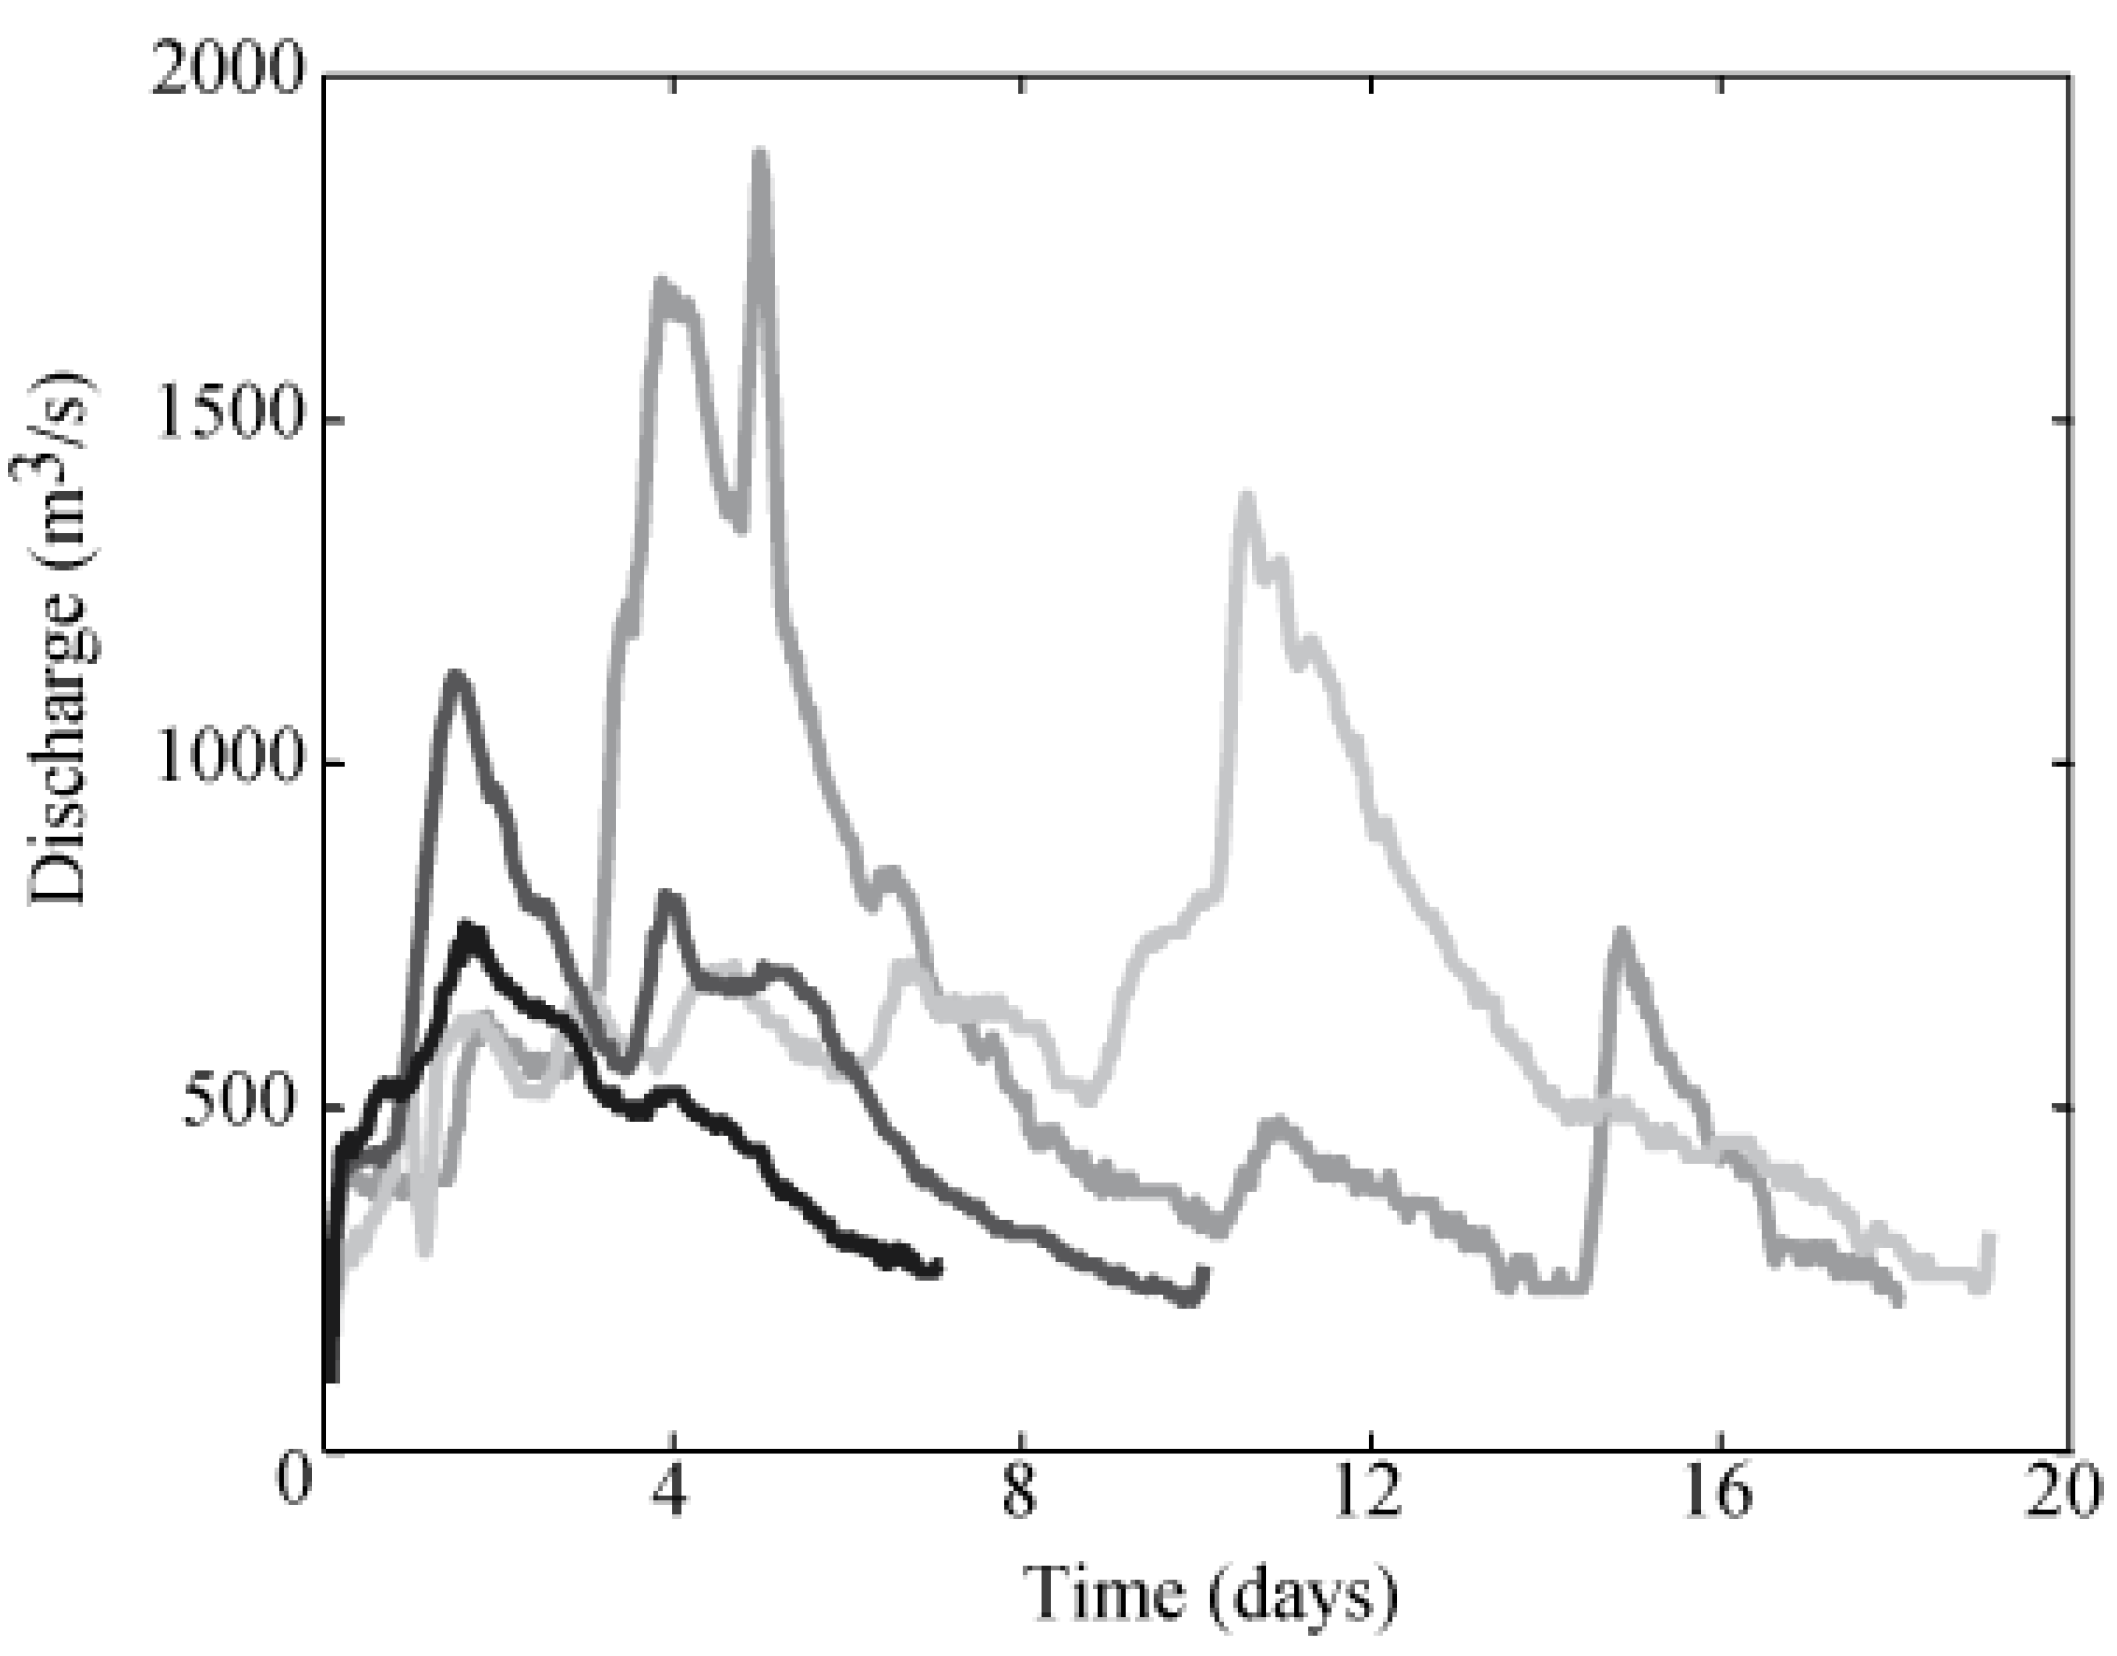
The dam operator provided data from 13 observed floods at the Belesar Dam; The peak flow and volume were compared with those of the synthetically generated flood sample. Typical flood events at the basin last between one and two weeks (
Figure 4).
The Belesar Dam managers and the authors agreed upon the range of magnitudes of interest for the study, associated with return periods (Tr) between 5 and 100 years. With this in mind, N was set at 1000 years (with 1 < Tr < 1000 years) in order to cover that range adequately.
As the flood events considered are relatively short (fast response basin), the time step adopted in this work was one hour for both hydrograph generation and reservoir operation.
Figure 4.
Examples of recorded flood hydrographs at the Belesar Dam.
Figure 4.
Examples of recorded flood hydrographs at the Belesar Dam.
4.1. Reservoir Characteristics
The main purposes of the Belesar Dam are hydropower generation and flood control. The dam has two gated spillways (10 m-high) with a total discharge capacity of 3700 m3/s. The maximum flood control level (FCL) is 330 m (storage = 654 × 106 m3). The maximum (MOL) and minimum operating levels are 327.5 m (608 × 106 m3) and 262.5 m (48 × 106 m3), respectively. The crest dam level (CDL) is 332 m (692 × 106 m3).
The target limit discharge (TLD) was set as 1600 m3/s being based on the Dam Master Plan and the experience of the dam operators. In this case, the TLD was defined in a section immediately downstream of the dam as a measure of non-damaging flow for the downstream river. The TLD was defined to make this measure of the system resistance comparable with the loading (released flow).
Six rain-gauges located in the basin were considered as inputs to the RainSimV3 model. The daily rainfall records were obtained from the Spanish Meteorological Agency (AEMET). The length of these rainfall series ranged between 24 and 67 years.
The value of z was set as three. This value was chosen to guarantee that the storm event which causes the maximum flood in each year is included. Although the authors recognize the importance of this assumption, it is out of the scope of this paper to analyze the effect of z in the flood frequency curve. This topic is being developed in other studies conducted by the authors and other researchers. It is important to keep in mind that the main objective of this task is to provide a representative sample of hydrographs useful to probabilistically compare flood control operating rules.
4.2. Flood Control Operations
In order to test the proposed methodology, two alternative operating rules were considered (R = 2) that are complex predefined operating rules based on if-then-else statements. These strategies differ in three key parameters: MOL, minimum time step between consecutive gate maneuvers, and maximum increase in gate opening. These operating rules are based on flood routing studies previously conducted by dam managers to develop the Dam Master Plan.
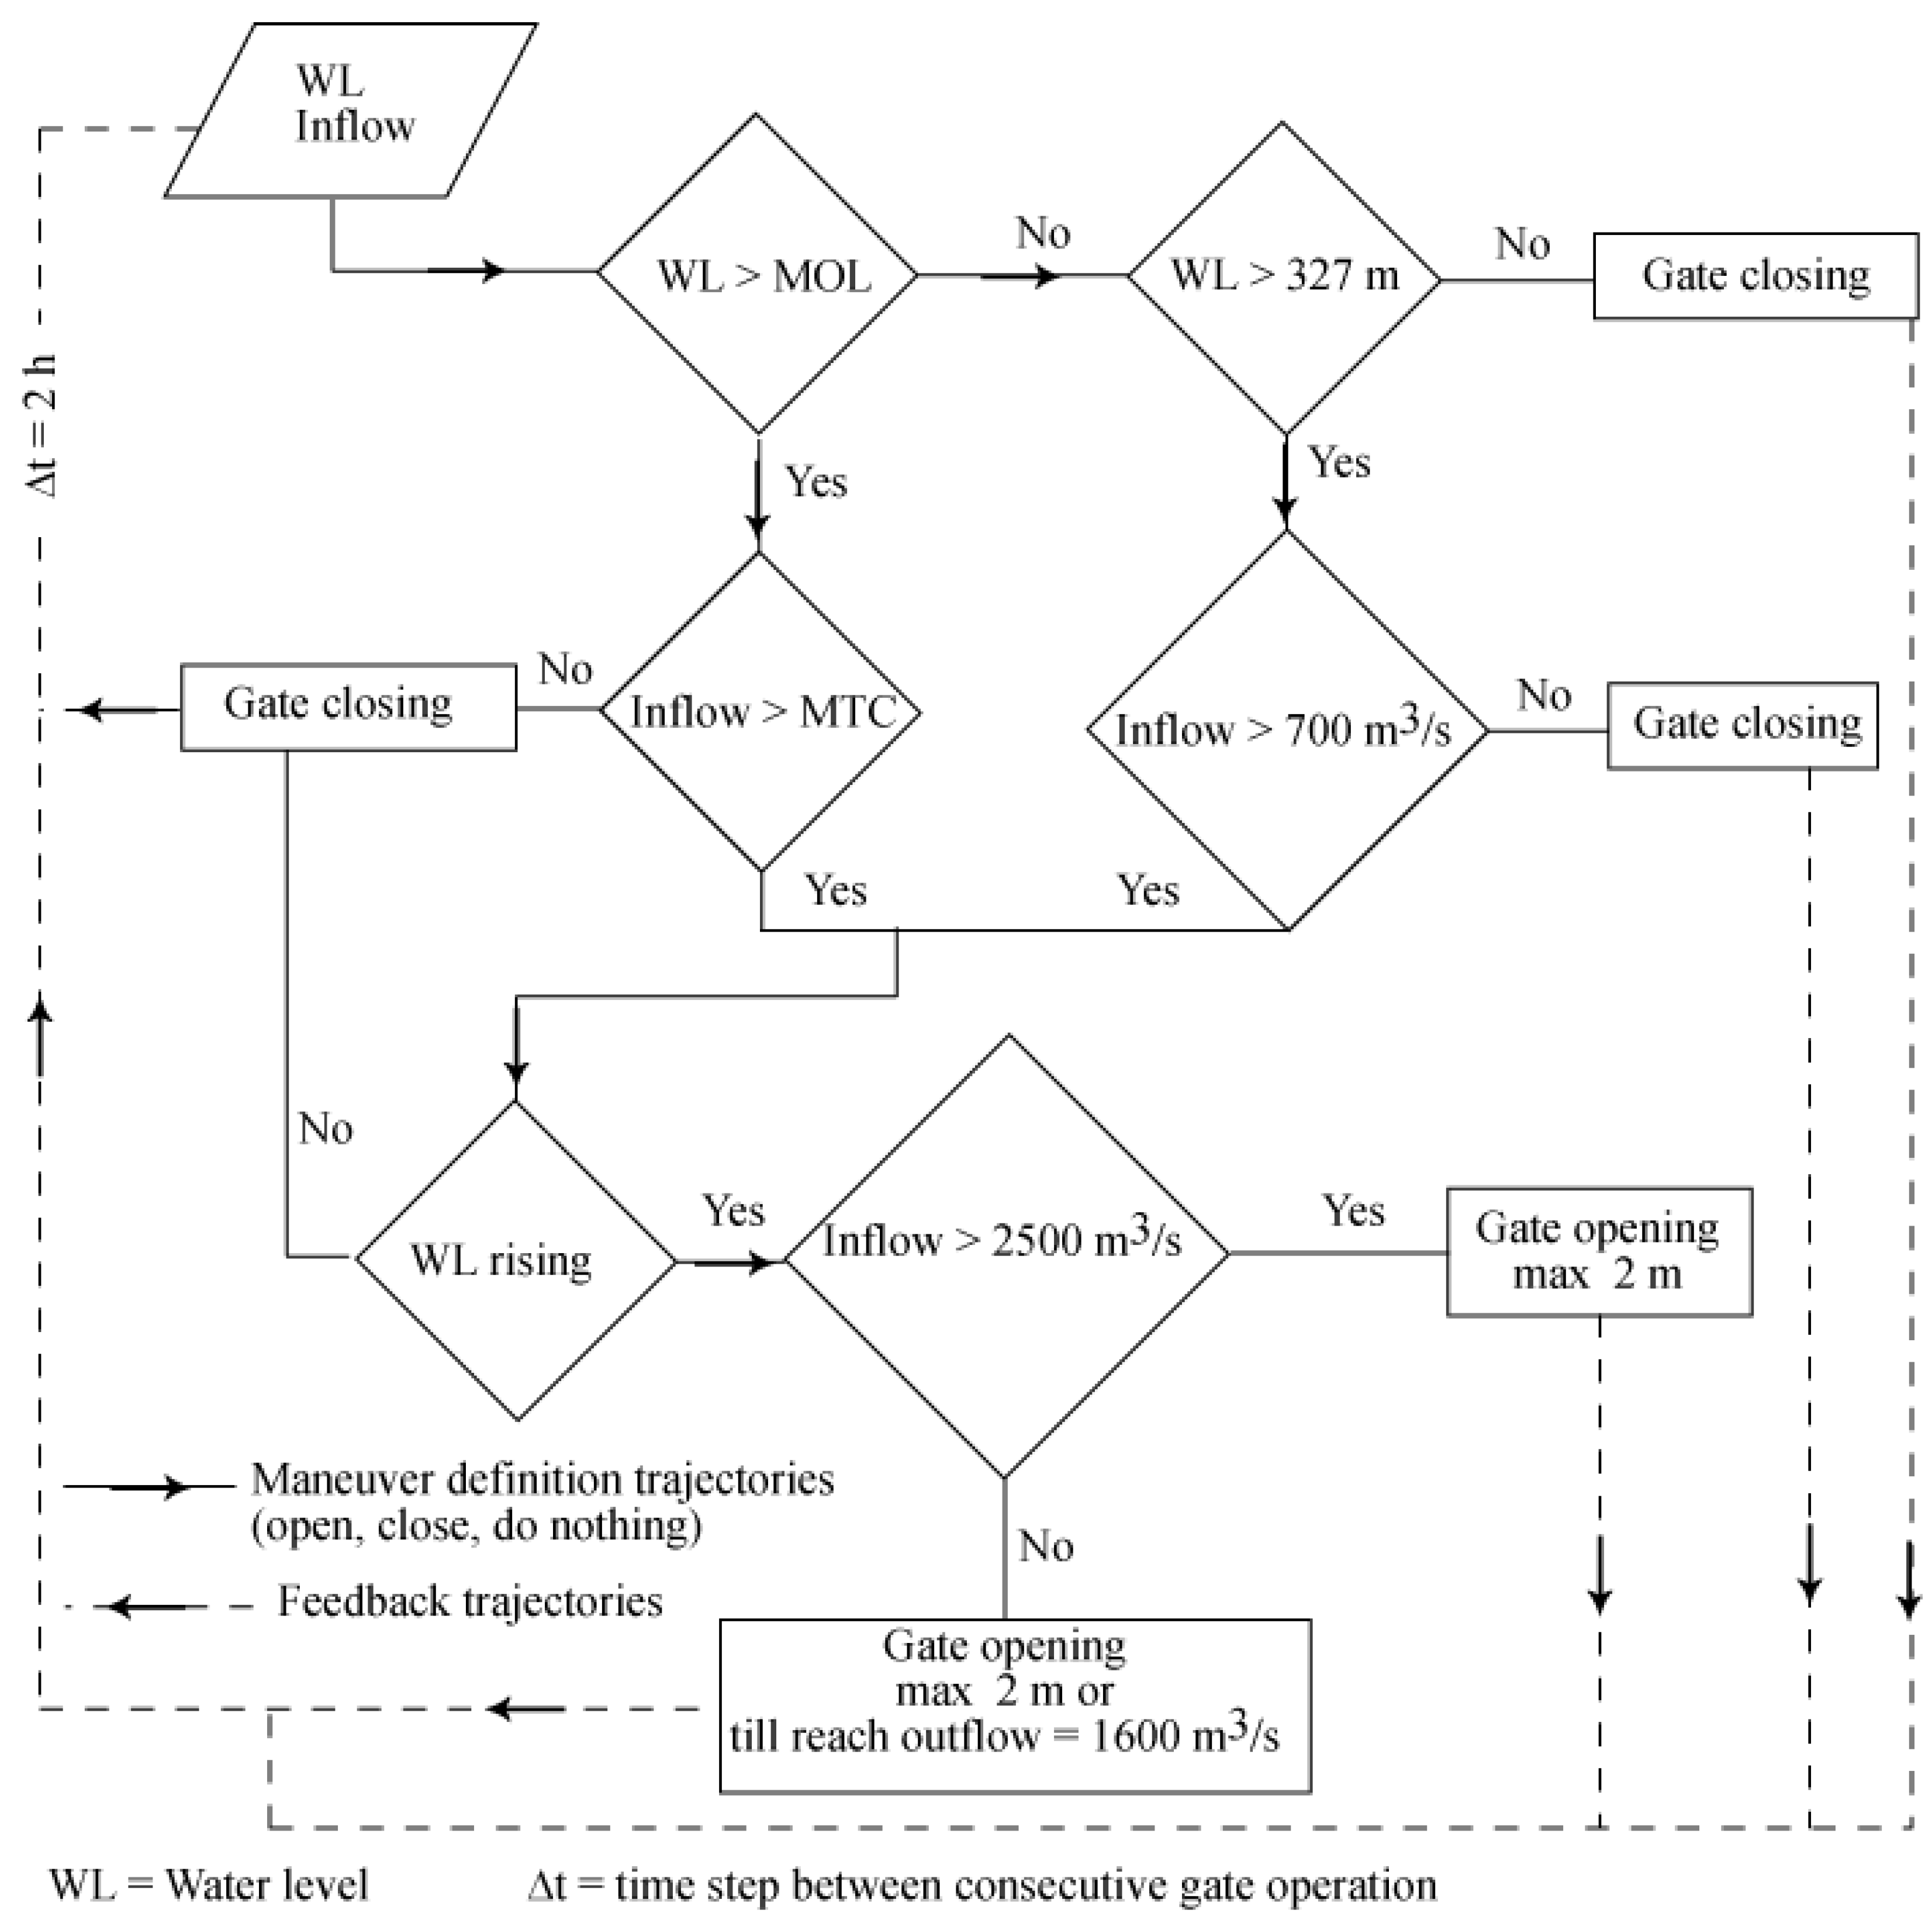
The first operating rule, identified as S1 (
Figure 5), considers beginning gate opening when the level in the reservoir reaches the MOL and inflow exceeds the maximum turbine capacity (MTC). Should the level be under the MOL but above 327 m while the inflow exceeds 700 m
3/s, the spillway gates are also opened. If the level drops below 327 m, the gates are closed regardless of inflow. The maximum increase (or decrease) in the gate opening (or closing) in a single maneuver is 2 m. The minimum time step between consecutive maneuvers is two hours. For inflows less than 2500 m
3/s the outflows are limited to 1600 m
3/s.
Figure 5.
Flow chart schematizing the functioning of the S1 operating rule.
Figure 5.
Flow chart schematizing the functioning of the S1 operating rule.
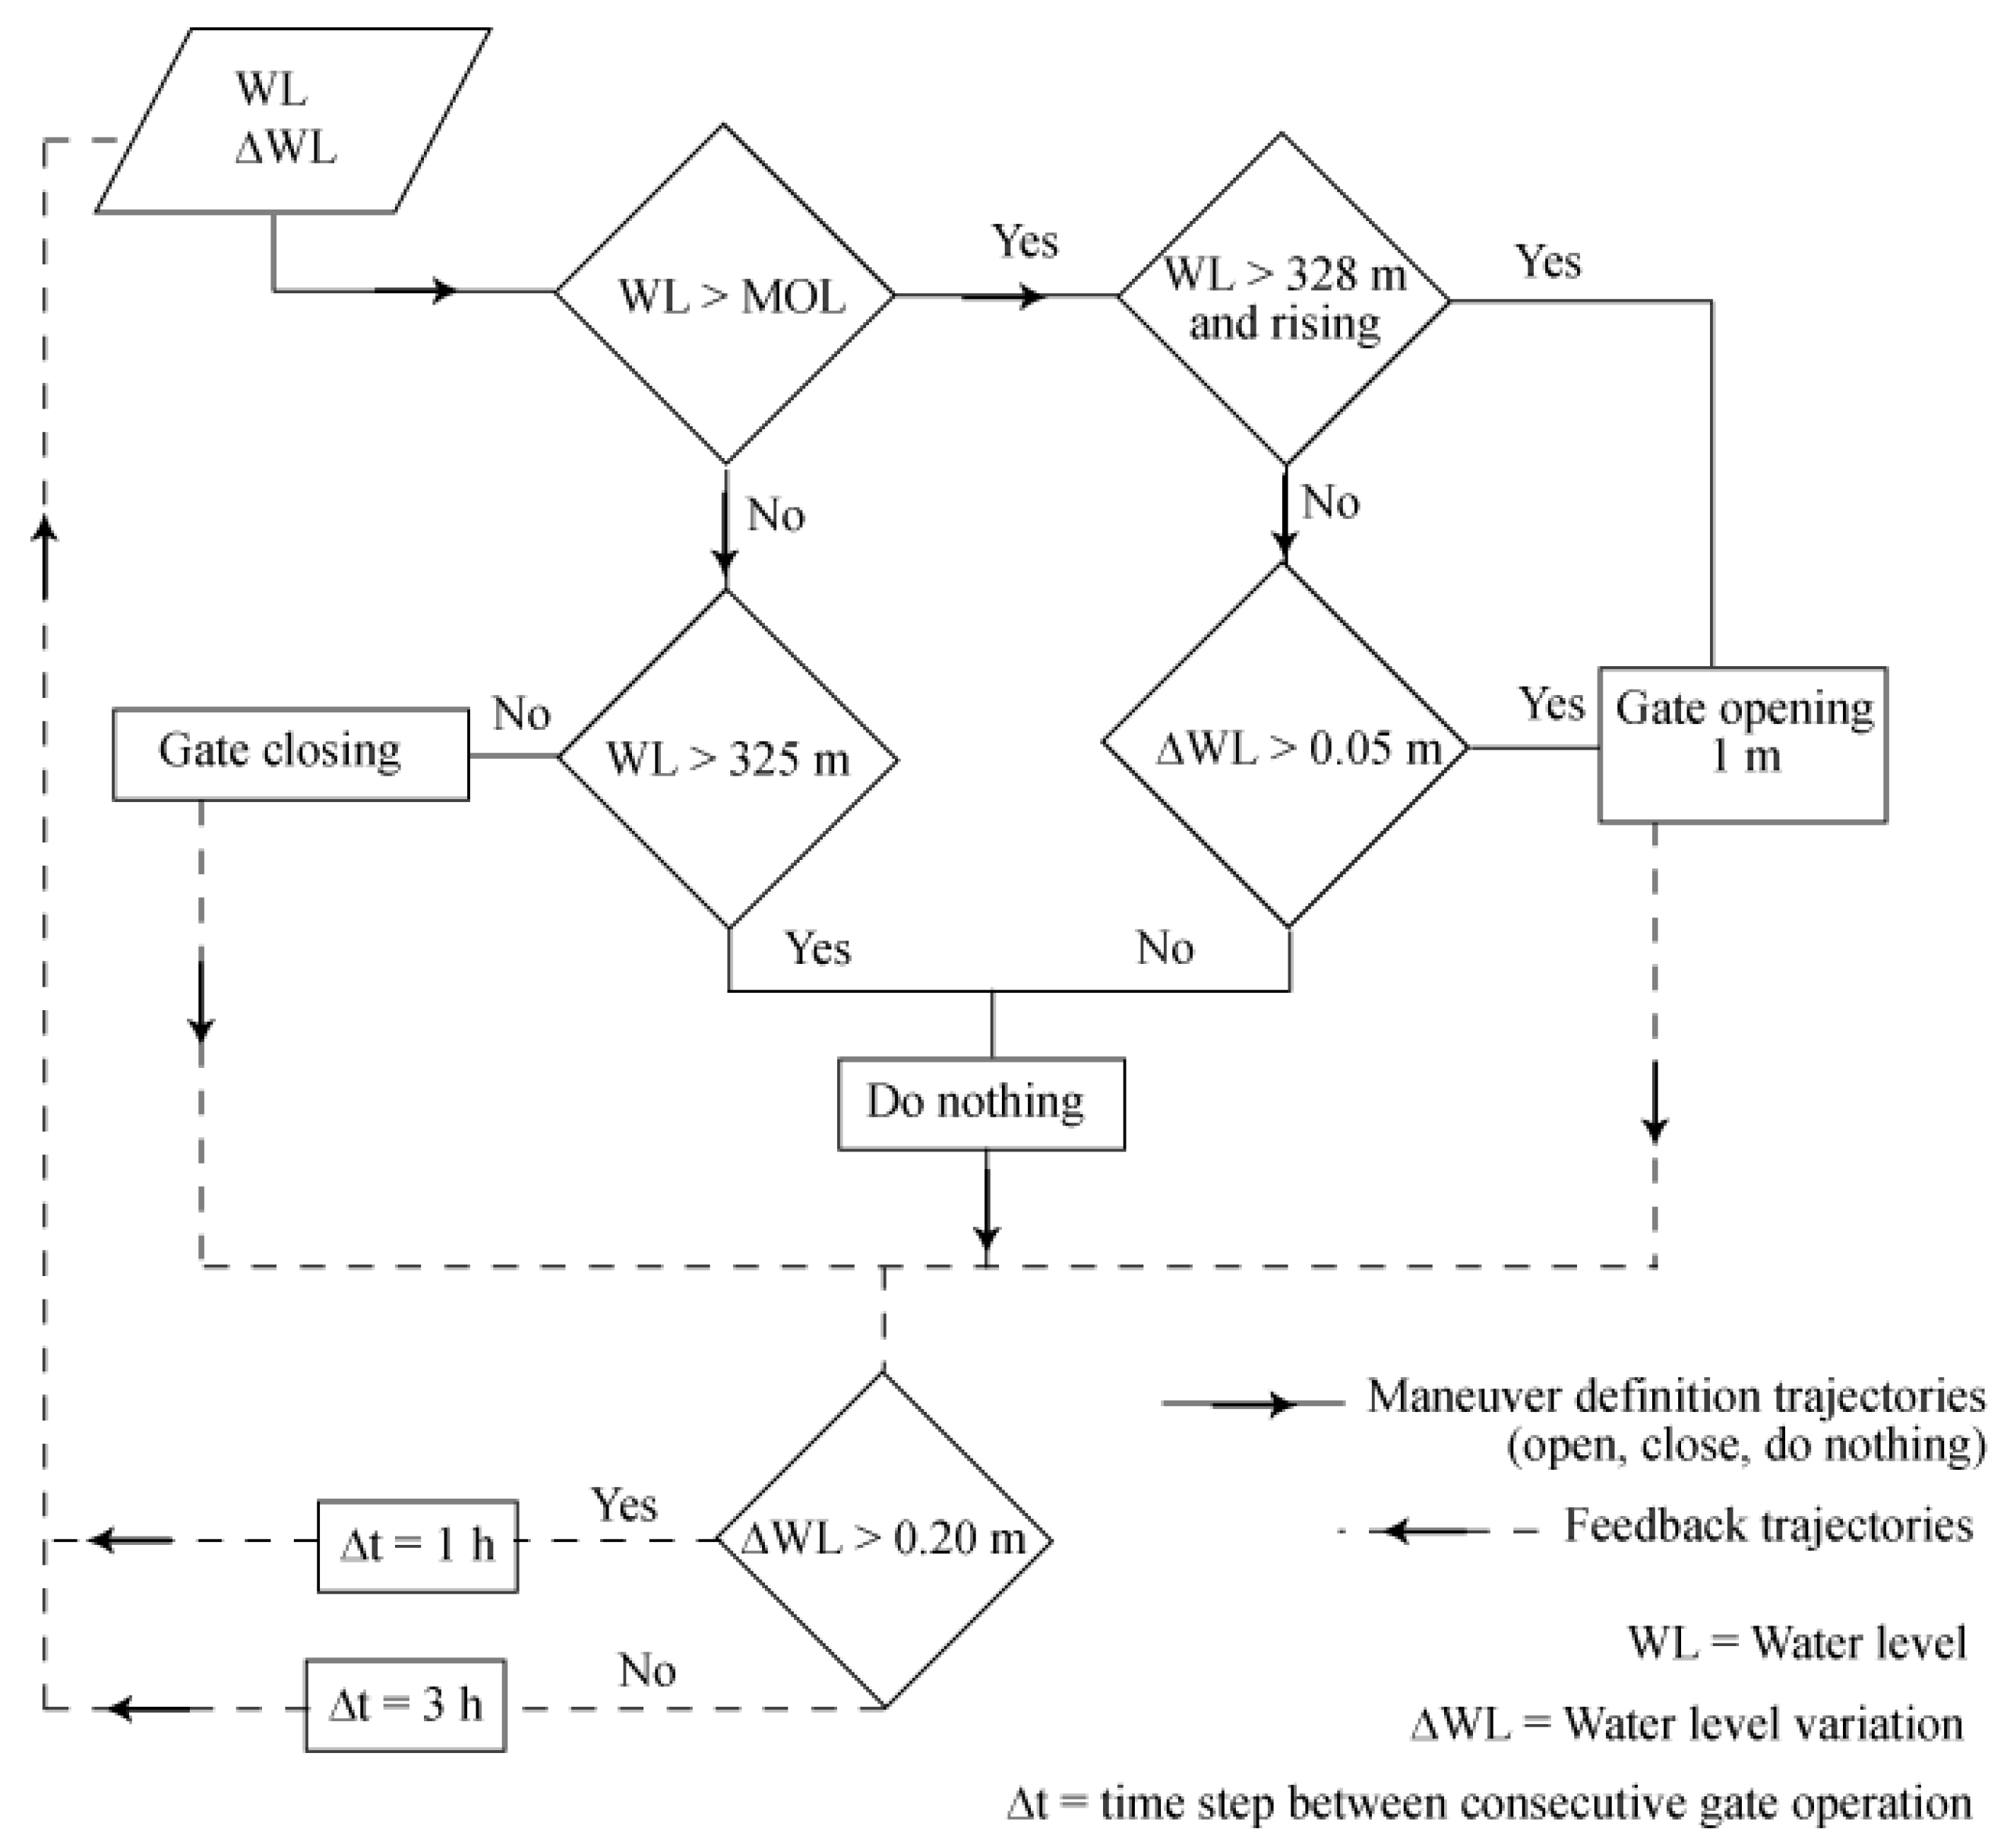
The second operating rule was identified as S2 (
Figure 6). The associated MOL is 326 m. The gates are opened if the level is above 328 m or if the level is higher than the MOL and the increase in the level is greater than 0.05 m/h. The increase in the gate opening is 1 m. The time step between consecutive maneuvers depends on the increase in the reservoir level: for a rise of 0.05 m/h the time step is three hours, though if the level rises more than 0.2 m/h or the level is higher than 328 m, the time step is reduced to one hour. Gates are closed when the level drops to 325 m or less.
Figure 6.
Flow chart that schematizes the functioning of the S2 operating rule.
Figure 6.
Flow chart that schematizes the functioning of the S2 operating rule.
An outflow that exceeds the maximum inflow is not allowed during the rising limb of the hydrograph (for any operating policy). The energy market and the energy price evolution were not considered in this study. Therefore, if possible, the MTC was achieved during flood control operations.
These strategies were parameterized (S1p and S2p) by varying the values of maximum operating level (MOL), maximum step for gate opening (
Gmax) and the level gradient (
∆WL) required to increase the release (only for S2). Six configurations were considered for the S1 policy and 18 for S2 and are summarized in
Table 2.
Table 2.
Operating rule parameterization.
Table 2.
Operating rule parameterization.
| Parameter | S1p | S2p |
|---|
| Maximum operating level, MOL | 327, 327.5 and 328 m | 326, 327 and 328 m |
| Maximum step for gate opening, Gmax | 1 and 2 m | 0.5, 1 and 2 m |
| Water level gradient required for opening, ∆WL | – | 0.02 and 0.05 m |
The selected values of MOL are related to the flood control capacity of the dam and to the actual MOL used by the Belesar dam operators. The values of Gmax are related to the downstream channel capacity and suitable flow rates.
5. Results and Discussion
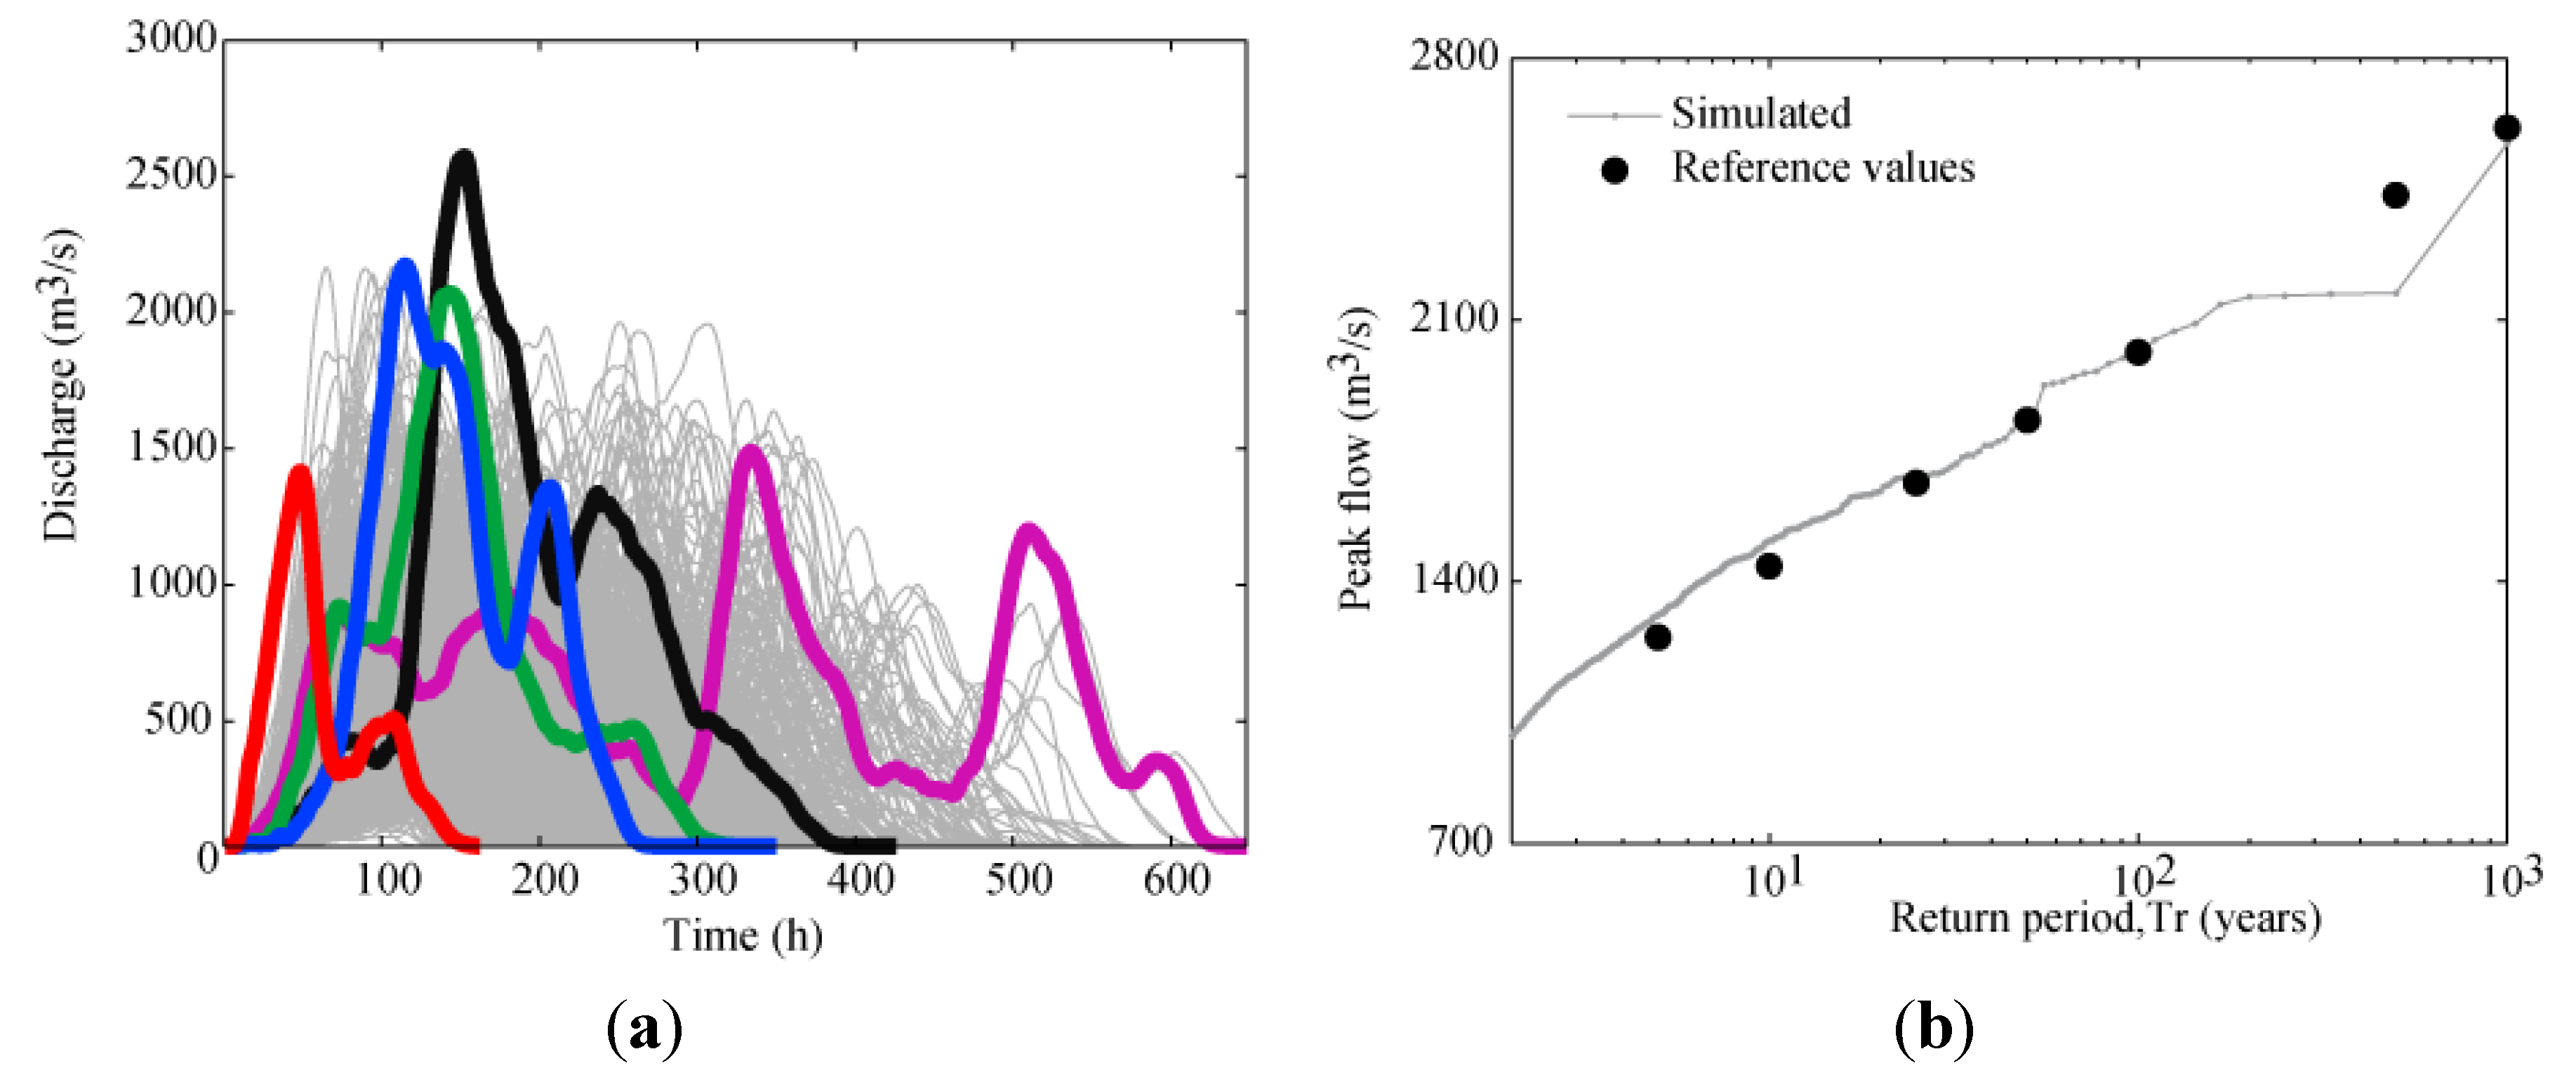
The flood ensemble was obtained by following the procedure explained. This procedure gave hydrographs with a wide variety of shapes and durations (
Figure 7a). Due to the characteristics of the case studied (large spillway capacity), the maximum flood volume series was chosen as the ensemble of annual maximum flood hydrographs [
37]. Peak flood frequency distribution was calibrated with the flood frequency curve indicated in the Dam Master Plan (
Figure 7b) [
28,
29,
40].
Figure 7.
Ensemble of flood hydrographs. (a) Stochastically generated flood events (selected hydrographs are highlighted to visualize the variety of shapes and duration); and (b) Calibration of the flood peak frequency curve.
Figure 7.
Ensemble of flood hydrographs. (a) Stochastically generated flood events (selected hydrographs are highlighted to visualize the variety of shapes and duration); and (b) Calibration of the flood peak frequency curve.
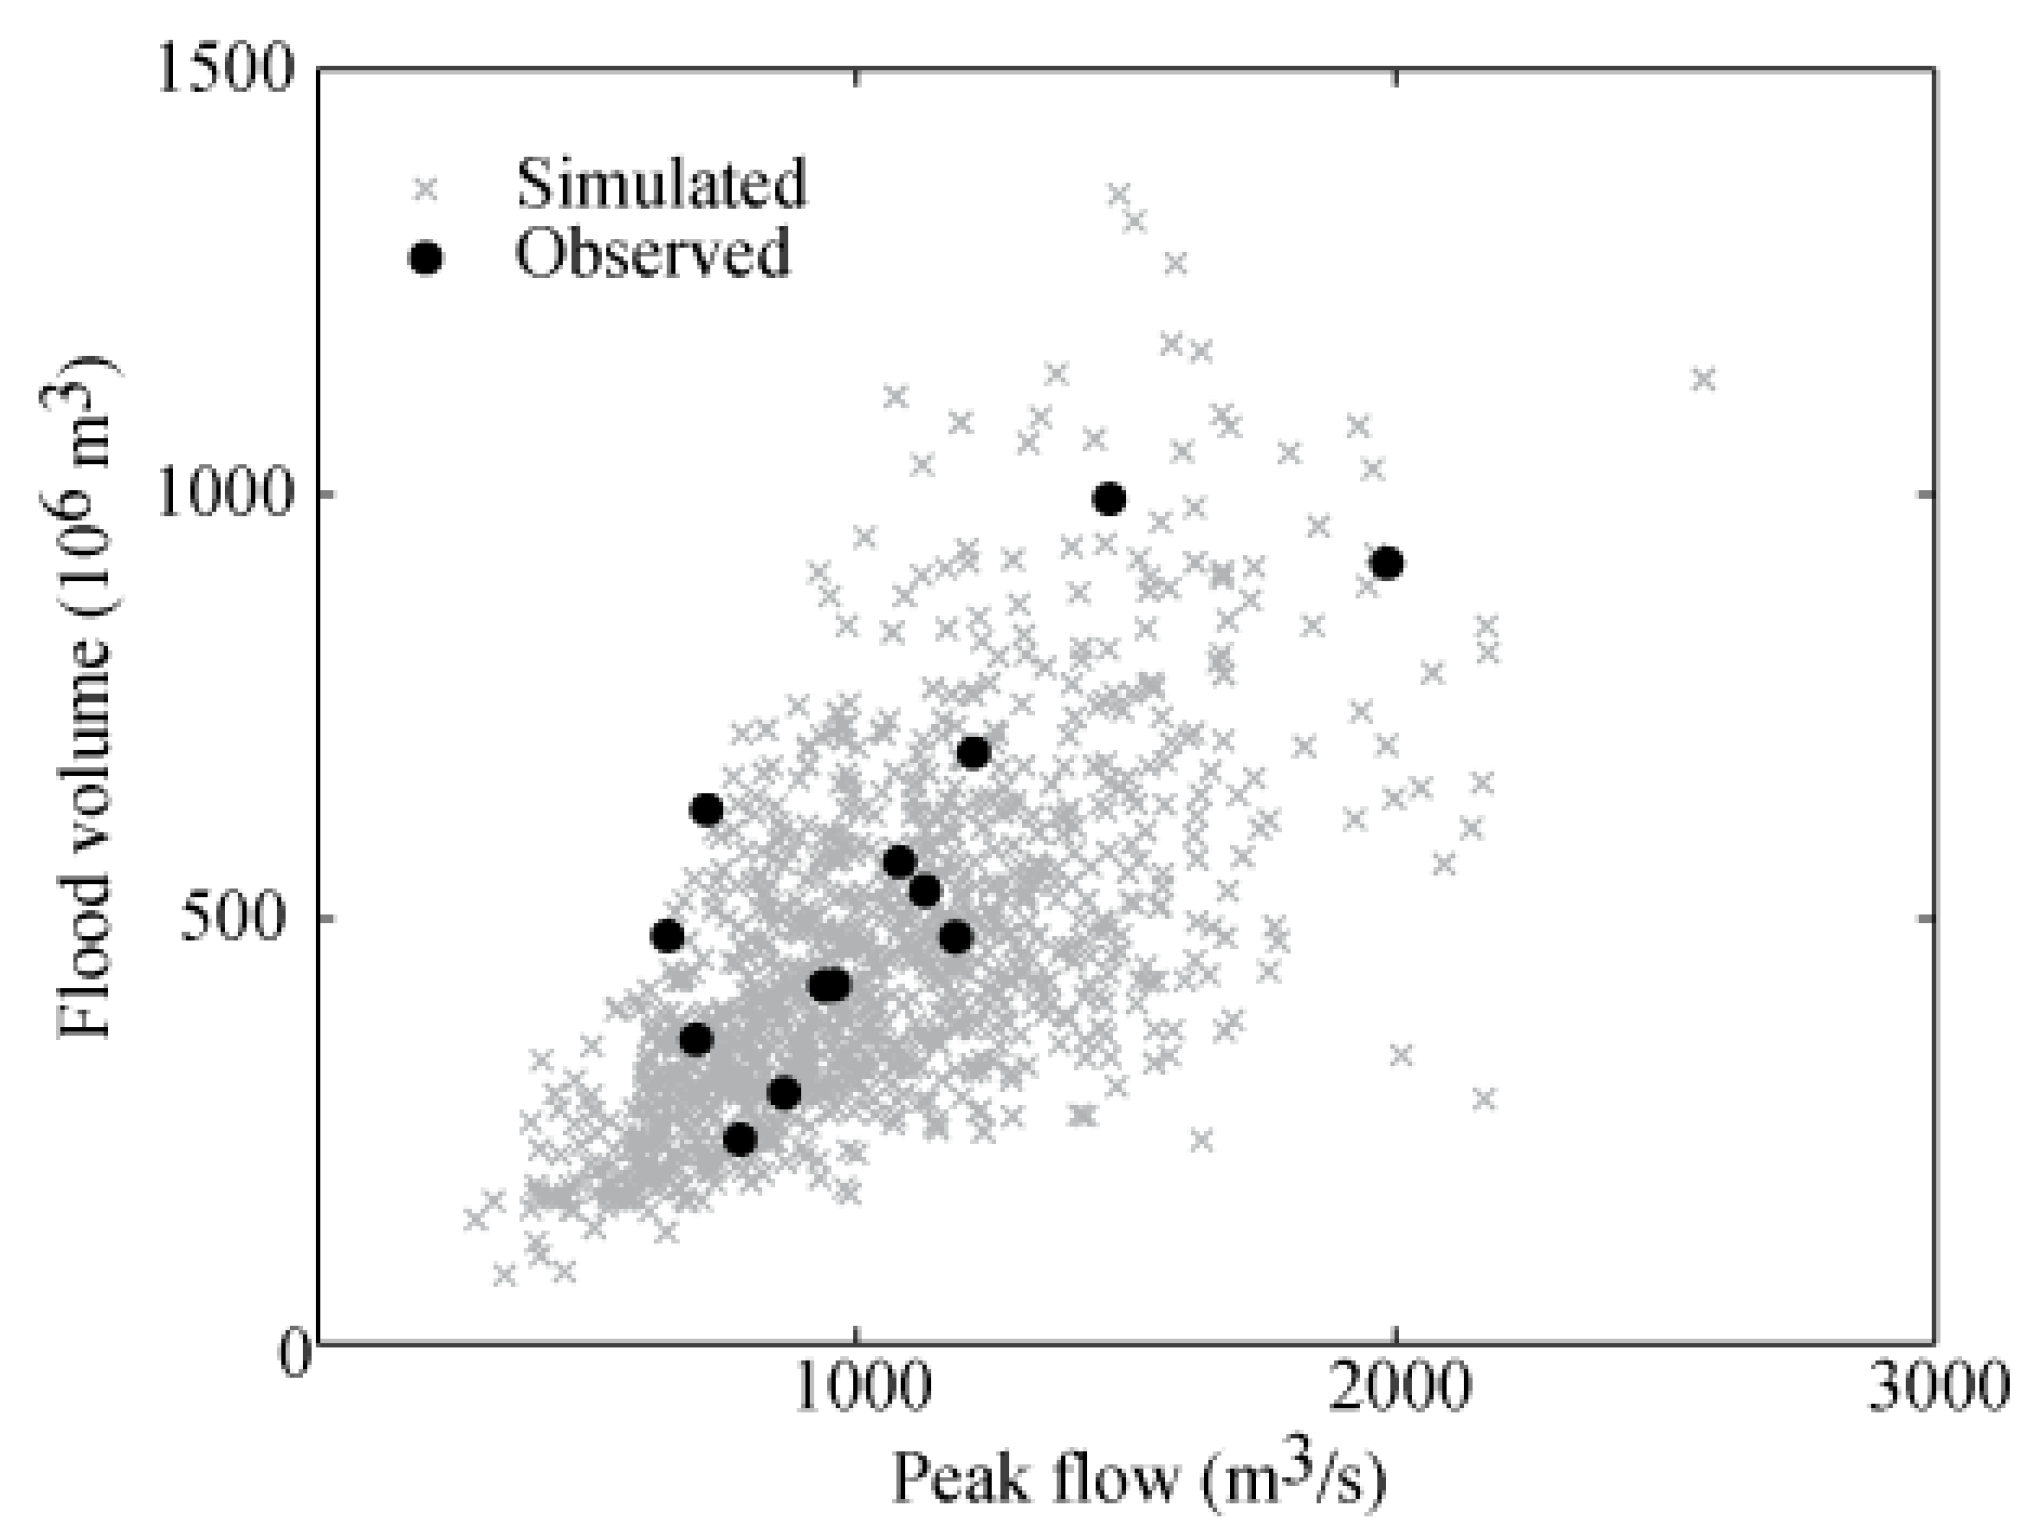
The relationship between peak flow and hydrograph volume of the stochastically generated events was compared with the corresponding values of the recorded ones (
Figure 8). The synthetic events provide an accurate reproduction of the peak flow and volume of the recorded floods in order to compare strategies under the same hydrological forcing.
Figure 8.
Relationship between peak flow and hydrograph volume for simulated and observed events.
Figure 8.
Relationship between peak flow and hydrograph volume for simulated and observed events.
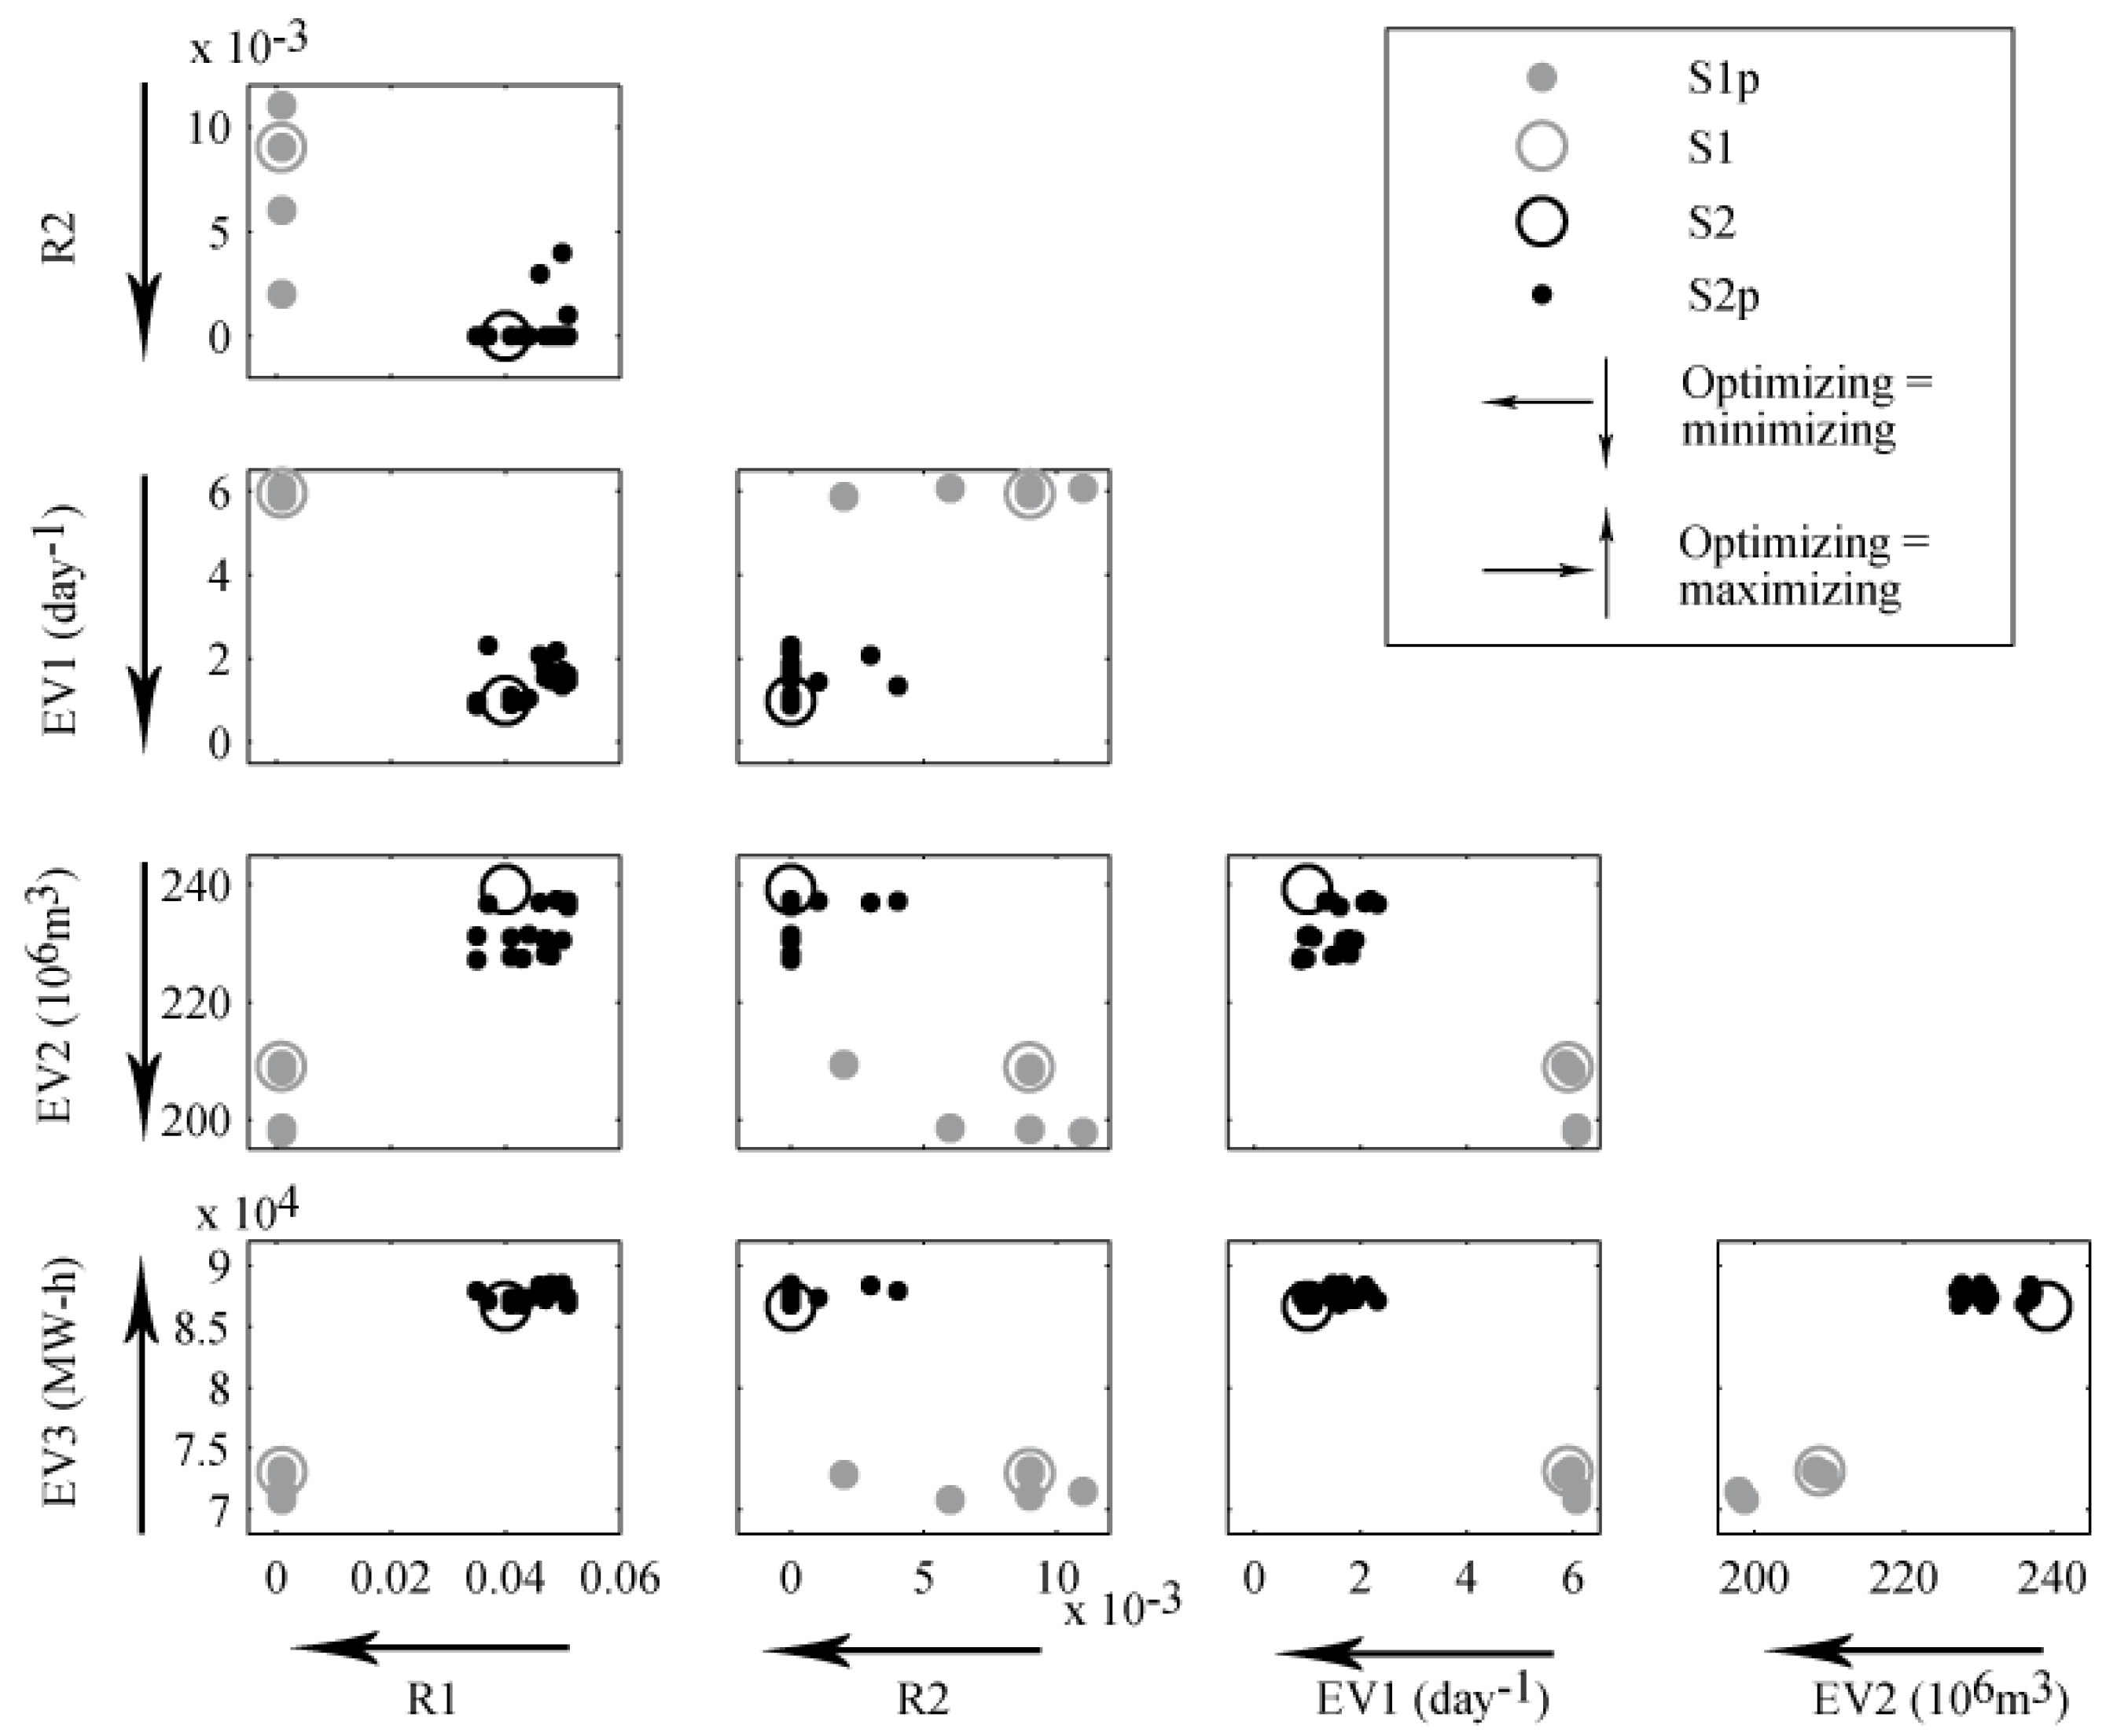
Then, the two operating rules were simulated and forced with the same flood ensemble (1000 events simulated). Both strategies were parameterized and run for each selected configuration. The tradeoff between the objective functions considered for the 24 parameterized strategies and two original ones are shown in
Figure 9 through a scatter plot matrix, which shows all
J·(
J − 1)/2 possible combinations of the objective functions, each with a two-dimensional projection [
20]. The arrows show the direction towards each variable is optimized (maximization or minimization). A better solution is that which optimizes both objective functions in all (or most) scatter plots.
Figure 9.
Depiction of the behavior of the strategies S1, S2, S1p and S2p in a scatter plot matrix.
Figure 9.
Depiction of the behavior of the strategies S1, S2, S1p and S2p in a scatter plot matrix.
While both S1 and S2 improve some aspects, it should be noted that they worsen in others. For this reason, they may be considered not absolutely better than the others but only as compromise solutions. S1 represents a better solution regarding flooding risk and unproductive spillage. Noticeably, S2 provides a better solution from the perspective of dam safety because of the lower MOL. S2 also gives better results regarding the operability and expected energy production. S1 provides generally smaller but more frequent variations of both released flows and levels. Although S2 affords smoother evolution of these variables in short periods of time, the maximum amplitude of these curves is greater than in the case of S1.
The S2p strategies are generally more sensitive than S1p. The S2p policies provide safer operations for the dam, higher expected gross energy and fewer maneuvers than the S1p strategies. Conversely, the latter reduce flooding risk and expected unproductive spills. This is because S1p, as in the case of S1, is aimed at maintaining the level as close as possible to MOL and the TLD cannot be exceeded if the inflows are smaller than 2500 m3/s. When high inflows occur, such limitation leads to higher maximum levels and, in some cases, overtopping. This behavior may also lead to release flows that are lower than MTC, especially during the decreasing limb of the flood hydrographs. Thus, the expected energy production is reduced.
According to these results, a new strategy (S2M) was proposed. It was based on the S2 operating rule with a MOL of 327.5 m, given that it is the value defined in the Dam Master Plan. Additionally, it was established that when the reservoir level rises up to the FCL the spillway gates should be fully opened, in accordance with the rules. The results of the evaluation applied to the original (S1 and S2) and the alternative (S2M) strategies are summarized in
Table 3. The arrows indicate the direction towards each variable is optimized (maximization ↑ or minimization ↓).
Table 3.
Evaluation of performance of different strategies.
Table 3.
Evaluation of performance of different strategies.
| Strategy | MOL | Initial Level | R1 ↓ | R2 ↓ | EV1 ↓ | EV2 ↓ | EV3 ↑ |
|---|
| [m] | [m] | – | – | – | [106 m3] | [MW h] |
|---|
| S1 | 327.5 | 327.0 | 0.001 | 0.009 | 6 | 209 | 73080 |
| S2 | 326.0 | 325.5 | 0.040 | 0.000 | 1 | 239 | 85475 |
| S2M | 327.5 | 327.0 | 0.038 | 0.000 | 1.5 | 202 | 86638 |
It is observed that the S1 strategy affords a lower risk of flooding than the S2 and the S2M. Conversely, these two rules provide better performance in terms of risk of overtopping. The S2 offers, simultaneously, the highest expected values of gross energy production and of unproductive spills. While the S2M gives a similar expected value of gross produced energy, it reduces the volume of water released through the spillways. The S1 rule implies a significantly higher expected value of maneuvers during the peak flood.
Through the changes proposed, the good performance of S2 in terms of dam safety and expected energy produced are preserved in S2M, though they enhance some of the aspects with poorer performance. Nevertheless, no strategy may be deemed as being absolutely better than the others. The final selection of the most suitable operating rules depends on the judgment of the respective dam manager and relative prioritization of the objectives considered. Assuming that a risk of an overtopping greater than zero is unacceptable for the magnitude of the flood considered (the maximum Tr is 1000 years, approximately), the S2M provides a reasonable compromise solution among the risk, operability and energy generation criteria.
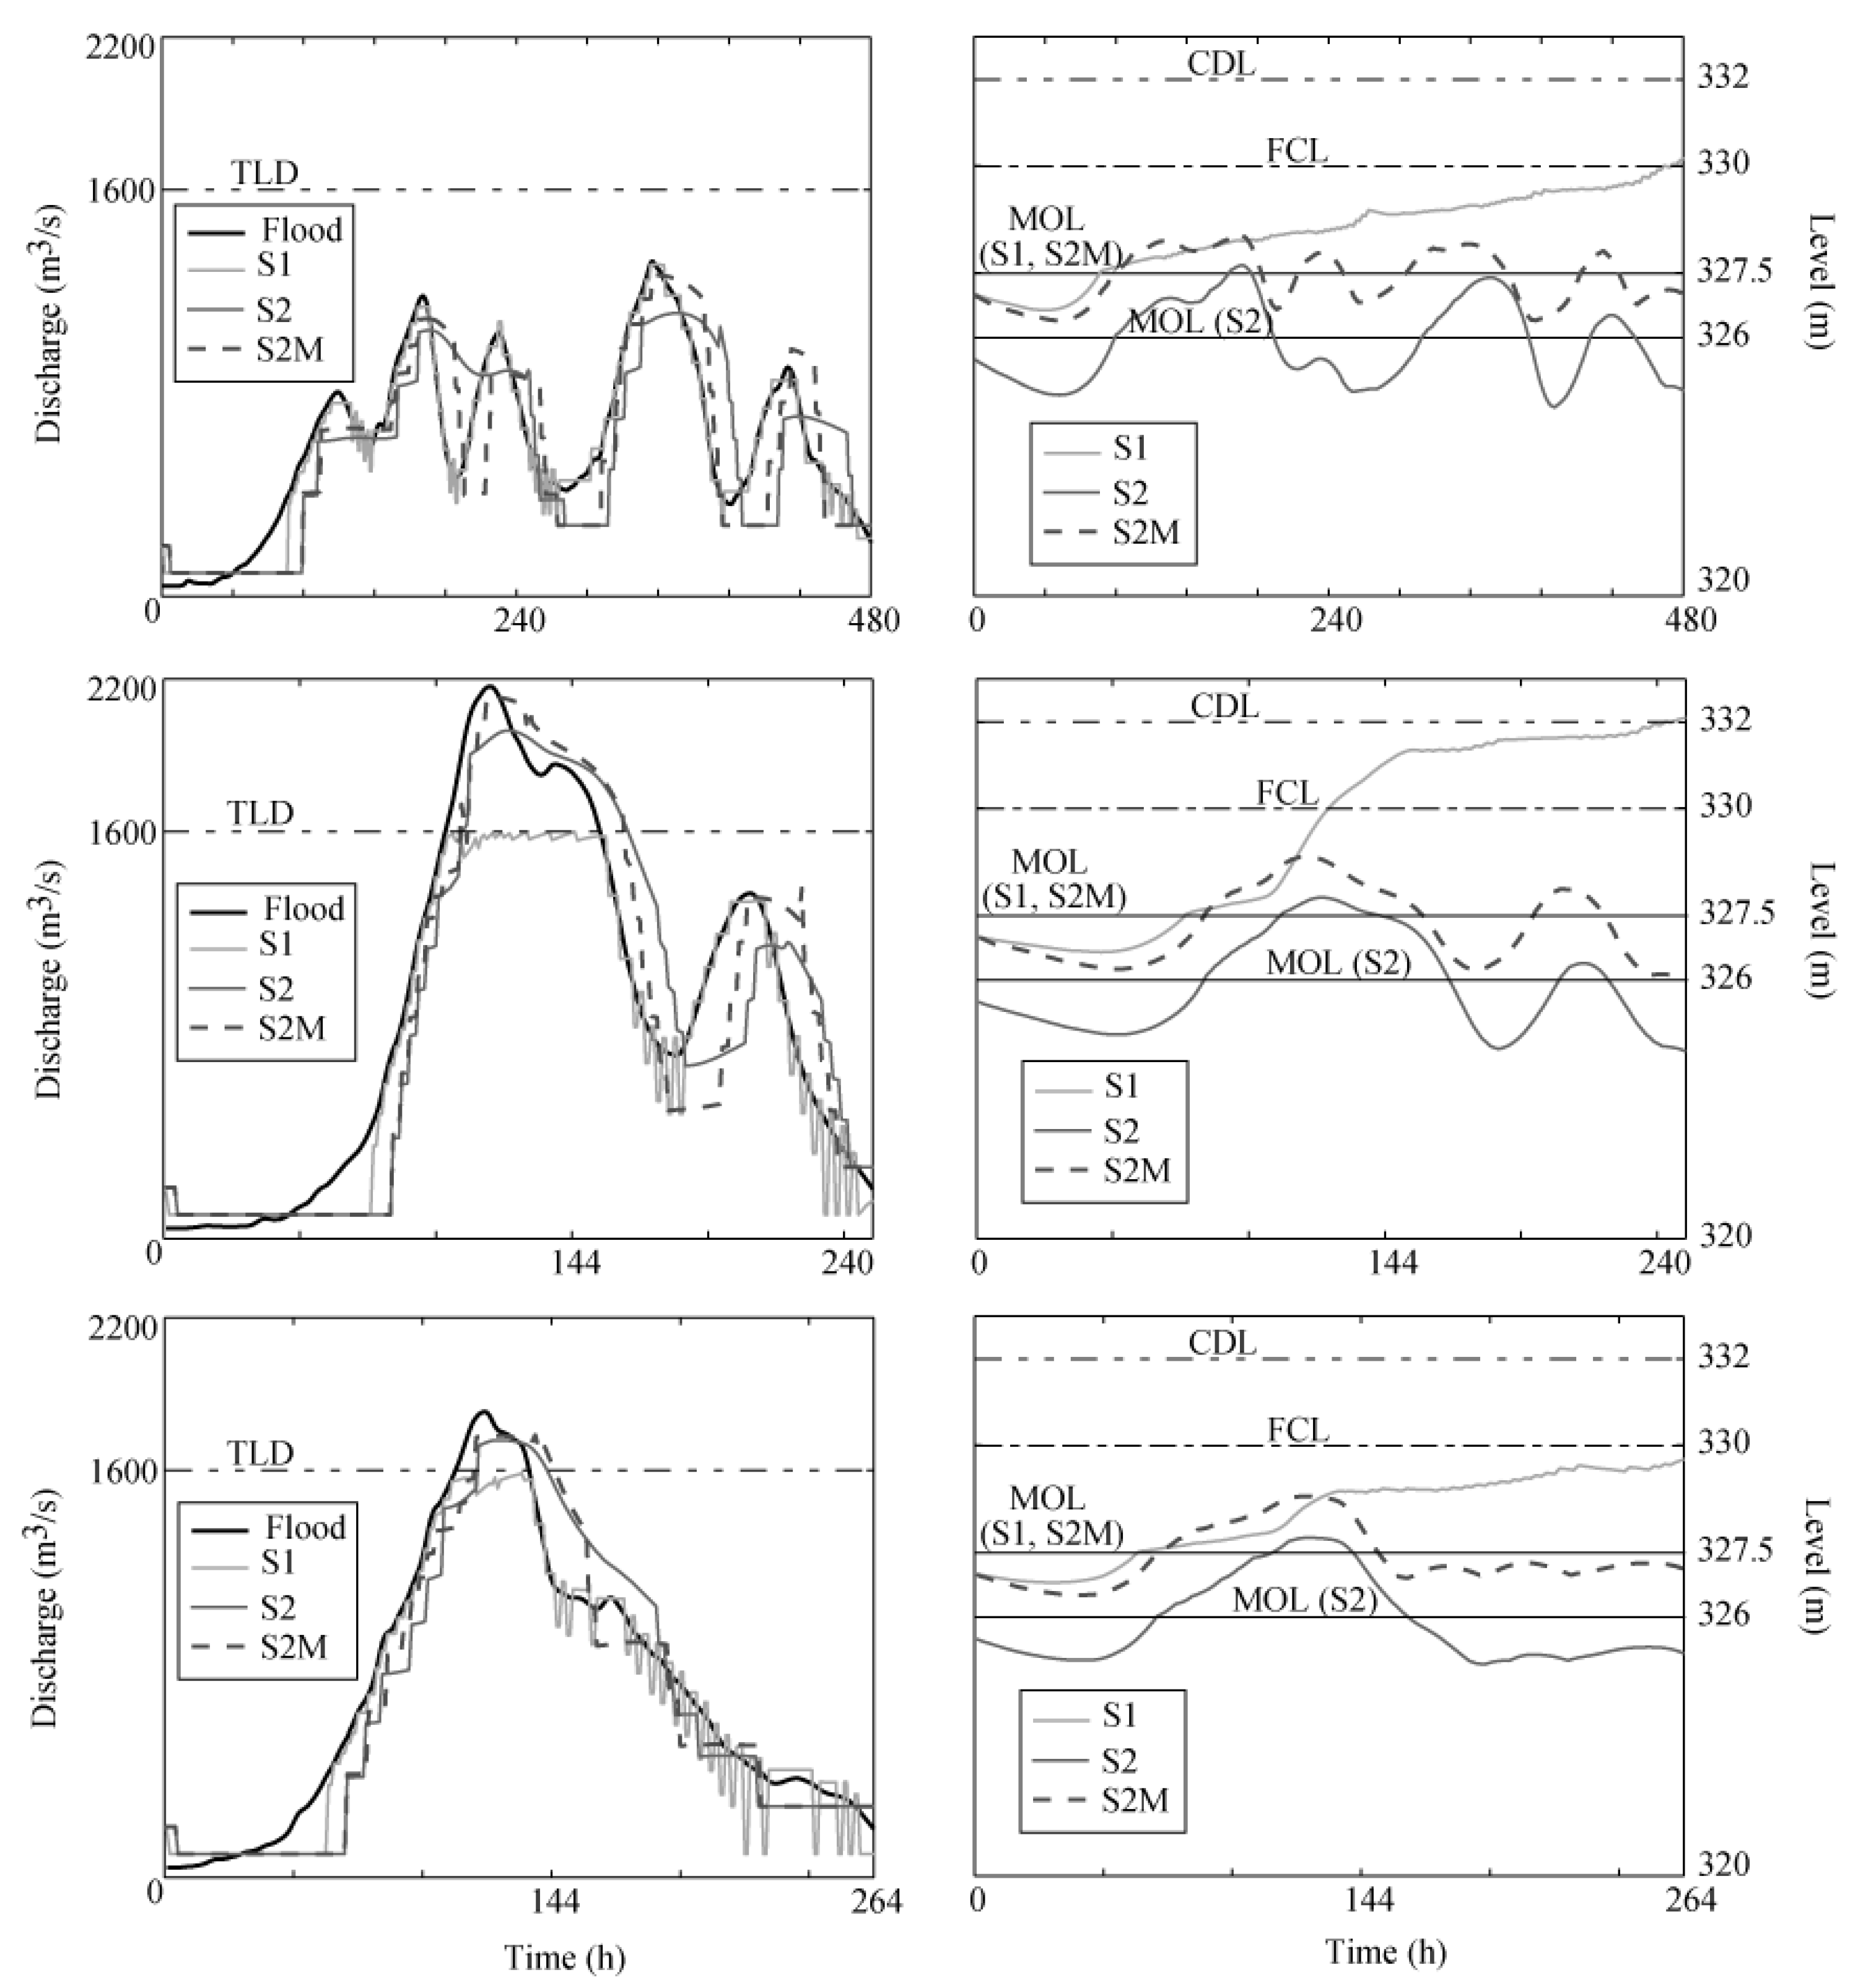
The operation provided by each of these three strategies is compared with regard to selected flood events (
Figure 10), with the corresponding return period (Tr) being in the range of 10 to 200 years.
For peak floods lower than TLD, S1 provides higher peak outflows than S2 and S2M (upper example in
Figure 10). Conversely, it is observed in the second and third examples of
Figure 10 that for peak flows that exceed the TLD, S2 and S2M afford higher outflows (with the corresponding increase in flooding risk). This is explained by the fact that S1 limits the outflows to 1600 m
3/s for inflows smaller than 2500 m
3/s. However, this behavior leads to elevated water levels for S1, reaching the flood control level (entering the uncontrolled flood pool) or even exceeding the CDL. S2 reaches lower maximum water levels because the corresponding MOL and, consequently, the initial water level are lower than for S1 and S2M. These two strategies achieve similar water levels (or higher for S2M) up to the arrival of the peak flow. After this, S1 follows the inflow hydrograph and causes rapid and accentuated variations in outflows and water level. This can lead to a drop of the released flows, even below the MTC, in the final intervals of the hydrograph, causing a reduction in energy production. The water level gradient threshold included in the S2 and S2M operating rules provides a smoother evolution of discharge and water level, and delays the beginning of the operation when compared with S1. However, it also delays the date of closing that leads, in many cases, to greater unproductive spillages, especially for S2. Such behavior allows rapid reduction of the water level to safe values. Although this performance may be considered better from the point of view of dam safety, it is worse from the perspective of storing water for future energy generation. Once again, both the multiobjective and stochastic nature of the flood control problem in hydropower reservoirs is shown.
Figure 10.
Comparison of the S1, S2 and S2M operating rules applied to selected flood hydrographs (10 < Tr < 200 years).
Figure 10.
Comparison of the S1, S2 and S2M operating rules applied to selected flood hydrographs (10 < Tr < 200 years).


