Article

Seasonal and Interannual Ground-Surface Displacement in Intact and Disturbed Tundra along the Dalton Highway on the North Slope, Alaska

1
International Arctic Research Center, University of Alaska Fairbanks, Fairbanks, AK 99775, USA
2
Japan Agency for Marine-Earth Science and Technology, Yokohama 237-0061, Japan
*
Author to whom correspondence should be addressed.
Submission received: 30 November 2020 / Revised: 23 December 2020 / Accepted: 25 December 2020 / Published: 29 December 2020
(This article belongs to the Special Issue Permafrost Landscape)

Abstract

:
Spatiotemporal variation in ground-surface displacement caused by ground freeze–thaw and thermokarst is critical information to understand changes in the permafrost ecosystem. Measurement of ground displacement, especially in the disturbed ground underlain by ice-rich permafrost, is important to estimate the rate of permafrost and carbon loss. We conducted high-precision global navigation satellite system (GNSS) positioning surveys to measure the surface displacements of tundra in northern Alaska, together with maximum thaw depth (TD) and surface moisture measurements from 2017 to 2019. The measurements were performed along two to three 60–200 m transects per site with 1–5 m intervals at the three areas. The average seasonal thaw settlement (STS) at intact tundra sites ranged 5.8–14.3 cm with a standard deviation range of 2.1–3.3 cm. At the disturbed locations, averages and variations in STS and the maximum thaw depth were largest in all observed years and among all sites. The largest seasonal and interannual subsidence (44 and 56 cm/year, respectively) were recorded at points near troughs of degraded ice-wedge polygons or thermokarst lakes. Weak or moderate correlation between STS and TD found at the intact sites became obscure as the thermokarst disturbance progressed, leading to higher uncertainty in the prediction of TD from STS.

1. Introduction

Frost heave is the upward or outward movement of the ground surface caused by the formation of ice lenses in porous materials (e.g., [1]). This is a ubiquitous phenomenon in cold regions, where the ground surface experiences freezing. The fundamental mechanism of frost heave has been recognized since the 1920s as the formation of segregated ice lenses by water migration to the freezing front in the frost-susceptible soil (e.g., [2,3]). The heaved ground surface, in turn, settles during thawing seasons, and the seasonal thaw settlement (STS) depends on the amount of ice lenses formed in the previous years and the maximum thaw depth (TD) of the observation year. Frost heave redistributes soil water and displaces components of the soil layer (e.g., [4]). Researchers and practitioners of civil engineering have studied the mechanism of frost heave and modeled its behavior (e.g., [5,6,7,8]) because the surface displacement damages infrastructure, such as roads, railroads, and buildings, through repeated seasonal heave and settlement. Ice segregation is a fundamental driving force to develop geomorphological features such as palsas [9] and lithalsas (e.g., [10]) in permafrost regions. The physical processes underlying the phenomenon of frost heave have been studied by a number of researchers, as summarized by Dash et al. [11].
Ice segregation in the active layer and the resulting differential seasonal ground displacement through frost heave and thaw settlement produce highly heterogeneous soil structures and microrelief in Arctic ground surfaces underlain by permafrost. At the same time, ice segregation damages fine plant roots and seedlings (e.g., [12,13]), alters vertical moisture distribution [14,15] in freezing soil layers, and restricts water accessibility for aboveground vegetation and belowground microbial activity at different soil depths. Quantifying these key processes is critical to understanding cold-region ecosystems that are experiencing rapid climate change.
The development of automatic measurement systems with sensors (e.g., strain gauge and potentiometer) and loggers has provided continuous and high-resolution measurements of ground-surface displacement (e.g., [16,17]). Gruber [18] introduced a low-cost and simple-structured “tilt arm” measurement system. Although these automatic systems can provide continuous measurements, there still remains a problem of limited spatial extent of the measurements.
Little et al. [19] demonstrated the ability of a differential global positioning system (DGPS) to measure ground-surface displacement caused by frost heave and thaw settlement in wide areas more rapidly than classical methods. A similar DGPS displacement measurement in Alaskan tundra was continued by Shiklomanov et al. [20] and Streletskiy et al. [21]. The recent technological development of RTK (real-time kinematic)/PPK (postprocessed kinematic) GNSS (global navigation satellite system) positioning enabled much more rapid measurements with a vertical precision of 10–20 mm. However, these measurements are also episodic and require the physical presence of surveyors.
As a solution to the limited spatial extent of in situ displacement measurement, a radar remote-sensing technique has been deployed to estimate the spatial variation of active layer thickness in broad areas. For example, Liu et al. [22], Schaefer et al. [23], and Michaelides et al. [24] estimated spatial variation in the active layer in Alaskan permafrost regions using the SAR (synthetic aperture radar) interferometry technique (InSAR). In developing the algorithm to determine active layer thickness from remotely sensed variables, they presumed a relationship between TD and STS because greater TD results in a larger water capacity that potentiates larger frost heave and STS. However, supporting direct field validation for the remote-sensing algorithm is still missing, due to the scarcity of studies on the TD–STS relationship.
Furthermore, recent InSAR studies applied to permafrost regions have demonstrated the ability to capture high-resolution spatial variation in seasonal and interannual ground displacement caused by ground freezing and thawing, for example, in Alaska (e.g., [25,26]), Siberia [27,28,29], and Himalayan highland [30]. Few studies conducted comparisons between InSAR measurements and in situ ground survey; however, the numbers of measuring points and observation periods were limited by various logistical reasons.
Our study focuses on the knowledge gap between the high-resolution spatial distribution of ground-surface displacement and remote sensing in permafrost regions. We conducted a three year in situ measurement of ground-surface displacement on the North Slope, Alaska, deploying a GNSS positioning system. The objectives of our field campaign were (1) to capture spatial and temporal variations in ground-surface displacement in an ice-rich permafrost region in a broader and denser manner than previously reported, (2) to better understand the magnitude of disturbance impact on the freeze–thaw-related ground-surface displacement, and (3) to examine the relationship between TD and STS that was presumed in past remote-sensing works without field measurements.

2. Materials and Methods
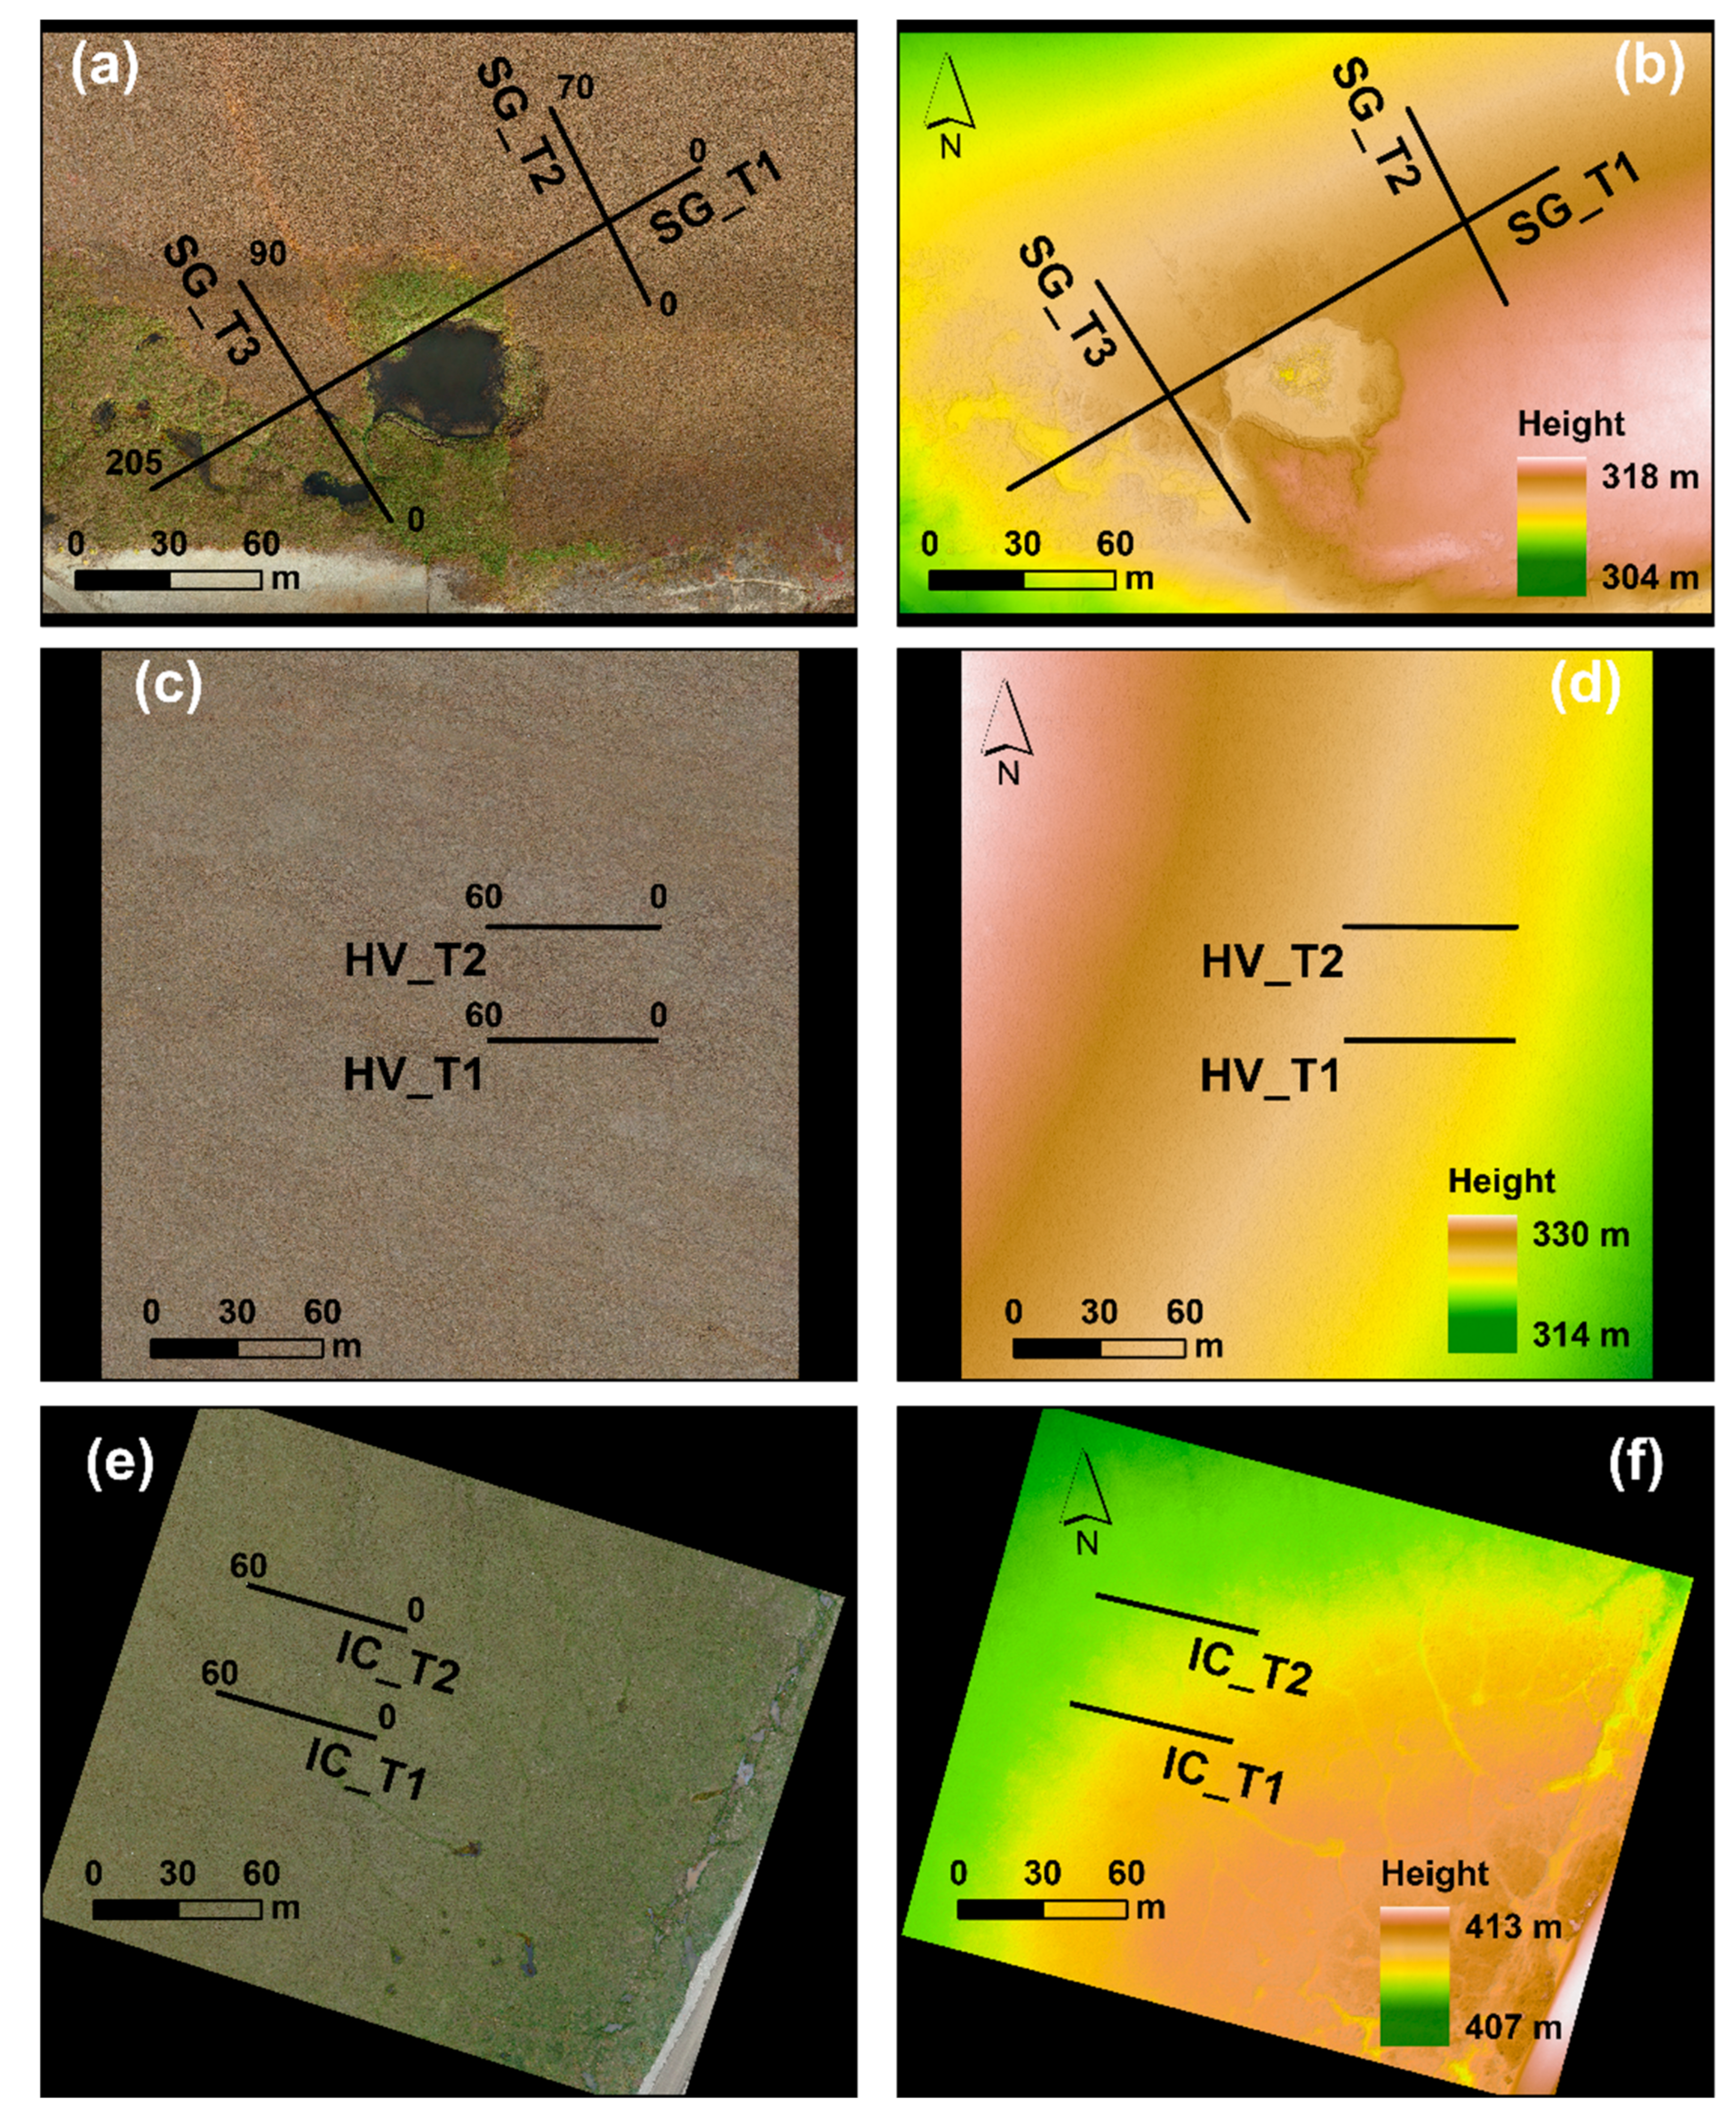
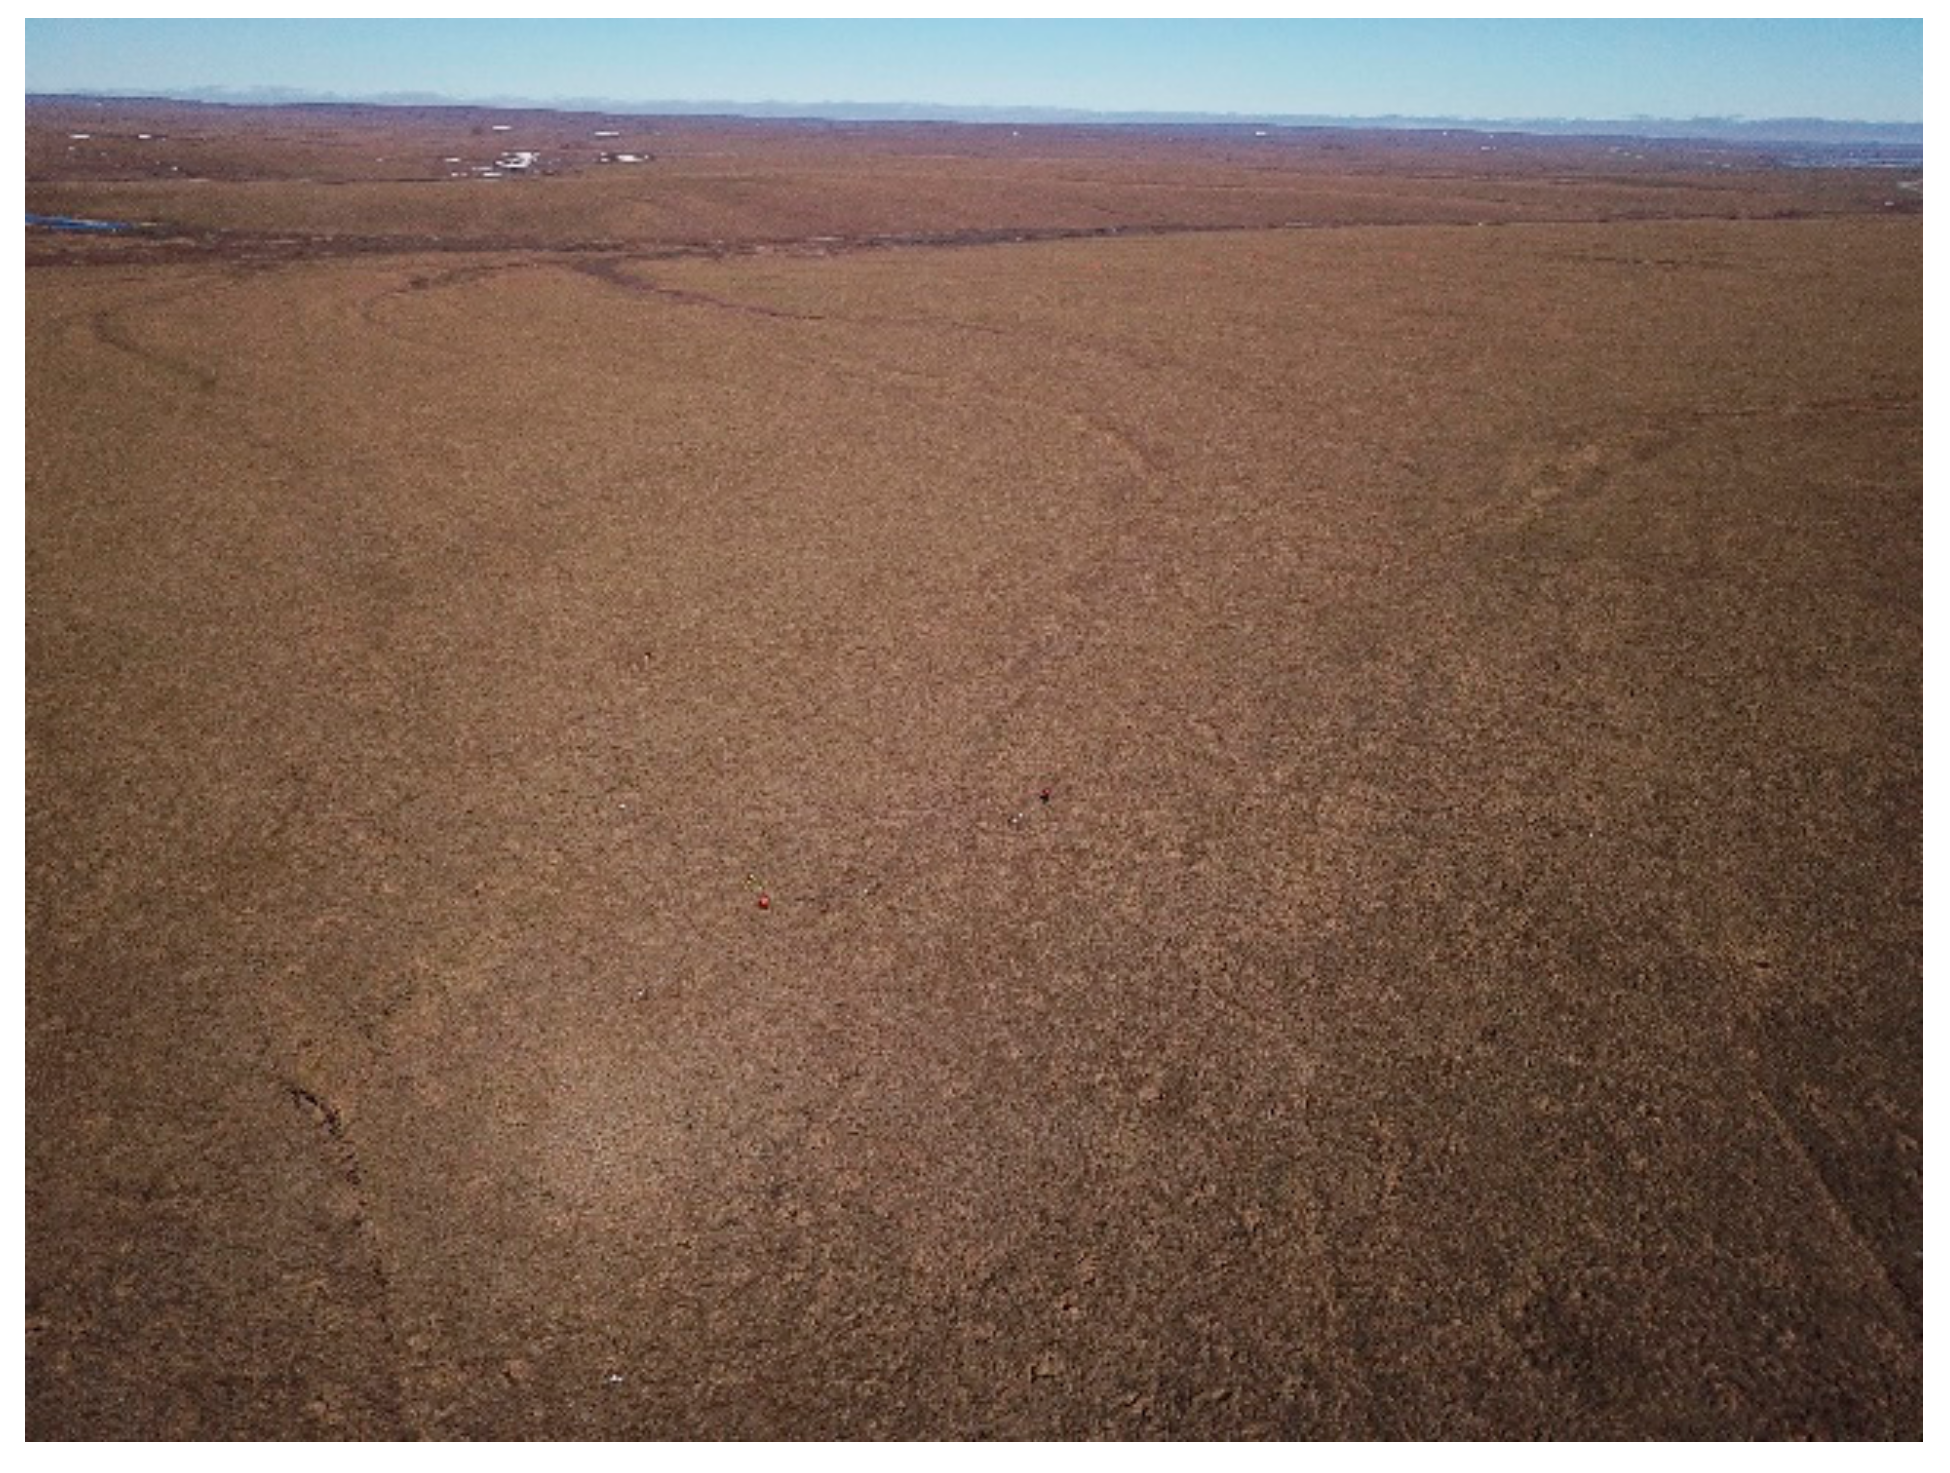
2.1. Study Sites

The study sites are located about 300–500 m west of the Dalton Highway, midway between the Brooks Range and Deadhorse (Figure 1). All study sites are located in Arctic bioclimate subzone E covered with dominant vegetation unit 8 (tussock sedge, dwarf shrub, and moss tundra) according to the CAVM (Circumpolar Arctic Vegetation Map) Team [31] and Walker et al. [32]. No tall shrubs (>0.5 m) were found, and no patterned ground was discernable in the areas of our survey transects, except for faint ice-wedge polygons at site IC. Land cover consists of acidic dry tussock-sedge tundra developed on silty loam to silty clay loam soils (e.g., [33,34]) with occasional gravels or cobbles.
According to Alaska Paleo-Glacier Atlas Version 2 [35], site SG (Sagwon) is situated a few kilometers out of the maximum glaciation range, while sites HV (Happy Valley), and IC (Ice Cut) are located in the area between the maximum glaciation and early Wisconsin glaciation boundaries. The landscape of these study sites is gently rolling hills of highly ice-rich permafrost sediment (Yedoma Ice complex) with an elevation range of 300–400 m.
Site SG (Figure 2a,b, Figure A1 and Figure A2) is located on a relatively flat summit area of a Yedoma remnant hill. A portion of site SG experienced surface disturbance between 1995 and 2007, according to available high-resolution images, and thermokarst development is ongoing. Transects SG_T1 and SG_T3 intersect the disturbed and undisturbed tundra, while the entire transect SG_T2 is situated in intact tundra. We subdivided site SG into SG_disturbed and SG_intact for the later descriptions and discussion. Site HV (Figure 2c,d, Figure A3 and Figure A4) is located on a gentle hill slope of intact tundra. The tundra surface at HV is relatively smooth, and the lack of prominent troughs or depressions indicates no thermokarst development. Site IC (Figure 2e,f, Figure A5 and Figure A6) is on flat tundra. There are recognizable troughs associated with the degradation of ice-wedge polygons between site IC and the Dalton Highway.
Small tussocks with a height up to 20 cm are sporadically distributed at these sites, and 12%, 28%, and 16% of the total survey stakes were installed on the tussocks at SG, HV, and IC, respectively.
Mean annual air temperatures at the NOAA (National Oceanic and Atmospheric Administration) Sagwon station (GHCND: USS0048U01S) ranged from −6 to −9 °C and the mean annual precipitation was 238 mm in the period 2002–2018 [36]. Daily mean air temperature ranged from −40 to 23 °C (Figure 3). Other meteorological statistics for our study period using daily data at the Sagwon station [37] are summarized in Table 1. For the calculation of TDD Menne thawing degree days) and FDD (freezing degree days), we used periods of June–September and the previous October–May for the respective year.

2.2. Field Measurements
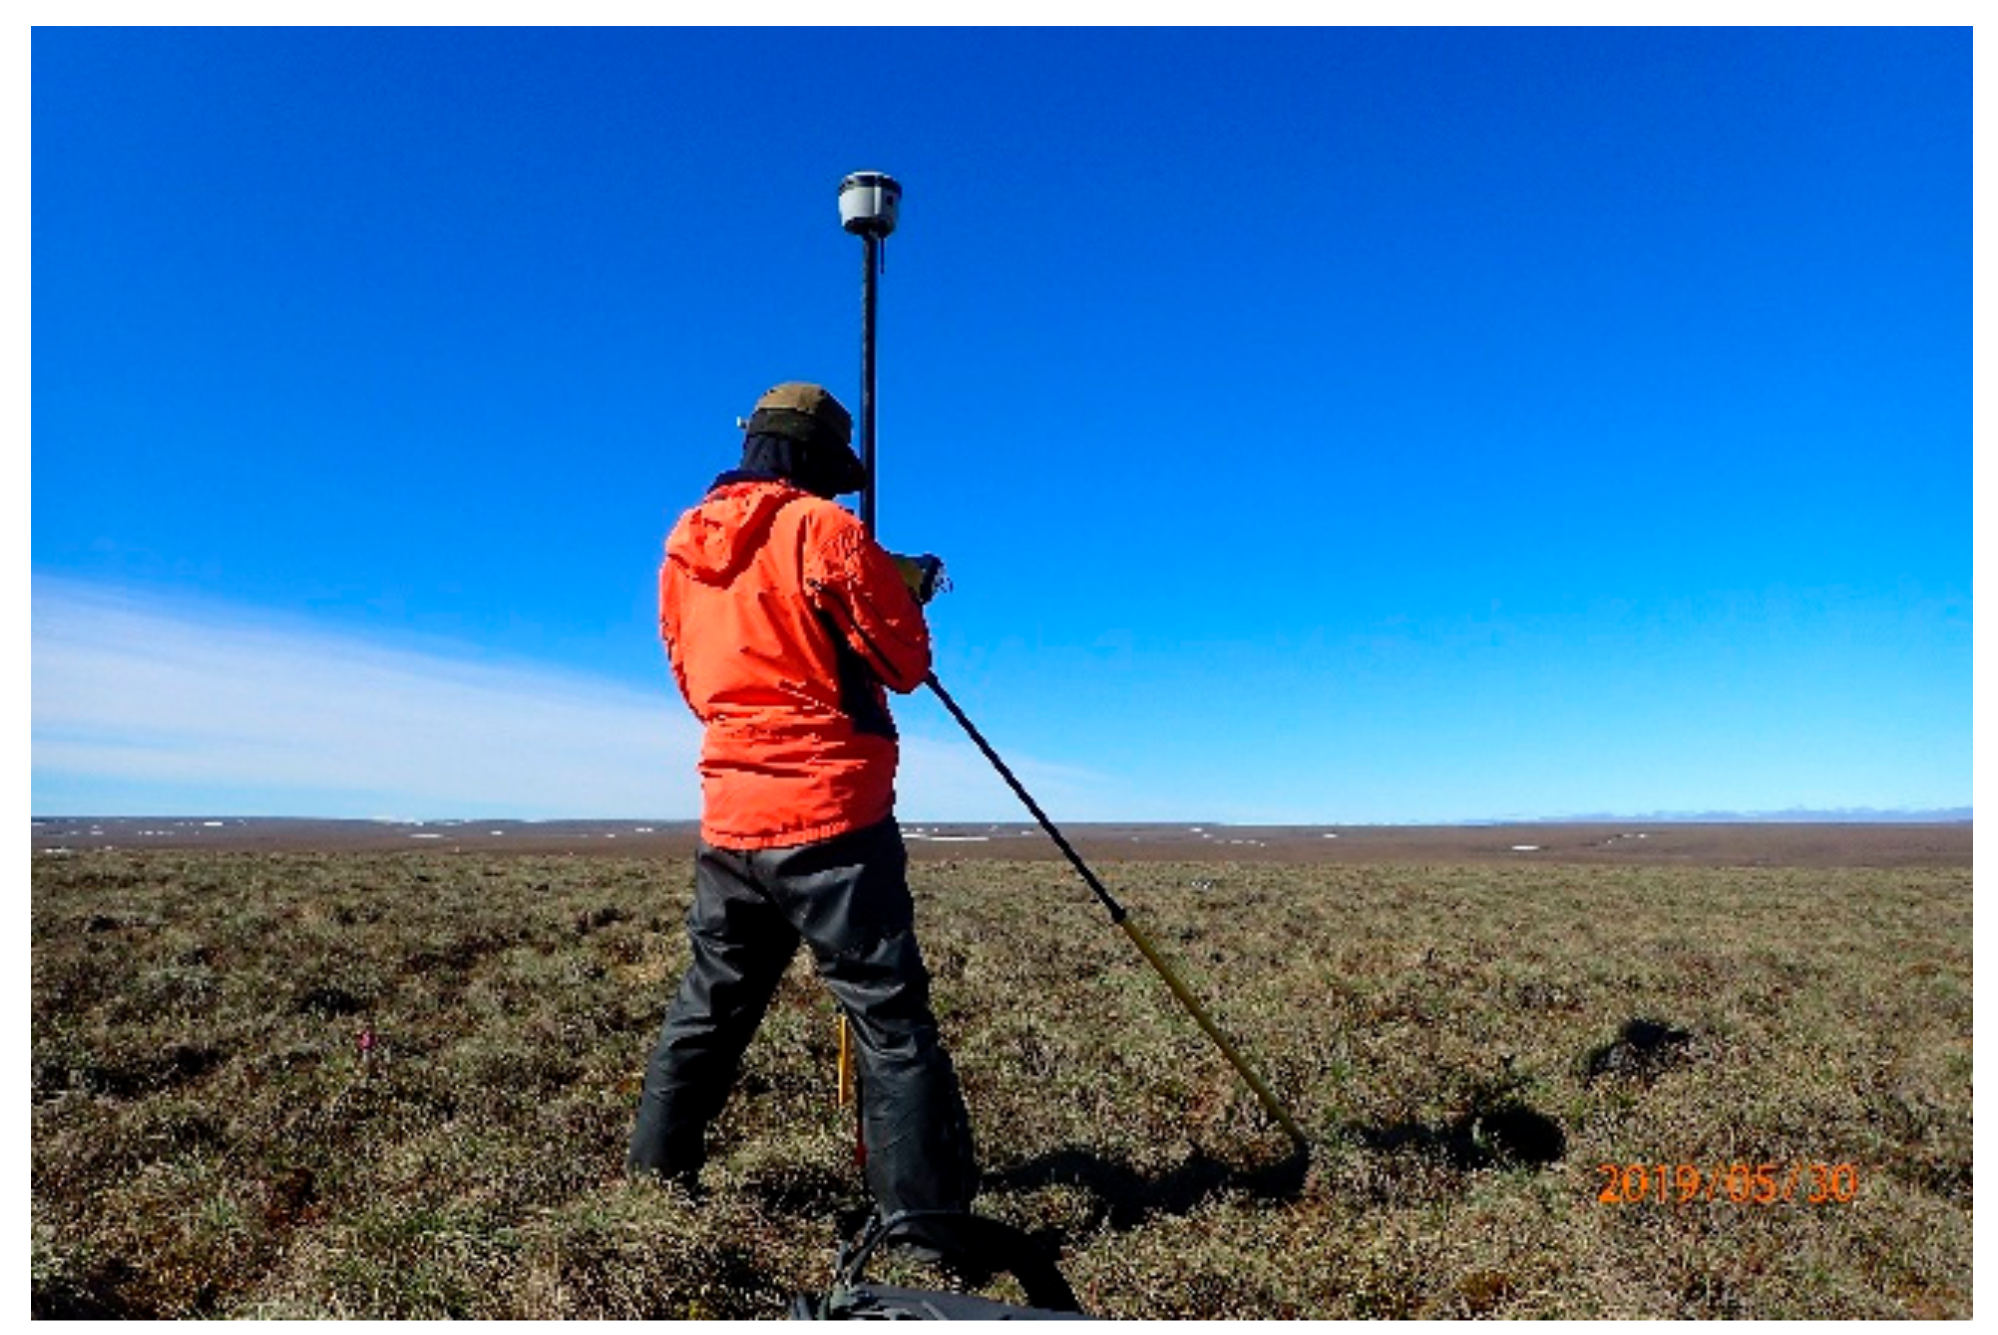
2.2.1. GNSS Survey

We conducted an RTK (real-time kinematic)/PPK (postprocessed kinematic) GNSS (global navigation satellite system) positioning survey to measure seasonal and interannual ground-surface displacement at targeted tundra sites (Figure 2). At each site, we installed transect lines permanently marked by surveyor stakes at intervals of 1 or 5 m. The measurements were repeatedly performed at the marked ground surfaces at the beginning and end of thawing season from 2017 to 2019. We used a Trimble R9s GNSS receiver as a base station and the R2 receiver placed on the top of a carbon-fiber survey rod with a flat topo shoe (Seco, 5192-02) as a rover. The nominal vertical accuracies of static and RTK/PPK GNSS positioning were 5 mm + 0.5 ppm RMS (root mean square) and 20 mm + 1 ppm RMS, respectively (Trimble Inc., USA).
The height of the measuring ground surface was defined as the height at which the rover rod’s bottom settled by the entire rover weight. To avoid ambiguity in selecting the ground surface around a survey stake by different surveyors at timings, we installed the survey stakes at the center of flat tundra areas with an approximate diameter larger than 10 cm. The GNSS positioning was performed for more than 10 s at each measurement point. The measured points with vertical precision larger than 15 mm were discarded and remeasured when the RTK survey was performed. Postprocessing of PPK or static measurements was carried out using the software Trimble Business Center. Postprocessed points with low vertical precision (larger than 15 mm) were removed from further analysis during postprocessing.
A permanent stake was installed in the permafrost layer at least 1 m deep at each site and repeatedly used as a reference point. While we can safely assume that the reference height was stable during a thawing season, frost jacking of the stakes was sometimes unavoidable. To minimize the error in vertical height of the reference rods raised by frost jacking, we used individual postprocessed base locations measured every year. The base locations were measured for at least 24 h to obtain a vertical measurement precision of static GNSS positioning less than 20 mm. Combining the measurement errors of the rover and base, we estimated the overall GNSS positioning accuracies to be less than 21 and 29 mm for STS and interannual displacement, respectively.
STS was determined by the difference in the ground-surface heights measured at the beginning and end of thaw season each year. Interannual surface displacement for the individual interval was determined according to the height difference between measurements of the ground-surface heights for the corresponding time interval.

2.2.2. Thaw Depth and Surface Moisture

We measured TD and surface moisture at the end of thawing seasons nearby the survey points within a few days of the GNSS survey. TD was determined by pounding a steel rod into the ground until frost was encountered. As an indicator of volumetric water content in the ground surface, the travel time of electromagnetic waves (TDR period) at depths of 6, 12, and 20 cm was measured by HydroSence II (Campbell Scientific Logan).

2.3. Statistical Analysis

Statistical testing and calculations were done using R version 3.6.1 software [38] with the “corrplot” package [39].

3. Results

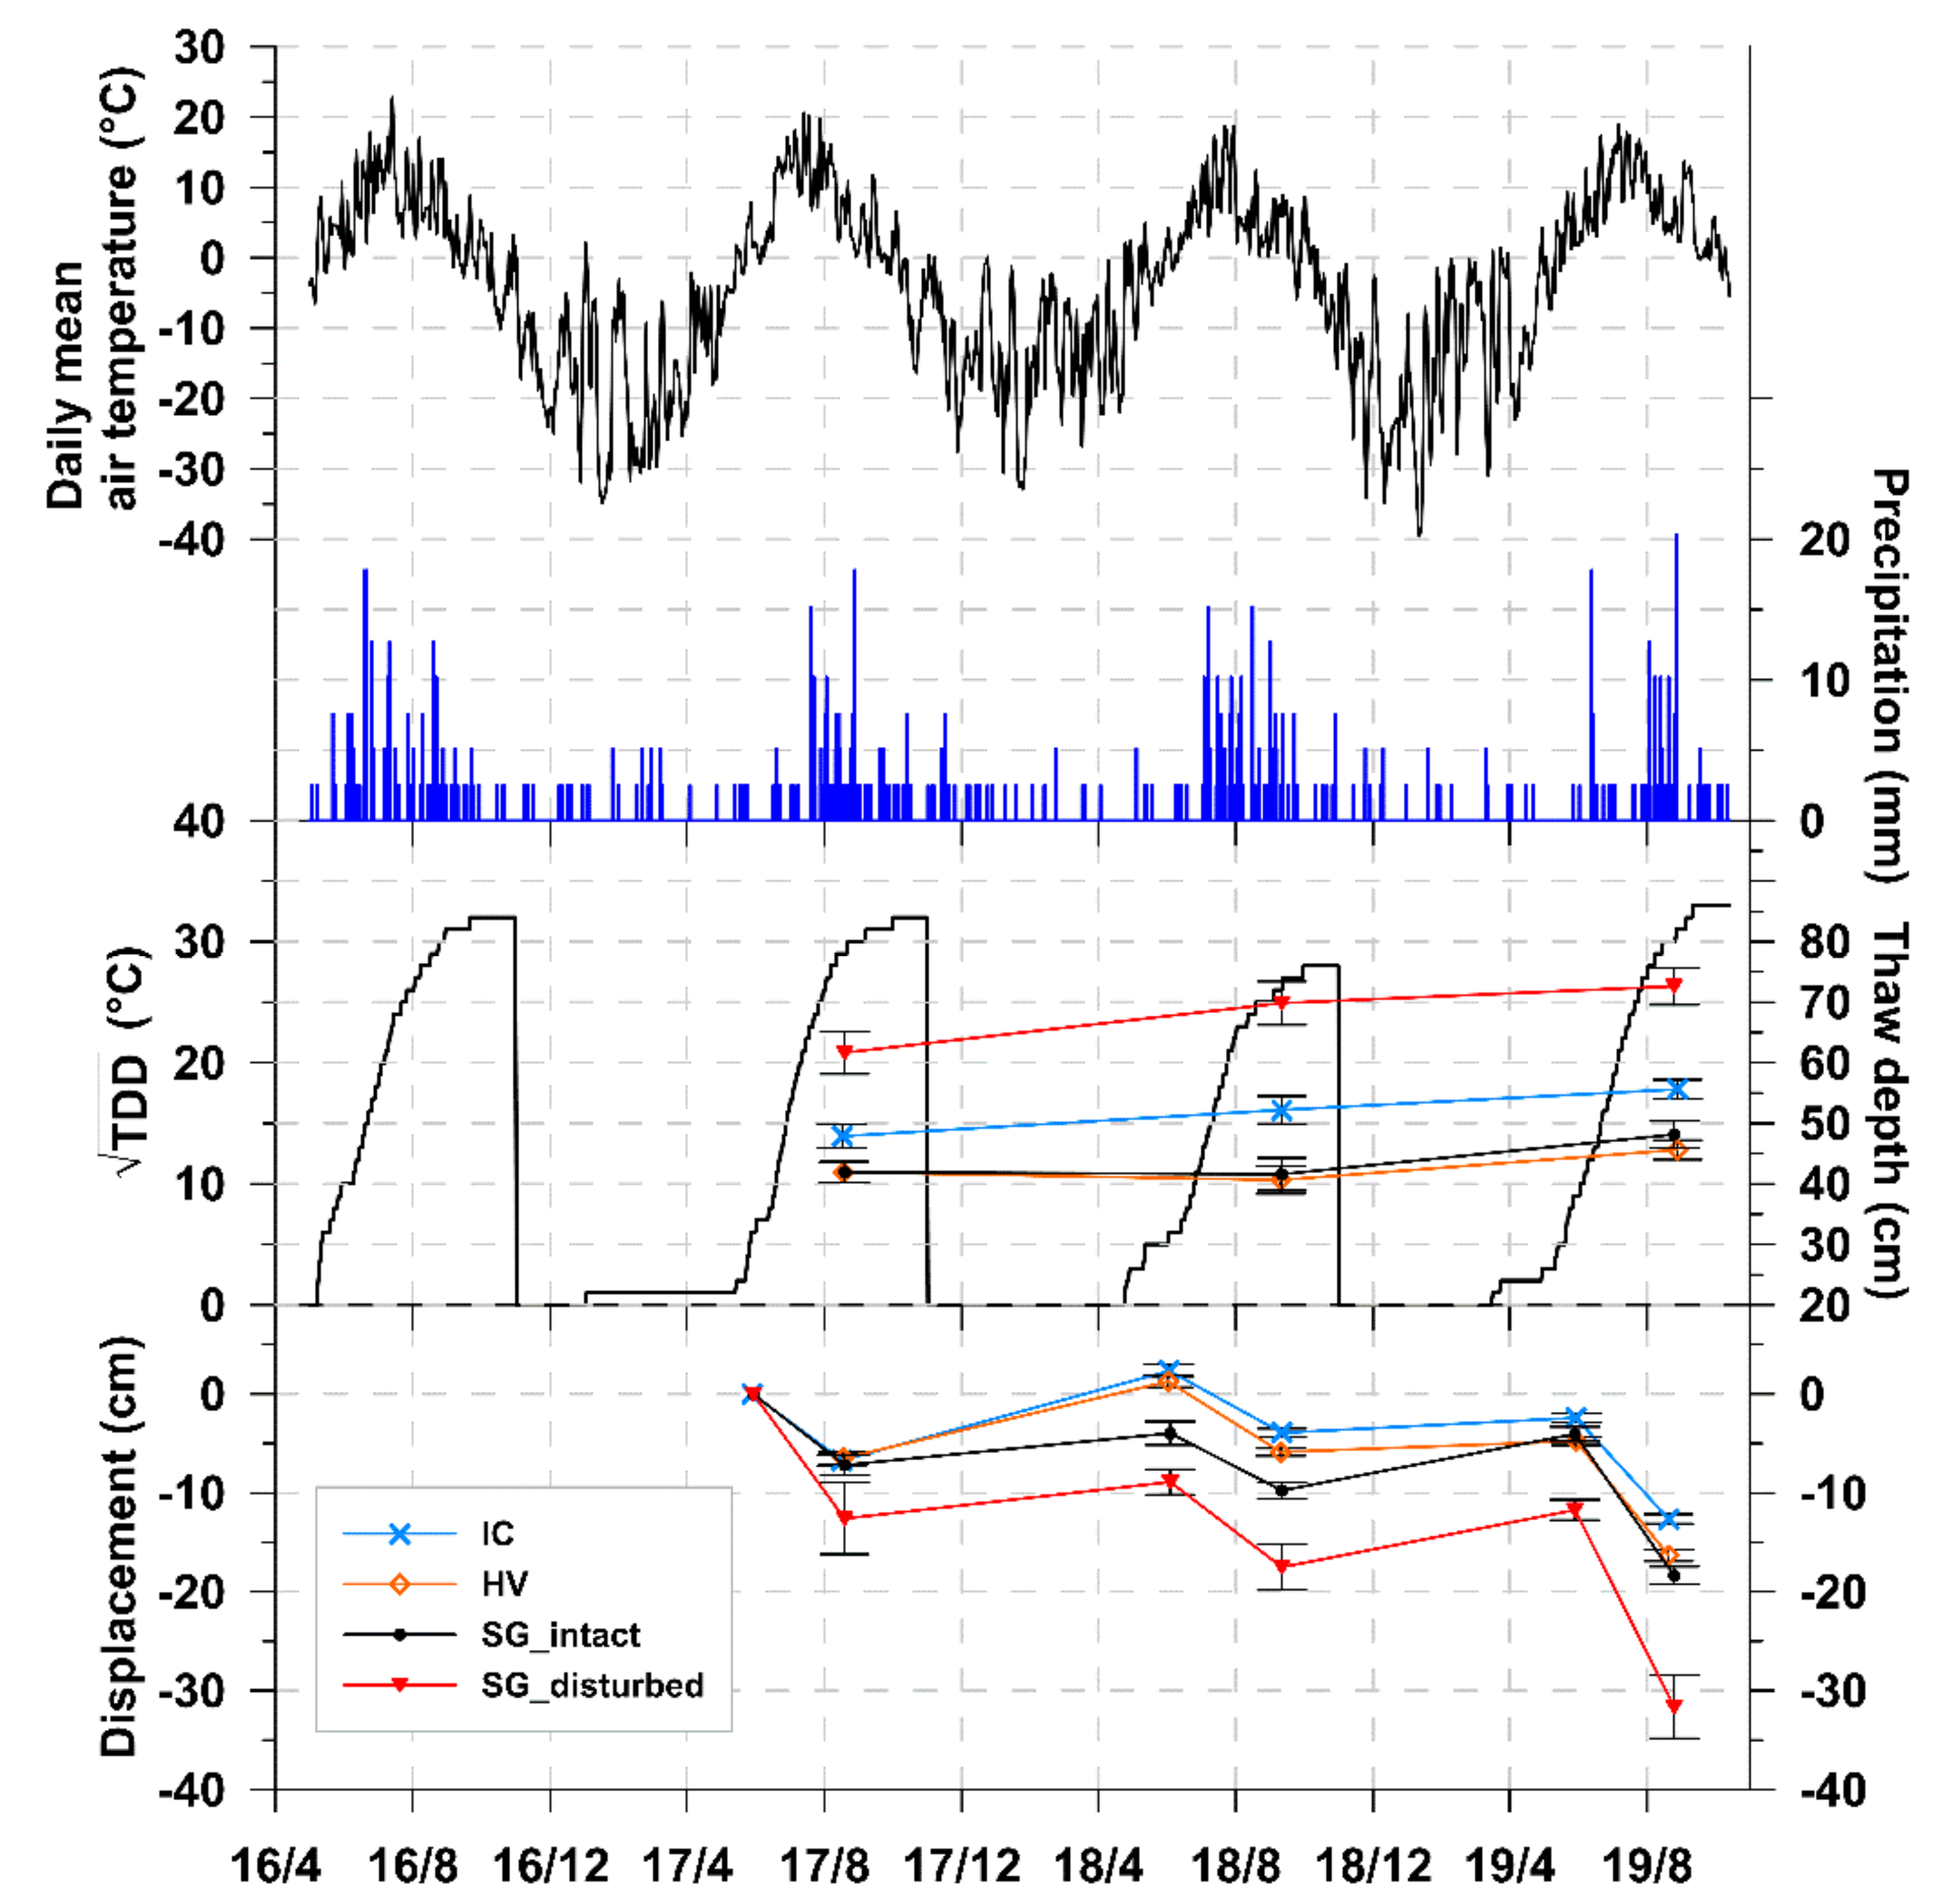
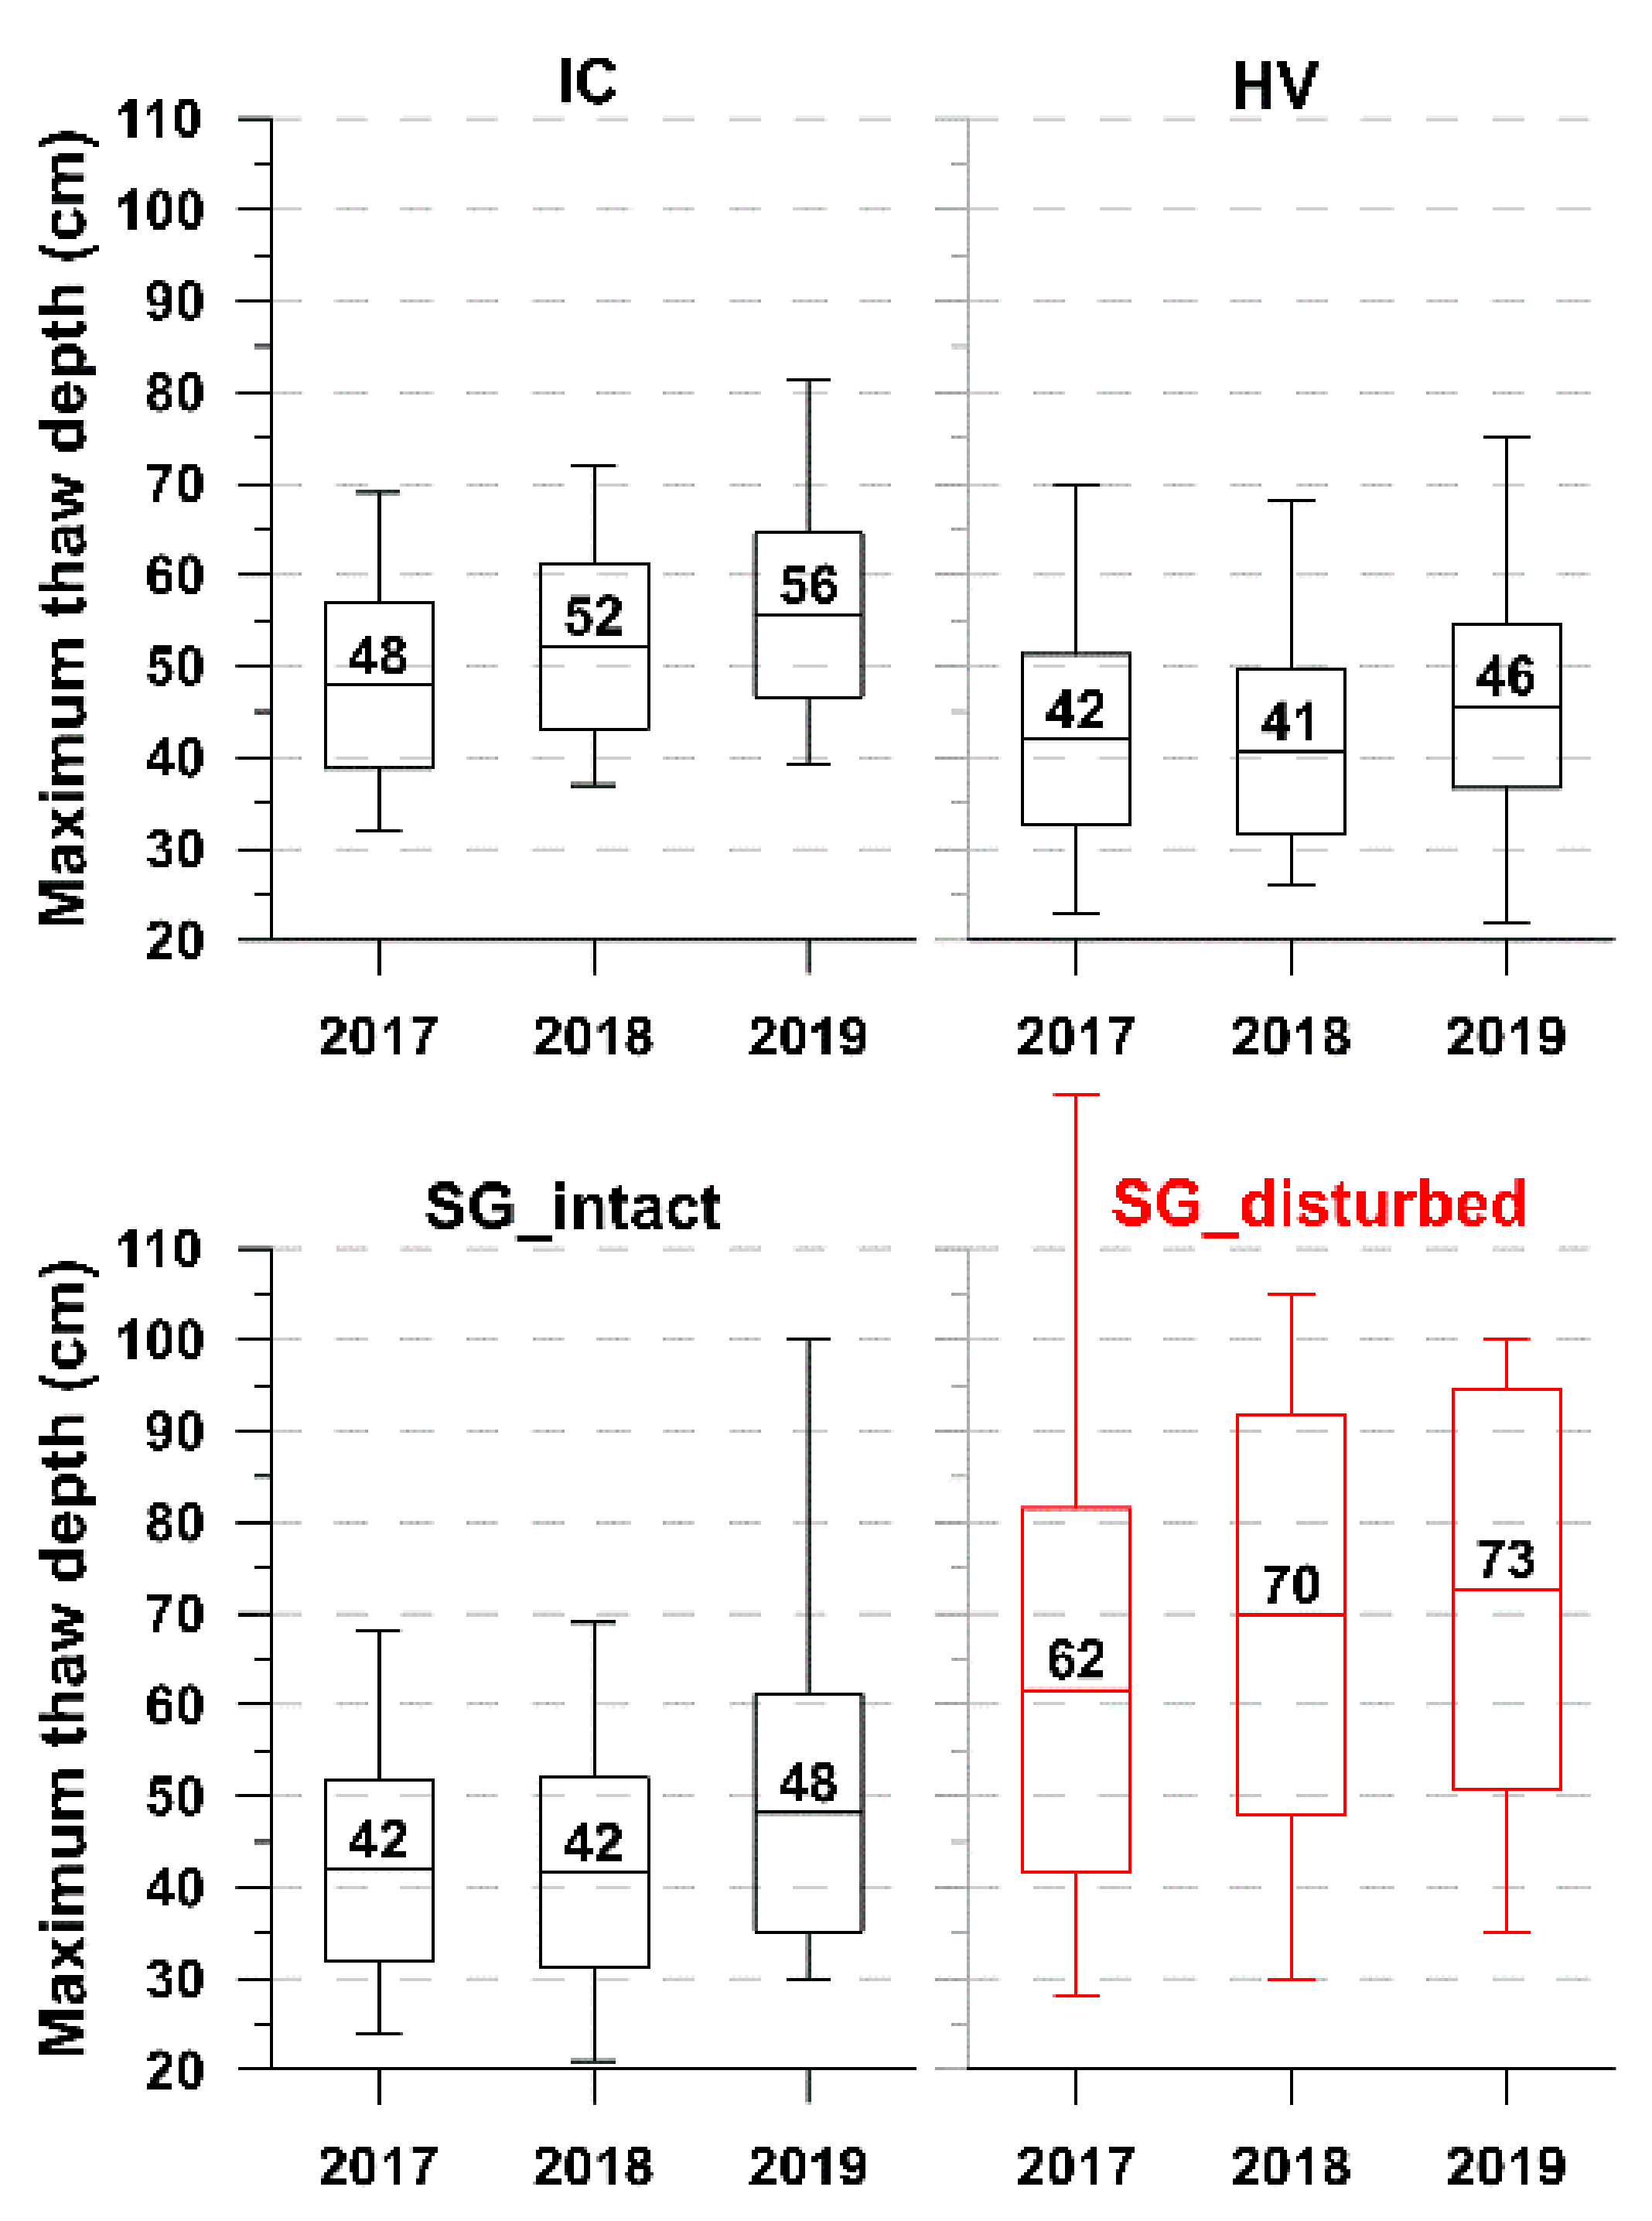
3.1. Variation in the Maximum Thaw Depth

For each study site, the maximum thaw depth (TD) measurements with confidential intervals are summarized in Table 2 and Figure 3. The mean TDs at SG_disturbed were the largest (62–73 cm) throughout the study period, and were about 1.5 times larger than the values at other intact sites. The TDs at SG_intact and HV were in a similar range (41–48 cm), while those at IC had an intermediate value (Figure 3, Table 2). Our observed TD ranges at the intact locations were comparable to the TD (about 50 cm) measured at a site a few hundred meters from our sites by Raynolds et al. [33] and Walker et al. [40]. Variations in TD within the areas were largest at SG_disturbed (Figure 4). The standard deviations of TD at SG_disturbed were markedly higher (20–22 cm) than those at IC and HV (9 cm), reflecting the influence of past surface disturbance (Table 2). Although mean TD at SG_intact was as shallow as that at HV, the larger variations in TD compared to other intact sites indicate the nearby influence of surface disturbance at SG_disturbed, and a potential increase of TD in the near future.
The overall trend of interannual change in TD was an increase at all sites from 2017 to 2019. There were monotonic increases in mean TD at SG_disturbed and IC, while the TD at SG_intact and HV showed stagnation in 2018. The largest TD in 2019 was mainly attributed to the warmest summer conditions and the thicker snow depth in the previous winter (Table 1). The development of thermokarst may also cause an increase in TD. However, analysis of the thermokarst processes at the individual site was beyond the scope of this study.
Our TD measurements were conducted at the end of the thawing season each year. TDD1/2 values on the days of TD measurements were 29, 26, and 31, in 2017, 2018, and 2019, respectively. TDD1/2 is often used as an analytical estimate of the progress of seasonal thaw depth in permafrost regions, according to the simplified Stefan equation (e.g., [41,42,43]) as well as for the interannual comparison of active layer thickness (e.g., [20,21]). TDD1/2 values on our measurement dates were 94%, 96%, and 97% of the annual maximum values, respectively (Figure 3). Therefore, we regarded our measured TD as maximum seasonal values for an interannual comparison.

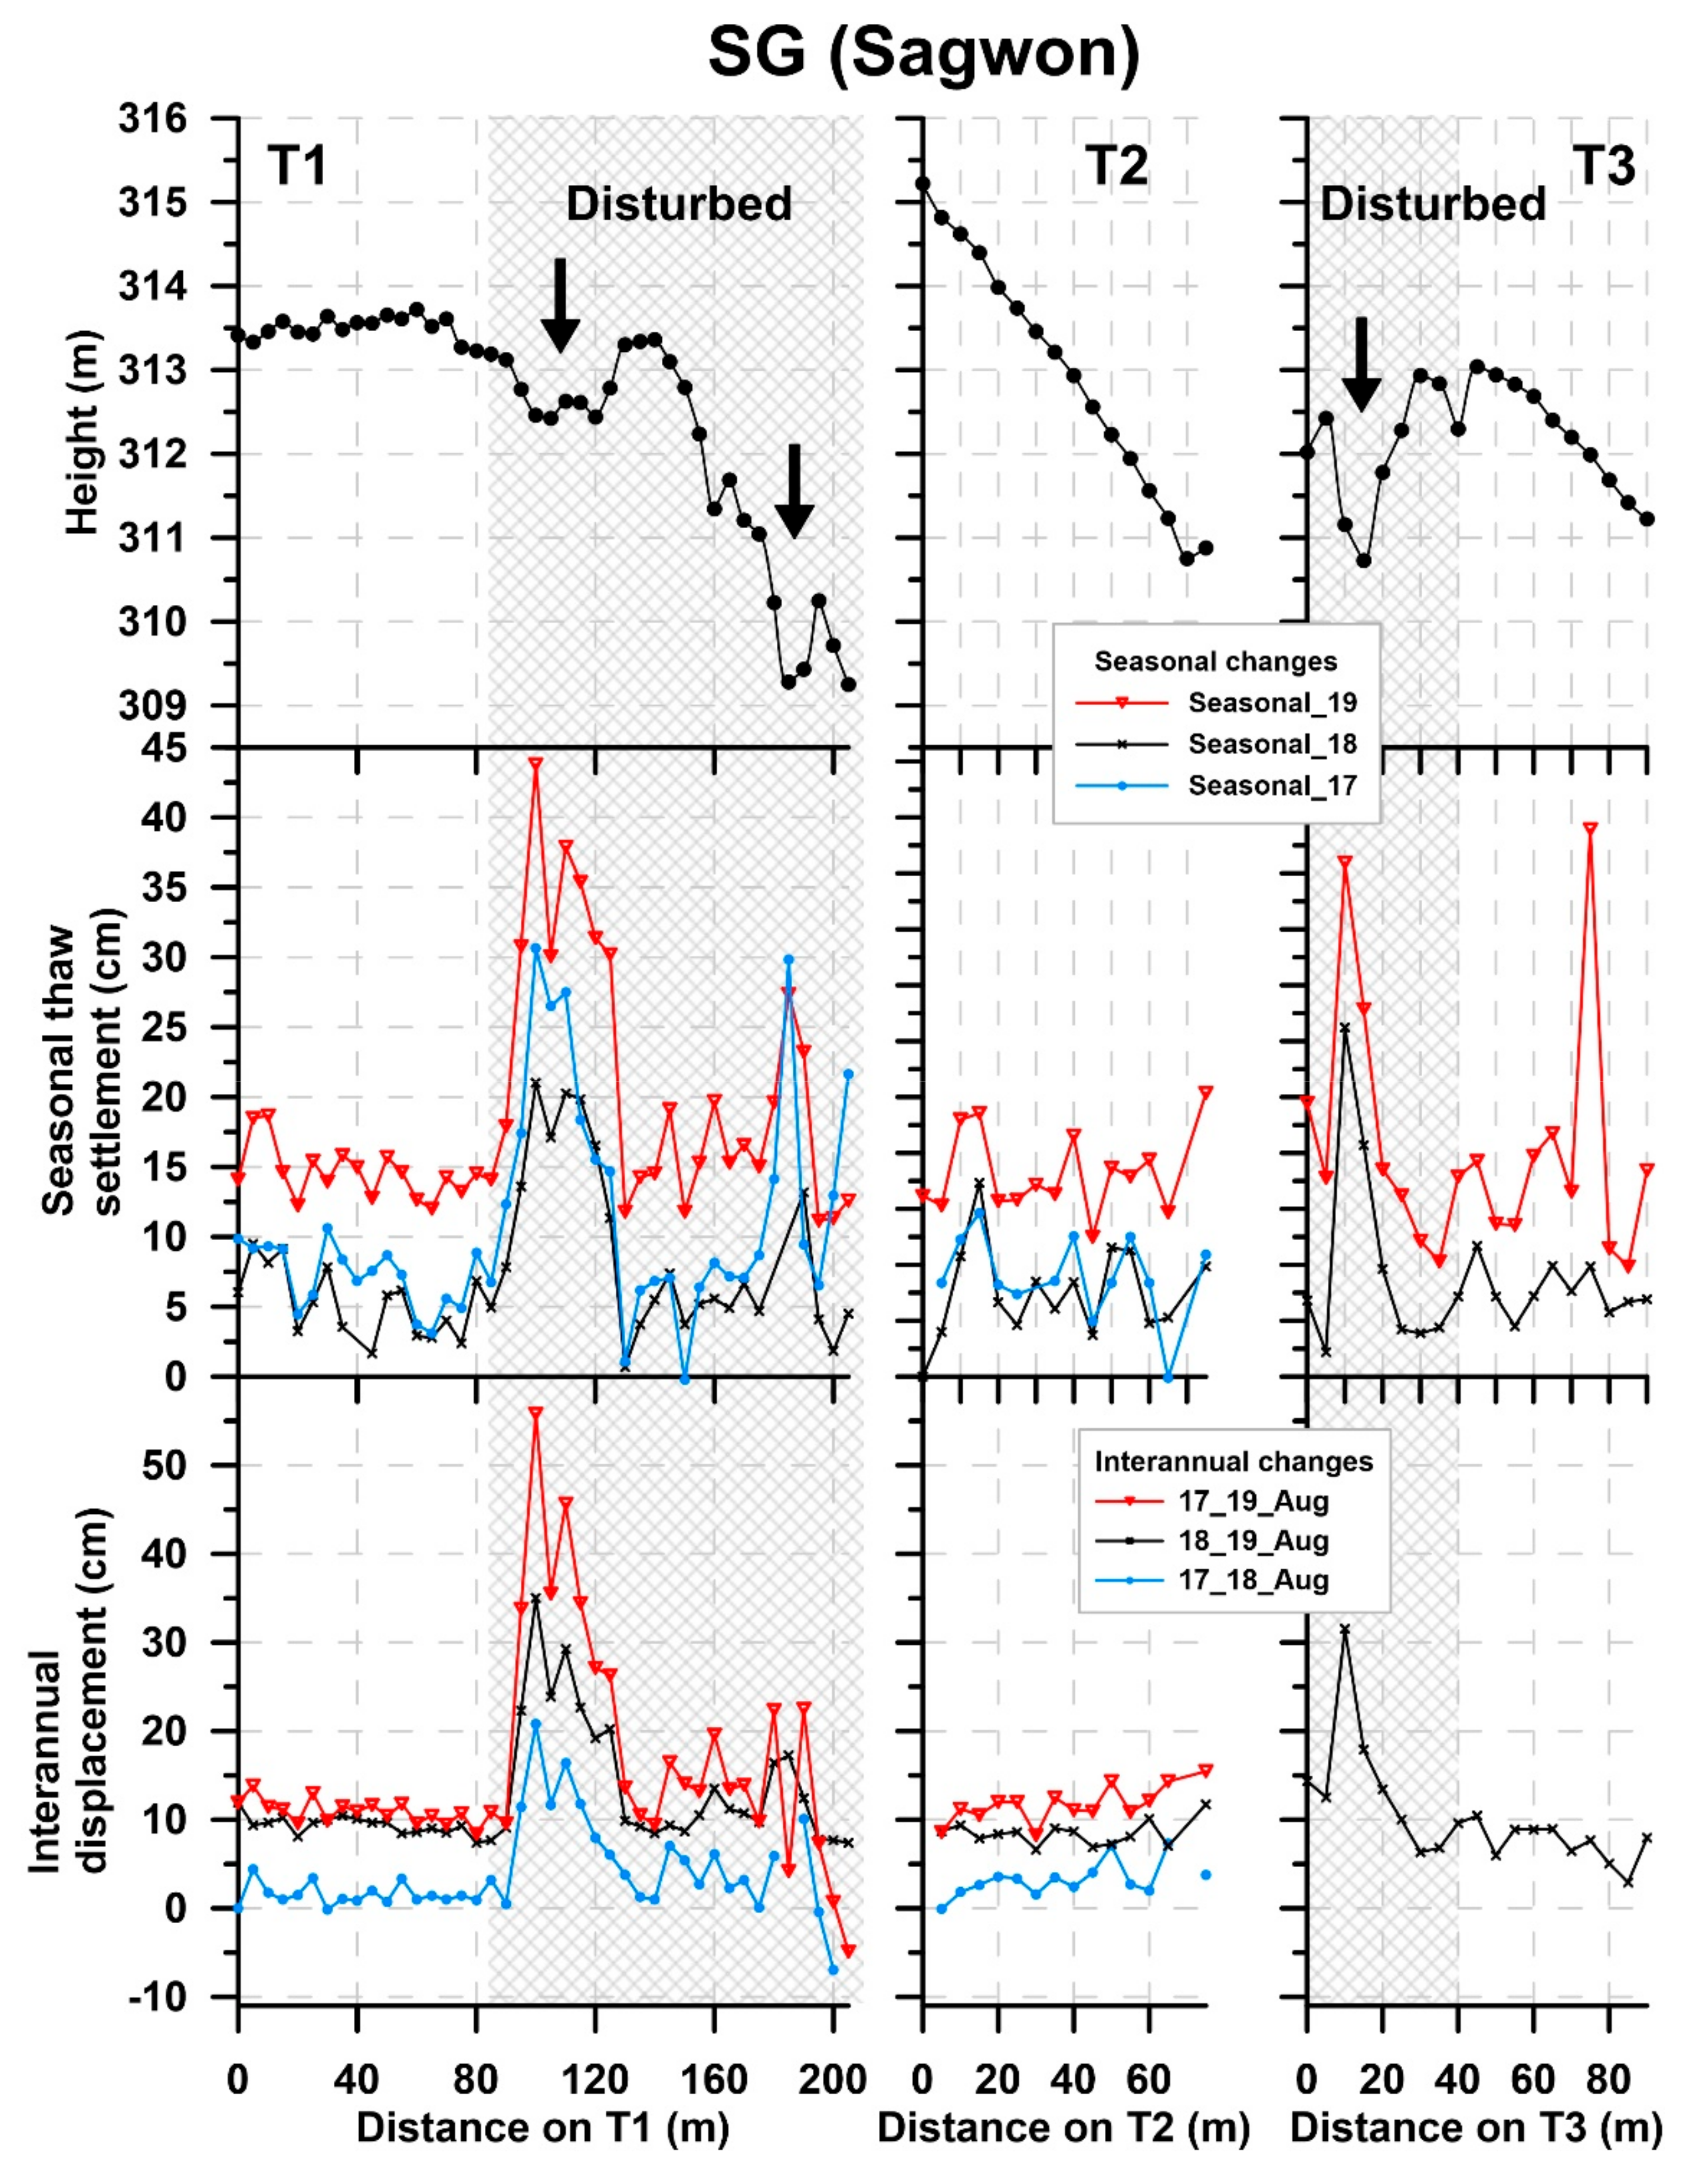
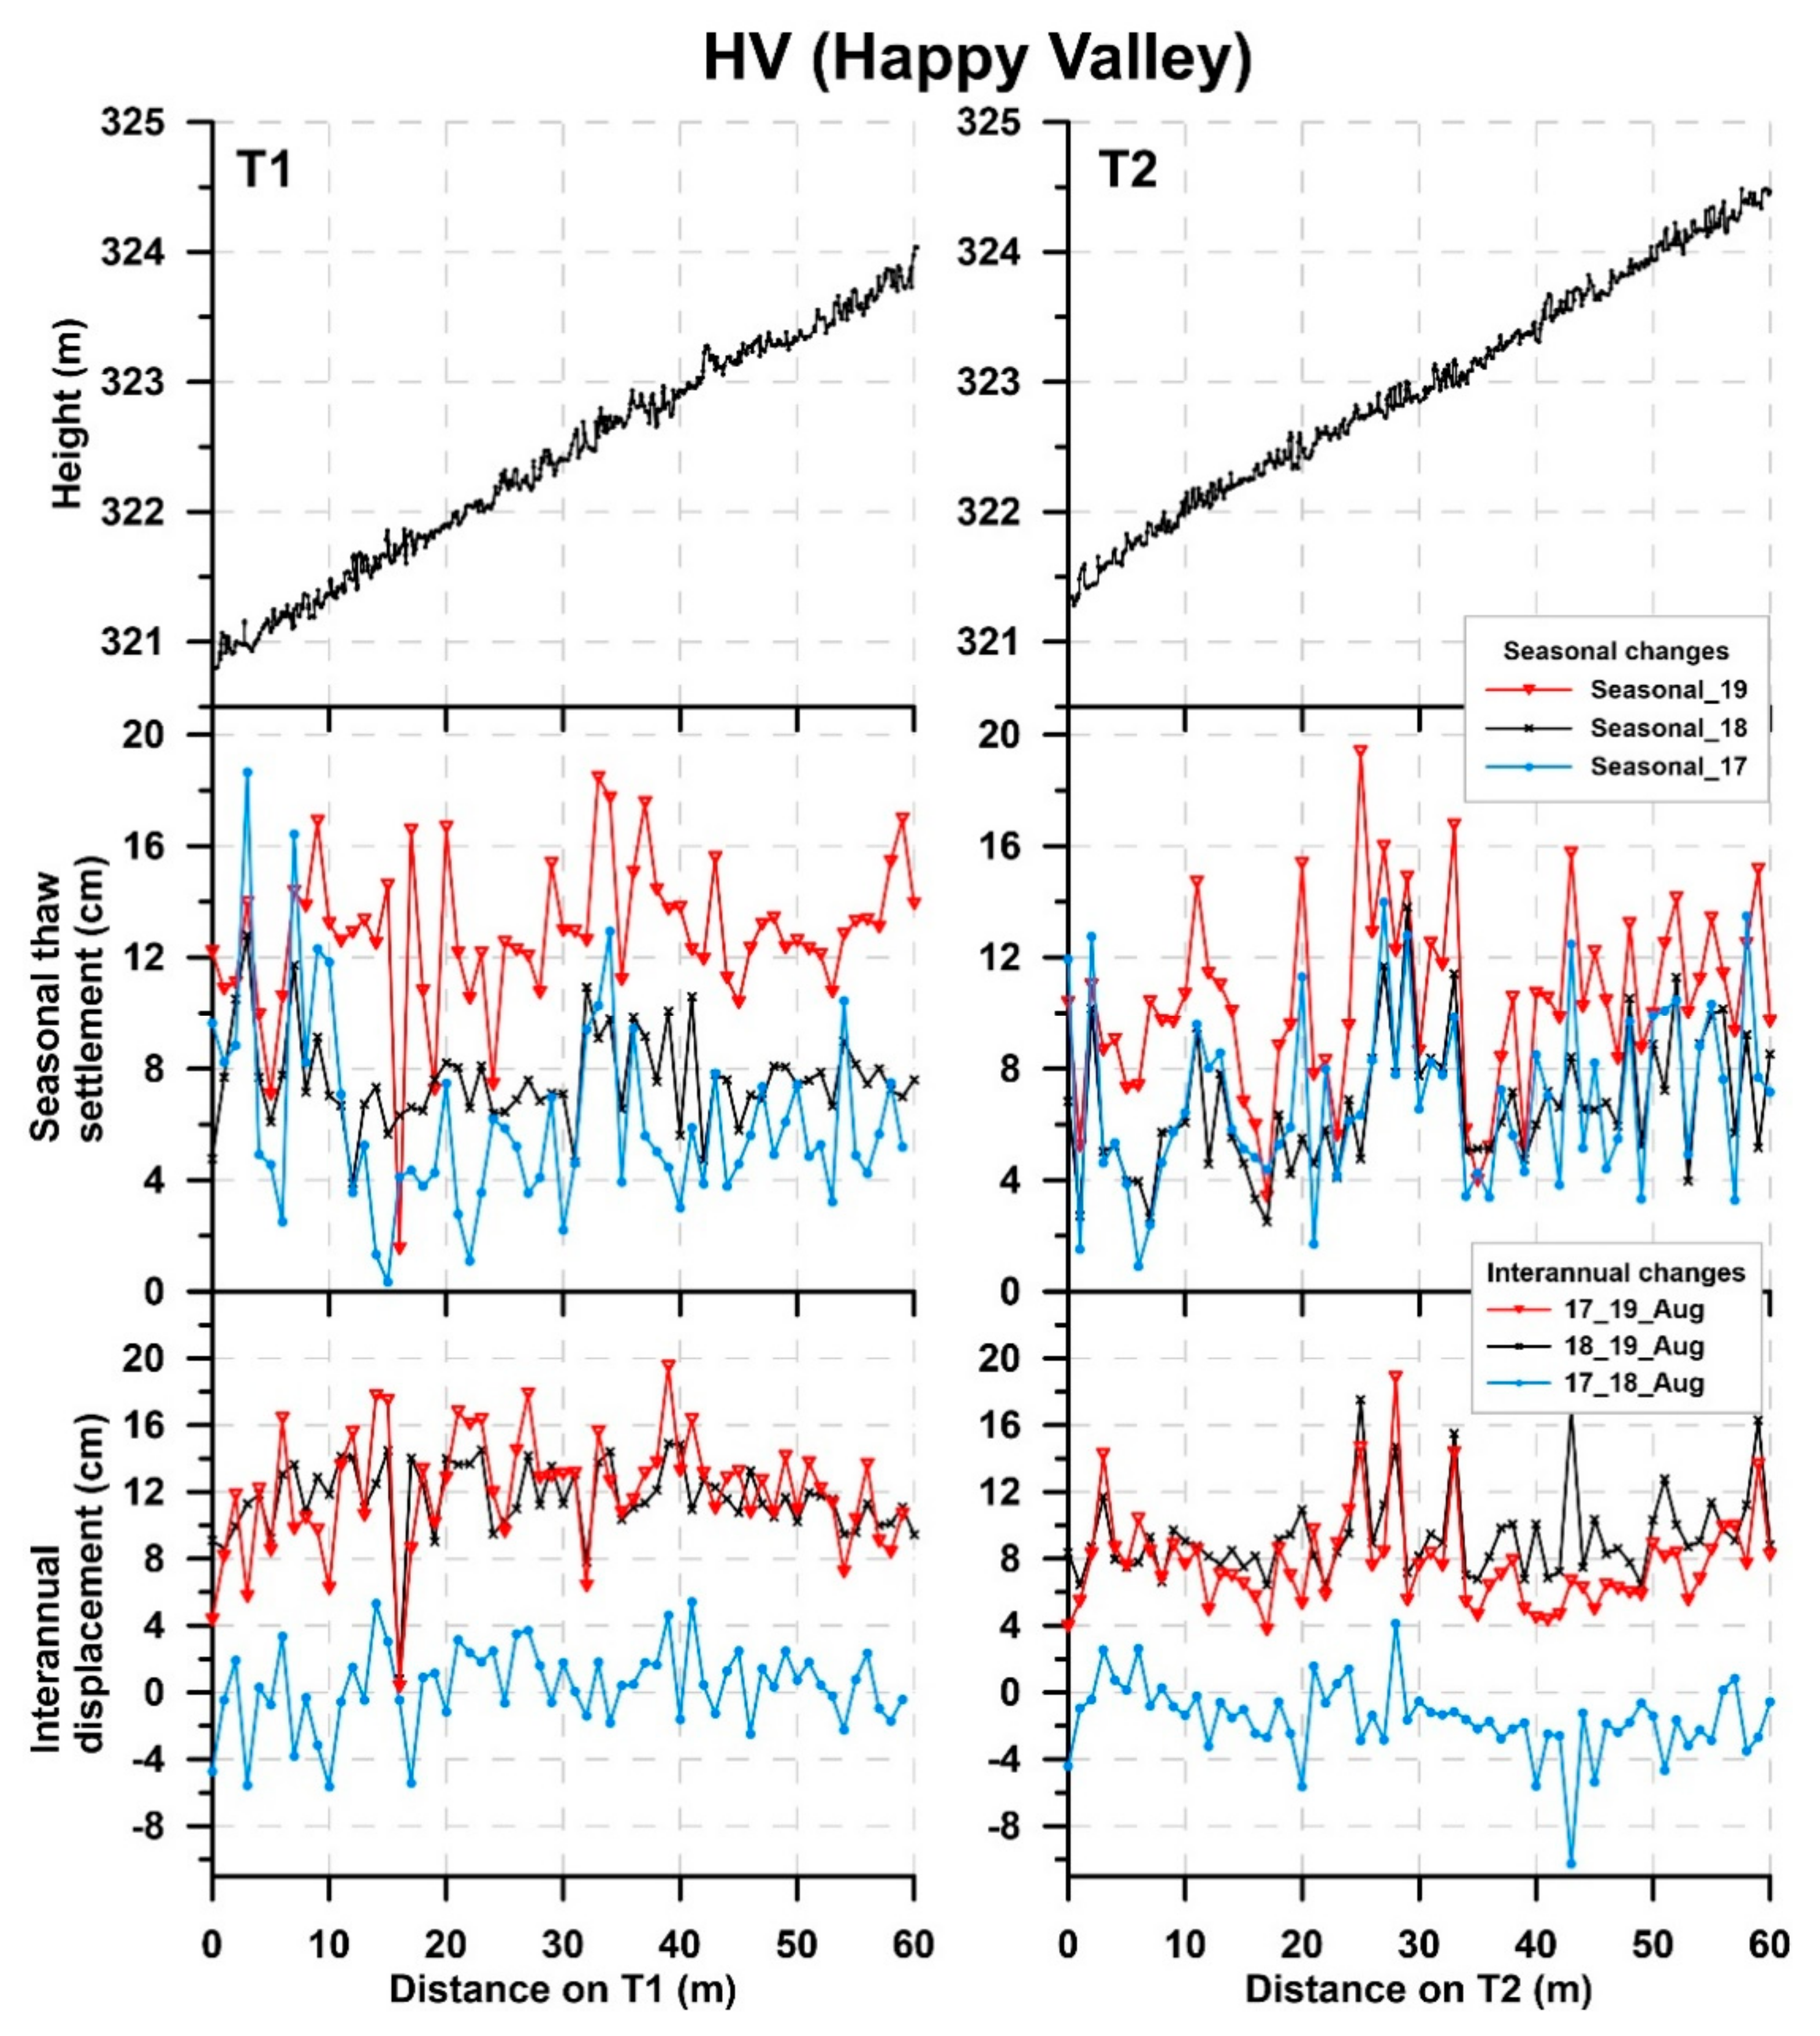
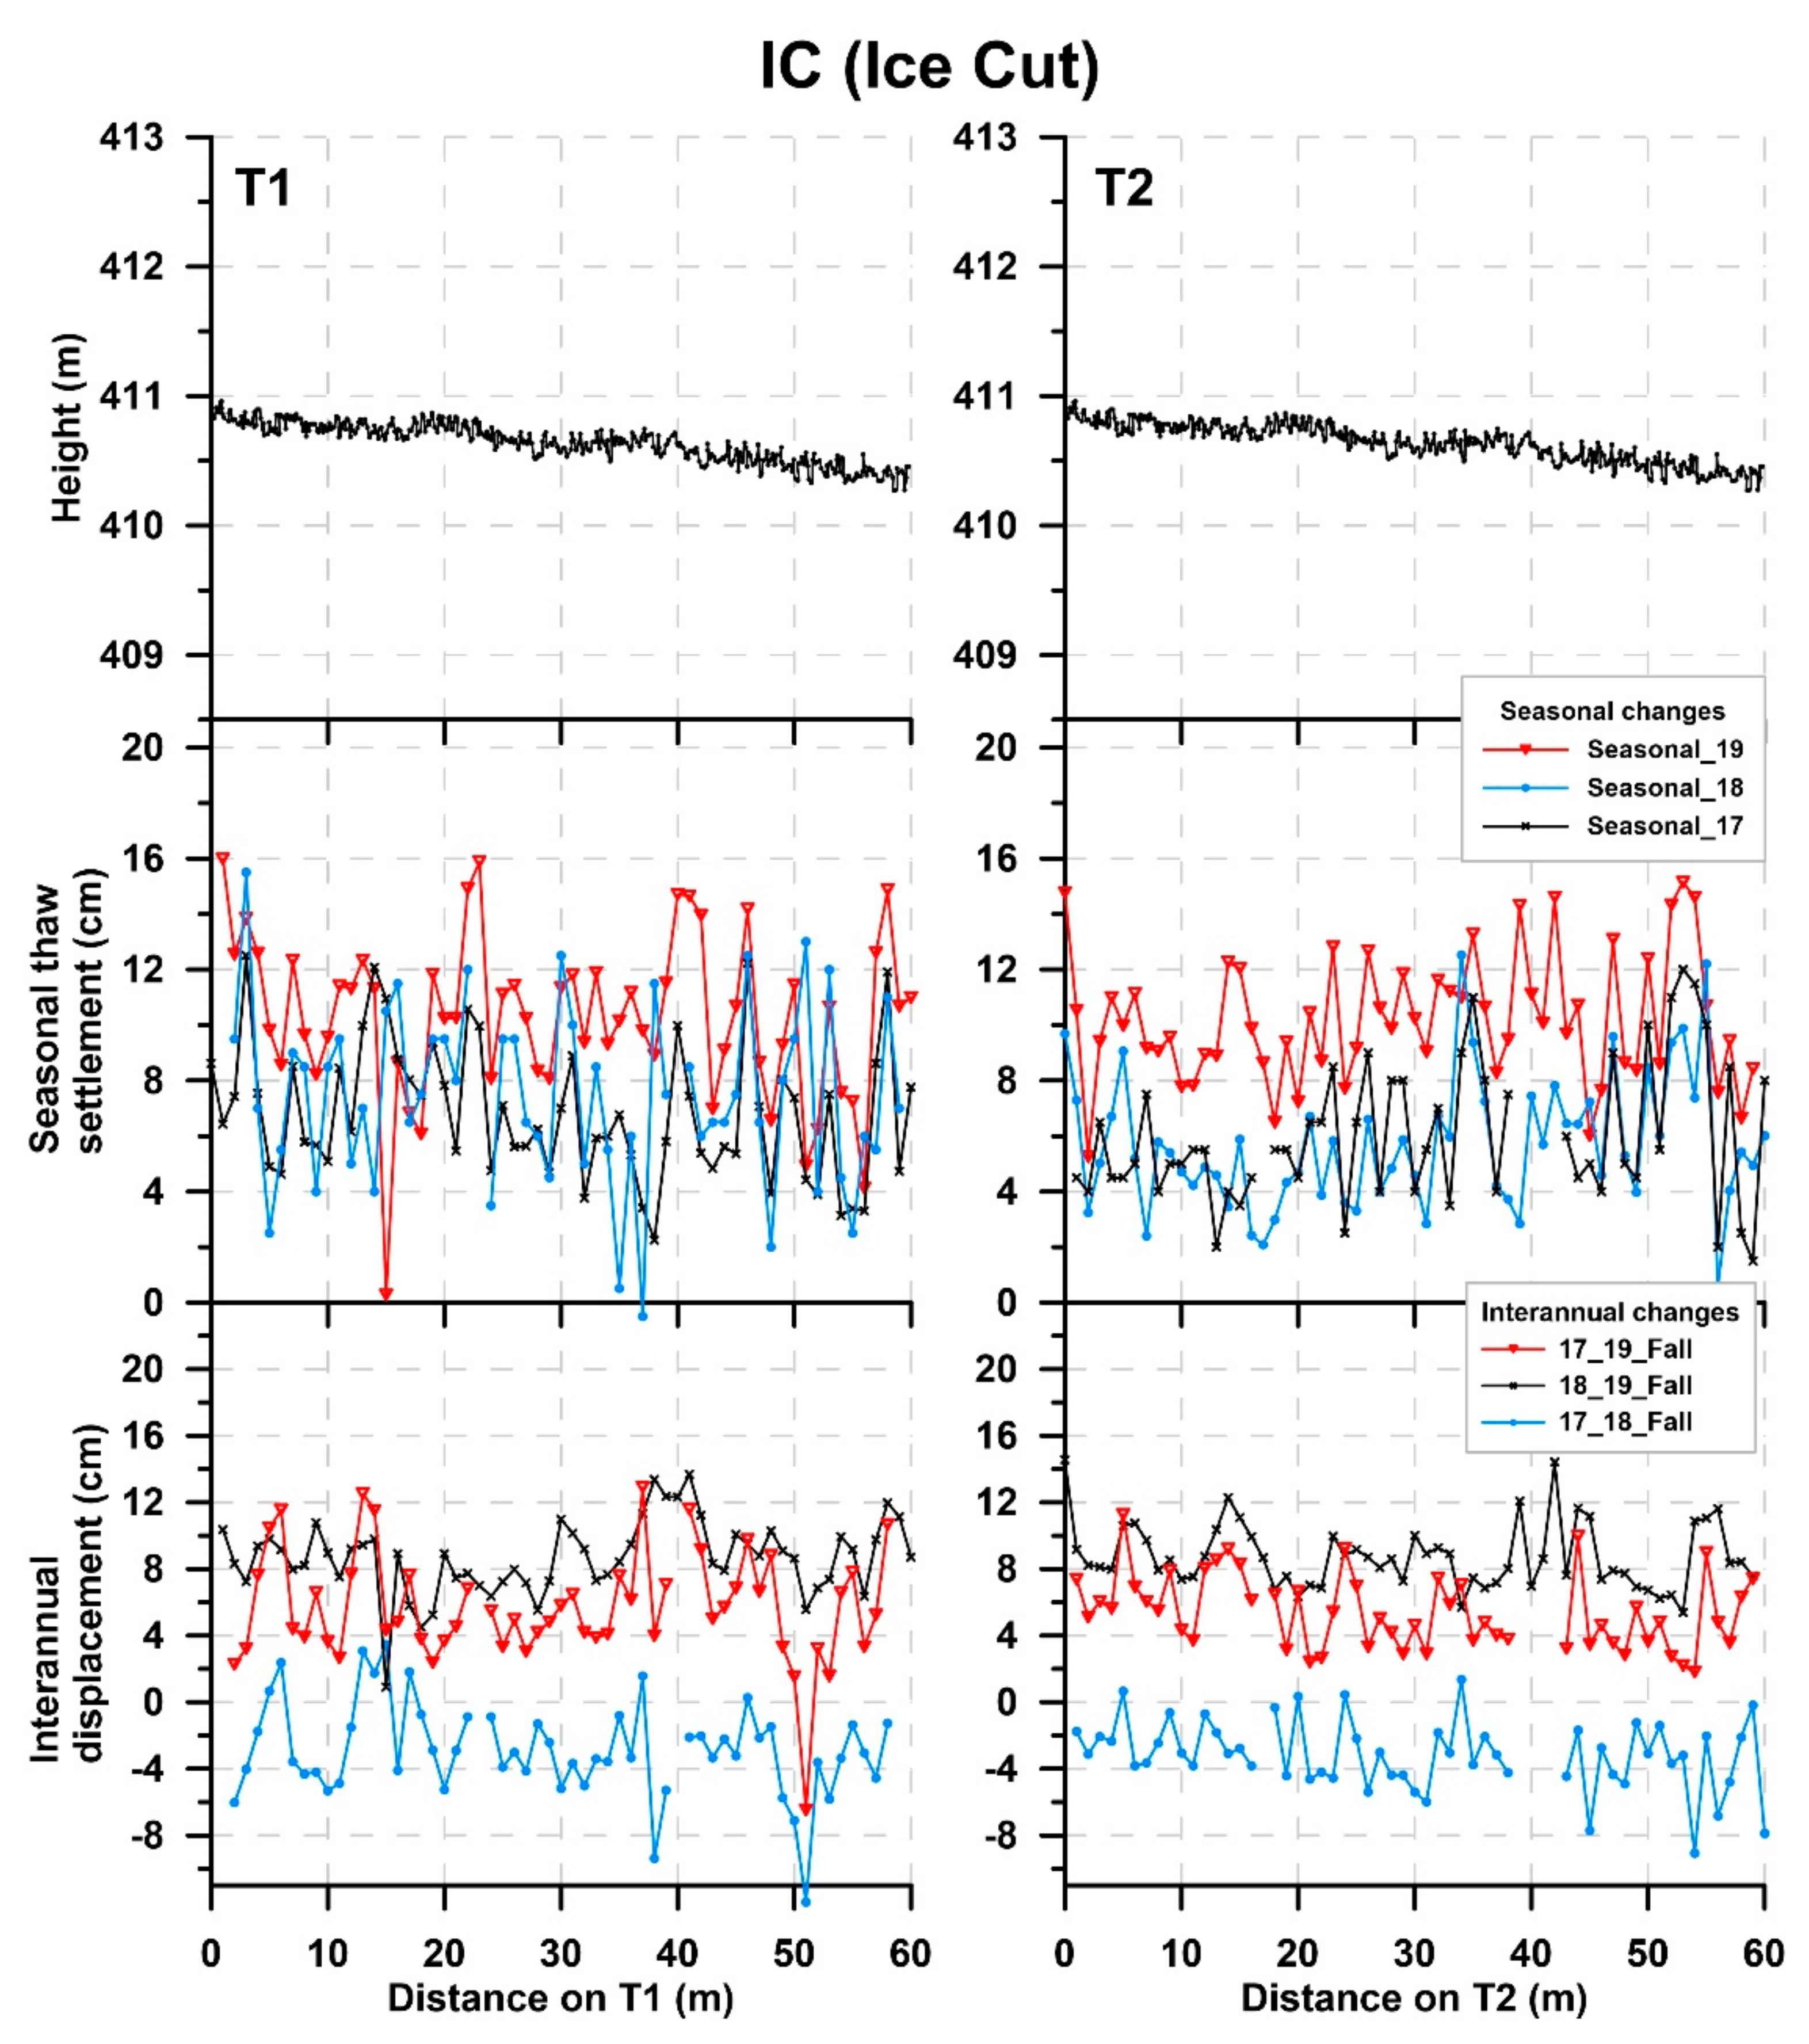
3.2. Variation in Surface Displacement

Our GNSS surveys captured the variation in seasonal thaw settlement (STS) during thawing seasons and frost heave during freezing seasons, together with interannual ground-surface displacement at each site (Figure 3), depending on the year and location. The averaged STS at intact sites (IC, HV, and SG_intact) ranged between 5.8 and 7.2 cm in 2017 and 2018, while that in 2019 was between 10.2 and 14.3 cm. The STS values at intact sites were slightly smaller than the averaged frost heave (8.8 cm) observed in similar intact tundra on the North Slope, Alaska, by Daanen [44]. Walker et al. [45], Romanovsky et al. [46], and Walker et al. [40] observed a distinct difference in the amount of frost heave between the interior (about 10–15 cm) and exterior (about 2–4 cm) of patterned ground features, such as frost boils, at the nearby HV and SG sites. The magnitude of the seasonal ground-surface displacement was comparable among different observation campaigns. A rigorous comparison between the previous observations and our study was unfeasible because of the differences in measurement timing and microtopography.
The STS at SG_disturbed was highest in all observed years and among all sites (12.6, 8.6, and 19.9 cm in 2017, 2018, and 2019, respectively). The enhanced values of average STS in 2019 at all sites were reasonable considering the warmest summer condition and the greatest TD in 2019. Our observation showed 1.3–1.9-fold larger values of STS at SG_disturbed than at other intact locations. Kade and Walker [47] also observed increased thaw depth and frost heave after a ground-surface disturbance (vegetation removal) near SG.
We observed that similar patterns of STS and frost heave in 2017 and 2018 resulted in a slight upheaval from fall season 2017 to fall 2018, as well as significantly large interannual subsidence from fall 2018 to fall 2019 at IC and HV (Table 2). On the other hand, the ground surface showed monotonic interannual subsidence at SG. We observed that fall season measurements had a much larger average total subsidence at SG_disturbed (18.2 cm) than at SG_intact (11.6 cm). It is highly probable that the thermokarst process is ongoing at SG due to the past surface disturbance, resulting in monotonic interannual subsidence.
Surface disturbance and the thermokarst that followed enhanced the magnitude and spatial variation of ground-surface displacement due to the freeze–thaw cycle in the active layer. Large seasonal and interannual displacement (up to 44 and 56 cm for seasonal and interannual, respectively) was observed in concave areas (arrows in Figure 5) due to thermokarst subsidence in the disturbed zones along transects SG_T1 and SG_T3 (Figure 2a). Standard deviations of STS at SG_disturbed (6.5–9.3 cm) were about three times larger than values at SG_intact, HV, and IC (2.1–3.3 cm) (Table 2).
Characteristics of the fine-scale spatial variation in ground-surface displacement tended to be preserved over the years (Figure 5, Figure 6 and Figure 7). For example, the points with larger STS and interannual subsidence in a certain year tended to have relatively larger values regardless of the observed year. The dependency of the amount of ground-surface displacement on the fine-scale locations obviously indicates the importance of microtopography and the local difference in soil properties, as demonstrated by Walker et al. [45], Romanovsky et al. [46], and Walker et al. [40].

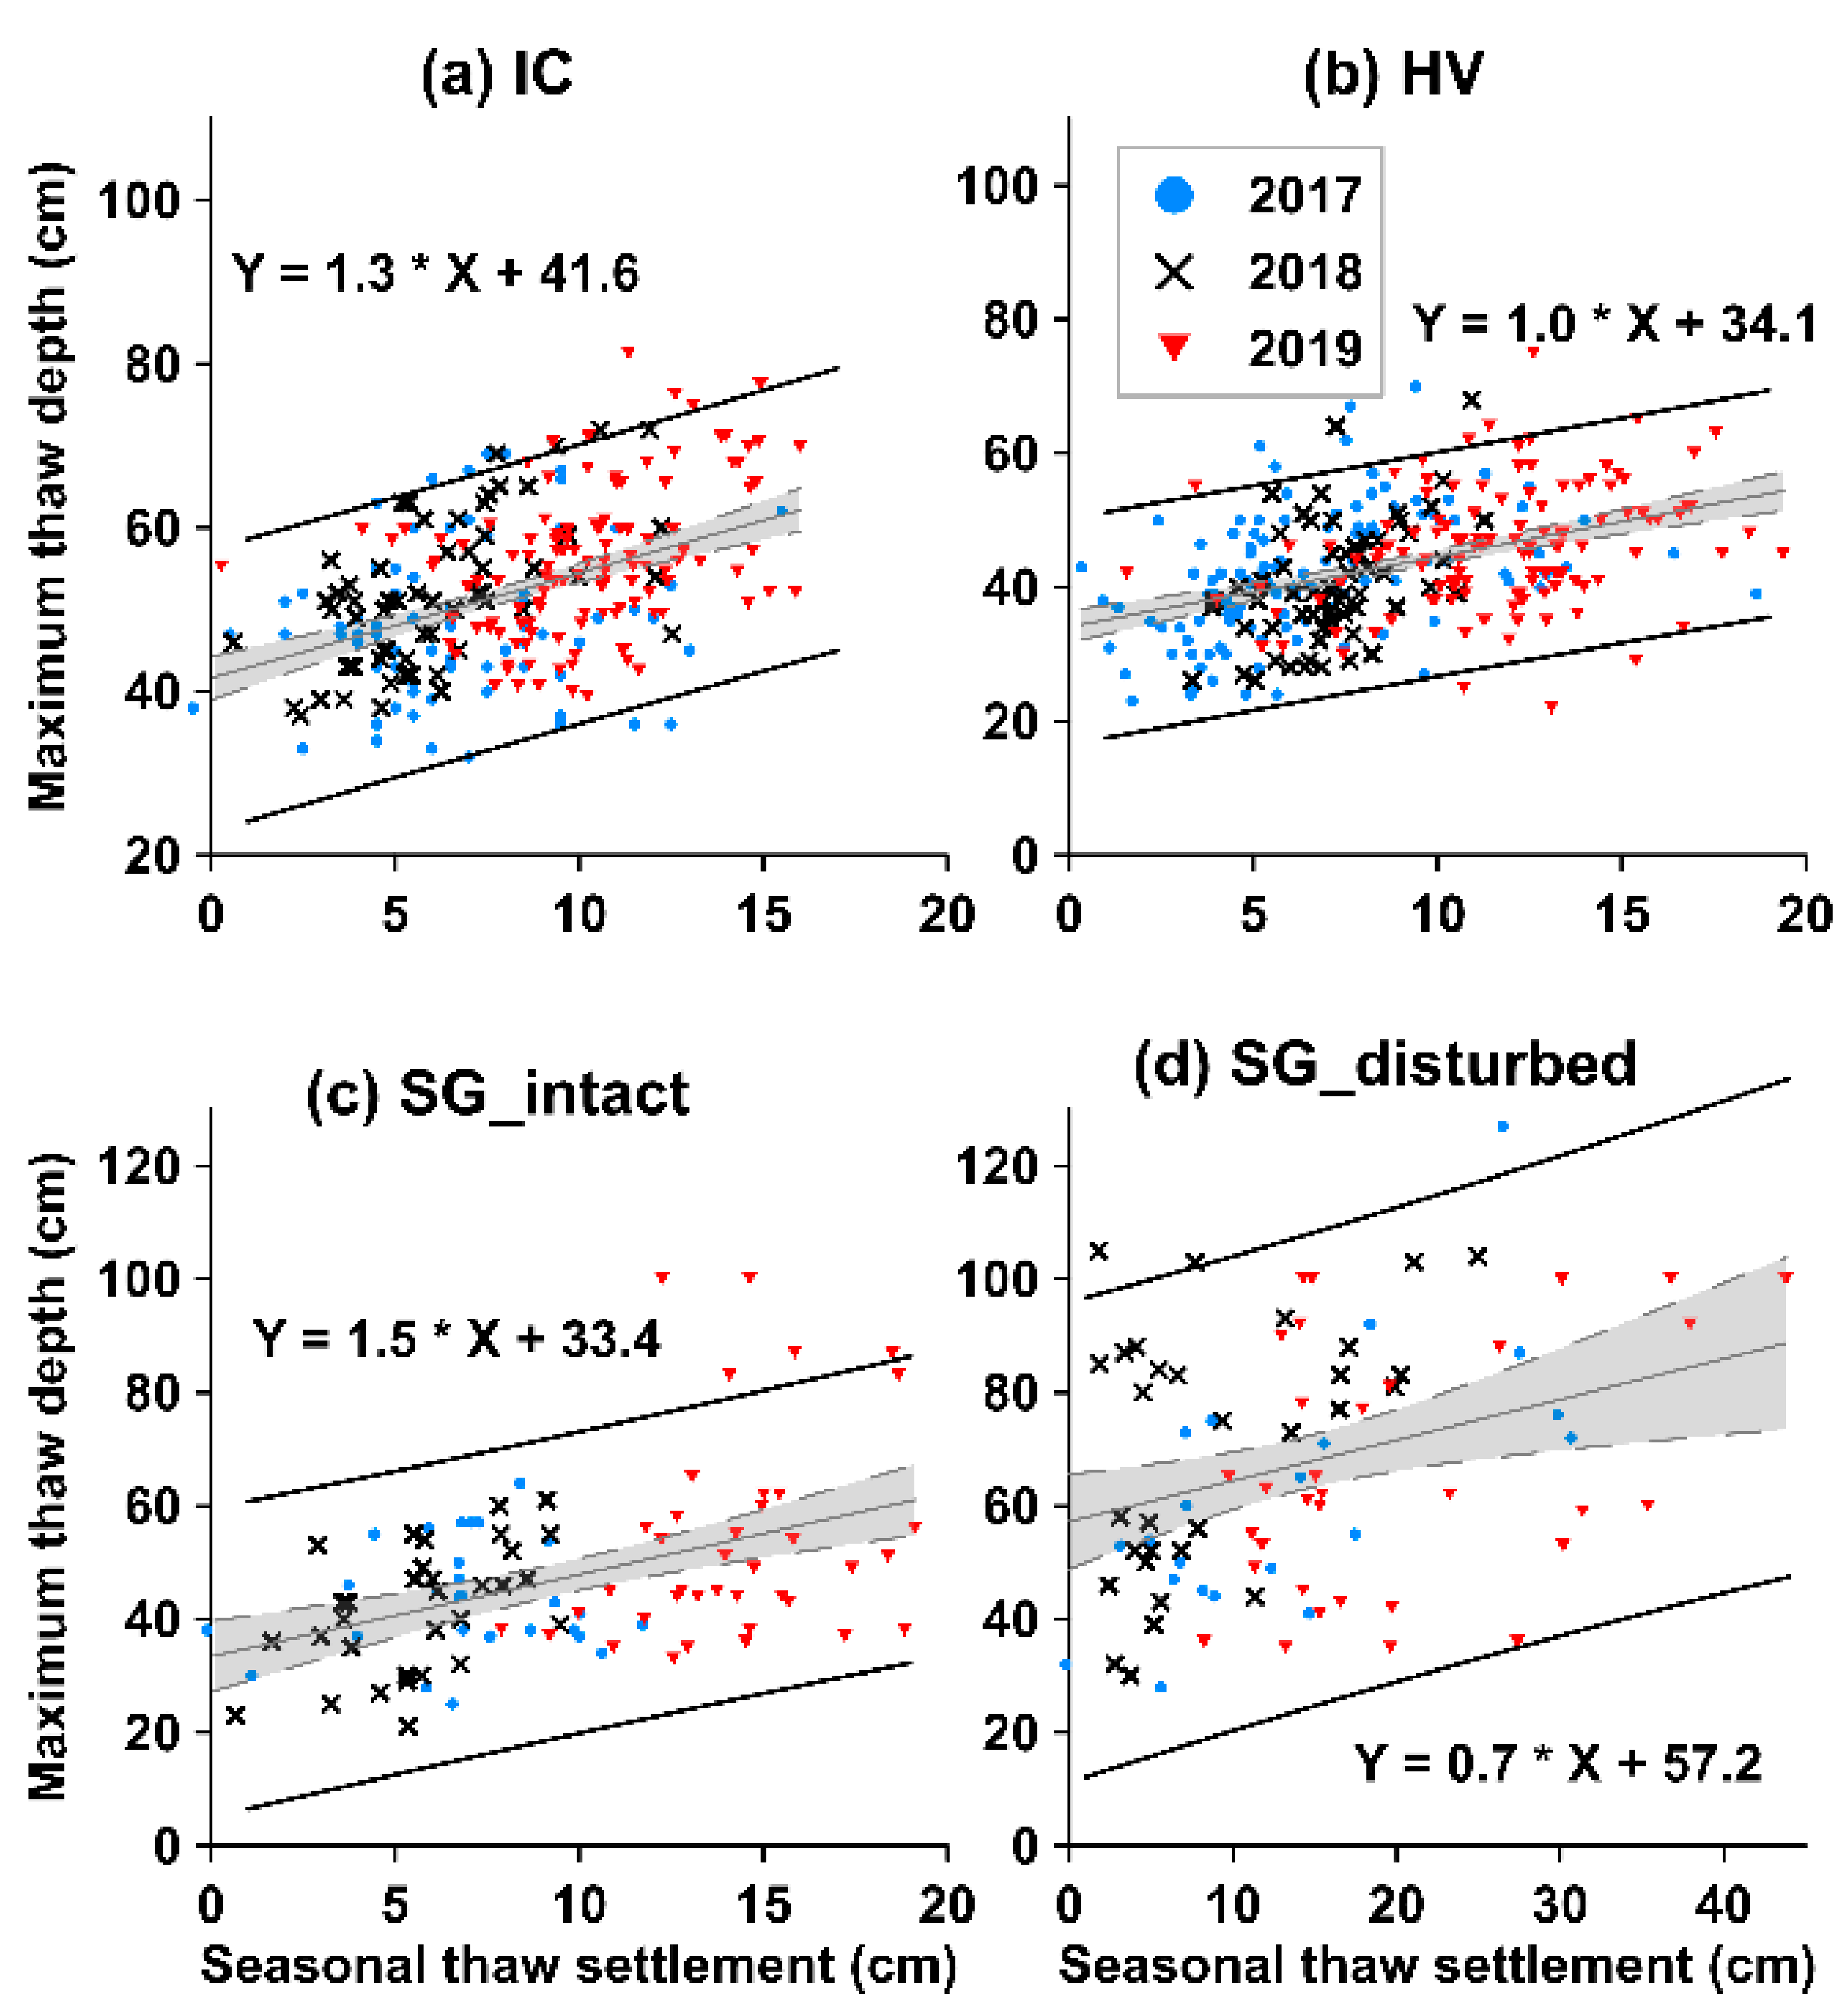
3.3. Correlation between Seasonal Thaw Settlement and Maximum Thaw Depth

Pearson’s positive correlations between STS and TD were found to be statistically significant in all groups (Figure 8). Moderate correlations (R = 0.41–0.45, p < 0.001) were found at IC, HV, and SG_intact, and low correlation (R = 0.37, p < 0.001) was found at SG_disturbed. An analysis of covariance (ANCOVA) showed insignificant differences for slopes at the location, but significant (p < 0.001) differences in intercepts of the regression curves; i.e., the differences in average TD among the sites. ANCOVA also showed an insignificant interaction between the presence of tussocks and STS.
Our observations showed that the hypothesis of a positive relationship between STS and TD generally holds, but features high uncertainty in the use of point prediction. Despite the significant moderate correlation between STS and TD at intact sites, the uncertainty in prediction (width of the 95% confidence interval) using linear regression curves was high (at least ±17 cm at HV). As expected from the low correlation at SG_disturbed, the uncertainty for this site was the largest (±42 cm).
The correlation between STS and TD may be useful for ensembles of measurements to predict from one parameter to the other. At the same time, the uncertainty range over 34 cm for the TD prediction from a single STS observation demonstrates the difficulty in the use of regression curves for individual point measurements. A possible quantitative explanation for the differences in the prediction uncertainty ranges among the intact locations is the degree of thermokarst or proximity to disturbed tundra. HV was located farthest from the Dalton Highway, and there were no visible thermokarst depressions at or near the site. SG_intact was next to the SG_disturbed locations, and IC could be treated as intermediately affected by thermokarst because slight thermokarst depressions were recognizable near the site, and the site was close to the highway.
Overall, as the thermokarst disturbance progressed, the correlation between STS and TD became obscure, and the uncertainty in the prediction of TD from STS became larger. The lower correlation between STS and TD in thermokarst-affected locations was reasonable. Assuming similar weather conditions and frost susceptibility of the soils in the study area, differences in soil moisture and freezing rate play important roles in the amount of seasonal ground-surface displacement (frost heave and thaw settlement) (e.g., [11]). While an increase in TD in thermokarst-affected locations expands the potential STS range, larger spatial (horizontal and vertical) variations in soil moisture and altered thermal regime in the active layer increase the range in frost heave amount compared to the intact tundra with its relatively uniform soil properties. Our observations suggest that thermokarst, by melting segregation ice and massive ground ice in the transient (shielding) layer of permafrost, shifted hydrology in the active layer (e.g., lower water table and enhanced drainage) and altered the correlation between STS and TD in the intact tundra.

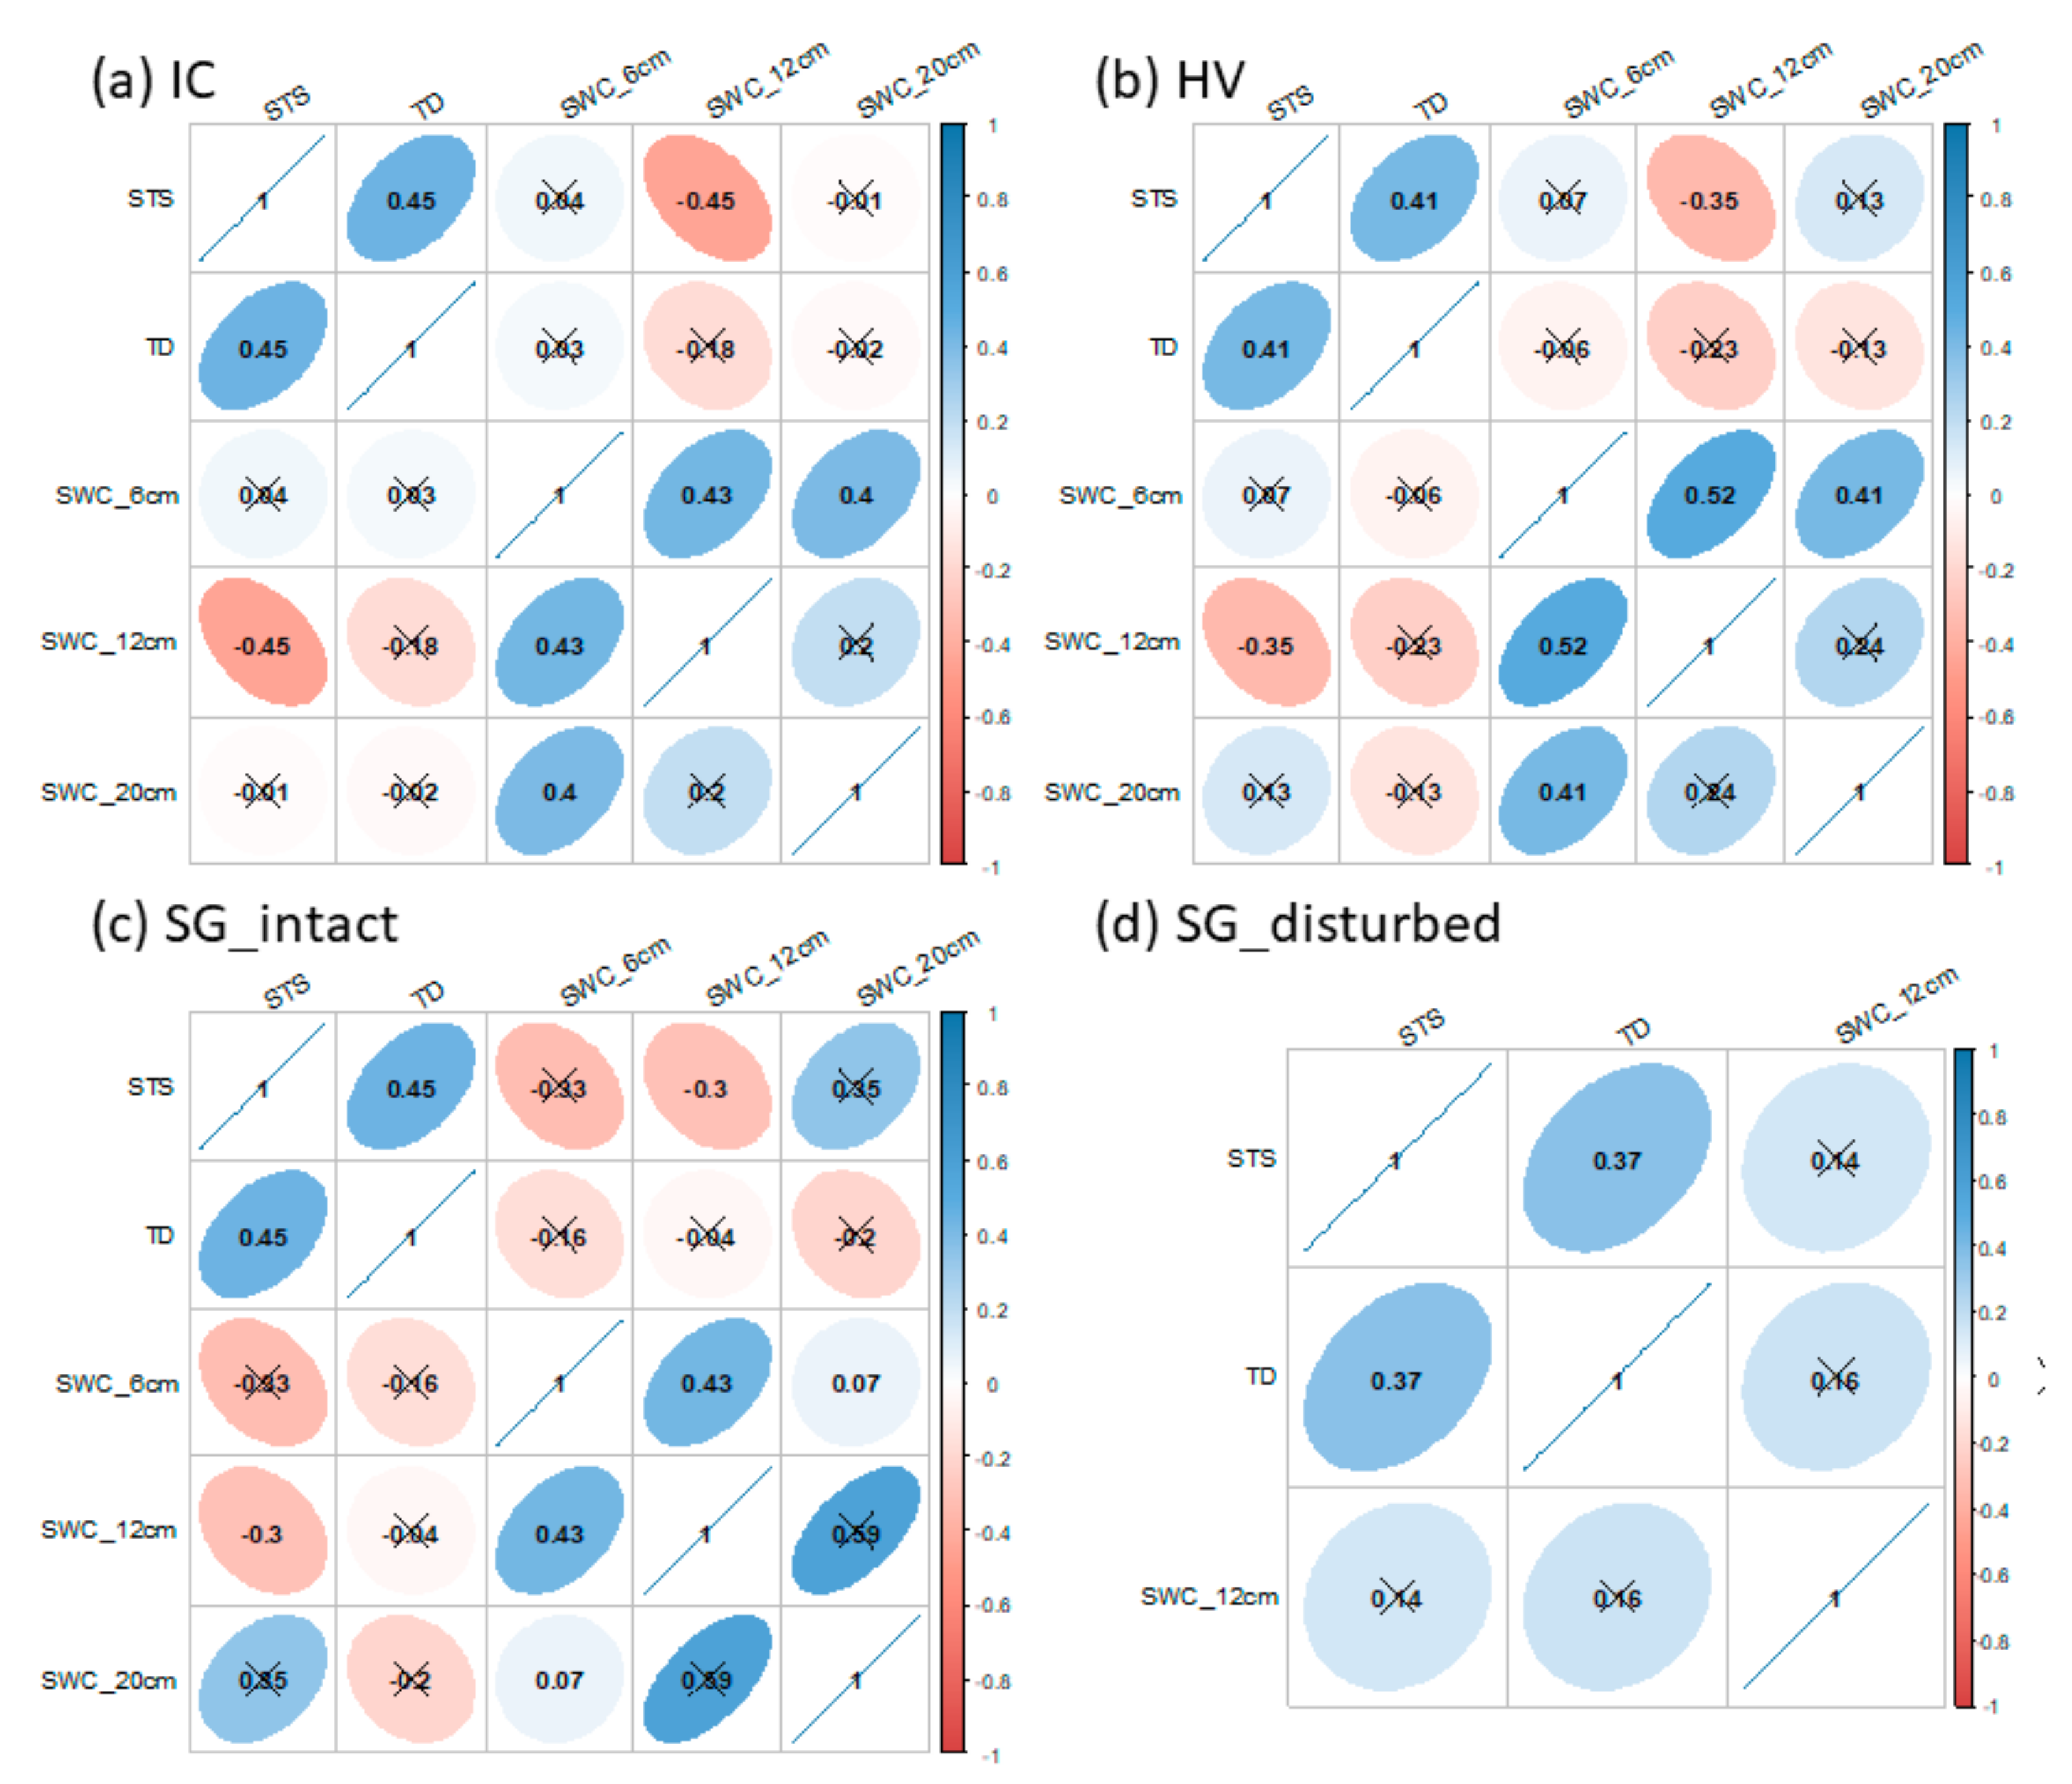
3.4. Surface Moisture Distribution and Ground-Surface Displacement

Low to moderate correlations (significance level of 99.9%) between STS and surface moisture at a depth of 12 cm were found at intact tundra sites (Figure 9). However, moisture at the shallower (6 cm) and deeper (20 cm) levels was uncorrelated with STS in our study. In the active layer of the tundra with shallow TD (about 50 cm), water drainage from the soil layer close to the frost table is usually hindered by the relatively flat topography and underlying frozen ground. In comparison, the top few centimeters of the active layer typically consist of highly permeable live plants, moss, or peat, which rapidly drains precipitation water downward. As a result, the surface moisture in the upper and lower active layer tends to be less variable in space. The negative correlation between STS and surface moisture at IC, HV, and SG_intact was counterintuitive because we expected larger frost heave where soil moisture is higher, which is essential for the formation of ice lenses upon freeze-up. To explain this negative correlation, we may need to compare soil texture at a fine spatial resolution; however, these ancillary spatial data were not available for this study.
On the other hand, no significant correlation was shown at SG_disturbed between STS and surface moisture (only measurements at a depth of 12 cm were available). There was also no significant correlation between TD and surface moisture at all sites.

4. Conclusions

The spatial variation in ground-surface displacement at intact tundra sites without marked patterned ground features and a disturbed site was characterized using repeated precise GNSS positioning surveys. The average seasonal thaw settlement (STS) at intact tundra sites (HV and IC) ranged 5.8–7.2 cm and 10.2–14.3 cm in average climate summers (2017 and 2018) and a warmer summer (2019), respectively. Standard deviations were relatively stable (2.1–3.3 cm) over the observation years. At the disturbed site (SG_disturbed), STS was highest in all observed years and among all sites (12.6, 8.6, and 19.9 cm in 2017, 2018, and 2019, respectively). The spatial variation in ground-surface displacement among the observed points roughly persisted during our observation period. There were few variations in meteorological and ground-surface conditions, including vegetation cover, among the study sites. Hence, the observed variations in ground-surface displacement were presumably governed by in situ physical properties and conditions of the active layer.
Low to moderate positive Pearson’s correlations between maximum thaw depth (TD) and STS were found in intact areas. On the other hand, a lower and nonsignificant correlation was found at SG_disturbed, where ongoing thermokarst was prominent. The lower correlation suggests shifts of hydrology in the active layer (e.g., lower water table and enhanced drainage) and increased contribution of thermokarst subsidence by melting segregation ice and massive ground ice in the transient (shielding) layer of permafrost. However, soil moisture at a depth of 12 cm negatively correlated with STS at all sites, and no correlations were found at other depths.
The TD at SG_disturbed was greatest (62–73 cm) throughout the study period and about 1.5 times larger than that at other intact sites (41–48 cm). The interannual changes in TD and STS could be explained by the weather conditions (snow depth, freeze/thaw indices) at the intact locations. On the other hand, the interannual changes at SG_disturbed were less dependent on atmospheric forcing, indicating significant influence by thermokarst.
Overall, as the thermokarst disturbance progressed, the correlation between STS and TD became obscure, and the uncertainty in the prediction of TD from STS became larger. Our field surveys captured the spatial and temporal variations in freeze–thaw-related ground-surface displacement at intact tundra sites and a disturbed area in a typical tundra landscape underlain by ice-rich permafrost.

Author Contributions

Conceptualization, G.I.; methodology, G.I., R.C.B., and K.S.; validation, G.I. and K.S.; formal analysis, G.I.; investigation, G.I. and R.C.B.; resources, G.I. and K.S.; data curation, G.I. and R.C.B.; writing—original draft preparation, G.I.; writing—review and editing, G.I., R.C.B., and K.S.; visualization, G.I.; supervision, K.S.; project administration, G.I. and K.S.; funding acquisition, G.I. and K.S. All authors have read and agreed to the published version of the manuscript.

Funding

This study was performed under the projects NASA ABoVE (Arctic Boreal and Vulnerability Experiment (grant no. NNX17AC57A)) and the Environment Research and Technology Development Fund (2-1605). This study was also partly supported by JSPS KAKENHI (18H03353). The Toolik Field Station GIS and Remote Sensing Department, University of Alaska Fairbanks was funded by NSF Grant #: 1623461.

Data Availability Statement

The data presented in this study are available on request from the corresponding author.

Acknowledgments

The authors greatly acknowledge those who contributed to field surveys (Sarah Liben, Zachary Sauve, Naresh Saravanan, Nana Matsui, and Simon Zwieback). We thank all staff at the Toolik Field Station for their logistical support. Members of the Toolik GIS Office acquired drone images for our study sites and provided support and equipment for the GNSS positioning survey.

Conflicts of Interest

The authors declare no conflict of interest.

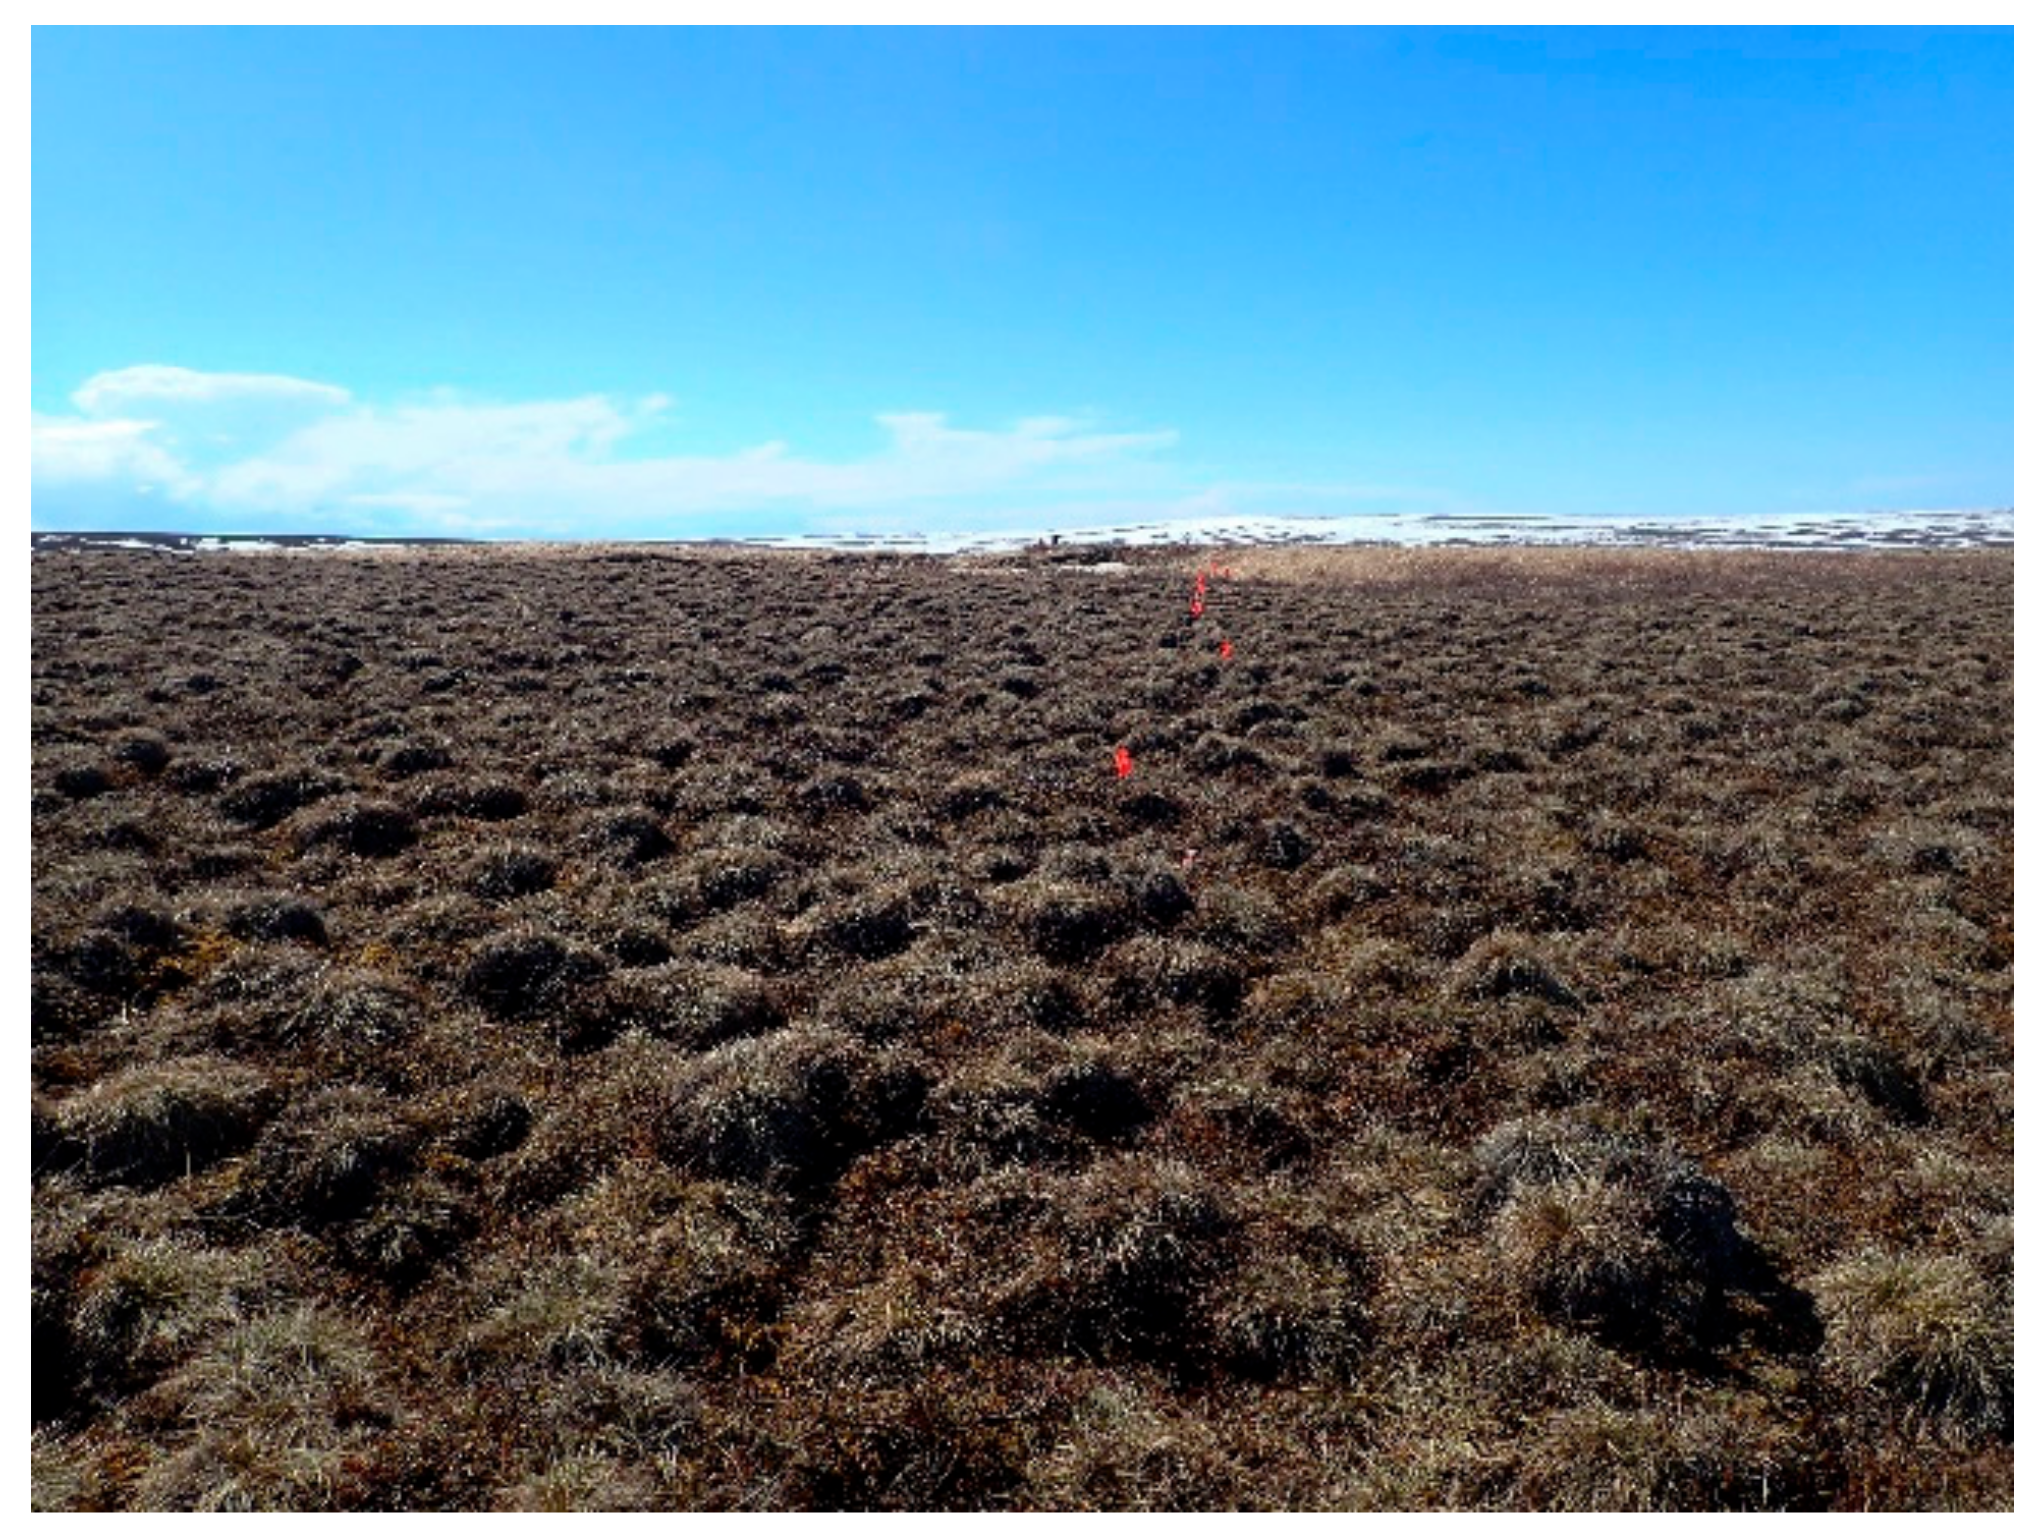
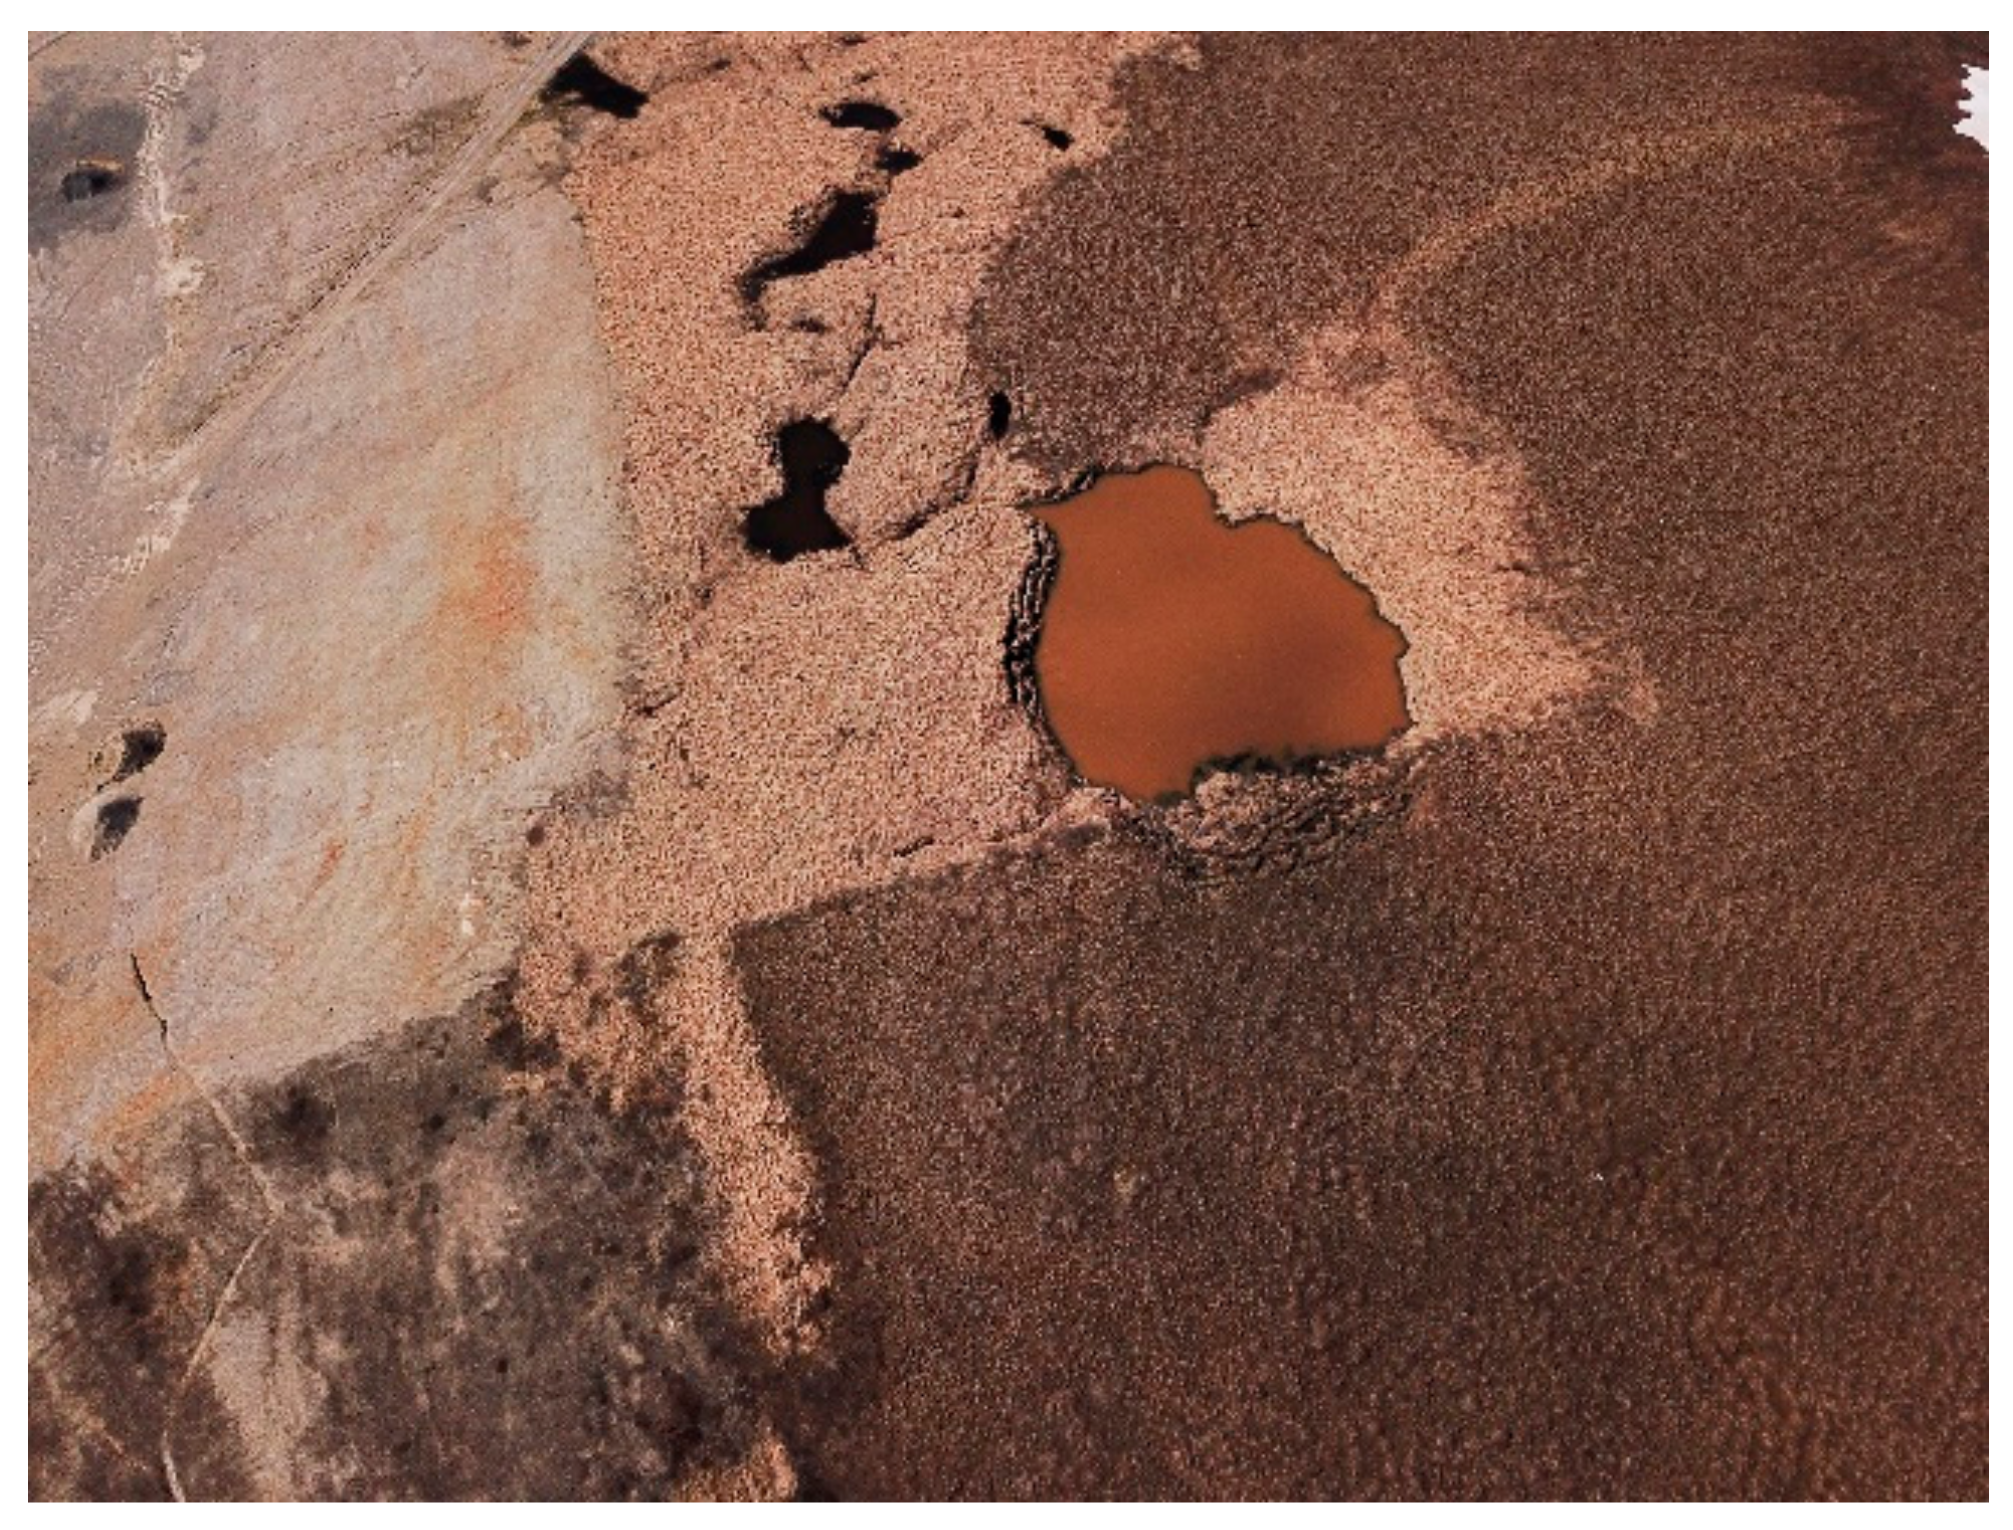
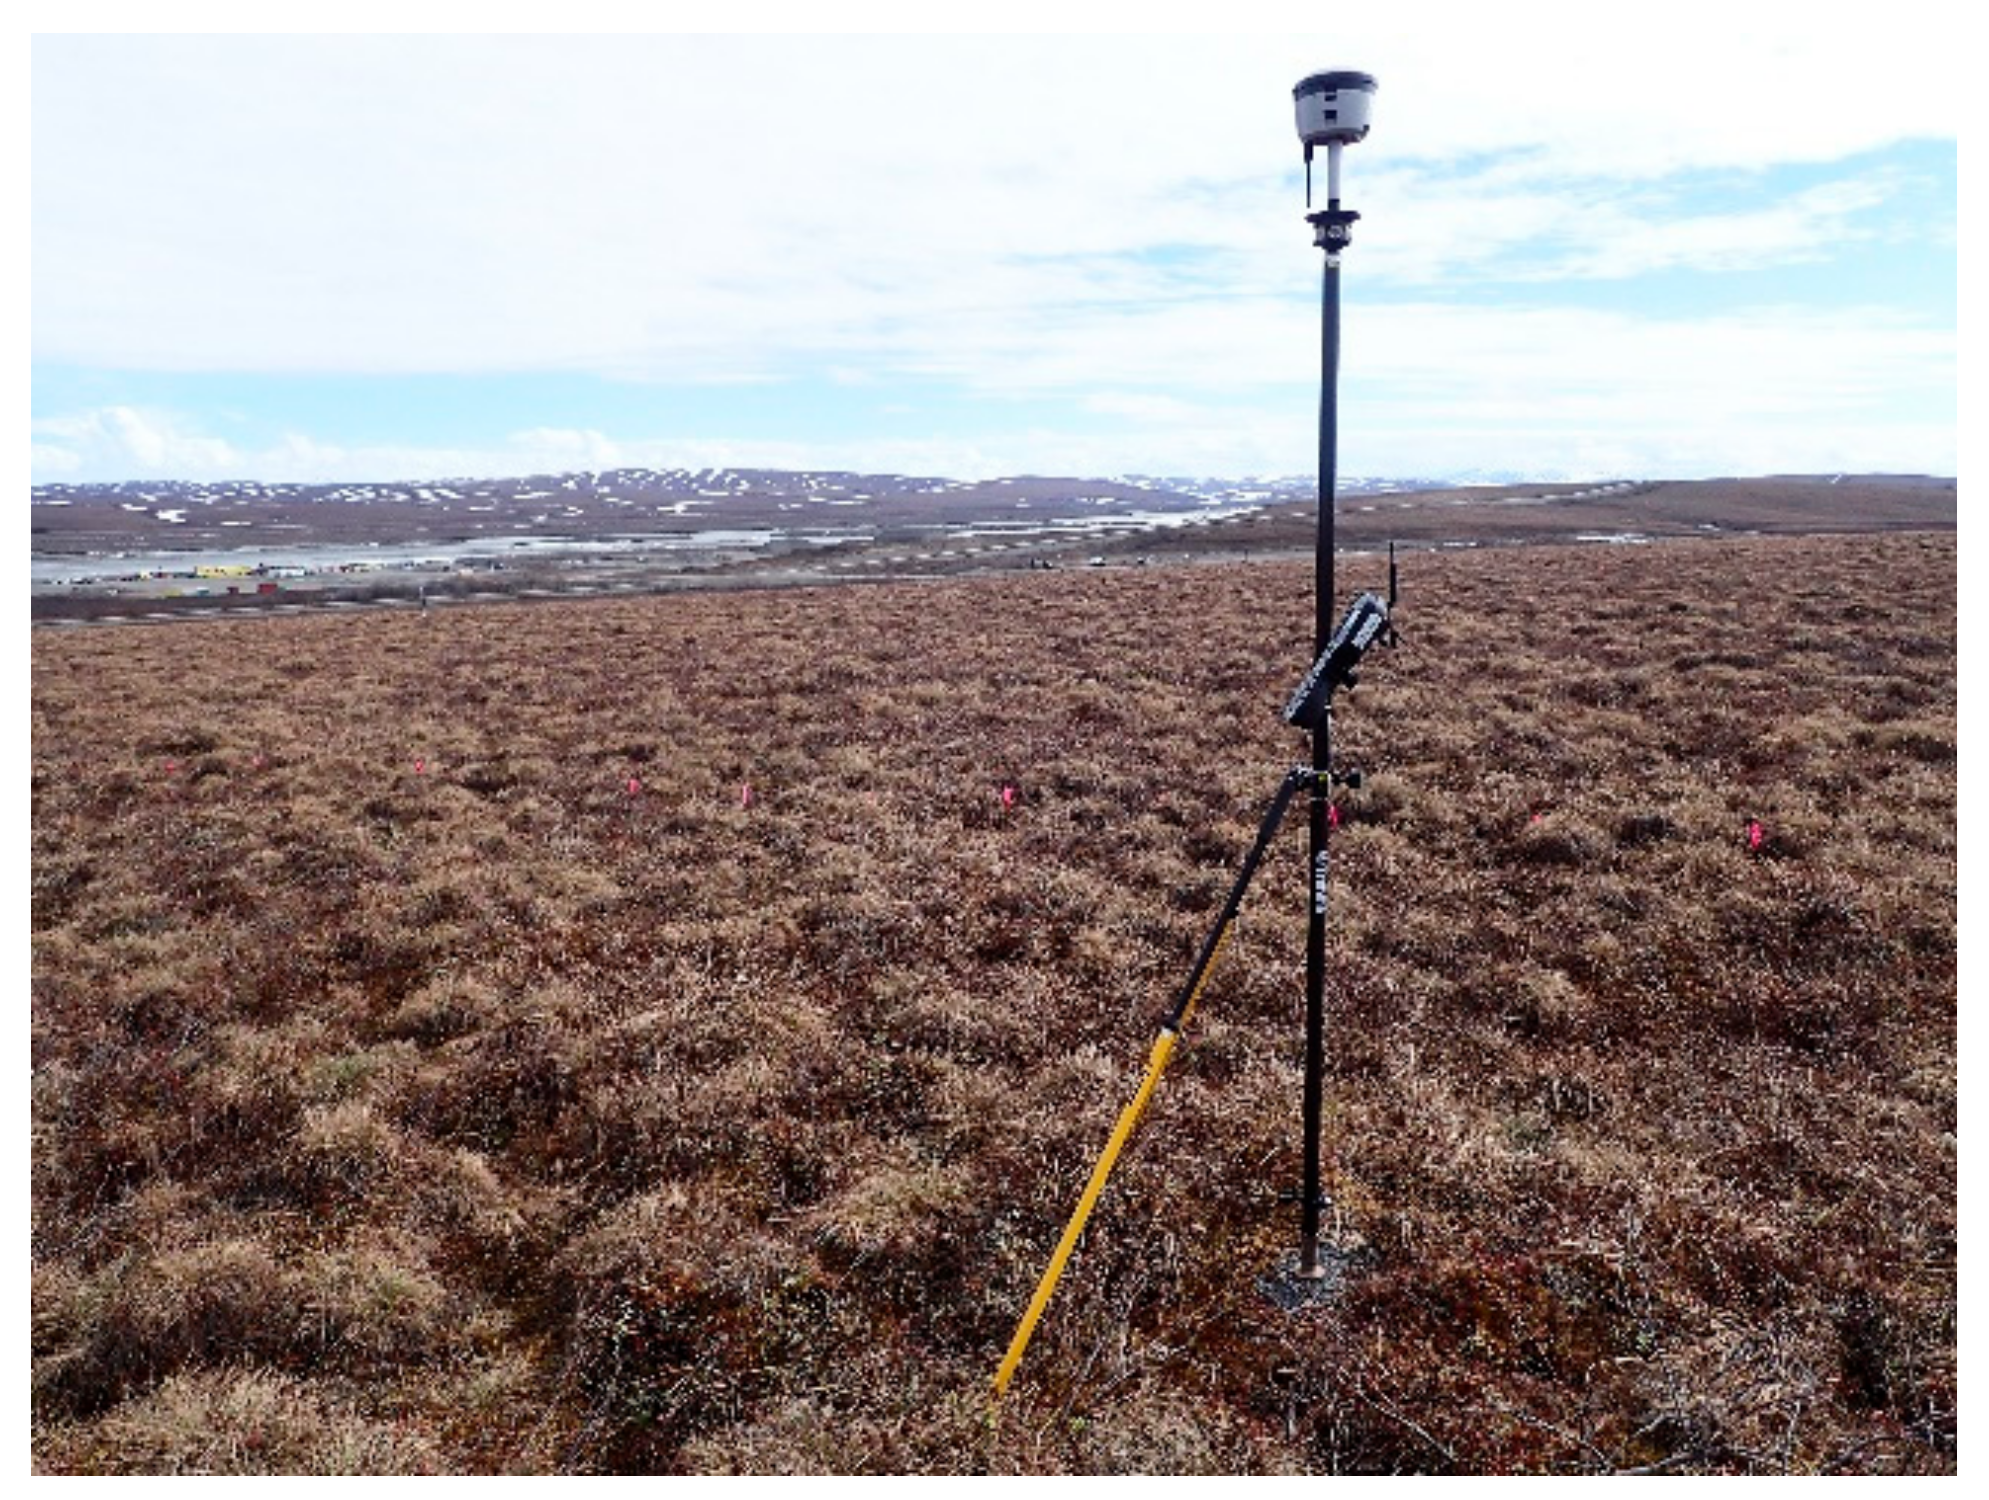
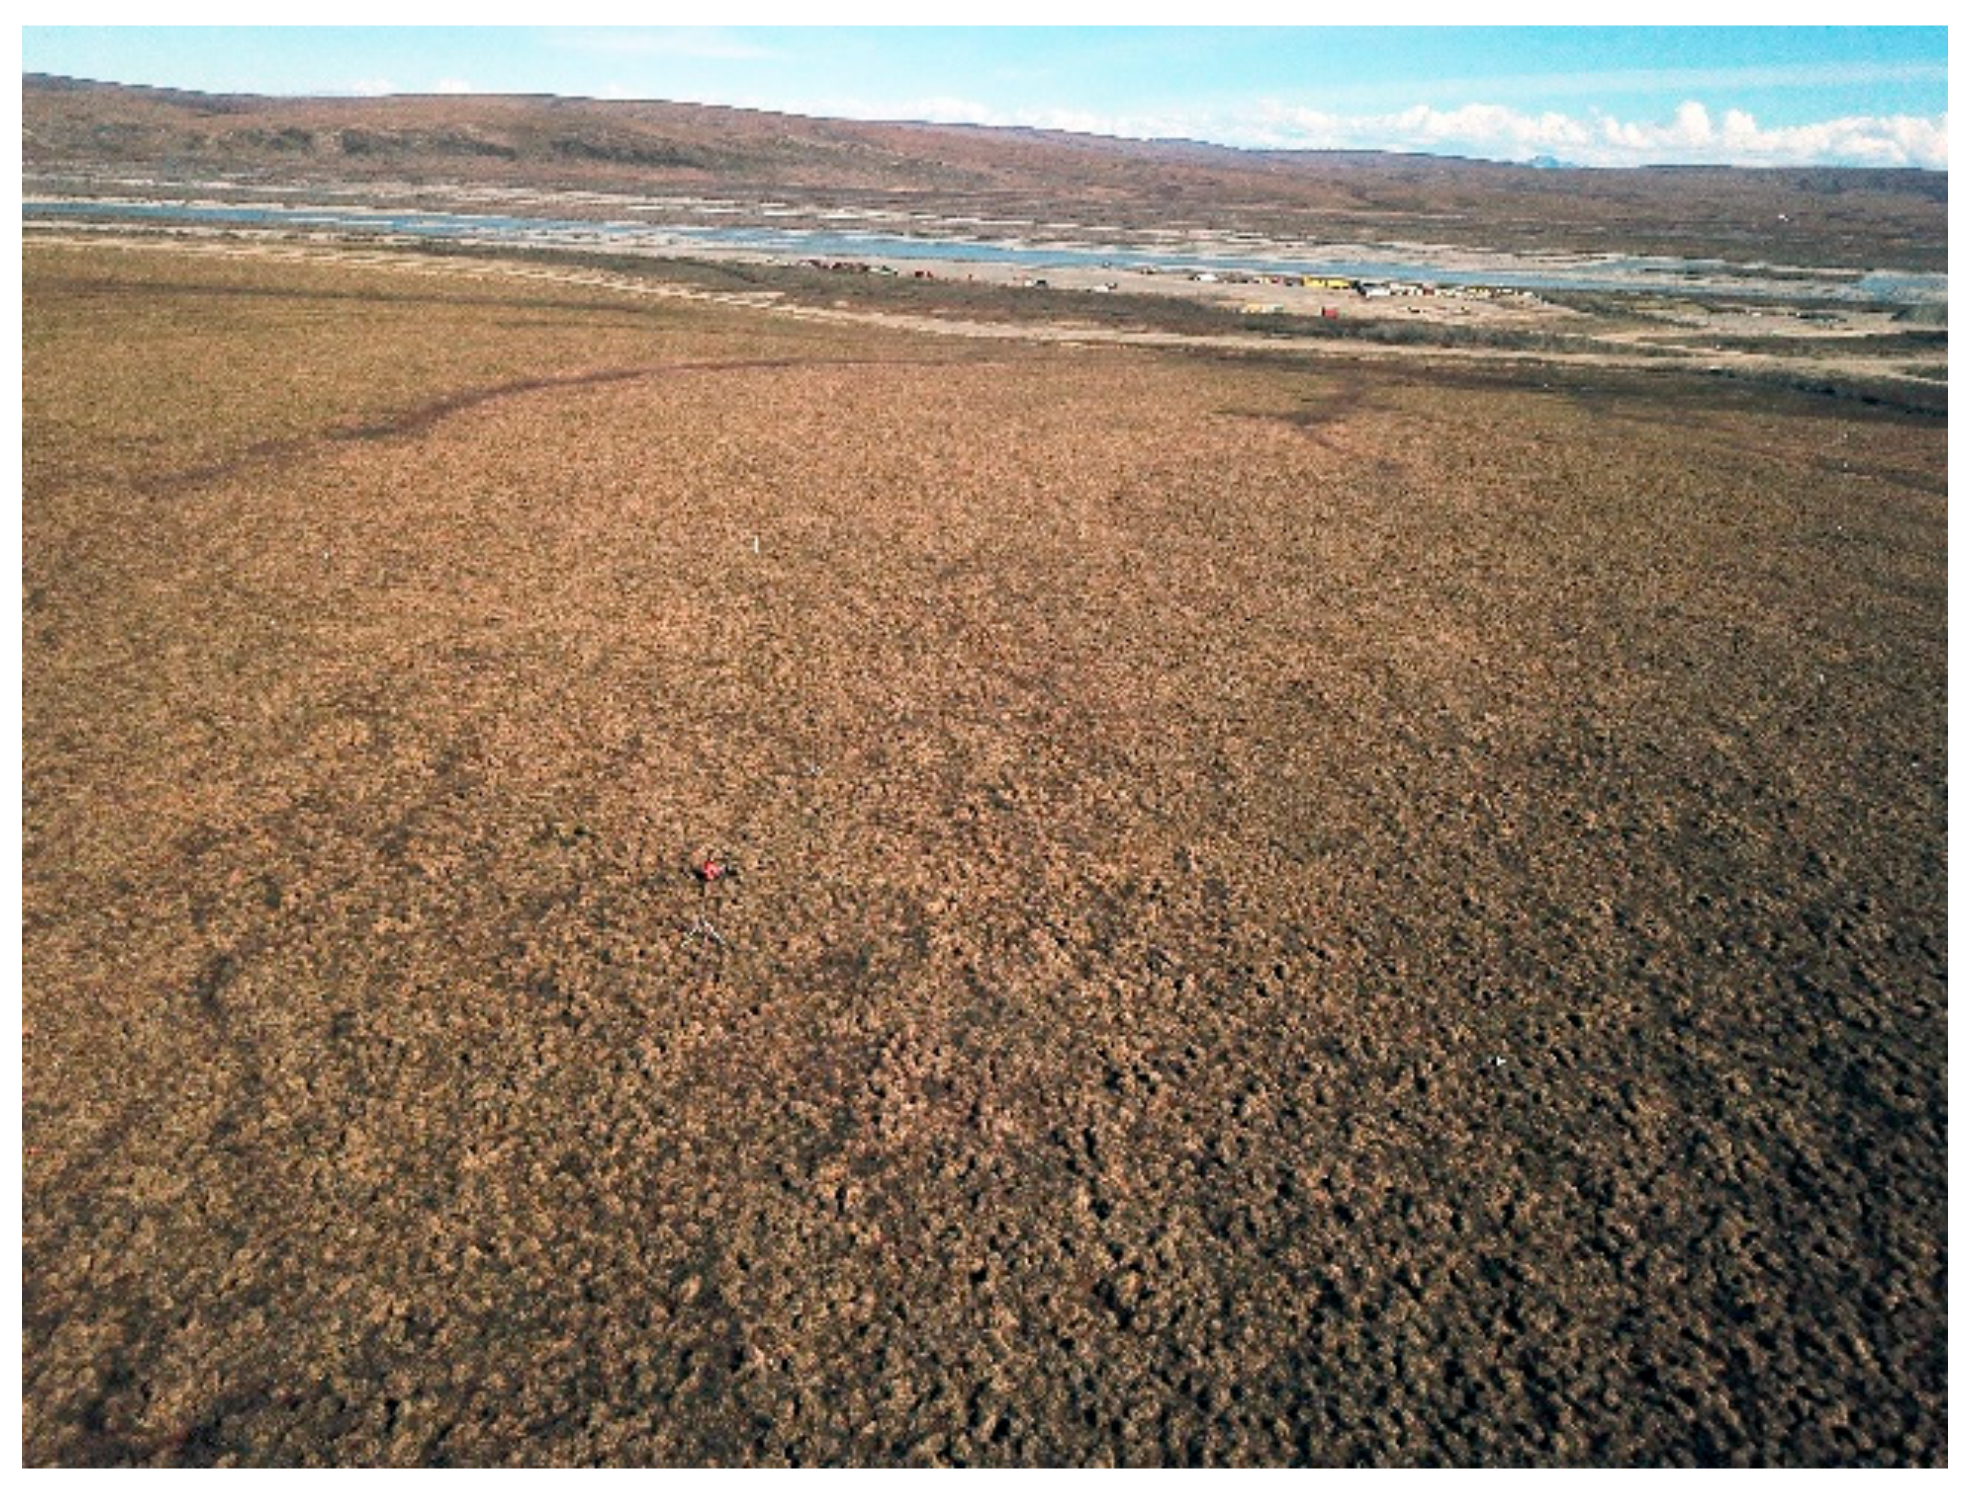
Appendix A. Photos of Field Sites

Figure A1. Field photo of SG from SG_T3_90 on 4 June 2018.
Land 10 00022 g0a1
Figure A2. Oblique aerial photo of SG on 31 May 2019.
Land 10 00022 g0a2
Figure A3. Field photo of HV on 31 May 2017.
Land 10 00022 g0a3
Figure A4. Oblique aerial photo of HV on 30 May 2019.
Land 10 00022 g0a4
Figure A5. Field photo of IC on 30 May 2019.
Land 10 00022 g0a5
Figure A6. Oblique aerial photo of IC on 31 May 2019.
Land 10 00022 g0a6

References

  1. van Everdingen, R.O. Multi-language glossary of permafrost and related ground-ice terms. In Multi-Language Glossary of Permafrost and Related Ground-Ice Terms; van Everdingen, R.O., Ed.; National Snow and Ice Data Center/World Data Center for Glaciology: Boulder, CO, USA, 1998; revised January 2005; p. 98. [Google Scholar]
  2. Beskow, G. Soil Freezing and Frost Heaving with Special Application to Roads and Railroads; Technological Institute, Northwestern University: Evanston, IL, USA, 1935. [Google Scholar]
  3. Taber, S. The mechanics of frost heaving. J. Geol. 1930, 38, 303–317. [Google Scholar] [CrossRef]
  4. Miller, R.D.; Black, P.B. Redistribution of water in terrestrial soils at subfreezing temperatures: A review of processes and their potential relevance to Mars. J. Geophys. Res. 2003, 108. [Google Scholar] [CrossRef]
  5. Konrad, J.M.; Morgenstern, N.R. The segregation potential of a freezing soil. Can. Geotech. J. 1981, 18, 482–491. [Google Scholar] [CrossRef]
  6. O’Neill, K. The physics of mathematical frost heave models: A review. Cold Reg. Sci. Technol. 1983, 6, 275–291. [Google Scholar] [CrossRef]
  7. Black, P.B.; Hardenberg, M.J. Historical Perspectives in Frost Heave Research: The Early Works of S. Taber and G. Beskow; Cold Regions Research and Engineering Laboratory, Engineer Research and Development Center: Vicksburg, MS, USA, 1991; Volume 91–23, p. 174. [Google Scholar]
  8. Guymon, G.L.; Berg, R.L.; Hromadka, T.V. Mathematical Model of Frost Heave and Thaw Settlement in Pavements; U.S. Army Cold Regions Research and Engineering Laboratory: Hanover, NH, USA, 1993; p. 126.
  9. Seppala, M. Synthesis of studies of palsa formation underlining the importance of local environmental and physical characteristics. Quat. Res. 2011, 75, 366–370. [Google Scholar] [CrossRef]
  10. Iwahana, G.; Fukui, K.; Mikhailov, N.; Ostanin, O.; Fujii, Y. Internal structure of a Lithalsa in the Akkol Valley, Russian Altai mountains. Permafr. Periglac. Process. 2012, 23, 107–118. [Google Scholar] [CrossRef]
  11. Dash, J.G.; Rempel, A.W.; Wettlaufer, J.S. The physics of premelted ice and its geophysical consequences. Rev. Mod. Phys. 2006, 78, 695–741. [Google Scholar] [CrossRef] [Green Version]
  12. Goulet, F. Frost heaving of forest tree seedlings: A review. New For. 1995, 9, 67–94. [Google Scholar] [CrossRef]
  13. Cleavitt, N.L.; Fahey, T.J.; Groffman, P.M.; Hardy, J.P.; Henry, K.S.; Driscoll, C.T. Effects of soil freezing on fine roots in a northern hardwood forest. Can. J. For. Res. 2008, 38, 82–91. [Google Scholar] [CrossRef]
  14. Cheng, G. The mechanism of repeated-segregation for the formation of thick layered ground ice. Cold Reg. Sci. Technol. 1983, 8, 57–66. [Google Scholar] [CrossRef]
  15. Flerchinger, G.N.; Lehrsch, G.A.; McCool, D.K. Freezing and thawing processes. In Encyclopedia of Soils in the Environment; Hillel, D., Ed.; Elsevier, Ltd.: Oxford, UK, 2005; pp. 104–110. [Google Scholar]
  16. Matsuoka, N. Contemporary permafrost and periglaciation in Asian high mountains: An overview. Z. Fur Geomorphol. 2003, 47, 145–166. [Google Scholar]
  17. Harris, C.; Kern-Luetschg, M.; Smith, F.; Isaksen, K. Solifluction processes in an area of seasonal ground freezing, Dovrefjell, Norway. Permafr. Periglac. Process. 2008, 19, 31–47. [Google Scholar] [CrossRef]
  18. Gruber, S. Ground subsidence and heave over permafrost: Hourly time series reveal inter-annual, seasonal and shorter-term movement caused by freezing, thawing and water movement. Cryosphere 2020, 14, 1437–1447. [Google Scholar] [CrossRef]
  19. Little, J.D.; Sandall, H.; Walegur, M.T.; Nelson, F.E. Application of differential global positioning systems to monitor frost heave and thaw settlement in tundra environments. Permafr. Periglac. Process. 2003, 14, 349–357. [Google Scholar] [CrossRef]
  20. Shiklomanov, N.I.; Streletskiy, D.A.; Little, J.D.; Nelson, F.E. Isotropic thaw subsidence in undisturbed permafrost landscapes. Geophys. Res. Lett. 2013, 40, 6356–6361. [Google Scholar] [CrossRef]
  21. Streletskiy, D.A.; Shiklomanov, N.I.; Little, J.D.; Nelson, F.E.; Brown, J.; Nyland, K.E.; Klene, A.E. Thaw subsidence in undisturbed Tundra Landscapes, Barrow, Alaska, 1962–2015. Permafr. Periglac. Process. 2017, 28, 566–572. [Google Scholar] [CrossRef]
  22. Liu, L.; Schaefer, K.; Zhang, T.; Wahr, J. Estimating 1992–2000 average active layer thickness on the Alaskan North Slope from remotely sensed surface subsidence. J. Geophys. Res. Earth Surf. 2012, 117, F01005. [Google Scholar] [CrossRef]
  23. Schaefer, K.; Liu, L.; Parsekian, A.; Jafarov, E.; Chen, A.; Zhang, T.; Gusmeroli, A.; Panda, S.; Zebker, H.A.; Schaefer, T. Remotely sensed active layer thickness (ReSALT) at Barrow, Alaska using interferometric synthetic aperture radar. Remote Sens. 2015, 7, 3735–3759. [Google Scholar] [CrossRef] [Green Version]
  24. Michaelides, R.; Schaefer, K.; Zebker, H.; Parsekian, A.; Liu, L.; Chen, J.; Natali, S.M.; Ludwig, S.; Schaefer, S. Inference of the impact of wildfire on permafrost and active layer thickness in a discontinuous permafrost region using the remotely sensed active layer thickness (ReSALT) algorithm. Environ. Res. Lett. 2019, 14, 3. [Google Scholar] [CrossRef]
  25. Liu, L.; Schaefer, K.M.; Chen, A.C.; Gusmeroli, A.; Zebker, H.A.; Zhang, T. Remote sensing measurements of thermokarst subsidence using InSAR. J. Geophys. Res. Earth Surf. 2015, 120, 1935–1948. [Google Scholar] [CrossRef] [Green Version]
  26. Iwahana, G.; Uchida, M.; Liu, L.; Gong, W.; Meyer, F.; Guritz, R.; Yamanokuchi, T.; Hinzman, L. InSAR Detection and field evidence for Thermokarst after a Tundra wildfire, using ALOS-PALSAR. Remote Sens. 2016, 8, 218. [Google Scholar] [CrossRef] [Green Version]
  27. Antonova, S.; Sudhaus, H.; Strozzi, T.; Zwieback, S.; Kääb, A.; Heim, B.; Langer, M.; Bornemann, N.; Boike, J. Thaw subsidence of a yedoma landscape in northern siberia, measured in situ and estimated from TerraSAR-X interferometry. Remote Sens. 2018, 10, 494. [Google Scholar] [CrossRef] [Green Version]
  28. Yanagiya, K.; Furuya, M. Post-wildfire surface deformation near Batagay, eastern Siberia, detected by L-Band and C-Band InSAR. J. Geophys. Res. Earth Surf. 2020, 125, e2019JF005473. [Google Scholar] [CrossRef]
  29. Abe, T.; Iwahana, G.; Efremov, P.V.; Desyatkin, A.R.; Kawamura, T.; Fedorov, A.; Zhegusov, Y.; Yanagiya, K.; Tadono, T. Surface displacement revealed by L-band InSAR analysis in the Mayya area, Central Yakutia, underlain by continuous permafrost. Earth Planets Space 2020, 72, 138. [Google Scholar] [CrossRef]
  30. Dini, B.; Daout, S.; Manconi, A.; Loew, S. Classification of slope processes based on multitemporal DInSAR analyses in the Himalaya of NW Bhutan. Remote Sens. Environ. 2019, 233, 111408. [Google Scholar] [CrossRef]
  31. CAVM Team. Circumpolar Arctic Vegetation Map. Conservation of Arctic Flora and Fauna (CAFF) Map No. 1; U.S. Fish and Wildlife Service: Anchorage, AK, USA, 2003.
  32. Walker, D.A.; Raynolds, M.K.; Daniels, F.J.A.; Einarsson, E.; Elvebakk, A.; Gould, W.A.; Katenin, A.E.; Kholod, S.S.; Markon, C.J.; Melnikov, E.S.; et al. The Circumpolar Arctic vegetation map. J. Veg. Sci. 2005, 16, 267–282. [Google Scholar] [CrossRef]
  33. Raynolds, M.K.; Walker, D.A.; Munger, C.A.; Vonlanthen, C.M.; Kade, A.N. A map analysis of patterned-ground along a north American Arctic Transect. J. Geophys. Res. Biogeosci. 2008, 113. [Google Scholar] [CrossRef] [Green Version]
  34. Michaelson, G.J.; Ping, C.L.; Epstein, H.; Kimble, J.M.; Walker, D.A. Soils and frost boil ecosystems across the North American Arctic Transect. J. Geophys. Res. Biogeosciences 2008, 113. [Google Scholar] [CrossRef] [Green Version]
  35. Kaufman, D.S.; Young, N.E.; Briner, J.P.; Manley, W.F. Alaska Paleo-Glacier Atlas (Version 2). In Quaternary Glaciations Extent and Chronology, Part IV: A Closer Look. Developments in Quaternary Sciences 15; Ehlers, J., Gibbard, P.L., Hughes, P., Eds.; Elsevier: Amsterdam, The Netherlands, 2011; pp. 427–445. [Google Scholar]
  36. Lawrimore, J.H.; Ray, R.; Applequist, S.; Korzeniewski, B.; Menne, M.J. Global Summary of the Year (GSOY), Version 1; Information, NOAA National Centers for Environmental Information: Asheville, NC, USA, 2016. [Google Scholar] [CrossRef]
  37. Menne, M.J.; Durre, I.; Korzeniewski, B.; McNeal, S.; Thomas, K.; Yin, X.; Anthony, S.; Ray, R.; Vose, R.S.; Gleason, B.E.; et al. Global Historical Climatology Network-Daily (GHCN-Daily), Version 3; NOAA National Climatic Data Center: Asheville, NC, USA, 2012. [Google Scholar] [CrossRef]
  38. R Core Team. R: A Language and Environment for Statistical Computing; R Foundation for Statistical Computing: Vienna, Austria, 2019; Available online: https://www.R-project.org/ (accessed on 30 November 2020).
  39. Wei, T.; Simko, V. R Package “Corrplot”: Visualization of a Correlation Matrix; NCBI: Bethesda, MD, USA, 2017; Available online: https://github.com/taiyun/corrplot (accessed on 30 November 2020).
  40. Walker, D.A.; Epstein, H.E.; Romanovsky, V.E.; Ping, C.L.; Michaelson, G.J.; Daanen, R.P.; Shur, Y.; Peterson, R.A.; Krantz, W.B.; Raynolds, M.K.; et al. Arctic patterned-ground ecosystems: A synthesis of field studies and models along a North American Arctic transect. J. Geophys. Res. Biogeosciences 2008, 113. [Google Scholar] [CrossRef]
  41. Mackay, J.R. Active layer changes (1968 to 1993) following the forest-tundra fire near Inuvik, NWT, Canada. Arct. Alp. Res. 1995, 27, 323–336. [Google Scholar] [CrossRef]
  42. Nelson, F.E.; Shiklomanov, N.I.; Mueller, G.R.; Hinkel, K.M.; Walker, D.A.; Bockheim, J.G. Estimating active-layer thickness over a large region: Kuparuk River Basin, Alaska, USA. Arct. Alp. Res. 1997, 29, 367–378. [Google Scholar] [CrossRef]
  43. Liu, L.; Zhang, T.; Wahr, J. InSAR measurements of surface deformation over permafrost on the North Slope of Alaska. J. Geophys. Res. Earth Surf. 2010, 115, F03023. [Google Scholar] [CrossRef]
  44. Daanen, R. Annual frost heave distribution in a non-sorted circle system measured with a terrestrial laser scanner. In Proceedings of the Tenth International Conference on Permafrost, Sarekhard, Russia, 25–29 June 2012; pp. 1–5. [Google Scholar]
  45. Walker, D.A.; Epstein, H.E.; Gould, W.A.; Kelley, A.M.; Kade, A.N.; Knudson, J.A.; Krantz, W.B.; Michaelson, G.; Peterson, R.A.; Ping, C.-L.; et al. Frost-boil ecosystems: Complex interactions between landforms, soils, vegetation and climate. Permafr. Periglac. Process. 2004, 15, 171–188. [Google Scholar] [CrossRef] [Green Version]
  46. Romanovsky, V.E.; Marchenko, S.S.; Daanen, R.P.; Sergeev, D.O.; Walker, D.A. Soil climate and frost heave along the Permafrost/Ecological North American Arctic Transect. In Proceedings of the Ninth International Conference on Permafrost, Fairbanks, AK, USA, 28 June–3 July 2008. [Google Scholar]
  47. Kade, A.; Walker, D.A. Experimental alteration of vegetation on nonsorted circles: Effects on cryogenic activity and implications for climate change in the Arctic. Arct. Antarct. Alp. Res. 2008, 40, 96–103. [Google Scholar] [CrossRef] [Green Version]
Figure 1. Locations of study sites along the Dalton Highway, Alaska.
Land 10 00022 g001
Figure 2. Locations of survey transect lines at the (a,b) SG (Sagwon), (c,d) HV (Happy Valley), and (e,f) IC (Ice Cut) sites. (a) Red/green/blue (RGB) images (a,c,e) and digital surface models (DSMs) (b,d,f) for sites SG, HV, and IC were obtained using a UAV (DJI Matrice M210 with Zenmuse X4s) and processed (Agisoft Metashape v. 1.6.3) by the Toolik Field Station GIS (geographic information system) and Remote Sensing Department using an unmanned aerial vehicle (DJI Matrice M210 with Zenmuse X4s). The numbers at the beginning and end of the transect lines indicate the start point (0) and length of the transect in meters, respectively. Field photos are available in Appendix A.
Land 10 00022 g002
Figure 3. Temporal changes in weather conditions, thaw depth, ground-surface displacement, and thawing degree days (TDD). The error bars for thaw depth and displacement indicate two standard errors (95.45% confidence interval).
Land 10 00022 g003
Figure 4. Box–whisker plot of changes and differences in thaw depth at the end of thawing periods at sites IC, HV, and SG in years 2017–2019. For SG, statistics are shown separately for survey points in the intact tundra area (SG_intact) and the disturbed area in red color (SG_disturbed). The box limits are standard deviations. Mean values are indicated as lines in the boxes and labeled. The whiskers indicate minimum and maximum values.
Land 10 00022 g004
Figure 5. Microtopography in ellipsoid height (top), seasonal thaw settlement (middle), and interannual displacement at site SG. The disturbed portions in transects T1 and T3 are highlighted in the hachured pattern. The heights of the ground surface at survey stakes were measured on 30 May and 19 August in 2017, 4 June and 11 September in 2018, and 29 May and 25 August in 2019. The arrows indicate locations of thermokarst depressions. Seasonal thaw settlements measured between spring and fall survey days are shown as Seasonal_17, Seasonal_18, and Seasonal_19 for thaw seasons in 2017, 2018, and 2019, respectively (middle). Interannual surface displacements for the period between fall survey days are displayed as 17_18_Fall, 18_19_Fall, and 17_19_Fall, for the 1 year displacement from 2017 to 2018, 1 year displacement from 2018 to 2019, and 2 year displacement from 2017 to 2019, respectively.
Land 10 00022 g005
Figure 6. Microtopography in ellipsoid height (top), seasonal thaw settlement (middle), and interannual displacement at site HV. The heights of ground surface at survey stakes were measured on 29–30 May and 17–18 August in 2017, 2–3 June and 10–11 September in 2018, and 30 May and 20 August in 2019. Legends for the plots are the same as in Figure 5.
Land 10 00022 g006
Figure 7. Microtopography in ellipsoid height (top), seasonal thaw settlement (middle), and interannual displacement at site IC. The heights of ground surface at survey stakes were measured on 29–30 May and 17–18 August in 2017, 2–3 June and 10–11 September in 2018, and 30 May and 20 August in 2019. Legends for the plots are the same as in Figure 5.
Land 10 00022 g007
Figure 8. Scatter plots of the maximum thaw depth against the seasonal thaw settlement for IC, HV, SG_intact, and SG_disturbed points. A linear regression curve with its 95% confidence interval is shown in gray for each plot. The 95% prediction intervals are also shown in solid black lines for each plot. The equation for each plot is a linear regression equation.
Land 10 00022 g008
Figure 9. Correlation matrix among STS (seasonal thaw settlement), TD (maximum thaw depth), TDR period (travel time of electromagnetic waves) at 6 cm depth (SWC_6cm), TDR period at 12 cm depth (SWC_12cm), and TDR period at 20 cm depth (SWC_20cm) for sites (a) IC, (b) HV, (c) SG_intact, and (d) SG_disturbed. The color bars and figures in the matrix indicate the Pearson’s correlation coefficient. The correlation coefficients with p-value > 0.001 are crossed out.
Land 10 00022 g009
Table 1. Meteorological statistics for 2017–2019. The summer period was defined as June–September. TDD and FDD are thawing and freezing degree days, respectively; T D D denotes the square root of TDD.
Meteorological Statistics at SG201720182019
Summer mean air temperature (°C)7.75.88.3
Total rainfall (mm)205228184
Maximum snow depth of previous winter (cm)615669
TDD (June to September)312732
TDD on the day of TD meare ment292631
FDD (October to May)575254
Table 2. Maximum thaw depth, seasonal thaw settlement, and interannual surface displacement at study sites in 2017, 2018, and 2019.
StatisticsSiteMaximum Thaw Depth (cm)Seasonal Thaw Settlement (cm)Inter-Annual Surface Displacement (cm)
201720182019201720182019201720182019
AverageIC47.952.255.66.76.310.2−3.08.75.6
HV41.940.645.66.57.111.6−0.610.59.8
SG-intact41.941.648.17.25.814.32.68.611.6
SG-disturbed61.769.872.612.68.619.95.313.918.2
Standard deviationIC9.19.08.93.02.52.62.52.12.8
HV9.49.08.93.32.13.22.52.63.8
SG-intact9.910.413.02.72.62.82.01.71.9
SG-disturbed19.921.921.98.66.59.36.27.514.3
CI_95%IC2.02.31.60.60.40.50.50.40.5
HV1.72.31.60.60.40.60.50.50.7
SG-intact1.72.72.21.00.80.90.70.60.7
SG-disturbed3.53.63.13.62.33.22.72.65.9
MaximumIC69728115.512.516.03.514.612.9
HV70687518.613.819.45.417.519.5
SG-intact6869100 *11.713.920.37.311.916.4
SG-disturbed127105100 *30.625.043.820.835.055.8
Number of samplesIC8362121111122120110120109
HV12262122121122122121122121
SG-intact12860134304040313931
SG-disturbed323751243335233425
* more than 100 cm.
Publisher’s Note: MDPI stays neutral with regard to jurisdictional claims in published maps and institutional affiliations.

