Evaluation of a Micro-Electro Mechanical Systems Spectral Sensor for Soil Properties Estimation

 , ,
, ,
Abstract
:1. Introduction
2. Materials and Methods
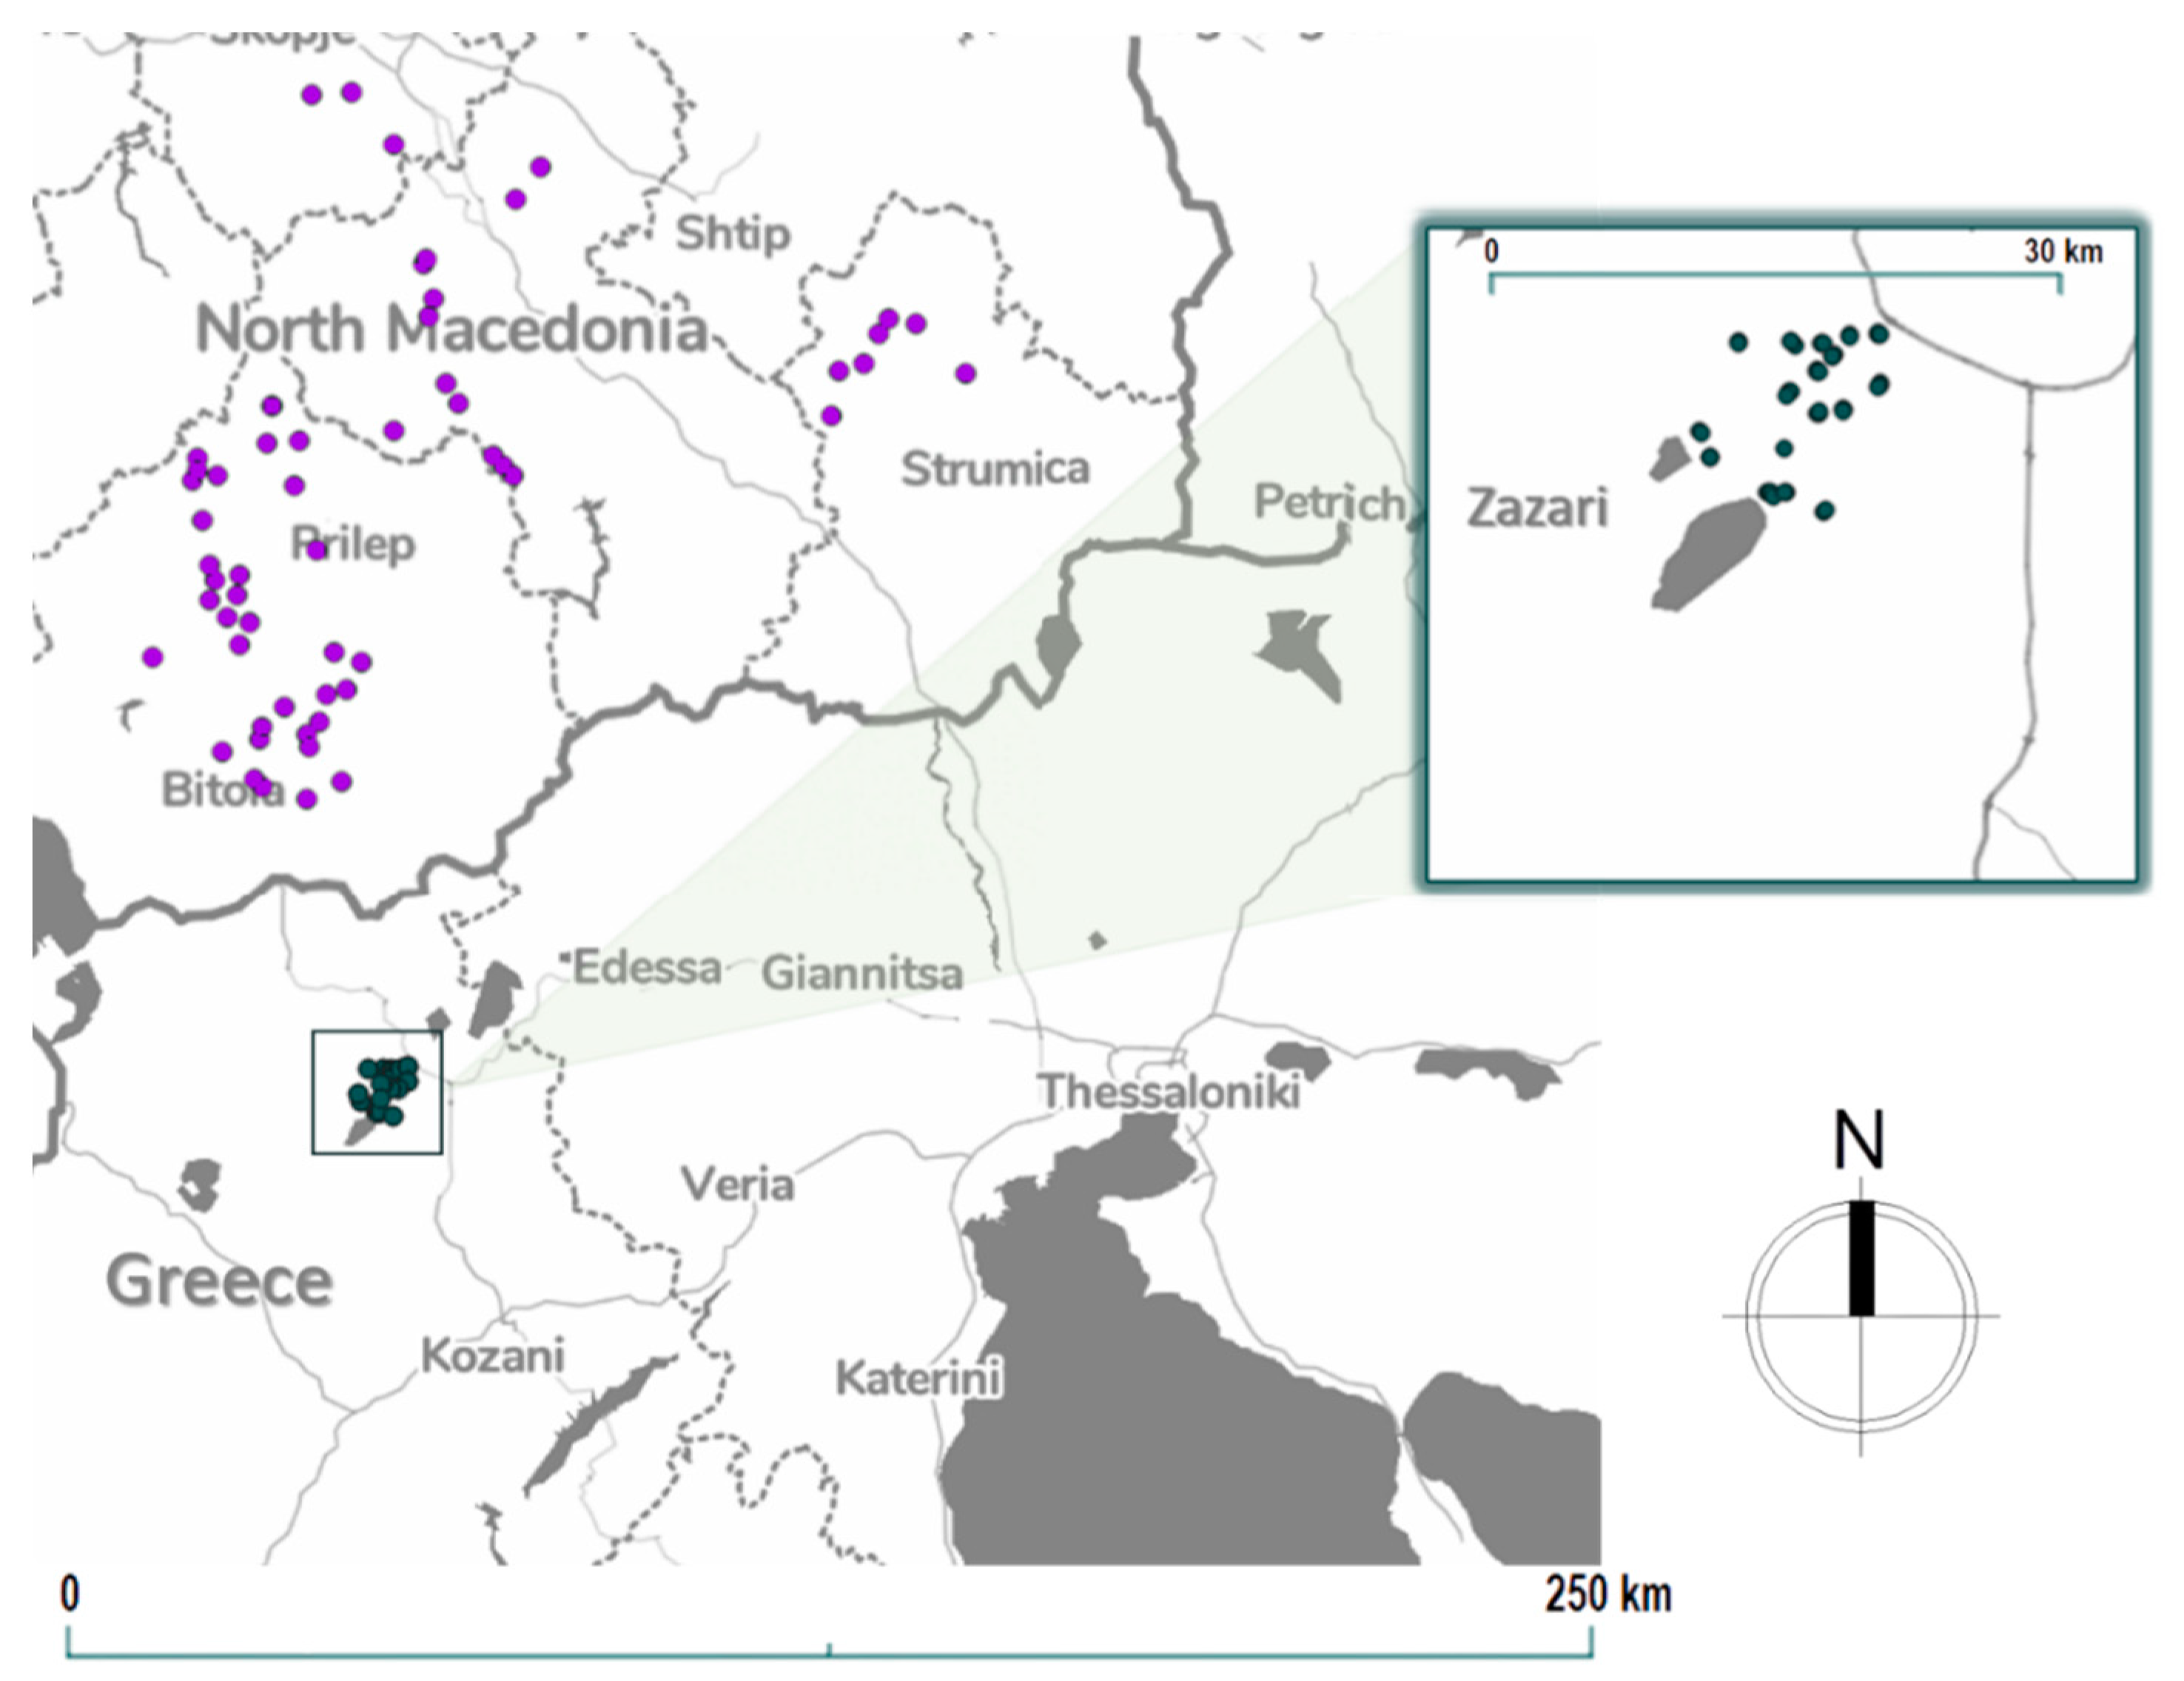
2.1. Sample Dataset
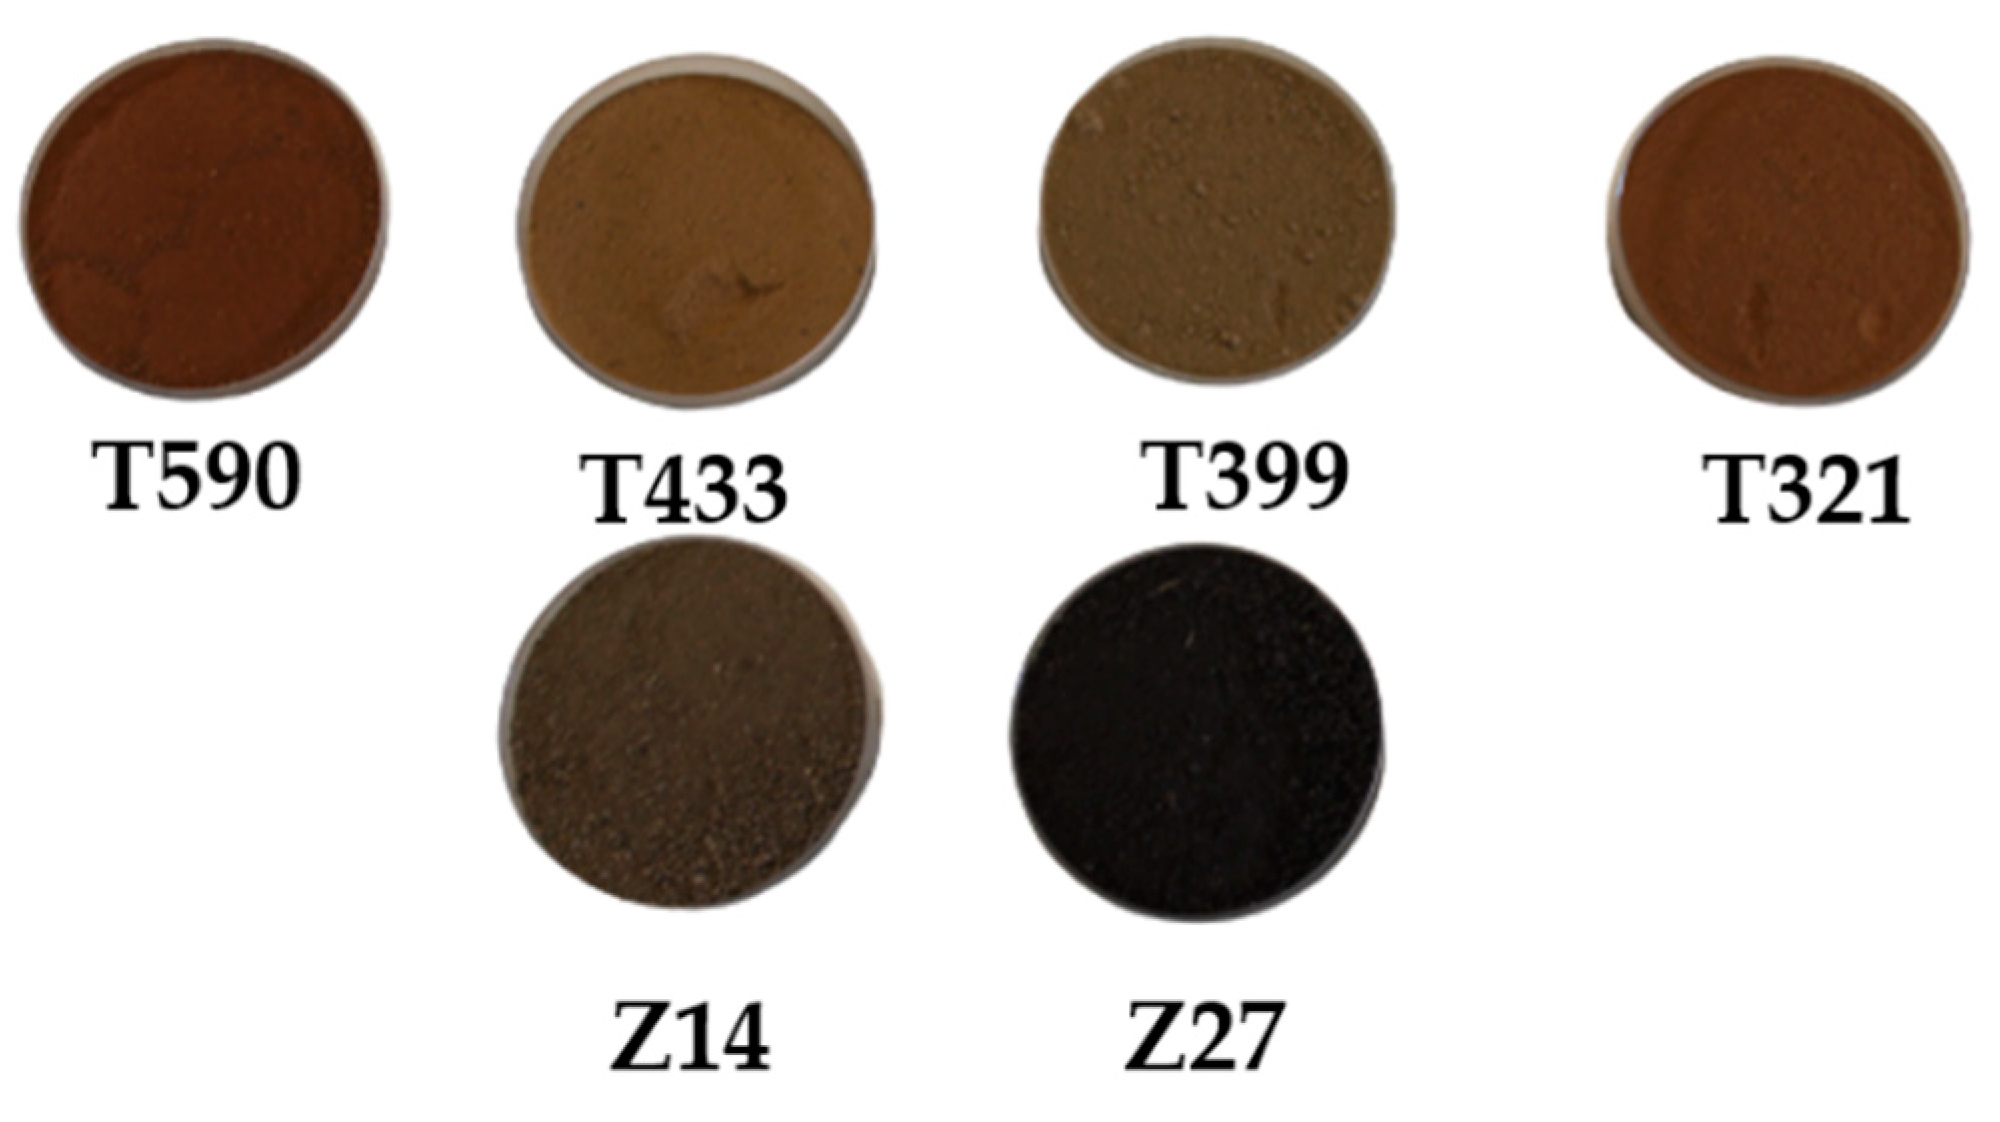
2.2. Sample Preparation and Chemical Analysis
2.3. Spectral Measurements
2.3.1. Reference Spectral Measurements
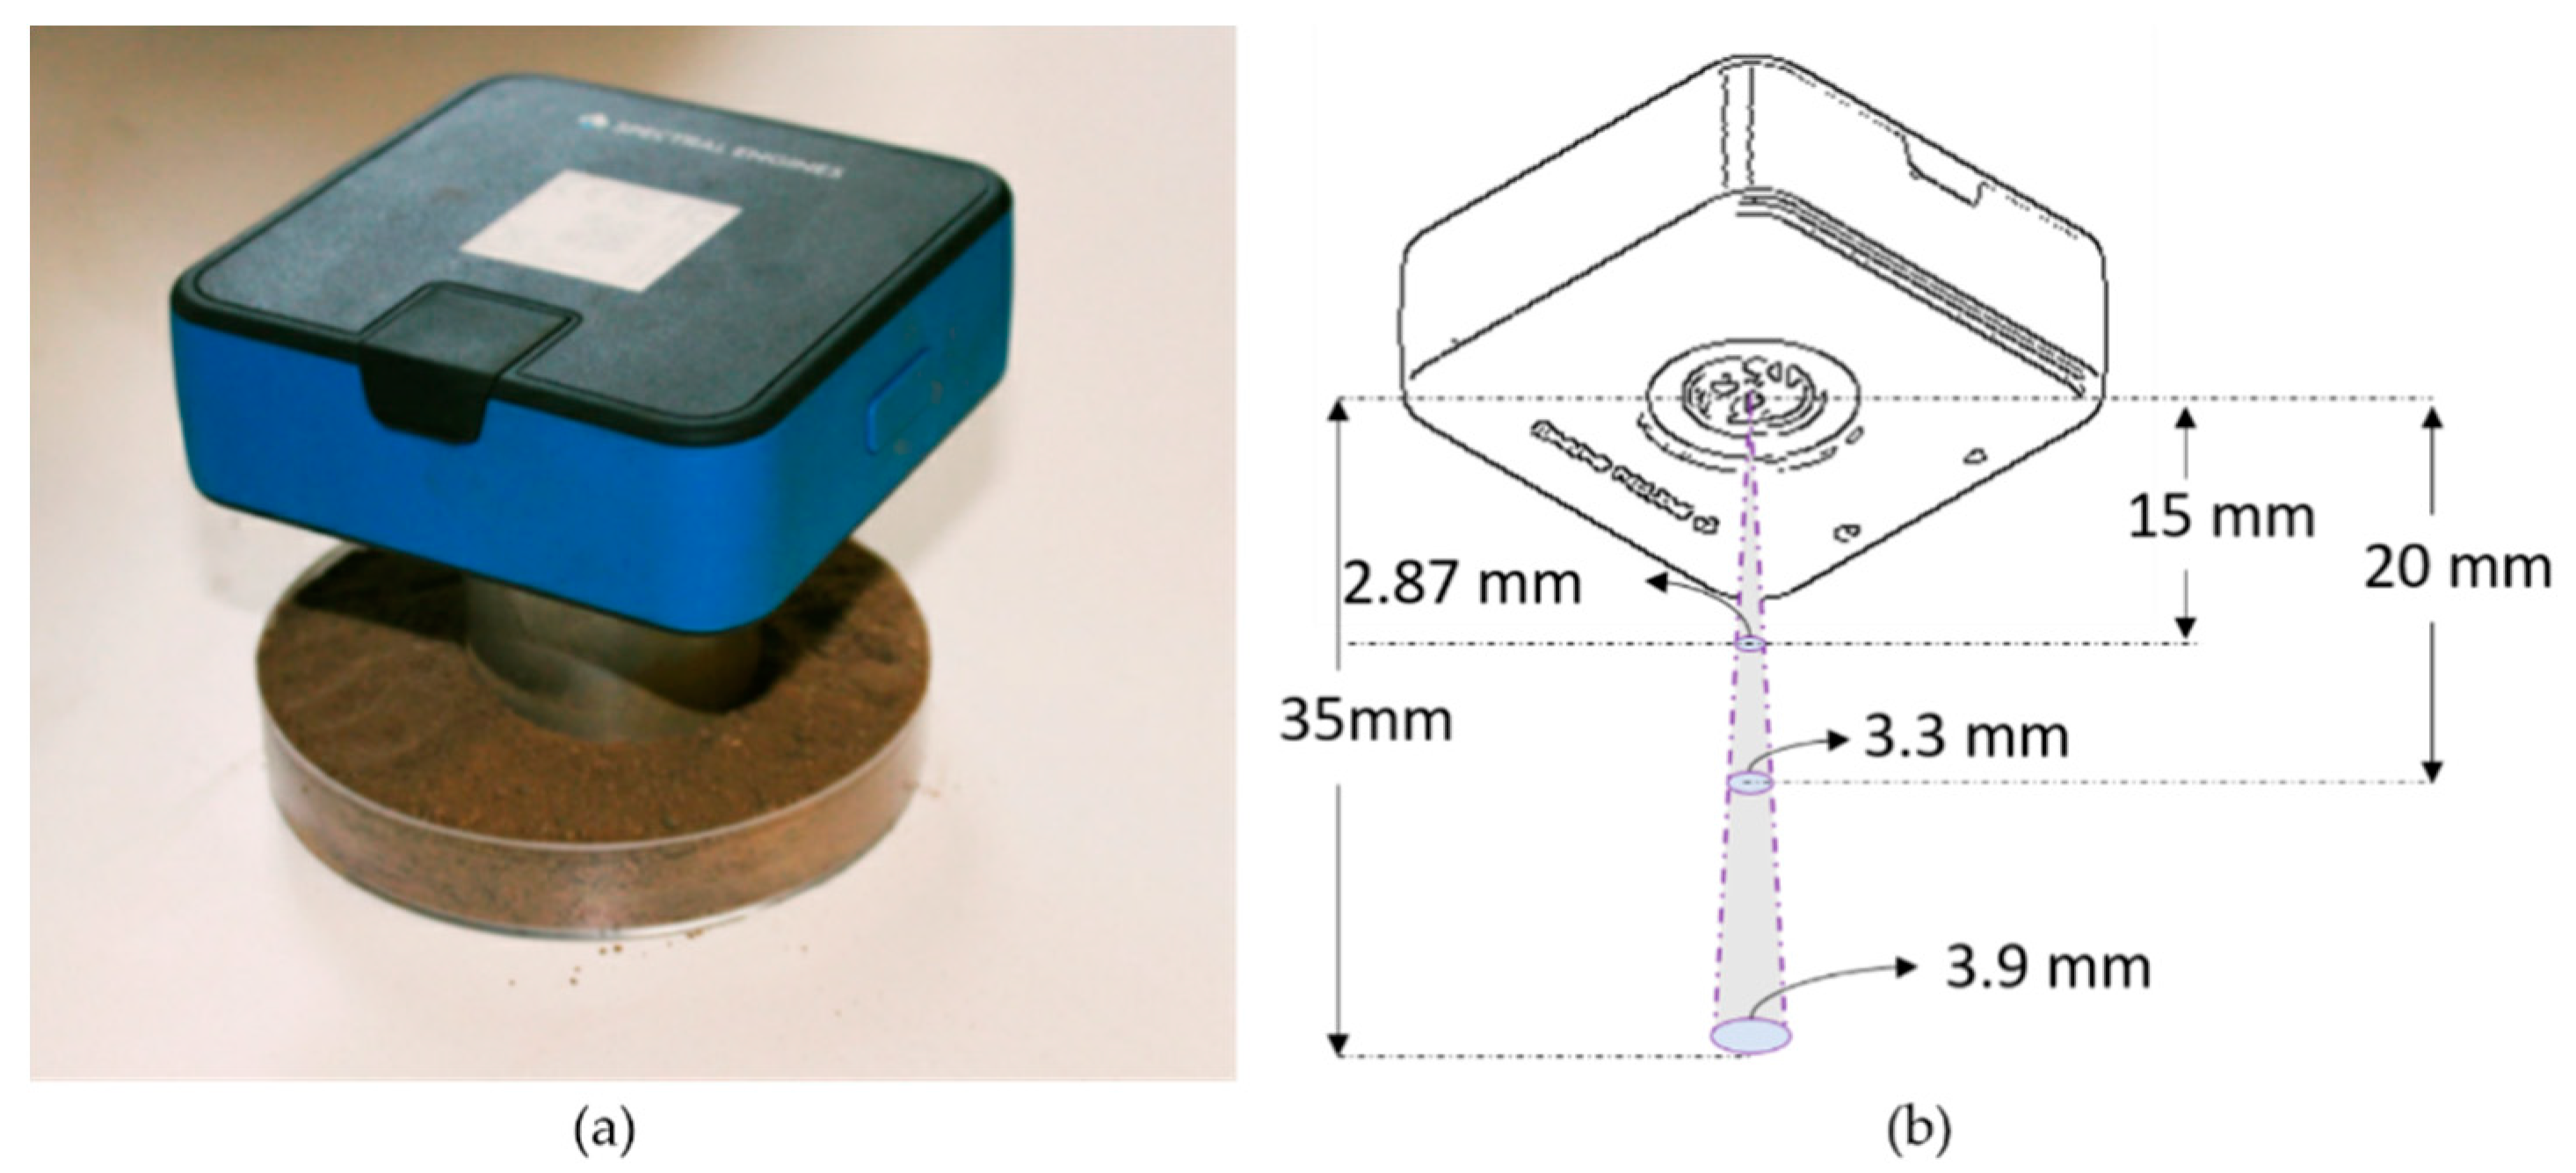
2.3.2. MEMS Sensor Configuration and Experimental Setup
2.3.3. MEMS Sensor Spectral Measurements
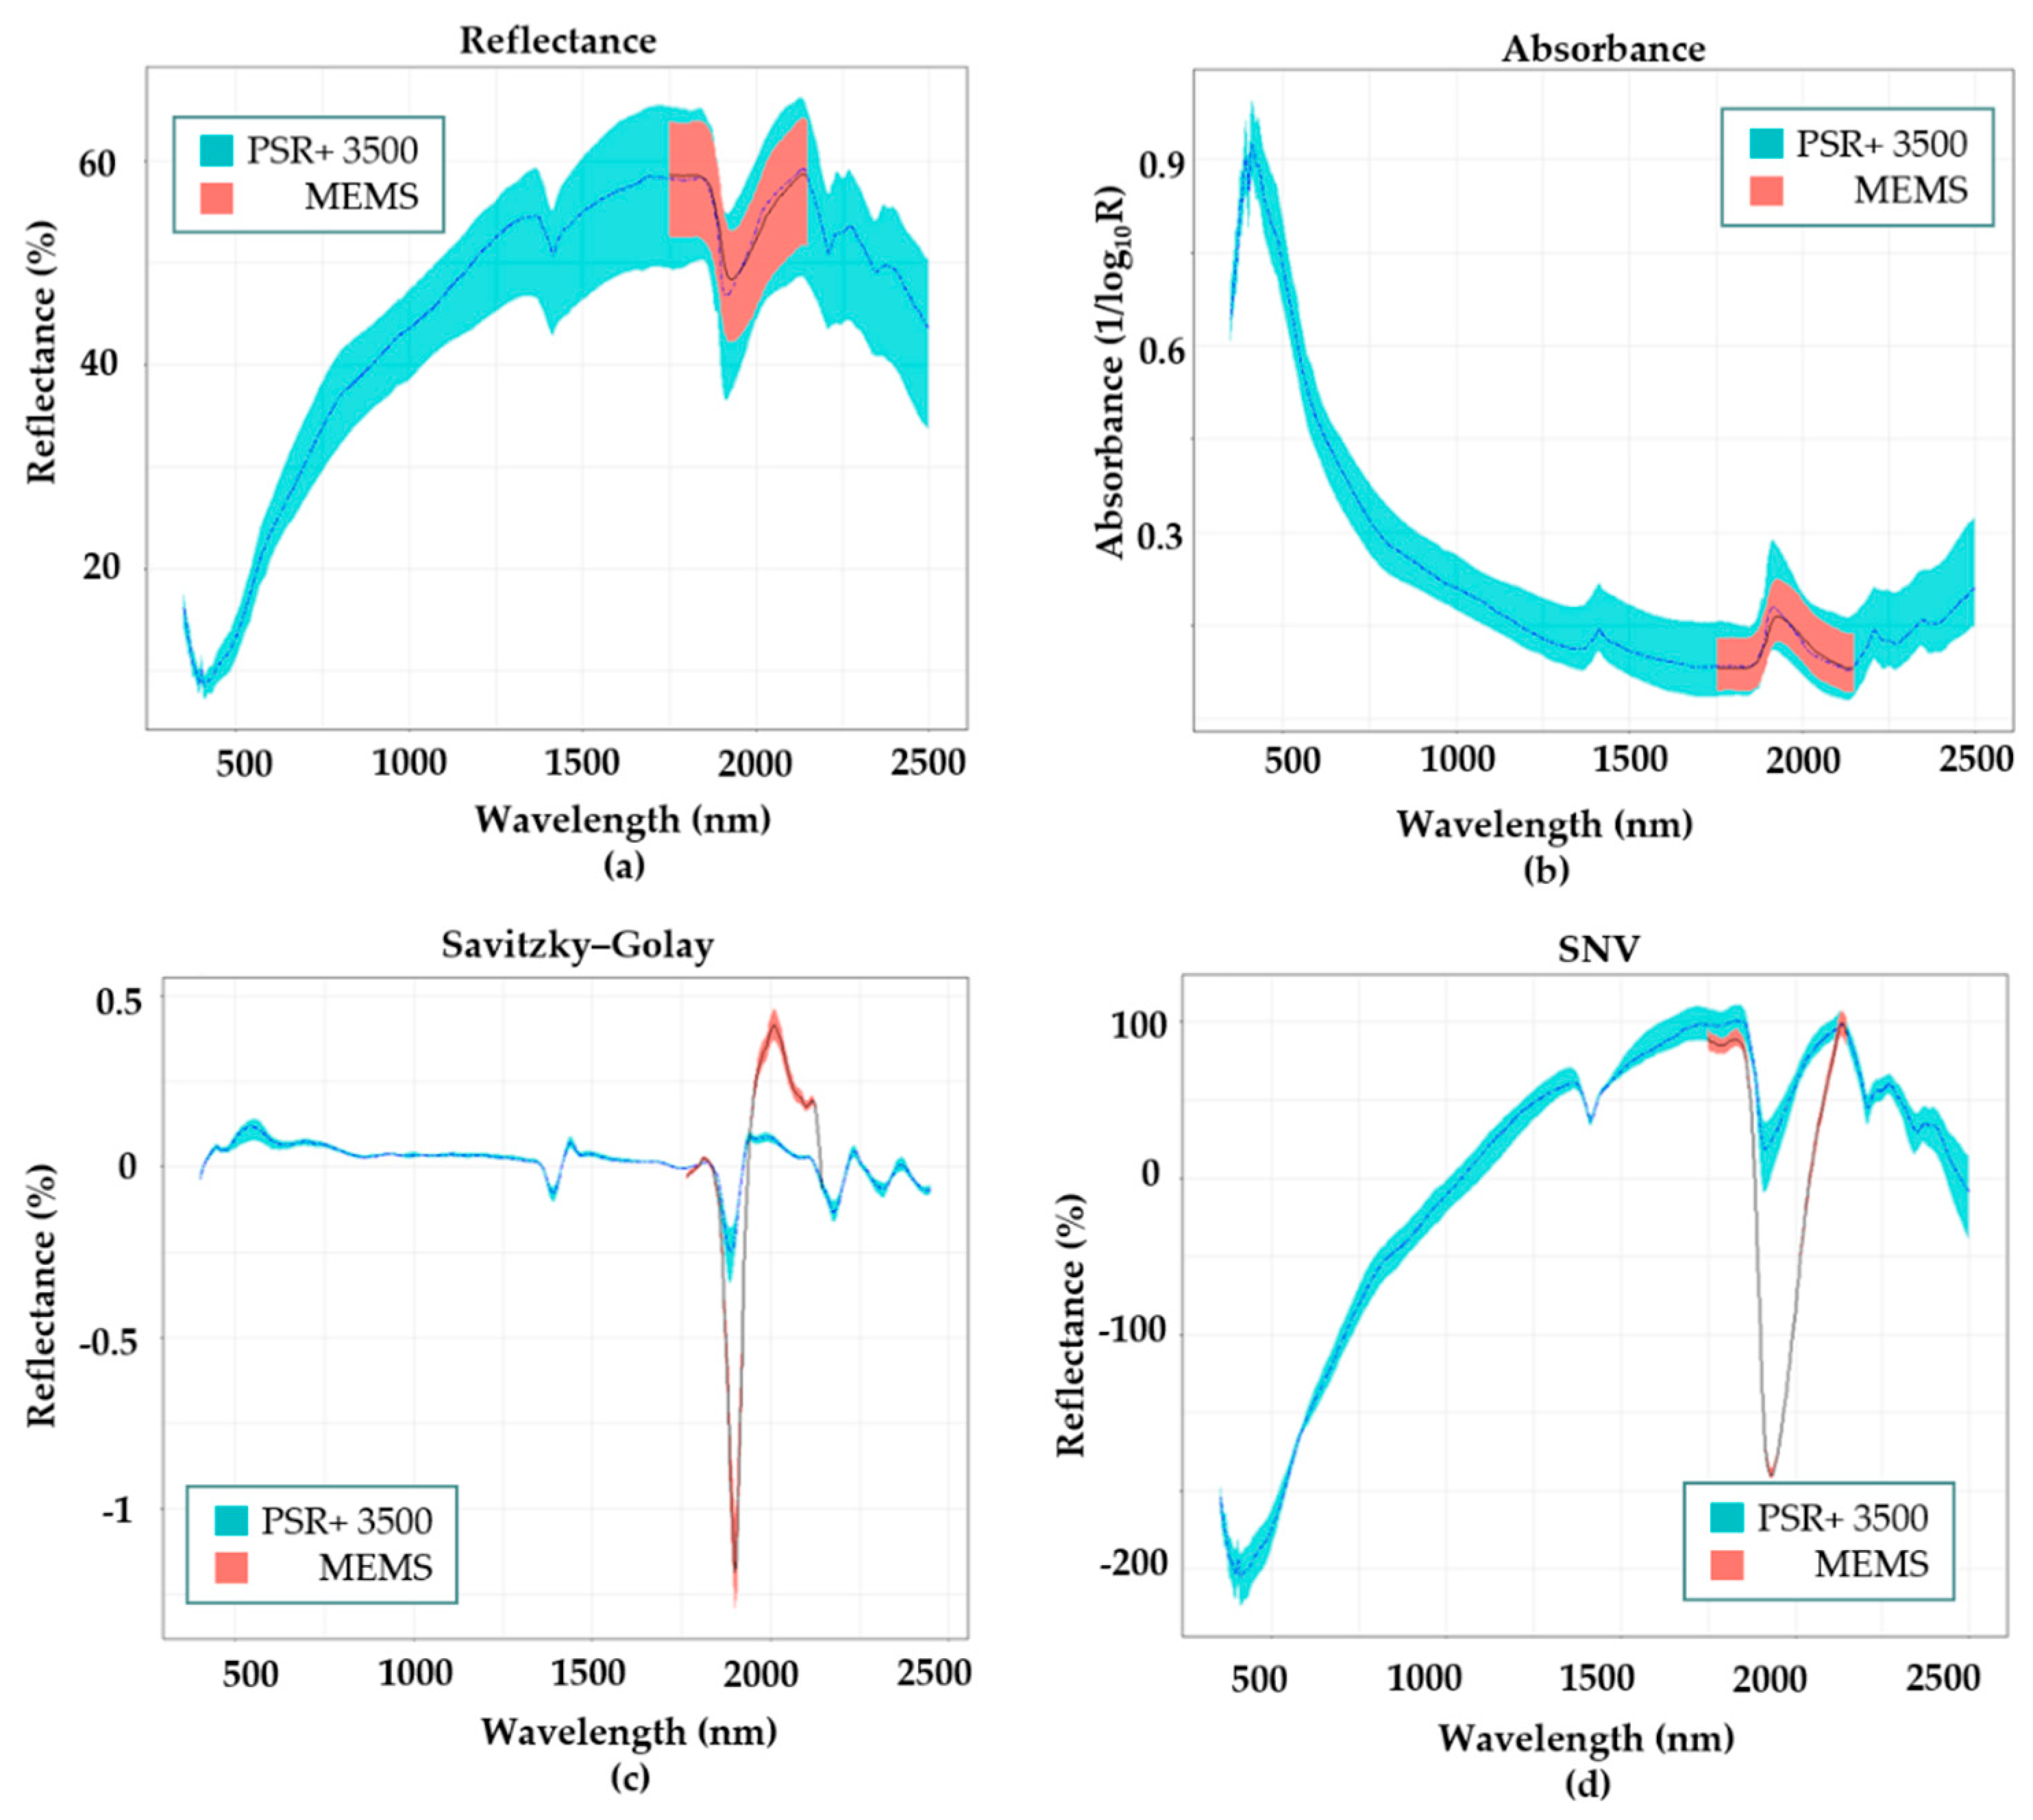
2.4. Spectral Data Preprocessing
2.5. Model Calibration and Validation
3. Results and Discussion
3.1. Physicochemical Analysis of Soil Samples
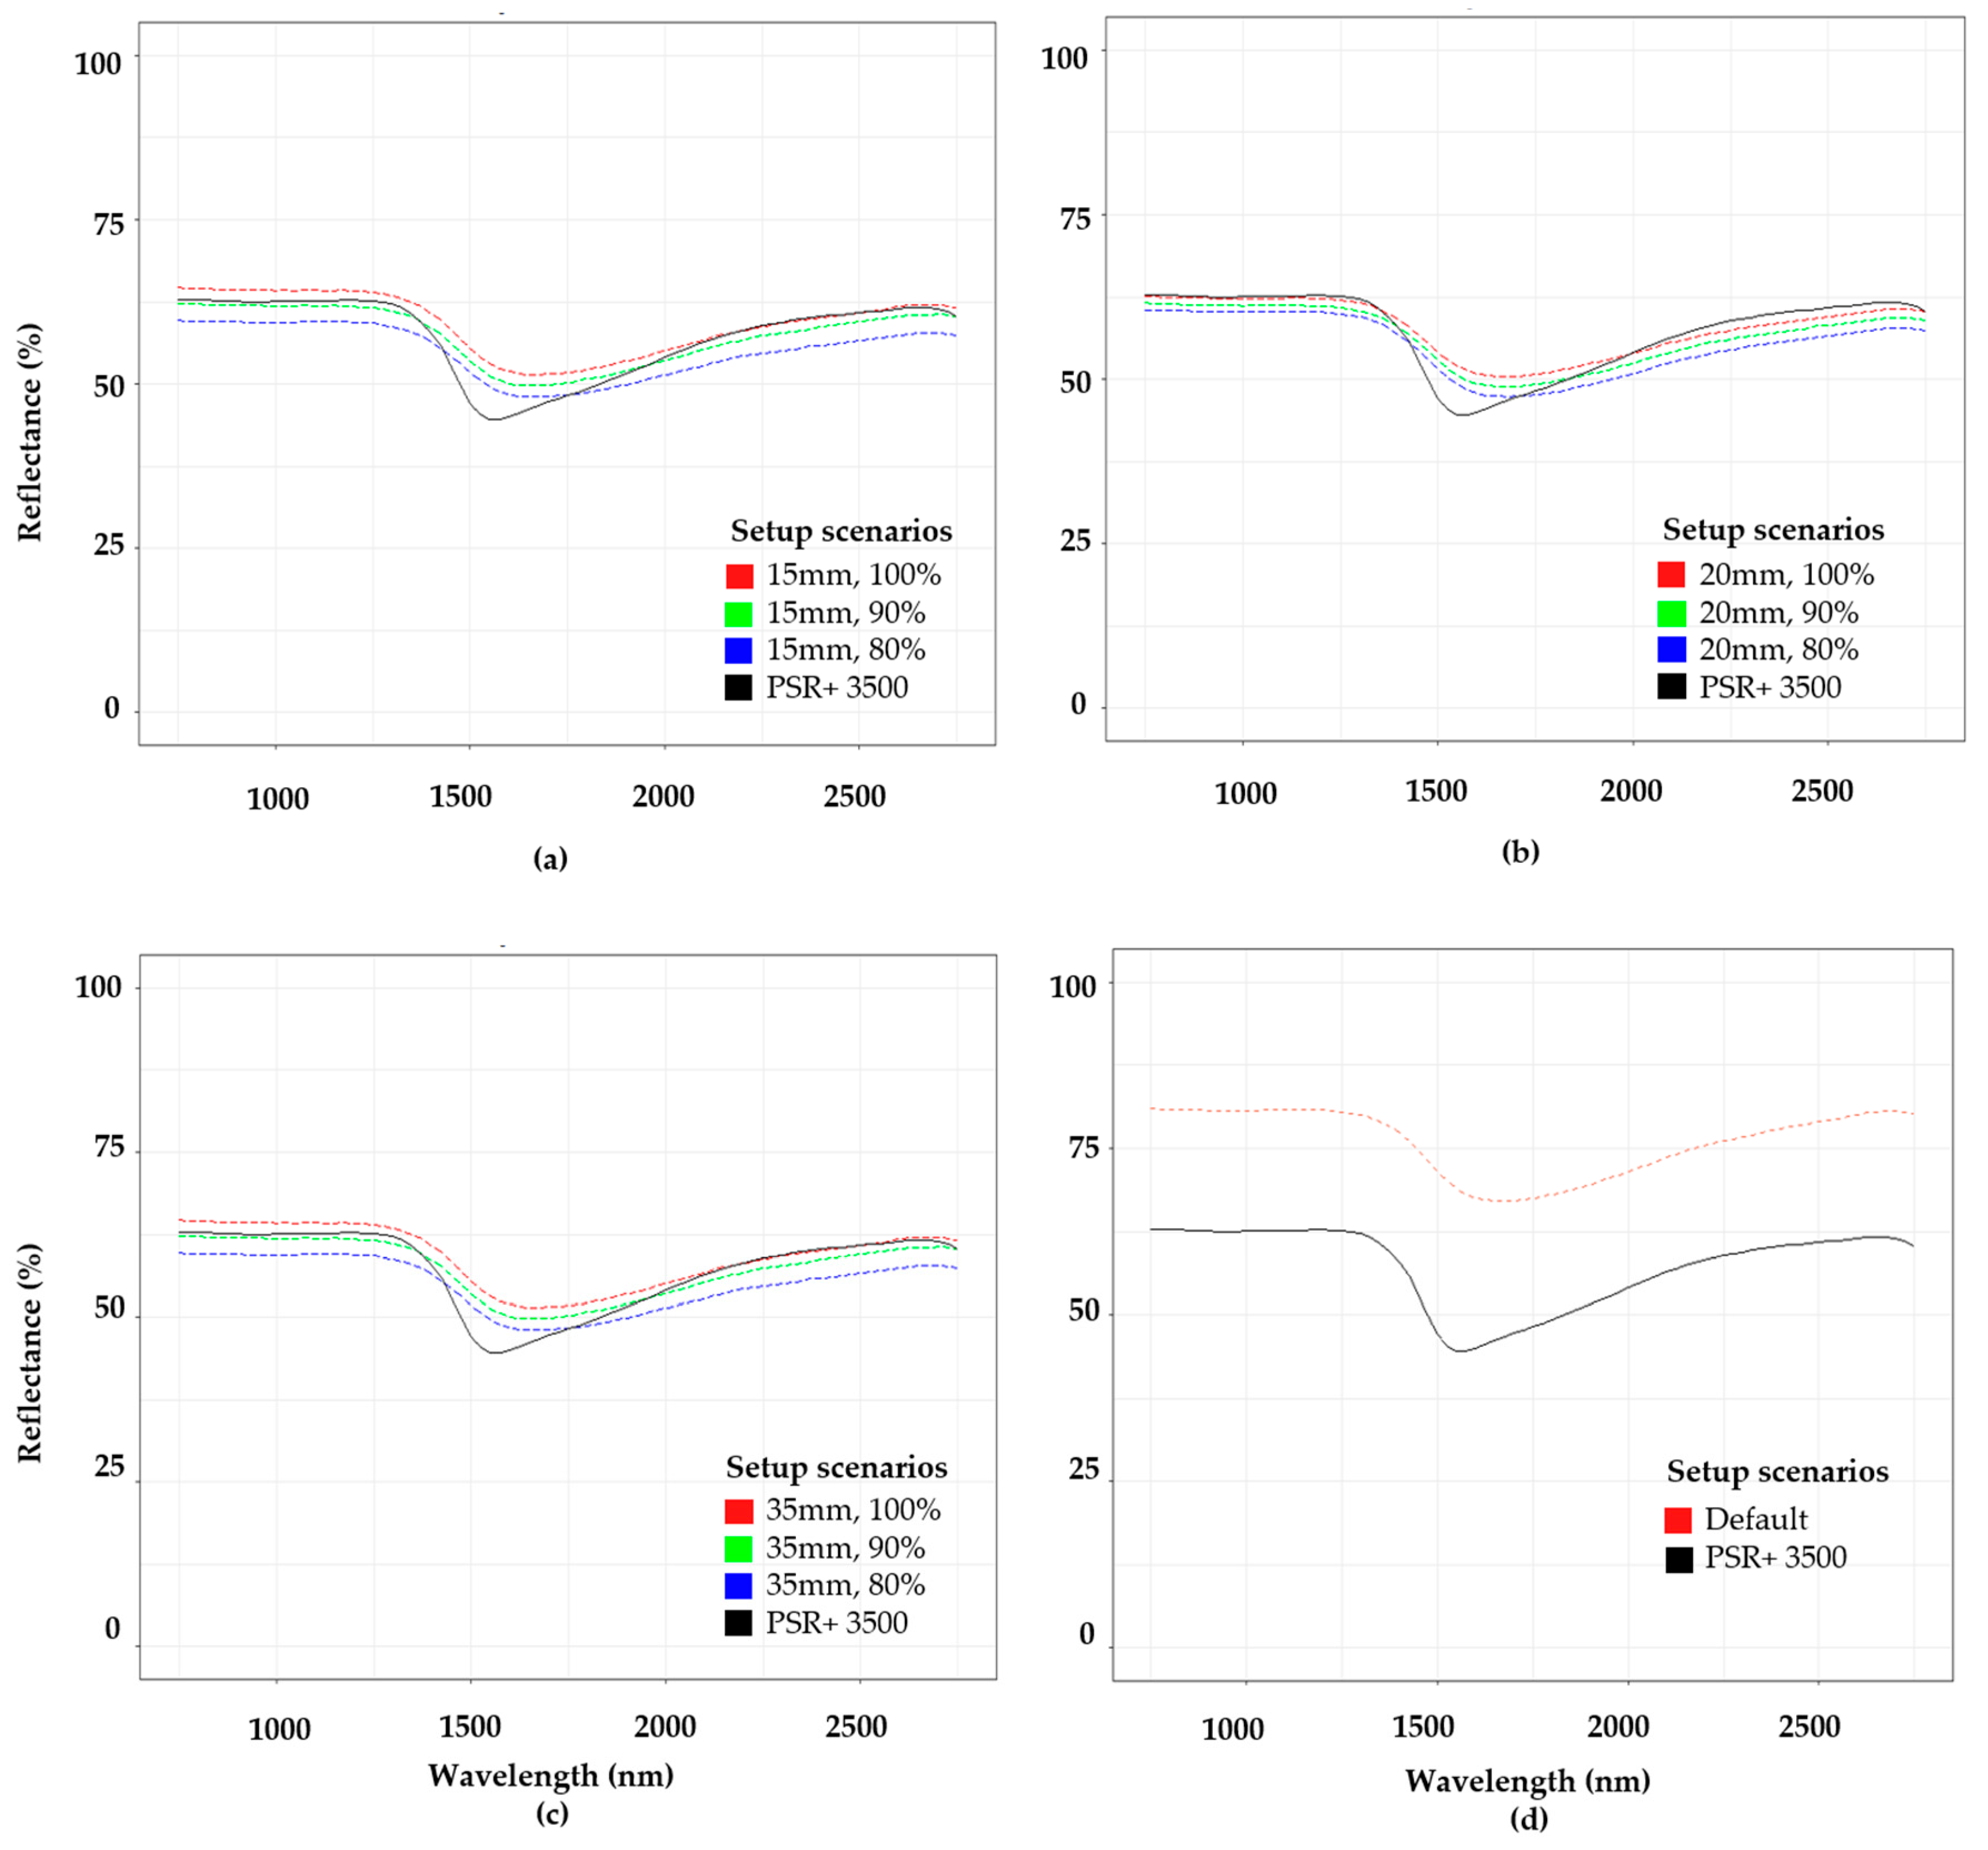
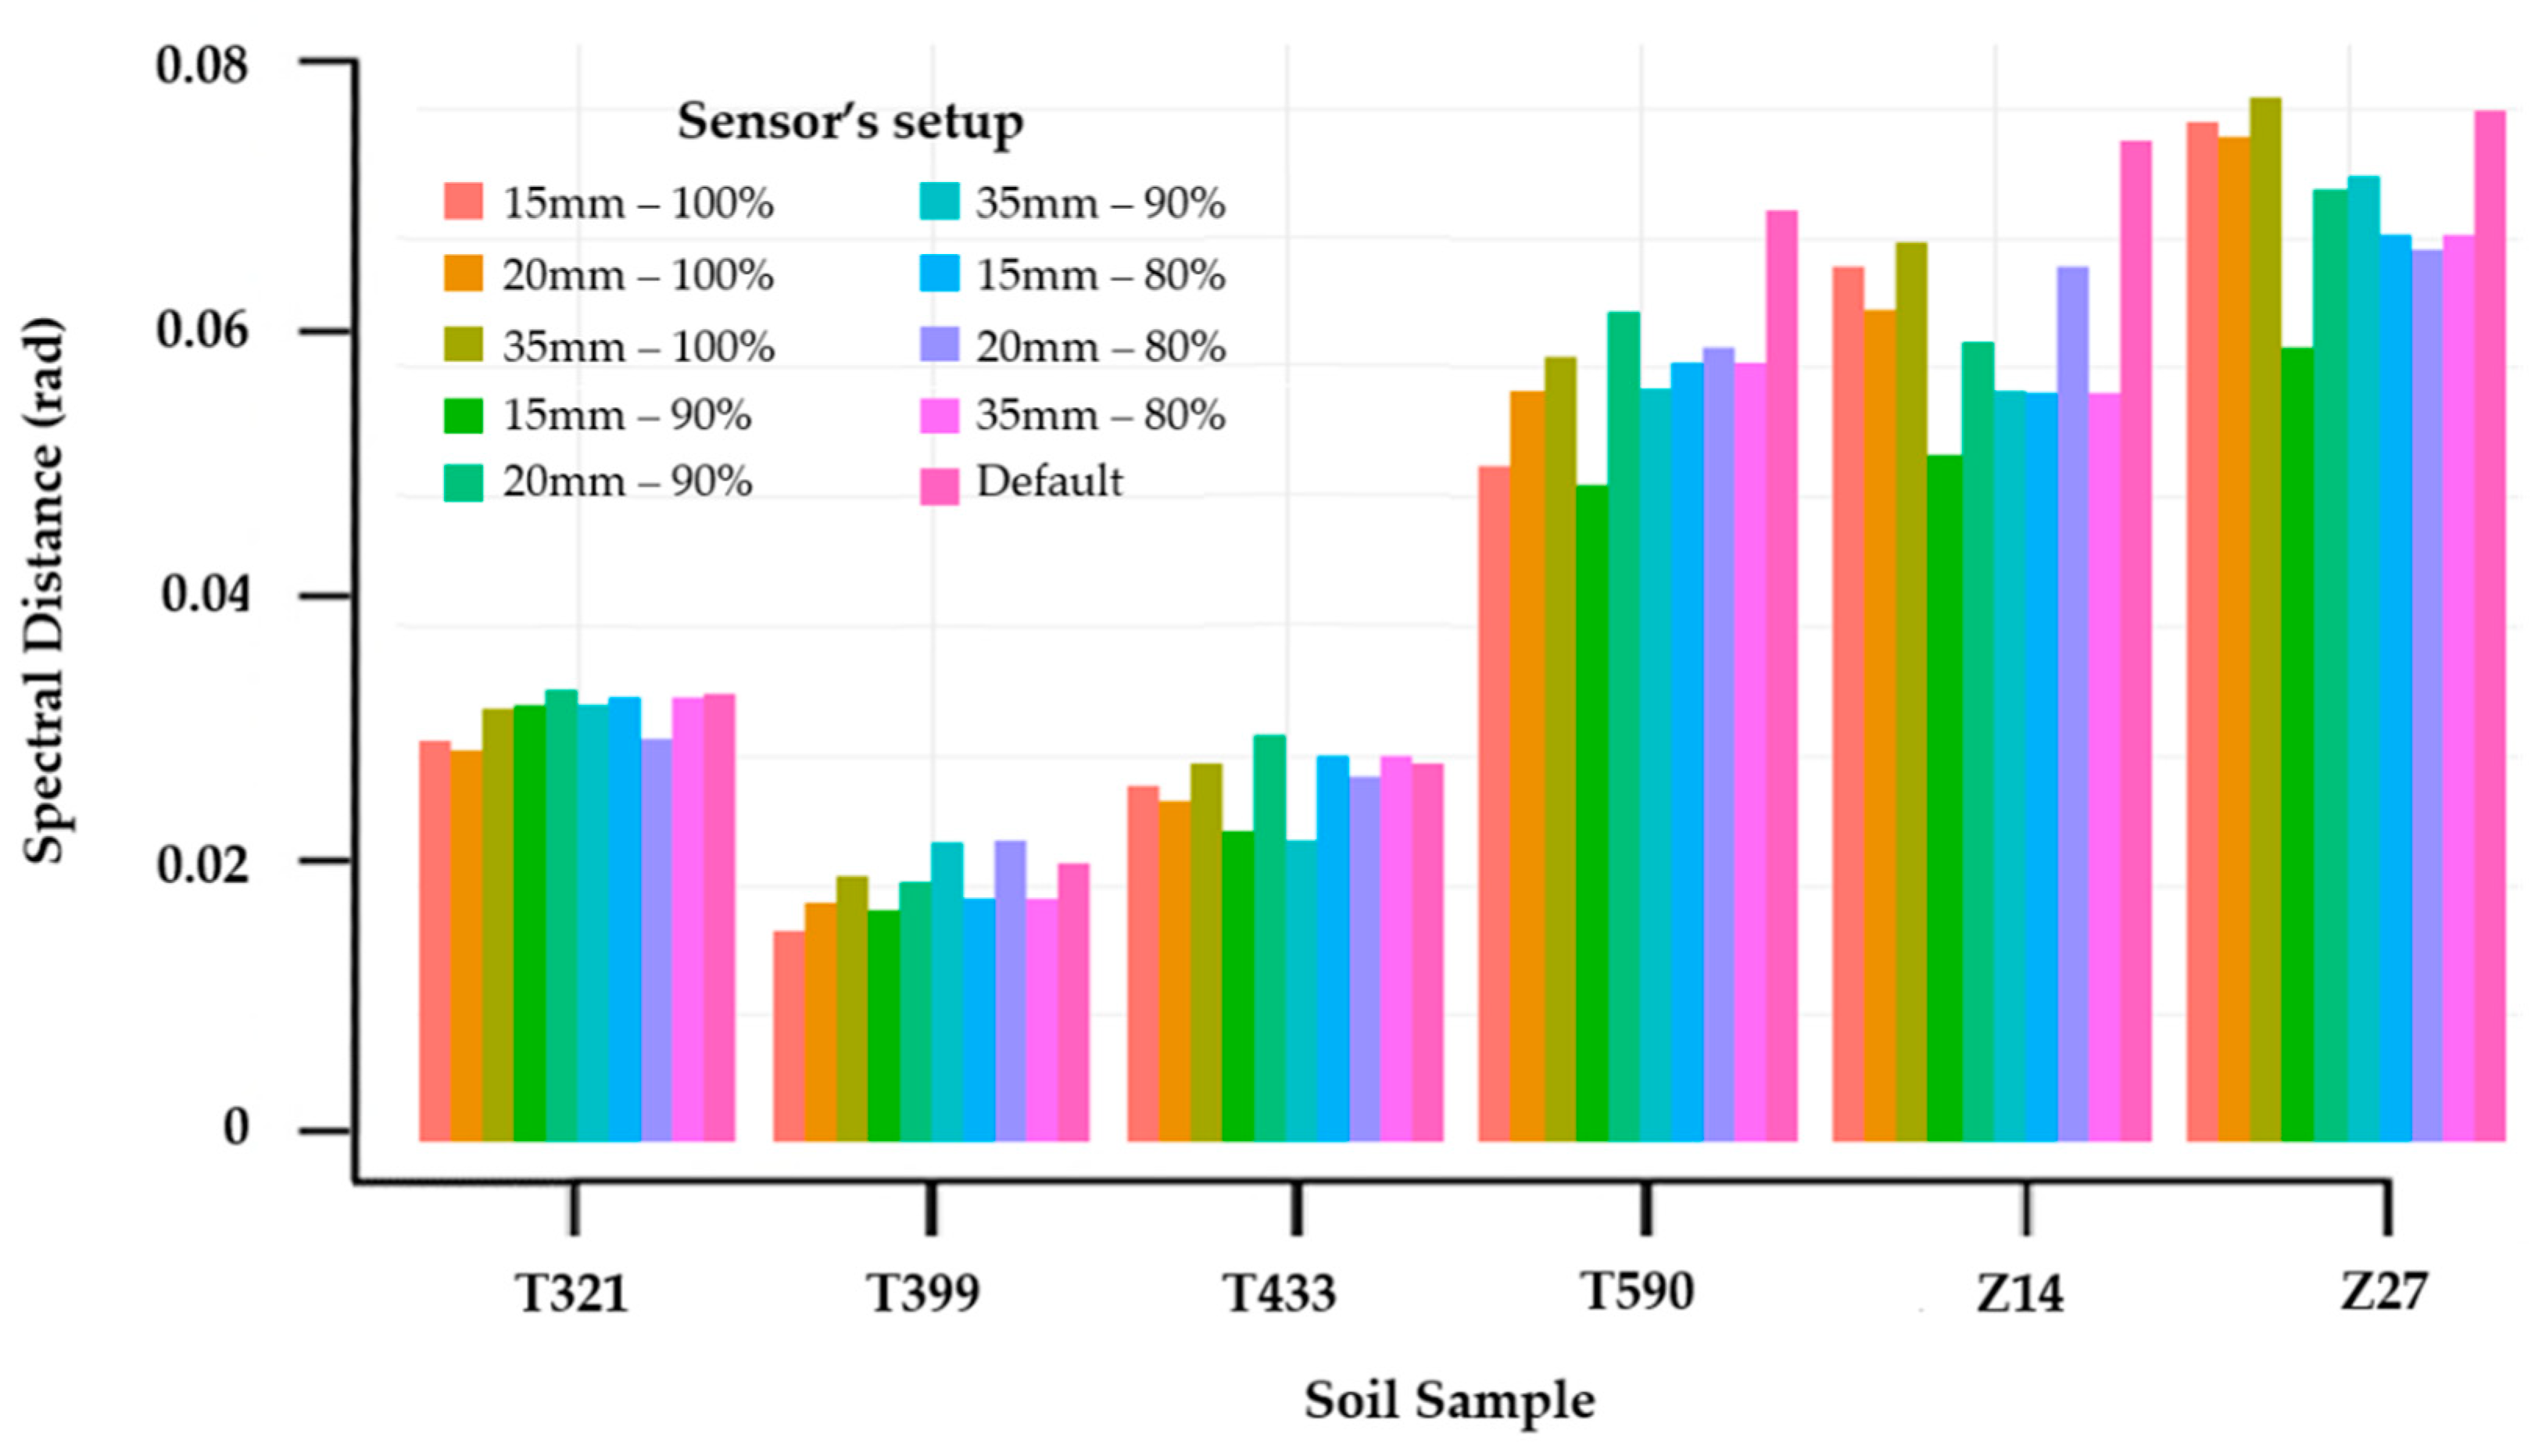
3.2. MEMS Sensor Optimal Configuration
3.3. Reference Spectral Measurements Compared to The MEMS Sensor Spectral Measurements
4. Conclusions
Author Contributions
Funding
Data Availability Statement
Acknowledgments
Conflicts of Interest
References
- Salam, A.; Shah, S. Internet of things in smart agriculture: Enabling technologies. In Proceedings of the IEEE 5th World Forum on Internet of Things, WF-IoT 2019-Conference Proceedings, Limerick, Ireland, 15–18 April 2019; pp. 692–695. [Google Scholar]
- Muangprathub, J.; Boonnam, N.; Kajornkasirat, S.; Lekbangpong, N.; Wanichsombat, A.; Nillaor, P. IoT and agriculture data analysis for smart farm. Comput. Electron. Agric. 2018, 156, 467–474. [Google Scholar] [CrossRef]
- Walter, A.; Finger, R.; Huber, R.; Buchmann, N. Smart farming is key to developing sustainable agriculture. Proc. Natl. Acad. Sci. USA 2017, 114, 6148–6150. [Google Scholar] [CrossRef] [PubMed] [Green Version]
- Viscarra Rossel, R.A.; Adamchuk, V.I.; Sudduth, K.A.; McKenzie, N.J.; Lobsey, C. Proximal Soil Sensing: An Effective Approach for Soil Measurements in Space and Time; Academic Press: Cambridge, MA, USA, 2011; Volume 113, pp. 243–291. [Google Scholar]
- Bowers, S.A.; Hanks, R.J. Reflection of Radiant Energy from Soils. Soil Sci. 1965, 100, 130–138. [Google Scholar] [CrossRef] [Green Version]
- Nocita, M.; Stevens, A.; van Wesemael, B.; Aitkenhead, M.; Bachmann, M.; Barthès, B.; Ben Dor, E.; Brown, D.J.; Clairotte, M.; Csorba, A.; et al. Soil Spectroscopy: An Alternative to Wet Chemistry for Soil Monitoring. Adv. Agron. 2015, 132, 139–159. [Google Scholar] [CrossRef]
- Cozzolino, D.; Cynkar, W.U.; Dambergs, R.G.; Shah, N.; Smith, P. In Situ Measurement of Soil Chemical Composition by Near-Infrared Spectroscopy: A Tool Toward Sustainable Vineyard Management. Commun. Soil Sci. Plant Anal. 2013, 44, 1610–1619. [Google Scholar] [CrossRef]
- Wetterlind, J.; Stenberg, B.; Söderström, M. Increased sample point density in farm soil mapping by local calibration of visible and near infrared prediction models. Geoderma 2010, 156, 152–160. [Google Scholar] [CrossRef] [Green Version]
- Heinze, S.; Vohland, M.; Joergensen, R.G.; Ludwig, B. Usefulness of near-infrared spectroscopy for the prediction of chemical and biological soil properties in different long-term experiments. J. Plant Nutr. Soil Sci. 2013, 176, 520–528. [Google Scholar] [CrossRef]
- Rossel, R.A.V.; Behrens, T. Using data mining to model and interpret soil diffuse reflectance spectra. Geoderma 2010, 158, 46–54. [Google Scholar] [CrossRef]
- Piekarczyk, J.; Kazmierowski, C.; Krolewicz, S.; Cierniewski, J. Effects of Soil Surface Roughness on Soil Reflectance Measured in Laboratory and Outdoor Conditions. IEEE J. Sel. Top. Appl. Earth Obs. Remote Sens. 2016, 9, 827–834. [Google Scholar] [CrossRef]
- Jaconi, A.; Vos, C.; Don, A. Near infrared spectroscopy as an easy and precise method to estimate soil texture. Geoderma 2019, 337, 906–913. [Google Scholar] [CrossRef]
- Moura-Bueno, J.M.; Dalmolin, R.S.D.; ten Caten, A.; Dotto, A.C.; Demattê, J.A.M. Stratification of a local VIS-NIR-SWIR spectral library by homogeneity criteria yields more accurate soil organic carbon predictions. Geoderma 2019, 337, 565–581. [Google Scholar] [CrossRef]
- Gholizadeh, A.; Saberioon, M.; Carmon, N.; Boruvka, L.; Ben-Dor, E. Examining the Performance of PARACUDA-II Data-Mining Engine versus Selected Techniques to Model Soil Carbon from Reflectance Spectra. Remote Sens. 2018, 10, 1172. [Google Scholar] [CrossRef] [Green Version]
- Padarian, J.; Minasny, B.; McBratney, A.B. Using deep learning to predict soil properties from regional spectral data. Geoderma Reg. 2019, 16, e00198. [Google Scholar] [CrossRef]
- Angelopoulou, T.; Balafoutis, A.; Zalidis, G.; Bochtis, D. From laboratory to proximal sensing spectroscopy for soil organic carbon estimation-A review. Sustainability 2020, 12, 443. [Google Scholar] [CrossRef] [Green Version]
- Churchman, G.J. Game Changer in Soil Science. Functional role of clay minerals in soil. J. Plant Nutr. Soil Sci. 2018, 181, 99–103. [Google Scholar] [CrossRef] [Green Version]
- FAO. Soil Organic Carbon the Hidden Potential; FAO: Rome, Italy, 2017; ISBN 9789251096819. [Google Scholar]
- Nabiollahi, K.; Golmohamadi, F.; Taghizadeh-Mehrjardi, R.; Kerry, R.; Davari, M. Assessing the effects of slope gradient and land use change on soil quality degradation through digital mapping of soil quality indices and soil loss rate. Geoderma 2018, 318, 16–28. [Google Scholar] [CrossRef]
- Zeraatpisheh, M.; Bakhshandeh, E.; Hosseini, M.; Alavi, S.M. Assessing the effects of deforestation and intensive agriculture on the soil quality through digital soil mapping. Geoderma 2020, 363, 114139. [Google Scholar] [CrossRef]
- Fang, Q.; Hong, H.; Zhao, L.; Kukolich, S.; Yin, K.; Wang, C. Visible and Near-Infrared Reflectance Spectroscopy for Investigating Soil Mineralogy: A Review. J. Spectrosc. 2018, 1–14. [Google Scholar] [CrossRef]
- Stenberg, B.; Viscarra Rossel, R.A.; Mouazen, A.M.; Wetterlind, J. Visible and near infrared spectroscopy in soil science. In Advances in Agronomy; Academic Press: Cambridge, MA, USA, 2010; Volume 107, pp. 163–215. [Google Scholar] [CrossRef] [Green Version]
- Lee, K.S.; Lee, D.H.; Sudduth, K.A.; Chung, S.O.; Kitchen, N.R.; Drummond, S.T. Wavelength identification and diffuse reflectance estimation for surface and profile soil properties. Trans. ASABE 2009, 52, 683–695. [Google Scholar] [CrossRef]
- Angelopoulou, T.; Tziolas, N.; Balafoutis, A.; Zalidis, G.; Bochtis, D. Remote sensing techniques for soil organic carbon estimation: A review. Remote Sens. 2019, 11, 676. [Google Scholar] [CrossRef] [Green Version]
- Viscarra Rossel, R.A.; Behrens, T.; Ben-Dor, E.; Brown, D.J.; Demattê, J.A.M.; Shepherd, K.D.; Shi, Z.; Stenberg, B.; Stevens, A.; Adamchuk, V.; et al. A global spectral library to characterize the world’s soil. Earth Sci. Rev. 2016, 155, 198–230. [Google Scholar] [CrossRef] [Green Version]
- Brown, D.J. Using a global VNIR soil-spectral library for local soil characterization and landscape modeling in a 2nd-order Uganda watershed. Geoderma 2007, 140, 444–453. [Google Scholar] [CrossRef]
- Stevens, A.; Nocita, M.; Tóth, G.; Montanarella, L.; van Wesemael, B. Prediction of Soil Organic Carbon at the European Scale by Visible and Near InfraRed Reflectance Spectroscopy. PLoS ONE 2013, 8, e66409. [Google Scholar] [CrossRef] [PubMed]
- Waiser, T.H.; Morgan, C.L.S.; Brown, D.J.; Hallmark, C.T. In Situ Characterization of Soil Clay Content with Visible Near-Infrared Diffuse Reflectance Spectroscopy. Soil Sci. Soc. Am. J. 2007, 71, 389. [Google Scholar] [CrossRef]
- Kuang, B.; Mahmood, H.S.; Quraishi, M.Z.; Hoogmoed, W.B.; Mouazen, A.M.; van Henten, E.J. Sensing soil properties in the laboratory, in situ, and on-line. A review. In Advances in Agronomy; Academic Press: Cambridge, MA, USA, 2012. [Google Scholar]
- Viscarra Rossel, R.A.; Cattle, S.R.; Ortega, A.; Fouad, Y. In situ measurements of soil colour, mineral composition and clay content by vis–NIR spectroscopy. Geoderma 2009, 150, 253–266. [Google Scholar] [CrossRef]
- Roudier, P.; Hedley, C.B.; Ross, C.W. Prediction of volumetric soil organic carbon from field-moist intact soil cores. Eur. J. Soil Sci. 2015, 66, 651–660. [Google Scholar] [CrossRef]
- Knadel, M.; Thomsen, A.; Schelde, K.; Greve, M.H. Soil organic carbon and particle sizes mapping using vis-NIR, EC and temperature mobile sensor platform. Comput. Electron. Agric. 2015, 114, 134–144. [Google Scholar] [CrossRef]
- Vincent, D.R.; Deepa, N.; Elavarasan, D.; Srinivasan, K.; Chauhdary, S.H.; Iwendi, C. Sensors Driven AI-Based Agriculture Recommendation Model for Assessing Land Suitability. Sensors 2019, 19, 3667. [Google Scholar] [CrossRef] [Green Version]
- Sharma, N.; Pant, B.D.; Mathur, J. MEMS devices used in agriculture-a review. J. Biosens. Bioelectron. 2019, 10, 267. [Google Scholar] [CrossRef]
- Rady, A.; Fischer, J.; Reeves, S.; Logan, B.; James Watson, N. The Effect of Light Intensity, Sensor Height, and Spectral Pre-Processing Methods When Using NIR Spectroscopy to Identify Different Allergen-Containing Powdered Foods. Sensors 2019, 20, 230. [Google Scholar] [CrossRef] [Green Version]
- Salzmann, M.; Schledjewski, R. Controlling Moisture Content of Natural Fibres in RTM-Process. In Key Engineering Materials; Trans Tech Publisher: Zurich, Swizterland, 2019; Volume 809, pp. 610–614. [Google Scholar]
- Uusitalo, S.; Aernouts, B.; Sumen, J.; Hietala, E.; Utriainen, M.; Frondelius, L.; Kajava, S.; Pastell, M. Comparison of milk analysis performance between NIR laboratory analyser and miniaturised NIR MEMS sensors. In ICAR Conference Technical Series No. 24: New Traits and Adding New Value to the Recording and ID Services in the Animal Production, Prague, Czech Republic, 17–21 June 2019; ICAR: Rome, Italy, 2019; pp. 111–115. [Google Scholar]
- Kirchler, C.G.; Pezzei, C.K.; Beć, K.B.; Mayr, S.; Ishigaki, M.; Ozaki, Y.; Huck, C.W. Critical evaluation of spectral information of benchtop vs. portable near-infrared spectrometers: Quantum chemistry and two-dimensional correlation spectroscopy for a better understanding of PLS regression models of the rosmarinic acid content in Rosmarin. Analyst 2017, 142, 455–464. [Google Scholar] [CrossRef] [PubMed]
- Luco Colilles, A. Evaluation of Two Compact Near-Infrared Spectrometers for the Detection of Microplastics in Soil Samples, Report; Universitat de Barcelona: Barcelona, Spain, 2019. [Google Scholar]
- Tang, Y.; Jones, E.; Minasny, B. Evaluating low-cost portable near infrared sensors for rapid analysis of soils from South Eastern Australia. Geoderma Reg. 2020, 20, e00240. [Google Scholar] [CrossRef]
- Ng, W.; Husnain; Anggria, L.; Siregar, A.F.; Hartatik, W.; Sulaeman, Y.; Jones, E.; Minasny, B. Developing a soil spectral library using a low-cost NIR spectrometer for precision fertilization in Indonesia. Geoderma Reg. 2020, 22, e00319. [Google Scholar] [CrossRef]
- Tziolas, N.; Tsakiridis, N.; Ben-Dor, E.; Theocharis, J.; Zalidis, G. A memory-based learning approach utilizing combined spectral sources and geographical proximity for improved VIS-NIR-SWIR soil properties estimation. Geoderma 2019, 340, 11–24. [Google Scholar] [CrossRef]
- Kennard, R.W.; Stone, L.A. Computer aided design of experiments. Technometrics 1969, 11, 137–148. [Google Scholar] [CrossRef]
- Bouyoucos, G.J. Hydrometer method improved for making particle size analyses of soils 1. Agron. J. 1962, 54, 464–465. [Google Scholar] [CrossRef]
- Allison, L.E.; Black, C. Methods of soil analysis. Part 2. Chemical and microbiological properties. Agron. Monogr. 1965, 9, 1367–1378. [Google Scholar]
- Ben Dor, E.; Ong, C.; Lau, I.C. Reflectance measurements of soils in the laboratory: Standards and protocols. Geoderma 2015, 245–246, 112–124. [Google Scholar] [CrossRef]
- Pimstein, A.; Notesco, G.; Ben-Dor, E. Performance of Three Identical Spectrometers in Retrieving Soil Reflectance under Laboratory Conditions. Soil Sci. Soc. Am. J. 2011, 75, 746–759. [Google Scholar] [CrossRef]
- Roderick, G.L. A History of Particle-Size Limits, 1st ed.; Iowa State University: Ames, Iowa, 1962. [Google Scholar]
- Kruse, F.A.; Lefkoff, A.B.; Boardman, J.W.; Heidebrecht, K.B.; Shapiro, A.T.; Barloon, P.J.; Goetz, A.F.H. The spectral image processing system (SIPS)-interactive visualization and analysis of imaging spectrometer data. Remote Sens. Environ. 1993, 75, 746–759. [Google Scholar] [CrossRef]
- Savitzky, A.; Golay, M.J.E. Smoothing and differentiation of data by simplified least squares procedures. Anal. Chem. 1964, 26, 1627–1639. [Google Scholar] [CrossRef]
- Gholizadeh, A.; Boruvka, L.; Saberioon, M.M.; Kozák, J.; Vašát, R.; Nemecek, K. Comparing different data preprocessing methods for monitoring soil heavy metals based on soil spectral features. Soil Water Res. 2015, 10, 218–227. [Google Scholar] [CrossRef] [Green Version]
- Barnes, R.J.; Dhanoa, M.S.; Lister, S.J. Standard normal variate transformation and de-trending of near-infrared diffuse reflectance spectra. Appl. Spectrosc. 1989, 43, 772–777. [Google Scholar] [CrossRef]
- Silva, E.B.; Giasson, É.; Dotto, A.C.; Caten, A.T.; Demattê, J.A.M.; Bacic, I.L.Z.; da Veiga, M. A regional legacy soil dataset for prediction of sand and clay content with VIS-NIR-SWIR, in southern Brazil. Rev. Bras. Cienc. Do Solo 2019, 43. [Google Scholar] [CrossRef] [Green Version]
- Lamichhane, S.; Kumar, L.; Wilson, B. Digital soil mapping algorithms and covariates for soil organic carbon mapping and their implications: A review. Geoderma 2019, 352, 395–413. [Google Scholar] [CrossRef]
- Breiman, L. Random forests. Mach. Learn. 2001, 45, 5–32. [Google Scholar] [CrossRef] [Green Version]
- de Santana, F.B.; de Souza, A.M.; Poppi, R.J. Visible and near infrared spectroscopy coupled to random forest to quantify some soil quality parameters. Spectrochim. Acta Part A Mol. Biomol. Spectrosc. 2018, 191, 454–462. [Google Scholar] [CrossRef]
- Svetnik, V.; Liaw, A.; Tong, C.; Christopher Culberson, J.; Sheridan, R.P.; Feuston, B.P. Random Forest: A Classification and Regression Tool for Compound Classification and QSAR Modeling. J. Chem. Inf. Comput. Sci. 2003, 43, 1947–1958. [Google Scholar] [CrossRef]
- Wold, S.; Sjöström, M.; Eriksson, L. PLS-regression: A basic tool of chemometrics. Chemom. Intell. Lab. Syst. 2001, 58, 109–130. [Google Scholar] [CrossRef]
- Kuhn, M. Building predictive models in R using the caret package. J. Stat. Softw. 2008, 28, 1–26. [Google Scholar] [CrossRef] [Green Version]
- Vohland, M.; Besold, J.; Hill, J.; Fründ, H.-C. Comparing different multivariate calibration methods for the determination of soil organic carbon pools with visible to near infrared spectroscopy. Geoderma 2011, 166, 198–205. [Google Scholar] [CrossRef]
- Terra, F.S.; Demattê, J.A.M.; Viscarra Rossel, R.A. Spectral libraries for quantitative analyses of tropical Brazilian soils: Comparing vis-NIR and mid-IR reflectance data. Geoderma 2015, 255–256, 81–93. [Google Scholar] [CrossRef]
- Knadel, M.; Stenberg, B.; Deng, F.; Thomsen, A.; Greve, M.H. Comparing predictive abilities of three visible-near infrared spectrophotometers for soil organic carbon and clay determination. J. Near Infrared Spectrosc. 2013, 21, 67–80. [Google Scholar] [CrossRef]
- Viscarra Rossel, R.A.; Chappell, A.; De Caritat, P.; Mckenzie, N.J. On the soil information content of visible-near infrared reflectance spectra. Eur. J. Soil Sci. 2011, 62, 442–453. [Google Scholar] [CrossRef]
- Krishnan, P.; Alexander, J.D.; Butler, B.J.; Hummel, J.W. Reflectance Technique for Predicting Soil Organic Matter1. Soil Sci. Soc. Am. J. 1980, 44, 1282. [Google Scholar] [CrossRef]
- Dalal, R.C.; Henry, R.J. Simultaneous Determination of Moisture, Organic Carbon, and Total Nitrogen by Near Infrared Reflectance Spectrophotometry1. Soil Sci. Soc. Am. J. 1986, 50, 120. [Google Scholar] [CrossRef]
- Rodionov, A.; Pätzold, S.; Welp, G.; Pude, R.; Amelung, W. Proximal field Vis-NIR spectroscopy of soil organic carbon: A solution to clear obstacles related to vegetation and straw cover. Soil Tillage Res. 2016, 163, 89–98. [Google Scholar] [CrossRef]
- Irons, J.R.; Weismiller, R.A.; Peterson, G.W. Soil Reflectance. Remote Sens. Earth Sci. 1989, 3, 66–106. [Google Scholar]
- Shi, T.; Chen, Y.; Liu, H.; Wang, J.; Wu, G. Soil organic carbon content estimation with laboratory-based visible-near-infrared reflectance spectroscopy: Feature selection. Appl. Spectrosc. 2014, 698, 831–837. [Google Scholar] [CrossRef]
- Tsakiridis, N.L.; Keramaris, K.D.; Theocharis, J.B.; Zalidis, G.C. Simultaneous prediction of soil properties from VNIR-SWIR spectra using a localized multi-channel 1-D convolutional neural network. Geoderma 2020, 367, 114208. [Google Scholar] [CrossRef]
- Viscarra Rossel, R.A.; Walvoort, D.J.J.; McBratney, A.B.; Janik, L.J.; Skjemstad, J.O. Visible, near infrared, mid infrared or combined diffuse reflectance spectroscopy for simultaneous assessment of various soil properties. Geoderma 2006, 131, 59–75. [Google Scholar] [CrossRef]


| Clay% | SOC% | ||||||||
|---|---|---|---|---|---|---|---|---|---|
| Region | n | Min | Max | Mean | Std | Min | Max | Mean | Std |
| Zazari | 57 | 5.00 | 57.90 | 27.56 | 16.41 | 0.52 | 5.00 | 1.77 | 1.27 |
| MKD | 45 | 16.80 | 89.70 | 40.53 | 15.27 | 0.37 | 1.85 | 0.96 | 0.30 |
| Total | 102 | 5.00 | 89.70 | 34.81 | 16.99 | 0.37 | 5.00 | 1.33 | 0.96 |
| Scenario | Spectral Angle Mapper (rad) |
|---|---|
| Default set up | 0.052 |
| H: 15 mm, LI: 90% | 0.049 |
| H: 20 mm, LI: 80% | 0.048 |
| H: 35 mm, LI: 80% | 0.047 |
| H: 15 mm, LI: 80% | 0.046 |
| H: 15 mm, LI: 100% | 0.046 |
| H: 20 mm, LI: 90% | 0.045 |
| H: 35 mm, LI: 100% | 0.045 |
| H: 35 mm, LI: 90% | 0.045 |
| H: 20 mm, LI: 100% | 0.040 |
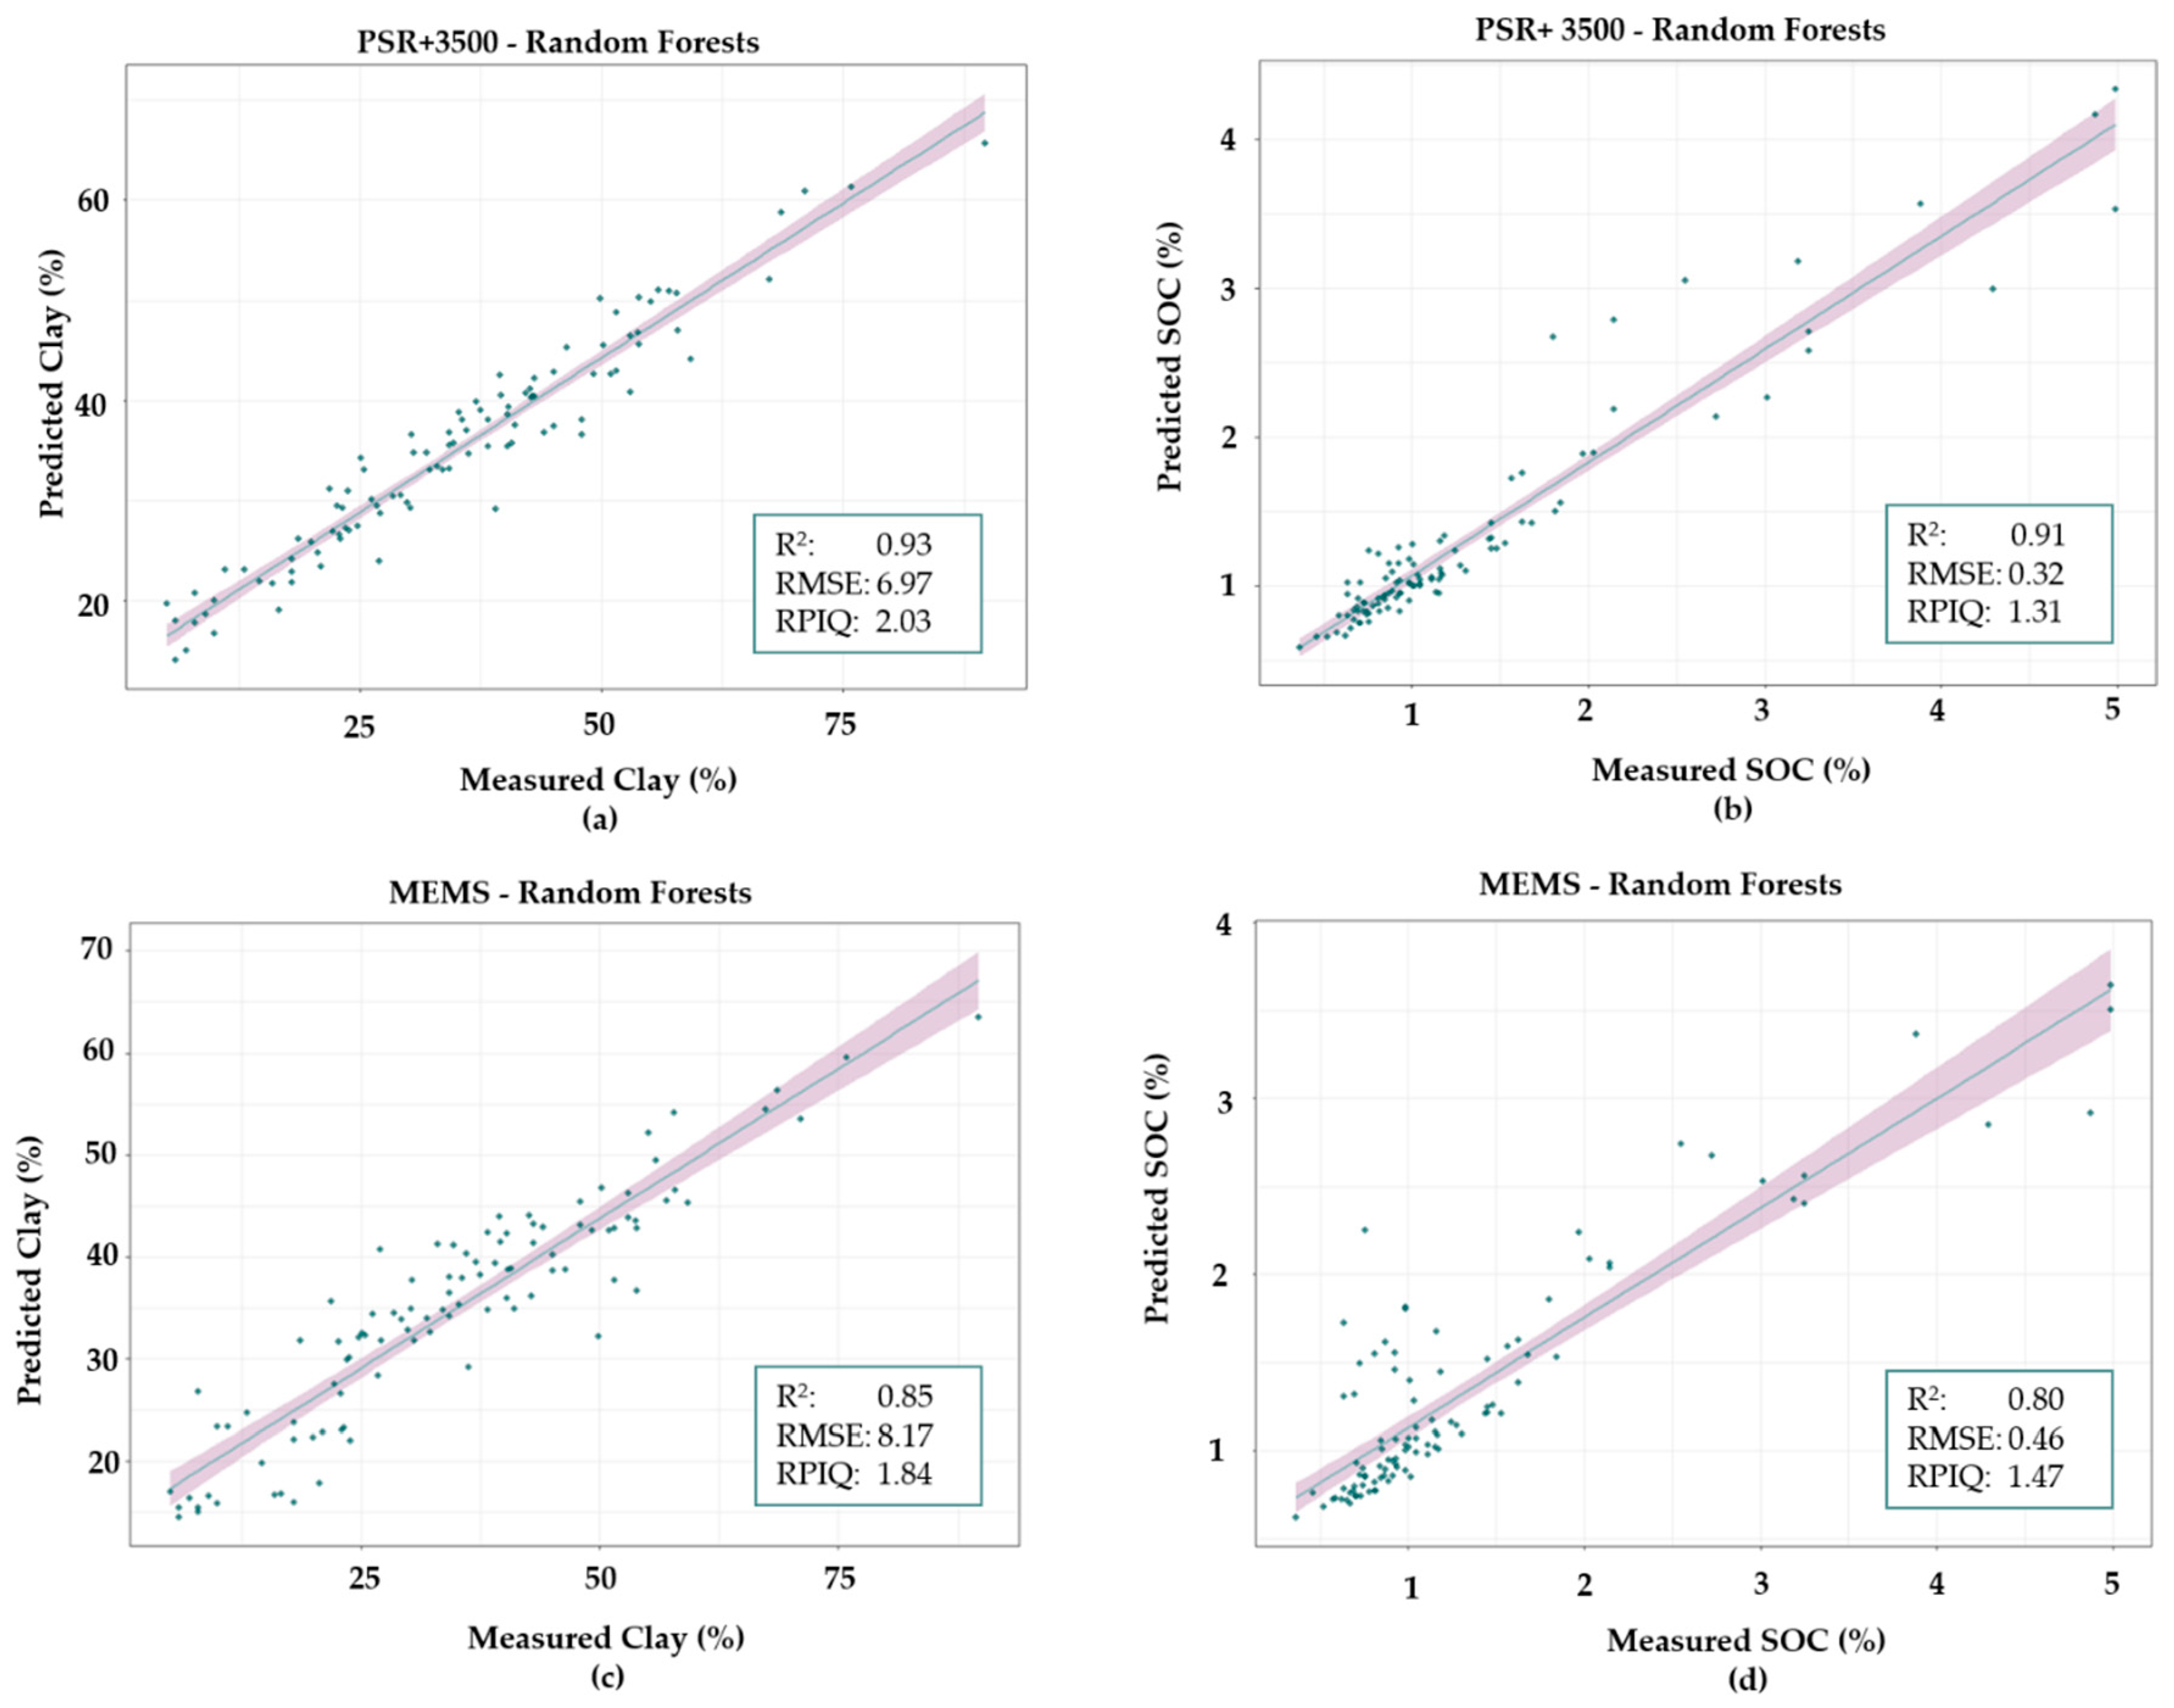
| Sensor | Method | Clay % | SOC % | ||||
|---|---|---|---|---|---|---|---|
| R2 | RMSE | RPIQ | R2 | RMSE | RPIQ | ||
| PSR+ 3500 | RF | 0.93 | 6.97 | 2.03 | 0.91 | 0.32 | 1.31 |
| MEMS | RF | 0.85 | 8.17 | 1.84 | 0.80 | 0.46 | 1.47 |
| PSR+ 3500 | PLSR | 0.70 | 8.17 | 2.11 | 0.88 | 0.29 | 2.65 |
| MEMS | PLSR | 0.31 | 14.12 | 0.95 | 0.38 | 0.94 | 1.06 |
Publisher’s Note: MDPI stays neutral with regard to jurisdictional claims in published maps and institutional affiliations. |
© 2021 by the authors. Licensee MDPI, Basel, Switzerland. This article is an open access article distributed under the terms and conditions of the Creative Commons Attribution (CC BY) license (http://creativecommons.org/licenses/by/4.0/).
Share and Cite
Karyotis, K.; Angelopoulou, T.; Tziolas, N.; Palaiologou, E.; Samarinas, N.; Zalidis, G. Evaluation of a Micro-Electro Mechanical Systems Spectral Sensor for Soil Properties Estimation. Land 2021, 10, 63. https://0-doi-org.brum.beds.ac.uk/10.3390/land10010063
Karyotis K, Angelopoulou T, Tziolas N, Palaiologou E, Samarinas N, Zalidis G. Evaluation of a Micro-Electro Mechanical Systems Spectral Sensor for Soil Properties Estimation. Land. 2021; 10(1):63. https://0-doi-org.brum.beds.ac.uk/10.3390/land10010063
Chicago/Turabian StyleKaryotis, Konstantinos, Theodora Angelopoulou, Nikolaos Tziolas, Evgenia Palaiologou, Nikiforos Samarinas, and George Zalidis. 2021. "Evaluation of a Micro-Electro Mechanical Systems Spectral Sensor for Soil Properties Estimation" Land 10, no. 1: 63. https://0-doi-org.brum.beds.ac.uk/10.3390/land10010063