Bundles and Hotspots of Multiple Ecosystem Services for Optimized Land Management in Kentucky, United States


Department of Forestry and Natural Resources, University of Kentucky, 730 Rose St., Lexington, KY 40546, USA
*
Author to whom correspondence should be addressed.
†
Center for Integrative Conservation, Xishuangbanna Tropical Botanical Garden, Chinese Academy of Sciences, Menglun 666303, China.
Land 2021, 10(1), 69; https://0-doi-org.brum.beds.ac.uk/10.3390/land10010069
Submission received: 30 November 2020
/
Revised: 8 January 2021
/
Accepted: 8 January 2021
/
Published: 14 January 2021
(This article belongs to the Special Issue Exploring the Relationships between Land Use and Ecosystem Services)
Abstract
:Ecosystem services are benefits that the natural environment provides to support human well-being. A thorough understanding and assessment of these services are critical to maintain ecosystem services flow through sustainable land management to optimize bundles of ecosystem services provision. Maximizing one particular ecosystem service may lead to reduction in another. Therefore, identifying ecosystem services tradeoffs and synergies is key in addressing this challenge. However, the identification of multiple ecosystem services tradeoffs and synergies is still limited. A previous study failed to effectively capture the spatial interaction among ecosystem services as it was limited by “space-to-time” substitution method used because of temporal data scarcity. The study was also limited by using land use types in creating ecosystem services, which could lead to some deviations. The broad objective of this study is therefore to examine the bundles and hotspots of multiple ecosystem services and their tradeoffs in Kentucky, U.S. The study combined geographic data and spatially-explicit models to identify multiple ecosystem services bundles and hotspots, and determined the spatial locations of ecosystem services hotspots. Results showed that the spatial interactions among ecosystem services were very high: of the 21 possible pairs of ecosystem services, 17 pairs were significantly correlated. The seven ecosystem services examined can be bundled into three groups, geographically clustered on the landscape. These results support the hypothesis that some groups of ecosystem services provision can present similar spatial patterns at a large mesoscale. Understanding the spatial interactions and bundles of the ecosystem services provides essential information for evidence-based sustainable land management.
1. Introduction
Ecosystem services are broadly defined as the benefits obtained directly or indirectly by humans from ecosystems that improve human well-being and provide fundamental life-support for human civilization [1,2,3]. Assessments of ecosystem services are seen by many as a promising and effective communication tool for bridging the knowledge gap between science and policy-making, and supporting land management decisions, because they seek to highlight the multiple contributions of ecosystems to society and associated tradeoffs between different land use options [4,5,6].
In a context of the increasing demand of human society for ecosystem services, there is often an ambition to maximize ecosystem services supply and to reduce its shortfalls through prudent land management [6]. However, the key challenge of land management is determining how to manage multiple ecosystem services effectively to avoid unwanted tradeoffs [6,7]. According to the results of Millennium Ecosystem Assessment and many others, increasing the supply of some ecosystem services, especially provisioning services such as food and timber, can cause a decline in other ecosystem services such as carbon sequestration, and unsustainable management may undermine the future provision of these services as well [1,3,8,9]. Therefore, identifying ecosystem services tradeoffs and synergies is urgently needed in order to address this challenge [7,10].
Tradeoffs and synergies are typical relationships between multiple ecosystem services [3]. Tradeoffs describe a conflicting situation wherein the supply of one ecosystem service increases while another decreases. Synergies occur when the provision of two or more than two ecosystem services increase simultaneously [7]. These relationships are driven by two non-exclusive mechanisms: (1) through common drivers (e.g., land use, climate change) that affect multiple ecosystem services at the same time, and (2) direct interactions among multiple ecosystem services (e.g., reliance on the same ecosystem processes and functions) [11,12]. The purpose of tradeoffs and synergies analysis is to increase synergies and reduce or avoid unwanted tradeoffs, which is essential for net-gain decision-making [8,13,14]. By confronting the increasing demand of the public and changes in the global environment, identifying the tradeoffs and synergies among ecosystem services is among the most pressing concerns in sustainable land management today [2,15,16]. However, the identification of multiple ecosystem services tradeoffs and synergies is still limited [3,17].
The results of tradeoffs and synergies analyses can be further used to inform ecosystem services bundles. A bundle is formed by a mix of synergistic ecosystem services, which repeatedly appear together across space or time [7,18,19]. The analyses of multiple ecosystem services bundles would deepen the knowledge of ecosystem services tradeoffs and synergies and are useful tools for identifying the hotspots of multiple ecosystem services for optimizing management of multifunctional landscapes [7,20,21].
A study by [22] analyzed spatial interactions of ecosystem services in a global hotspot in the three parallel river regions in southern China. The study reveals complex relationships, spatial patterns, and distribution among ecosystem services in the mountainous areas. However, this study was limited by the “space-to-time” substitution method used due to temporal data scarcity. The study was also limited by the use of land use types to create ecosystem services, which could lead to some deviations. Hence, the authors recommend that a comprehensive database may be needed in future studies to effectively capture the spatial interaction among ecosystem services.
In another study on ecosystem services tradeoff, synergies, and drivers, [23] focused on ecosystem services provided by slash pine (Pinus elliotii) forests. The study examined interaction between carbon sequestration, timber production, and water yield, and how forest management practices affect these ecosystem services in northern Florida, U.S. Results showed tradeoffs between ecosystem services. One limitation of this study is the use of natural break algorithm to classify the dataset, as it does not reveal all the trends in continuous data. The study used 377 plots across the study area, which was relatively small. The authors, therefore, recommend that future studies using identical datasets should use them in their continuous form and a larger sample size will be ideal for such analysis.
Over the last 10 years, the Intergovernmental Science-Policy Platform on Biodiversity and Ecosystem Services (IPBES) has conducted a number of studies and analyses on ecosystem services. These studies covered various topics with some specific ones that are relevant to our study. A study by [24] assessed ecosystem services bundles based on socio-cultural preferences of individuals in Spain. The authors observed substantial differences in the social perception about the relative importance of different ecosystem service categories across three ecosystem service bundles. Broadly, results showed ecosystem service bundles can be identified from people’s systemic representations of interrelationships between ecosystem services, and tradeoffs can be identified from socio-cultural preferences as people’s willingness to tradeoff conservation of one ecosystem service against another.
Assessments of ecosystems and biodiversity have transitioned to include a wider range of values, valuation methods, and worldviews. The Natures Contribution to People (NCP) introduced by the IPBES initiative focuses on accounting for these wider values and valuation methods. Another study [25] reviewed evidence from economic and socio-cultural valuation methods of instrumental and relational values of nature’s contributions to people (NCP) within the IPBES European and Central Asia region. Results showed that regulating NCP was more highly valued than material and non-material NCP. The authors observed substantial evidence of the instrumental values of NCP. The NCP concept was introduced by the IPBES as an improved concept to ecosystem services to shed more light on the contributions, both positive and negative, that people obtain from nature or affects people’s way of life. However, the introduction of NCP has not received total consensus as some researchers and the practice community believes NCP is not different from ecosystem services [26].
In 2018, IPBES produced a regional assessment report on biodiversity and ecosystem services for the Americas [27]. The report represents the state of knowledge on the Americas region and subregions. The report provides a critical assessment of the full range of issues facing decision-makers, including the importance, status, trends and threats to biodiversity, and nature’s contributions to people, as well as policy and management response options.
The assessment concludes that the Americas are endowed with much greater capacity for nature to contribute to people’s quality of life than the global average, and that the economic value of the terrestrial contributions of nature to people is estimated to be at least $24.3 trillion per year, equivalent to the region’s gross domestic product. The assessment also concludes that the majority of the countries in the Americas are using nature at a rate that exceeds nature’s ability to renew the contributions it makes to the quality of life. The assessment also found that biodiversity and ecosystem conditions in the Americas are declining, resulting in a reduction of the contributions of nature to the quality of life of people. The dominant direct drivers of this are habitat conversion, fragmentation, and overexploitation or overharvesting. Climate change is recognized as becoming increasingly important, amplifying the other direct drivers.
The report concludes that there are options and initiatives, some ongoing, that can slow down and reverse ecosystem degradation, and enhance the provision of nature’s contributions to people, including ecological restoration and sustainable land management outside protected areas. These require implementation of effective governance processes and evidence-based policy instruments. Kentucky State has a horizontally-distinct distribution of physiography and land use land cover (LULC), which is typical in many parts of the world, with mountainous landscape in the east, pasture landscape in the central, and cultivated landscape in the west. Such a distinctive heterogeneity of LULC at regional scales makes it an ideal system to examine the bundles and hotspots of multiple ecosystem services. This study combined geographic data and spatially-explicit models to identify multiple ecosystem services bundles and hotspots for state-level optimized conservation policy-making in Kentucky, U.S. The objectives of this study are to: (1) map spatial patterns of multiple ecosystem services at the state scale; (2) identify the interactions between each paired ecosystem services; (3) assess multiple ecosystem services bundles and their main characteristics; and (4) determine the hotspots of multiple ecosystem services.
2. Study Area and Methods
2.1. Study Area
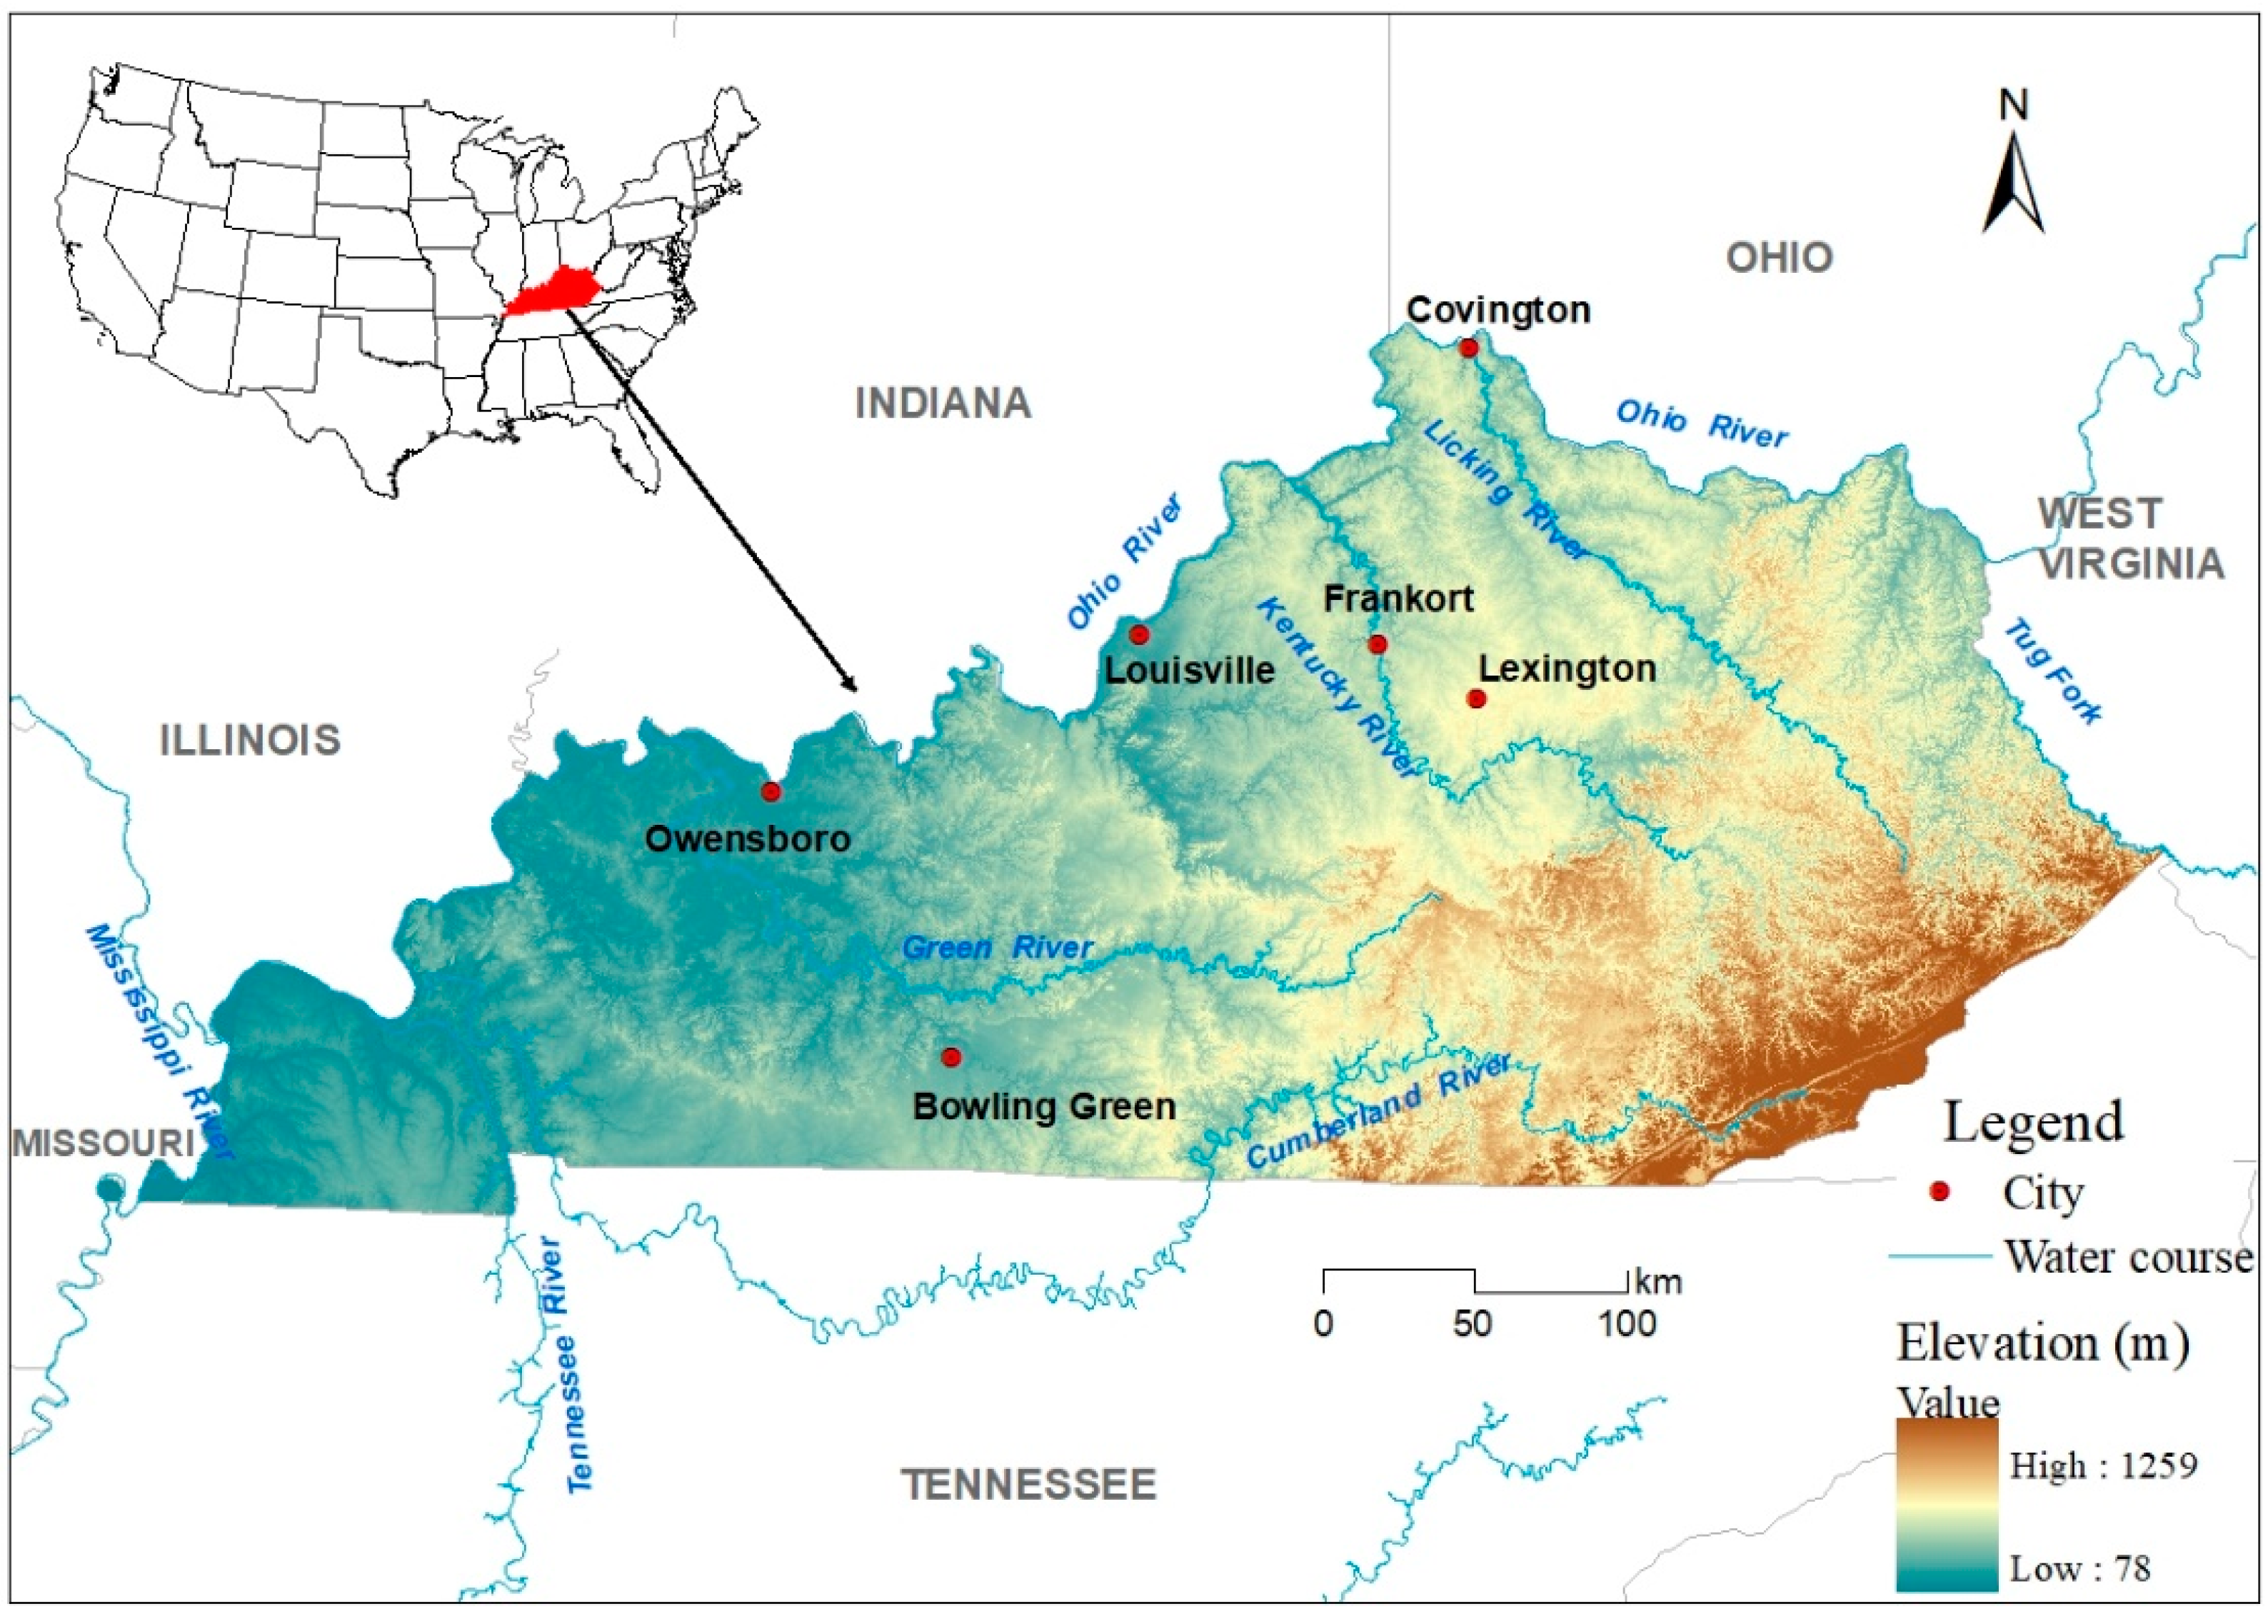
Kentucky (36°30′ N~39°09′ N, 81°58′ W~89°34′ W, Figure 1), covering an area of 104,749 km2, is located in the east south-central region of the United States and is bounded by the Appalachian Mountains to the east and the Ohio and Mississippi Rivers to the north and the west, respectively. The highest point in Kentucky is 1259 m and lowest is 78 m, along the Mississippi River, above sea level. Kentucky has a humid subtropical climate with an average annual precipitation ranging from 1016 to 1397 mm and monthly average temperature ranging from −1 to 27 °C. Kentucky has an estimated population of 4,468,402 with an annual gross domestic product (GDP) of $213 billion, GDP per capita of $47,757, 2.5 million employment, and $105,031 average household income, as of 2018 [28]. More than 45% of Kentucky’s land area is forested, of which 88% (11.0 million acres) is under private family ownership [29], spread across 467,000 owners [30]. Kentucky has some of the most diverse woodlands in the United States with over one hundred tree species naturally occurring in the state [31]. These woodlands support clean water provision, wildlife habitat, recreation, and also provide the foundation for a large forest industry with a significant economic contribution of over $13 billion annually.
2.2. Framework for Quantifying Multiple Ecosystem Services Bundles and Hotspots
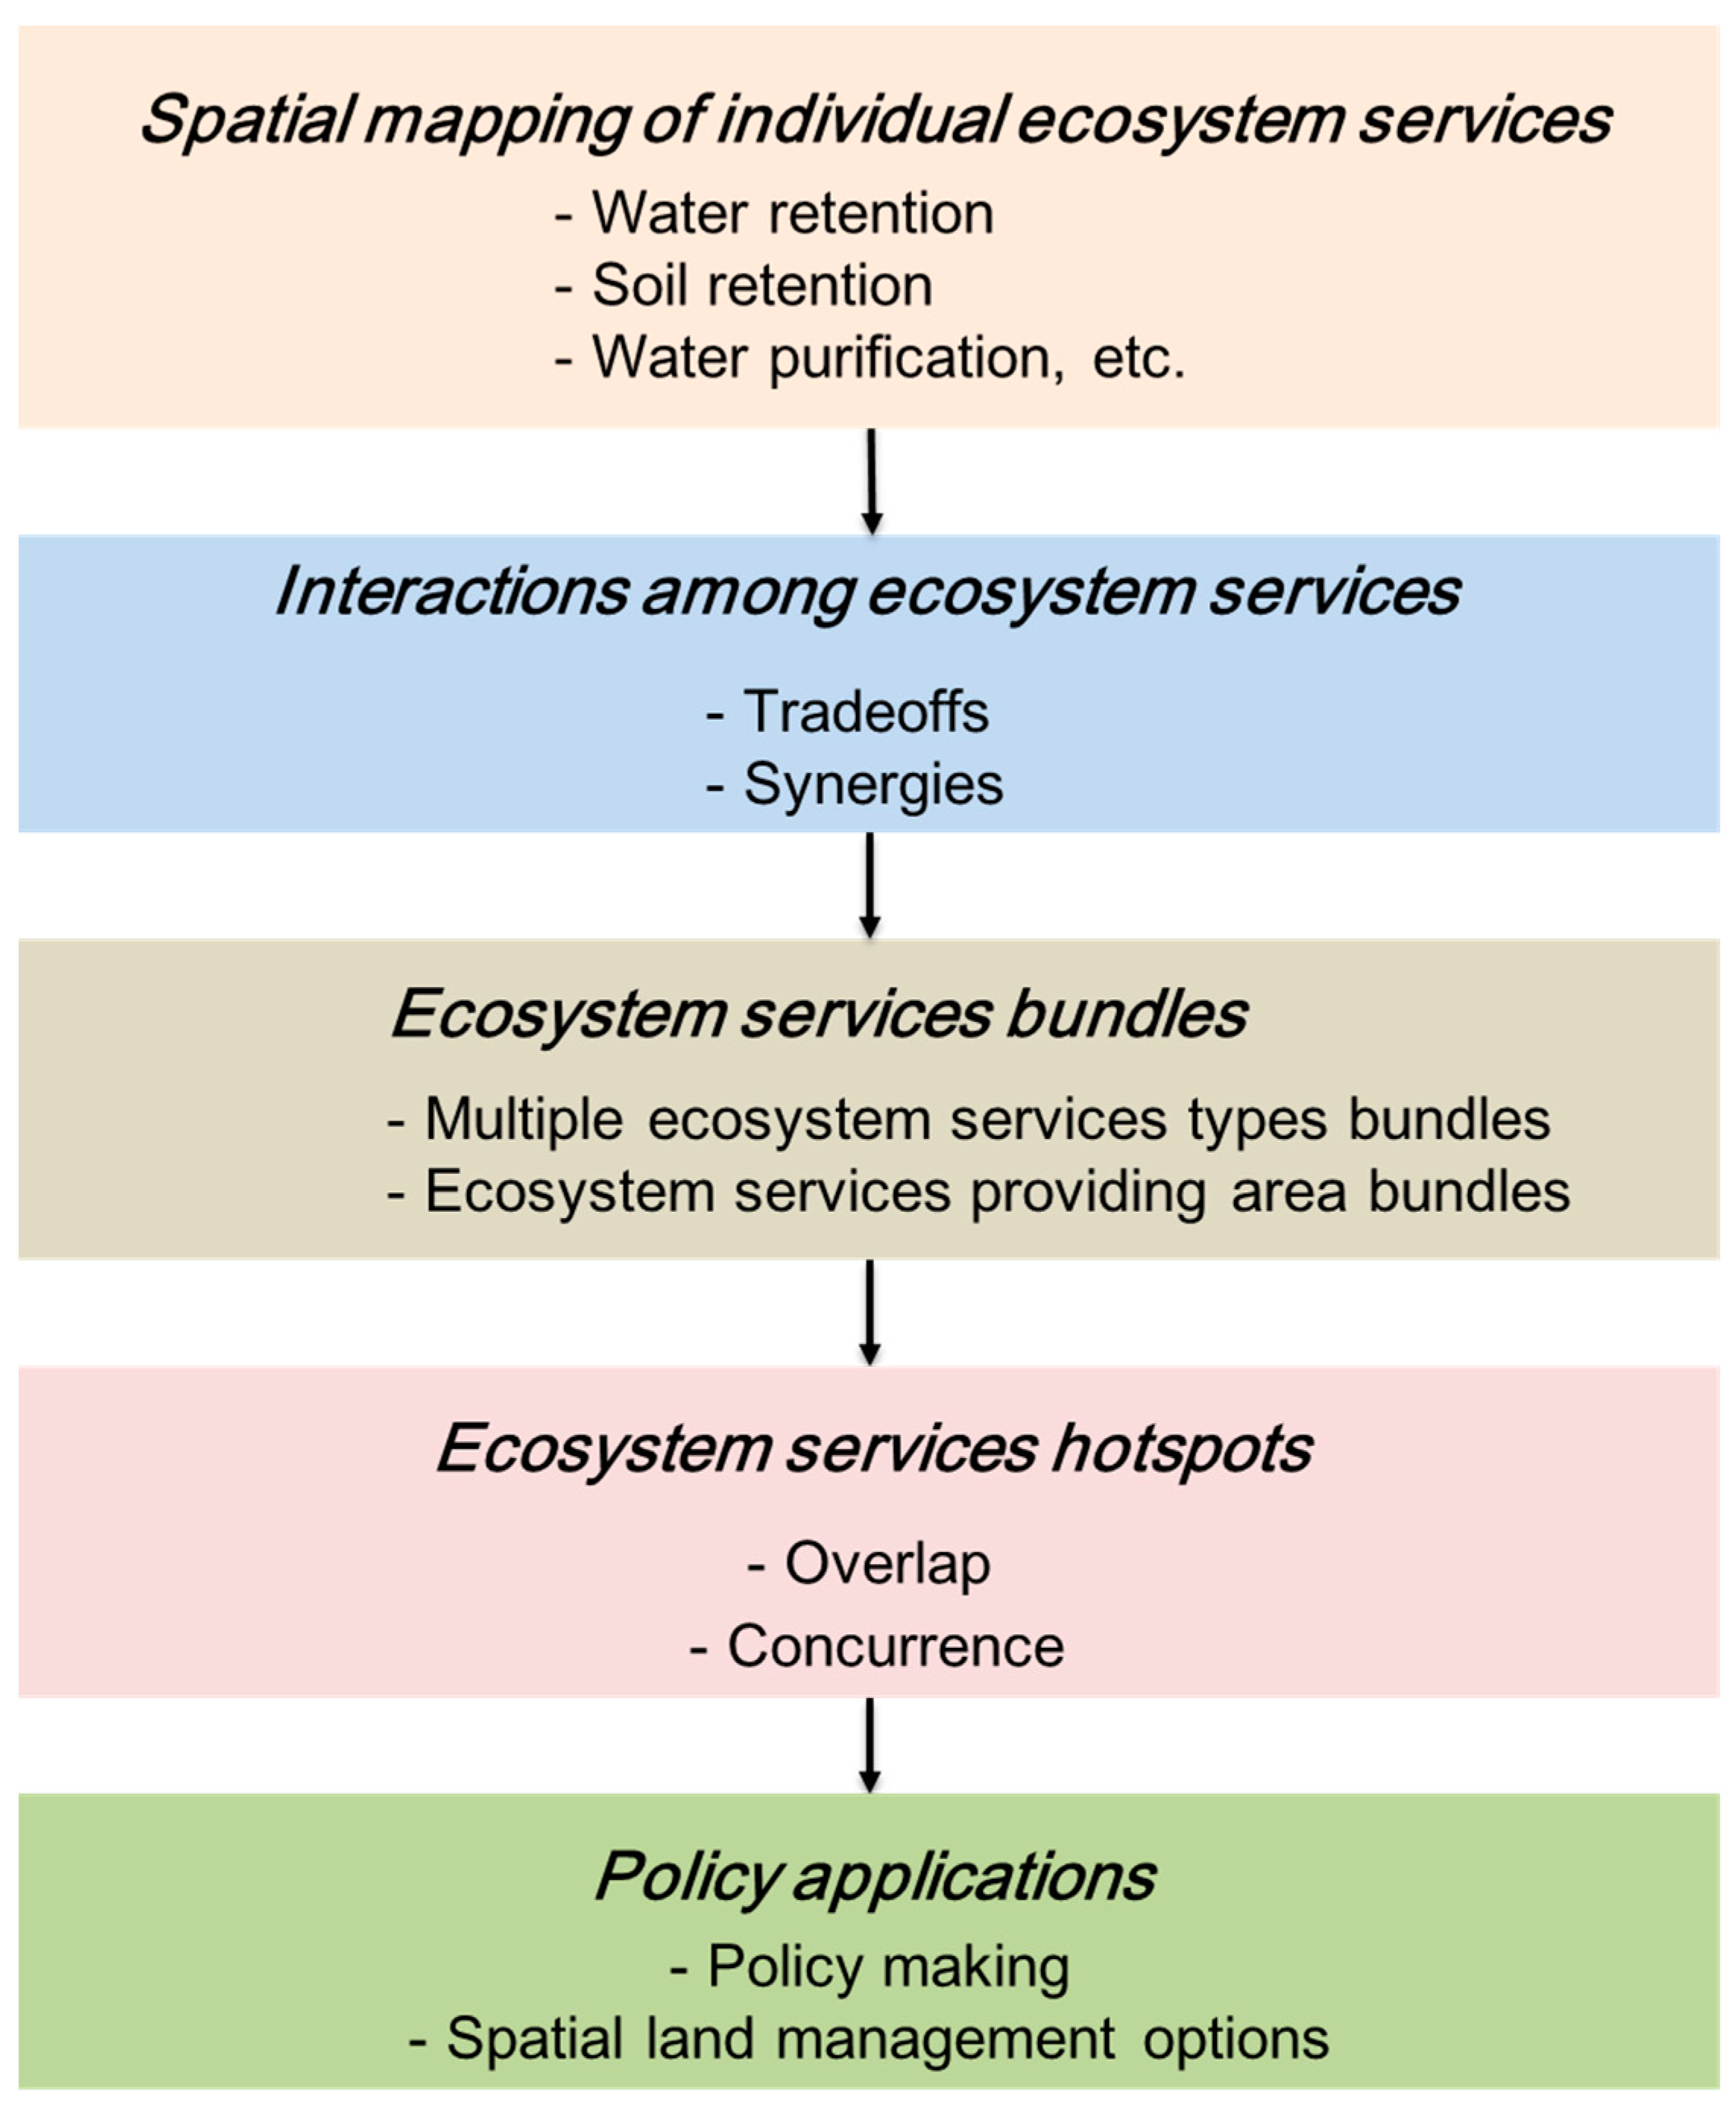
An operational framework, which contains five core steps, was developed to quantify bundles and hotspots of multiple ecosystem services for optimal land management in Kentucky (Figure 2). First, geographic data and spatially-explicit ecosystem services assessment models were used to map the patterns of multiple ecosystem services in Kentucky. Secondly, the tradeoffs and synergistic interactions between each paired ecosystem services were evaluated. Thirdly, multiple ecosystem services bundles and their main characteristics were assessed. Fourthly, the hotspots and spatial locations of multiple ecosystem services were determined. In the last step, the policy applications of the results to inform future policy making and land management options were outlined.
2.2.1. Ecosystem Services Mapping
The Integrated Valuation of Ecosystem Services and Tradeoffs (InVEST) (Version.3.3.3) suite of tools was developed to enable decision makers to assess interactions among ecosystem services and to compare the consequences of different future change scenarios, like land use or climate change [32]. The InVEST has suites of models for assessing various ecosystem services. This study used the Water Yield InVEST model (for water retention and water provision), the Sediment Delivery Ratio model (for soil retention), and the Nutrient Delivery Ratio model (for nitrogen and phosphorus export) to evaluate the corresponding ecosystem services in Kentucky. A detailed version of the ecosystem services modeling process can be found in Supplementary Information 1. InVEST model parameterization and validations are described in Supplementary Information 2. Customized models based on the existing national inventory data and biomass maps were used to evaluate timber production and carbon sequestration, which are described in Supplementary 3. Data availability and sources are summarized in Supplementary Information Table S1. Related input parameters can be found in Supplementary Information Tables S2–S4.
Timber Production
Production of timber is an important ecosystem service provided by forests, with the potential to generate significant revenue for those with legal rights to harvest [33]. Due to lack of accurate harvest intensity and rotation cycle information from natural forests, this study evaluated the natural forest stand volume and considered this as the potential timber production. The forest stand volume was calculated as forest biomass multiplied by biomass-volume conversion coefficient from the Intergovernmental Panel on Climate Change Report ([34]; also see Supplementary 3.1).
Water Retention and Water Provision
The service of water retention is defined as the ability of ecosystems to intercept or store water resources from precipitation and is calculated by subtracting runoff and evapotranspiration from precipitation [35]. Water provision is roughly equal to the runoff from the landscape that contributes annually to humans needs, such as irrigations and hydropower production. First, we estimated precipitation minus evapotranspiration by using the water yield model in InVEST. Then, water retention was calculated by subtracting runoff from water yield. In InVEST, the annual water yield for each pixel is estimated based on average annual precipitation and the Budyko curve [32]. This calculation is then used in conjunction with data of mean annual precipitation, annual reference evapotranspiration, and correction factors for vegetation type, soil depth, and plant-available water content [32] (Supplementary Tables S1–S3; Supplementary 1.1). Then, we used an extended model to evaluate water retention, which was calculated by subtracting runoff from water yield (Supplementary 1.2).
Carbon Sequestration
There are four carbon pools that can store or sequester carbon over time, namely, aboveground biomass, belowground biomass, soil, and dead organic matter, which are vital to influencing carbon dioxide-driven climate change [32]. Net primary productivity for carbon sequestration was used in this research, which was downloaded from Numerical Terradynamic Simulation Group (NTSG, http://files.ntsg.umt.edu) at a 30 m spatial resolution ([36]; see Supplementary 3.2). In [36], net primary production is defined as the carbon allocated to plant tissue after accounting for the costs of autotrophic respiration.
Soil Retention
The InVEST Sediment Delivery Ratio model maps overland sediment generation and delivery to the stream. For each cell, the model first computes the amount of eroded sediment, then the sediment delivery ratio, which is the proportion of soil loss that reaches the catchment outlet to the total amount eroded [32]. The amount of annual soil loss in each pixel is computed using the revised universal soil loss equation (RUSLE). Outputs from the sediment model include the annual sediment load delivered to the stream, as well as the amount of sediment eroded in the catchment and retained by vegetation and topographic features. The input data for the Sediment Delivery Ratio model includes maps of land cover and land use, digital elevation models (DEM), rainfall, and soil erodibility, along with biophysical attributes related to sediment retention based on land cover (Supplementary Tables S1–S3; Supplementary 1.3).
Water Purification
The InVEST Nutrient Delivery Ratio model maps nutrient sources from watersheds and nutrient transported to the stream [32]. The model uses a mass balance approach, describing the movement of nutrient mass through space. Sources of nutrients across the landscape, also called nutrient loads, are determined based on the land use map and associated loading rates. Nutrient export from each pixel is represented by the product of the load and the nutrient delivery ratio. Each pixel’s load is modified to account for the local runoff potential, which can be divided into surface and subsurface runoff [32]. Although there are multiple potentially significant impairments of water quality, in this study we focused on nitrogen and phosphorous. The input data for the water purification model includes maps of land cover and land use, DEMs, and rainfall, along with biophysical attributes related to the nutrient loading and retention efficiency for each land use and land cover class (Supplementary Tables S1–S3; Supplementary 1.4).
2.2.2. Ecosystem Services Interaction
The ecosystem services interaction in this study refers to a tradeoff or synergistic relationships between pairs of ecosystem services. Pearson correlation analysis was used for each pair of services in SPSS software [7,35]. Samples were extracted at the county level. There are 120 counties in Kentucky, making the total number of samples of 120.
2.2.3. Ecosystem Services Bundle
Principal components analysis (PCA) was used to identify the bundles of ecosystem services and the groups of counties with similar sets of ecosystem services [35]. We considered all 120 counties.
2.2.4. Ecosystem Services Hotspots
Ecosystem services hotspots were defined as an area that provides large components of a specific ecosystem service in spatial [35]. In this study, the top 10% of grid cells for each ecosystem service was delineated as a hotspot.
2.2.5. Data Requirement and Preparation
The InVEST model requires multiple gridded data sets combined with specific biophysical data as inputs. Specifically, DEM data with a spatial resolution of 10 m was downloaded from the Kentucky Geoportal (http://kyraster.ky.gov/). Land use layers with a spatial resolution of 30 m were downloaded from the National Land Cover Database (NLCD) (see Supplementary Figure S1 and Supplementary Table S5). Climate data containing the average annual precipitation and temperature from 1981 to 2016 were downloaded from the Parameter-elevation Regression on Independent Slopes Model (PRISM) [37]. Spatial data for the state of Kentucky and other relevant data collected for this study are listed in Supplementary Table S1, which includes summaries of each dataset by source, a short introduction, and the associated models. Also, Supplementary Tables S2 and S3 list key parameters used in the InVEST models. All spatial layers were resampled to a 30 m resolution and projected to the Kentucky State Plane FIPS 1600 reference system.
3. Results
3.1. Spatial Mapping of Individual Ecosystem Services
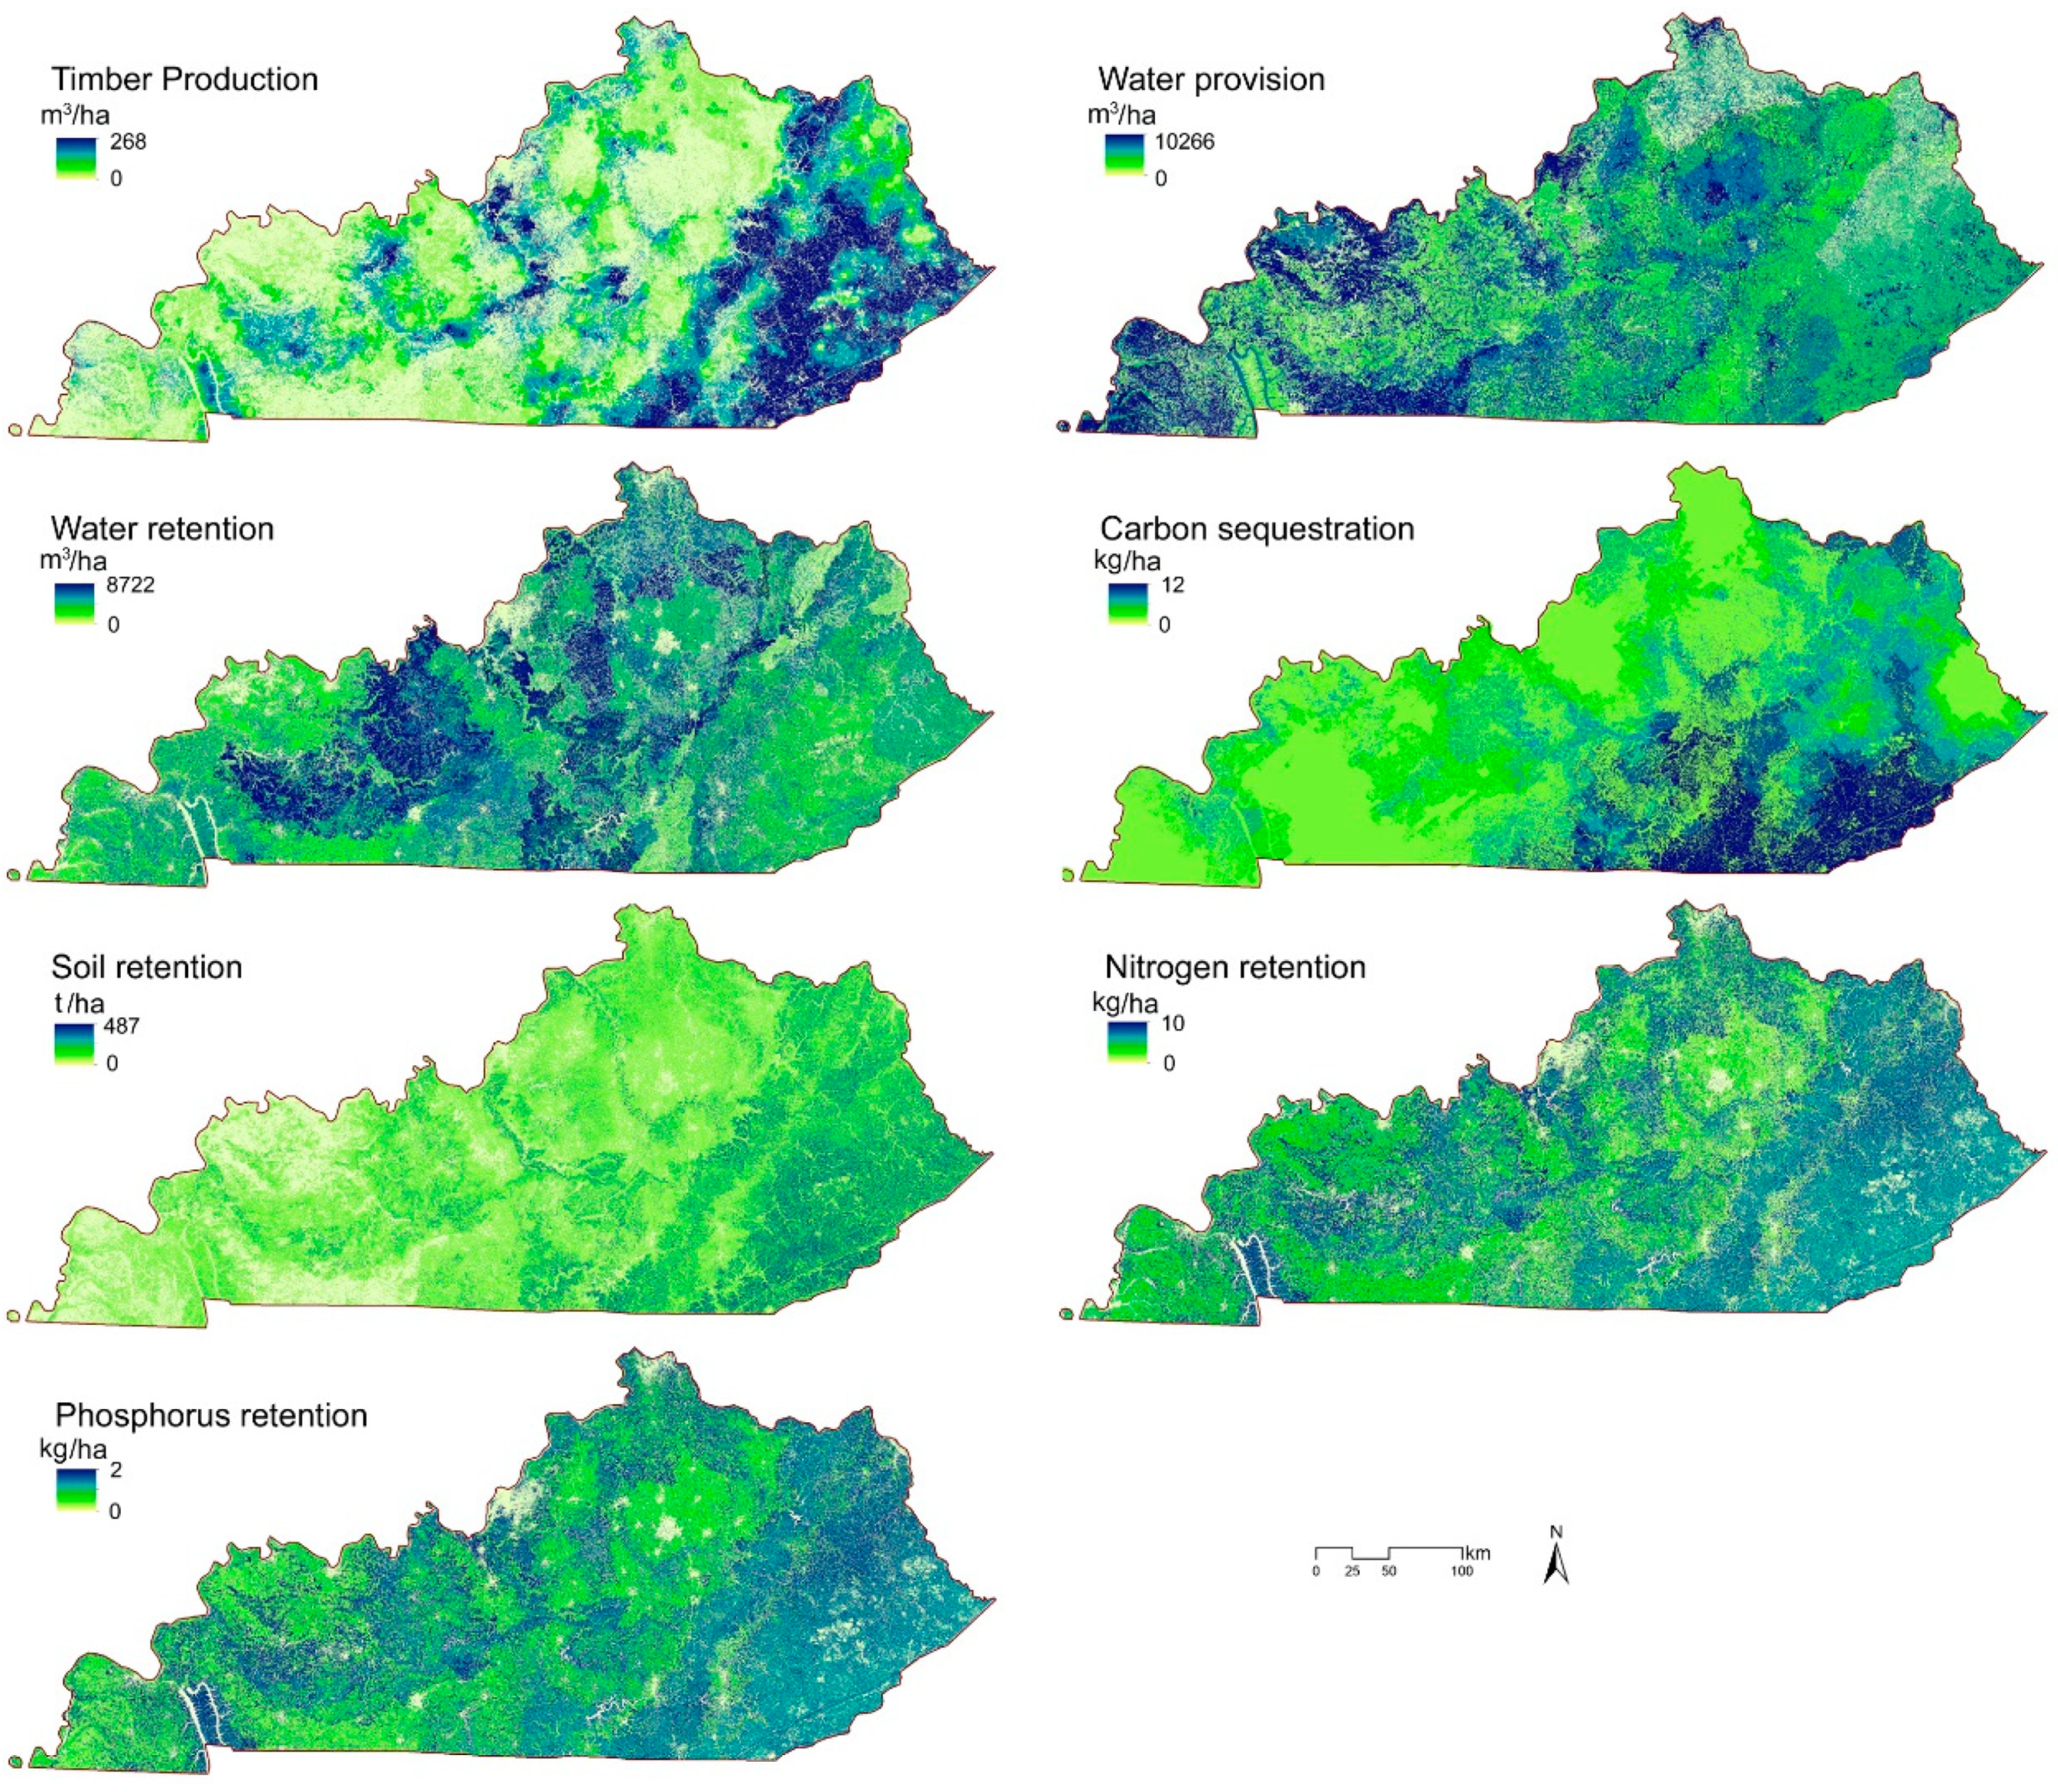
Spatial distributions of seven ecosystem services were distinctly different, but generally spatially clumped (Figure 3), which can be attributed to the social-economic, ecological, and geographic factors. The eastern Kentucky region is dominant in timber production, carbon sequestration, and soil retention, while the central Kentucky region leads in water retention, nitrogen retention, and phosphorus retention. On the other hand, the western Kentucky region is important for water provision. At the whole state scale, the biophysical outcomes of these ecosystem services are 0.78 billion m3 for timber production, 0.04 million tons for carbon sequestration, 55.71 billion m3 for water provision, 14.66 billion m3 for water retention, 26.46 million tons for soil retention, 46.85 million kg for nitrogen retention, and 9.9 million kg for phosphorus retention, respectively (Supplementary Table S6).
3.2. Interactions Among Ecosystem Services
Spatial interactions among ecosystem services were very high (Table 1): Pearson’s correlation results indicated very significant correlations. Of the 21 possible pairs of ecosystem services, 17 pairs were significantly correlated (Pearson coefficient; p < 0.05) at the county level, and 15 of which were extremely significantly correlated (Pearson coefficient; p < 0.01). Specifically, the positive correlation between timber production and carbon sequestration was as high as 0.944. Certain pairs of ecosystem services were not significantly or weakly correlated. For instance, the correlation between water provision and soil retention was only −0.226 at the county level.
At the state level, water provision exhibited a tradeoff pattern with the other six ecosystem services. Water provision was extremely significantly negatively correlated with timber production, carbon sequestration, water retention, and nutrients retention, which was also significantly negatively correlated with soil retention. Meanwhile, water retention presented tradeoff patterns with both timber production and soil retention. On the other hand, all other paired ecosystem services presented synergistic patterns. Both timber production and carbon sequestration showed extremely significant positive correlations with soil retention, nitrogen retention, and phosphorus retention, respectively. Generally, the highest synergy was between nitrogen retention and phosphorus retention, while the highest tradeoff was between water provision and nitrogen retention.
3.3. Ecosystem Services Bundles
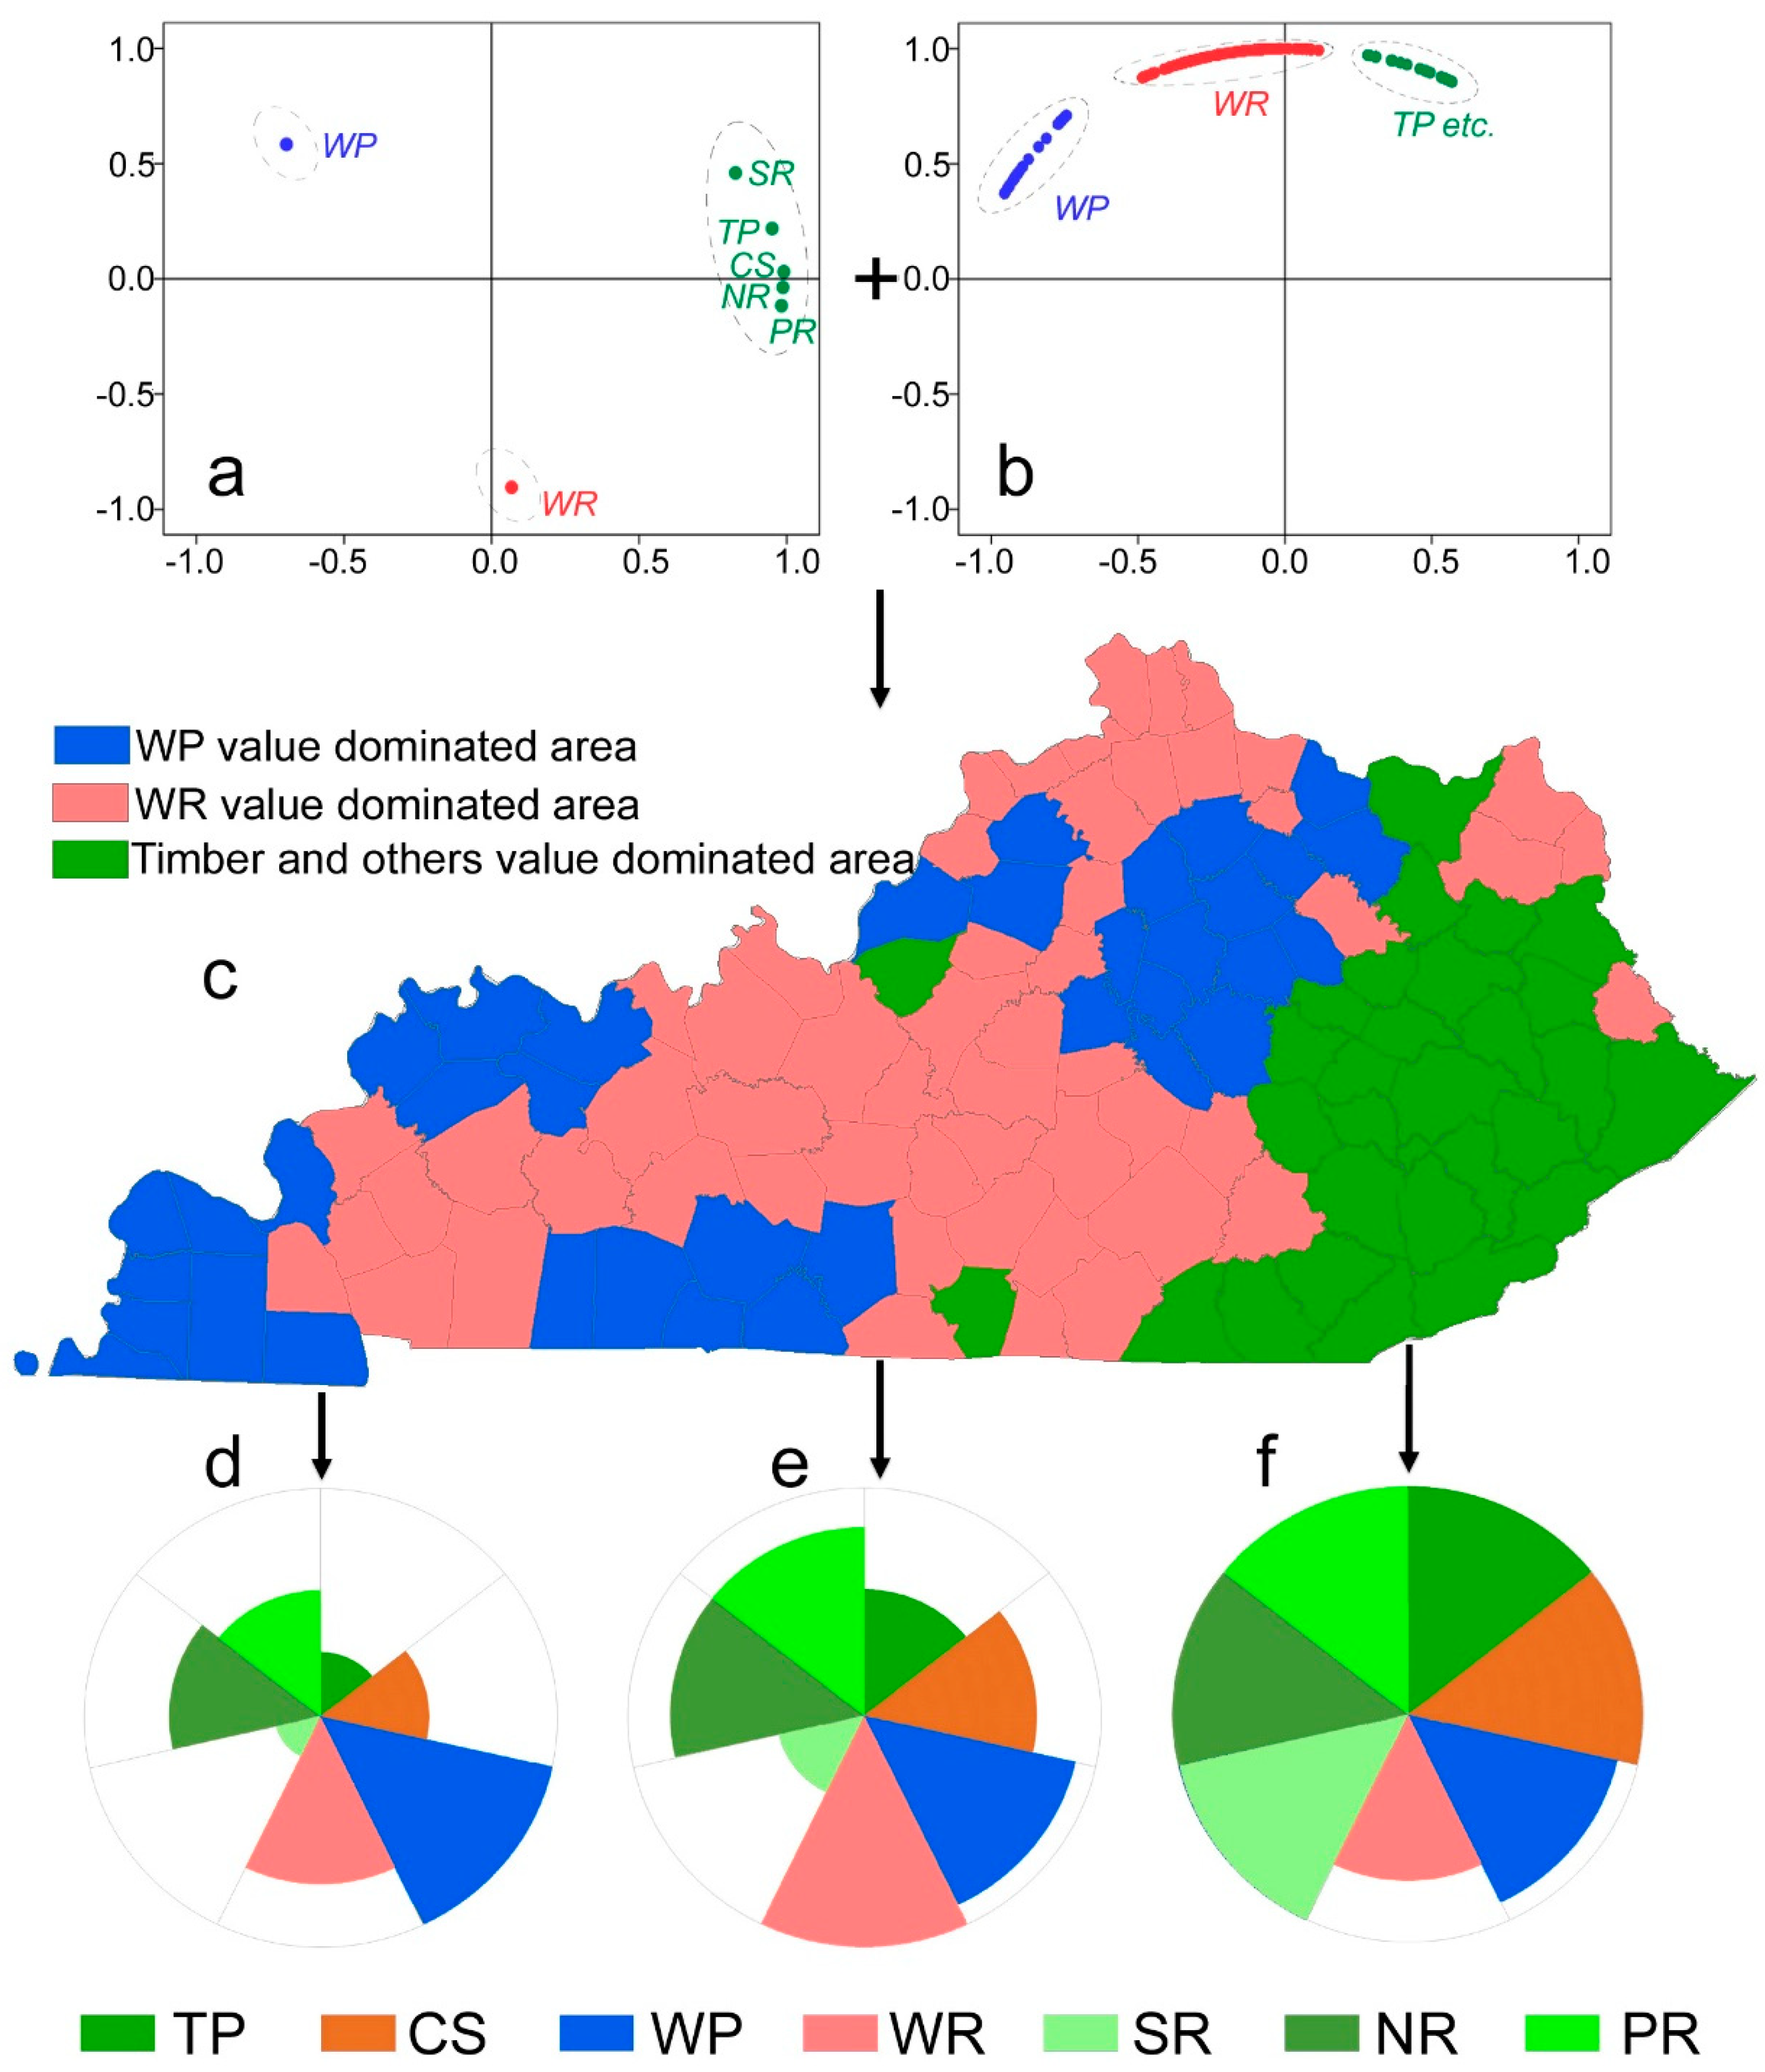
The principal component analysis (PCA) of the seven ecosystem services in the 120 counties indicated that these services can be bundled into three groups (Figure 4a,b). The three ecosystem services bundles were geographically clustered on the landscape. Group 1 was water provision, comprising counties that have extensive agriculture LULC, which are mainly distributed in the western and northern regions of Kentucky State (Figure 4c,d; Supplementary Figure S2). Group 2 was water retention, comprising counties that have extensive pasture and grassland LULC, which are mainly distributed in the central region of Kentucky State (Figure 4c,e). Group 3 was timber production and the other four ecosystem services, comprising counties that have extensive forest landscape, which are mainly distributed in the eastern region of Kentucky State (Figure 4c,f).
3.4. Ecosystem Services Hotspots
Except for water provision, the hotspots of the other six ecosystem services were all distributed at the forest landscape level, especially for timber production, nitrogen retention, and phosphorus retention (Supplementary Table S7). For water provision, 45.04% of the hotspots were located in cultivated landscape and 43.03% were located in developed areas.
The pair-wise overlaps between the seven hotspots indicated that the highest overlap was between nitrogen retention and phosphorus retention (98.26%), then between timber production and soil retention (43.01%). Timber production exhibited a relatively high overlap with soil retention and carbon sequestration (40.96%), but presented relatively low overlaps with nitrogen retention (12.65%), phosphorus retention (12.23%), and water retention (7.09%). The hotspots of water provision exhibited very few overlaps with timber production (1.50%), soil retention (0.50%), and water retention (0.01%), while it did not present any overlaps with carbon sequestration, nitrogen retention, and phosphorus retention (Table 2).
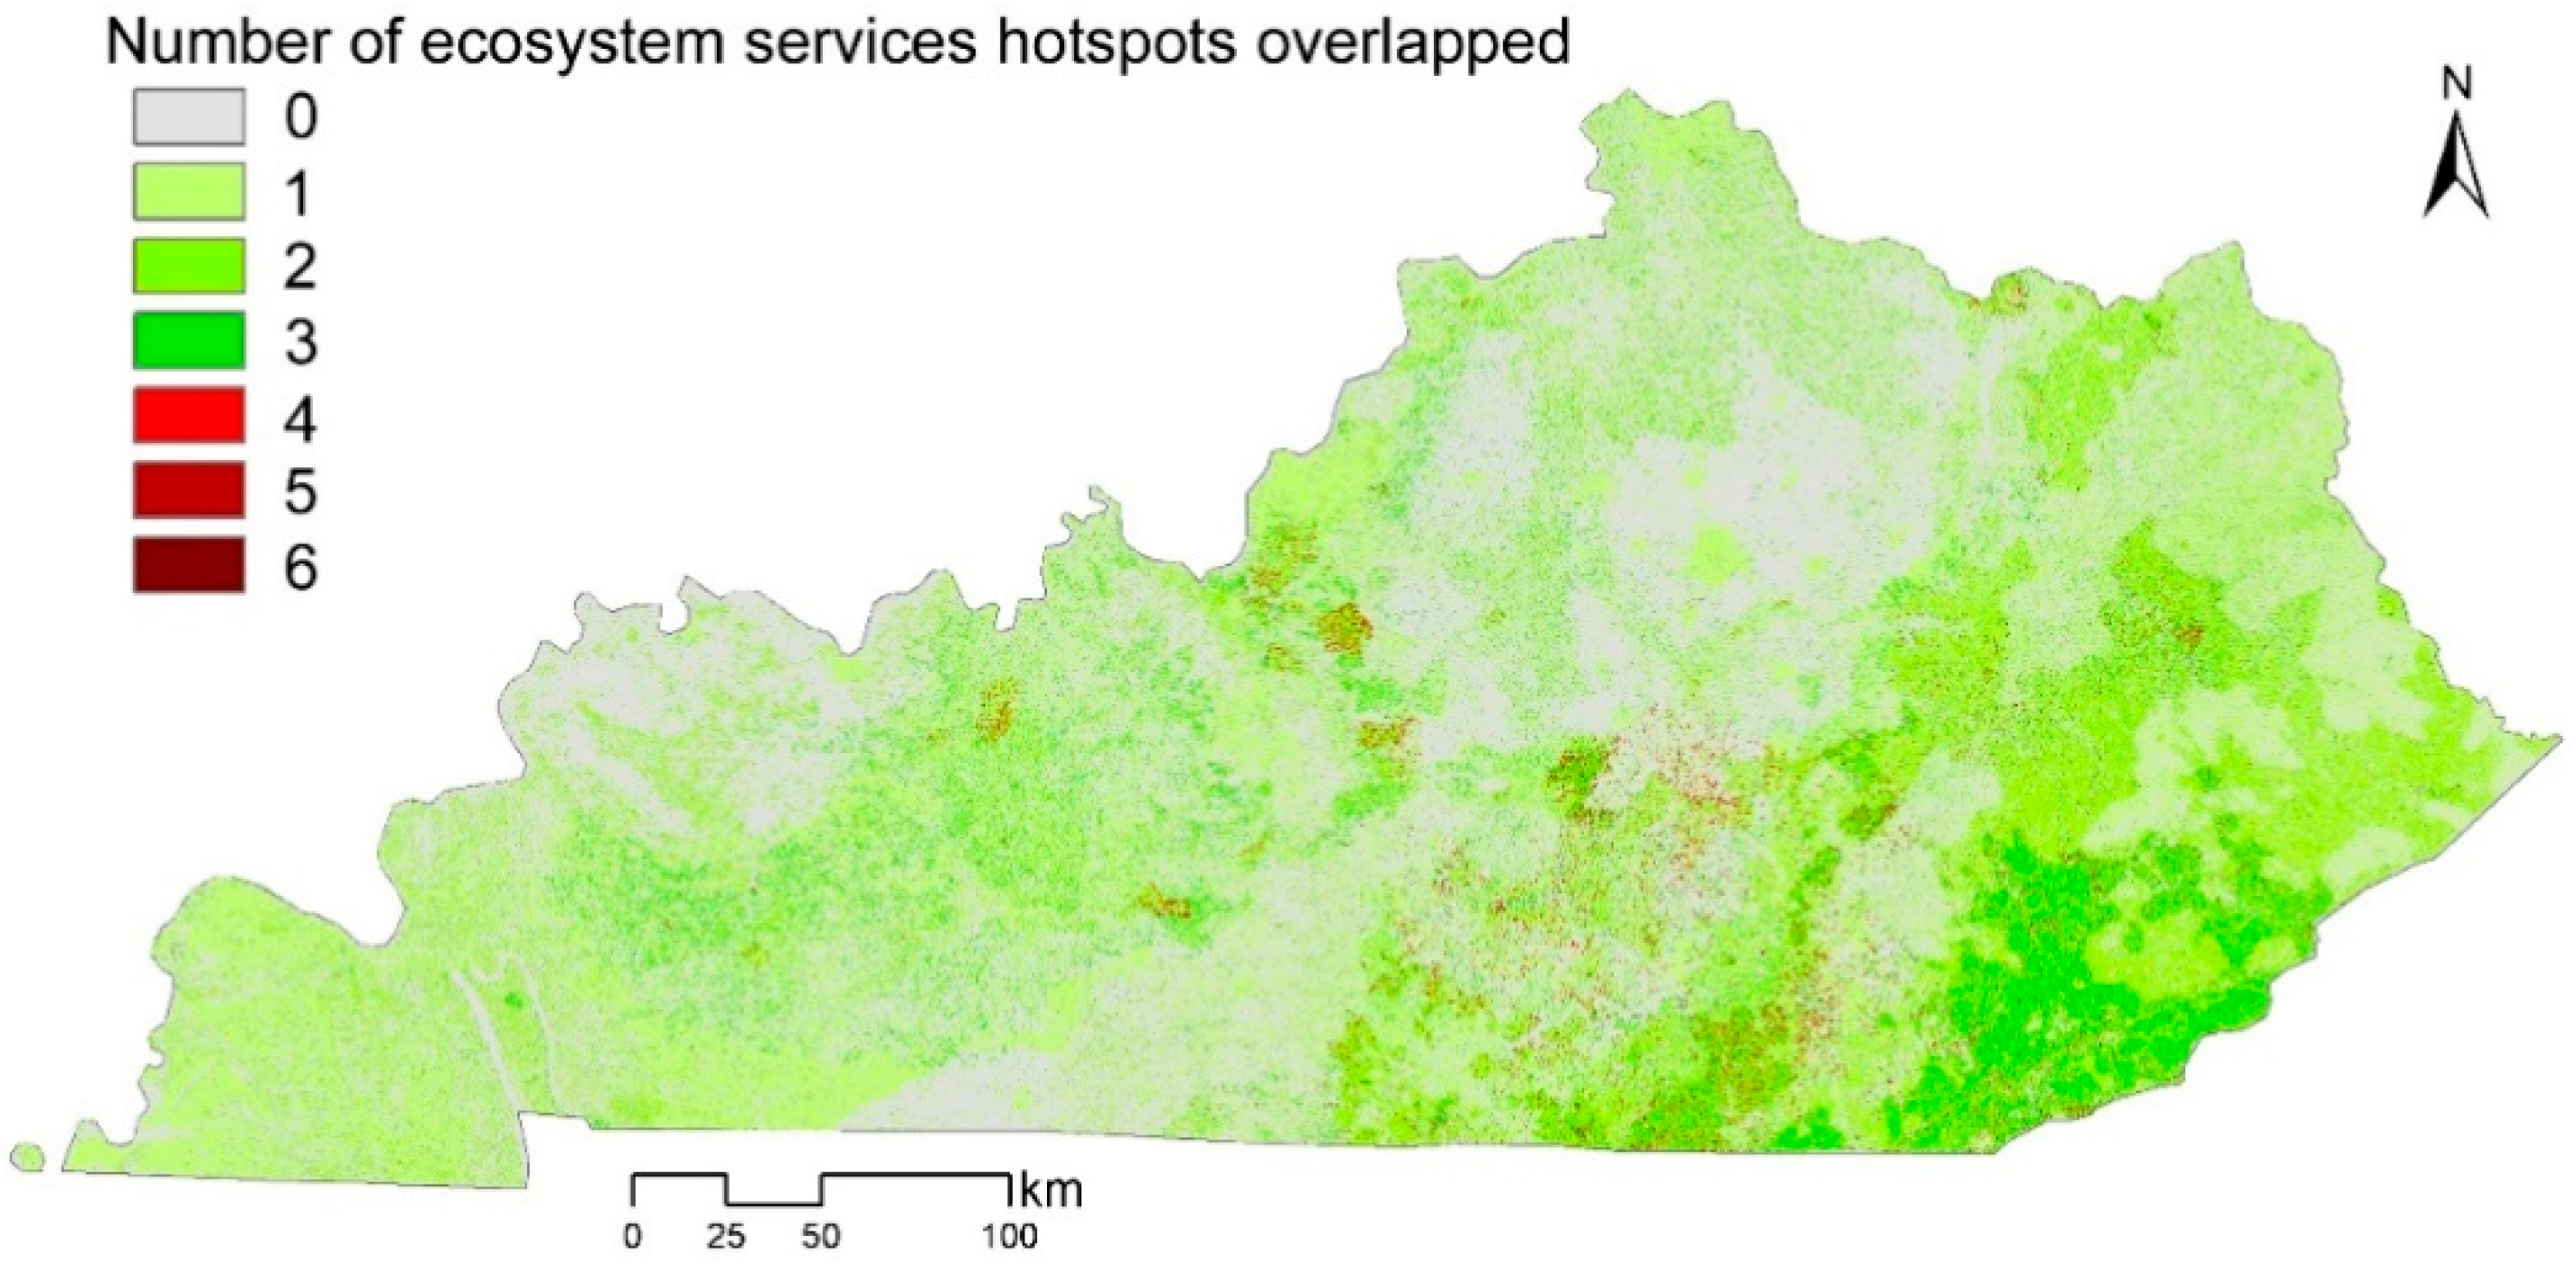
The number of concurrences of the seven ecosystem services hotspots varied from 0 to 6 in space (Figure 5). The area of concurrence decreased along with the increasing number of hotspots, which decreased from 31,447.34 km2 (only 1 hotspot) to 0.11 km2 (6 hotspots concurrences) (Supplementary Table S8). On the other hand, there were 42.50% of the Kentucky area that did not have any ecosystem services hotspots. The high concurrence areas were mainly distributed at the southeastern part of the state, which were most important for providing multiple ecosystem services.
4. Discussions
Mapping ecosystem services biophysical values and analyzing their interactions are considered as important and cost-effective measures for ecosystem management and decision making [4,20,38]. The interactions in ecosystem services in this study were consistent with many other studies in that tradeoffs often occur between provisioning and regulating services, while synergies are more likely to happen within/between regulating and cultural services [2,3]. In this study, the tradeoffs’ interactions existed between one provisioning service (i.e., water provision) and a regulating service (i.e., soil retention and carbon sequestration). The tradeoffs between water provision and nitrogen retention were much higher, followed by the interactions between water provision and phosphorus retention. However, another provision service (i.e., timber production) presented tradeoff interactions with water provision and water retention, and synergy interactions with soil retention and carbon sequestration. However, most of the paired regulating services presented synergistic interactions with each other [2,7], except water retention and soil retention, which showed a tradeoff interaction. These results showed that provisioning services are not always in tradeoff relationships with regulating services, which is also evidenced in another case study in which there were synergies between timber production and regulating services [20]. In most cases, increasing some of the regulating services would be at the expense of losing some provisioning services. In other cases, some provisioning and regulating services could be enhanced simultaneously, like timber production and carbon sequestration.
Beyond tradeoffs and synergies, the analysis of ecosystem services bundles can also be used to manifest the relationships between ecosystem services [20,39]. The ecosystem services bundles can help policy makers decide on better management strategies by taking ecosystem services tradeoffs and synergies into consideration towards sustainable land management [40]. From the ecosystem services bundles revealed in this study, land managers can enhance their understanding of the characteristics of each ecosystem service and their interactions. Such evidence-based information would be vital in making targeted policy decisions for a more sustainable social and economic development, as well as maintaining the effective functioning of natural and anthropogenic land systems [2,41]. Forest is the dominant land system in Kentucky, occupying approximately 50% of the state’s total area. However, forest area decreased more than 5000 sq. km2 from 1992 to 2011, resulting in a significant degradation of water-related ecosystem services at the state level [42]. Much of the forest loss was attributed to coal mining and the subsequent reclamation to the grassland in eastern Kentucky [43]. Restoration of abandoned coal mines to forest in the Appalachian region has been advocated by a coalition of citizens, government officials, and coal industry representatives for quite some time [44], yet its adoption is very limited, partly due to the lack of appreciation of ecosystem services provided by forest by the local residents and stakeholders. Our tradeoff and synergy study shows that timber production has a strong synergy with carbon sequestration, soil retention, and nutrients retention, which may help reverse the public opinion and increase the use of forestry-based restoration on the previously mined lands in Kentucky.
In this study, we found three bundles, which represented the interactions among ecosystem services in Kentucky. Each bundle clustered the spatial areas with similar major ecosystem services together, which dominated in one or several ecosystem services. Consistent with other studies [7,45], we found mountainous area bundle had high regulating ecosystem services, such as soil retention and nitrogen retention, as well as a provisioning service (i.e., timber production). The agricultural area bundle had high water provision services. The pasture area bundle had high water retention services. According to the characteristic of those three bundles, Kentucky can be divided into provisioning areas and regulating areas. The provisioning areas were mainly composed of cultivated land, while the regulating areas were mainly composed of forest, pasture and grassland. A similar composite pattern of ecosystems and services in a bundle, which share common environmental conditions and challenges, would be suitable for similar management strategies [20]. Additionally, the overlap characteristics of ecosystem services hotspots can provide identification of prioritization sites for comprehensive, compact, and cost-effective management [46].
On a final note, there are a few challenges that we encountered in this research that we leave for further research. One important challenge for ecosystem services interactions and bundles research is the choice of indicators. Capacity indicators or flow indicators, middle service indicators or final service indicators, question the results and interpretations of the ecosystem services interactions and bundles [19]. Another important challenge is the choice of scale. The scale effect on ecosystem services is worth further exploring. The interactions and bundles of ecosystem services may vary at different scales. Finally, understanding the drivers of ecosystem services interactions and bundles is useful and important to inform decision making and for policy implementation. The drivers, such as the biophysical variables and human activities factors [2], can result in the complexity and integrity of spatial patterns of ecosystems.
5. Conclusions
Multiple ecosystem services that are driven by a common factor or directly interact with each other often exhibit a spatial clustering pattern at a large spatial scale. Understanding the spatial interactions and bundles of multiple ecosystem services under biophysical variables and human influences can provide crucial information for prudent and targeted landscape management by knowing where to protect and invest in the future. Our study presents a comprehensive application of how to identify potential synergies and tradeoffs between timber production, carbon sequestration, and several water-related ecosystem services through the mapping and spatial analyses of those ecosystem services in Kentucky. The results showed that the spatial interactions among ecosystem services were very high: of the 21 possible pairs of ecosystem services, 17 pairs were significantly correlated. The seven ecosystem services in the 120 counties of Kentucky considered in this study can be bundled into three groups. The three ecosystem services bundles were geographically clustered on the landscape. Except for water provision, the hotspots of the other six ecosystem services were all distributed at the forest landscape, especially for timber production, nitrogen retention, and phosphorus retention. Our results support the hypothesis that some groups of ecosystem services provision can present similar or contrasting spatial patterns at a mesoscale that are likely driven by the underlying environmental conditions and land use history. Contrary to the widely accepted belief that the increase of provisioning services (e.g., food, fiber) often comes at the expense of the regulating services (e.g., soil retention), our study shows that certain provisioning services (timber production) and regulating services (carbon sequestration and nutrients retention) can exhibit a synergy. Such findings highlight the need of the bundle and hotspot analyses of multiple ecosystem services to improve the targeted land use and management planning at the regional level.
Supplementary Materials
The following are available online at https://0-www-mdpi-com.brum.beds.ac.uk/2073-445X/10/1/69/s1, Table S1: Data requirement for the InVEST model; Table S2: Key parameters used in the current study; Table S3: Critical parameter settings in the biophysical table; Supplementary 1: InVEST models; Table S4: Runoff Coefficients; Supplementary 2: InVEST parameterization and validation; Supplementary 3: Customized models; Table S5: LULC class definitions from NLCD 2001 and 2011, used in the maps for Kentucky; Table S6: The biophysical term of each ecosystem service; Table S7: Land use and land cover composition in each ecosystem service hotspots; Table S8: The number of overlap of ecosystem services hotspots; Figure S1: The observed data versus modeled data (kg ha-1 yr-1); Figure S2: Land use and land cover in 2011.
Author Contributions
Conceptualization, T.O.O. and J.Y.; methodology, T.O.O., J.Y. and Y.B.; software, J.Y. and Y.B.; validation, J.Y. and Y.B.; formal analysis, Y.B.; investigation, J.Y. and Y.B.; resources, T.O.O. and J.Y.; data curation, J.Y. and Y.B.; writing—original draft preparation, Y.B. and J.Y.; writing—review and editing, T.O.O., D.A.A. and J.Y.; visualization, Y.B.; supervision, T.O.O. and J.Y.; project administration, T.O.O.; funding acquisition, T.O.O. All authors have read and agreed to the published version of the manuscript.
Funding
This work is supported by the National Institute of Food and Agriculture, U.S. Department of Agriculture, McIntire-Stennis Program under 1018771.
Data Availability Statement
The data presented in this study are available on request from the corresponding author. The data are not publicly available due to ongoing research.
Conflicts of Interest
The authors declare no conflict of interest.
References
- MEA. Millennium Ecosystem Assessment Synthesis Report; Island Press: Washington, DC, USA, 2005. [Google Scholar]
- Zhao, M.; Peng, J.; Liu, Y.; Li, T.; Wang, Y. Mapping watershed-level ecosystem service bundles in the Pearl River Delta, China. Ecol. Econ. 2018, 152, 106–117. [Google Scholar] [CrossRef]
- Yang, S.; Zhao, W.; Liu, Y.; Wang, S.; Wang, J.; Zhai, R. Influence of land use change on the ecosystem service trade-offs in the ecological restoration area: Dynamics and scenarios in the Yanhe watershed, China. Sci. Total Environ. 2018, 644, 556–566. [Google Scholar] [CrossRef] [PubMed]
- Goldstein, J.H.; Caldarone, G.; Duarte, T.K.; Ennaanay, D.; Hannahs, N.; Mendoza, G.; Polasky, S.; Wolny, S.; Daily, G.C. Integrating ecosystem-service tradeoffs into land-use decisions. Ecosyst. Serv. 2012, 109, 7565–7570. [Google Scholar] [CrossRef] [PubMed] [Green Version]
- Honey-Rosés, J.; Pendleton, L.H. A demand driven research agenda for ecosystem services. Ecosyst. Serv. 2013, 1, 160–162. [Google Scholar] [CrossRef]
- Chen, J.; Jiang, B.; Bai, Y.; Xu, X.; Alatalo, J.M. Quantifying ecosystem services supply and demand shortfalls and mismatches for management optimisation. Sci. Total Environ. 2019, 650, 1426–1439. [Google Scholar] [CrossRef]
- Raudsepp-Hearne, C.; Peterson, G.D.; Bennett, E.M. Ecosystem service bundles for analyzing tradeoffs in diverse landscapes. PNAS 2010, 107, 5242–5247. [Google Scholar] [CrossRef] [Green Version]
- Nelson, E.; Mendoza, G.; Regetz, J.; Polasky, S.; Tallis, H.; Cameron, D.; Chan, K.M.; Daily, G.C.; Goldstein, J.; Kareiva, P.M. Modeling multiple ecosystem services, biodiversity conservation, commodity production, and tradeoffs at landscape scales. Front. Ecol. Environ. 2009, 7, 4–11. [Google Scholar] [CrossRef]
- Sherrouse, B.C.; Semmens, D.J.; Ancona, Z.H.; Brunner, N.M. Analyzing land-use change scenarios for trade-offs among cultural ecosystem services in the Southern Rocky Mountains. Ecosyst. Serv. 2017, 26, 431–444. [Google Scholar] [CrossRef]
- Wang, L.; Zheng, H.; Wen, Z.; Liu, L.; Robinson, B.E.; Li, R.; Li, C.; Kong, L. Ecosystem service synergies/trade-offs informing the supply-demand match of ecosystem services: Framework and application. Ecosyst. Serv. 2019, 37, 100939. [Google Scholar] [CrossRef]
- Carpenter, S.R.; Caraco, N.F.; Corell, D.L.; Howarth, R.W.; Sharpley, A.N.; Smith, V.H. Nonpoint pollution of surface waters with phosphorus and nitrogen. Ecol. Appl. 1998, 8, 559–568. [Google Scholar] [CrossRef]
- Cord, A.F.; Bartkowski, B.; Beckmann, M.; Dittrich, A.; Hermans-Neumann, K.; Kaim, A.; Lienhoop, N.; Locher-Krause, K.; Priess, J.; Schröter-Schlaack, C. Towards systematic analyses of ecosystem service trade-offs and synergies: Main concepts, methods and the road ahead. Ecosyst. Serv. 2017, 28, 264–272. [Google Scholar] [CrossRef]
- Tallis, H.; Kareiva, P.; Marvier, M.; Chang, A. An ecosystem services framework to support both practical conservation and economic development. PNAS 2008, 105, 9457–9464. [Google Scholar] [CrossRef] [PubMed] [Green Version]
- King, E.; Cavender-Bares, J.; Balvanera, P.; Mwampamba, T.H.; Polasky, S. Trade-offs in ecosystem services and varying stakeholder preferences: Evaluating conflicts, obstacles, and opportunities. Ecol. Soc. 2015, 20, 25. [Google Scholar] [CrossRef] [Green Version]
- Bennett, E.M.; Peterson, G.D.; Gordon, L. Understanding relationships among multiple ecosystem services. Ecol. Lett. 2009, 12, 1394–1404. [Google Scholar] [CrossRef] [PubMed]
- Carpenter, S.R.; Mooney, H.A.; Agard, J.; Capistrano, D.; DeFries, R.S.; Díaz, S.; Dietz, T.; Duraiappah, A.K.; Oteng-Yeboah, A.; Pereira, H.M. Science for managing ecosystem services: Beyond the Millennium Ecosystem Assessment. PNAS 2009, 106, 1305–1312. [Google Scholar] [CrossRef] [PubMed] [Green Version]
- Turkelboom, F.; Leone, M.; Jacobs, S.; Kelemen, E.; García-Llorente, M.; Baró, F.; Termansen, M.; Barton, D.N.; Berry, P.; Stange, E. When we cannot have it all: Ecosystem services trade-offs in the context of spatial planning. Ecosyst. Serv. 2018, 29, 566–578. [Google Scholar] [CrossRef]
- Baró, F.; Gómez-Baggethun, E.; Haase, D. Ecosystem service bundles along the urban-rural gradient: Insights for landscape planning and management. Ecosyst. Serv. 2017, 24, 147–159. [Google Scholar] [CrossRef] [Green Version]
- Saidi, N.; Spray, C. Ecosystem services bundles: Challenges and opportunities for implementation and further research. Environ. Res. Lett. 2018, 13, 113001. [Google Scholar] [CrossRef]
- Yang, G.; Ge, Y.; Xue, H.; Yang, W.; Shi, Y.; Peng, C.; Du, Y.; Fan, X.; Ren, Y.; Chang, J. Using ecosystem service bundles to detect trade-offs and synergies across urban–rural complexes. Landsc. Urban Plan. 2015, 136, 110–121. [Google Scholar] [CrossRef]
- Fernandez-Campo, M.; Rodriguez-Morales, B.; Dramstad, W.E.; Fjellstad, W.; Diaz-Varela, E.R. Ecosystem services mapping for detection of bundles, synergies and trade-offs: Examples from two Norwegian municipalities. Ecosyst. Serv. 2017, 28, 283–297. [Google Scholar] [CrossRef]
- Lin, S.; Wu, R.; Yang, F.; Wang, J.; Wu, W. Spatial trade-offs and synergies among ecosystem services within a global biodiversity hotspot. Ecol. Indic. 2018, 84, 371–381. [Google Scholar] [CrossRef]
- Cademus, R.; Escobedo, F.J.; McLaughlin, D.; Abd-Elrahman, A. Analyzing trade-offs, synergies, and drivers among timber production, carbon sequestration, and water yield in Pinus elliotii forests in southeastern USA. Forests 2014, 5, 1409–1431. [Google Scholar] [CrossRef] [Green Version]
- Martín-López, B.; Iniesta-Arandia, I.; García-Llorente, M.; Palomo, I.; Casado-Arzuaga, I.; Del Amo, D.G.; Gómez-Baggethun, E.; Oteros-Rozas, E.; Palacios-Agundez, I.; Willaarts, B.; et al. Uncovering ecosystem service bundles through social preferences. PLoS ONE 2012, 7, e38970. [Google Scholar]
- Christie, M.; Martín-López, B.; Church, A.; Siwicka, E.; Szymonczyk, P.; Sauterel, J.M. Understanding the diversity of values of “Nature’s contributions to people”: Insights from the IPBES Assessment of Europe and Central Asia. Sustain. Sci. 2019, 14, 1267–1282. [Google Scholar] [CrossRef] [Green Version]
- Kadykalo, A.N.; López-Rodriguez, M.D.; Ainscough, J.; Droste, N.; Ryu, H.; Ávila-Flores, G.; Le Clec’h, S.; Muñoz, M.C.; Nilsson, L.; Rana, S.J.E.; et al. Disentangling ‘ecosystem services’ and ‘nature’s contributions to people’. Ecosyst. People 2019, 15, 269–287. [Google Scholar] [CrossRef] [Green Version]
- Rice, J.; Seixas, C.S.; Zaccagnini, M.E.; Bedoya-Gaitán, M.; Valderrama, N.; Anderson, C.B.; Arroyo, M.T.K.; Bustamante, M.; Cavender-Bares, J.; Diaz-de-Leon, A.; et al. The IPBES Regional Assessment Report On Biodiversity and Ecosystem Services for the Americas; IPBES: Bonn, Germany, 2018. [Google Scholar]
- BEA. Department of Commerce. 2017. Available online: https://www.bea.gov (accessed on 12 August 2019).
- Oswalt, C.M. Forests of Kentucky, 2013, in Resource Update FS-109; US Department of Agriculture Forest Service, Southern Research Station: Asheville, NC, USA, 2017. [Google Scholar]
- KWOA. Available online: https://wwwkwoanet/ (accessed on 15 July 2020).
- Thomas, B. Kentucky Woodland Owners: Who They Are and the Challenges They Face, in Kentucky Woodlands; Kentucky Energy and Environment Cabinet: Frankfort, KY, USA, 2017; pp. 3–7. [Google Scholar]
- Sharp, R.; Tallis, H.; Ricketts, T.; Guerry, A.; Wood, S.; Chaplin-Kramer, R.; Nelson, E.; Ennaanay, D.; Wolny, S.; Olwero, N. InVEST+ VERSION+ User’s Guide; The Natural Capital Project; Stanford University: Stanford, CA, USA; University of Minnesota: Minneapolis, MN, USA; The Nature Conservancy: Arlington County, VA, USA; World Wildlife Fund: Gland, Switzerland, 2016. [Google Scholar]
- Tallis, H.; Ricketts, T.; Nelson, E.; Ennaanay, D.; Wolny, S.; Olwero, N.; Vigerstol, K.; Pennington, D.; Mendoza, G.; Aukema, J. InVEST 1.004 Beta User’s Guide; The Natural Capital Project; Stanford University: Stanford, CA, USA, 2010. [Google Scholar]
- De Klein, C.; Novoa, R.; Ogle, S.; Smith, K.; Rochette, P.; Wirth, C.; McConkey, B.; Mosier, A.; Rypdal, K.; Williams, S. Agriculture, Forestry and Other Land Use. Chapter 11: N2O Emissions from Managed Soils, and CO2 Emissions from Lime and Urea Application. In IPCC Guidelines for National Greenhouse Gas Inventories; Intergovernmental Panel on Climate Change (IPCC): Geneva, Switzerland, 2006; Volume 4. [Google Scholar]
- Bai, Y.; Zhuang, C.; Ouyang, Z.; Zheng, H.; Jiang, B. Spatial characteristics between biodiversity and ecosystem services in a human-dominated watershed. Ecol Complex 2011, 8, 177–183. [Google Scholar] [CrossRef]
- Robinson, N.P.; Allred, B.W.; Smith, W.K.; Jones, M.O.; Moreno, A.; Erickson, T.A.; Naugle, D.E.; Running, S.W. Terrestrial primary production for the conterminous United States derived from Landsat 30 m and MODIS 250 m. Remote. Sens. Ecol. Conserv. 2018, 4, 264–280. [Google Scholar] [CrossRef]
- PRISM Climate Group, O.S.U. Available online: http://prism.oregonstate.edu/ (accessed on 12 August 2018).
- Bateman, I.J.; Harwood, A.R.; Mace, G.M.; Watson, R.T.; Abson, D.J.; Andrews, B.; Binner, A.; Crowe, A.; Day, B.H.; Dugdale, S. Bringing ecosystem services into economic decision-making: Land use in the United Kingdom. Science 2013, 341, 45–50. [Google Scholar] [CrossRef]
- Kareiva, P.; Watts, S.; McDonald, R.; Boucher, T. Domesticated nature: Shaping landscapes and ecosystems for human welfare. Science 2007, 316, 1866–1869. [Google Scholar] [CrossRef] [Green Version]
- Kong, L.; Zheng, H.; Xiao, Y.; Ouyang, Z.; Li, C.; Zhang, J.; Huang, B.J.S. Mapping ecosystem service bundles to detect distinct types of multifunctionality within the diverse landscape of the yangtze river basin, China. Sustainability 2018, 10, 857. [Google Scholar] [CrossRef] [Green Version]
- Shoyama, K.; Yamagata, Y. Local perception of ecosystem service bundles in the Kushiro watershed, Northern Japan–Application of a public participation GIS tool. Ecosyst. Serv. 2016, 22, 139–149. [Google Scholar] [CrossRef]
- Bai, Y.; Ochuodho, T.O.; Yang, J. Impact of land use and climate change on water-related ecosystem services in Kentucky, USA. Ecol. Indic. 2019, 102, 51–64. [Google Scholar] [CrossRef]
- Gurung, K.; Yang, J.; Fang, L. Assessing Ecosystem Services from the Forestry-Based Reclamation of Surface Mined Areas in the North Fork of the Kentucky River Watershed. Forests 2018, 9, 652. [Google Scholar] [CrossRef] [Green Version]
- Zipper, C.E.; Burger, J.A.; Skousen, J.G.; Angel, P.N.; Barton, C.D.; Davis, V.; Franklin, J.A. Restoring forests and associated ecosystem services on Appalachian coal surface mines. Environ. Manag. 2011, 47, 751–765. [Google Scholar] [CrossRef] [PubMed]
- Turner, K.G.; Odgaard, M.V.; Bøcher, P.K.; Dalgaard, T.; Svenning, J.-C. Bundling ecosystem services in Denmark: Trade-offs and synergies in a cultural landscape. Landsc. Urban Plan. 2014, 125, 89–104. [Google Scholar] [CrossRef]
- Schröter, M.; Remme, R.P. Spatial prioritisation for conserving ecosystem services: Comparing hotspots with heuristic optimisation. Landsc. Ecol. 2016, 31, 431–450. [Google Scholar] [CrossRef] [Green Version]
Figure 1.
Spatial location of Kentucky and its topographic features.

Figure 2.
Methodology framework of the research.

Figure 3.
Spatial distributions of seven ecosystem services shown in quintiles.

Figure 4.
Ecosystem services bundles and spatial cluster. TP is an abbreviation for timber production; CS is for carbon sequestration; WP is for water production; WR is for water retention; SR is for soil retention; NR is for nitrogen retention and PR is for phosphorus retention. (a) The bundle of each ecosystem service based on PCA analysis; (b) the bundle of counties based on PCA analysis; (c) the spatial distribution of dominated ecosystem services area; (d)–(f) the dominated ecosystem service types.

Figure 5.
Concurrence of the seven ecosystem services hotspots.


Table 1.
Pair-wise spatial interactions among ecosystem services.
| Types | Timber Production | Carbon Sequestration | Water Provision | Water Retention | Soil Retention | Nitrogen Retention |
|---|---|---|---|---|---|---|
| Carbon Sequestration | 0.944 ** | |||||
| Water Provision | −0.501 ** | −0.647 ** | ||||
| Water Retention | −0.095 | 0.061 | −0.411 ** | |||
| Soil Retention | 0.891 ** | 0.845 ** | −0.226 * | −0.249 * | ||
| Nitrogen Retention | 0.893 ** | 0.963 ** | −0.761 ** | 0.146 | 0.734 ** | |
| Phosphorus Retention | 0.921 ** | 0.976 ** | −0.708 ** | 0.079 | 0.767 ** | 0.989 ** |
* indicated a significant correlation (p < 0.05); ** indicated an extremely significant correlation (p < 0.01); n = 120.
Table 2.
Pair-wise overlaps between ecosystem services hotspots.
| Types | Timber Production | Carbon Sequestration | Water Provision | Water Retention | Soil Retention | Nitrogen Retention |
|---|---|---|---|---|---|---|
| Carbon Sequestration | 40.96% | |||||
| Water Provision | 1.50% | 0 | ||||
| Water Retention | 7.09% | 15.81% | 0.01% | |||
| Soil Retention | 43.01% | 38.40% | 0.50% | 5.95% | ||
| Nitrogen Retention | 12.65% | 13.15% | 0 | 34.72% | 1.23% | |
| Phosphorus Retention | 12.23% | 13.18% | 0 | 35.34% | 1.18% | 98.26% |
Publisher’s Note: MDPI stays neutral with regard to jurisdictional claims in published maps and institutional affiliations. |
© 2021 by the authors. Licensee MDPI, Basel, Switzerland. This article is an open access article distributed under the terms and conditions of the Creative Commons Attribution (CC BY) license (http://creativecommons.org/licenses/by/4.0/).
Share and Cite
MDPI and ACS Style
Bai, Y.; Ochuodho, T.O.; Yang, J.; Agyeman, D.A. Bundles and Hotspots of Multiple Ecosystem Services for Optimized Land Management in Kentucky, United States. Land 2021, 10, 69. https://0-doi-org.brum.beds.ac.uk/10.3390/land10010069
AMA Style
Bai Y, Ochuodho TO, Yang J, Agyeman DA. Bundles and Hotspots of Multiple Ecosystem Services for Optimized Land Management in Kentucky, United States. Land. 2021; 10(1):69. https://0-doi-org.brum.beds.ac.uk/10.3390/land10010069
Chicago/Turabian StyleBai, Yang, Thomas O. Ochuodho, Jian Yang, and Domena A. Agyeman. 2021. "Bundles and Hotspots of Multiple Ecosystem Services for Optimized Land Management in Kentucky, United States" Land 10, no. 1: 69. https://0-doi-org.brum.beds.ac.uk/10.3390/land10010069
Note that from the first issue of 2016, this journal uses article numbers instead of page numbers. See further details here.