Scientific Mapping on the Impact of Climate Change on Cultural and Natural Heritage: A Systematic Scientometric Analysis

 ,
,  ,
,  and
and 
Abstract
:1. Introduction
2. Materials and Methods
2.1. Search Criteria
- (a)
- Time-coverage: as of closing January 2020, in order to recover the maximum number of publications and to have information published for full years.
- (b)
- Documentary unit of analysis: the scientific article. It is a resource that shows organized, synthesized and quickly obtainable information, in addition to having visibility and impact at different levels (local, national and international) [35,36,37]. These are the advantages over other publication formats that are excluded, which both databases contain (book chapters, conferences, etc.).
- (c)
- Thematic approach: to identify studies that address “the impact of climate change on natural and cultural heritage”; theoretical approaches, description of the processes of affectation or actions for either the adaptation, mitigation of the identified impacts or both, etc.
- (d)
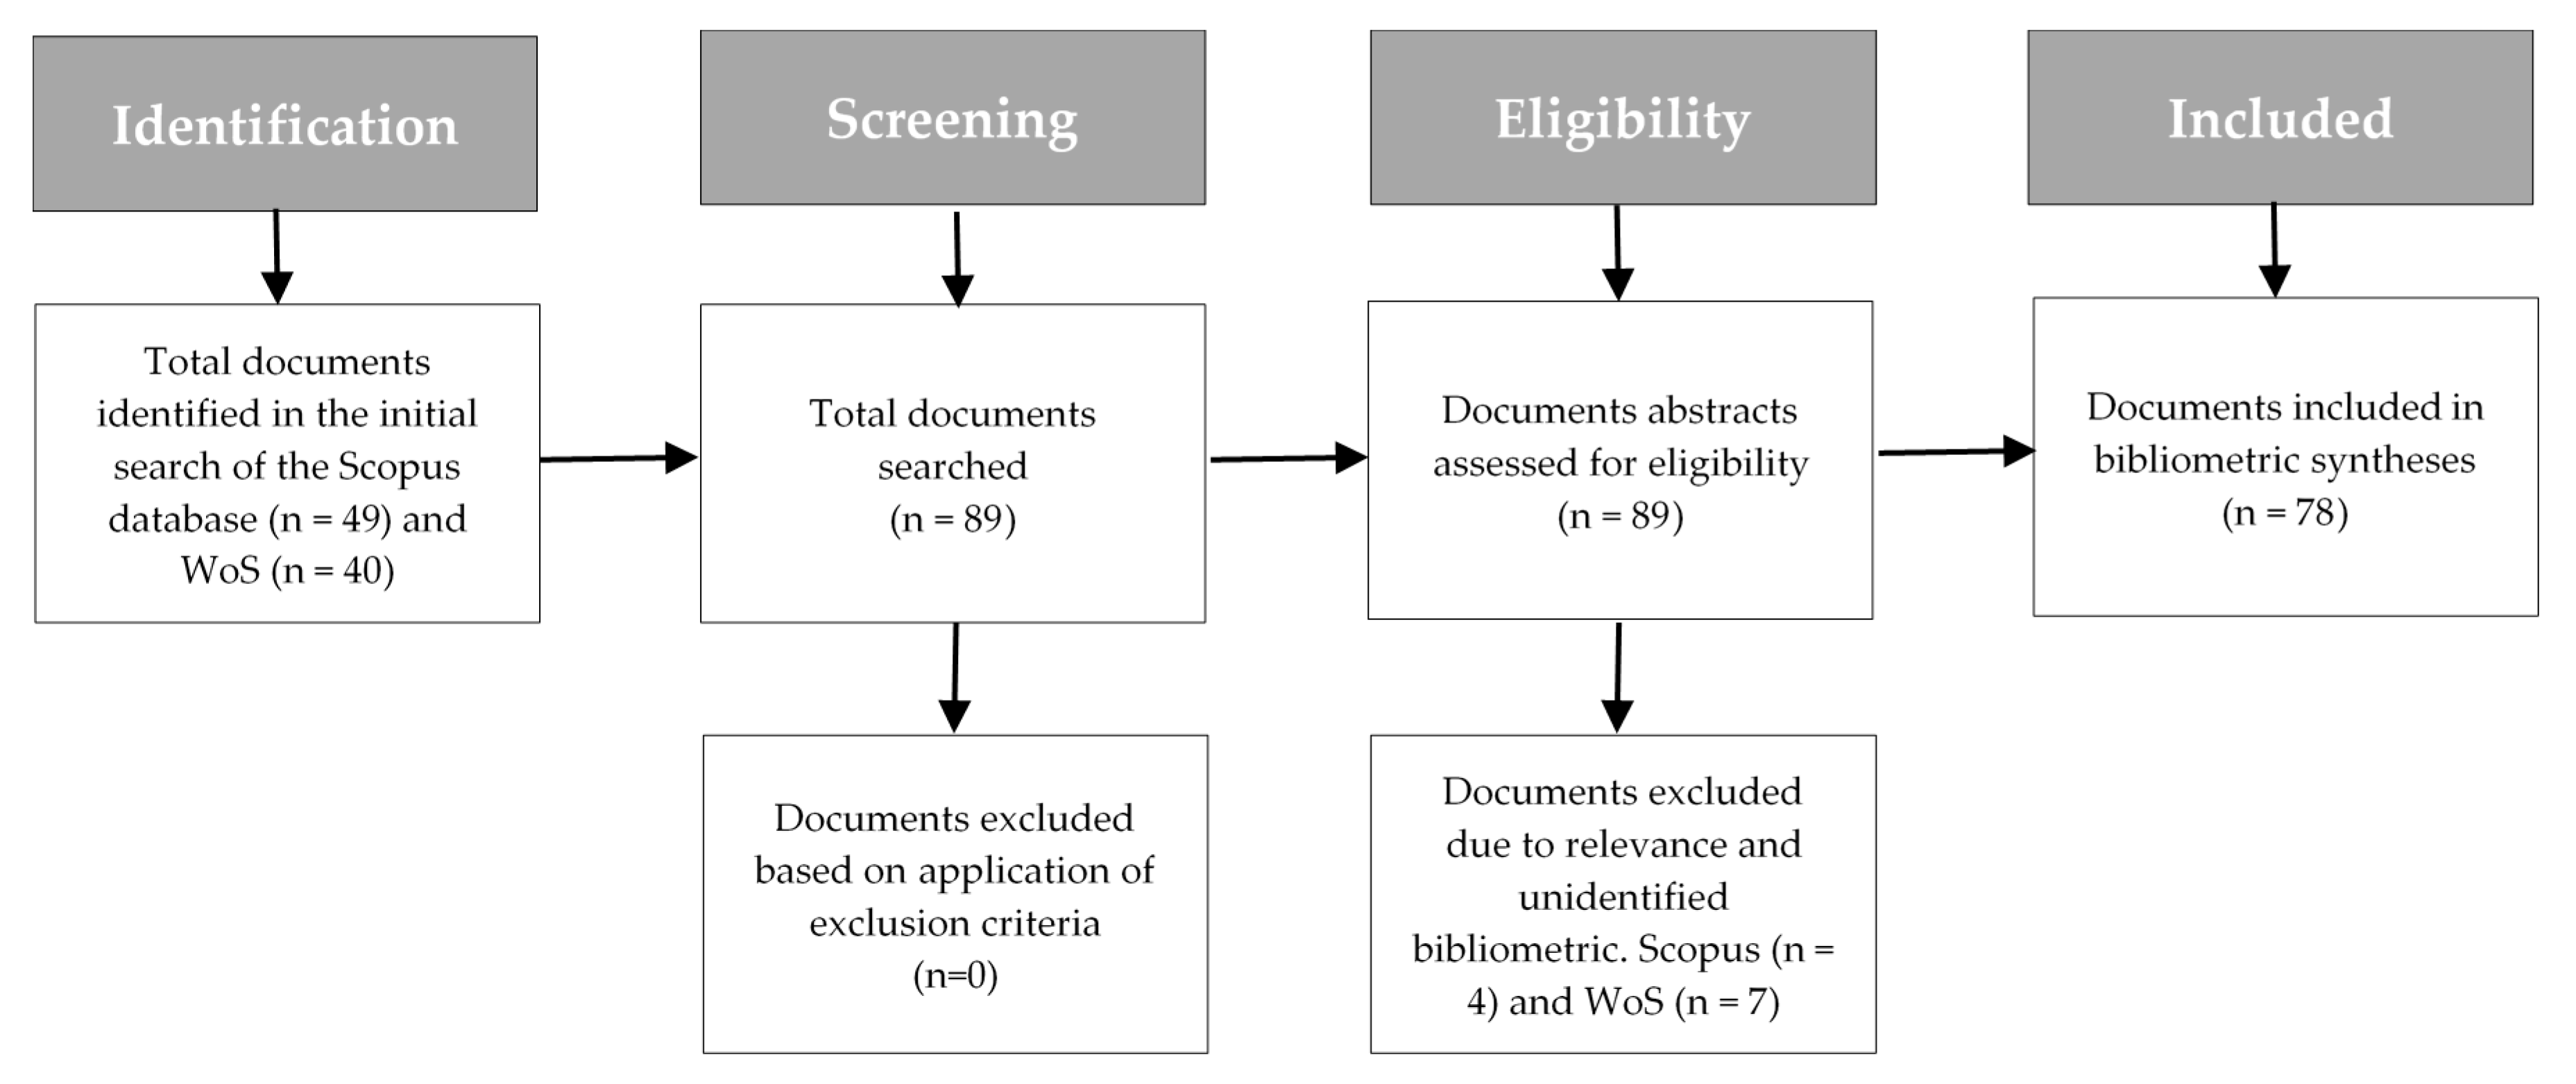
- Tracking process, the guidelines of the PRISMA (Preferred Reporting Items for Systematic Reviews and Meta-Analyses) method were used.
2.2. PRISMA Method
2.3. Data Extraction
2.4. Data Analysis
3. Results
3.1. Overlap in Databases
3.2. Analysis with Evaluative Measures
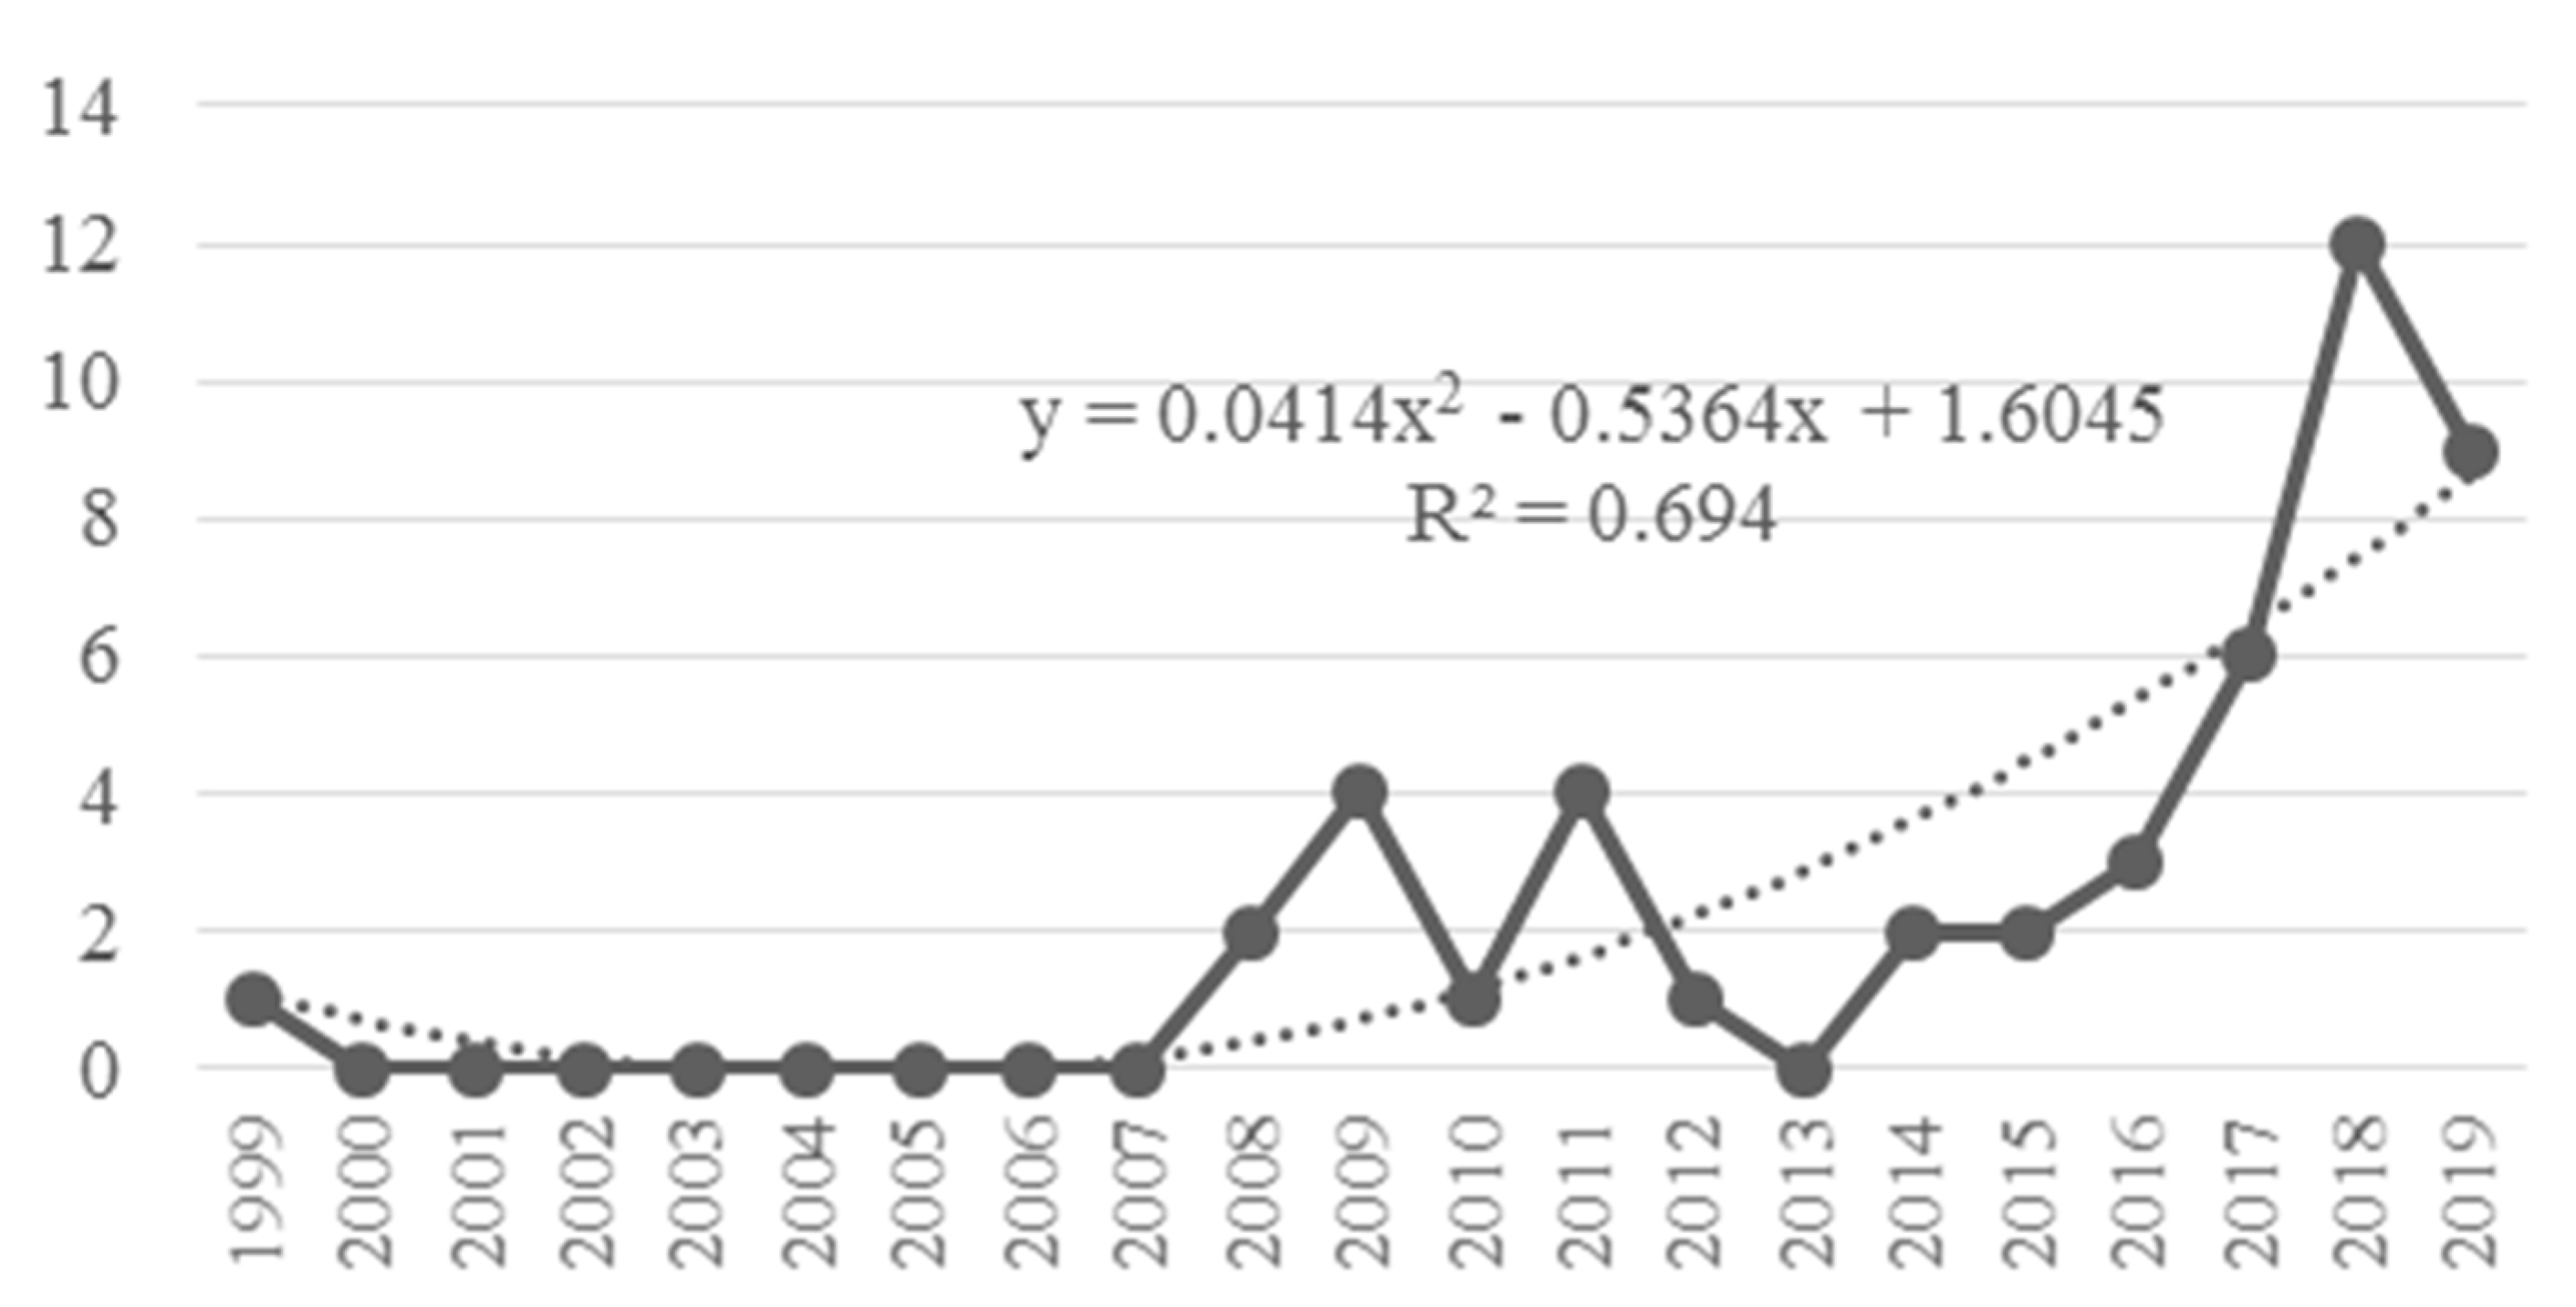
3.2.1. Productivity per Years
3.2.2. Citations
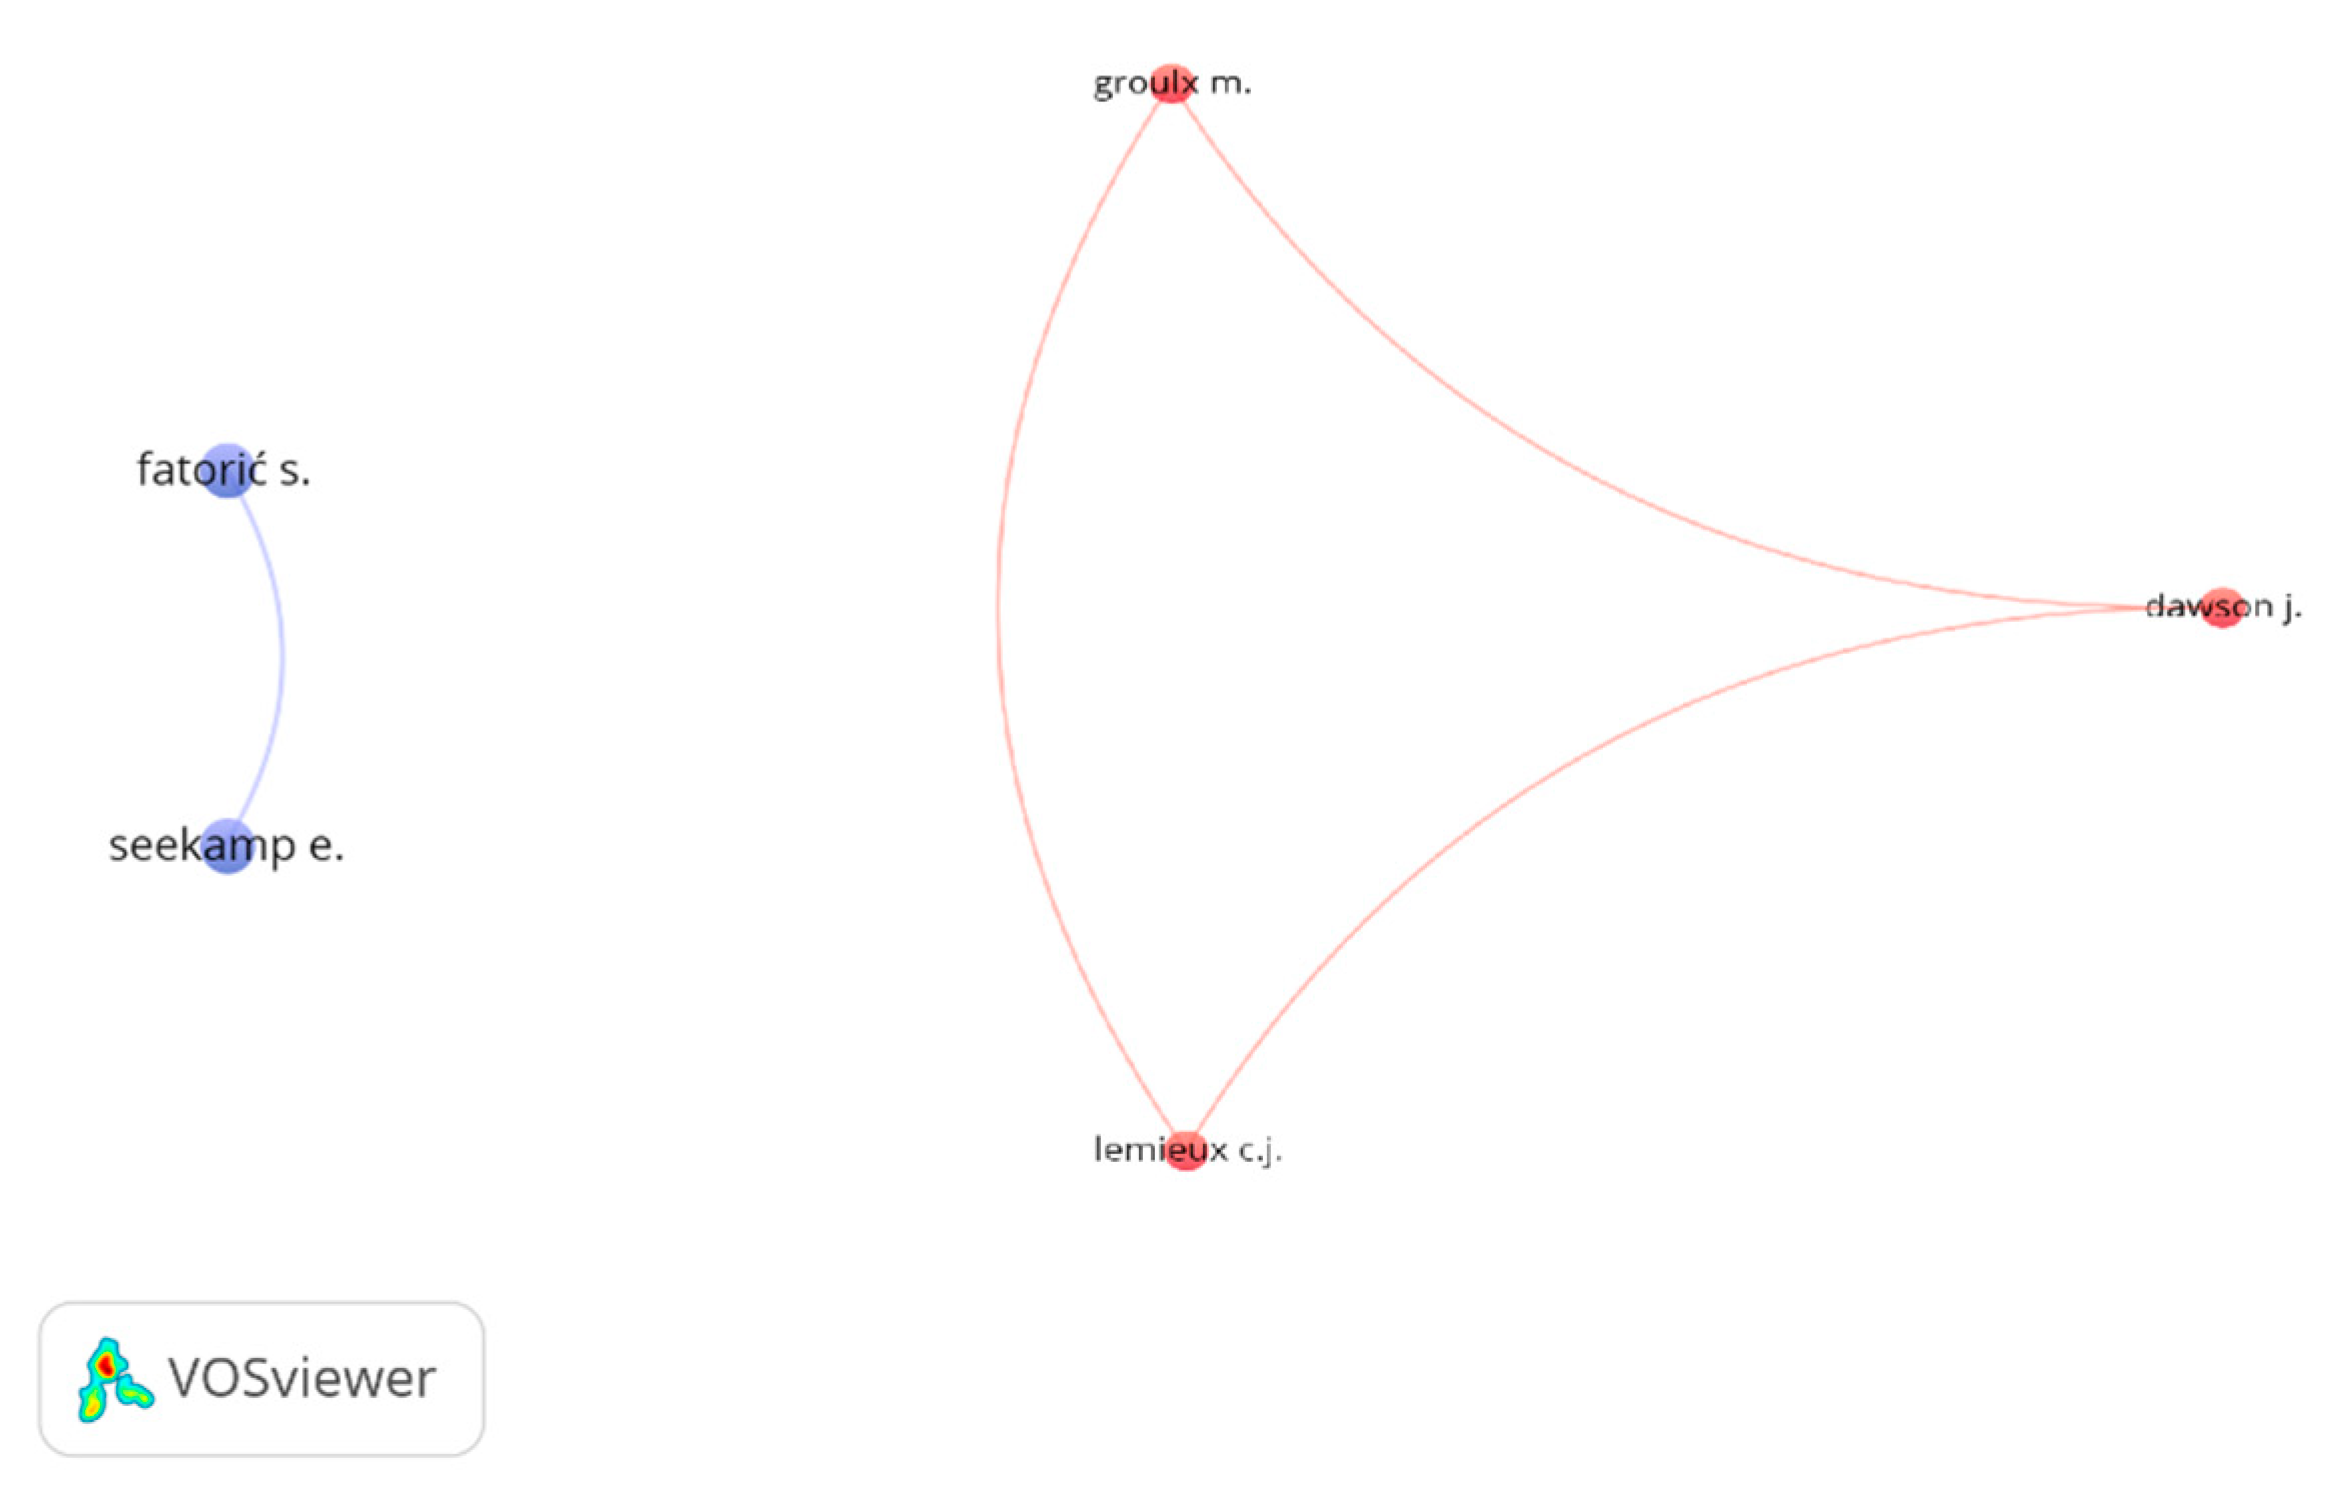
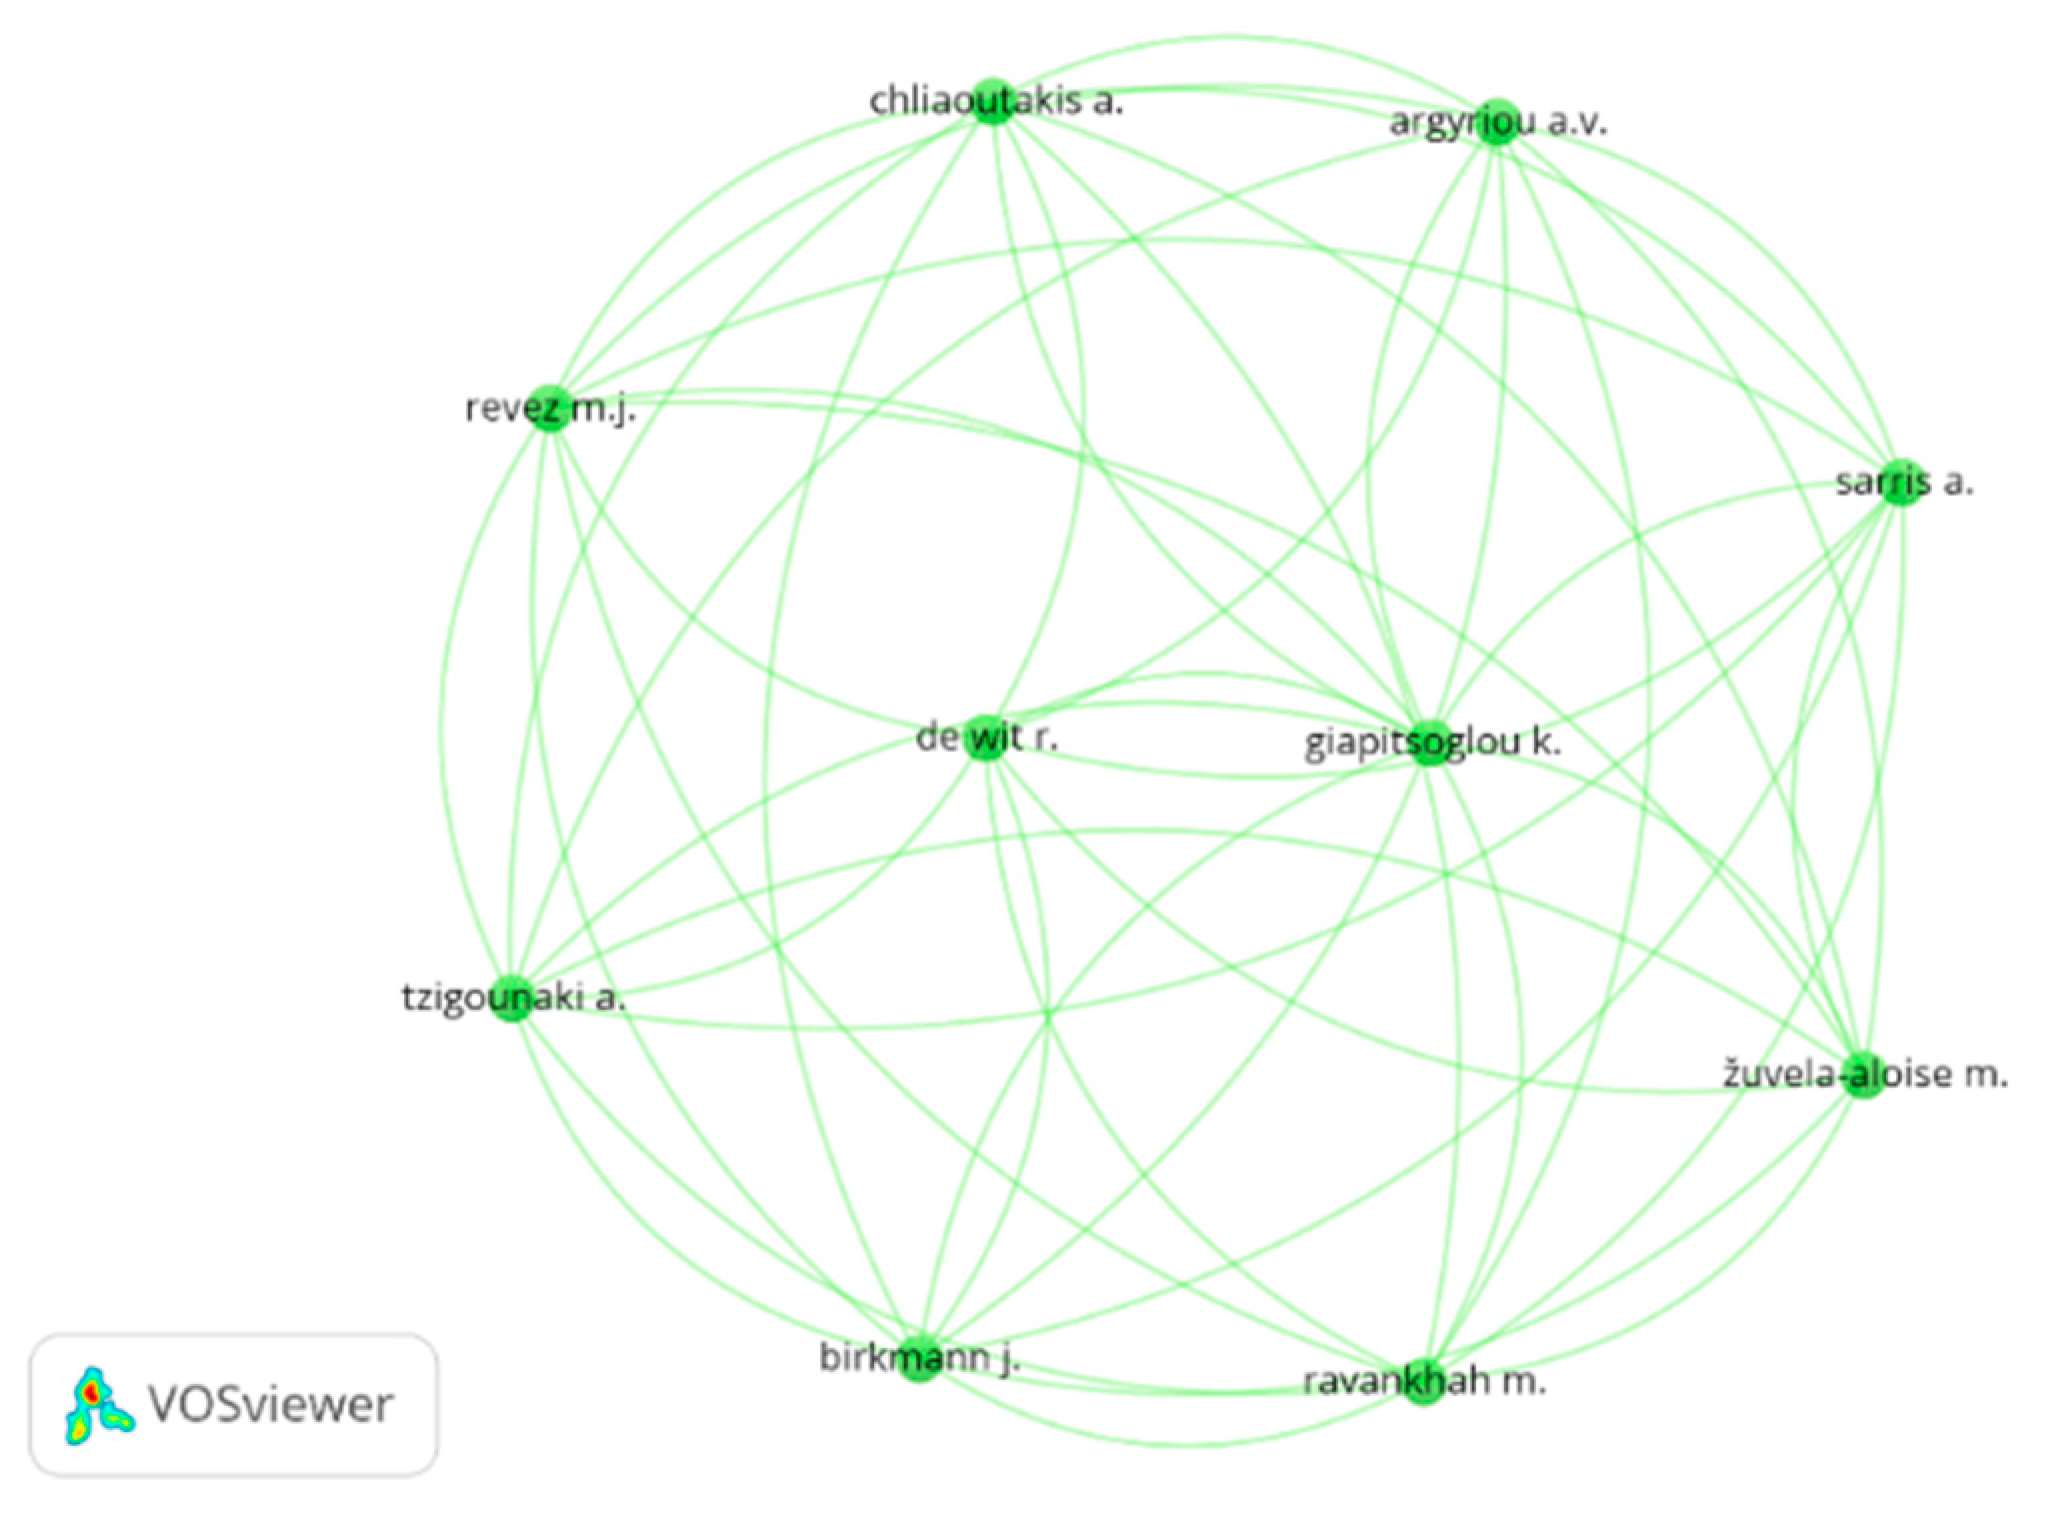
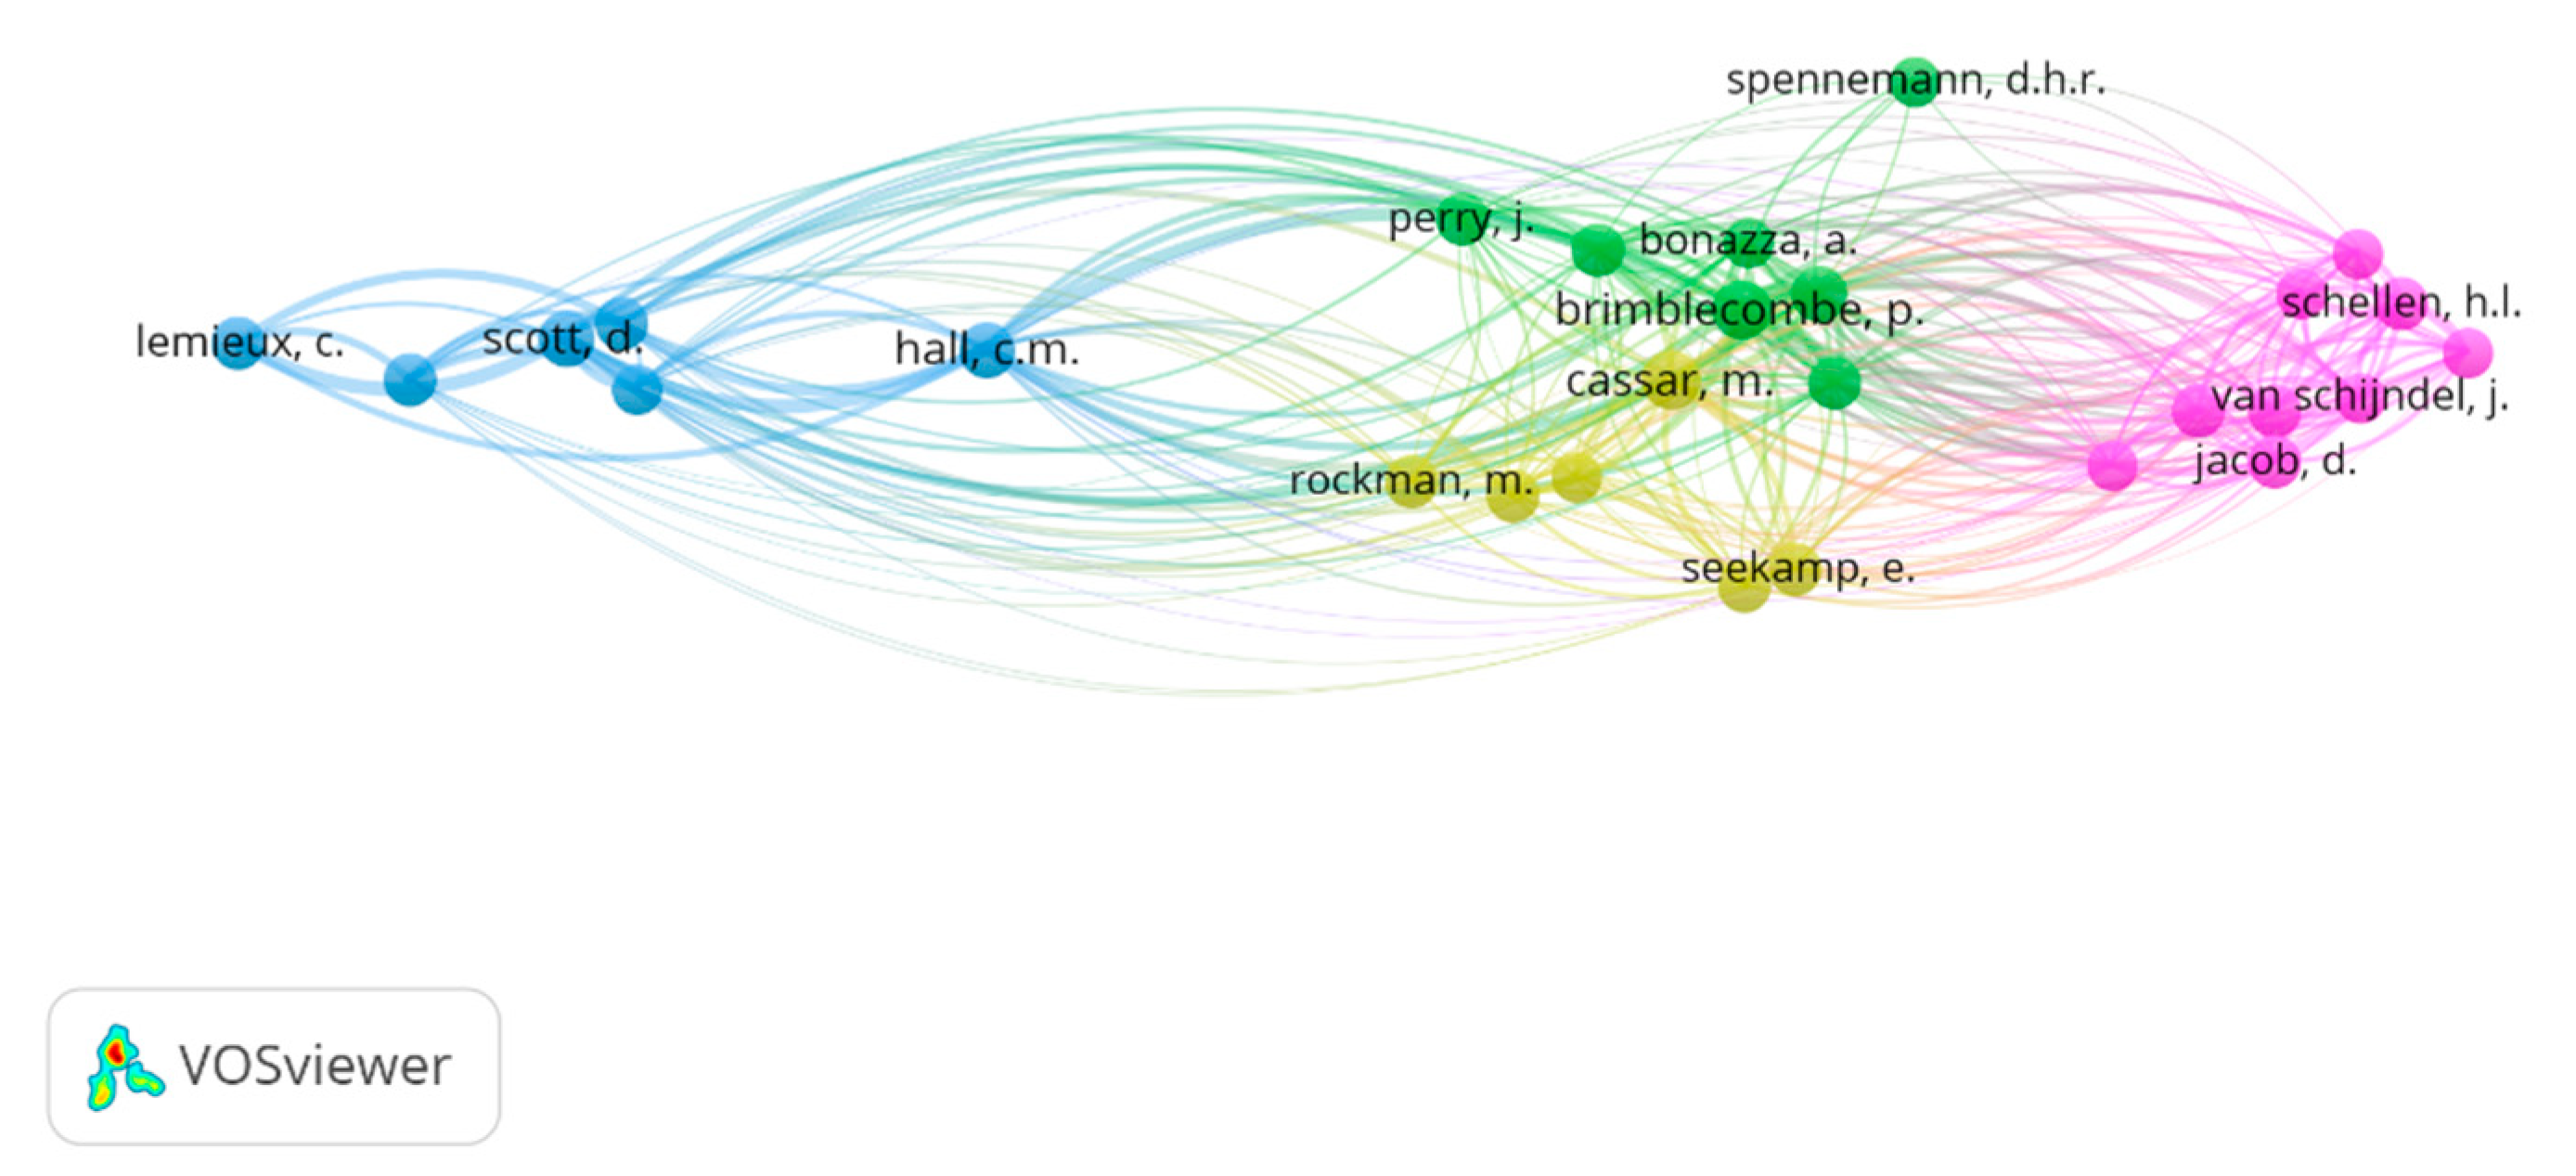
3.2.3. Authors
3.2.4. Productivity by Type of Institutions and Country
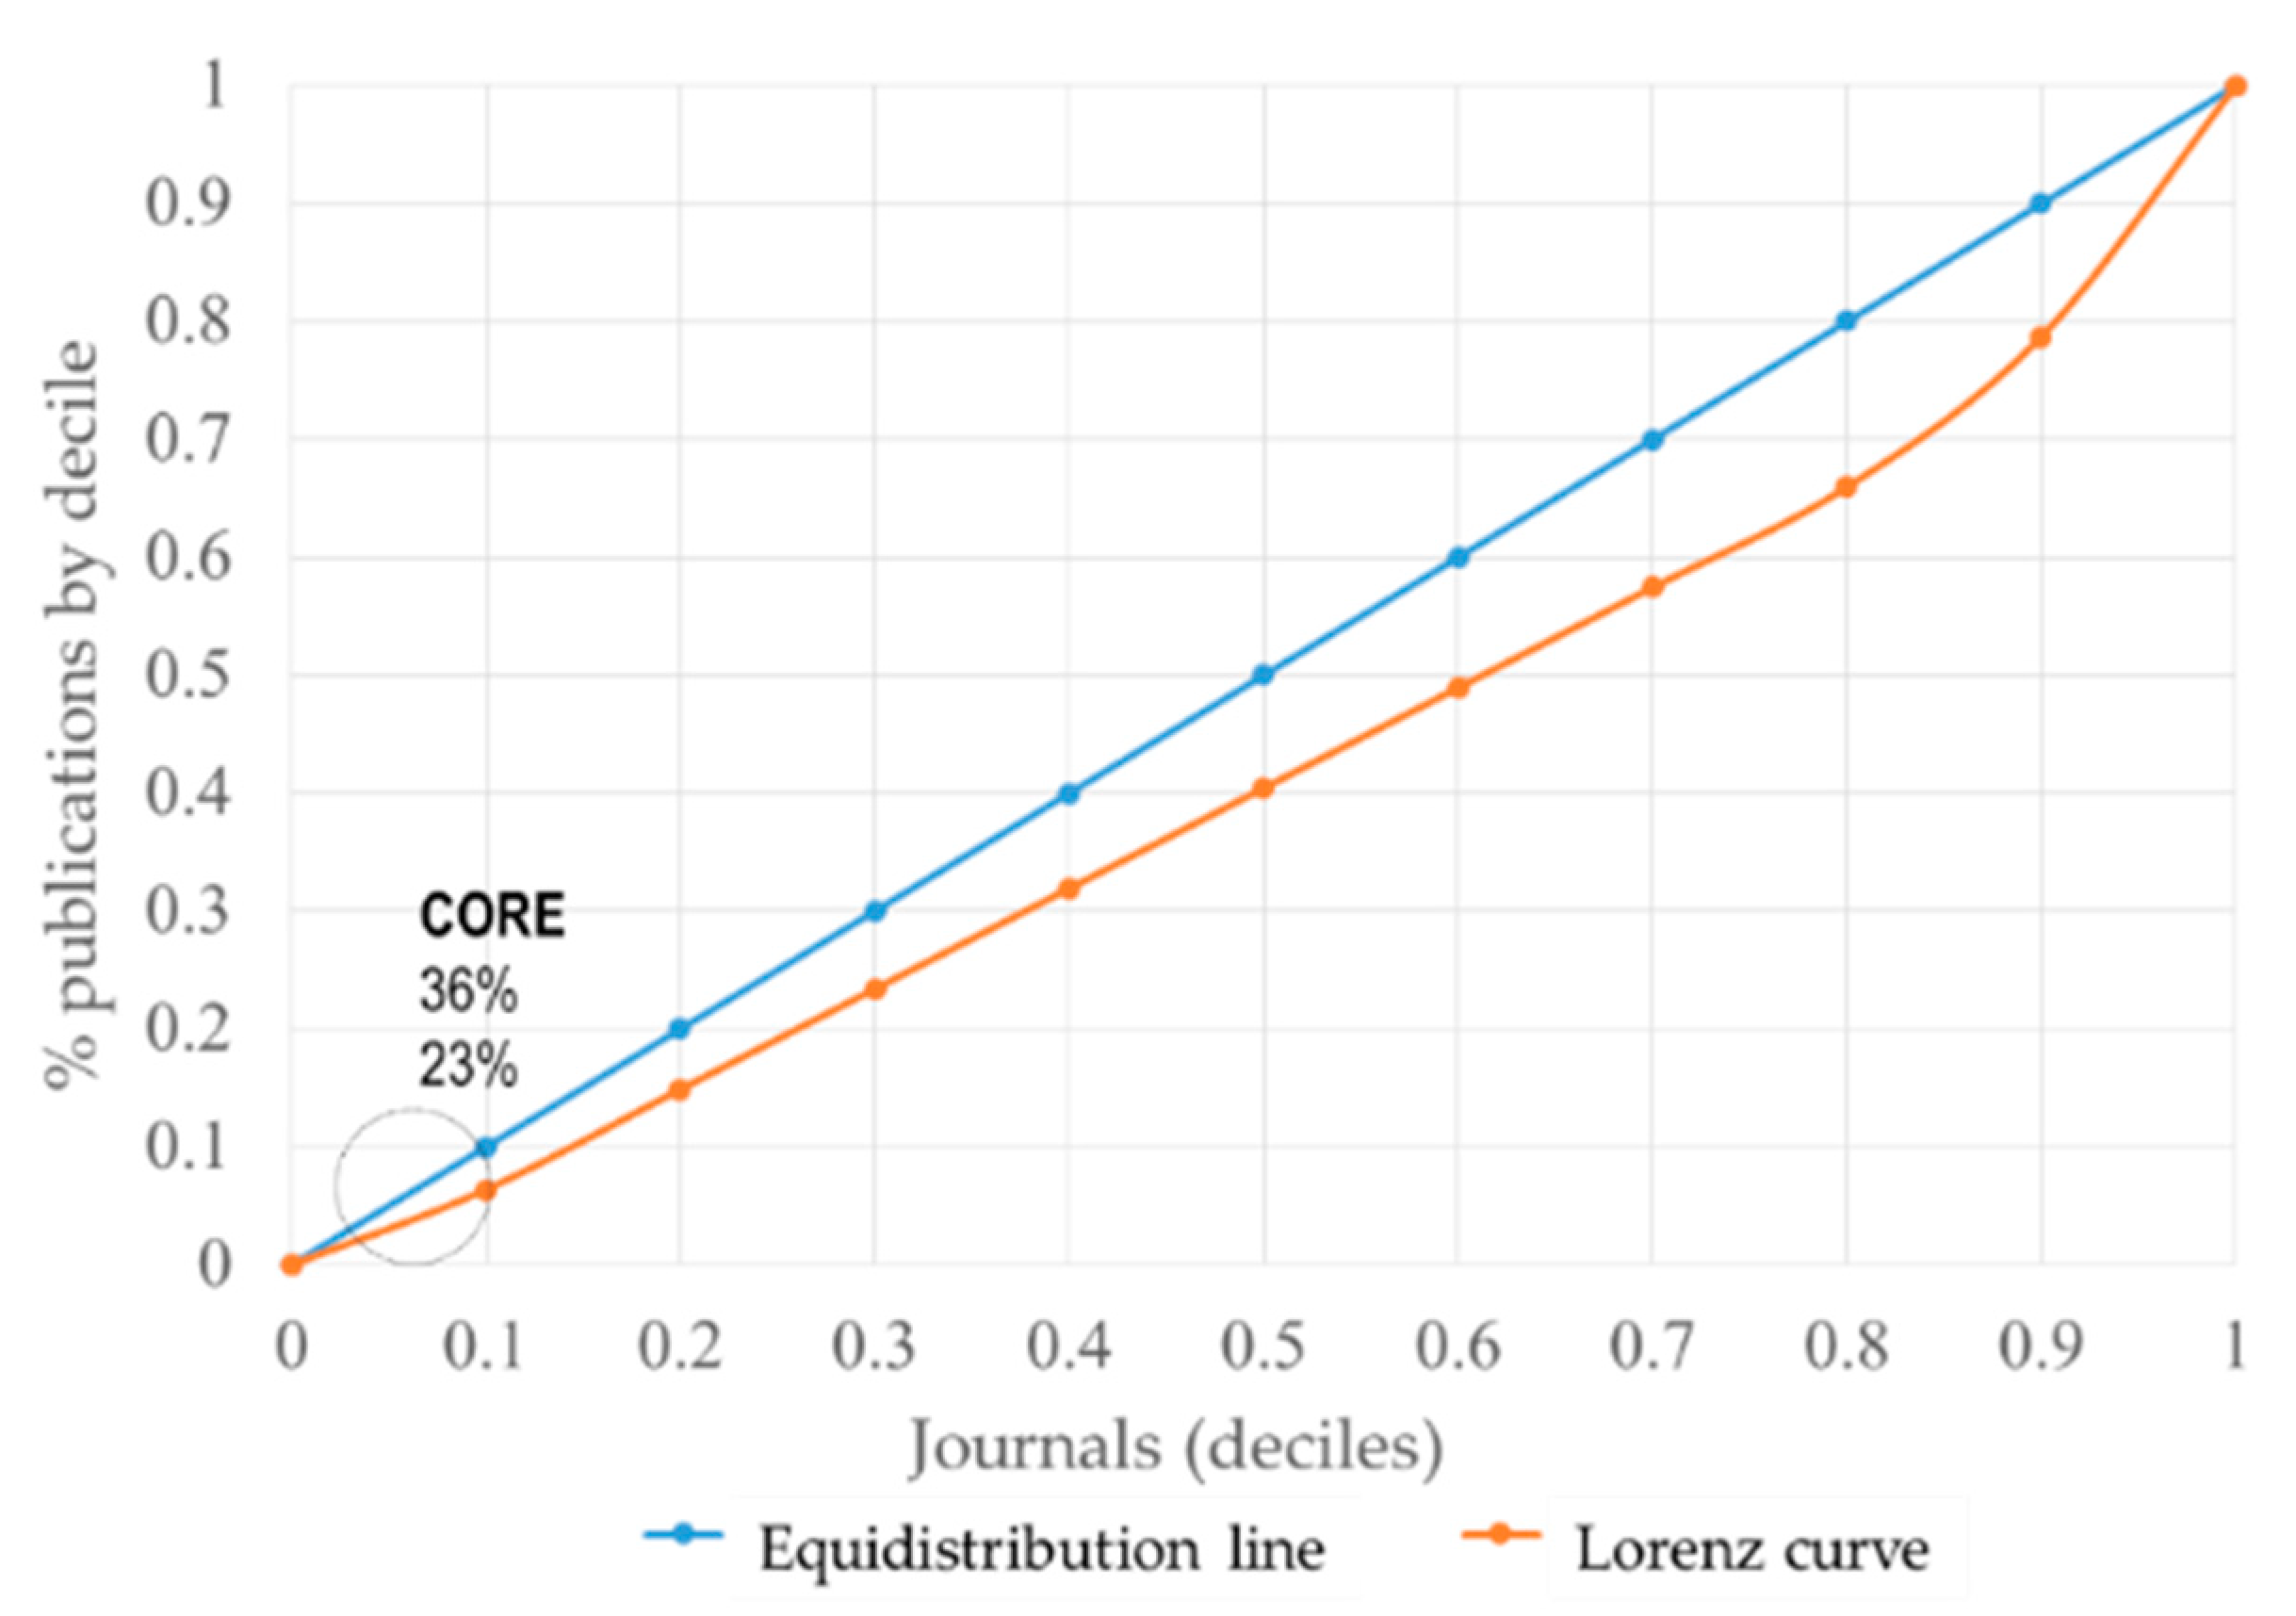
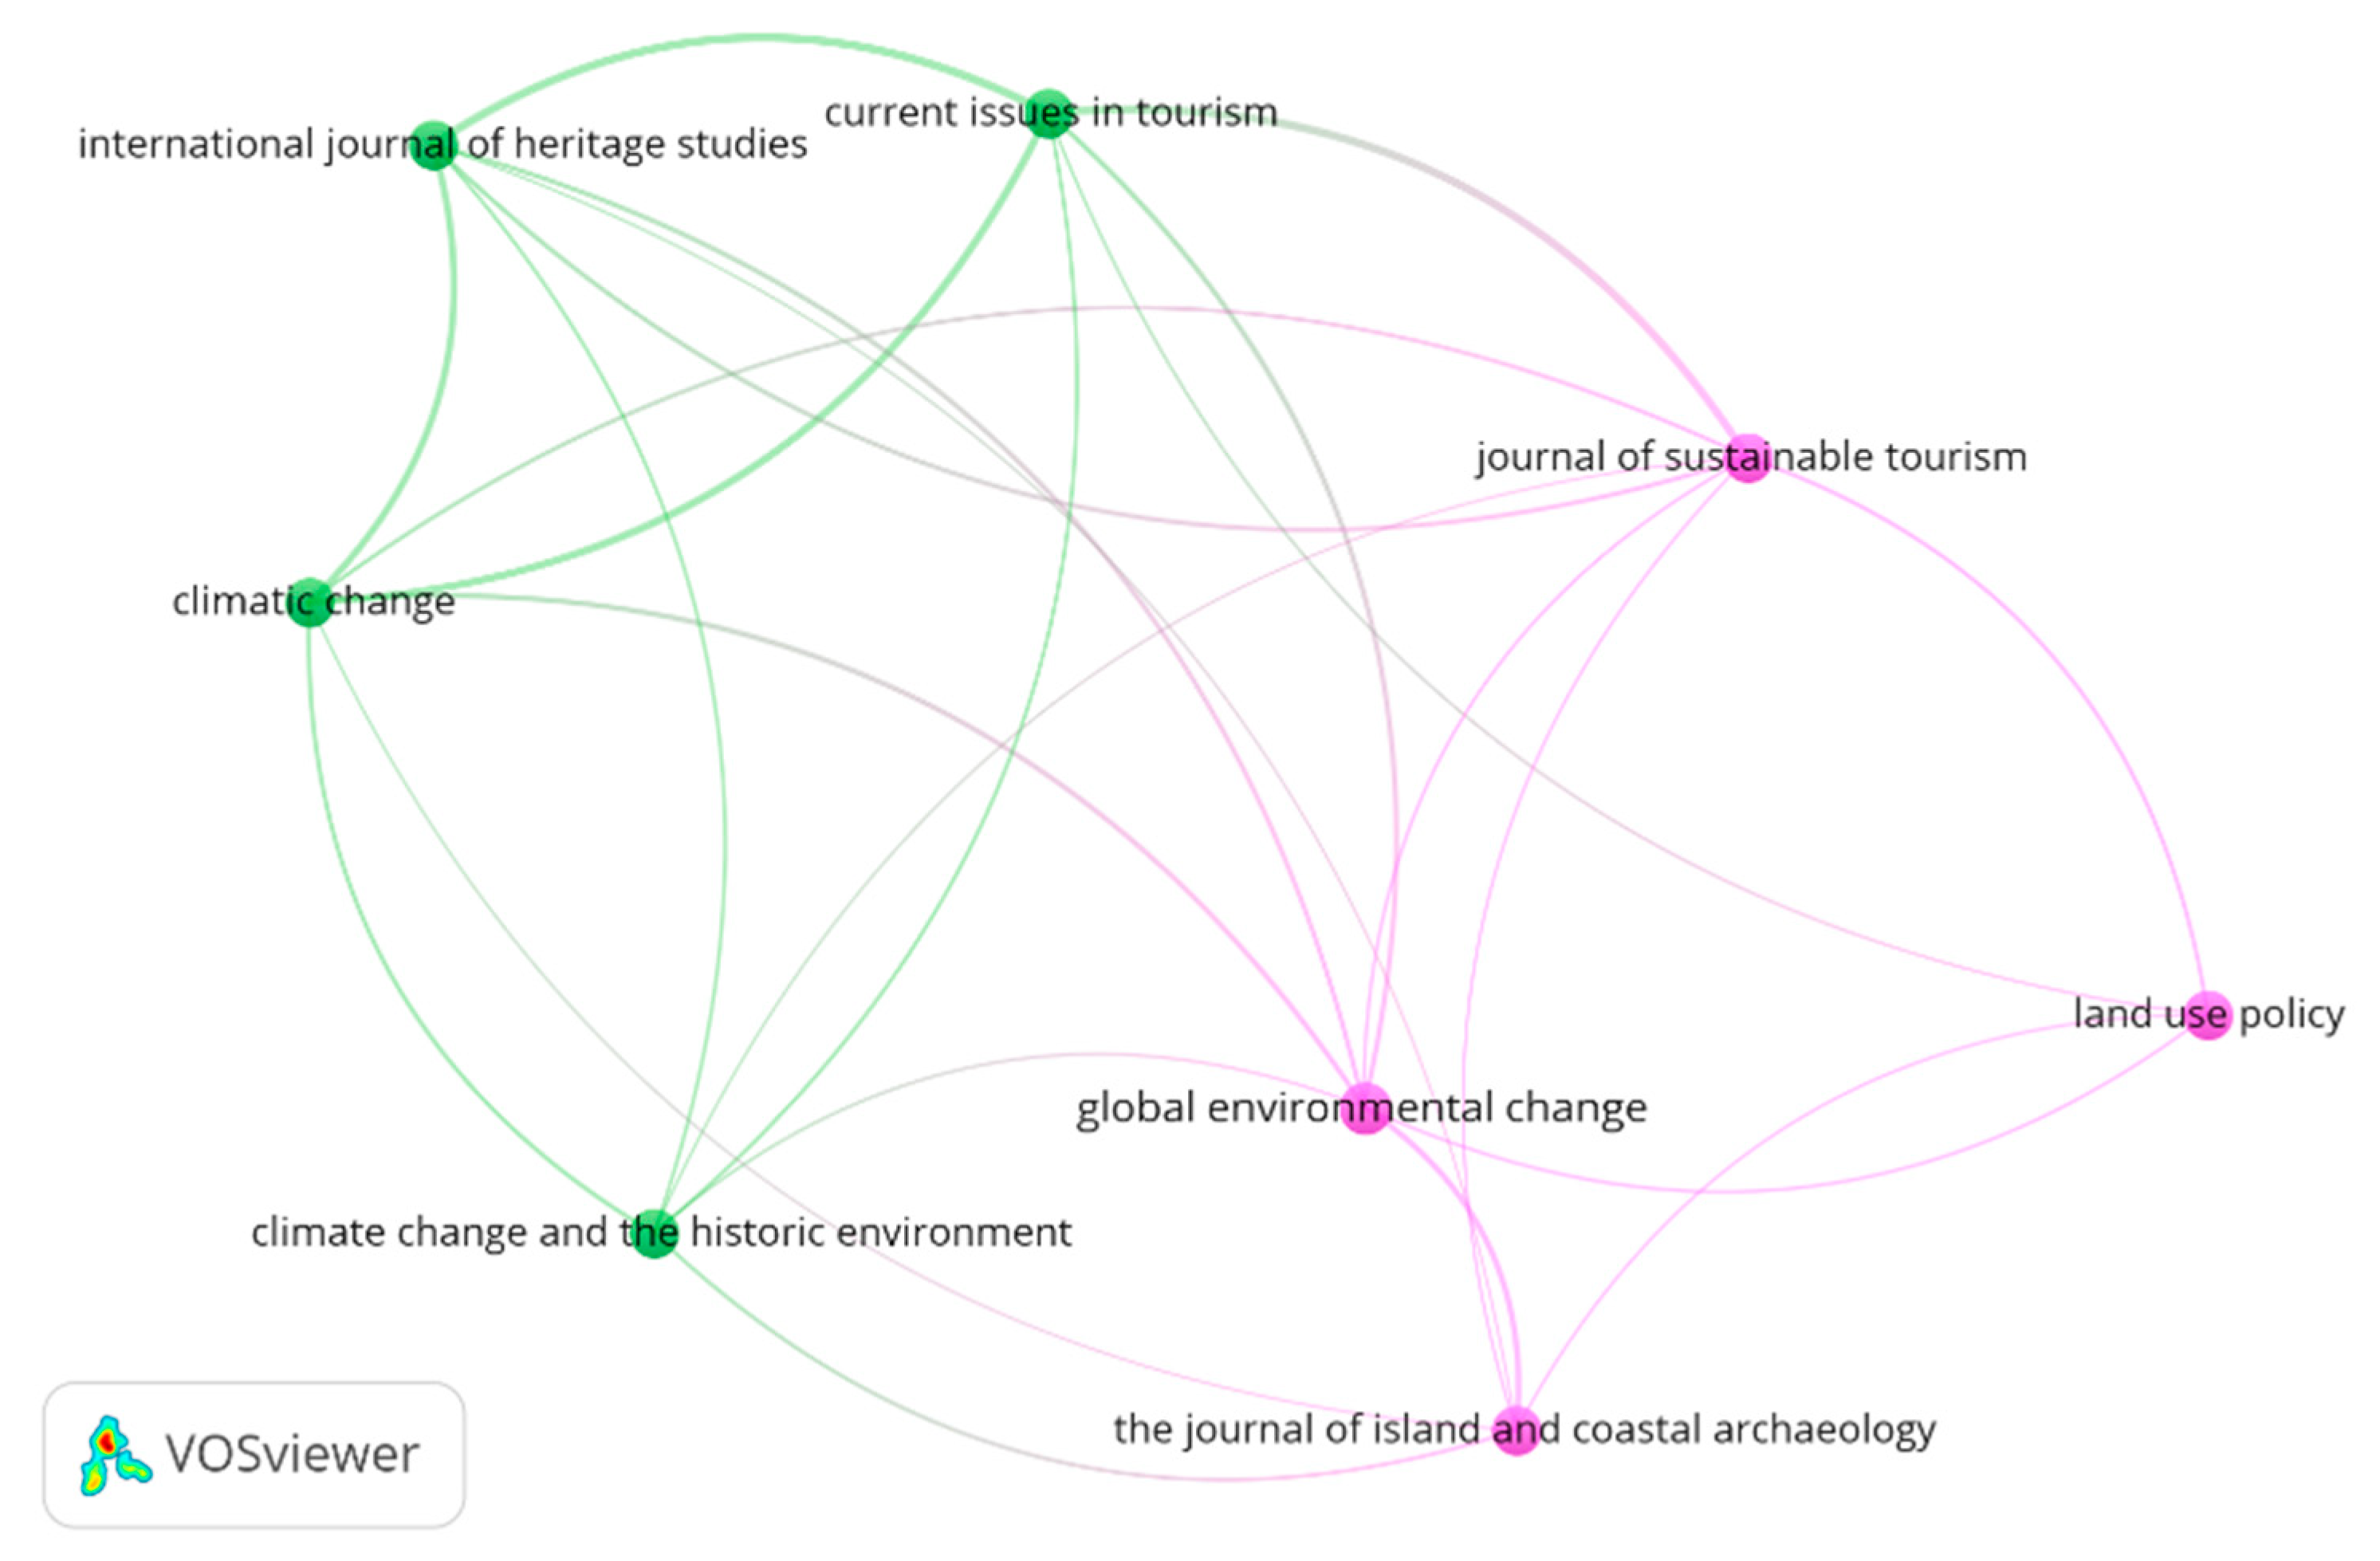
3.2.5. Journals
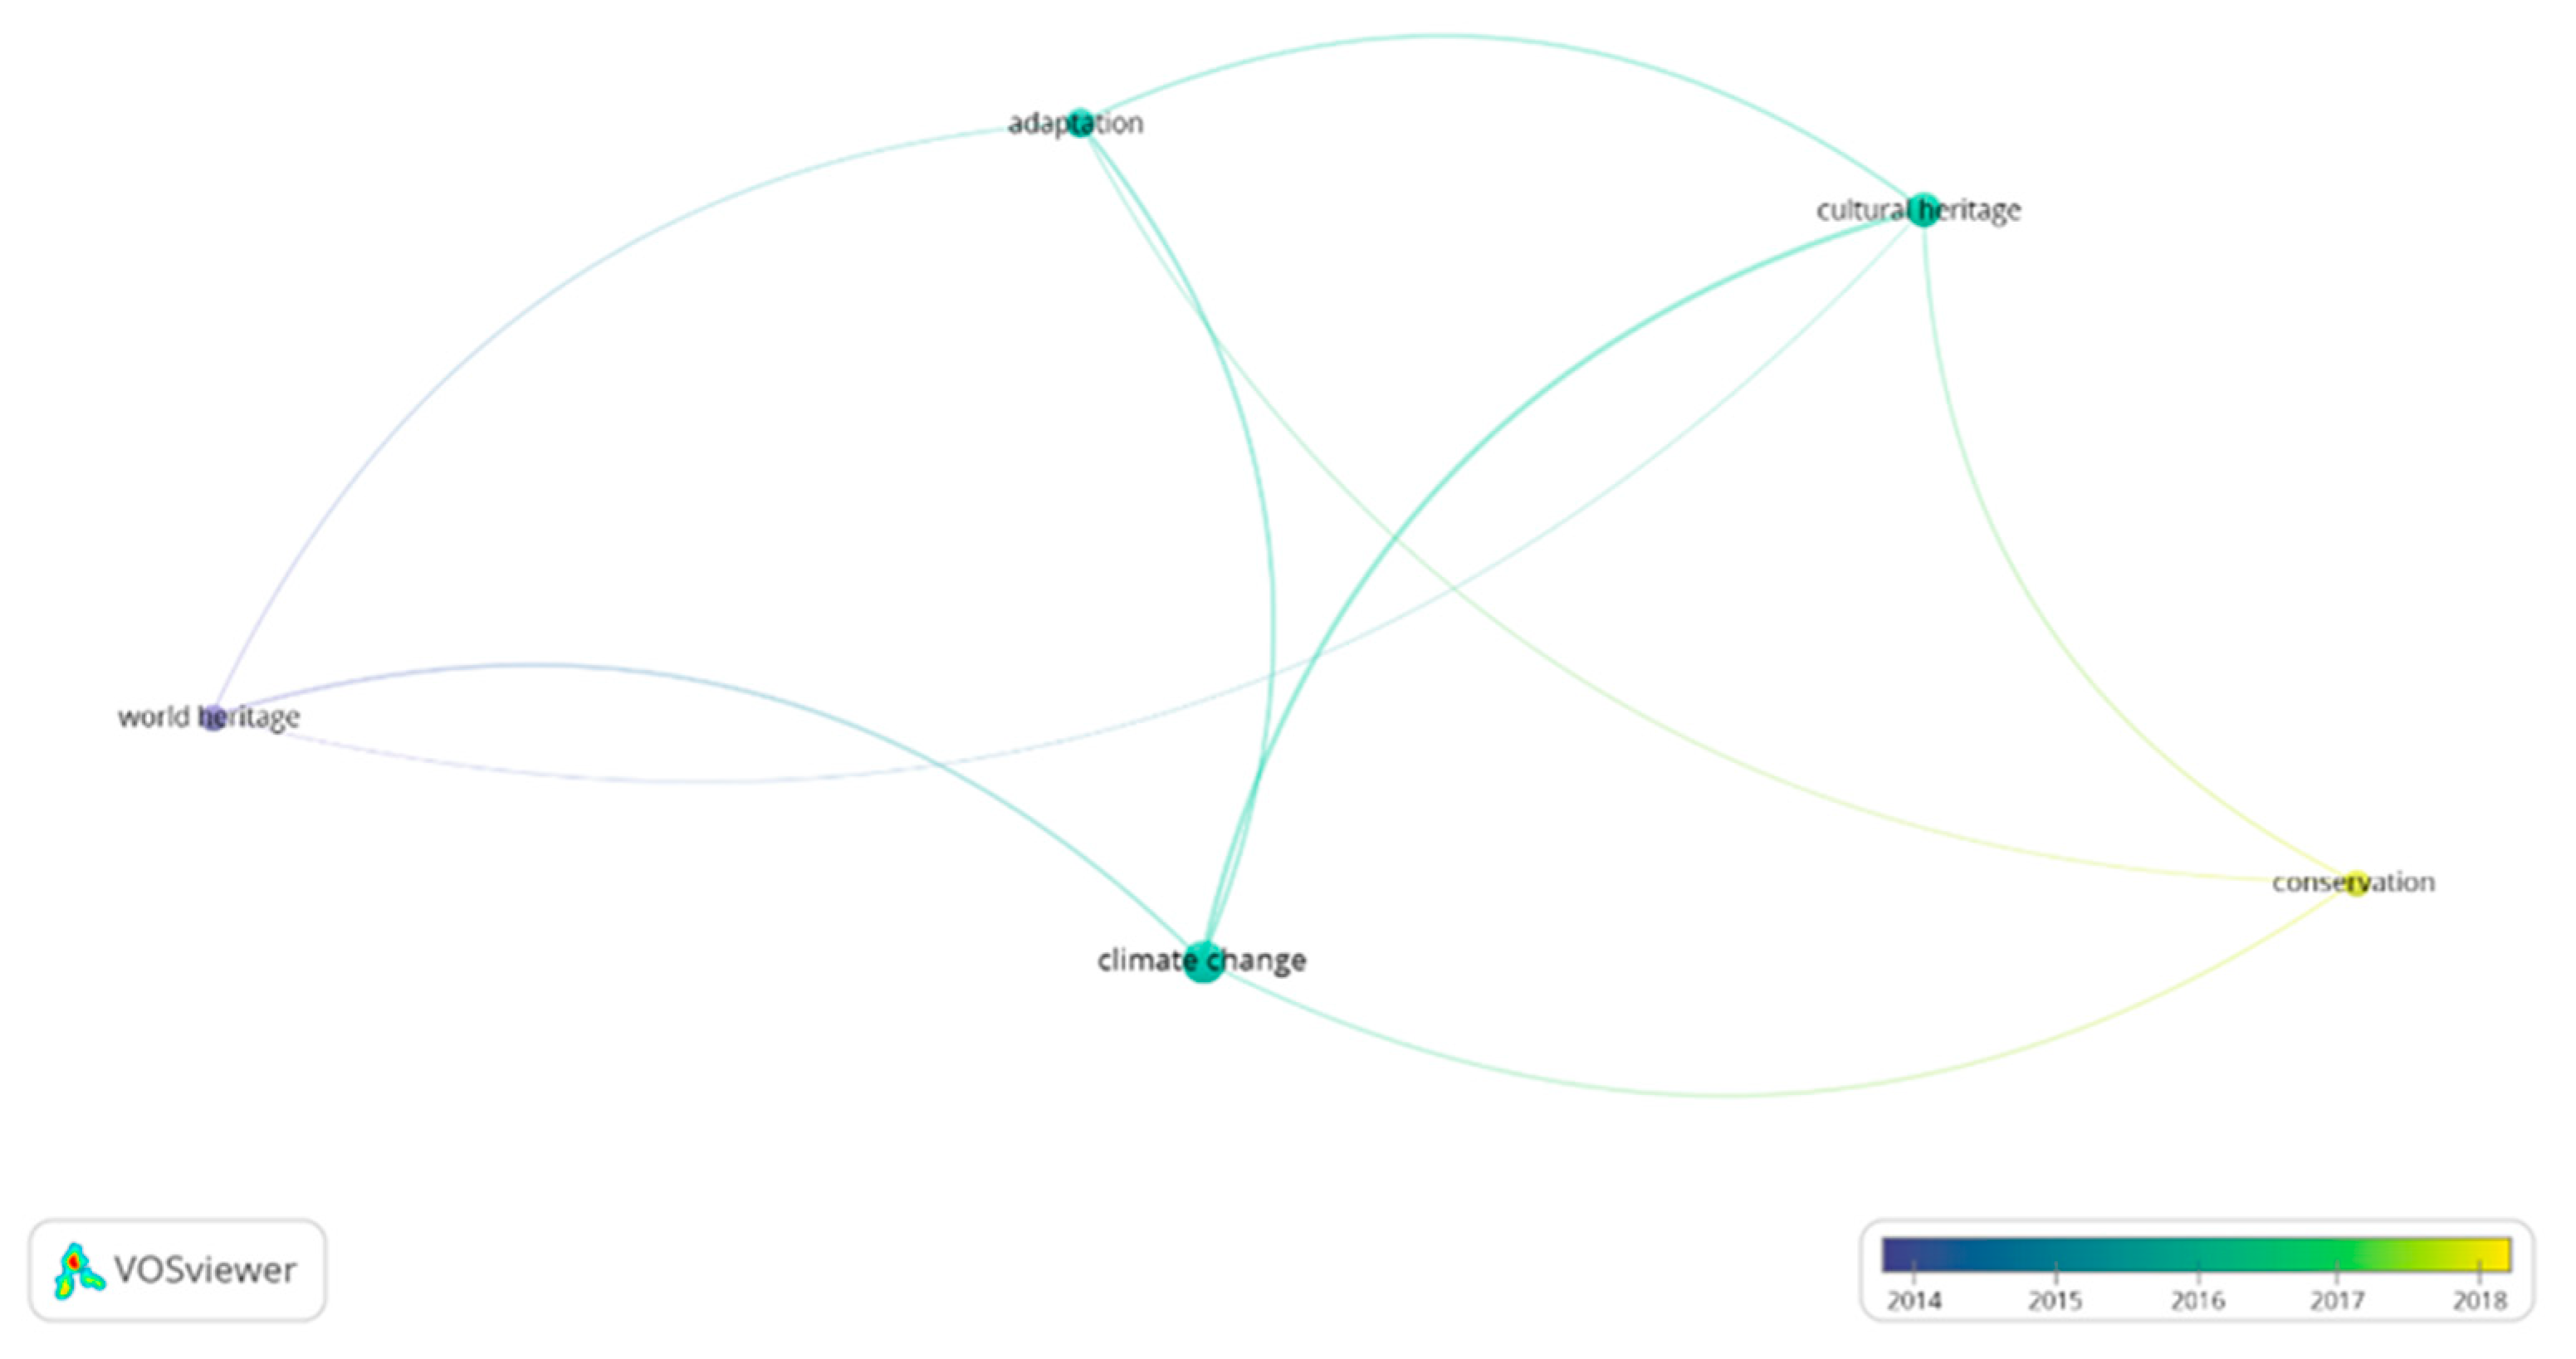
3.2.6. Keywords
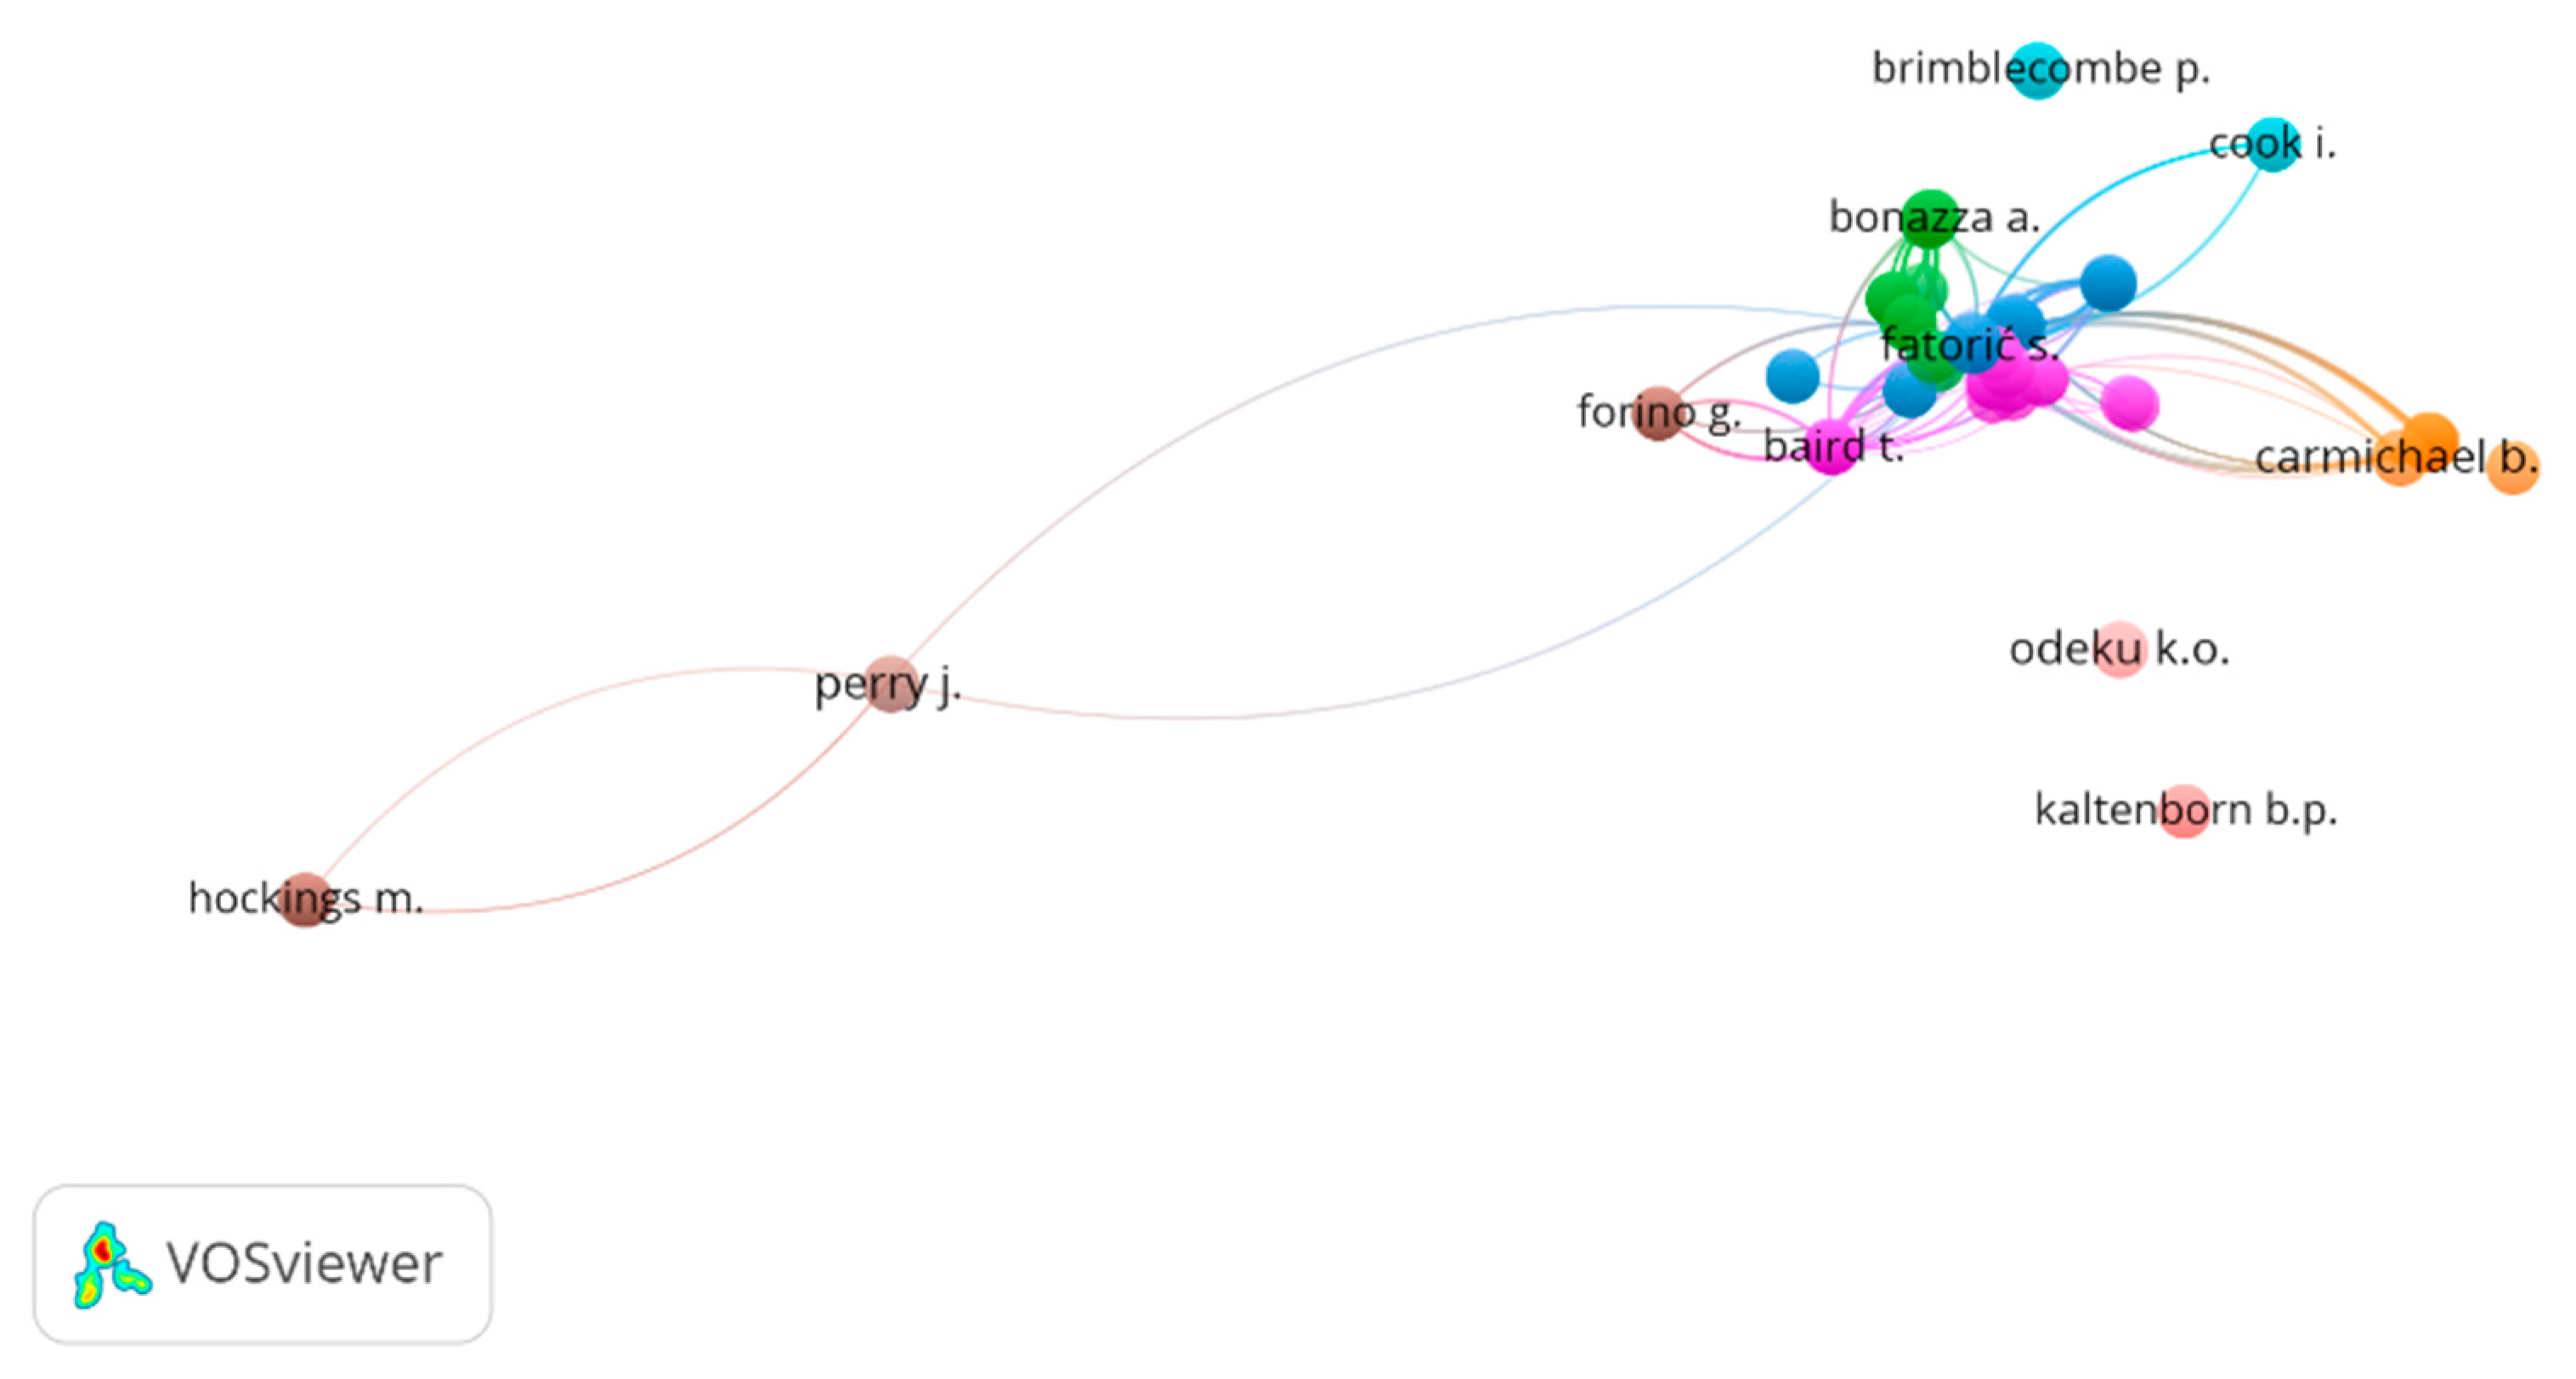
3.3. Analysis with Relational Measures (of Networks)
4. Conclusions
Author Contributions
Funding
Institutional Review Board Statement
Informed Consent Statement
Data Availability Statement
Conflicts of Interest
References
- IPCC. Climate Change 2014: Synthesis Report. Contribution of Working Groups I, II and III to the Fifth Assessment Report of the Intergovernmental Group of Experts on Climate Change. 2014. Available online: http://www.ipcc.ch (accessed on 14 October 2020).
- Haunschild, R.; Bornmann, L.; Marx, W. Climate change research in view of bibliometrics. PLoS ONE 2016, 11, e0160393. [Google Scholar] [CrossRef] [PubMed] [Green Version]
- Forino, G.; MacKee, J.; von Meding, J. A proposed assessment index for climate change-related risk for cultural heritage protection in Newcastle (Australia). Int. J. Disaster Risk Reduct. 2016, 19, 235–248. [Google Scholar] [CrossRef]
- McIntyre-Tamwoy, S. The impact of global climate change and cultural heritage: Grasping the issues and defining the problem. Hist. Environ. 2008, 21, 2–9. [Google Scholar]
- Brimblecombe, P.; Grossi, C.; Harris, I. Climate Change Critical to Cultural Heritage. In Proceedings of the International Conference on Heritage, Weathering and Conservation, HWC-2006, Madrid, Spain, 21–24 June 2006; Volume 1, pp. 195–205. [Google Scholar]
- Haugen, A.; Mattsson, J. Preparations for climate change’s influences on cultural heritage. Int. J. Clim. Chang. Strateg. Manag. 2011, 3, 386–401. [Google Scholar] [CrossRef]
- Howard, E. Garden Cities of Tomorrow; Routledge: London, UK, 2013. [Google Scholar]
- MacKee, J.; Askland, H.H.; Askew, L. Recovering cultural built heritage after natural disasters: A resilience perspective. Int. J. Disaster Resil. Built Environ. 2014, 5, 202–212. [Google Scholar] [CrossRef]
- O’Brien, G.; O’Keefe, P.; Jayawickrama, J.; Jigyasu, R. Developing a model for building resilience to climate risks for cultural heritage. J. Cult. Herit. Manag. Sustain. Dev. 2015, 5, 99. [Google Scholar] [CrossRef]
- Perry, J. World Heritage hot spots: A global model identifies the 16 natural heritage properties on the World Heritage List most at risk from climate change. Int. J. Herit. Stud. 2011, 17, 426–441. [Google Scholar] [CrossRef]
- Phillips, H. The capacity to adapt to climate change at heritage sites—The development of a conceptual framework. Environ. Sci. Policy 2015, 47, 118–125. [Google Scholar] [CrossRef]
- Sabbioni, C.; Cassar, M.; Brimblecombe, P.; Lefevre, R.-A. Vulnerability of cultural heritage to climate change. Pollut. Atmos. 2009, 202, 157–169. [Google Scholar]
- Hall, C.M.; Baird, T.; James, M.; Ram, Y. Climate change and cultural heritage: Conservation and heritage tourism in the Anthropocene. J. Herit. Tour. 2016, 11, 10–24. [Google Scholar] [CrossRef]
- Wang, D.; Gouhier, T.C.; Menge, B.A.; Ganguly, A.R. Intensification and spatial homogenization of coastal upwelling under climate change. Nature 2015, 518, 390–394. [Google Scholar] [CrossRef] [PubMed]
- Cassar, M. Climate Change and the Historic Environment; Centre for Sustainable Heritage, University College: London, UK, 2005. [Google Scholar]
- Huijbregts, Z.; Kramer, R.P.; Martens, M.H.J.; van Schijndel, A.W.M.; Schellen, H.L. A proposed method to assess the damage risk of future climate change to museum objects in historic buildings. Build. Environ. 2012, 55, 43–56. [Google Scholar] [CrossRef]
- UNESCO. Adaptation to Climate Change in Natural World Heritage Sites: A Practical Guide; 2015; Volume 37. Available online: https://whc.unesco.org/en/series/37/ (accessed on 14 October 2020).
- Convention Concerning the Protection of the World Cultural and Natural Heritage. In World Heritage Convention, or Convention; UNESCO: Paris, France, 1972.
- Rajčić, V.; Skender, A.; Damjanović, D. An innovative methodology of assessing the climate change impact on cultural heritage. Int. J. Archit. Herit. 2018, 12, 21–35. [Google Scholar] [CrossRef]
- Shearing, S. Here today, gone tomorrow? Climate change and world heritage. Australas. J. Nat. Resour. Law Policy 2008, 12, 161–200. [Google Scholar] [CrossRef]
- Carroll, P.; Aarrevaara, E. Review of potential risk factors of cultural heritage sites and initial modelling for adaptation to climate change. Geosciences 2018, 8, 26. [Google Scholar]
- Brimblecombe, P. Refining climate change threats to heritage. J. Inst. Conserv. 2014, 37, 85–93. [Google Scholar] [CrossRef]
- Sabbioni, C.; Brimblecombe, P.; Cassar, M. The Atlas of Climate Change Impact on European Cultural Heritage; Publications Office of the EU; Anthem Press: London, UK, 2010. [Google Scholar]
- UNESCO. Case Studies on Climate Change and World Heritage; UNESCO: Paris, France, 2007. [Google Scholar]
- Fatorić, S.; Seekamp, E. Are cultural heritage and resources threatened by climate change? A systematic literature review. Clim. Chang. 2017, 142, 227–254. [Google Scholar]
- Blake, J. Convention for the Safeguarding of Intangible Cultural Heritage. J. Encycl. Glob. Archaeol. 2003, 19–82. [Google Scholar] [CrossRef]
- Pellegrini, M.M.; Rialti, R.; Marzi, G.; Caputo, A. Sport entrepreneurship: A synthesis of existing literature and future perspectives. Int. Entrep. Manag. J. 2020, 16, 795–826. [Google Scholar] [CrossRef] [Green Version]
- Durán Sánchez, A.; Álvarez García, J.; Del Río Rama, M.C. Sustainable Water Resources Management: A Bibliometric Overview. Water 2018, 10, 1191. [Google Scholar] [CrossRef] [Green Version]
- Booth, A.; Sutton, A.; Papaioannou, D. Systematic Approaches to a Successful Literature Review, 1st ed.; SAGE Publications Ltd.: New York, NY, USA, 2016. [Google Scholar]
- Ertz, M.; Leblanc-Proulx, S. Sustainability in the collaborative economy: A bibliometric analysis reveals emerging interest. J. Clean. Prod. 2018, 196, 1073–1085. [Google Scholar] [CrossRef]
- Costas Comesaña, R. Análisis Bibliométrico de la Actividad Científica de los Investigadores del CSIC en tres Áreas, Biología y Biomedicina, Ciencia de los Materiales y Recursos Naturales: Una Aproximación Metodológica a Nivel Micro (Web of Science); Universidad Carlos III de Madrid: Madrid, Spain, 2008. [Google Scholar]
- Mongeon, P.; Paul-Hus, A. The journal coverage of Web of Science and Scopus: A comparative analysis. Scientometrics 2016, 106, 213–228. [Google Scholar] [CrossRef]
- Norris, M.; Oppenheim, C. Comparing alternatives to the Web of Science for coverage of the social sciences’ literature. J. Informetr. 2007, 1, 161–169. [Google Scholar] [CrossRef]
- Álvarez-García, J.; Maldonado-Erazo, C.P.; del Río-Rama, M.C. Green Consumerism Study of Academic Publications in Scientific Journals indexed in Web of Science and Scopus. In Green Consumerism Perspectives, Sustainability, and Behavior, 1st ed.; Apple Academic Press, Inc.: Cambridge, MA, USA, 2018; pp. 41–66. [Google Scholar]
- Frank, M. Access to the Scientific Literature: A Difficult Balance. New Engl. J. Med. 2006, 354, 1552–1555. [Google Scholar] [CrossRef] [PubMed]
- Briones-Bitar, J.; Carrión-Mero, P.; Montalván-Burbano, N.; Morante-Carballo, F. Rockfall Research: A Bibliometric Analysis and Future Trends. Geosciences 2020, 10, 403. [Google Scholar] [CrossRef]
- Rojas, L. Por qué publicar artículos científicos? Rev. Orb. 2008, 10, 120–137. [Google Scholar]
- Zupic, I.; Čater, T. Bibliometric Methods in Management and Organization. Organ. Res. Methods 2015, 18, 429–472. [Google Scholar] [CrossRef]
- Perianes-Rodriguez, A.; Waltman, L.; van Eck, N.J. Constructing bibliometric networks: A comparison between full and fractional counting. J. Informetr. 2016, 10, 1178–1195. [Google Scholar] [CrossRef] [Green Version]
- Van Eck, N.J.; Waltman, L. Software survey: VOSviewer, a computer program for bibliometric mapping. Scientometrics 2010, 84, 523–538. [Google Scholar] [CrossRef] [Green Version]
- Van Eck, N.J.; Nees, J.; Waltman, L. How to normalize cooccurrence data? An analysis of some well-known similarity measures. J. Am. Soc. Inf. Sci. Technol. 2009, 60, 1635–1651. [Google Scholar]
- Van Eck, N.J.; Nees, J.; Waltman, L.; Dekker, R.; van den Berg, J. A comparison of two techniques for bibliometric mapping: Multidimensional scaling and VOS. J. Am. Soc. Inf. Sci. Technol. 2010, 61, 2405–2416. [Google Scholar] [CrossRef] [Green Version]
- Van Eck, N.J.; Waltman, L. Text mining and visualization using VOSviewer. Issi. Newsl. 2011, 7, 50–54. [Google Scholar]
- Van Eck, N.J.; Waltman, L. Visualizing Bibliometric Networks. In Measuring Scholarly Impact; Springer: London, UK, 2014; pp. 285–320. [Google Scholar]
- Álvarez-García, J.; Maldonado-Erazo, C.P.; Del Río-Rama, D.M.; Castellano-Álvarez, J.F. Cultural Heritage and Tourism Basis for Regional Development: Mapping of Scientific Coverage. Sustainability 2019, 11, 6034. [Google Scholar]
- Gavel, Y.; Iselid, L. Web of Science and Scopus: A journal title overlap study. Online Inf. Rev. 2008, 32, 8–21. [Google Scholar]
- Pulgarín, A.; Escalona, M. Medidas del solapamiento en tres bases de datos con información sobre ingeniería. An. De Doc. 2008, 10, 335–344. [Google Scholar]
- Costas, R.; Moreno, L.; Bordons, M. Solapamiento y singularidad de MEDLINE, WoS e IME para el análisis de la actividad científica de una región en Ciencias de la Salud. Revista Española de Documentación Científica 2008, 31, 327–343. [Google Scholar]
- Gluck, M. A review of journal coverage overlap with an extension to the definition of overlap. J. Am. Soc. Inf. Sci. 1990, 41, 43–60. [Google Scholar] [CrossRef]
- Bearman, T.; Kunberger, W. A Study of Coverage Overlap among Fourteen Major Science and Technology Abstracting and Indexing Services; National Federation of Abstracting and Indexing Services: Philadelphia, PA, USA, 1977. [Google Scholar]
- Garrigos-Simon, F.J.; Narangajavana-Kaosiri, Y.; Narangajavana, Y. Quality in tourism literature: A bibliometric review. Sustainability 2019, 11, 3859. [Google Scholar] [CrossRef] [Green Version]
- Merigó, J.M.; Rocafort, A.; Aznar-Alarcón, J.P. Bibliometric overview of business & economics research. J. Bus. Econ. Manag. 2016, 17, 397–413. [Google Scholar]
- Seguí-Amortegui, L.; Clemente-Almendros, J.A.; Medina, R.; Grueso Gala, M. Sustainability and Competitiveness in the Tourism Industry and Tourist Destinations: A Bibliometric Study. Sustainability 2019, 11, 6351. [Google Scholar] [CrossRef] [Green Version]
- Koseoglu, M.A.; Rahimi, R.; Okumus, F.; Liu, J. Bibliometric studies in tourism. Ann. Tour. Res. 2016, 61, 180–198. [Google Scholar] [CrossRef]
- Hubert, J.J. General Bibliometric Models; Library Trends, Johns Hopkins University Press: Baltimore, MD, USA, 1981. [Google Scholar]
- Benckendorff, P.; Zehrer, A. A network analysis of tourism research. Ann. Tour. Res. 2013, 43, 121–149. [Google Scholar] [CrossRef]
- Hall, C.M. Publish and perish? Bibliometric analysis, journal ranking and the assessment of research quality in tourism. Tour. Manag. 2011, 32, 16–27. [Google Scholar] [CrossRef]
- Leydesdorff, L.; Vaughan, L. Co-occurrence matrices and their applications in information science: Extending ACA to the Web environment. J. Am. Soc. Inf. Sci. Technol. 2006, 57, 1616–1628. [Google Scholar] [CrossRef] [Green Version]
- Ronda-Pupo, G.A.; Guerras-Martin, L.Á. Dynamics of the evolution of the strategy concept 1962–2008: A co-word analysis. Strateg. Manag. J. 2012, 33, 162–188. [Google Scholar] [CrossRef]
- Boyack, K.W.; Klavans, R. Co-citation analysis, bibliographic coupling, and direct citation: Which citation approach represents the research front most accurately? J. Am. Soc. Inf. Sci. Technol. 2010, 61, 2389–2404. [Google Scholar] [CrossRef]
- Chen, X.; Chen, J.; Wu, D.; Xie, Y.; Li, J. Mapping the Research Trends by Co-word Analysis Based on Keywords from Funded Project. Procedia Comput. Sci. 2016, 91, 547–555. [Google Scholar] [CrossRef] [Green Version]
- Hallinger, P.; Suriyankietkaew, S. Science Mapping of the Knowledge Base on Sustainable Leadership, 1990–2018. Sustainability 2018, 10, 4846. [Google Scholar] [CrossRef] [Green Version]
- Klavans, R.; Boyack, K.W. Which Type of Citation Analysis Generates the Most Accurate Taxonomy of Scientific and Technical Knowledge? J. Assoc. Inf. Sci. Technol. 2017, 68, 984–998. [Google Scholar] [CrossRef]
- Yoopetch, C.; Nimsai, S. Science Mapping the Knowledge Base on Sustainable Tourism Development, 1990–2018. Sustainability 2019, 11, 3631. [Google Scholar] [CrossRef] [Green Version]
- Del Río-Rama, M.; Maldonado-Erazo, C.P.; Álvarez-García, J. Cultural and Natural Resources in Tourism Island: Bibliometric Mapping. Sustainability 2020, 12, 724. [Google Scholar] [CrossRef] [Green Version]
- Yang, Y.; Wu, M.; Cui, L. Integration of three visualization methods based on co-word analysis. Scientometrics 2012, 90, 659–673. [Google Scholar] [CrossRef]
- Zong, Q.J.; Shen, H.Z.; Yuan, Q.J.; Hu, X.W.; Hou, Z.P.; Deng, S.G. Doctoral dissertations of Library and Information Science in China: A co-word analysis. Scientometrics 2013, 94, 781–799. [Google Scholar] [CrossRef]
- Rowland, M.J. Accelerated Climate Change and Australia’s Cultural Heritage. Aust. J. Environ. Manag. 1999, 6, 109–118. [Google Scholar] [CrossRef]
- Terrill, G. Climate Change: How Should the World Heritage Convention Respond? Int. J. Herit. Stud. 2008, 14, 388–404. [Google Scholar] [CrossRef]
- Price, D.J. The exponential curve of science. Discovery 1956, 17, 240–243. [Google Scholar]
- Merigó, J.M.; Mas-Tur, A.; Roig-Tierno, N.; Ribeiro-Soriano, D. A bibliometric overview of the Journal of Business Research between 1973 and 2014. J. Bus. Res. 2015, 68, 2645–2653. [Google Scholar] [CrossRef]
- Hambrecht, G.; Rockman, M. International approaches to climate change and cultural heritage. Am. Antiq. 2017, 82, 627–641. [Google Scholar] [CrossRef] [Green Version]
- Blankholm, H.P. Long-Term Research and Cultural Resource Management Strategies in Light of Climate Change and Human Impact. Arct. Anthropol. 2009, 46, 17–24. [Google Scholar] [CrossRef]
- Bradford, S.C. Sources of information on specific subjects. Engineering 1934, 137, 85–86. [Google Scholar]
- Gössling, S.; Scott, D.; Hall, C.M.; Ceron, J.P.; Dubois, G. Consumer behaviour and demand response of tourists to climate change. Ann. Tour. Res. 2012, 39, 36–58. [Google Scholar] [CrossRef]
- Hall, C.M. Heritage, heritage tourism and climate change. J. Herit. Tour. 2016, 11, 1–9. [Google Scholar] [CrossRef]
- Groulx, M.; Lemieux, C.; Lewis, J.; Brown, S. Understanding consumer behaviour and adaptation planning responses to climate-driven environmental change in Canada’s parks and protected areas: A climate futurescapes approach. J. Environ. Plan. Manag. 2016, 60, 1–20. [Google Scholar] [CrossRef]
- Hall, C.M.; James, M.; Baird, T. Forests and trees as charismatic mega-flora: Implications for heritage tourism and conservation. J. Herit. Tour. 2011, 6, 309–323. [Google Scholar] [CrossRef]
- Bertolin, C.; Camuffo, D.; Leissner, J.; Antretter, F.; Winkler, M.; Van Schijndel, A.W.M.; Schellen, H.L.; Kotova, L.; Mikolajewicz, U.; Brostrom, T.; et al. Results of the EU project Climate for Culture: Future climate-induced risks to historic buildings and their interiors. Sisc. Conf. 2014, 923–943. [Google Scholar]
- Jacob, D.; Elizalde, A.; Haensler, A.; Hagemann, S.; Kumar, P.; Podzun, R.; Rechid, D.; Remedio, A.R.; Saeed, F.; Sieck, K.; et al. Assessing the Transferability of the Regional Climate Model REMO to Different Coordinated Regional Climate Downscaling Experiment (CORDEX) Regions. Atmosphere 2012, 3, 181–199. [Google Scholar] [CrossRef] [Green Version]
- Leissner, J.; Kilian, R.; Kotova, L.; Jacob, D.; Mikolajewicz, U.; Broström, T.; Ashley-Smith, J.; Schellen, H.L.; Martens, M.; Van Schijndel, J.; et al. Climate for Culture: Assessing the impact of climate change on the future indoor climate in historic buildings using simulations. Herit. Sci. 2015, 3, 1–15. [Google Scholar] [CrossRef]
- Herrera-Franco, G.; Montalván-Burbano, N.; Carrión-Mero, P.; Apolo-Masache, B.; Jaya-Montalvo, M. Research Trends in Geotourism: A Bibliometric Analysis Using the Scopus Database. Geosciences 2020, 10, 379. [Google Scholar] [CrossRef]


| Data Base | Equation |
|---|---|
| Scopus | (TITLE (“climat * chang * ”OR” climat * effect * ”OR”climat * varia * “ OR ”global climat * “ OR ”climat * warn * “) ANDTITLE (“cultural resource * “OR” cultural heritage * “ OR ”heritage * site”OR”urban heritage * “ OR ”artistic * heritage * “ OR ”monument * heritage * “ OR ”historic * heritage * “ OR ”historic * preservat * “ OR ”heritage * conservat * “ OR ”world heritage * “ OR ”natural heritage * “ OR ” coastal heritg * “ OR ”natural site” OR ”natural reserve * “)) AND (EXCLUDE (PUBYEAR, 2020)) AND (LIMIT-O (LANGUAGE, “English”)) |
| WoS | TITLE:(“climat * chang * “ OR “ climat* effect * “ OR “climat * varia * “ OR “global climat * “ OR “climat * warn * “) ANDTITLE: (“cultural resource * “ OR “cultural heritage * “ OR “heritage * site” OR “urban heritage * “ OR “artistic * heritage * “ OR “monument * heritage * “ OR “historic * heritage * “ OR “historic * preservat * “ OR “heritage * conservat * “ OR “world heritage * “ OR “natural heritage * “ OR “coastal heritg * “ OR “natural site” OR “natural reserve * “) Refined by: LANGUAGE: (ENGLISH) |
| Distribution. | Cites Scopus | % | Cites WoS | % |
|---|---|---|---|---|
| Less than 1 | 9 | 20.00 | 8 | 24.00 |
| 1–25 | 35 | 78.00 | 25 | 76.00 |
| 26–50 | 1 | 2.00 | 0 | 0.00 |
| 45 | 100.00 | 33 | 100.00 |
| R | Authors | Year | Scopus | WoS | Main Results | ||
|---|---|---|---|---|---|---|---|
| C | C/Y | C | C/Y | ||||
| 1 | Fatorić and Seekamp Are cultural heritage and resources threatened by climate change? A systematic literature review | 2017 [25] | 31 | 15.50 | - | - | High theoretical production Limitation of study areas worldwide Limited production on the benefits of adaptation to CC |
| 2 | Phillips The capacity to adapt to climate change at heritage sites-The development of a conceptual framework | 2015 [11] | 23 | 5.75 | - | - | Determine a conceptual framework for understanding adaptive capacity There is a significant gap in the knowledge of adaptation to climate change and the management of cultural heritage |
| 3 | Hambrecht and Rockman International Approaches to Climate Change and Cultural Heritage | 2017 [72] | 21 | 10.50 | - | - | Theoretical analysis of response experiences to CC with respect to cultural and archaeological heritage It proposes the development of joint efforts to face CC threats supported by the exchange of experiences, increased interaction with visitors and other audiences, generation of local management tools and allocation of resources from different areas for study. |
| 4 | Blankholm Long-Term Research and Cultural Resource Management Strategies in Light of Climate Change and Human Impact | 2009 [73] | 21 | 2.10 | 18 | 1.80 | Deficiency in the adaptation of archaeological research to CC Generation and strengthening of the legal basis for CC mitigation in polar zones |
| 5 | Perry World Heritage hot spots: a global model identifies the 16 natural heritage properties on the World Heritage List most at risk from climate change | 2011 [10] | 20 | 2.50 | 14 | 1.75 | It develops the World Heritage Vulnerability Index (WHVI), as a tool for making informed decisions about natural or mixed heritage. Identifies adaptation strategies and steps to proactively adapt to climate change in 16 natural heritage properties on the World Heritage List that are most at risk. |
| 6 | Terrill Climate Change: How Should the World Heritage Convention Respond? | 2008 [69] | 14 | 1.27 | 10 | 0.90 | It argues that CC is not by itself the only element causing the degradation of heritage. Identify the need to develop CC adaptation plans, with short-term actions. |
| 7 | Forino, et al. A proposed assessment index for climate change-related risk for cultural heritage protection in Newcastle (Australia) | 2016 [3] | 13 | 4.33 | 11 | 3.66 | Develops the Cultural Heritage Risk Index (CHRI). Make a first approach to exploring the relationships between risks linked to climate change and cultural heritage. |
| 8 | Haugen and Mattsson Preparations for climate change’s influences on cultural heritage | 2011 [6] | 16 | 2.00 | 12 | 1.50 | Development of a methodology to address the problem of CC and cultural heritage through the use of digital media, details content that increases the knowledge of owners and responsible authorities so that they can prepare for climate change on a practical level. |
| R | Country | Scopus ∪ WoS | Cites Scopus | Cites WoS | ||||||||
|---|---|---|---|---|---|---|---|---|---|---|---|---|
| C | A | As | f | hi% | TC | h-Index | f | hi% | TC | h-Index | ||
| 1 | United States | 17 | 22 | 25 | 24 | 18.60 | 144 | 6 | 18 | 17.14 | 35 | 4 |
| 2 | Australia | 13 | 19 | 20 | 22 | 17.05 | 13 | 6 | 16 | 15.24 | 45 | 4 |
| 3 | United Kingdom | 8 | 11 | 12 | 11 | 8.53 | 55 | 5 | 6 | 5.71 | 23 | 3 |
| 4 | Norway | 7 | 8 | 8 | 8 | 6.20 | 77 | 6 | 8 | 7.62 | 56 | 4 |
| 5 | Canada | 5 | 8 | 11 | 11 | 8.53 | 12 | 3 | 11 | 10.48 | 12 | 3 |
| 6 | Italy | 5 | 10 | 10 | 10 | 7.75 | 17 | 3 | 9 | 8.57 | 6 | 2 |
| 7 | New Zealand | 3 | 6 | 6 | 6 | 4.65 | 18 | 2 | 6 | 5.71 | 12 | 2 |
| 8 | Finland | 2 | 3 | 3 | 3 | 2.33 | 16 | 2 | 3 | 2.86 | 10 | 2 |
| 9 | France | 2 | 2 | 2 | 2 | 1.55 | 10 | 2 | 1 | 0.95 | 3 | 1 |
| 10 | Germany | 2 | 3 | 3 | 3 | 2.33 | 9 | 1 | 3 | 2.86 | 7 | 1 |
| 11 | Greece | 2 | 5 | 5 | 5 | 3.88 | 0 | 0 | 5 | 4.76 | 0 | 0 |
| 12 | Israel | 2 | 3 | 3 | 3 | 2.33 | 16 | 2 | 1 | 0.95 | 8 | 1 |
| 13 | Japan | 2 | 2 | 2 | 2 | 1.55 | 10 | 2 | 2 | 1.90 | 8 | 2 |
| 14 | Portugal | 2 | 4 | 4 | 4 | 3.10 | 0 | 0 | 4 | 3.81 | 0 | 0 |
| 15 | South Africa | 2 | 2 | 3 | 3 | 2.33 | 14 | 1 | 1 | 0.95 | 8 | 1 |
| 16 | Austria | 1 | 2 | 2 | 2 | 1.55 | 0 | 0 | 2 | 1.90 | 0 | 0 |
| 17 | China | 1 | 1 | 1 | 1 | 0.78 | 1 | 1 | 1 | 0.95 | 1 | 1 |
| 18 | Croatia | 1 | 3 | 3 | 3 | 2.33 | 7 | 1 | 3 | 2.86 | 7 | 1 |
| 19 | Cyprus | 1 | 1 | 1 | 1 | 0.78 | 0 | 0 | 1 | 0.95 | 0 | 0 |
| 20 | Iceland | 1 | 1 | 1 | 1 | 0.78 | 3 | 1 | 1 | 0.95 | 2 | 1 |
| 21 | Netherlands | 1 | 1 | 3 | 3 | 2.33 | 1 | 1 | 2 | 1.90 | 4 | 1 |
| 22 | Sweden | 1 | 1 | 1 | 1 | 0.78 | 14 | 1 | 1 | 0.95 | 8 | 1 |
| R | Institution | Country | Scopus ∪ WoS | |
|---|---|---|---|---|
| A | As | |||
| 1 | Italian National Research Council | Italy | 4 | 4 |
| 2 | Department of Primary Industries, Parks, Water and Environment | Australia | 3 | 3 |
| 3 | IMS–FORTH (Institute for Mediterranean Studies–Foundation for Research and Technology) | Greece | 3 | 3 |
| 4 | The University of Queensland | Australia | 3 | 3 |
| 5 | Universidade NOVA de Lisboa | Portugal | 3 | 3 |
| 6 | University of Camerino | Italy | 3 | 3 |
| 7 | University of Newcastle | Australia | 3 | 3 |
| 8 | University of Otago | New Zealand | 3 | 3 |
| 9 | University of Ottawa | Canada | 3 | 4 |
| 10 | University of the West of Scotland | United Kingdom | 3 | 3 |
| 11 | University of Zagreb | Croatia | 3 | 3 |
| R | Title | Country | f | hi% | Scopus | WoS | ||||||||
|---|---|---|---|---|---|---|---|---|---|---|---|---|---|---|
| f | TC | h-Index | Q | SJR | f | TC | h-Index | Q | JCR | |||||
| 1 | Geosciences (Switzerland) | Switzerland | 4 | 8.51 | 4 | 18 | 14 | 2 | 0.39 | 4 | 14 | 16 | 0 | 0 |
| 2 | Land Use Policy | Netherlands | 2 | 4.26 | 2 | 7 | 93 | 1 | 1.41 | 2 | 4 | 99 | 1 | 3.57 |
| 3 | Journal of Cultural Heritage | France | 2 | 4.26 | 2 | 10 | 53 | 1 | 0.61 | 2 | 8 | 56 | 3 | 1.95 |
| 4 | International Journal of Heritage Studies | United Kingdom | 2 | 4.26 | 2 | 34 | 36 | 1 | 0.48 | 2 | 24 | 30 | 2 | 1.36 |
| 5 | Australasian Journal of Environmental Management | United Kingdom | 2 | 4.26 | 2 | 9 | 19 | 2 | 0.43 | 1 | 0 | 17 | 4 | 1.19 |
| 6 | African Journal of Hospitality, Tourism and Leisure | South Africa | 2 | 4.26 | 2 | 0 | 3 | 4 | 0.14 | - | -- | -- | -- | -- |
Publisher’s Note: MDPI stays neutral with regard to jurisdictional claims in published maps and institutional affiliations. |
© 2021 by the authors. Licensee MDPI, Basel, Switzerland. This article is an open access article distributed under the terms and conditions of the Creative Commons Attribution (CC BY) license (http://creativecommons.org/licenses/by/4.0/).
Share and Cite
Maldonado-Erazo, C.P.; Álvarez-García, J.; Río-Rama, M.d.l.C.d.; Durán-Sánchez, A. Scientific Mapping on the Impact of Climate Change on Cultural and Natural Heritage: A Systematic Scientometric Analysis. Land 2021, 10, 76. https://0-doi-org.brum.beds.ac.uk/10.3390/land10010076
Maldonado-Erazo CP, Álvarez-García J, Río-Rama MdlCd, Durán-Sánchez A. Scientific Mapping on the Impact of Climate Change on Cultural and Natural Heritage: A Systematic Scientometric Analysis. Land. 2021; 10(1):76. https://0-doi-org.brum.beds.ac.uk/10.3390/land10010076
Chicago/Turabian StyleMaldonado-Erazo, Claudia Patricia, José Álvarez-García, María de la Cruz del Río-Rama, and Amador Durán-Sánchez. 2021. "Scientific Mapping on the Impact of Climate Change on Cultural and Natural Heritage: A Systematic Scientometric Analysis" Land 10, no. 1: 76. https://0-doi-org.brum.beds.ac.uk/10.3390/land10010076