Tightly Coupling Input Output Economics with Spatio-Temporal Land Use in a Dynamic Planning Support System Framework


1
Department of Information Science, University of Illinois at Urbana-Champaign, Champaign County, IL 61820, USA
2
Department of Landscape Architecture, University of Illinois at Urbana-Champaign, Champaign County, IL 61820, USA
3
School of Architecture, University of Illinois at Urbana-Champaign, Champaign County, IL 61820, USA
*
Author to whom correspondence should be addressed.
Land 2021, 10(1), 78; https://0-doi-org.brum.beds.ac.uk/10.3390/land10010078
Submission received: 16 December 2020
/
Revised: 13 January 2021
/
Accepted: 13 January 2021
/
Published: 16 January 2021
(This article belongs to the Section Land Planning and Landscape Architecture)
Abstract
:Planning support systems (PSSs) should generally be designed to promote the participation of stakeholders in planning and design processes through the delivery of useful, localized information, an ability to collect feedback, and an ability to model and test various ‘what-if’ scenarios. This paper focuses on such a PSS tool. The tool integrates the Land-use Evolution and Assessment Model (LEAM) with a Regional Economic Input-Output Model (REIM) in a tightly coupled computational process made accessible to stakeholders through a web-based PSS. The integrated tool allows for users to easily navigate the models and test land use and economic scenarios without expert assistance. It also keeps simulations updated with dynamic inputs and engages users in PSS development and application through responsive feedback to enhance plan-making abilities. In this paper, we demonstrate an application of the LEAM-REIM PSS in Sangamon County, Illinois. The application demonstrates an ability to provide more efficacious and detailed land use estimations through the connection of economic and land-use models, allowing users to easily engage with, navigate, and respond to scenario tests. We discuss the PSS tool, model integration approach, and detailed application to assess its usefulness in urban planning and design. We also propose some opportunities for further research.
1. Introduction
The coupling of land-use models with other simulation environments (e.g., transportation models, hydrological models) to forecast and inform planning strategies and policies has been well investigated in previous literature [1,2]. To date, the coupling of such models has shown an improved ability to simulate changes in the urban fabric more reliably when compared to singular, un-coupled models [3]. This paper draws on these examples to propose a planning support system (PSS) that couples regional land-use and economic models to produce integrated simulations that assess and estimate the economic consequences of land-use decisions.
Many PSSs are spatial, data-driven tools designed to enhance urban development and planning decisions through their ability to measure, scenario test, and visualize outcomes [4]. The use of these types of tools allows urban planners to analyze complex urban problems from a systems perspective, identify potential issues of concern, and help planners respond to such problems with targeted strategies in a data-driven and intuitive way. Some of these systems utilize user-friendly interfaces that are designed to enable non-technical users (urban planners) to navigate analysis and evaluate complex urban planning and investment issues; independent of support from technical experts [5]. Historically, these systems utilize some form of geographical information system (GIS) to analyze and visualize spatial data, especially as such data relates to transportation management and scenario planning [6,7].
In recent years, advances in computational technologies, spatial analytic methods, and software technologies have enabled a new vision for PSSs that are capable of performing far more complex modeling and simulation tasks in far less time [8]. This new wave of PSSs will have the capacity to deal with big and varied (spatial and socio-economic) data sets from a wide variety of sources [9]. This is becoming critical as the breadth, depth, and availability of big data is making it difficult to analyze and make sense of it without advanced computer modeling capabilities. A PSS, by nature, helps to bridge the gap between impenetrably esoteric data, highly advanced computational technologies, and planners seeking relevant (and contextually applied) information [9]. PSSs, which are able to utilize and make sense of multiple, large data sets using multiple models and methodologies rather than single models based on single data types, offer even more clarity to planners.
From the literature, Ababaei et al. [10] demonstrated the value of coupling large, complex models through their work developing a PSS that combines climate and hydrological models with agricultural production and economic models to develop strategies to combat climate change [10]. The work helped decision-makers develop an optimal scenario balancing the competing objectives of economic income, employment opportunities, and water consumption. Simulation results suggested effective policy solutions to help the area maintain its fecundity and associated economic benefits, while reducing overall water use. This offers an example of how a PSS can help planners simultaneously consider a wide set of biophysical and socio-economic variables into the process of planning. URBIUS, a special decision support system specifically designed to foster sustainable urban renewal projects, is another example of the efficaciousness of such coupled systems. It was developed in Switzerland to help assist in the analysis of urban redevelopment at a neighborhood scale [11]. URBIUS provides a framework for coupling a range of environmental, social and ecological modeling environments for the evaluation of development scenarios. Potential development scenarios were evaluated for their ability to meet sustainability objectives. In this case, the PSS proved useful in helping to extract valuable policy-making information from erudite data.
Since urban systems are intrinsically complex, urban planners are forced to work within a set of existing confines defined by geographical, geological, biological, economic, cultural, social, and human factors (collectively referred to as “context” in planning parlance). A failure to understand and adapt to context is a common failure for planning endeavors [12,13]. A sophisticated PSS can enhance the understanding of the demands of a given location at a specific time, helping planners more completely treat the contexts in which they work [9]. Ideally, such PSSs should be flexible and responsive to changing environments, and continuously integrate updated data [9]. Such flexible and dynamic PSSs would reflect the spatial characteristics of a location (e.g., climate, population trend, economic situation) not only at present but also in the future, and require developers to gear their systems to the interests and capabilities of their end-users [14]. To accomplish this, the user interface should be straightforward and simple, so the tool can be democratically engaged by those without professional knowledge of spatial analysis [9].
Motivated by both the power and limitations of existing PSSs, this paper aims to develop and apply an online, easily navigable, and engaging PSS based on programming-based algorithms. The proposed PSS tightly couples large scale economic and land-use simulation models simultaneously to support land-use change projection, planning scenario testing, and impact assessment. Economic simulation is conducted using a regional economic input-output model (REIM), which uses investment scenario inputs to predict employment and changes in economic output. Land-use change is simulated using a dynamic spatial land-use model, the Land-use Evolution and Assessment Model (LEAM), which was originally developed by an interdisciplinary research team at the University of Illinois with support from the National Science Foundation [15]. The LEAM model treats a wide range of biophysical and socio-economic variables that positively impact urban development (e.g., employment opportunities, public services, green spaces) as “attractors.” The accessibility to attractors is estimated by a gravity model based on road networks, travel times, and the “weight” of these attractors.
Compared with many other PSSs which predict urban development, LEAM has the advantage of calculating accessibility by network, rather than linear distances. This method of calculation allows for a more accurate reflection of actual travel times in complex road (transit, driving, biking or walking) networks [15]. The LEAM model also offers flexible input variables, which makes it well suited to being easily extended and integrated with other models without extensive modification [3]. This study explored the tight coupling of the REIM economic model with the LEAM land-use model within a PSS framework. The resulting LEAM-REIM PSS is designed to support planning decisions by more accurately simulating the complex interactions between land use and economic changes. It seeks to test economic investment and physical planning scenarios by creating and manipulating said scenarios on a web interface. It keeps results consistent with observable data through the use of dynamic, user generated inputs. Finally, the system (output, algorithm, and interface design) is continuously refined based on user feedback.
The remainder of the paper is organized as follows. Section 2 presents the LEAM-REIM PSS framework, model algorithms, and coupling method. Section 3 describes an application of the LEAM-REIM PSS to Sangamon County, Illinois, the outcomes of the application, and a discussion of findings. Section 4 concludes with potential future applications and avenues for future research.
2. Methodology
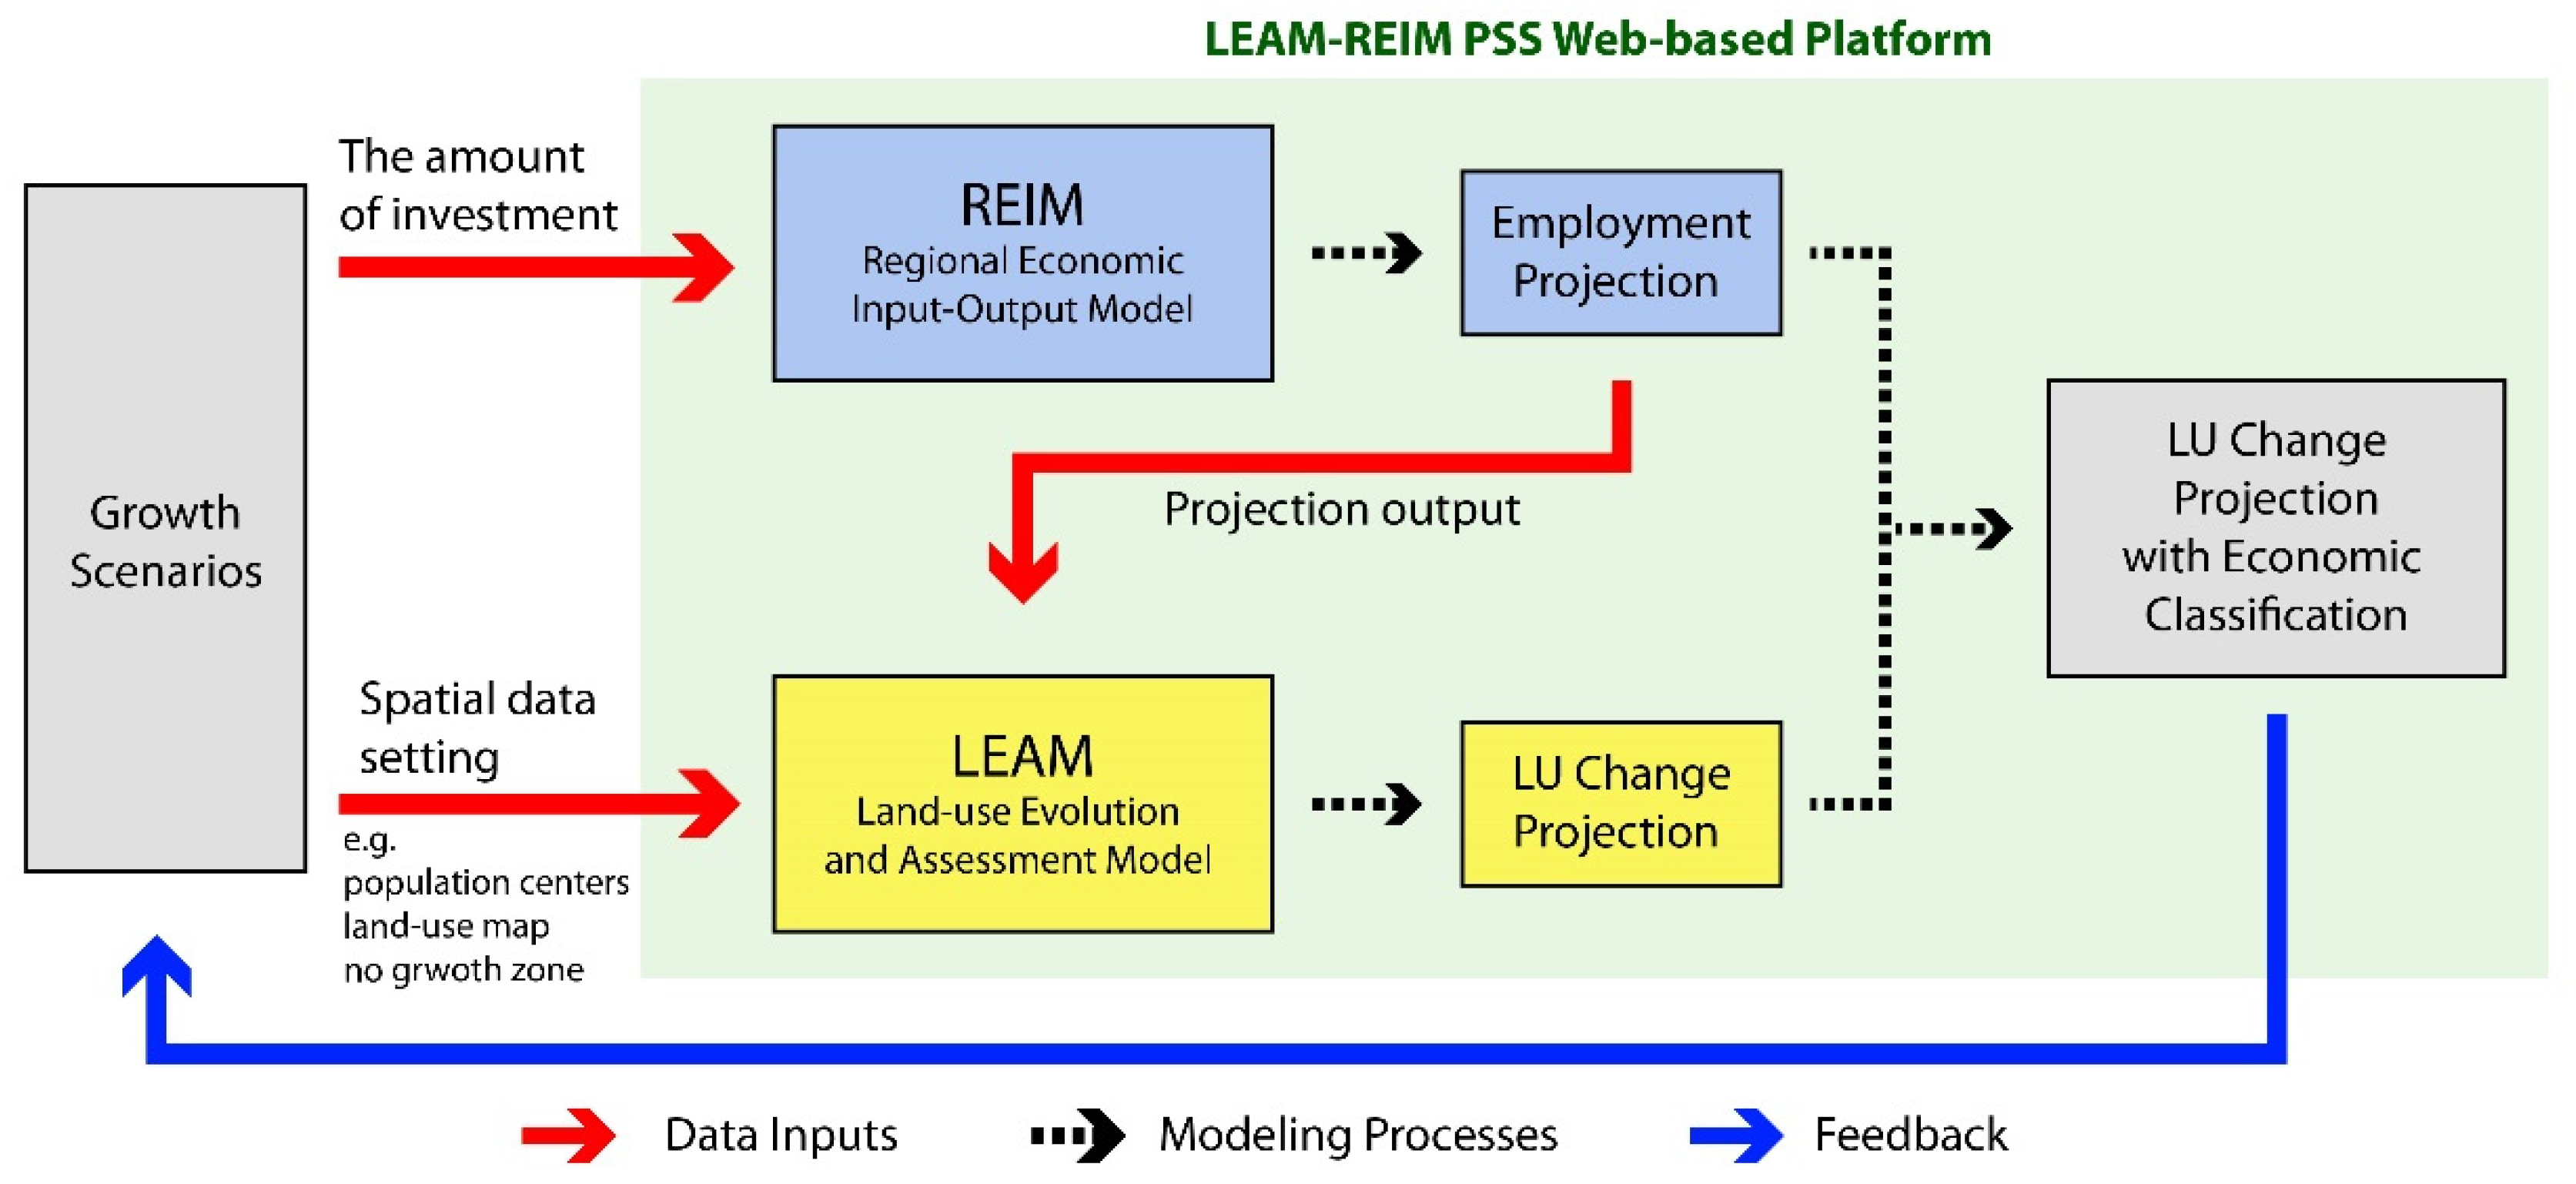
The LEAM-REIM PSS is based on a design which tightly couples the LEAM land-use model, the REIM economic model, and a web interface to allow users to navigate the coupling of the two models. Compared with the coupled models in some previous studies which loosely and manually combined multiple models [3,16], the LEAM-REIM PSS, as an integrated system, does not require human intervention in the coupling process, and thus speeds up the whole analysis and decreases technical requirement for users in application. A schematic of this arrangement is shown in Figure 1. The PSS is accessible through an open-access web address: http://sangamon.leam.illinois.edu/run_model/. The interface found here allows users to test scenarios on the coupled models, visualize the model inputs and outputs, download model result, and provide feedback. The architecture of the LEAM-REIM PSS supports flexibly responding to data updates, different scenario tests, and diverse user requests, achieving the key model objectives of dynamicity and flexibility.
2.1. LEAM
The Land-use Evolution and impact Assessment Model (LEAM) model developed by the University of Illinois is a spatially explicit PSS that aims to assess future impacts of different land-use scenarios, thereby supporting planning decision-makers. The LEAM model algorithm has been explained in greater detail elsewhere [3,9,15]. More briefly, the model can be said to consist of two major parts: (1) a land-use change model defined by a dynamic set of drivers which describe the local causal mechanisms and enable easy addition and removal of variables when testing the alternative scenarios [9]; and (2) impact assessment models that analyze and interpret the land-use changes depending on local interest and applicability to explore the implications of a scenario and evaluate ‘so-what’ questions [3].
LEAM uses a modified cellular automata approach considering socio-economic factors (e.g., administrative boundaries, population density) and environmental factors (e.g., watersheds, landforms). A typical LEAM scenario uses 30 × 30 m cells as a unit to match the resolution of the USGS National Land Cover Database (NCLD). This allows for more general applications across US cities. At a more granular scale, the size of the analytic unit can be adjusted for local urban settings.
In each cell, the probability that the cell will change is decided by both by the global and regional information stored in the model and by the local contexts. Ergo, LEAM simulations not only capture location information, but are also sensitive and responsive to global and regional information, such as economic trends. Each cell’s probability of development (e.g., for residential use or commercial use) is given by Equation (1) below [3]:
where is the developmental probability for land-use cell k at time t; is the function of growth restriction on certain types of lands for the land-use cell k at time step t which considers both zoning restrictions and biophysical factors’ restrictions (undevelopable lands); is the connectivity of the cell k to urban attractor i and is the function of mapping the connectivity value to probability of land use change; is the function that converts number of cells neighboring cell k at time step t − 1 to a probability number.
Adding probability to cells neighboring existing development can result in a more organic growth pattern, and Li et al.’s [17] function of connecting neighboring cells’ number with probability is used in this study [17]. The type of data and method to measure connectivity and the calibration and identification in function is explained in Deal et al.’ study [3]. It is noteworthy that while urban attractors in this study do not dynamically change with time, such attractors can be updated in future studies according to new local or regional planning scenarios, such as newly planned population centers or transportation infrastructure improvements.
The probability that a given cell will change is dependent on local attractors and derived through both analysis and stakeholder interaction. These help to assess “so-what” questions and explain the implications of various scenarios. A key basis for the LEAM framework, therefore, is to attempt to answer both “what-if” and “so-what” questions within the context of the policy-making process.
After calculating the developmental probability of all undeveloped land use cells k at time step t, the model allocates new growth using Equation (2) below:
where represents whether cell k at time step t change to projected land-uses (1 for develop and 0 for not develop); is the density of employment in each land use cell; and is the total growth demand at time step t specified by the official planning documents and information for each city. LEAM generates sequential land use maps over a specified planning horizon, and these outputs can be used as inputs to the impact assessment models that analyze long-term development impacts.
The LEAM framework’s hierarchical structure enables it to easily combine with multiple scaled models and integrate into a new single model framework, which has previously allowed LEAM to be integrated with both micro models and regional macro models, such as transportation models [3] and hydrology models [16].
2.2. REIM
This study uses a regional economic model to forecast macroeconomic variables (e.g., employment change) based on investment scenarios. The Regional Economic Input-Output Model (REIM) was extended and improved based on the classical economic input-output model by the Regional Economics Applications Laboratory at the University of Illinois at Urbana-Champaign. This entity considers both the relations between the regional and national economic development as well as the region’s own industrial structure [3]. REIM is designed to reflect the dynamics in the regional economy and enable users to get a better sense of the impacts of policies.
REIM aims to find balanced conditions between the supply and demand of the labor market in the regional economy. However, it must be noted that any exogenous shock (e.g., investment) can cause significant change in the economy, with such changes tending to be dynamically affected by a variety of factors (e.g., immigration, labor force partition rate, overall employment levels). To project the spatiotemporal change in the regional economy, REIM uses an econometric based, vector auto-regression method where output, employment, and income are tightly connected. It estimates the trajectory of labor productivity in each industry (economic sector) and projects that industry’s employment output. For each type of industry, regional employment forecasts serve as input in LEAM and are used to project land-use changes with sectoral classification, as explained in the following section.
2.3. Coupled Model
Within the LEAM-REIM PSS, the LEAM and REIM models are tightly coupled. More specifically, the regional population and employment forecasts within each sectoral classifications are taken from REIM and used as inputs in a LEAM model. Regional economic change is an important driver of land-use development [17]. The amount of economic growth, measured through metrics like employment increase, plays a critical role in determining how much land-use change, which is associated with regional economic change, can be expected to take place in the future. In this sense, one fundamental assumption employed in our coupling process is that the amount of economic grown proportionally affects the total amount of new development over time. In other words, we assume that the employment density of a specific economic sector for one 30 × 30 m land-use grid is a constant value, and that each economic sector has a different density. For example, the density of office workers in a 30 × 30 m cell is larger than the density of agricultural workers in a cell. For the purpose of this paper, this variable is referred to as the “spatial employment density” of a specific grid cell (see Table 1).
Spatial employment density values for this investigation are unique values, derived from the current economic and land-use distribution within the study area.
3. Application
We applied the LEAM-REIM PSS to Sangamon County, Illinois as a demonstration of its potential efficacy. Sangamon County is located in central Illinois, covers an area of 877 square miles (much of it agricultural), and is centered around the Illinois state capitol in Springfield, its largest city. In 2019, the county population was estimated at 194,672, with a fairly even split between urban and rural residents and a generally stable trend over the past decade [18]. In 2018, median household income was $60,466 and per capita income was $34,548 [18]. Urban development is mainly concentrated around Springfield, but includes several smaller outlying towns. The county features natural areas including forests and wetlands, which are primarily located near surface water bodies including rivers and Lake Springfield.
According to the Sangamon County Regional Strategic Plan 2014 [19], the county seeks to preserve its current character defined as villages and small towns. New developments are encouraged to take place at a compact form and near the established communities, where they can leverage existing utilities and public services. Transportation, infrastructure, and green space improvements are planned for better life qualities.
In the longer term, demographic shifts associated with an aging and declining population pose challenges to the county’s economy [19]. In an effort to counteract this decline, the county seeks to maintain a healthy economy by strengthening its most robust economic sectors which include medical and healthcare, government, tourism, and agriculture [19]. Given appropriate funding and policies, net employment within the county is expected to increase by 2040 [19].
In the modeling process, the current commercial land-uses retrieved from the National Land Cover Database (NLCD) were cleaned and classified into the five economic sectors: Agricultural Business, Commercial, Community Facility, Industrial and Utility, and Office. The sectoral classifications were provided by the clients (Sangamon County Regional Planning Committee) as a shapefile dataset at block level. Economic sectors were classified using a 2-digit classification based on the North American Industry Classification System (NAICS) to couple the LEAM outputs with REIM projections.
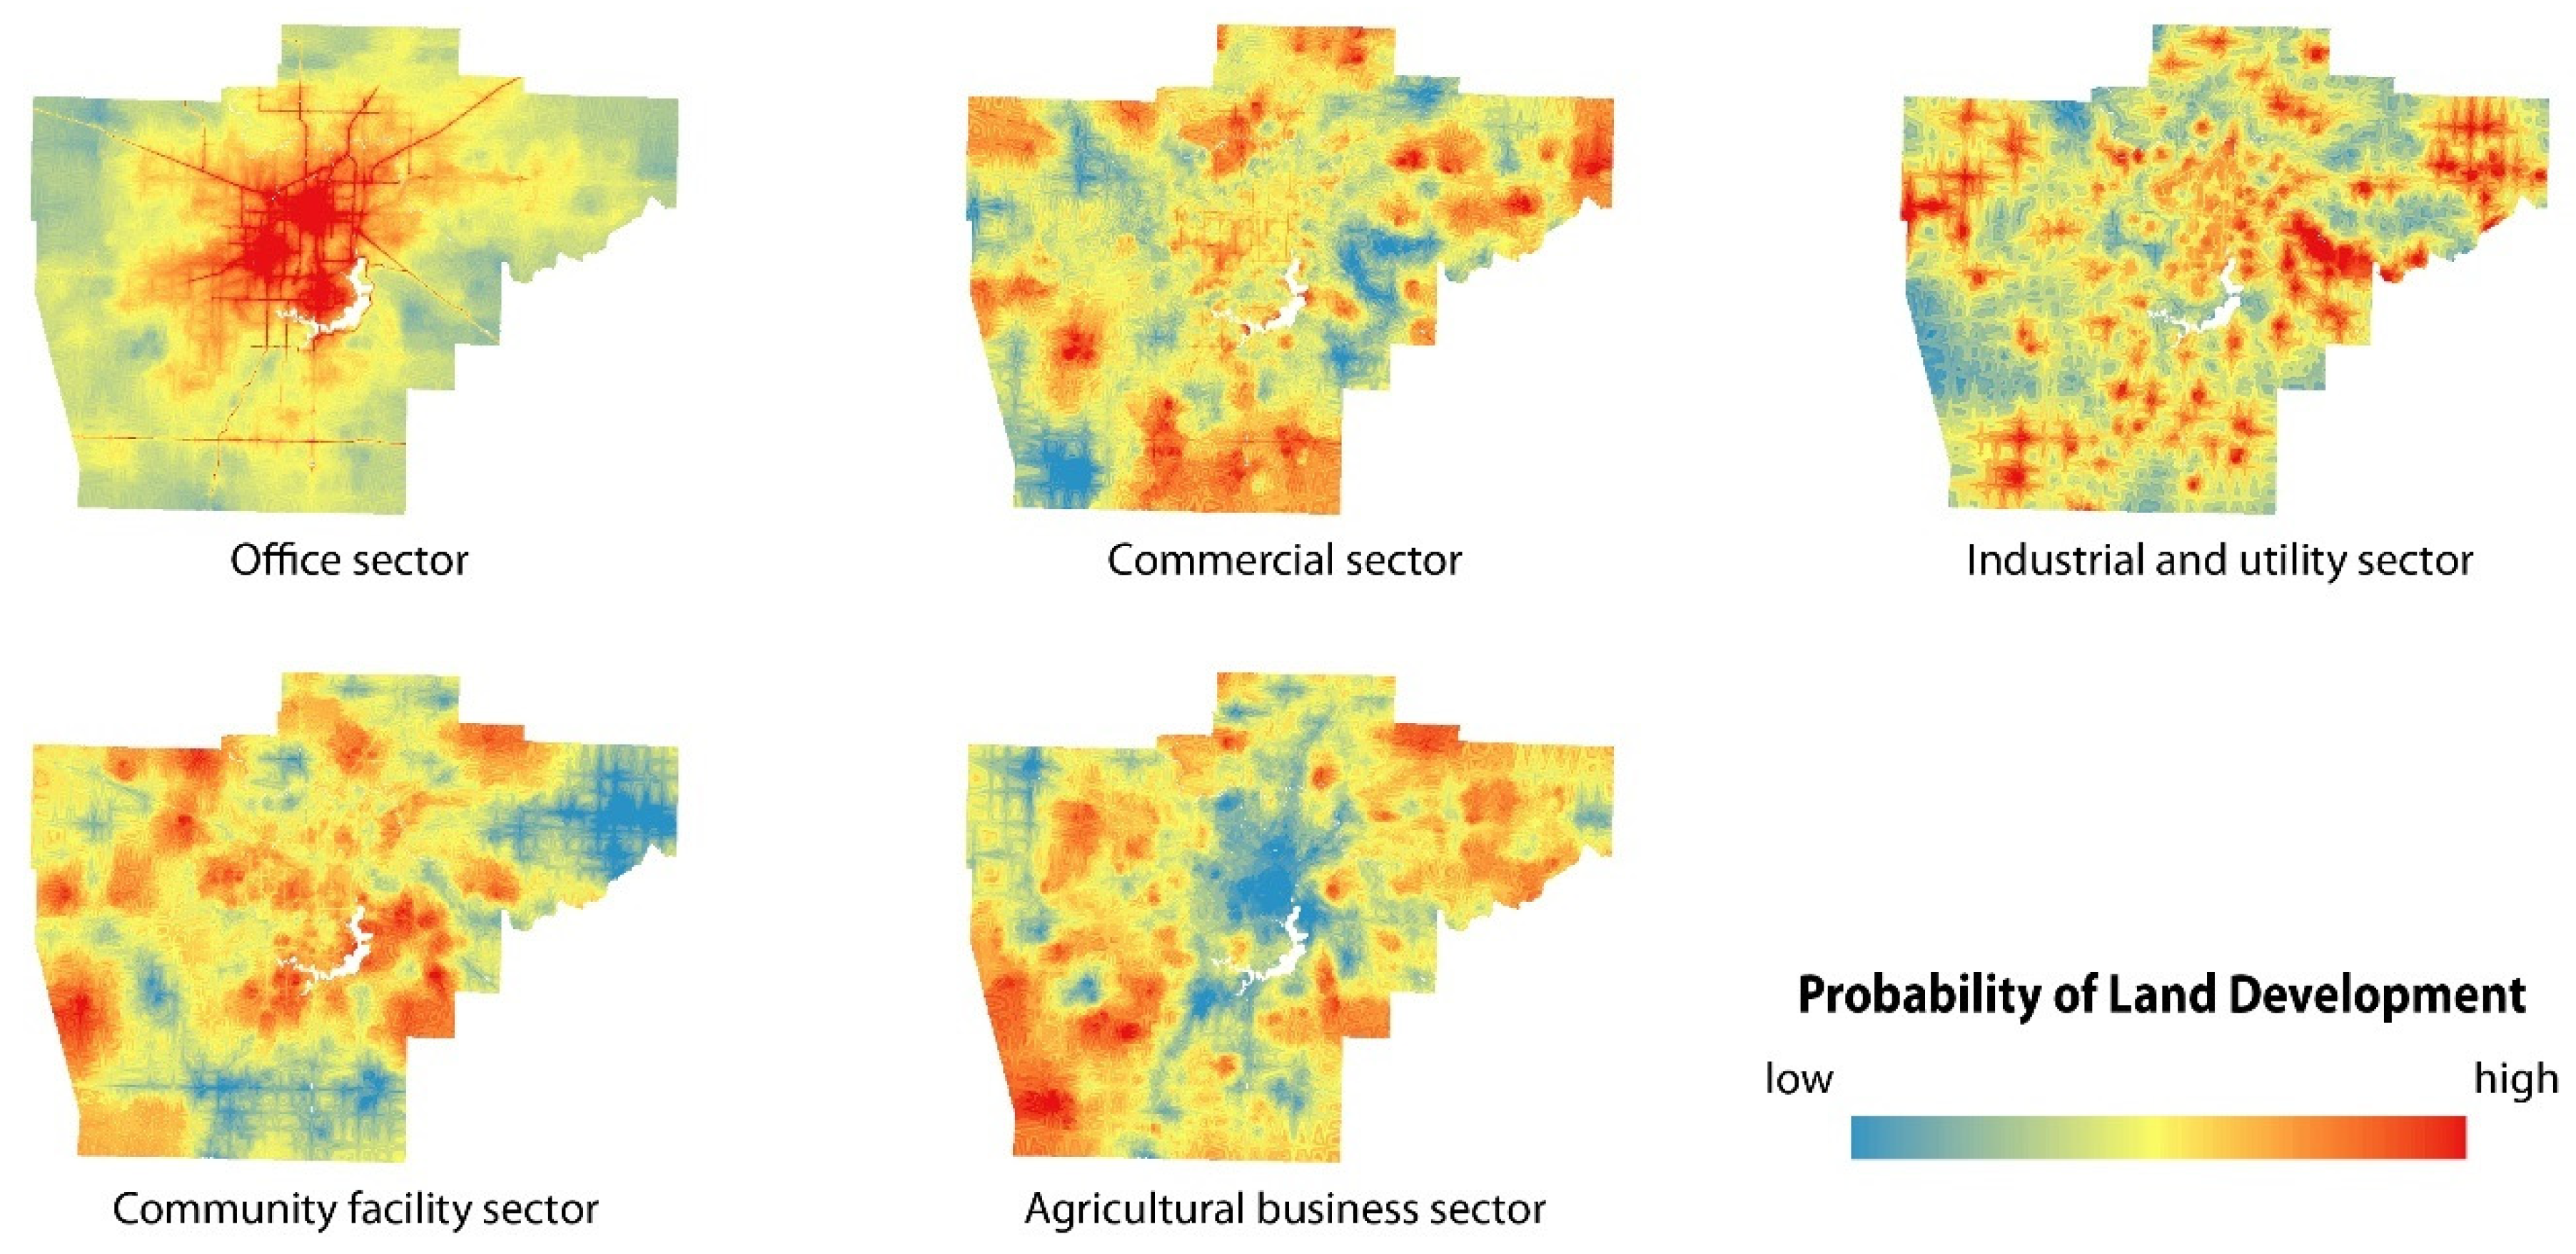
LEAM produced attraction maps, (e.g., population, employment, places of interest (POI), and transportation) to generate probability maps (where development is most likely to occur) for each individual economic sector. Each attraction map was computed using a Stochastic Greedy Algorithm which accounts for network-based accessibility in terms of travel time, so that network congestion can be considered [15]. Each resulting map represents the likely locations of land development for each economic sector in response to economic growth in the study region.
In the probability estimation, we employed a ridge-logistic regression to control for multicollinearity among the predictor variables. This adds a ridge penalty to a logistic regression model to better differentiate the statistical relation between different explanatory variables and the dependent variable. For example, although there might be multicollinearity between population attraction and community facility attraction or between commercial attraction and office attraction, it is not reasonable to remove the input variables from the model since they contain critical regional economic development information. By using a ridge-logistic regression, we attempted reduce prediction bias and improve the overall model accuracy [20].
To determine the explicit locations of land-use change across the economic sectors, we conducted cell-to-cell comparisons across the five probability maps that were fully rasterized and coordinated. More specifically, a probability value at a certain cell in one raster dataset (ranged from 0 to 1) was compared with corresponding cells in the other four datasets. Five maps that represent the development probability of each economic sector, respectively, competed as follows.
where , and represent the cell (i, j)’s probability on a 2-dimensinal lattice plane for Agricultural Business, Commercial, Community Facility, Industrial and Utility, and Office sectors, respectively; and refers to the economic sector determined by this comparison.
In total, 26,794,334 cells were compared, resulting in a sectoral classification of the economic growth probability (Figure 2). The amount of land development (i.e., the number of estimated newly developed land cells) for each sector was computed using the spatial employment densities from REIM (see Table 1). Development locations were selected according to probability values with some stochasticity built into the algorithm to represent urban development uncertainties.
3.1. PSS User Interface
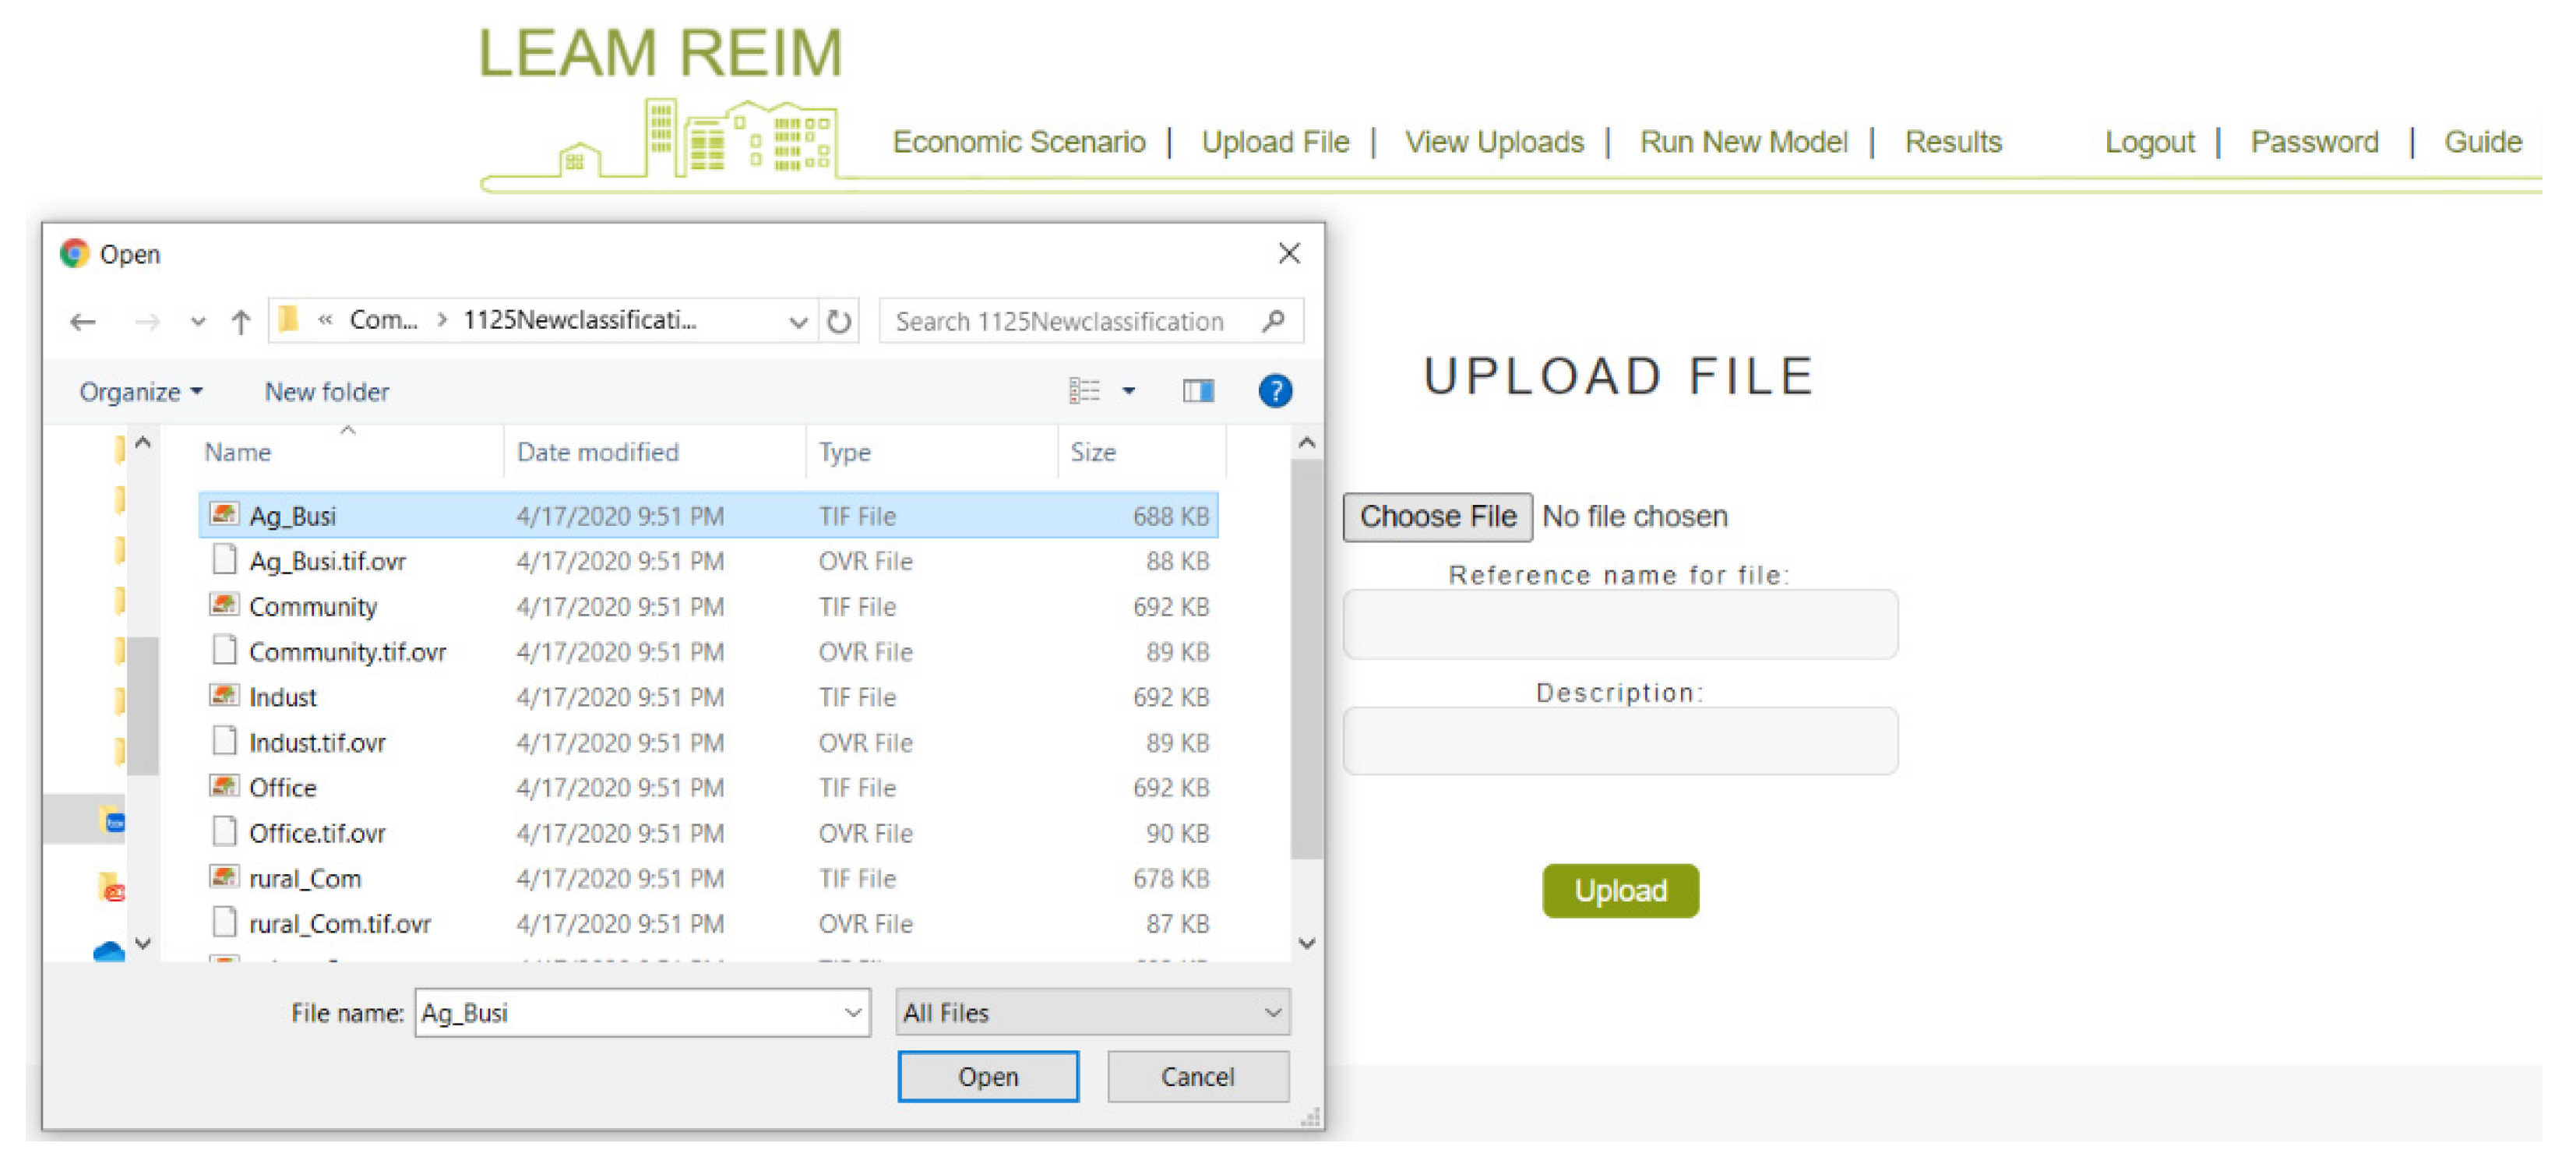
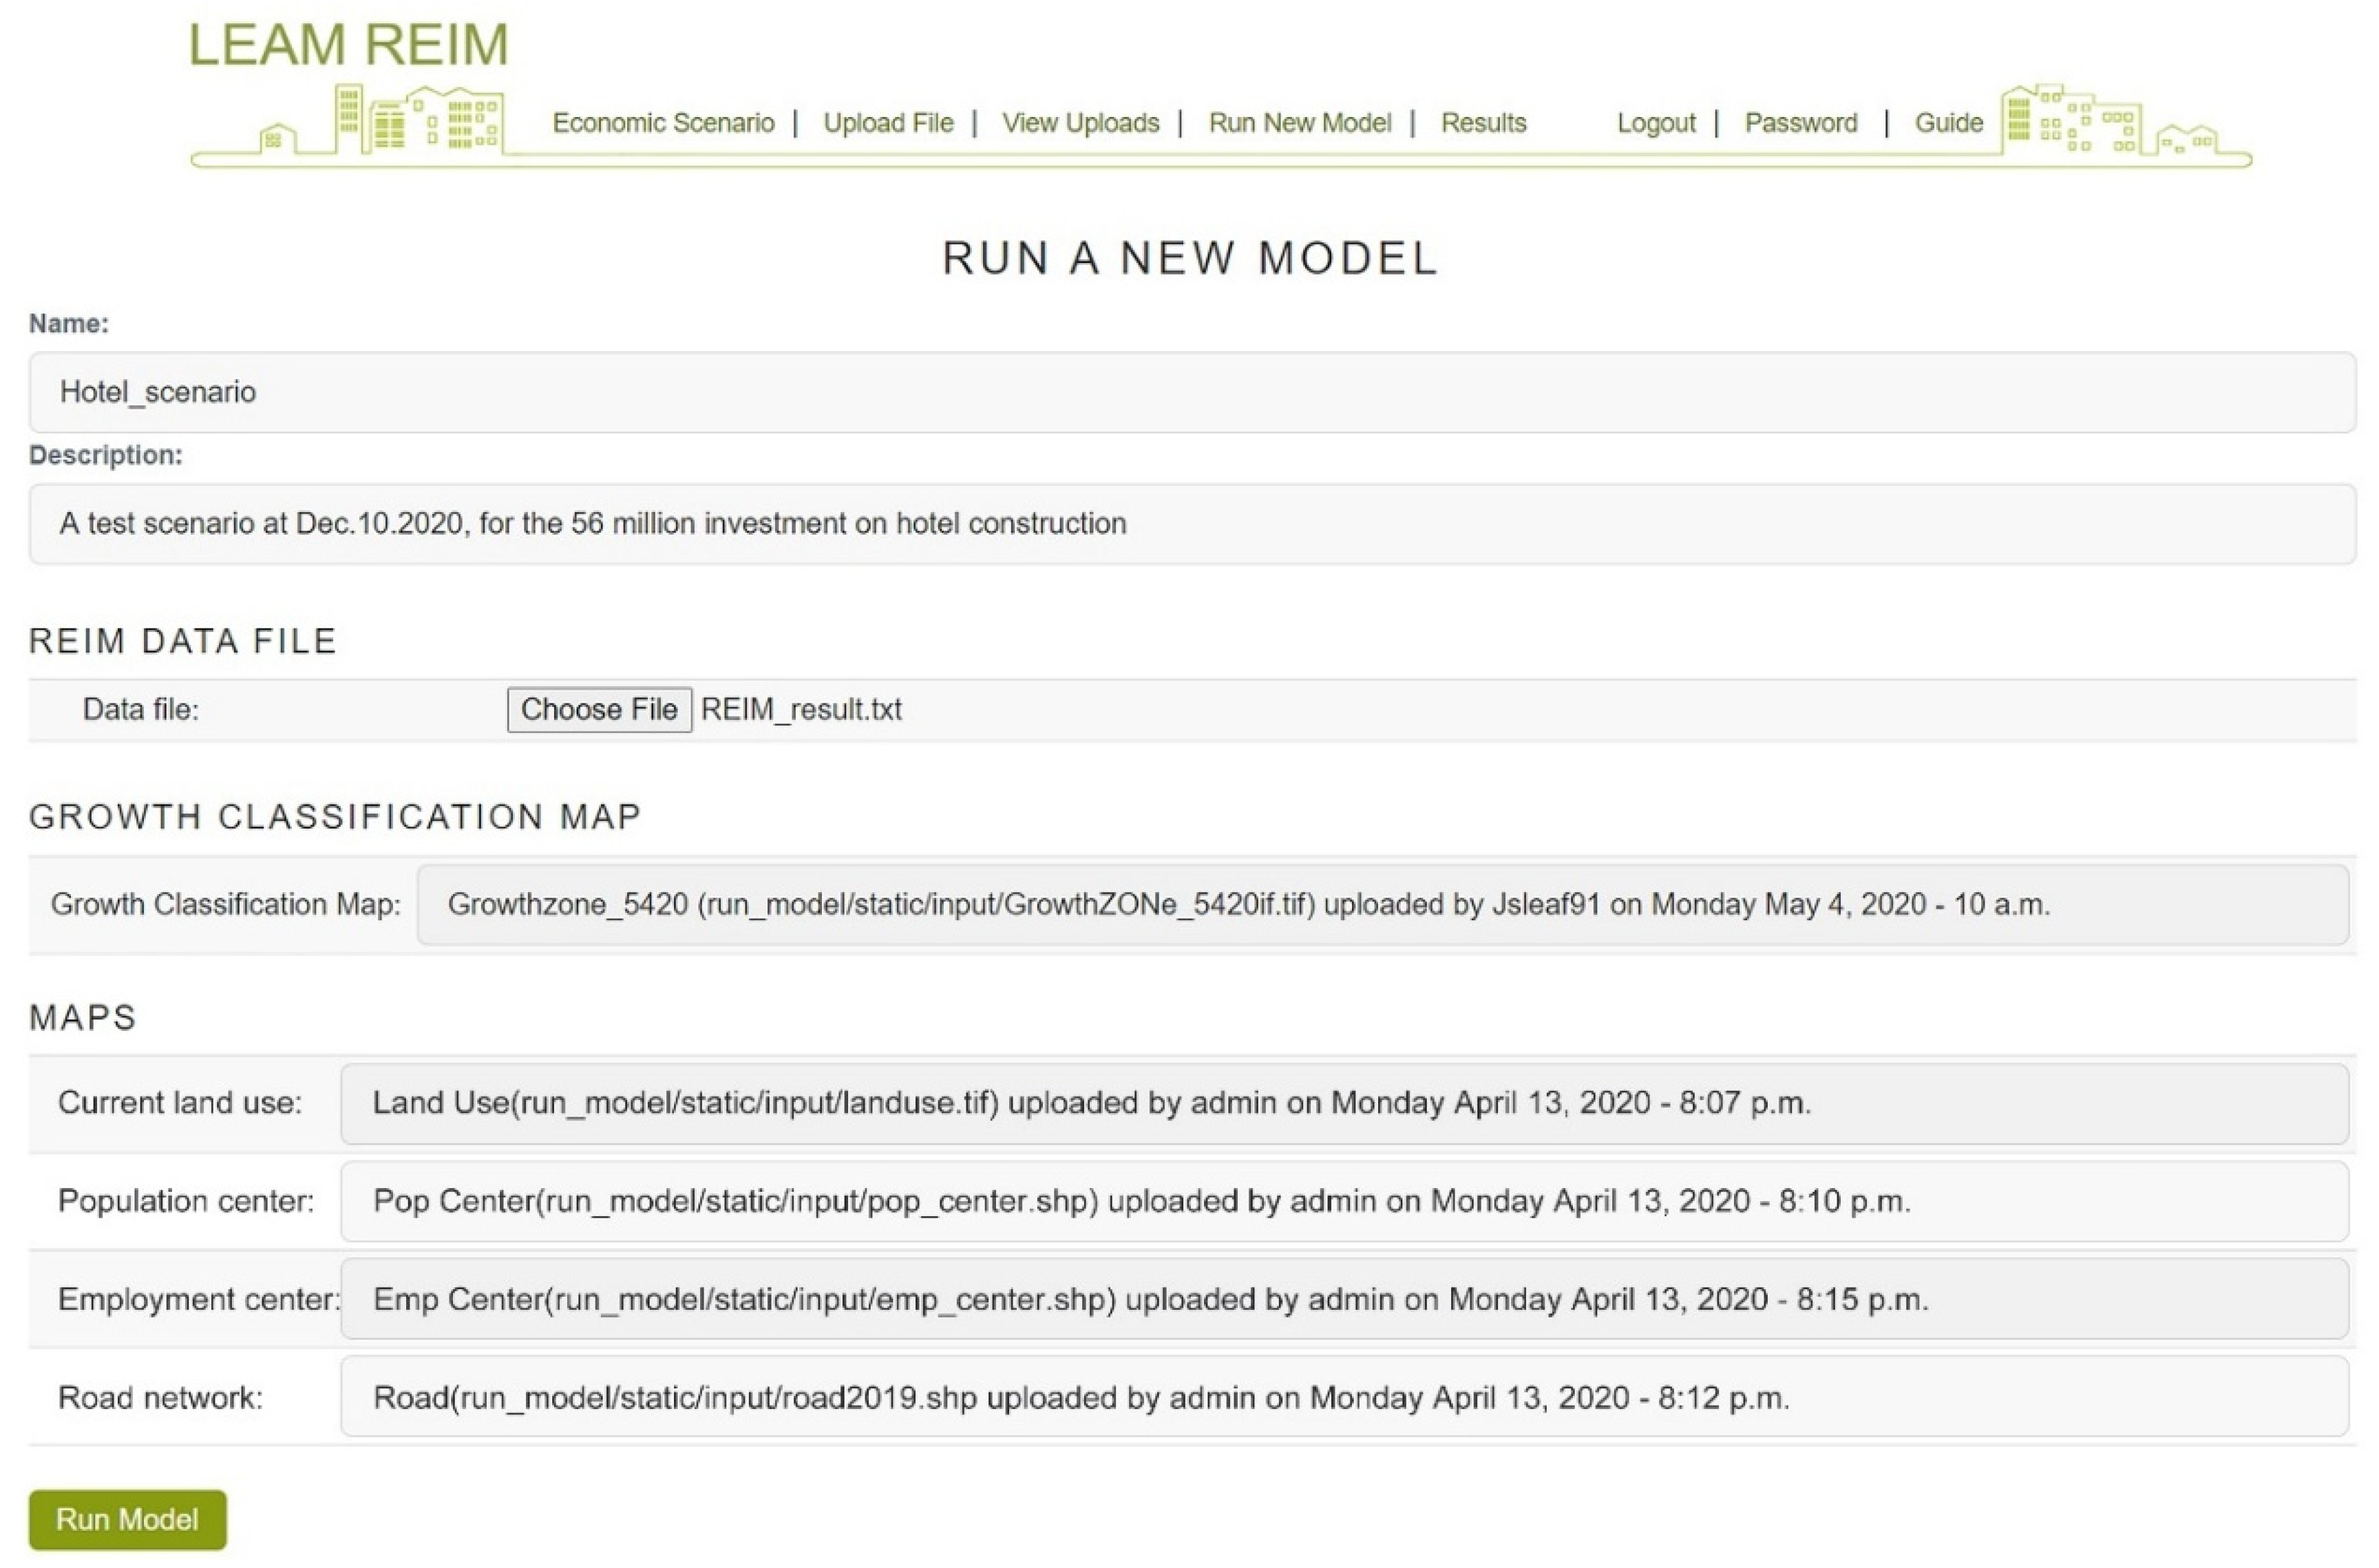
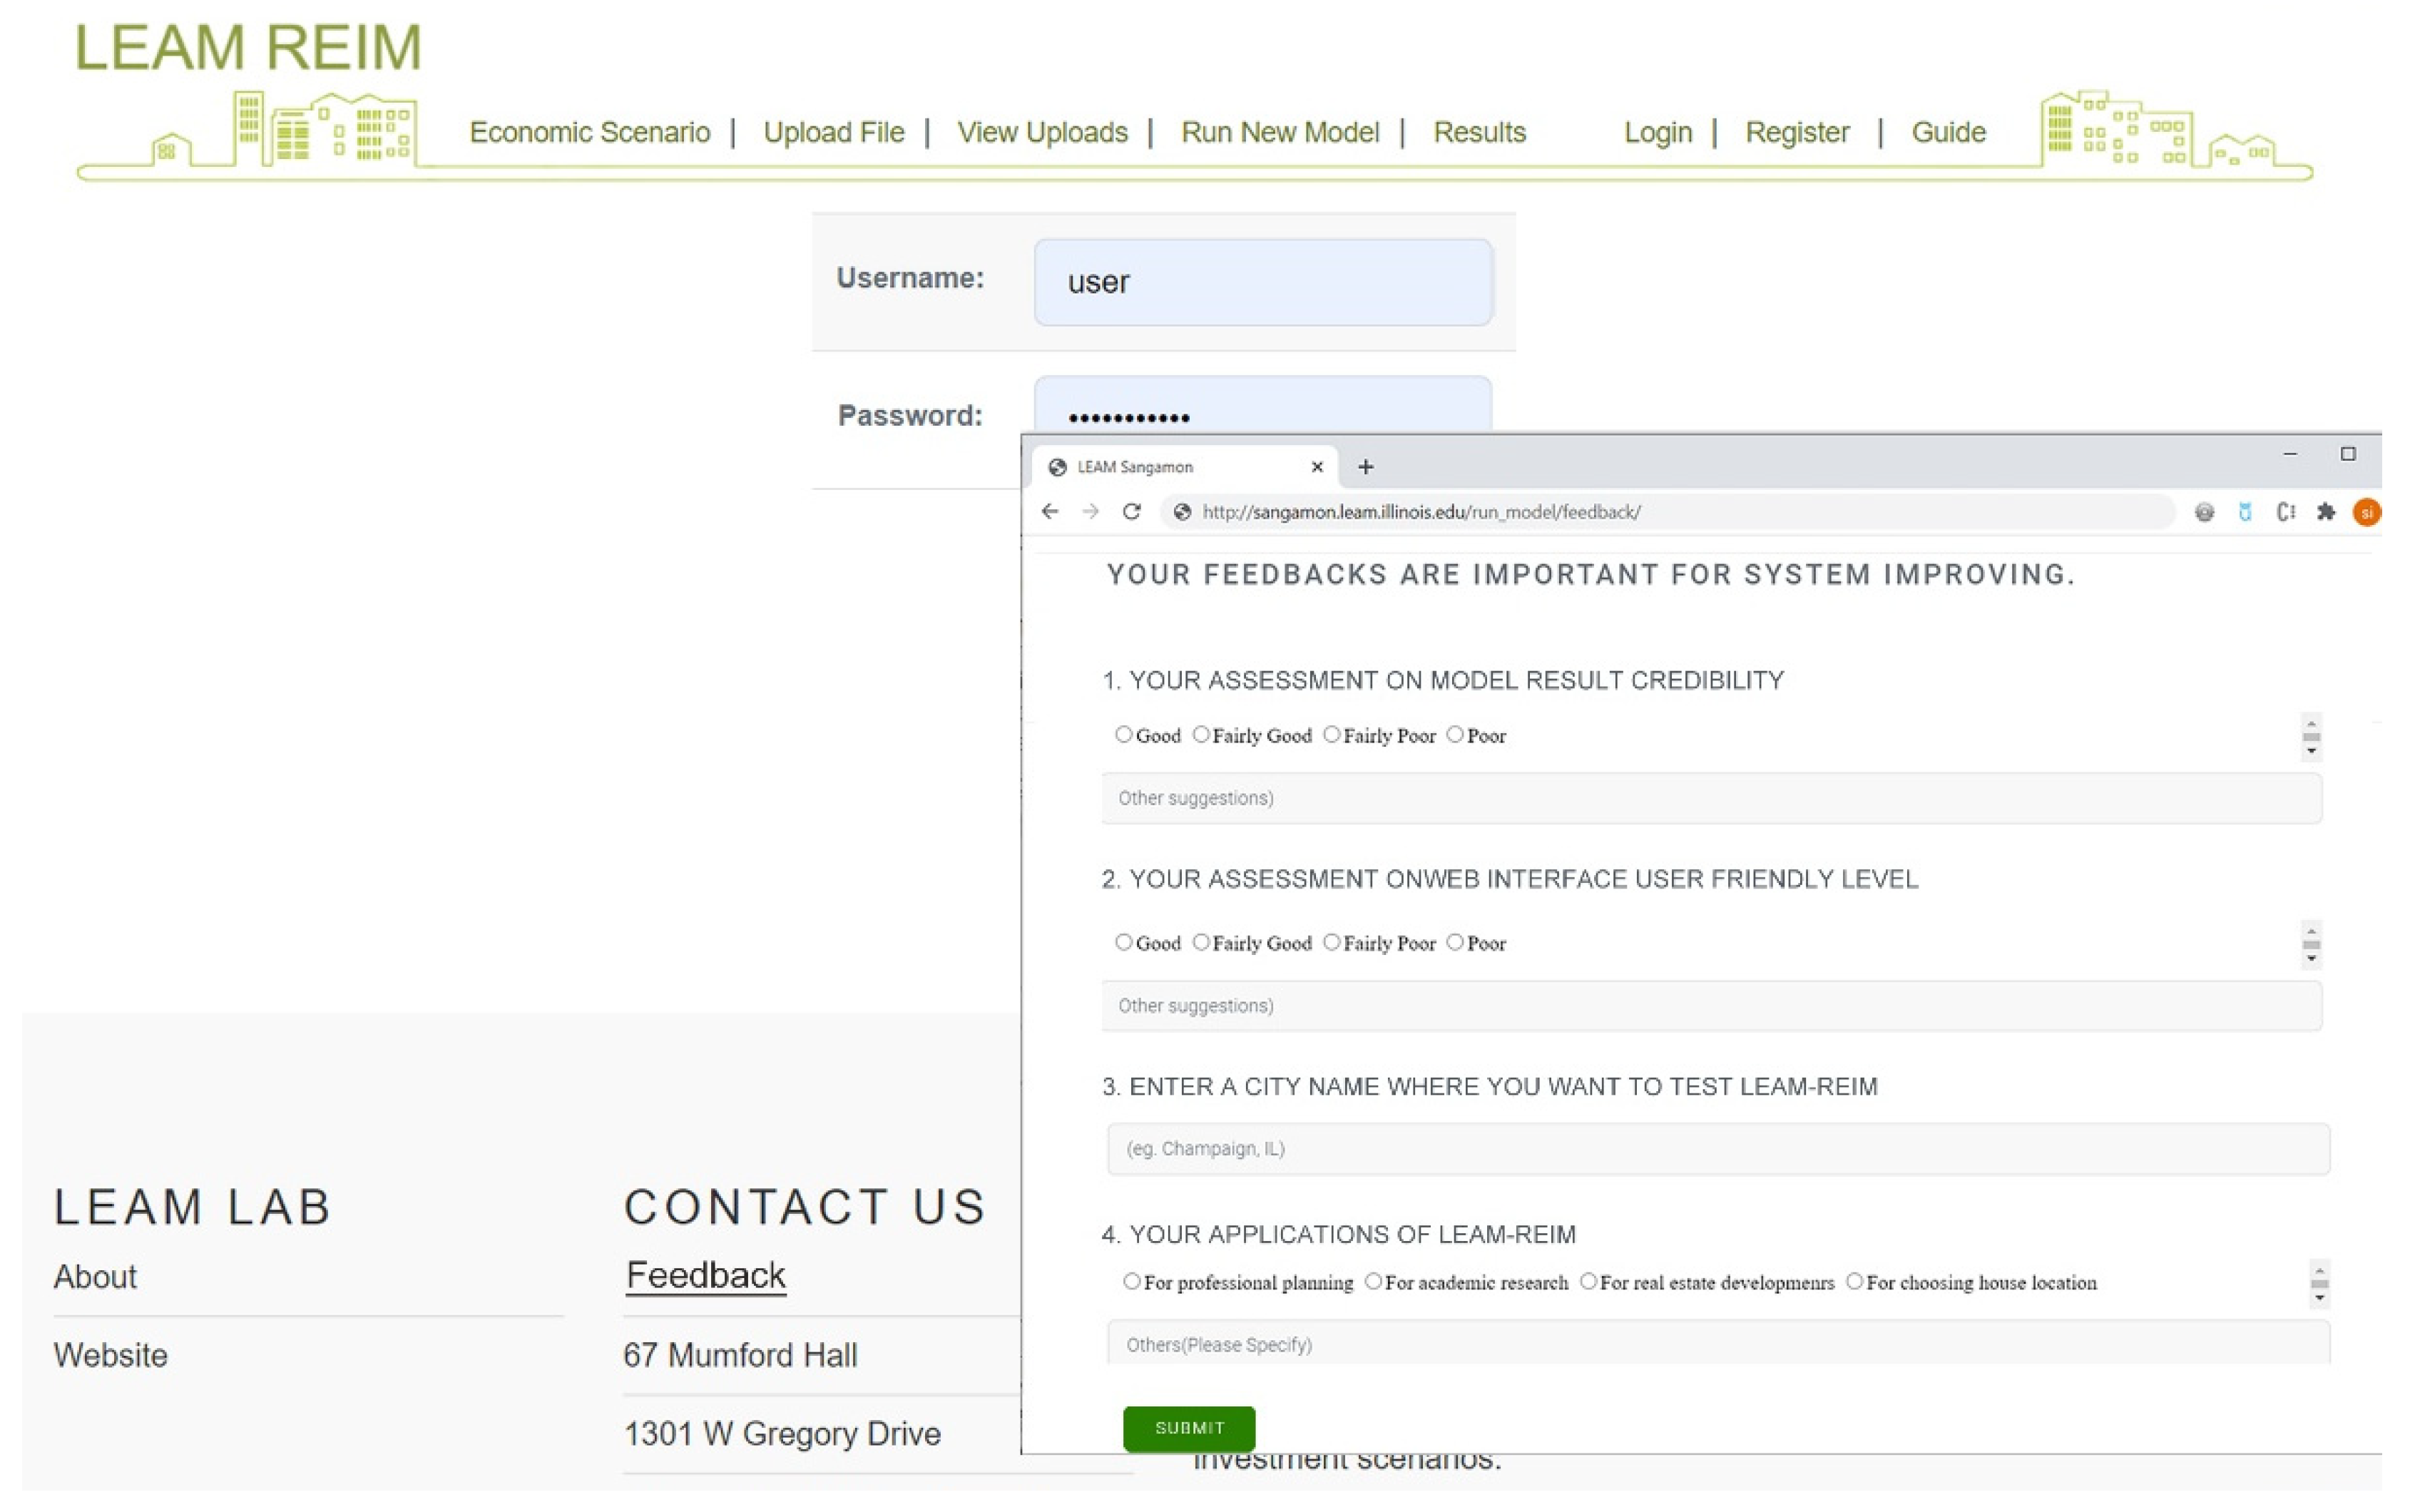
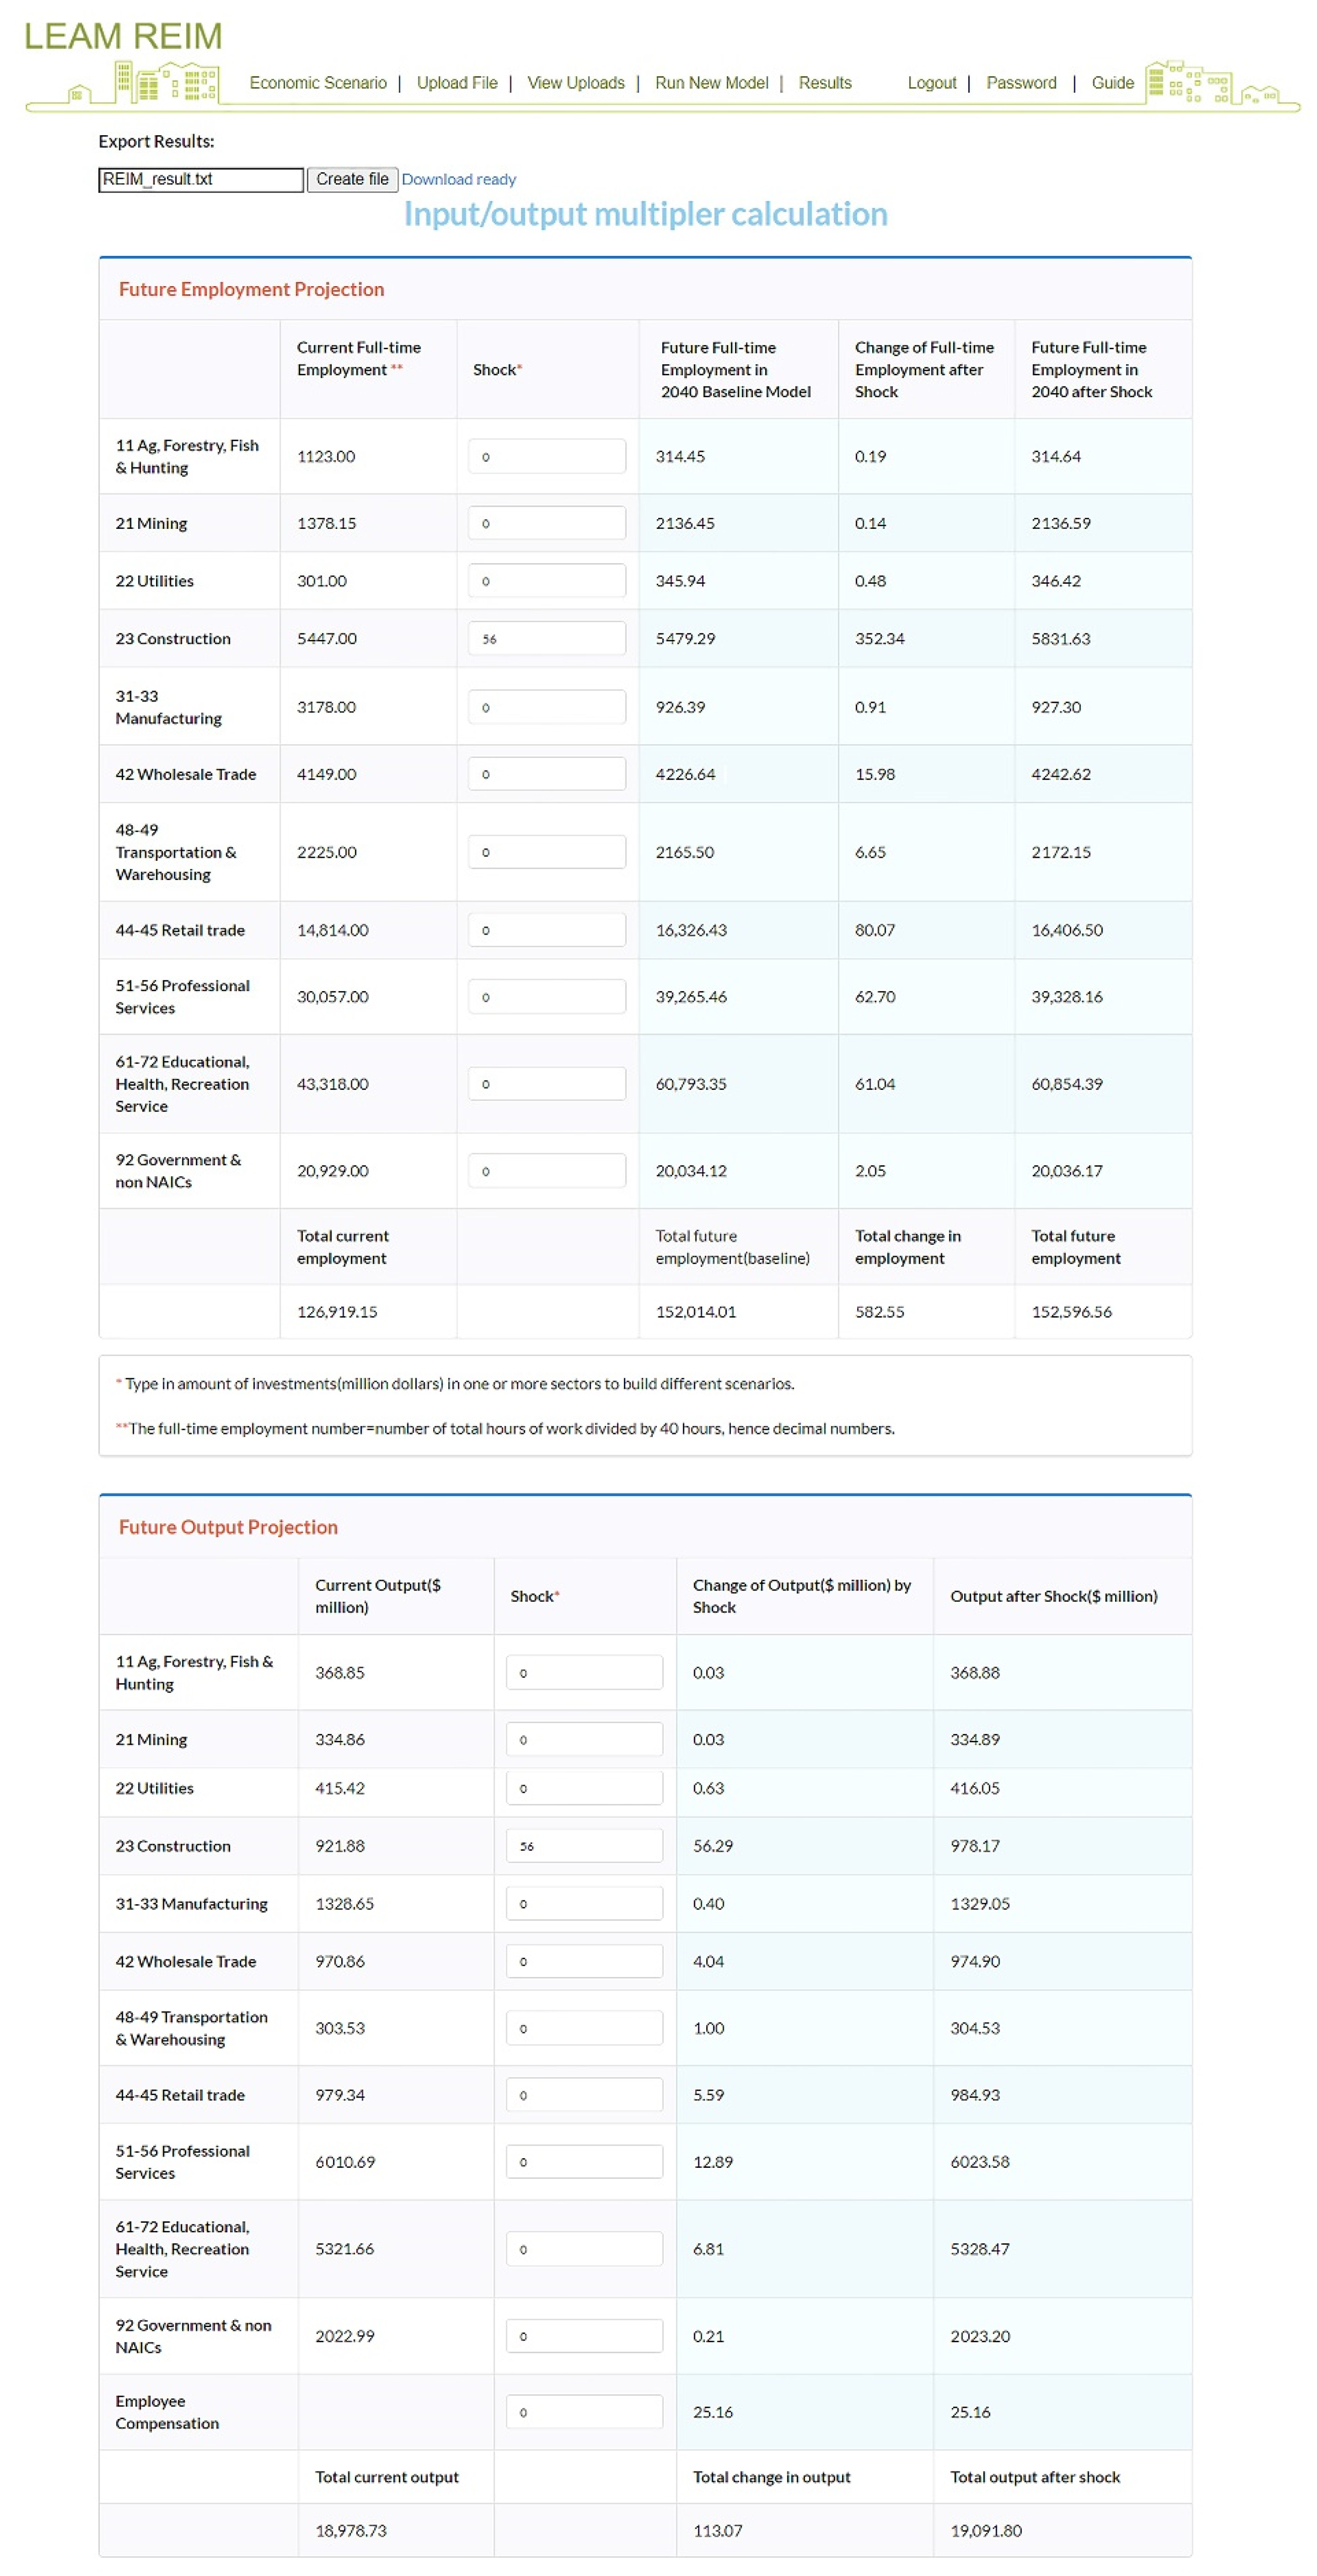
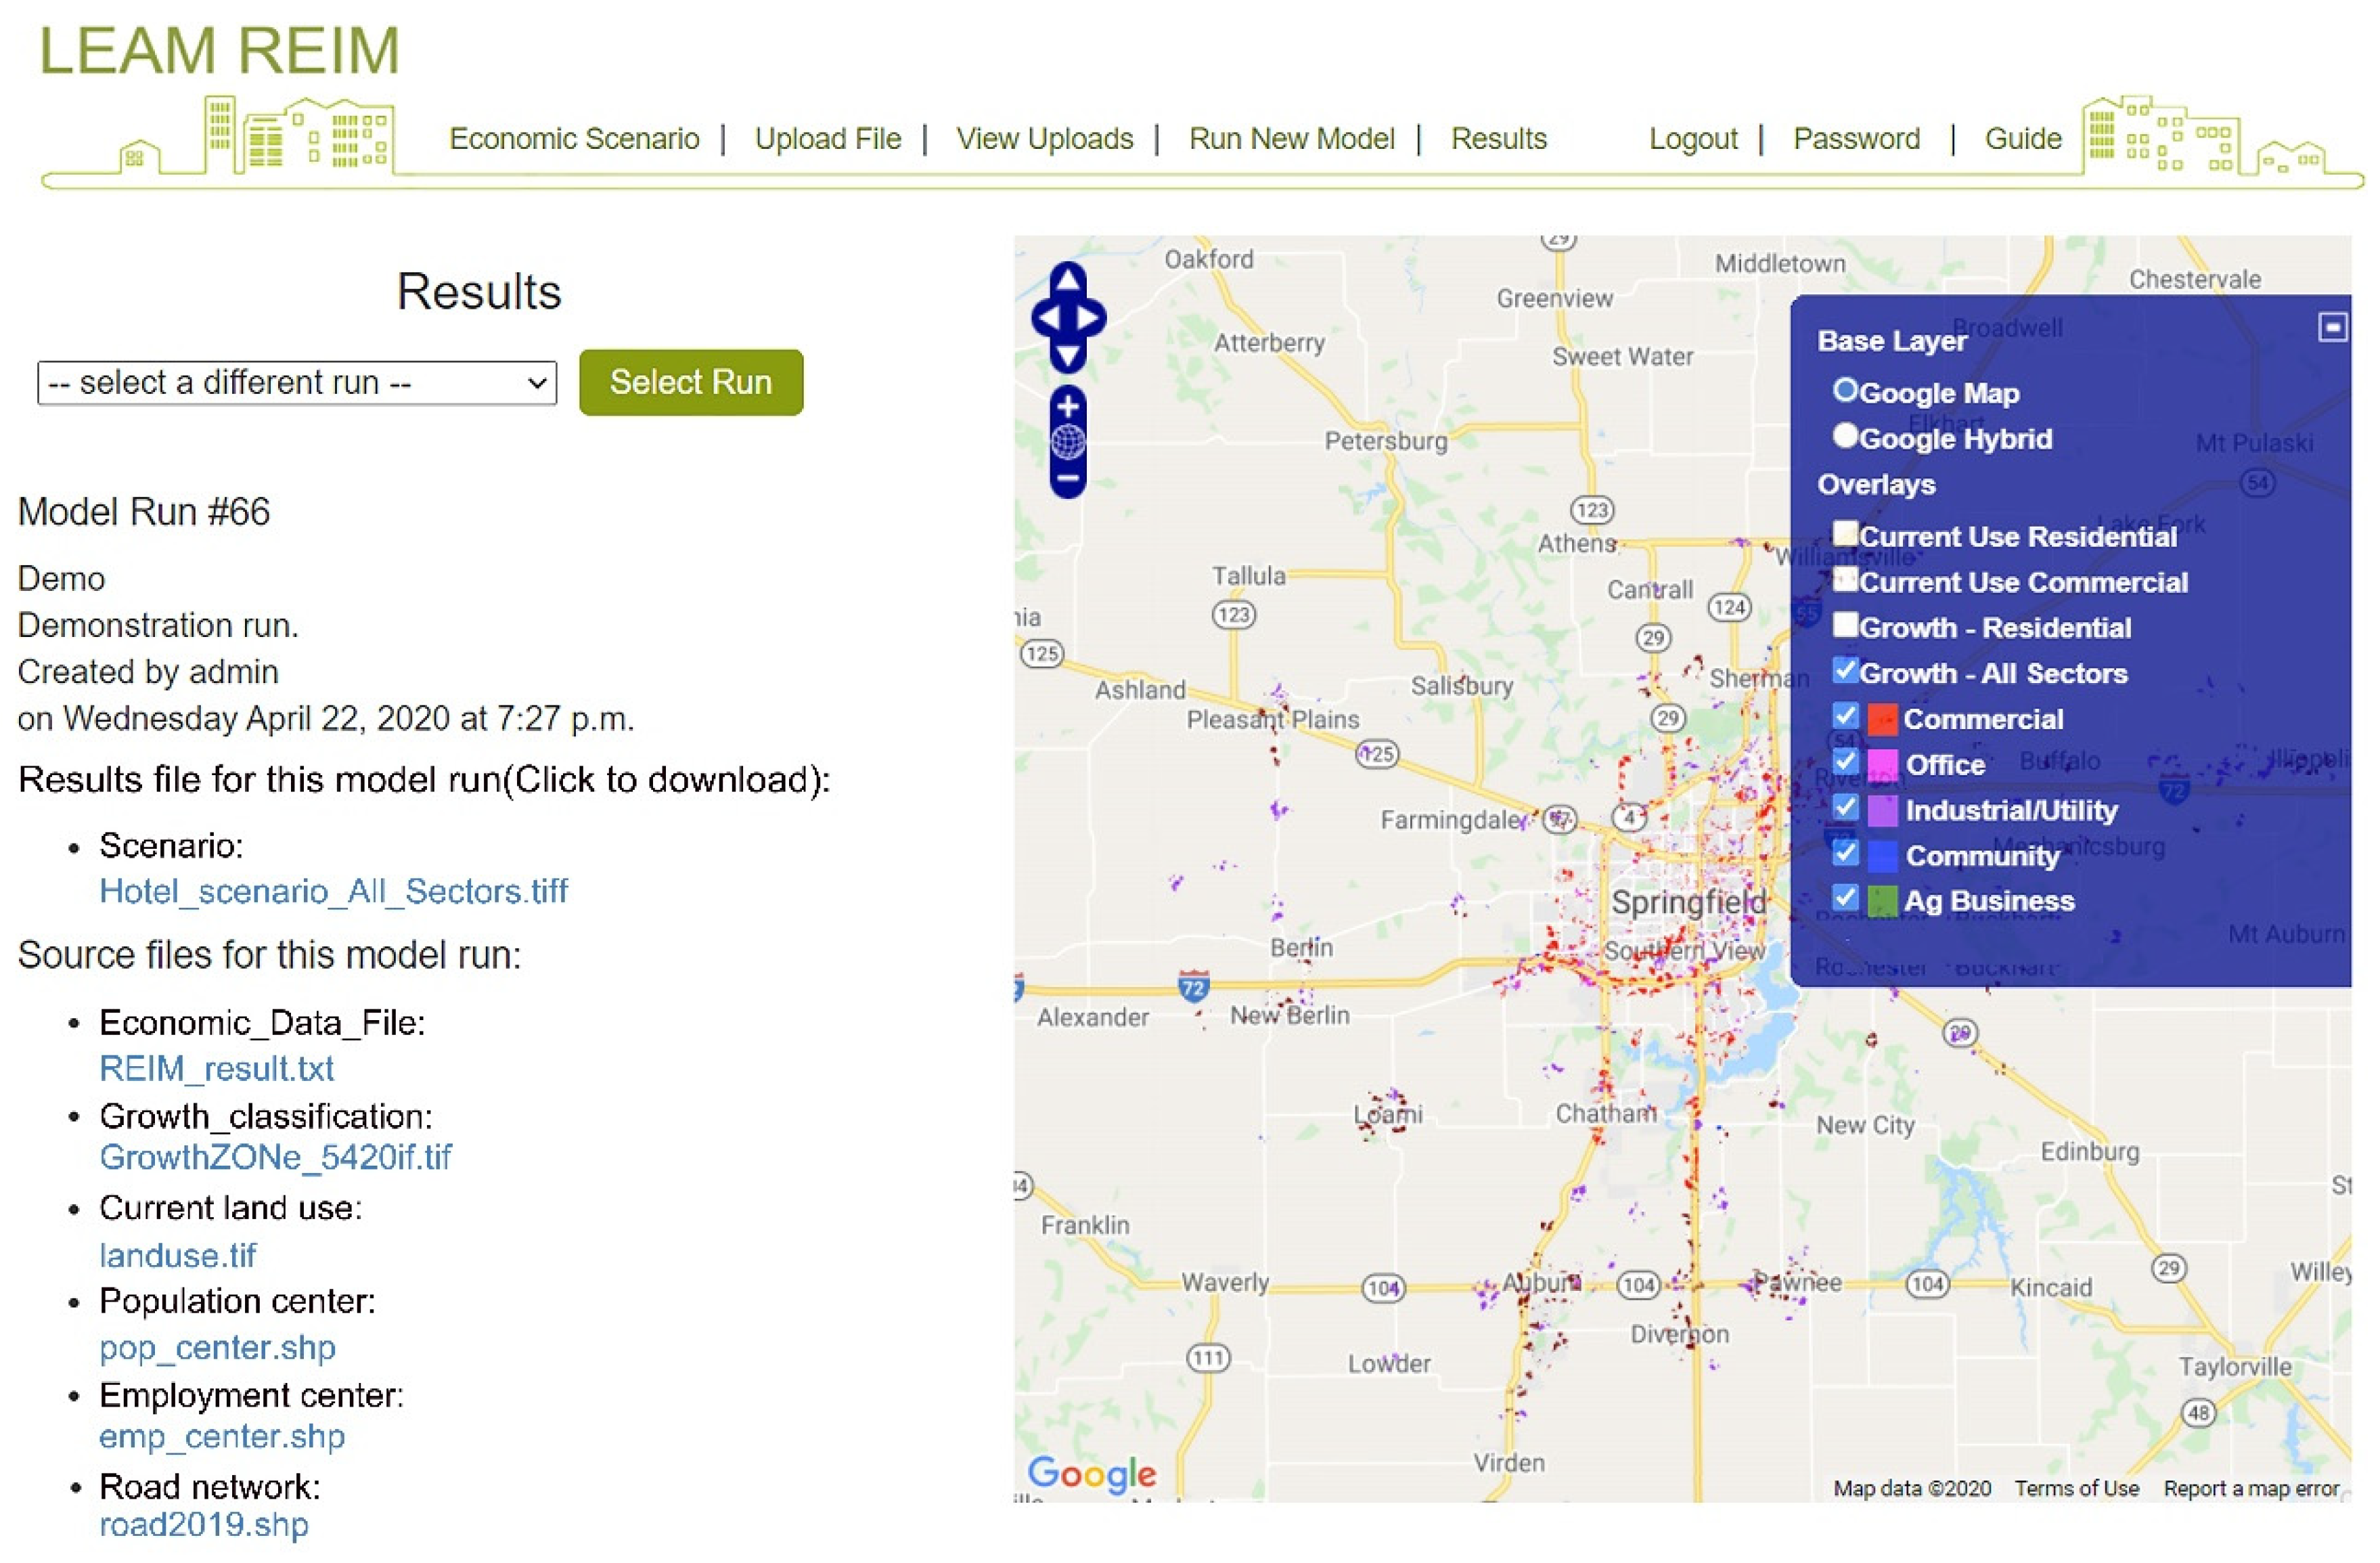
Our PSS user interface seeks to simplify the complex data analysis progress for non-technical users, provide interactive visualization of data, and collect user real-time feedback. Figure 3, Figure 4, Figure 5, Figure 6 and Figure 10 show the LEAM-REIM PSS web interface. Figure 3 describes the interface component that allows users to upload and annotate model input data. All uploaded files are stored in a web database and can be viewed in the “View Uploads” page. Figure 6 displays the interface component where users test, run, and download REIM scenarios. This provides estimations of future employment, based on user input (in dollars) for one or more industries. The estimated results of future full-time employment in 2040 for a baseline and investment scenario are shown for comparison. The table generated (Figure 6) is downloadable as a txt file and is used for LEAM input. Figure 4 presents the procedure for selecting the uploaded data, designing a scenario, and running a typical LEAM scenario. LEAM model inputs include the REIM scenario result, current land use, population, employment, road network, POI, and growth classification maps. Growth classification is a raster map with values ranging from 0 to 5 representing potential growth restrictions (or incentives). For example, state or nationally controlled lands (military bases) would be classified as a 0—no growth zones. Tax increment financed (TIF) districts and other enterprise zones would have a more aggressive classification. Growth classification are determined by the user (in this case the Sangamon County Regional Planning Committee) according to the local natural restrictions (e.g., flood zone, watershed, green infrastructure preservation), historical restriction (historical district preservation), and zoning. Figure 10 shows the interface component (google maps API) for visualizing the land use change estimation result based on the built scenario. Users are also able to adjust the visualization to compare the estimated land use changes with the current land use map and download the attached model inputs and results. Previous model results are also available from the “select a different run” drop list. The scenario name, description, and inputs are attached to each scenario for bookkeeping and scenario comparison. Figure 5 shows the web page for collecting user feedback on model algorithms, model application, and interface design through an online survey.
The LEAM-REIM PSS has a database associated with interface that includes user data (including profile and feedback), input data and previously run model results. All the uploaded data are internally stored in the database, and available to download. Database storage is also managed per login. Results are stored in based on login permissions and are available only to this account. User profile information and privacy are also protected through login restrictions.
There are five types of data stored and managed in PSS: spatial input data, user profile (user sign up information and feedback), the configuration of the scenario, spatial model result data, and descriptions for data. The spatial data input includes land use, population, employment, road network, and growth classification maps. These raw data are automatically pre-processed before storage in the database to have the same coordinate system, boundary, and resolution, to ensure all the input data meet the model running requirement.
3.2. REIM Result
In the Sangamon application, an investment scenario on hotel construction was tested. It was based on the Sangamon County Regional Planning Commission’s plan for 56 million dollars in hotel construction (Table 1 and Figure 6. LEAM-REIM interface showing REIM result of the investment plan which invested 56 million dollars in construction industry shows the results of entering the 56 shock (direct investment, unit: million dollar) for the construction industry in the REIM model. The REIM model input and output were categorized into 10 industrial sectors. The impacts are shown in 2 categories: 2040 output (the value of goods and services produced) and 2040 projected full-time employment. The sector entries reflect both the direct and indirect effects on the region’s economy. At the end of the sector impacts, there are entries labeled TOTAL, Direct and Indirect. The TOTAL entries are the summation of the direct and indirect effects.
In total, the direct investment of 56 million dollars will create 582 new jobs by 2040, including a direct employment increase of 352 in Construction, and an indirect employment increase of 230 for other industries. Overall, 582 jobs will be created by the 56-million-dollar investment in hotel construction. Hence, each job created by the project and its direct contractor will generate a further 1.79 jobs in the region by 2040. The value 1.79 is thus the employment 2040 multiplier or ripple effect. The hotel construction is projected to have the most significant effects on the increase in constriction employment. Besides the construction hiring, jobs related to customer amenities, (e.g., professional services, recreation, retail) show higher increases than those for the local residents (e.g., wholesale, transportation).
In terms of output (the value of goods and services produced), there will be a total 113.07 million dollar increase by investing 56 million dollars in hotel construction, which includes 56.29 million dollars of direct output in construction and 56.78 million dollars of indirect output in other industries. In this case, indirect output was especially pronounced for the life support industries (e.g., retail, professional services, educational services, healthcare services). This makes intuitive sense given our understanding that indirect output increase usually comes from new population, which is attracted by increased job opportunities.
3.3. Attractors
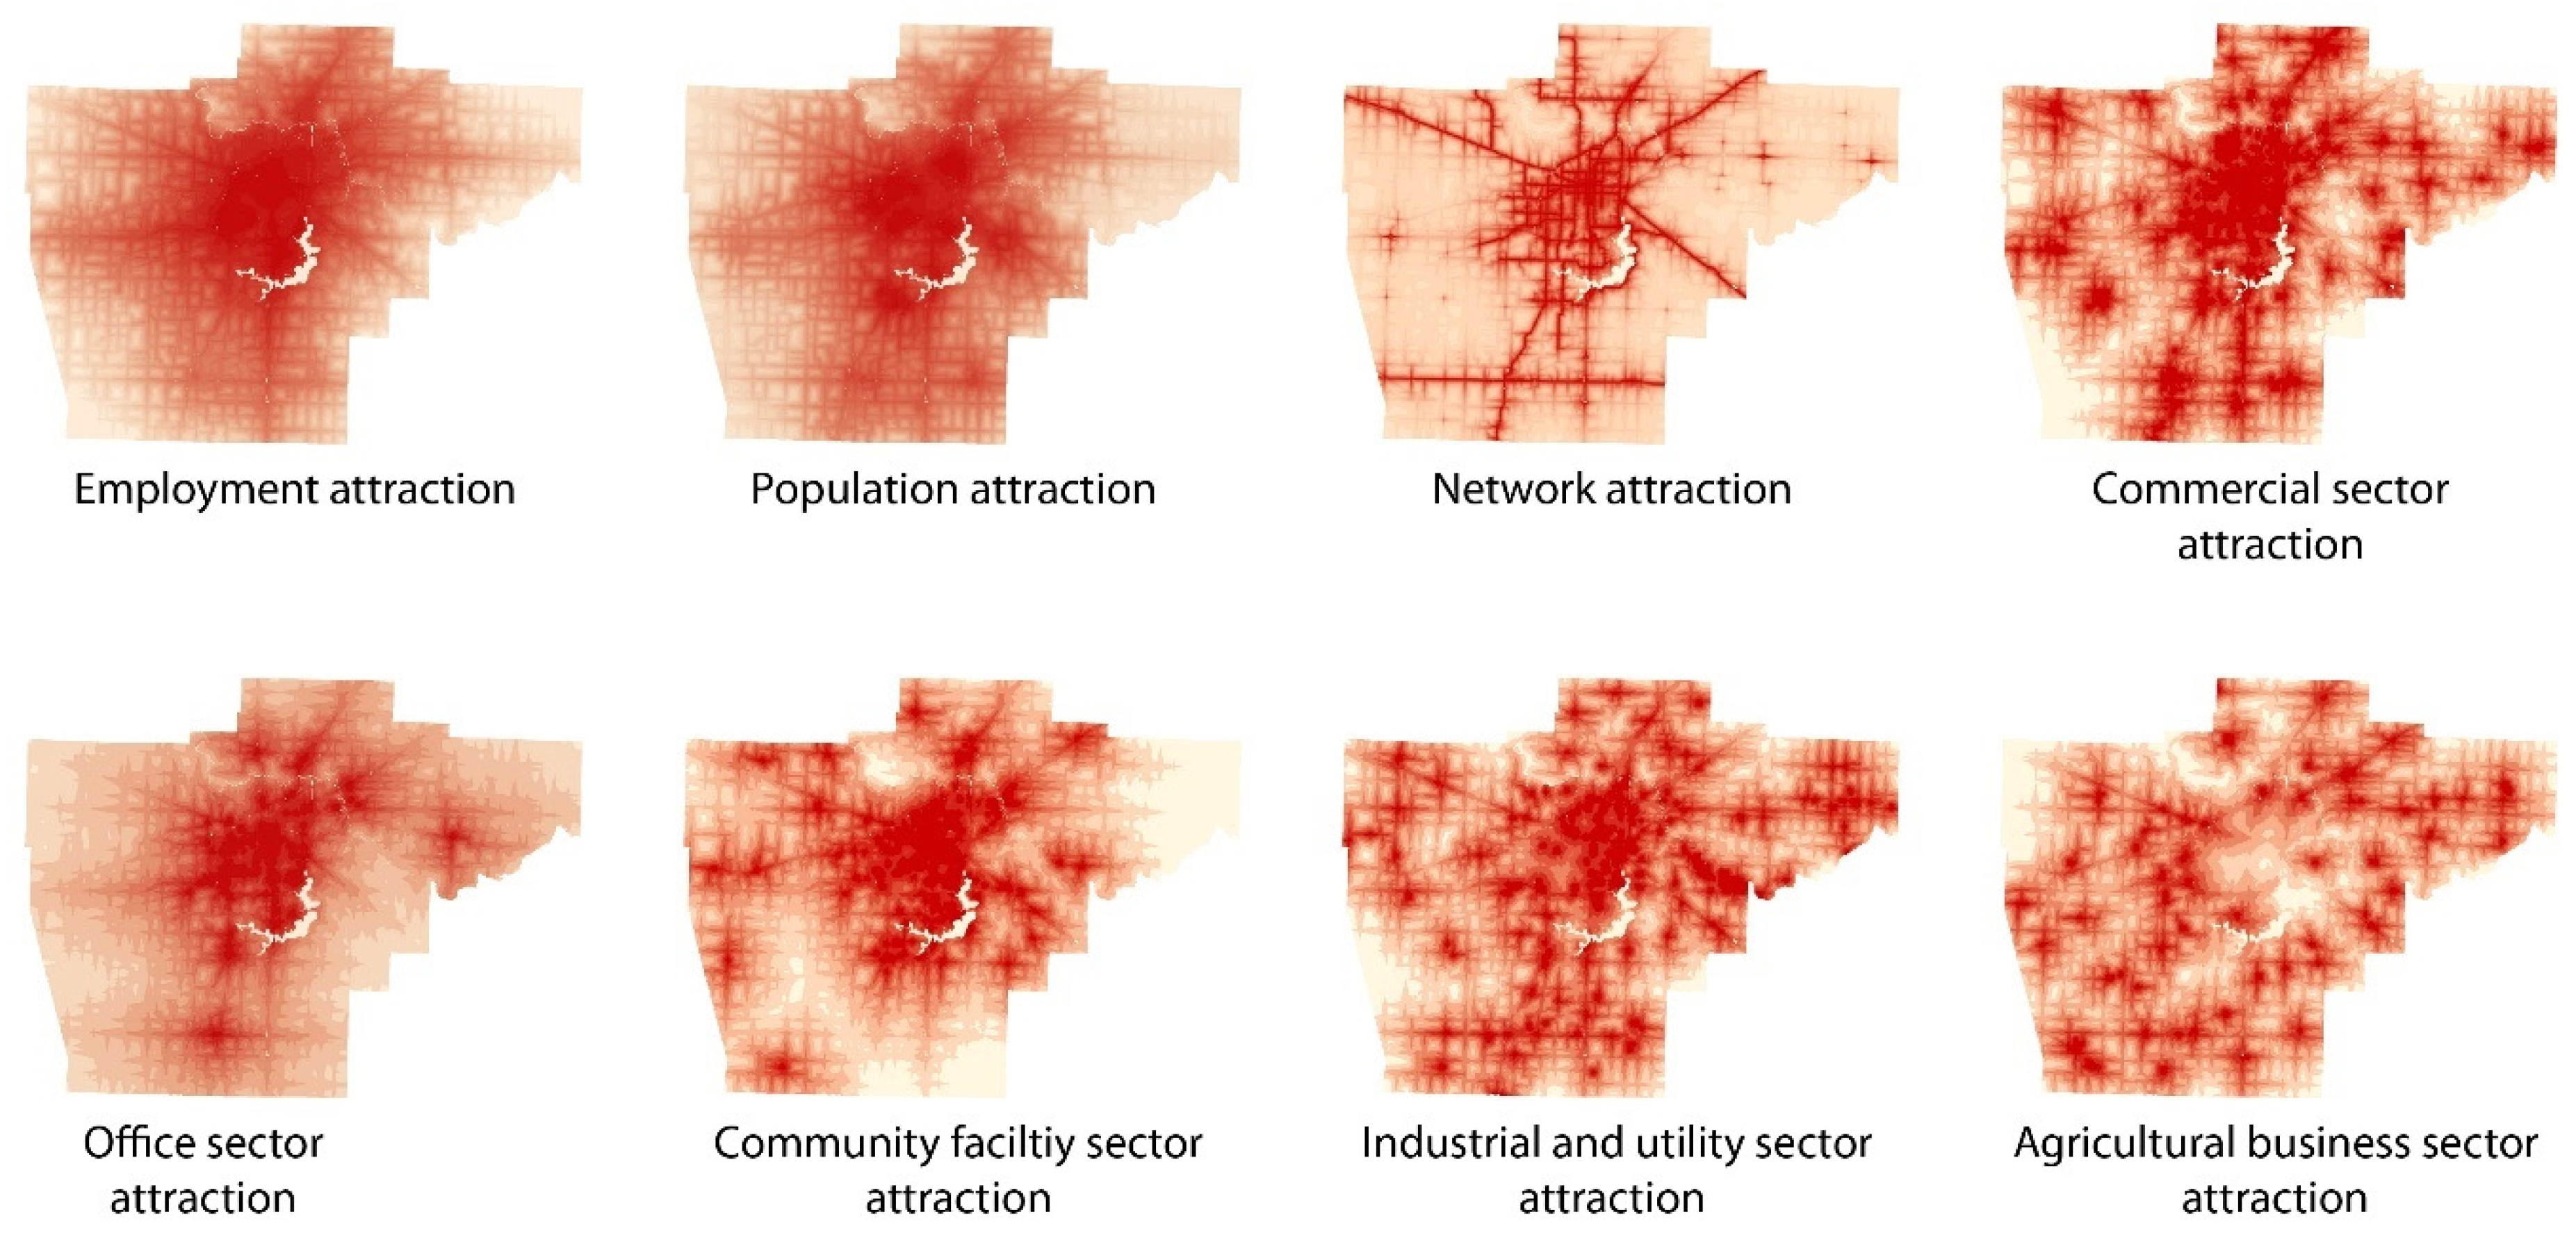
We illustrate the attractions of each growth driver respectively in Figure 7. For our study area, most of the growth attractors including population, employment, commercial, office, industrial/utility and community show high values of attractions (accessibilities) in the urban area, indicating the strong tendency for future growth to concentrate and spread out from the city center. Accessibility to attractors also show high values along major roads, indicating favorable growth opportunities for areas with good transportation connectivity. Agricultural business presents growth attraction to proximate land, albeit with limited strength.
The five development probability maps are shown in Figure 8. Each raster cell has five probability values corresponding to the 5 economic sectors. In the industrial/utility probability map, the high -probability areas appear to mostly agglomerate around the rural areas, especially near the urban boundary. This seems to follow the trend of existing industrial developments. Most current industrial/utility lands are located in the rural areas, which is the case in most cities due to the low social amenity requirements and high negative influence on the surrounding built environment. Similar future development trends are shown in the projected agricultural growth. This stands to be reasonable, given that both agricultural and industrial land have local social amenity requirements and exhibit low competitiveness in occupying land (since their marginal profits are lower compared with competitive land-uses, such as commercial and office areas).
The results for commercial development probability show the potential for spatial patterning associated with urban sprawl. Locations with high development probability are agglomerated in the urban center and more dispersed farther away from the urban center. Some locations with higher development probability area scattered in urban-fringe and rural areas, identifying areas of potential future sprawling.
The spatial configuration of community facility development probability shows a similar pattern to that of commercial development probability. Once again, the potential for sprawl is exhibited by higher development probability on greenfield sites at the urban fringe and in rural areas. Conversely, the office development probability map displays a highly centralized distribution.
3.4. Land-Use Estimation Result
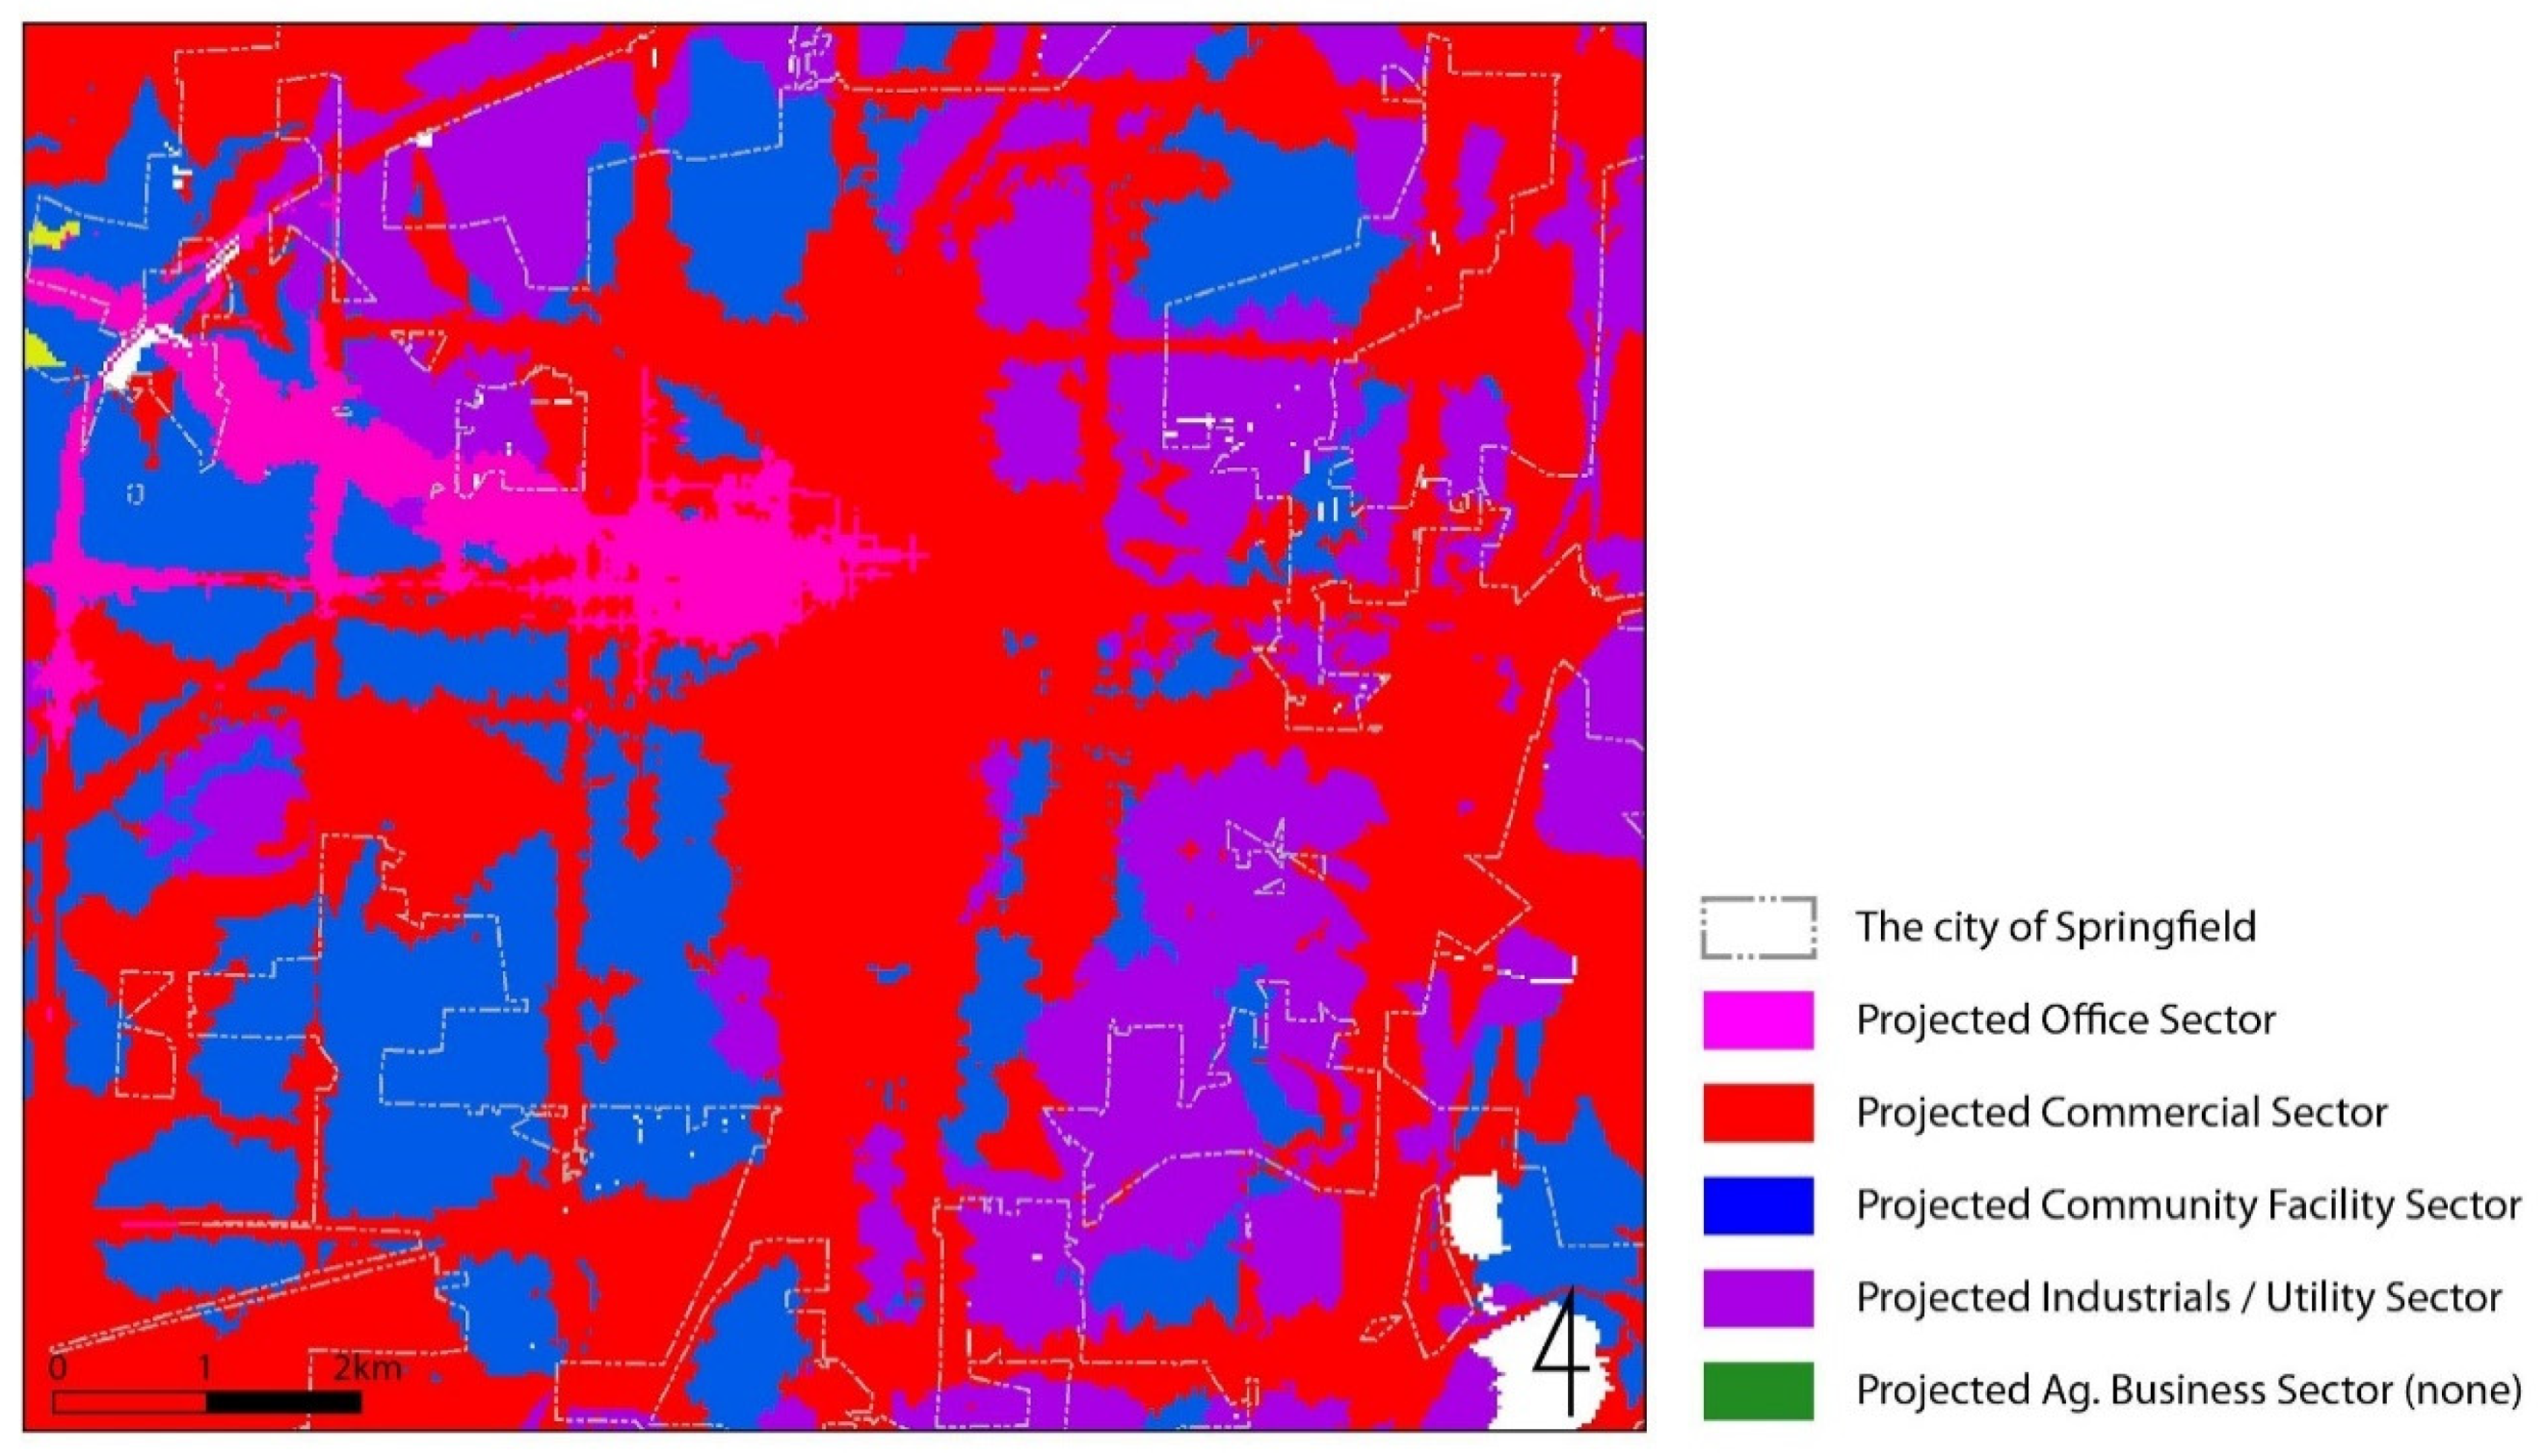
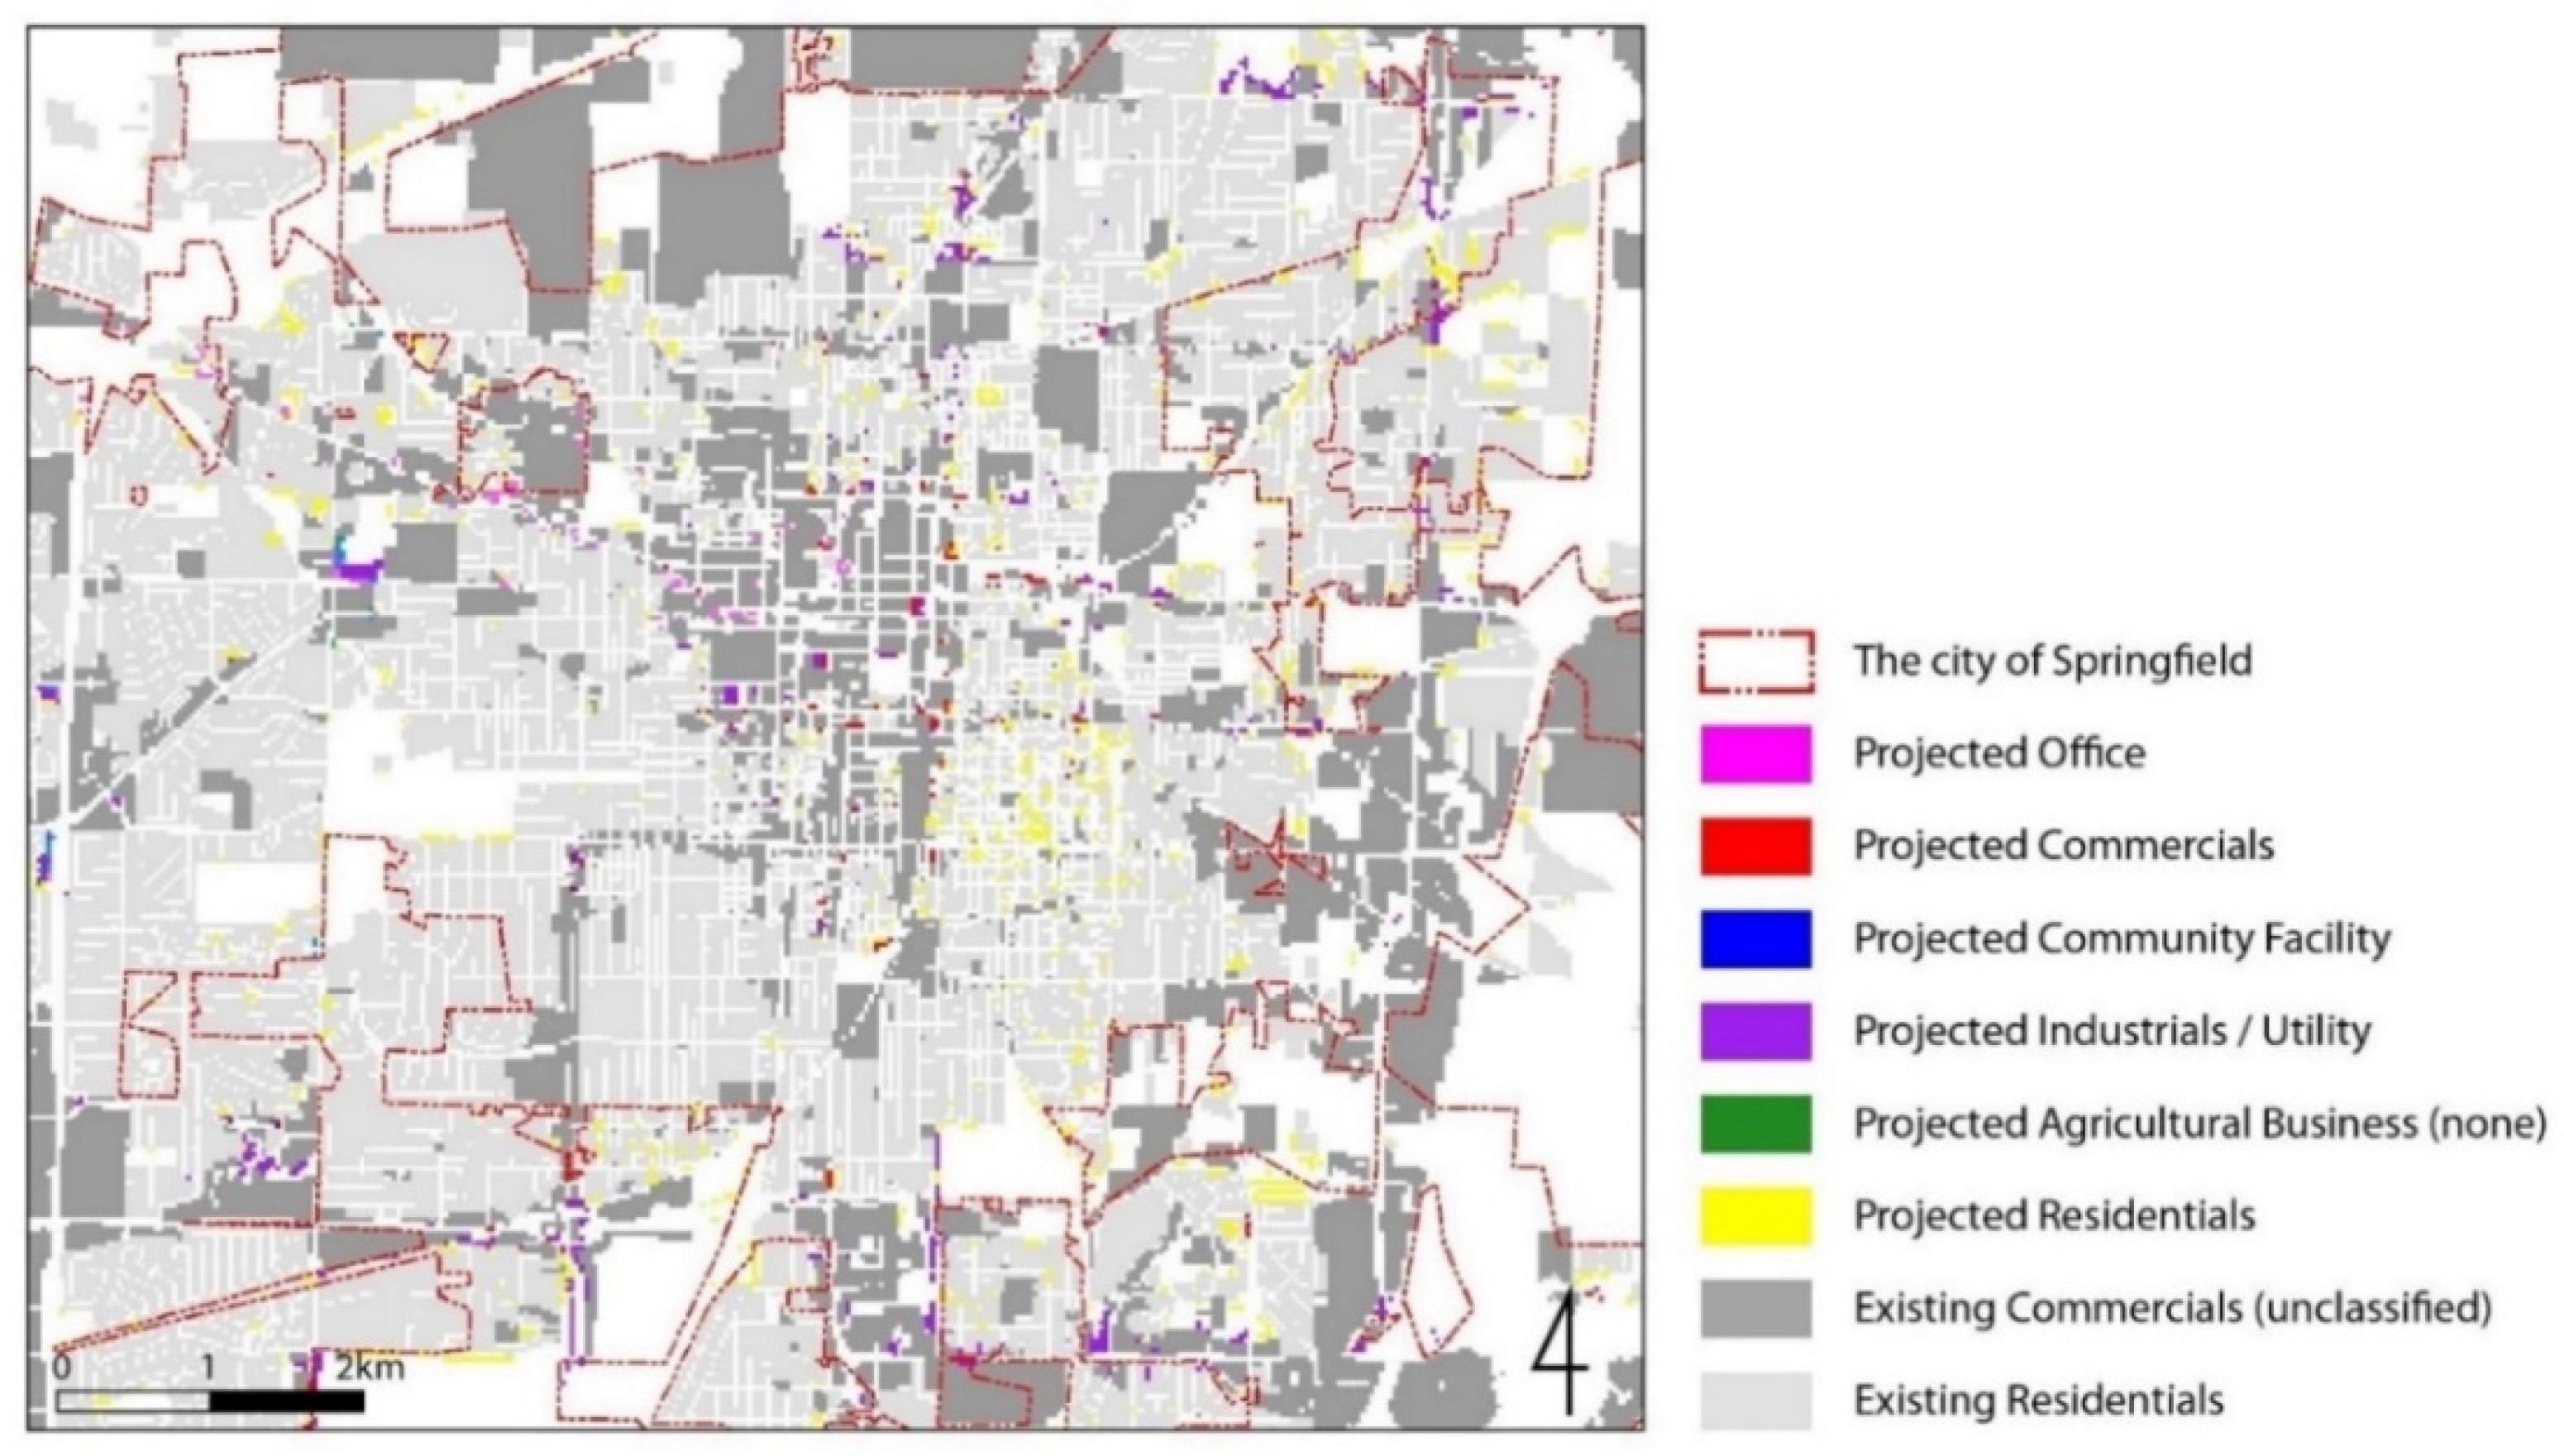
Based on the probability maps, land-use changes with five sectoral classifications are projected for the year 2040 in downtown Springfield, which is the central area of Sangamon County (Figure 9). Figure 10 shows the visualized model results on the interface for the whole Sangamon County where users can compare the current and estimated land use and download the results. This map spatially and explicitly displays how land-use configurations are likely to change and where jobs in each economic sector would be expected to arise in the future. Under an investment scenario whereby the local government invests in the industrial sector (specifically, hotel complex construction), changes in office and commercial land-use are expected to prevail in the central area. The industrial/utility and agricultural business land-use changes tends to occur more in the County’s rural areas.
The integrated LEAM and REIM PSS enables the simulation of land use changes at a more detailed level. Whereas in previous LEAM results [3,15] classified land use changed mainly based on residential and commercial categories, the LEAM-REIM model is able to predict such changes across five detailed commercial land use types along with residential uses. The granularity of development information in the five sub-categories within commercial development could provide better support for land-use and economic planning strategies than a model which fails to “break out” these sub-categories.
From an economic point of view, the proposed investment in hotel construction appears to result in spillover effects in associated business activities. Specifically, there are spillover effects within the urban center in the form of increased office employment, such as the spillover effects represented by the potential increased car rentals and travel agencies by hotel construction investments. Another spillover effect is the growth in the community facility sector, which is expected to. be sourced from the general growth in population and the resulting necessity of more community facilities to support this new population.
More importantly, the results demonstrate the utility of the PSS tool as a dynamic and engaging system which is capable of breaking the walls between models through the combined PSS user interface. While this paper focuses on a singular scenario (e.g., hotel development funding), it is easy to imagine a multitude of such scenarios using this framework. For example, results of scenarios which involve different investment in the same sector or investment varied across sectors can be directly compared. It is even possible to compare scenarios involving disinvestment in certain sectors. This ability to compare the results of varying scenarios provides insight into future land-use and its spatial-economic impacts.
3.5. Discussion
This study aimed to develop and apply an engaging, easily navigable, and functional PSS to integrate economic analysis into land-use change estimations. We demonstrated that land-use and economic models can be tightly coupled to create dynamic and comprehensive land-use change analysis that could be used by practitioners to evaluate policy impacts and test the planning scenarios. The LEAM-REIM PSS is developed as an integrated system through programming and web interface for the purpose of tightly coupling multiple models, which does not need manual intervention in the coupling process. Such tightly coupled models decrease technical requirements for users in application and speed up the whole analysis compared with the loosely and manually combined multiple models in many previous model coupling studies [1,3,16,21]. What’s more, the example showcased demonstrated the viability of a model which is capable of dynamic adjustment to context changes through the updated user-generated inputs.
In the case of Sangamon County, the tested hotel construction scenario offered noticeable improvement against the single LEAM model through allowing more detailed land-use sectors estimations, consideration of spillover effect and more reliable land-use cell number projections. In the hotel construction investment scenario, five economic land-use sectors were estimated compared with one economic sector in the single LEAM model. The office, commercial, and community facility land-use changes tended to agglomerate around the county’s central area as the coupled LEAM-REIM models estimated, while the industrial/utility and agricultural business land-use changes tend to occur in rural areas. The investment in hotel construction brough more increasement in community facilities land-use cells, followed by commercial and office land-use as estimated, demonstrating the spillover effects of investment.
In contrast to the complexity of the underlying LEAM-REIM model, the open-access web-based user interface developed for this specific project was targeted not at professional modelers, but at a lay audience. The user-friendly interface design, guidelines, and visual aspects of the PSS can support non-technical users to easily run scenarios using the coupled models for decision-making. This allows planning professionals who are not specifically trained in the mechanics of the software to conduct complex simulations in real time to answer real-world questions about planning and economic policy.
In fact, in the case of Sangamon County, users not only didn’t have to be experts, but were able to provide feedback directly to developers which allowed for the timely improvement of the web-based interface’s usability. User feedback was used to improve the model and interface functionality, which then lead to greater use and greater feedback. This “virtuous cycle” of PSS development is useful for the promotion and use of PSS systems by the target audiences.
While this tightly coupled modeling example represents an advance on current PSS technology, there are some limitations with this research. Firstly, employment density was assumed to remain constant when calculating the future land cell numbers within the model. This may not pose a problem for Sangamon County, where population and employment have been relatively constant over the last ten years. However, a more complicated scenario in which population and employment density are dynamic factors would require adjustment. Future research is necessary to adequately explore how more dynamic variables change the efficaciousness of the tightly coupled model. There are also limitations associated with the data, such as that the available road speed was speed limit data in estimating network-based travel time.
4. Conclusions
In this paper we have shown that the combination of economic and land-use models can be an effective strategy for the development of a richer PSS simulation environment and the production of more empirically valid model results in the evaluation of land-use policy. The LEAM-REIM PSS discussed in this paper has attempted to advance the science of PSSs by tightly coupling economic and land-use models to simulate and predict land-use change, thereby informing more cogent policy decisions in the face of big data overload. We argue the coupled modeling tool, in combination with a PSS framework, can create richer and more reliable and robust models which are better capable of supporting urban planning decision-making.
The results of the application of the LEAM-REIM PSS in Sangamon County, demonstrated the highly differential development probabilities of the various land use types. Commercial and office developments for example, have high proportional development probabilities in urban central areas. Conversely, industrial/utility developments and agricultural land use have higher development probabilities in urban-fringe and rural areas. These outcomes match trends in current development in the study area. It shows a need for separate and detailed coupling of output in each land use area with projected change. Collectively, these probability observations and their tendency to match the observed development phenomena within the region suggest a high degree of internal validity for the LEAM-REIM PSS.
The tool developed was built for a variety of stakeholders to access through an easy-to-use, web-based interface. This allowed for planning professionals to consider a multitude of scenarios without developing any new technical knowledge. Direct feedback from users was harnessed to further enhance the interface and general usability of the software.
The PSS improvements in tightly coupling complex models and visualization cataloged in this paper have suggested a possible course for future PSS research. Most directly, future researchers may seek to involve models in addition to the land use and economic models considered by adding new model types such as hydrological or real estate models. The expansion of this type of model combination seems to show promise is improving PSS design and producing more comprehensive models of land use consequences of policy decisions. We envision a future PSS which is capable of considering land-use, economic variables, real estate variables, environmental variables, and a host of other input in a much more complete fashion than currently available PSS’s. Demonstrating validity across a wide range of urban settings will be critical in establishing the robustness of the proposed methods. Future research may also seek to expand the area of application of the model to a wider variety of urban settings.
Cumulatively, the LEAM-REIM PSS developed in the course of this investigation shows great promise for producing more comprehensive models which allow for greater understanding of dynamic urban systems. This enhanced understanding, combined with a user-friendly web-based interface, will allow future planners to better evaluate the land-use consequences of their decisions. A more empirically valid decision-making process shows promise for enhancing outcomes of a wide variety of land-use policy decisions.
Author Contributions
Conceptualization, B.D., S.C., Y.K. and L.Z.; methodology, B.D., S.C. and Y.K.; software, S.C. and Y.K.; validation, S.C., Y.K., L.Z., B.D. and G.M.; resources, B.D.; data curation, B.D., S.C. and Y.K.; formal analysis, S.C. and Y.K.; investigation, L.Z. and B.D.; writing—original draft preparation, S.C., Y.K., L.Z. and B.D.; writing—review and editing, S.C., Y.K., L.Z., B.D. and G.M.; visualization, S.C. and Y.K.; supervision, B.D.; project administration, B.D.; funding acquisition, B.D. All authors have read and agreed to the published version of the manuscript.
Funding
This research received no external funding.
Institutional Review Board Statement
Not applicable.
Informed Consent Statement
Not applicable.
Data Availability Statement
The data presented in this study are available on request from the corresponding author. The data are not publicly available due to [privacy].
Conflicts of Interest
The authors declare no conflict of interest.
References
- Waddell, P. UrbanSim: Modeling urban development for land use, transportation, and environmental planning. J. Am. Plan. Assoc. 2002, 68, 297–314. [Google Scholar] [CrossRef]
- Land-Use Transport Interaction: State of the Art. Available online: https://ssrn.com/abstract=1434678 (accessed on 16 December 2020).
- Deal, B.; Kim, J.H.; Hewings, G.J.; Kim, Y.W. Complex urban systems integration: The LEAM experiences in coupling economic, land use, and transportation models in Chicago, IL. In Employment Location in Cities and Regions; Springer: Berlin/Heidelberg, Germany, 2013; pp. 107–131. [Google Scholar]
- Geertman, S.; Stillwell, J.; Toppen, F. Introduction to ‘Planning Support Systems for Sustainable Urban Development’. In Planning Support Systems for Sustainable Urban Development; Springer: Berlin/Heidelberg, Germany, 2013; Volume 195, pp. 1–15. [Google Scholar]
- Arciniegas, G.; Janssen, R. Spatial decision support for collaborative land use planning workshops. Landsc. Urban Plan. 2012, 107, 332–342. [Google Scholar] [CrossRef]
- Pettit, C.J.; Klosterman, R.E.; Delaney, P.; Whitehead, A.L.; Kujala, H.; Bromage, A.; Nino-Ruiz, M. The online what if? Planning support system: A land suitability application in Western Australia. Appl. Spat. Anal. Policy 2015, 8, 93–112. [Google Scholar] [CrossRef]
- Levy, N.; Benenson, I. GIS-based method for assessing city parking patterns. J. Transp. Geogr. 2015, 46, 220–231. [Google Scholar] [CrossRef]
- Widjaja, I.; Russo, P.; Pettit, C.; Sinnott, R.; Tomko, M. Modeling coordinated multiple views of heterogeneous data cubes for urban visual analytics. Int. J. Digit. Earth 2015, 8, 558–578. [Google Scholar] [CrossRef] [Green Version]
- Deal, B.; Pan, H.; Pallathucheril, V.; Fulton, G. Urban resilience and planning support systems: The need for sentience. J. Urban Technol. 2017, 24, 29–45. [Google Scholar] [CrossRef]
- Ababaei, B.; Sohrabi, T.; Mirzaei, F. Development and application of a planning support system to assess strategies related to land and water resources for adaptation to climate change. Clim. Risk Manag. 2014, 6, 39–50. [Google Scholar] [CrossRef] [Green Version]
- Pérez, M.G.R.; Laprise, M.; Rey, E. Fostering sustainable urban renewal at the neighborhood scale with a spatial decision support system. Sustain. Cities Soc. 2018, 38, 440–451. [Google Scholar] [CrossRef]
- Uittenbroek, C.J.; Janssen-Jansen, L.B.; Runhaar, H.A. Mainstreaming climate adaptation into urban planning: Overcoming barriers, seizing opportunities and evaluating the results in two Dutch case studies. Reg. Environ. Chang. 2013, 13, 399–411. [Google Scholar] [CrossRef]
- Hurlimann, A.; Barnett, J.; Fincher, R.; Osbaldiston, N.; Mortreux, C.; Graham, S. Urban planning and sustainable adaptation to sea-level rise. Landsc. Urban Plan. 2014, 126, 84–93. [Google Scholar] [CrossRef]
- Jiang, H.; Geertman, S.; Witte, P. Avoiding the planning support system pitfalls? What smart governance can learn from the planning support system implementation gap. Environ. Plan. B Urban Anal. City Sci. 2020, 47, 1343–1360. [Google Scholar] [CrossRef]
- Sun, Z.; Deal, B.; Pallathucheril, V.G. The land-use evolution and impact assessment model: A comprehensive urban planning support system. Urisa J. 2009, 21, 57. [Google Scholar]
- Choi, W.; Deal, B.M. Assessing hydrological impact of potential land use change through hydrological and land use change modeling for the Kishwaukee River basin (USA). J. Environ. Manag. 2008, 88, 1119–1130. [Google Scholar] [CrossRef] [PubMed]
- Li, X.; Gong, P.; Yu, L.; Hu, T. A segment derived patch-based logistic cellular automata for urban growth modeling with heuristic rules. Comput. Environ. Urban Syst. 2017, 65, 140–149. [Google Scholar] [CrossRef]
- County, S. Sangamon County Data Commons Place Explorer. Available online: https://datacommons.org/place/geoId/17167 (accessed on 13 December 2020).
- Sangamon County Regional Strategic Plan 2014. Available online: https://co.sangamon.il.us/Portals/0/Departments/Regional%20Planning%20Commission/Docs/Comprehensive-Strategic-Planning/FINAL%20SSCRPC%20Regional%20Plan%2004-25-2014.pdf (accessed on 13 December 2020).
- Pereira, J.M.; Basto, M.; da Silva, A.F. The logistic lasso and ridge regression in predicting corporate failure. Procedia Econ. Financ. 2016, 39, 634–641. [Google Scholar] [CrossRef] [Green Version]
- Boulange, C.; Pettit, C.; Gunn, L.D.; Giles-Corti, B.; Badland, H. Improving planning analysis and decision making: The development and application of a Walkability Planning Support System. J. Transp. Geogr. 2018, 69, 129–137. [Google Scholar] [CrossRef]
Figure 1.
The framework of Land-use Evolution and Assessment Model (LEAM)-Regional Economic Input-Output Model (REIM) planning support system (PSS) architecture. LEAM and REIM are tightly coupled allowing users to easily test alternative scenarios. Once users establish scenario(s) to test and feed input data to the PSS tool, the system produces detailed land-use estimations without ‘human intervention’ answering both “what-if” and “so-what” questions within the context of the policy-making process.

Figure 2.
Sectoral classifications of economic growth probability.

Figure 3.
LEAM-REIM interface for uploading files. Users click “choose file” button to choose file from local portals to upload the model input files. A file name and description are required as notes for future use.
Figure 3.
LEAM-REIM interface for uploading files. Users click “choose file” button to choose file from local portals to upload the model input files. A file name and description are required as notes for future use.

Figure 4.
LEAM-REIM interface for running a model. To prepare for a model run, users name the scenario, write the scenario descriptions, upload a REIM model result as investment scenario, and select attraction characteristics.
Figure 4.
LEAM-REIM interface for running a model. To prepare for a model run, users name the scenario, write the scenario descriptions, upload a REIM model result as investment scenario, and select attraction characteristics.

Figure 5.
LEAM PSS user feedback and log in.

Figure 6.
LEAM-REIM interface showing REIM result of the investment plan which invested 56 million dollars in construction. The investment is described as “Shock” values for each industry type for the current year (in millions of dollars). “Future Full-time Employment in 2040 in baseline model” shows the estimated employment in 2040 if without any investment. “Future Full-time Employment in 2040 after shock” shows the estimated employment in 2040 considering the investment scenario.

Figure 7.
Attraction maps displaying the accessibility to attractors (e.g., population centers) based on shortest travel time. The deeper red represents higher attraction from the attractors.
Figure 7.
Attraction maps displaying the accessibility to attractors (e.g., population centers) based on shortest travel time. The deeper red represents higher attraction from the attractors.

Figure 8.
Probability maps for five commercial sectors. Each map exhibits the possibility of location choice of each sectoral development. Five probability maps were computed using ridge-regression methods.
Figure 8.
Probability maps for five commercial sectors. Each map exhibits the possibility of location choice of each sectoral development. Five probability maps were computed using ridge-regression methods.

Figure 9.
Land-use change projection with sectoral classifications. It shows the projected spatial locations of future development. Office and commercial land-uses are expected to be agglomerated at the urban center.
Figure 9.
Land-use change projection with sectoral classifications. It shows the projected spatial locations of future development. Office and commercial land-uses are expected to be agglomerated at the urban center.

Figure 10.
LEAM-REIM interface for visualizing and downloading model scenario result. The map shows the visualized estimated six land-use sector changes (yellow color for residential, red color for commercial, pink color for office, purple color for industrial/utility, blue color for community, and green color for agricultural business). Users are able to show or hide the current and estimated land use layers to compare in the right-top blue box. All previous model results are also available through the “select a different run” drop list.


Table 1.
Spatial employment density of Sangamon County and projection for land-use cell number change based on an economic investment scenario.
Table 1.
Spatial employment density of Sangamon County and projection for land-use cell number change based on an economic investment scenario.
| Economic Sectors | Current Employment | Current Land-Use Cells | Spatial Employment Density | Projected Employment (from REIM) | Projected Land-Use Cells | Projected Change in Land-Use Cells |
|---|---|---|---|---|---|---|
| Agricultural Business | 1123 | 6637 | 0.17 | 315 | 1860 | (4777) |
| Commercial | 18,963 | 21,176 | 0.59 | 20,649 | 35,247 | 2787 |
| Community Facility | 43,318 | 16,574 | 2.61 | 60,854 | 23,284 | 6710 |
| Industrial and Utility | 7082 | 21,176 | 0.33 | 7402 | 223,131 | 955 |
| Office | 50,986 | 4944 | 10.30 | 59,364 | 8378 | 2756 |
Publisher’s Note: MDPI stays neutral with regard to jurisdictional claims in published maps and institutional affiliations. |
© 2021 by the authors. Licensee MDPI, Basel, Switzerland. This article is an open access article distributed under the terms and conditions of the Creative Commons Attribution (CC BY) license (http://creativecommons.org/licenses/by/4.0/).
Share and Cite
MDPI and ACS Style
Chen, S.; Kwak, Y.; Zhang, L.; Mosey, G.; Deal, B. Tightly Coupling Input Output Economics with Spatio-Temporal Land Use in a Dynamic Planning Support System Framework. Land 2021, 10, 78. https://0-doi-org.brum.beds.ac.uk/10.3390/land10010078
AMA Style
Chen S, Kwak Y, Zhang L, Mosey G, Deal B. Tightly Coupling Input Output Economics with Spatio-Temporal Land Use in a Dynamic Planning Support System Framework. Land. 2021; 10(1):78. https://0-doi-org.brum.beds.ac.uk/10.3390/land10010078
Chicago/Turabian StyleChen, Si, Yoonshin Kwak, Le Zhang, Grant Mosey, and Brian Deal. 2021. "Tightly Coupling Input Output Economics with Spatio-Temporal Land Use in a Dynamic Planning Support System Framework" Land 10, no. 1: 78. https://0-doi-org.brum.beds.ac.uk/10.3390/land10010078
Note that from the first issue of 2016, this journal uses article numbers instead of page numbers. See further details here.