Article

Emerging Anthropogenic Influences on the Southcentral Alaska Temperature and Precipitation Extremes and Related Fires in 2019

by
Uma S. Bhatt
1,2,*,
Rick T. Lader
3,
John E. Walsh
3,
Peter A. Bieniek
3,
Richard Thoman
3,
Matthew Berman
4,
Cecilia Borries-Strigle
1,2,
Kristi Bulock
5,
Jonathan Chriest
1,2,
Micah Hahn
6,
Amy S. Hendricks
1,2,
Randi Jandt
3,
Joseph Little
3,7,
Daniel McEvoy
8,
Chris Moore
9,
T. Scott Rupp
3,
Jennifer Schmidt
4,
Eric Stevens
9,
Heidi Strader
9,
Christine Waigl
1,
James White
2,3,
Alison York
3 and
Robert Ziel
3
add Show full author list remove Hide full author list
1
Geophysical Institute, University of Alaska Fairbanks, Fairbanks, AK 99775, USA
2
Department of Atmospheric Sciences, University of Alaska Fairbanks, Fairbanks, AK 99775, USA
3
International Arctic Research Center, University of Alaska Fairbanks, Fairbanks, AK 99775, USA
4
Institute of Social and Economic Research, University of Alaska Anchorage, Anchorage, AK 99508, USA
5
US Fish and Wildlife Service Alaska Region, Anchorage, AK 99503, USA
6
Institute for Circumpolar Health Studies, University of Alaska Anchorage, Anchorage, AK 99508, USA
7
The W. A. Franke College of Business, Northern Arizona University, Flagstaff, AZ 86011, USA
8
Desert Research Institute, Reno, NV 89512, USA
9
Predictive Services at the Alaska Interagency Coordination Center, Alaska Fire Service, Fairbanks, AK 99703, USA
*
Author to whom correspondence should be addressed.
Submission received: 23 December 2020 / Revised: 9 January 2021 / Accepted: 10 January 2021 / Published: 17 January 2021
(This article belongs to the Special Issue Fire in the Earth System: Humans and Nature)

Abstract

:
The late-season extreme fire activity in Southcentral Alaska during 2019 was highly unusual and consequential. Firefighting operations had to be extended by a month in 2019 due to the extreme conditions of hot summer temperature and prolonged drought. The ongoing fires created poor air quality in the region containing most of Alaska’s population, leading to substantial impacts to public health. Suppression costs totaled over $70 million for Southcentral Alaska. This study’s main goals are to place the 2019 season into historical context, provide an attribution analysis, and assess future changes in wildfire risk in the region. The primary tools are meteorological observations and climate model simulations from the NCAR CESM Large Ensemble (LENS). The 2019 fire season in Southcentral Alaska included the hottest and driest June–August season over the 1979–2019 period. The LENS simulation analysis suggests that the anthropogenic signal of increased fire risk had not yet emerged in 2019 because of the CESM’s internal variability, but that the anthropogenic signal will emerge by the 2040–2080 period. The effect of warming temperatures dominates the effect of enhanced precipitation in the trend towards increased fire risk.

1. Introduction

The late-season extreme fire activity in Southcentral Alaska during 2019 was highly unusual and consequential. Alaska’s fire season typically starts with lightning in June and ends by late July as seasonal rains arrive [1]. In 2019, a prolonged drought and several high wind events lengthened the fire season in Southcentral Alaska, driving extreme fire activity in the existing Swan Lake Fire (Figure 1) as well as enabling new ignitions beginning August 17. The McKinley Fire in the Susitna Valley north of Anchorage also started in mid-August. Regional average August climatic anomalies from station observations within the Kenai Peninsula and Susitna Valley Predictive Service Areas were +4.1 °C and −126.5 mm for temperature and precipitation, respectively.
The lightning-ignited Swan Lake Fire located in the Kenai Peninsula started on 5 June 2019 and grew under high temperatures from mid-June through mid-July (Figure 2). The prolonged drought and several high wind events in mid-August drove extreme fire activity in the existing Swan Lake Fire and contributed to several new ignitions. Farther north in the Susitna Valley, the McKinley Fire started near the Parks Highway on 17 August 2019 when sparks from a downed power line spread rapidly in strong northerly winds with relative humidity less than 20%. The rapid spread was exacerbated by vegetation that was unusually dry after a summer of positive temperature and negative precipitation anomalies [2].
The McKinley Fire forced evacuations and destroyed 52 homes, 84 outbuildings, and 3 businesses [3]. Major highway closures disrupted tourism-dependent livelihoods (Figure 3, left panel), with some small businesses (e.g., tourism, gas stations, eateries) in the vicinity of Swan Lake Fire losing up to 20% of their seasonal revenues [4]. The strong winds were the result of the unseasonably strong high pressure across northern Alaska and broad low pressure over the Gulf of Alaska. The Alaska Department of Natural Resources had to extend firefighting operations in 2019 by a month due to the extreme conditions that were surpassed only by the 2004 fire season. The drought created dry deep organic fuel layers, and some fires burned deep enough to leave ash pits, a phenomenon rarely seen before in Alaska. Ash pits are very difficult to see and resulted in numerous serious burns to firefighters [5].
The ongoing fires created poor air quality (Figure 3) throughout the region containing over 60 percent (460,000) of Alaska’s population, and both the high concentration of pollutants and the unprecedented number of days with poor air quality caused substantial impacts to public health. In Anchorage, nearly one-third (32.6%) of the days during June−August had 24-h levels of fine particulate matter (particulate matter 2.5 µm or less, or PM2.5) considered at least moderately unhealthy for the general population, based on the Environmental Protection Agency’s National Air Quality Index. Daily PM2.5 concentration first peaked at the end of June, followed by a larger peak at the end of August (Figure 4), and the three-month average was 156.9 percent higher than the previous 10-year average over the same summer period. PM2.5 originating from wildfire smoke during the 2019 and previous fire seasons in Alaska was associated with an increase in emergency department visits for asthma and heart failure, with pronounced effects among Alaska Natives [6].
In addition to public health effects, costs to the 2019 economy included suppression expenditures, infrastructure losses, and disruption from transportation closures and evacuation orders. Suppression costs for the two largest fires totaled $43 million for Swan Lake [7] and $15 million for the McKinley Fire [8], not counting local response. The total suppression costs for the 2019 season in Southcentral Alaska was $70 million [8]. The Swan Lake Fire burned a major electric power transmission line [9], costing utilities and customers an estimated $10.4 million [10].
Climate is an important driver of fires in Alaska. The magnitude and extremes of historical Alaska fire seasons have been shown to be linked with broader modes of climate variability [11,12,13,14] however, most work has largely focused on the Interior where fires are most prevalent. Southcentral Alaska and Kenai Peninsula boreal forests differ from Interior Alaska in that insect outbreaks and invasive species are tied to fire activity, and drought stress has not been common [15]. The annual temperature for all of Alaska has warmed between 1976 and 2016 by 0.3 °C per decade [16] but there is a large gradient in trend magnitudes between northernmost and southern Alaska. Regional warming trends are largest on the North Slope of Alaska and decrease southward [17] and are largest in the cooler months. Southcentral Alaska which is located in the Cook Inlet climate division [1] has June–August trends over the 1949–2019 period of 1.2 °C (mean = 10 °C) for temperature and −30.7 mm (mean = 320.3 mm) for precipitation. Temperature trends are similar for the Central Interior climate division (1.6 °C, mean = 12.5 °C) but of opposite sign for precipitation (+7.5 mm, mean = 191 mm) (updated from [17]). The Cook Inlet climate division is cooler and wetter in summer than the Central Interior climate division. The anthropogenic signal has already emerged in Interior Alaska based on an attribution study of 2015 fires [18] and we hypothesize that the anthropogenic signal is just starting to emerge in Southcentral Alaska, where the mean summer climate is cooler and wetter. In 2019, the Cook Inlet climate division July–September temperature was ranked warmest while June–August precipitation was ranked driest (Figure 5) over the 1925–2019 period. The unprecedented persistent warm temperatures and dry conditions in Southcentral Alaska in 2019 set the stage for the extreme late fire season.
The extreme seasonal climate, large economic costs, and societal consequences of the 2019 Southcentral Alaska fire motivates investigating the following questions:
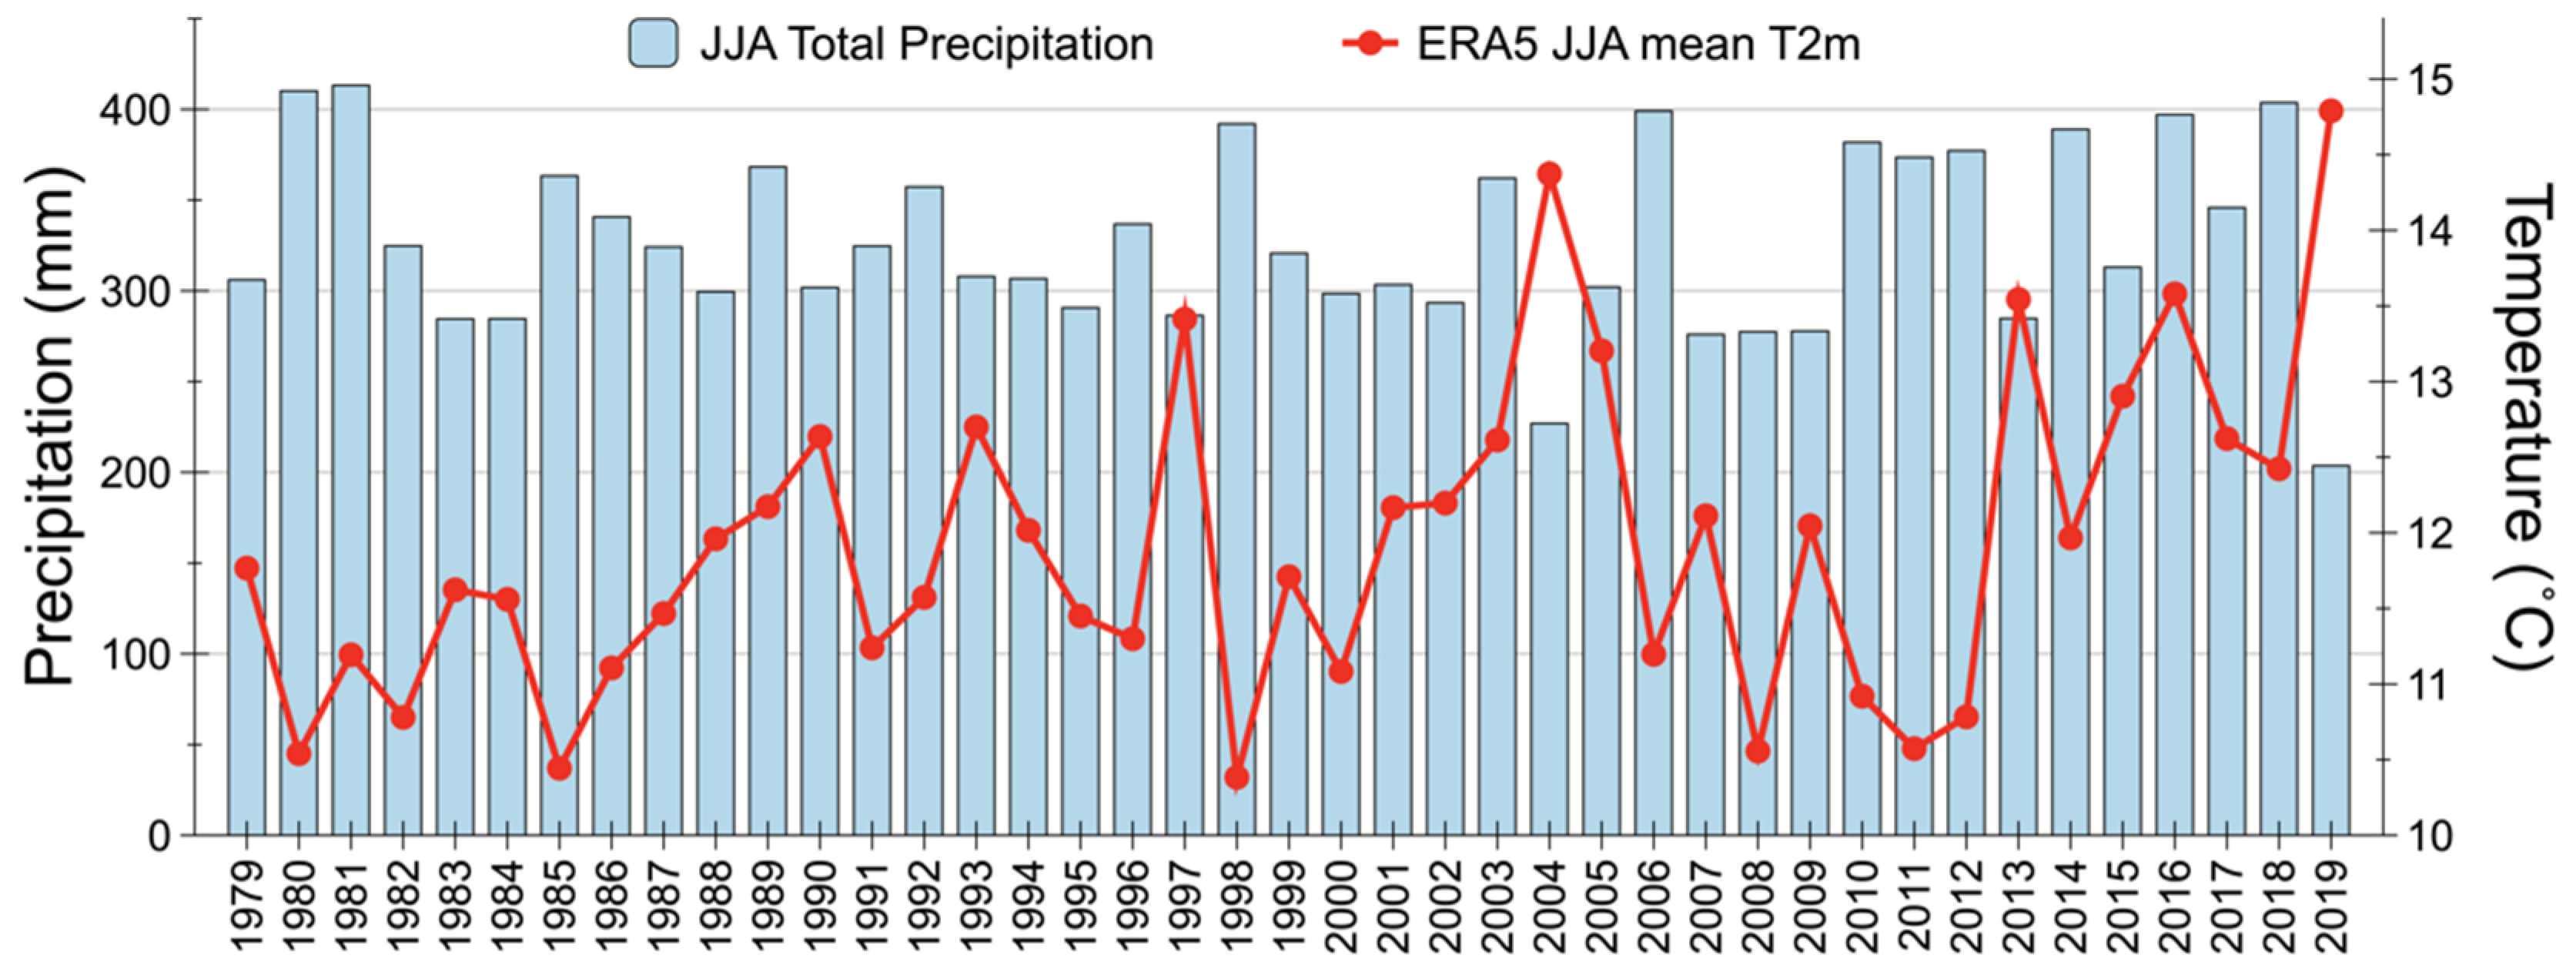
  • How did the climate conditions of 2019 in Southcentral Alaska vary intraseasonally in comparison with previous years from the observational record?
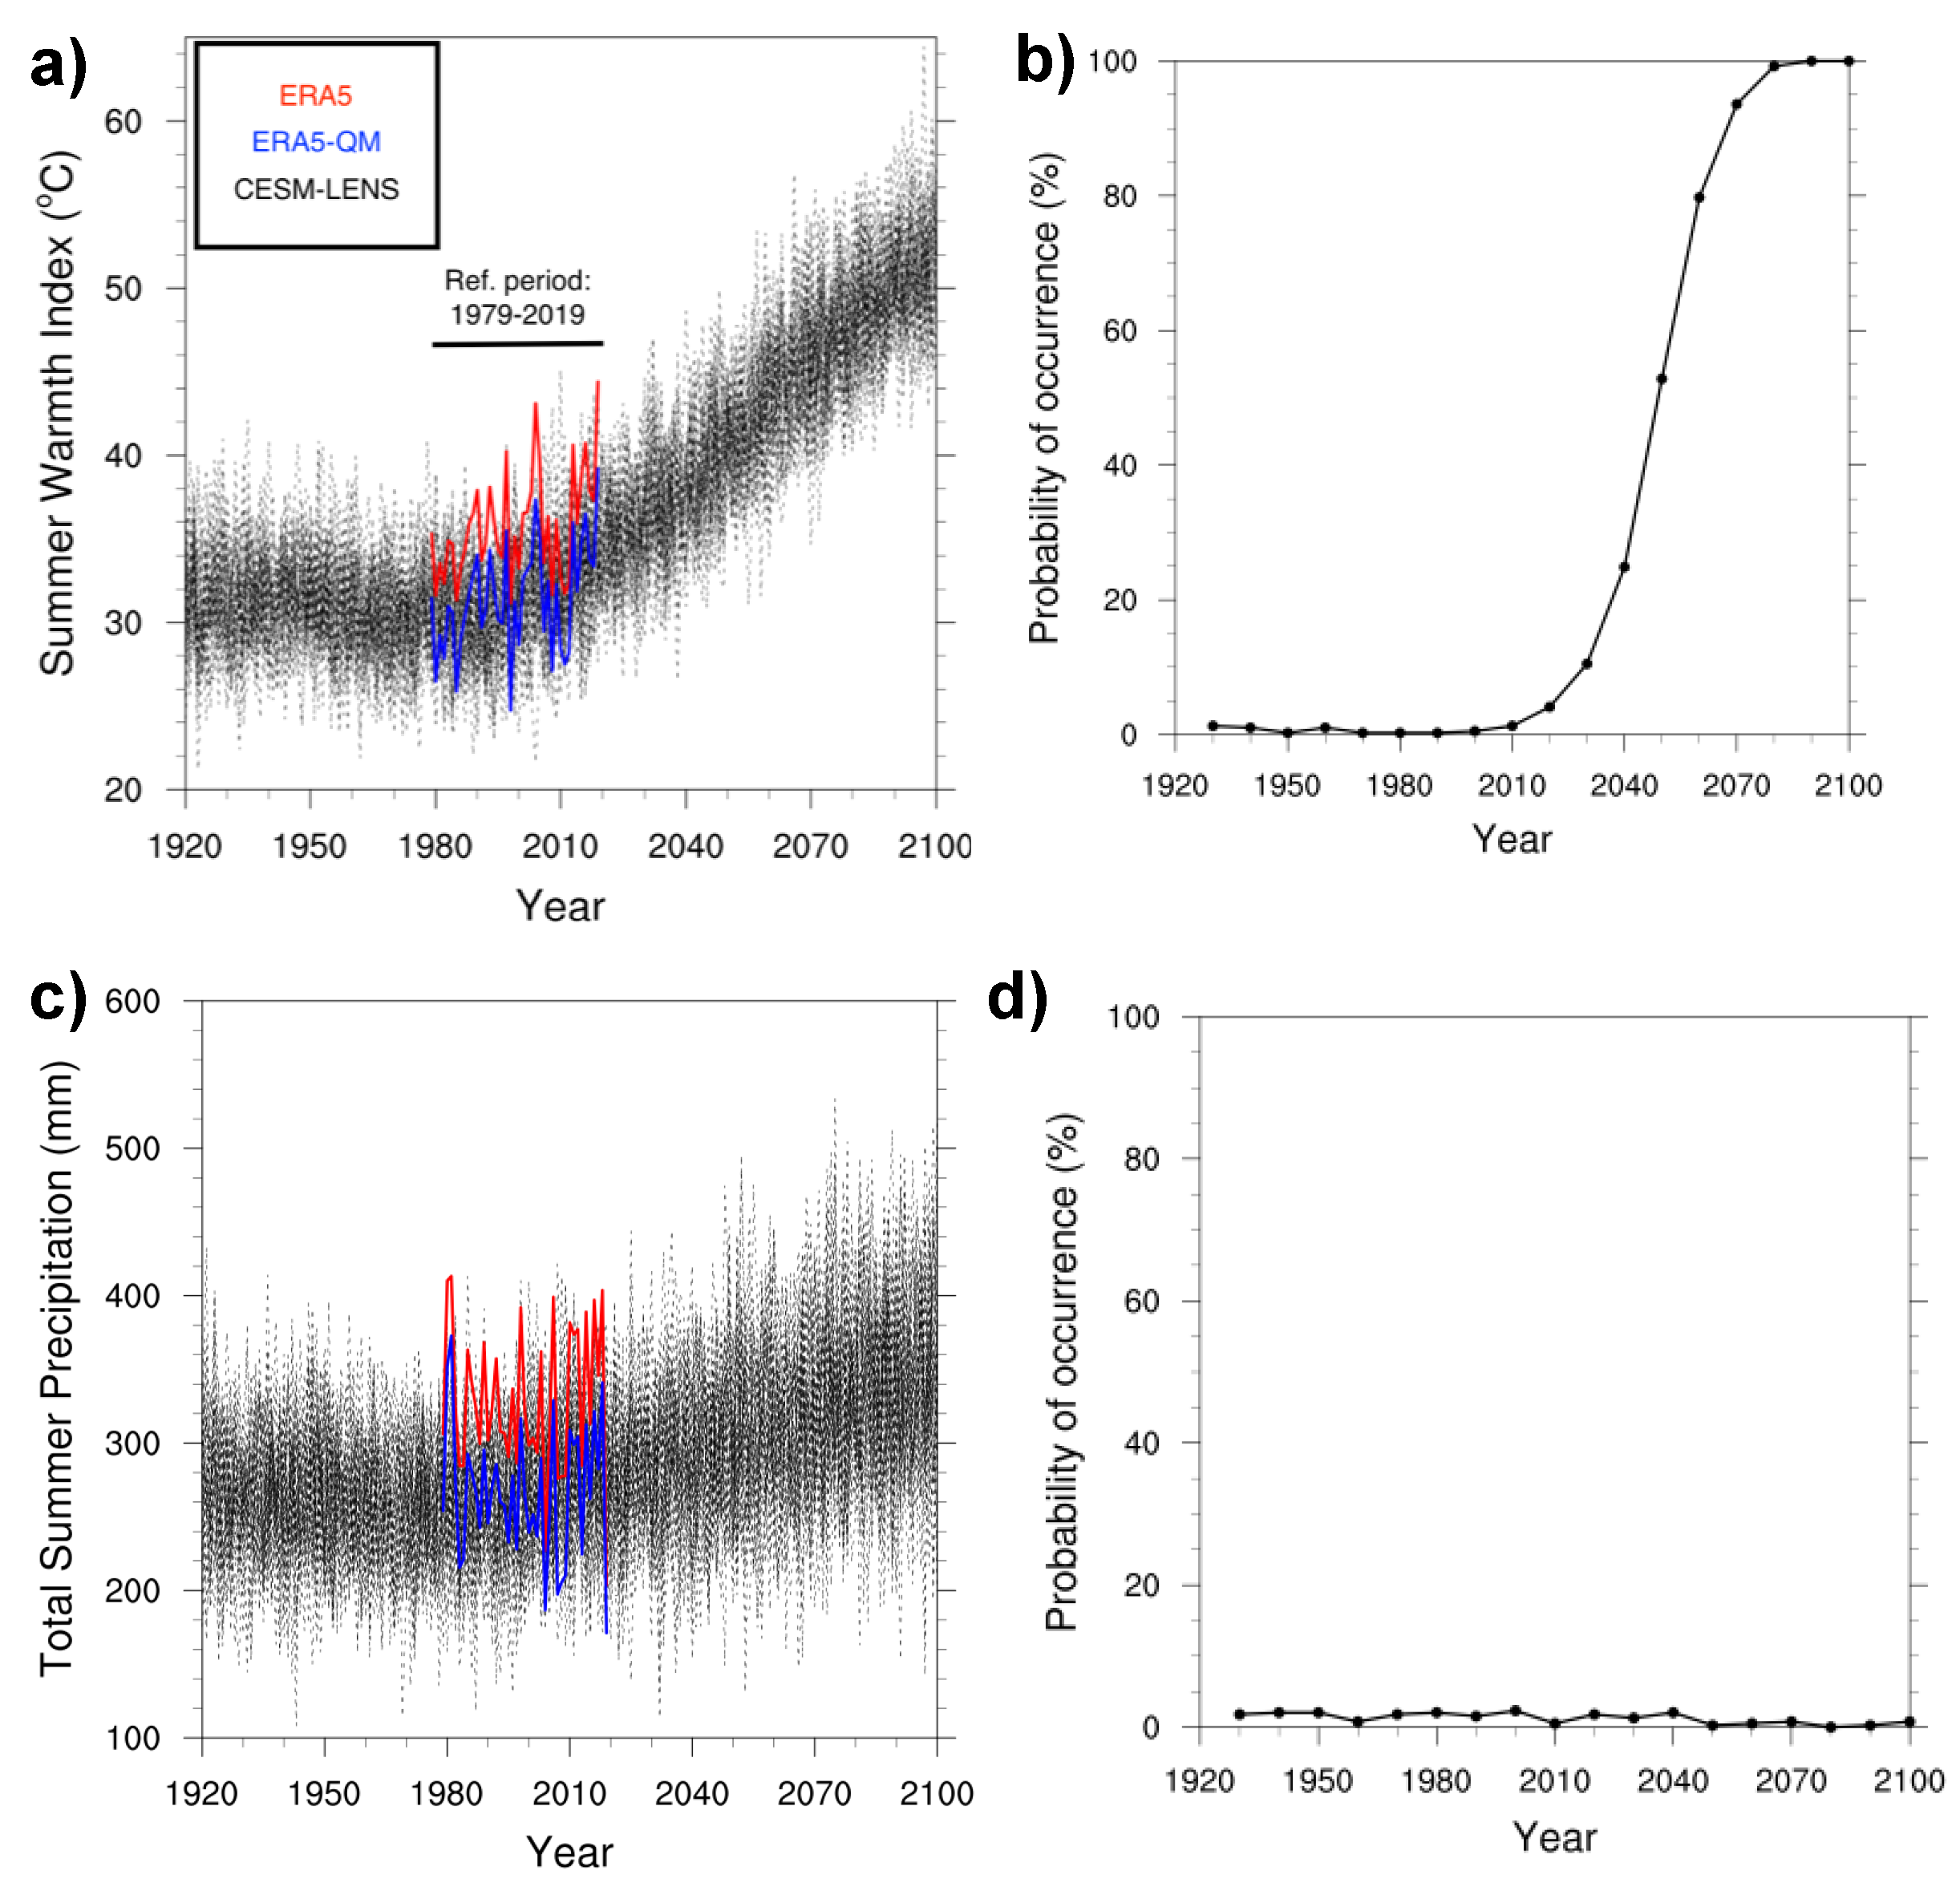
  • Do we expect more fire seasons in the future in Southcentral Alaska like 2019?
  • What are the relative contributions of temperature and precipitation to future changes of fire risk in Southcentral Alaska?
Section 2 describes the data and methods while Section 3 documents the events of 2019 in the historical observational setting, presents attribution and future projection analysis. Section 4 provides a discussion of these analyses and Section 5 contains the conclusions.

2. Data and Methods

2.1. Data

Observations at the Predictive Service Area (PSA) level for temperature and precipitation are based on station data from the Alaska Fire and Fuels (AKFF) website maintained by Mesowest (https://akff.mesowest.org/), an online cooperative data provider [19]. The AKFF database includes both National Weather Service stations and remote automatic weather stations (RAWS and USArray), which provide high-quality station data throughout the summer to monitor fire-relevant parameters.
The European Center Reanalysis version 5 (ERA5) [20] was used to represent observations because the drought measure SPEI (see Section 2.2 for definition) requires a long-term, consistent reference data set not available at many stations in the region [21]. ERA5 performs well in the Arctic [22] with fewer heterogeneities than station data for precipitation in Alaska [23]. The gridded ERA5 and climate model output (see below) were analyzed over a region bounded by 58–63° N and 144–157° W in order to represent the region south of the Alaska Range that included most of the PSAs of interest while excluding the mountains in the gridded data sets. Within this domain (red box, Figure 1 inset) land grid points (minimum 80% land) that are at or below 800 m in elevation were averaged to construct indices from gridded reanalysis and model data.
The role of anthropogenic climate change was quantified by using SPEI calculated from a climate model, the Community Earth System Model (CESM), for which a large ensemble (39 members were employed in this study) of simulations is available. The CESM model ranks among the top models representing temperature and precipitation in Alaska [24]. Comparisons of CESM and ERA5 depictions of temperature and precipitation from 1979 to 2019 for this study’s domain are included in Section 3. The use of a large ensemble from a single, widely used climate model offers the best means for assessing internal variability. A similar single-model strategy has been applied in the attribution of fire risk in Canada [25].

2.2. Methods

The key drivers of wildfire potential used in this attribution are monthly June–August temperature and precipitation, which are combined into the Standardized Precipitation Evapotranspiration Index (SPEI). SPEI is a measure of surface wetness/dryness defined as a normalization of precipitation minus potential evapotranspiration (PET) [26]. The normalization procedure produces a departure (in standard deviations) from the climatological mean for the location and calendar month. The SPEI was evaluated as a measure of fire danger using monthly accumulated precipitation and PET; cumulative June–August SPEI were constructed by summing 1-monthly values.
The monthly PETs were calculated using the Thornthwaite approach [27]. The Thornthwaite method was used over a more physical model like Penman−Monteith because of a lack of quality surface wind and solar radiation data in Alaska. The monthly P-PET values were normalized following the inverse normal approximation procedure in Vicente-Serrano et al. [26] but using the nonparametric Tukey plotting position to determine the probability positions of the data for simplicity [28], similar to the application for Evaporative Demand Drought Index [29].
Each ensemble member of the CESM Large Ensemble [30] provided monthly historical (1920–2005) and projected (2006–2100; RCP8.5) climate information. The 39 ensemble members from 1920–2100 were analyzed for two 41-year periods, 1979–2019 and 2040–2080. A 1000-year CESM-LENS preindustrial control simulation (PI) was randomly sampled, with the condition that each year was included once, to obtain 39 preindustrial ensemble members that were also 41 years in length. This provided a consistent framework to compare preindustrial, present and future SPEI.
SPEI requires a base climatological period against which to normalize the index. For ERA5 the observed 1979–2019 period was used. For a consistent comparison across the CESM suite of simulations, an ensemble average of the PI CESM was used as the base climatological period to normalize the 1920–2100 ensembles. The base climatological period is created by ranking the values in each ensemble member and then averaging across same ranks (i.e., the CESM-LENS rank 1 value is the average of the 39 rank 1 values) to construct the CESM-LENS distribution.
While this study uses the SPEI index because it can be readily evaluated from the monthly output available from the CESM simulations, an alternative metric of shorter-term (daily) variations of wildfire susceptibility is the Buildup Index (BUI). The BUI is computed from the 1300 (local time) air temperature, relative humidity, 24-hr accumulated precipitation, and herbaceous stage. The Buildup Index (BUI), part of the Canadian Fire Weather Index system was evaluated because it represents cumulative drying and potential flammability [31] and is used operationally by fire management in Alaska.

3. Results

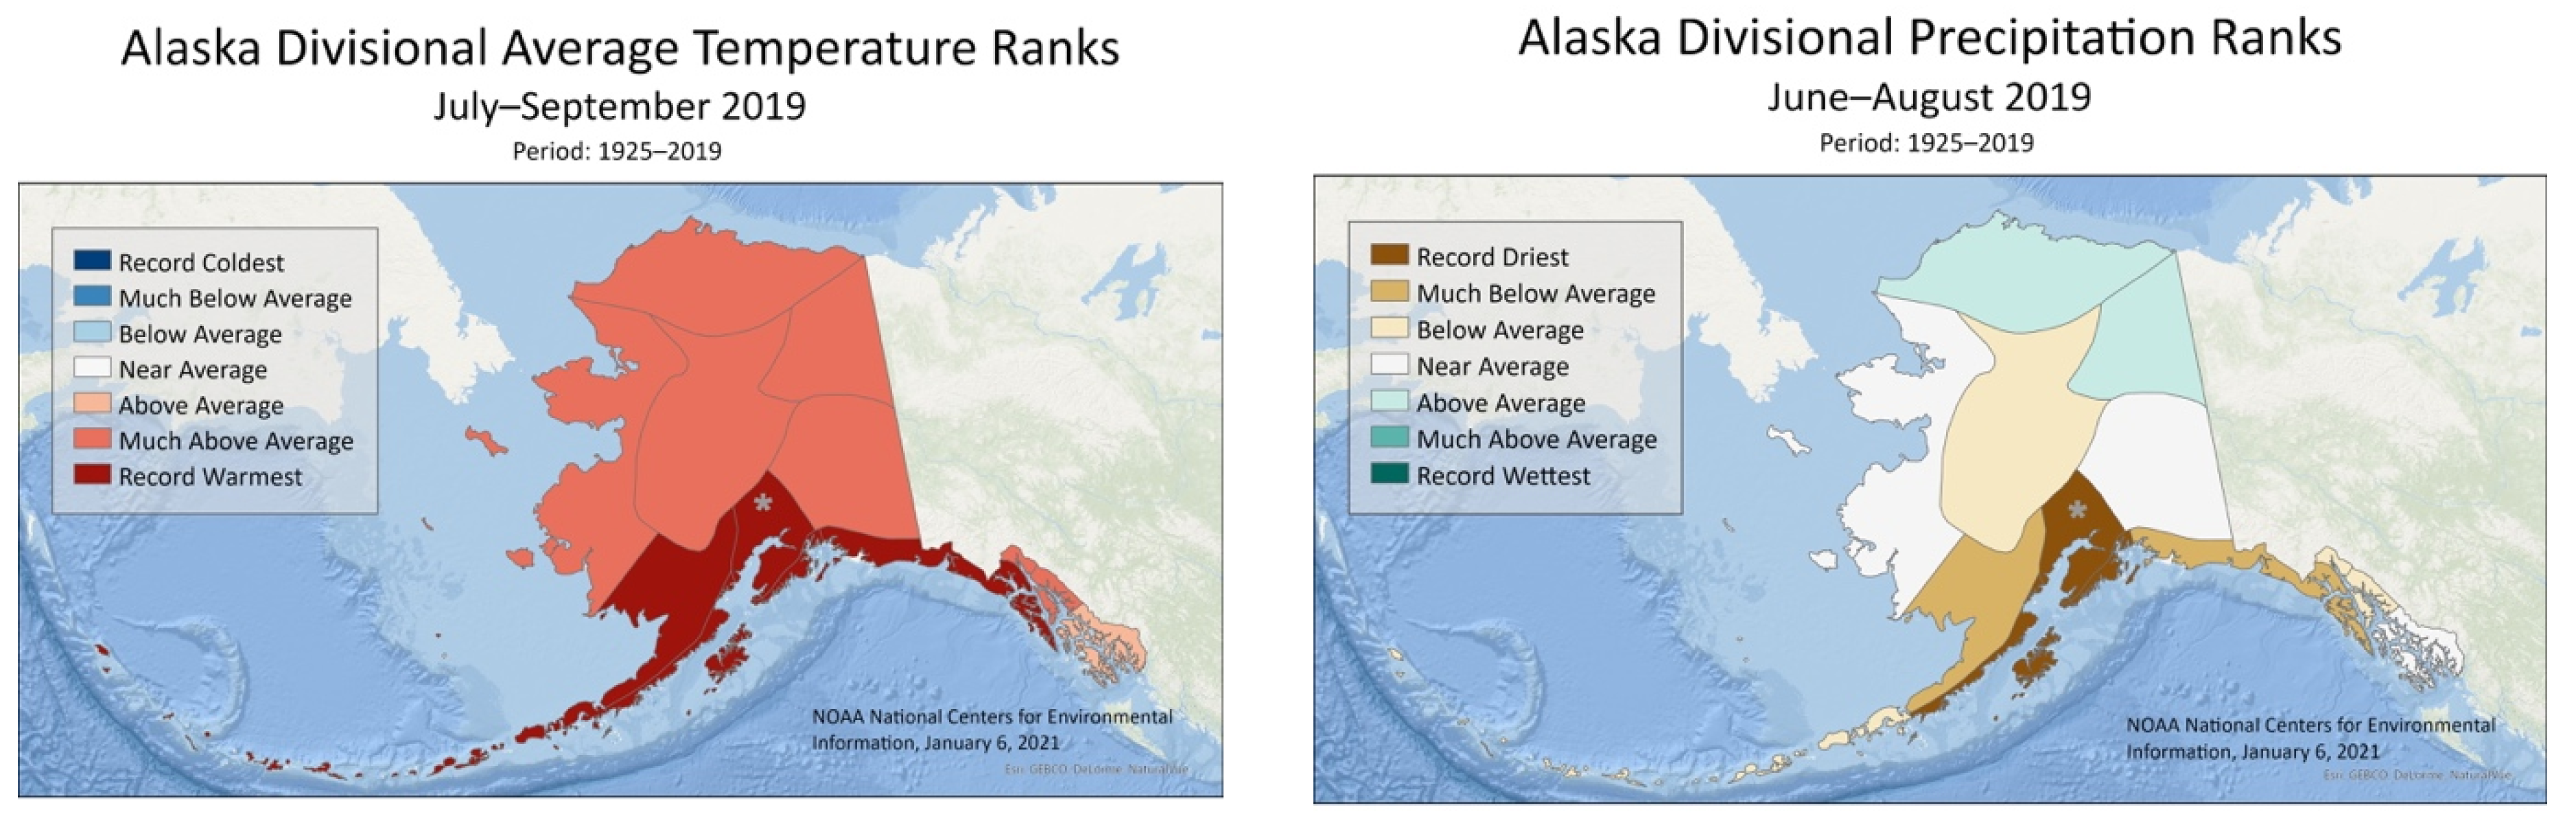
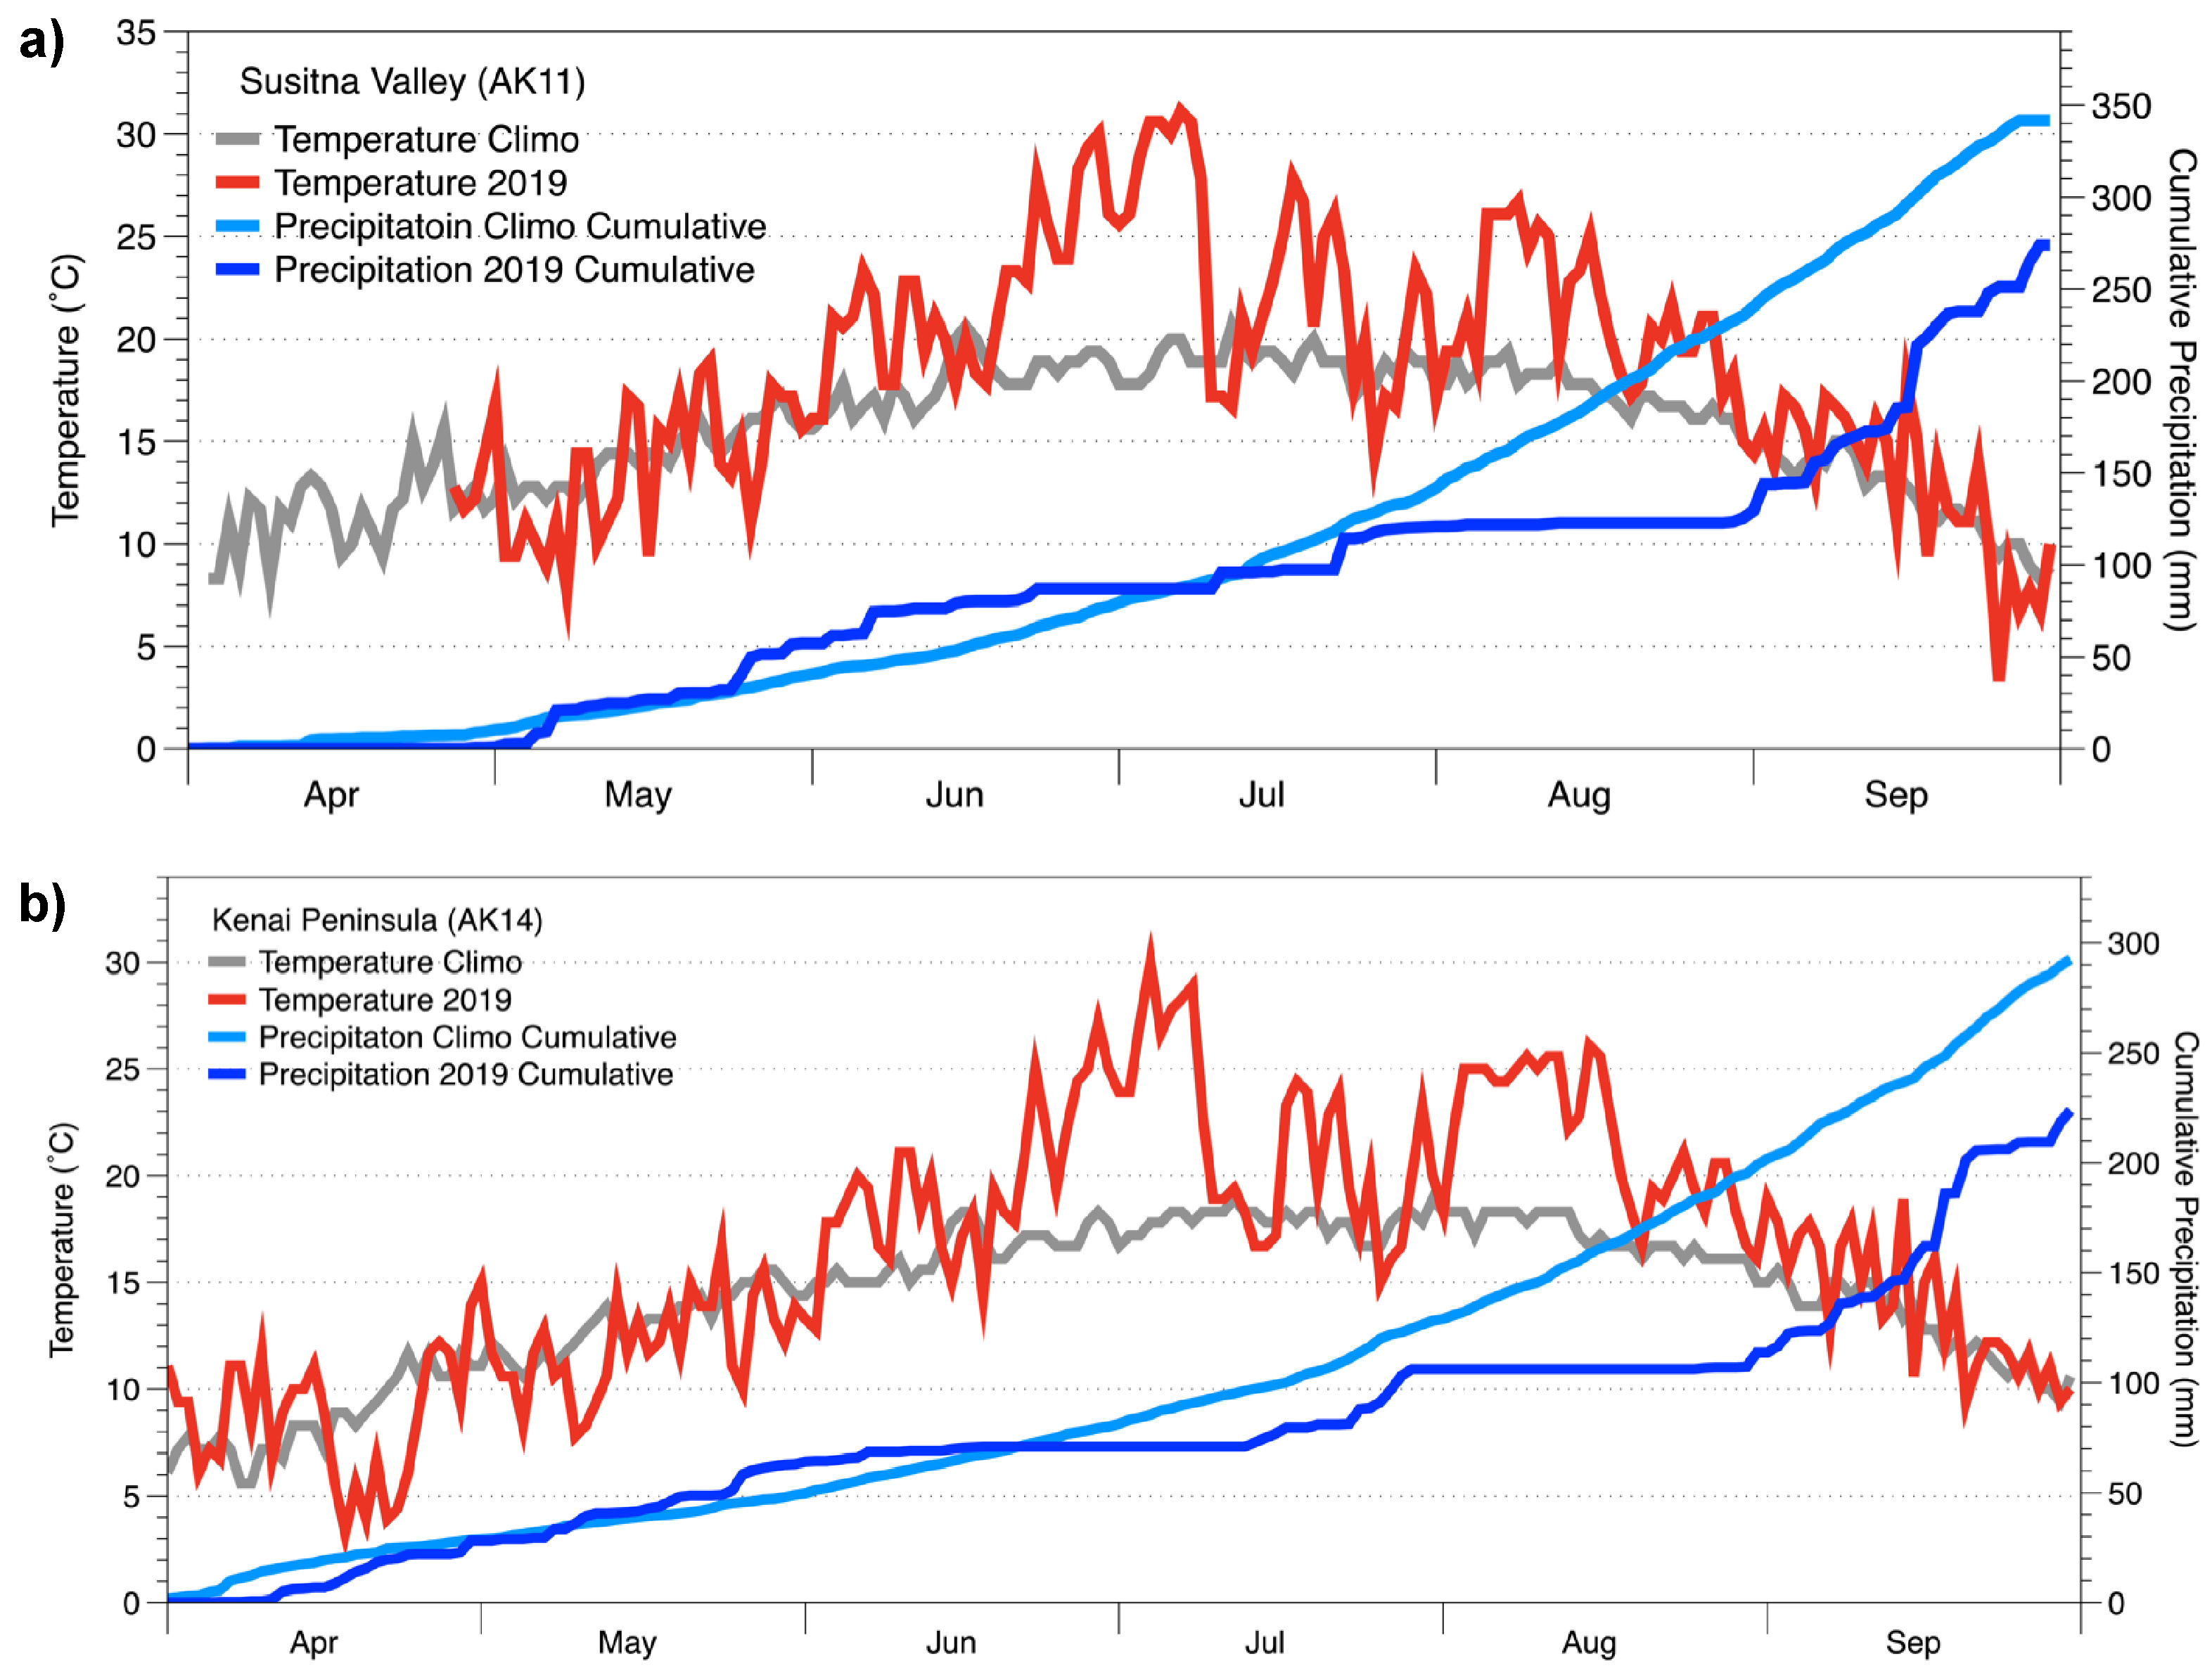
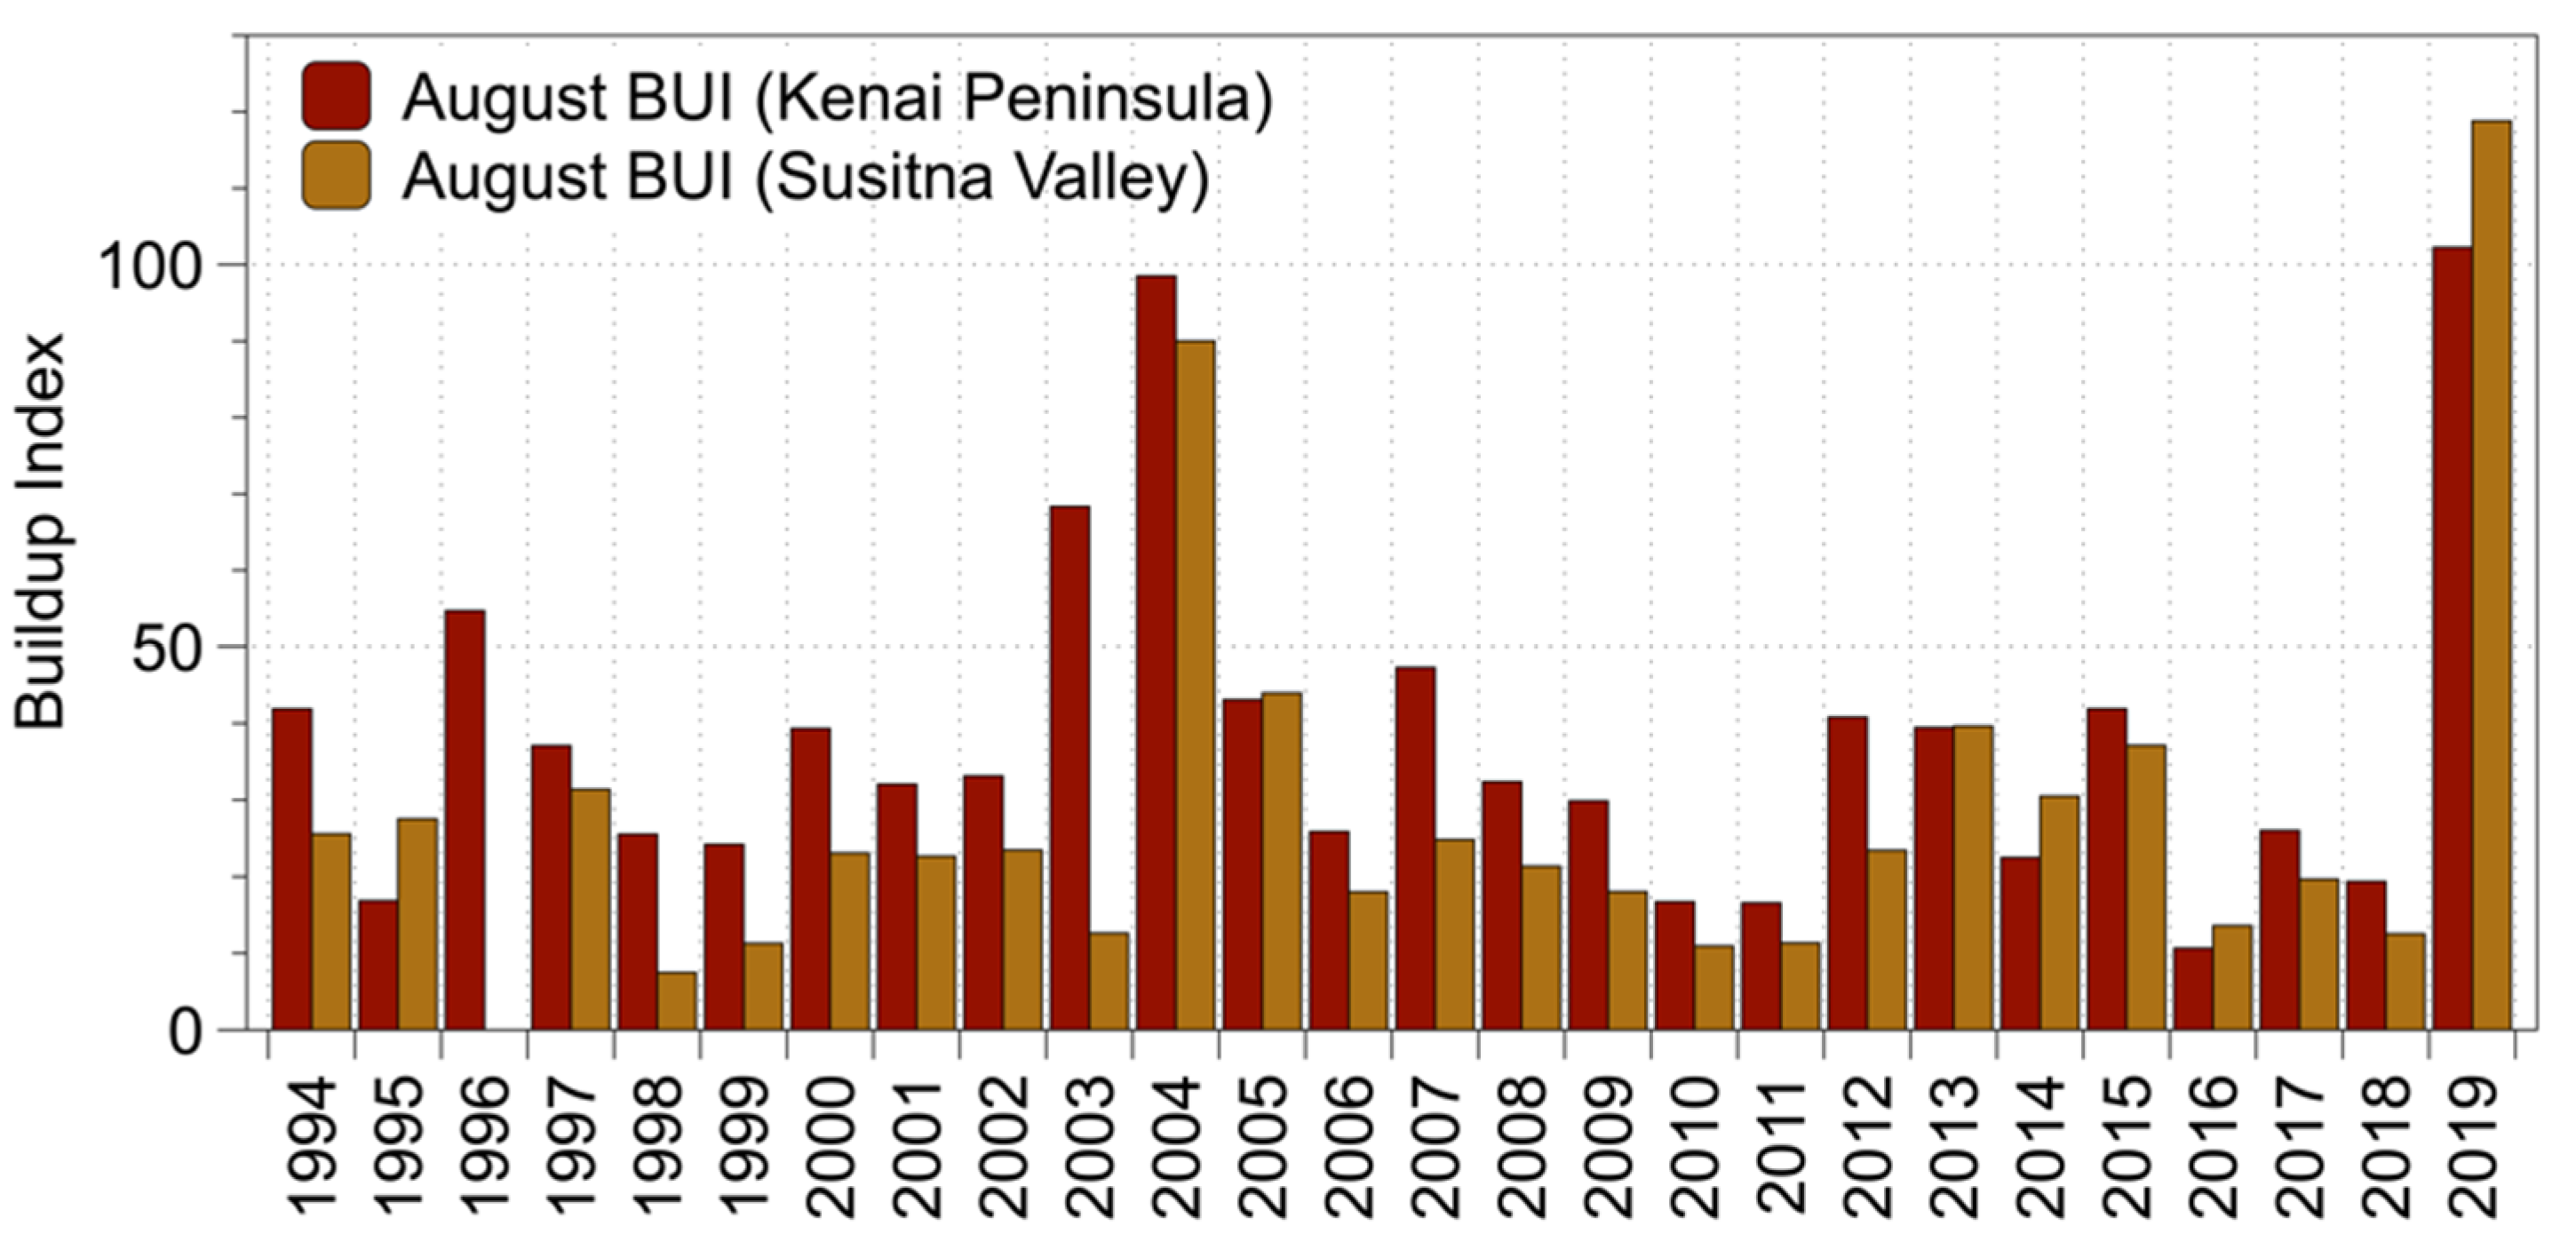
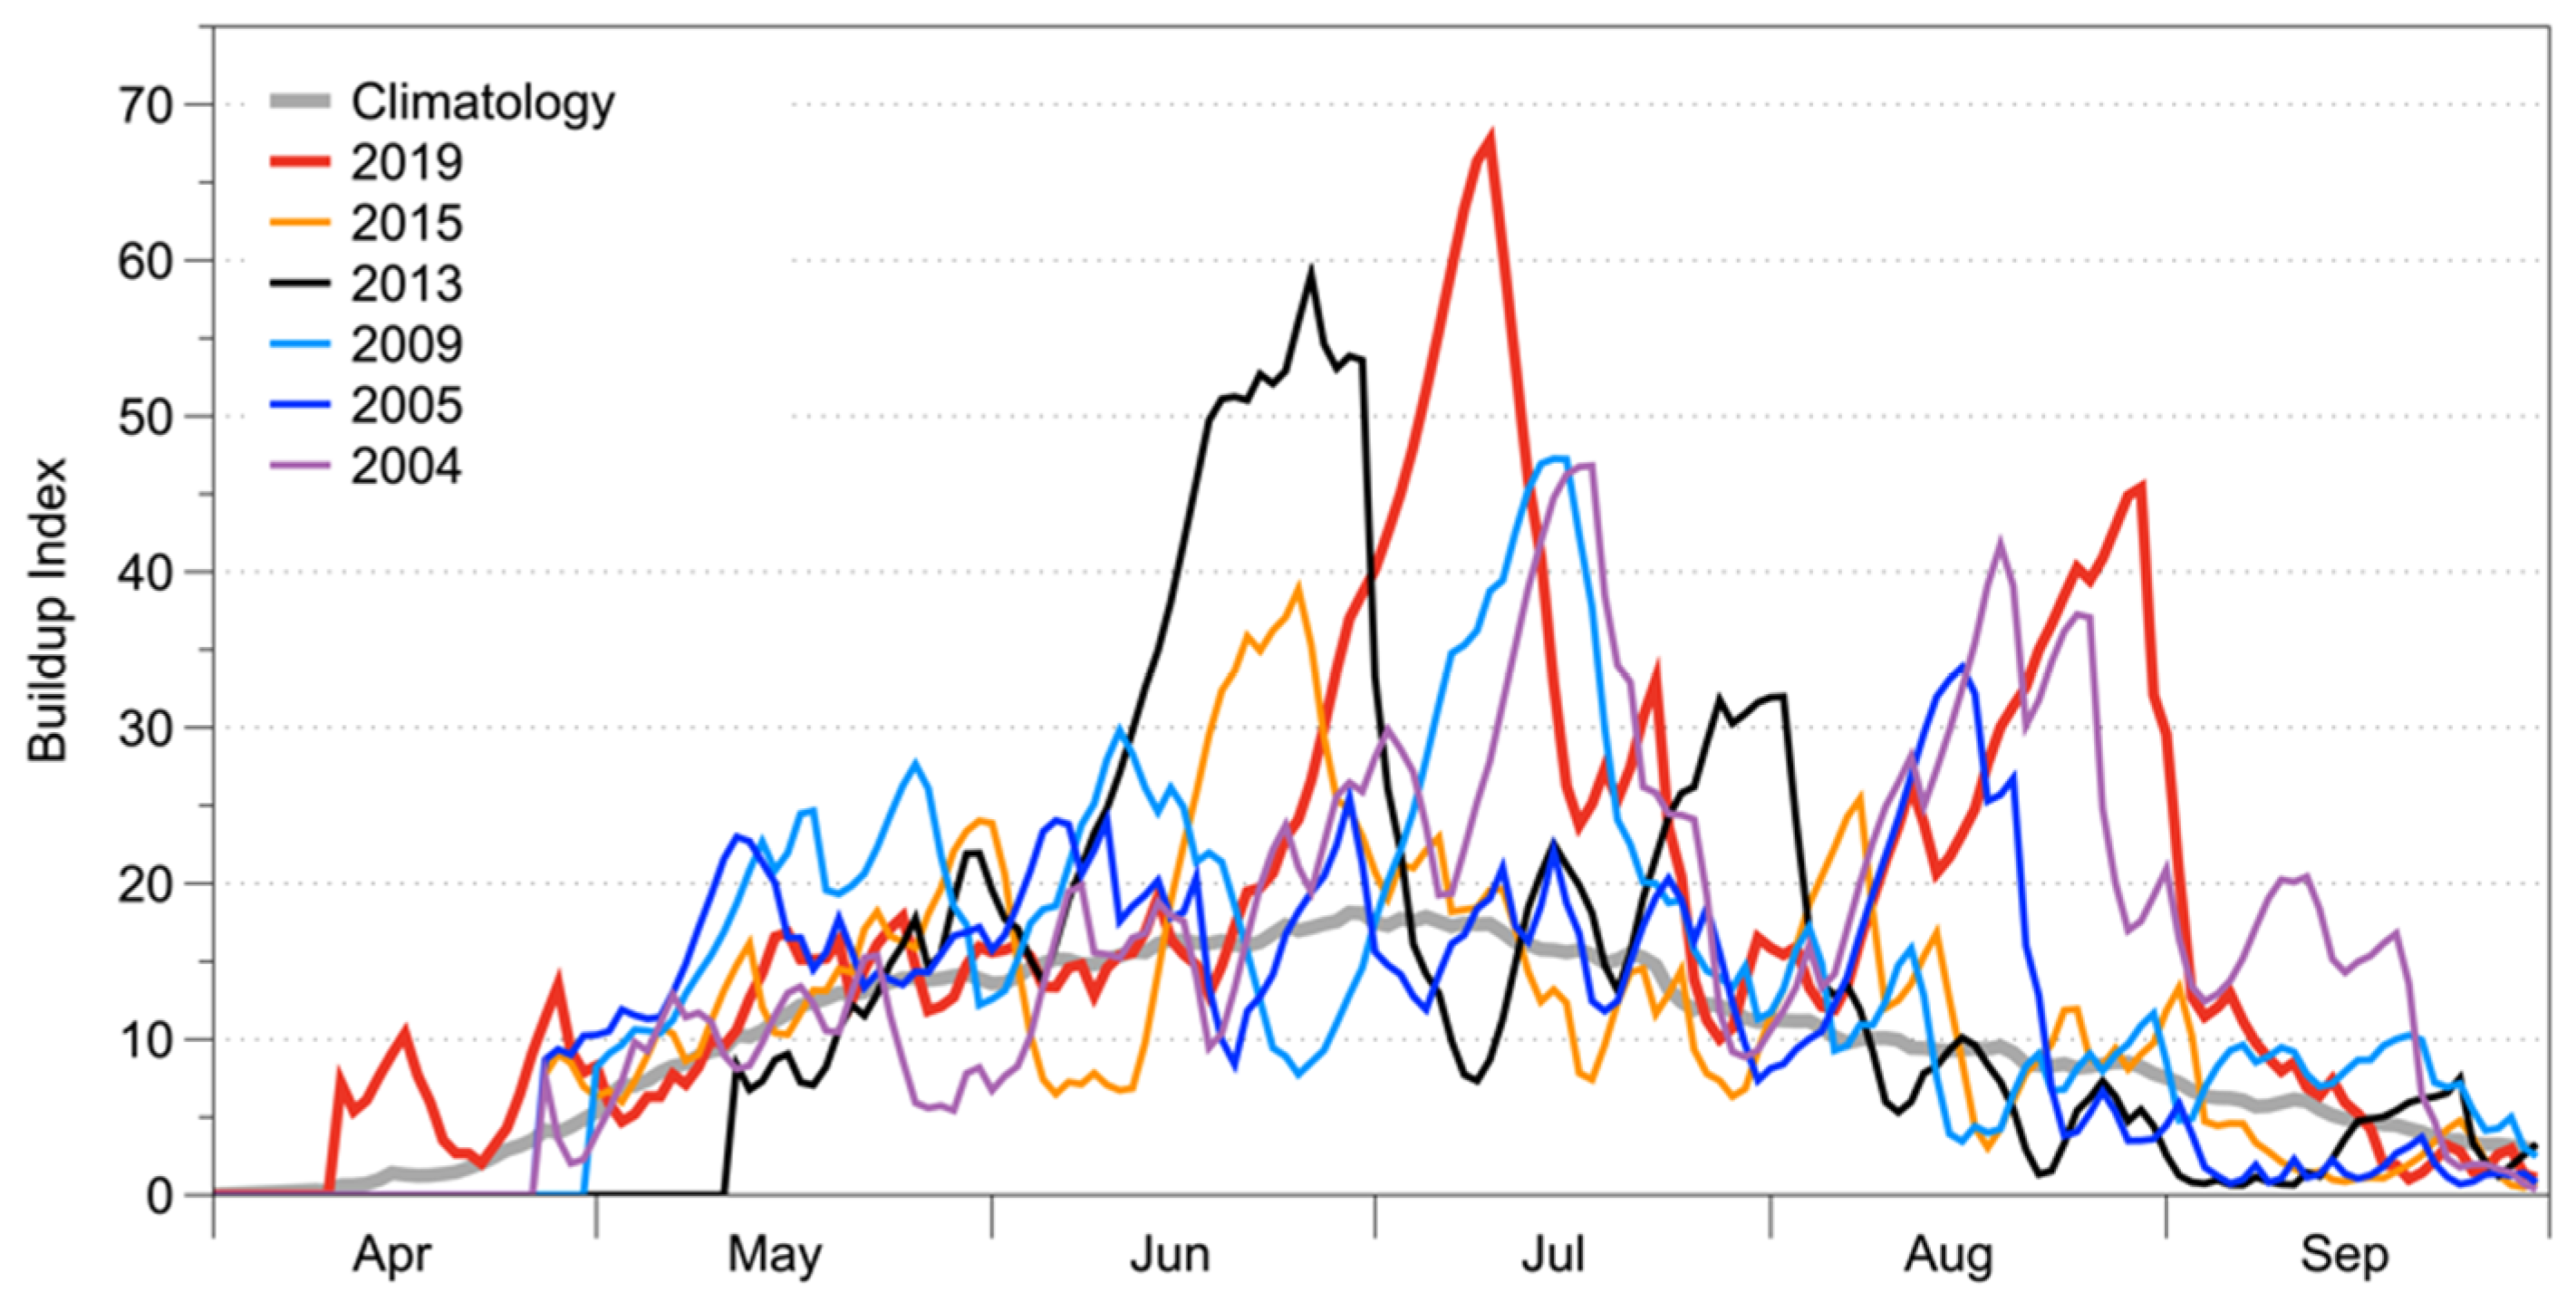
3.1. Historical Context

The summer of 2019 was characterized by abnormal warmth and dry conditions in Southcentral Alaska. Station-based temperatures showed several departures from the climatological (1981–2010) averages in both the Kenai Peninsula and Susitna PSAs (Figure 6), in which the Swan Lake and McKinley Fires occurred, respectively. Daily averaged temperatures from the AKFF database were more than 5–15 °C above normal from mid-June through early July in both PSAs. During this period, Anchorage reached its highest temperature ever recorded: 32 °C (90°F) on July 4, while nearby stations located farther from the coast reached even higher temperatures. Subsequent excursions of 5–10 °C above normal occurred over a multiday period in mid-July and during the first two-thirds of August. Figure 6 also shows that precipitation was well below normal over the June–August period, with the only notable precipitation occurring in late July. Even after several substantial rain events in September, the total warm-season (April–September) precipitation was approximately 25% below normal.
Figure 7 shows the August BUI values for 1994–2019 computed using AKFF data for the Kenai Peninsula and Susitna Valley PSAs. In both PSAs, the August values of the BUI were the highest of the entire period. The only prior year with BUI values approaching those of 2019 was 2004, in which the statewide total area burned by wildfire was the highest on record. Figure 8 compares the daily BUI evolution of 2019 with that of other severe fire years in Alaska based on the gridded ERA5 data. The daily BUI over our entire gridded analysis domain had two major peaks, in early July and late August in 2019, corresponding to the major growth periods of the Swan Lake and McKinley Fires. The evolution of BUI throughout the season from ERA5 reanalysis corresponds well to the station-based observations. While 2004 also had peaks with similar timing, the 2019 peaks were higher. In fact, the late-July peak of the daily BUI in 2019 exceeded the daily values of the severe fire years of 2004 and 2005, each of which had a larger statewide burn area than 2019.
The extreme nature of the 2019 fire season is also apparent in the ERA5-based domain averages of the seasonal and monthly temperature and precipitation, which form the basis of the SPEI attribution analysis in the following section. As shown in Figure 9, the domain-averaged temperature for the June–August (JJA) period was the highest while the JJA-averaged precipitation was the lowest of the entire 1979–2019 period spanned by the ERA5 reanalysis. Again, only 2004 comes close to matching the temperature and precipitation departures of 2019. The corresponding SPEI values are shown in Figure 10, where the SPEI values for the individual calendar months are color-coded. The 2019 SPEI deficits were large in each of the three summer months. Only four other years of the 41-year period had negative SPEI anomalies in all three summer months, and the 3-month total anomaly of 2019 was clearly the largest (of either sign) of the 41-year record.

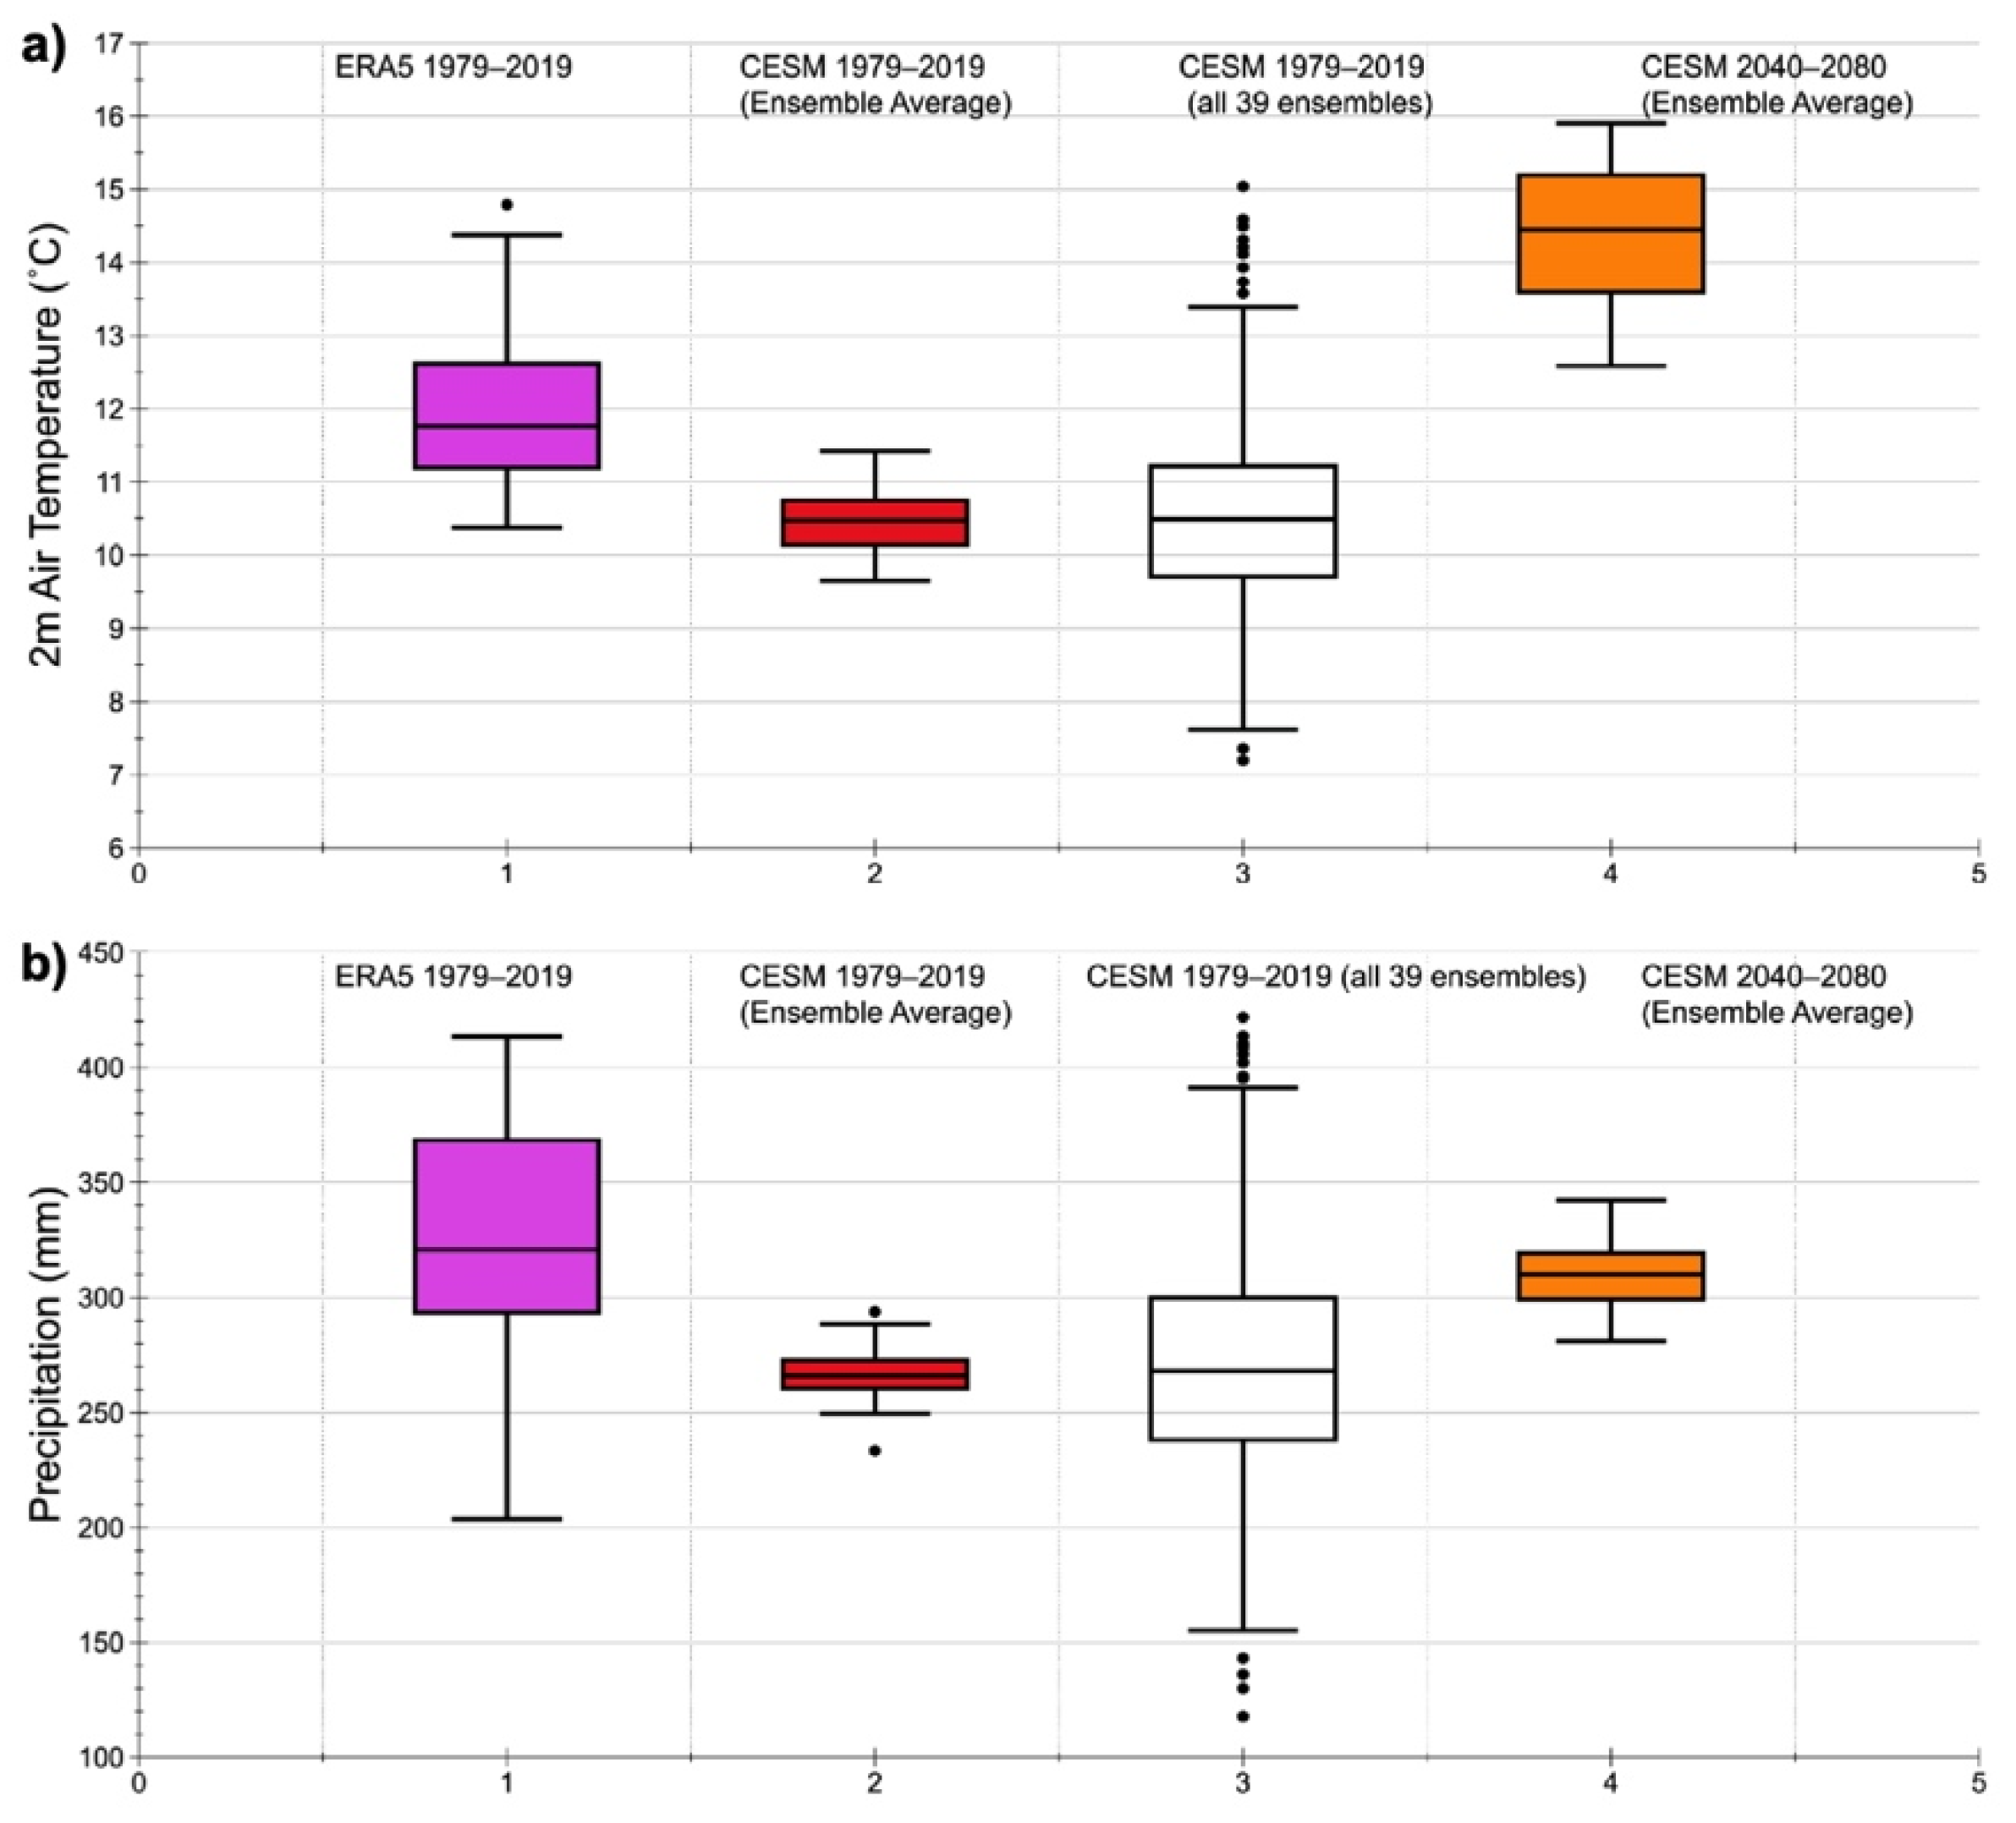
3.2. Attribution and Future Projections

Because air temperature and precipitation are the primary determinants of the SPEI, we begin the attribution analysis by summarizing the CESM-LENS simulations of 2 m air temperature and precipitation in comparison with ERA5 over the historical period. Figure 11 shows the medians and ranges of the yearly June–August values of these variables over 1979–2019 for ERA5 (left column), the 41 CESM-LENS yearly values averaged over all 39 ensemble members (second column), and the 41 × 39 CESM-LENS values for all years of all ensemble members (third column). It is apparent that the CESM tends to be cooler and drier than ERA5 over the historical period. The required bias-correction by quantile-mapping is described below. It is also apparent from the middle two columns of Figure 11 that the ensemble averaging narrows the range of CESM’s temperature and precipitation, but that the full set of 41 × 39 yearly values provides a larger sample for assessing frequencies of occurrence of extreme summers. Finally, column 4 of Figure 11 shows that CESM projects a future that is significantly warmer and wetter than the historical period over the domain of the analysis. The CESM distributions of the ensemble averages for 1979–2019 show no overlap with 2040–2080 in the case of temperature, and only a very slight overlap in the case of precipitation (columns 2 and 4 of Figure 11). This result is consistent with other studies of future trends in the Arctic, specifically with regard to the greater strength and earlier emergence of the temperature signal compared to the precipitation signal [32].
Figure 12a,c shows the yearly range of summer temperature and precipitation over the 1920–2100 period in the CESM-LENS ensemble, together with the ERA5 values for the 1979–2019 reference period. In this case, the summer temperature is plotted as the Summer Warmth Index, defined as the sum of the monthly mean temperatures (°C) above 0 °C. The cool and dry biases of the CESM relative to ERA5 are again apparent over the 1979–2019 reference period. In order to use the CESM-LENS output in an attribution analysis keyed to the ERA5 historical record, the distributions of ERA5 values were quantile-mapped to distributions of the CESM-LENS over the 1979–2019 reference period. In this way, the changing likelihoods of the 2019 values can be determined from the CESM-LENS output for the past and future decades, as shown in Figure 12b,d. Consistent with the historical data-based summaries in Section 4, the probabilities of 2019’s summer temperature were essentially zero prior to 2000, while the probabilities of precipitation as low as in 2019 were less than 5% in every decade from the 1920s onward. For the future, the probability of summer temperatures as warm as 2019 increases dramatically in the mid-21st century, reaching close to 100% by the 2080s. By contrast, the chances of a precipitation amount as low as in 2019 become even smaller, reaching essentially zero by mid-century.

4. Discussion

The trends towards higher summer temperatures and increased summer precipitation represent opposing influences on wildfire susceptibility in southern Alaska. The SPEI discussed earlier provides a metric to integrate these opposing effects on surface wetness. Therefore, SPEI values were computed from the monthly output of the CESM-LENS simulations and the ERA5 reanalysis. In ERA5, the lowest cumulative SPEI for JJA for the 1979–2019 period occurred in 2019 and is −5.02. The CESM ensemble-averages of the 41-year minima are −3.66 for the PI and −3.17 for 1979–2019, though by 2070 values closer to 2019 ERA5 are reached in CESM (Figure 13). The CESM data were not bias-corrected to the ERA5. Rather, CESM PI SPEIs were ranked and ensemble-averaged to construct minimum SPEI that were used as the baseline for comparison to the 1979–19 and 2040–80 periods for calculating probabilities of exceedance. The averaged CESM PI simulation has lower SPEI compared to CESM 1979–2019 (Figure 14) so there are few ensemble members in which the present-day JJA values of the SPEI exceed the corresponding monthly PI extremes (Table 1). However, the number of exceedances increases by 2040–2080 for JJA SPEI for ensemble-average comparisons and is even higher when individual ensemble members are considered. Exceedance probabilities for individual months are also shown in Table 1 for reference, but the persistent three months of hot dry conditions were key for the observed extreme fire season. Since SPEI is a normalized index, the 1979–2019 distributions for ERA5 and CESM look very similar with the exception of the extreme low ERA5 values and the higher ERA5 variability since ERA5 represents a single realization. Ensemble-average distributions from CESM for JJA SPEI (Figure 14) highlight that the CESM 1979–2019 is close but shifted slightly to the right of the PI distribution, whereas the CESM 2040–2080 has shifted to the left of the PI. Figure 15 displays a box plot of SPEI for all the ensemble members comprising 1979–2019 CESM. There are three ensemble members that reach SPEI values lower than the PI ensemble average. The CESM climate’s internal variability dominates over anthropogenic forcing until later in the century.
The salient result in Table 1 is that the probabilities of exceedances of preindustrial extremes of the SPEI increase later in the century, reaching 13.2% in June and 4.9% in the summer season average, indicating that the wildfire risk will increase in the coming decades. For June, the projected increase ranges among ensemble members from 0 to 27%, while the corresponding range for the summer season average is 0 to 17%. The projected increases for July and August are 8.9% (range: 0–12%) and 6.5% (range: 2.5–9.8%), respectively. It is noteworthy that the projected change dampens between June to August, perhaps in the form on increased season-ending rains. These projected changes are all substantially larger than the corresponding changes from the PI to the recent decades (1979–2019), which are 0.5% for the summer average, 2.1% for June, 1.9% for July and 2.4% for August. The fact that the recent changes are positive but much smaller than the projected future changes leads to the conclusion that the signal of anthropogenic forcing is emergent but not yet a major contributor to the wildfire risk in Southcentral Alaska. In contrast, Partain et al. [18] found that anthropogenic forcing has increased the risk of an event like the 2015 Interior Alaska fire season by 34–64% in an attribution analysis using BUI. Southcentral Alaska has climatologically cooler and wetter summers than Interior Alaska (i.e., compare Cook Inlet to Central Interior climate divisions in [1]), therefore it is not surprising that there is a weaker anthropogenic signal than in the Interior.
The future CESM SPEI values arise within the context of projected higher precipitation and higher temperatures (Figure 11 and Figure 12). Because the trends toward wetter and warmer conditions favor opposing changes in the SPEI, the projected decrease in the SPEI with more frequent negative extremes indicates that temperature rise is the more important driver. A notable caveat of this analysis is the SPEI’s dependence on the formulation of PET. PET estimates for Alaska can vary significantly with the choice of the PET formulation [33], especially when temperature and precipitation trends push PET in opposite directions.

5. Conclusions

For the areas of Southcentral Alaska affected by the 2019 wildfires, the cumulative June–August ERA5 SPEI was the lowest of the post-1979 period. The result was an unusually prolonged fire season with more than $70 million in suppression costs, unprecedented degradation of air quality with largely unknown health impacts, and economic losses including the disruption of tourism activities during the peak summer season. A comparison of climate model simulations of the preindustrial and present-day (1979–2019) periods shows that anthropogenic forcing has not yet increased the likelihood, relative to the preindustrial, of extremely low SPEI values and, by implication, the conditions favoring the 2019 wildfires in Southcentral Alaska. However, the model results for future decades show an emergent signal of more frequent negative extremes of the SPEI and hence an increased risk of severe wildfire years.
The projected changes presented here are based on a single-model ensemble under the RCP 8.5 forcing scenario, which is at the high end of the emission scenarios used in the Fifth Assessment Report (AR5) of the Intergovernmental Panel on Climate Change [34]. Output from this and other models used in AR5 shows that the changes projected for Alaska under weaker forcing scenarios are qualitatively similar but quantitatively weaker than under RCP 8.5 (e.g., [16], see also https://www.snap.uaf.edu/tools/community-charts). The changes of temperature and precipitation projected for most locations in Alaska scale almost linearly with the projected change in global temperature, which in turn varies monotonically with the magnitude of the RCP forcing. While greenhouse gas emissions have generally been following the RCP 8.5 scenario over the past decade, the projected probabilities of exceedance reported here should be reduced accordingly if a weaker forcing scenario is assumed.
This study provides a glimpse into a potential future with increased risk of late season wildland fire in highly populated Southcentral Alaska, where 75% of Alaska’s 734,000 denizens live [35]. Wildland fire is a natural part of the boreal ecosystem so while fires cannot be prevented, their impacts can be managed through diligent preparation to minimize loss of property and lives. Studies like this can serve as evidence that community leaders can use to incentivize residents to invest in developing fire-safe strategies such as removing flammable items from around their homes and having an escape plan in increasingly fire-prone areas. Increased communication with the public on fire-safe strategies is timely. For example, a recent public service communication about the McKinley Fire demonstrates the positive outcomes that resulted from fire-safe improvements [36]. The results obtained here also serve to inform decision-support for managing firefighting resources. Specifically, based on the projections that fire years like 2019 will become more common in the future, managers must ensure that firefighters and equipment are available in southern Alaska later in the season than previously.

Author Contributions

The contributions to the manuscript were as follows: conceptualization, K.B., H.S., E.S., R.J., A.Y., C.M., U.S.B., J.E.W., R.T.L., P.A.B., R.T., T.S.R., R.Z., A.Y.; methodology, D.M., J.W.; software and validation, A.S.H., C.B.-S., C.W.; formal analysis and investigation, U.S.B., R.T.L., P.A.B., J.E.W. and M.H.; writing—original draft preparation, U.S.B., J.E.W., R.T.L., M.B., J.S., M.H., H.S., R.T., J.L.; visualization J.C., C.W.; and writing—review and editing, all authors. All authors have read and agreed to the published version of the manuscript.

Funding

The National Science Foundation (#OIA-1753748), the State of Alaska, the United States Geological Survey (G17AC00363), and the Alaska Climate Adaptation Science Center (G17AC00213) provided support for this study. NOAA supported this work through grants #NA16OAR4310162 (R.T., J.E.W., A.Y.) and #NA16OAR4310142 (U.S.B., P.A.B.).

Data Availability Statement

The raw data presented in this study are openly available in their respective repositories. [Figure 2 was prepared with data from NASA. We acknowledge the use of data and/or imagery from NASA’s Fire Information for Resource Management System (FIRMS) (https://earthdata.nasa.gov/firms), part of the NASA Earth Observing System Data and Information System (EOSDIS). NRT VIIRS 375 m Active Fire product VNP14IMGT distributed from NASA FIRMS. Available on-line: https://earthdata.nasa.gov/firms]. doi:10.5067/FIRMS/VIIRS/VNP14IMGT_NRT.002]; [Figure 4 was prepared using Air quality data from the EPA Air Quality Program available on-line: https://www.epa.gov/outdoor-air-quality-data]; [Figure 5 data was provided by NOAA National Centers for Environmental information, Climate at a Glance: Divisional Mapping at https://www.ncdc.noaa.gov/cag/]; [Figure 6 and Figure 7 were prepared using data from Mesowest at: https://akff.mesowest.org/]; [Figure 8 data are available at https://zenodo.org/record/3626193#.YAHgsOBRdTY]; [Figure 9 and Figure 10 were prepared using ERA5 data available at: https://www.ecmwf.int/en/forecasts/datasets/reanalysis-datasets/era5]; [Figure 11, Figure 12, Figure 13, Figure 14 and Figure 15 were prepared using NCAR LENS data available at on the Earth System Grid using guidance at: https://www.cesm.ucar.edu/projects/community-projects/LENS/data-sets.html]. Processed data used to generate the Figure 6, Figure 7, Figure 8, Figure 9, Figure 10, Figure 11, Figure 12, Figure 13, Figure 14 and Figure 15 are available at the Alaska EPSCoR archive at: https://ak-epscor.portal.axds.co/#metadata/4000717f-1bc3-471e-bf68-eadf665e8175/project/files.

Acknowledgments

We thank Grace Kuiper for air quality data analysis. We thank Piyush Jain for the ERA5 BUI data. We thank Vanessa Raymond for her assistance in archiving our processed data. We thank the two anonymous reviewers for insightful comments that helped to improve this manuscript.

Conflicts of Interest

The authors declare no conflict of interest.

References

  1. Bieniek, P.A.; Bhatt, U.S.; Thoman, R.L.; Angeloff, H.; Partain, J.; Papineau, J.; Fritsch, F.; Holloway, E.; Walsh, J.E.; Daly, C.; et al. Climate Divisions for Alaska Based on Objective Methods. J. Appl. Meteorol. Clim. 2012, 51, 1276–1289. [Google Scholar] [CrossRef] [Green Version]
  2. AICC. 2019 Fire Season Weather Summary. 2019. Available online: https://fire.ak.blm.gov/content/Weather%20Folder/Fire%20Season%20Summaries/2019%20Fire%20Season.pdf (accessed on 10 December 2020).
  3. Homes, H.; Parrott, J. Scenes of Destruction: The McKinley Fire Raced for Miles along the Parks Highway. Anchorage Daily News. 7 September 2019. Available online: https://www.adn.com/visual/photos/2019/09/07/scenes-of-destruction-the-mckinley-fire-raced-for-miles-along-the-parks-highway/ (accessed on 15 January 2021).
  4. Earl, E. Feds Declare Economic Disasters for Swan Lake, McKinley Fires. Alsk. J. Commer. 2019. Available online: https://www.alaskajournal.com/2019-11-20/feds-declare-economic-disasters-swan-lake-mckinley-fires (accessed on 15 January 2021).
  5. AWFI. Ash Pits Are Hazardous to Firefighters. 2019. Available online: https://akfireinfo.com/2019/09/05/ash-pits-are-hazardous-to-firefighters (accessed on 10 December 2020).
  6. Hahn, M.B.; Kuiper, G.; O’Dell, K.; Fischer, E.V.; Magzamen, S. Wildfire smoke is associated with an increased risk of cardiorespiratory emergency room visits in Alaska. GeoHealth 2020. in review. [Google Scholar]
  7. NICC. National Interagency Coordination Center: Wildland Fire Summary and Statistics Annual Report 2019. 2019. Available online: https://www.predictiveservices.nifc.gov/intelligence/2019_statssumm/intro_summary19.pdf (accessed on 15 January 2021).
  8. AICC. Incident Information-Alaska Fires. 2020. Available online: https://fire.ak.blm.gov/incinfo/aklgfire.php (accessed on 10 December 2020).
  9. Petersen, V. Transmission line damaged by Swan Lake Fire repaired, re-energized. Peninsula Clarion. 19 December 2019. Available online: https://www.peninsulaclarion.com/news/transmission-line-damaged-by-swan-lake-fire-repaired-re-energized/ (accessed on 15 January 2021).
  10. Brehmer, E. Bradley Lake power line outage from wildfire tops $10M in cost to Alaska Railbelt ratepayers. Anchorage Daily News. 13 December 2019. Available online: https://www.adn.com/business-economy/2019/12/13/bradley-lake-power-line-outage-from-wildfire-tops-10m-in-cost-to-alaska-railbelt-ratepayers/ (accessed on 15 January 2021).
  11. Ascoli, D.; Hacket-Pain, A.; LaMontagne, J.M.; Cardil, A.; Conedera, M.; Maringer, J.; Motta, R.; Pearse, I.S.; Vacchiano, G. Climate teleconnections synchronize Picea glauca masting and fire disturbance: Evidence for a fire-related form of environmental prediction. J. Ecol. 2020, 108, 1186–1198. [Google Scholar] [CrossRef]
  12. Duffy, P.A.; Walsh, J.E.; Graham, J.M.; Mann, D.H.; Rupp, T.S. Impacts of large-scale atmospheric–ocean Variability on Alaskan fire season severity. Ecol. Appl. 2005, 15, 1317–1330. [Google Scholar] [CrossRef] [Green Version]
  13. Hess, J.C.; Scott, C.A.; Hufford, G.L.; Fleming, M.D. El Niño and its impact on fire weather conditions in Alaska. Int. J. Wildland Fire 2001, 10, 1–13. [Google Scholar] [CrossRef]
  14. Fauria, M.M.; Johnson, E.A. Large-scale climatic patterns control large lightning fire occurrence in Canada and Alaska forest regions. J. Geophys. Res. Biogeosci. 2006, 111. [Google Scholar] [CrossRef] [Green Version]
  15. Wolken, J.M.; Hollingsworth, T.N.; Rupp, T.S.; Chapin, F.S., III; Trainor, S.F.; Barrett, T.M.; Sullivan, P.F.; McGuire, A.D.; Euskirchen, E.S.; Hennon, P.E.; et al. Evidence and implications of recent and projected climate change in Alaska’s forest ecosystems. Ecosphere 2011, 2, 1–35. [Google Scholar] [CrossRef]
  16. Markon, C.; Gray, S.; Berman, M.; Eerkes-Medrano, L.; Hennessy, T.; Huntington, H.; Littell, J.; McCammon, M.; Thoman, R.; Trainor, S. 2018: Alaska. In Impacts, Risks, and Adaptation in the United States: Fourth National Climate Assessment; Reidmiller, D.R., Avery, C.W., Easterling, D.R., Kunkel, K.E., Lewis, K.L.M., Maycock, T.K., Stewart, B.C., Eds.; U.S. Global Change Research Program: Washington, DC, USA, 2018; Volume II, pp. 1185–1241. [Google Scholar] [CrossRef]
  17. Bieniek, P.A.; Walsh, J.E.; Thoman, R.L.; Bhatt, U.S. Using Climate Divisions to Analyze Variations and Trends in Alaska Temperature and Precipitation. J. Clim. 2014, 27, 2800–2818. [Google Scholar] [CrossRef]
  18. Partain, J.L.; Alden, S.; Strader, H.; Bhatt, U.S.; Bieniek, P.A.; Brettschneider, B.R.; Walsh, J.E.; Lader, R.T.; Olsson, P.Q.; Rupp, T.S.; et al. An Assessment of the Role of Anthropogenic Climate Change in the Alaska Fire Season of 2015. Bull. Am. Meteorol. Soc. 2016, 97, S14–S18. [Google Scholar] [CrossRef]
  19. Horel, J.; Splitt, M.; Dunn, L.; Pechmann, J.; White, B.; Ciliberti, C.; Lazarus, S.; Slemmer, J.; Zaff, D.; Burks, J. Mesowest: Cooperative mesonets in the western United States. Bull. Am. Meteorol. Soc. 2002, 83, 211–226. [Google Scholar] [CrossRef]
  20. Hersbach, H.; Bell, B.; Berrisford, P.; Hirahara, S.; Horányi, A.; Muñoz-Sabater, J.; Nicolas, J.; Peubey, C.; Radu, R.; Schepers, D.; et al. The ERA5 global reanalysis. Q. J. R. Meteorol. Soc. 2020, 146, 1999–2049. [Google Scholar] [CrossRef]
  21. Ziel, R.H.; Bieniek, P.A.; Bhatt, U.S.; Strader, H.; Rupp, T.S.; York, A. A Comparison of Fire Weather Indices with MODIS Fire Days for the Natural Regions of Alaska. Forests 2020, 11, 516. [Google Scholar] [CrossRef]
  22. Graham, R.M.; Hudson, S.R.; Maturilli, M. Improved Performance of ERA5 in Arctic Gateway Relative to Four Global Atmospheric Reanalyses. Geophys. Res. Lett. 2019, 46, 6138–6147. [Google Scholar] [CrossRef] [Green Version]
  23. White, J.H.R.; Walsh, J.E.; Thoman, R.L. Using Bayesian statistics to detect trends in Alaskan precipitation. Int. J. Climatol. 2020. [Google Scholar] [CrossRef]
  24. Walsh, J.E.; Bhatt, U.S.; Littell, J.S.; Leonawicz, M.; Lindgren, M.; Kurkowski, T.A.; Bieniek, P.A.; Thoman, R.; Gray, S.; Rupp, T.S. Downscaling of climate model output for Alaskan stakeholders. Environ. Model. Softw. 2018. [Google Scholar] [CrossRef]
  25. Kirchmeier-Young, M.C.; Zwiers, F.W.; Gillett, N.P.; Cannon, A.J. Attributing extreme fire risk in Western Canada to human emissions. Clim. Chang. 2017, 144, 365–379. [Google Scholar] [CrossRef] [PubMed] [Green Version]
  26. Vicente-Serrano, S.M.; Beguería, S.; López-Moreno, J.I. A Multiscalar Drought Index Sensitive to Global Warming: The Standardized Precipitation Evapotranspiration Index. J. Clim. 2010, 23, 1696–1718. [Google Scholar] [CrossRef] [Green Version]
  27. Thornthwaite, W.C. An Approach towards a Rational Classification of Climate. Geogr. Rev. 1948, 38, 55–94. [Google Scholar] [CrossRef]
  28. Farahmand, A.; AghaKouchak, A. A generalized framework for deriving nonparametric standardized drought indicators. Adv. Water Resour. 2015, 76, 140–145. [Google Scholar] [CrossRef]
  29. Hobbins, M.T.; Wood, A.; McEvoy, D.J.; Huntington, J.L.; Morton, C.; Anderson, M.; Hain, C. The Evaporative Demand Drought Index. Part I: Linking Drought Evolution to Variations in Evaporative Demand. J. Hydrometeorol. 2016, 17, 1745–1761. [Google Scholar] [CrossRef]
  30. Kay, J.E.; Deser, C.; Phillips, A.; Mai, A.; Hannay, C.; Strand, G.; Arblaster, J.M.; Bates, S.C.; Danabasoglu, G.; Edwards, J.; et al. The Community Earth System Model (CESM) Large Ensemble Project: A Community Resource for Studying Climate Change in the Presence of Internal Climate Variability. Bull. Am. Meteor. Soc. 2015, 96, 1333–1349. [Google Scholar] [CrossRef] [Green Version]
  31. Stocks, B.J.; Lawson, B.D.; Alexander, M.E.; Wagner, C.E.V.; McAlpine, R.S.; Lynham, T.J.; Dube, D.E. The Canadian forest fire danger rating system: An overview. For. Chron. 1989, 65, 258–265. [Google Scholar] [CrossRef] [Green Version]
  32. Landrum, L.; Holland, M.M. The emergence of a New Arctic: When extremes become routine. Nat. Clim. Chang. 2020, 10, 1108–1115. [Google Scholar] [CrossRef]
  33. McAfee, S.A. Methodological differences in projected potential evapotranspiration. Clim. Chang. 2013, 120, 915–930. [Google Scholar] [CrossRef]
  34. IPCC. Climate Change 2013: The Physical Science Basis. Working Group I Contribution to the Fifth Assessment Report of the Intergovernmental Panel on Climate Change; Cambridge University Press: Cambridge, UK, 2014. [Google Scholar]
  35. World Population Review, Alaska Population. 2020. Available online: https://worldpopulationreview.com/states/alaska-population (accessed on 8 January 2020).
  36. Alaska EPSCoR. The McKinley Fire: Rebuilding and Lessons Learned. YouTube. 2020. Available online: https://www.youtube.com/watch?v=no8dvnjbdHY&t=4s (accessed on 13 January 2021).
Figure 1. Major burn areas of 2019 in southern Alaska. Inset shows PSA (Predictive Service Areas) boundaries and the analysis domain used for the gridded data.
Land 10 00082 g001
Figure 2. Progression of the Swan Lake Fire. Colors correspond to the date of the detection of fire from the VIIRS (S-NPP) I-Band 375 m active fire product between June and September 2019. Arrows indicate the direction of fire spread.
Land 10 00082 g002
Figure 3. (Left panel) Southcentral highway conditions in 2019 during fires (photo credit: Alaska Division of Forestry/Shutterstock). (Right panel) Reduced air quality in August 2019 as viewed from the campus of the University of Alaska Anchorage (photo credit: Micah Hahn).
Land 10 00082 g003
Figure 4. Daily PM2.5 concentrations in Anchorage during April–September of 2019 (red line) compared to long-term daily mean values (dotted black line).
Land 10 00082 g004
Figure 5. Ranking of average temperature for July–September (left) and total precipitation (right) for June–August for Alaska climate divisions. Cook Inlet climate division is identified by grey asterisks. Data for figure provided by NOAA National Centers for Environmental information, Climate at a Glance: Divisional Mapping at https://www.ncdc.noaa.gov/cag/.
Land 10 00082 g005
Figure 6. Daily station-based temperature (°C) and daily cumulative precipitation (mm) for 2019 compared to corresponding climatological (averaged daily values over the period 1994 to 2019) values for Susitna Valley PSA (upper panel) and Kenai Peninsula PSA (lower panel). The 2019 temperatures are shown in red and precipitation amounts in dark blue. Climatological temperature shown in grey and climatological cumulative precipitation shown in light blue. Plotted values are averages over all weather-reporting stations in the respective PSAs.
Land 10 00082 g006
Figure 7. Average August Buildup Index (BUI) values for the Kenai Peninsula PSA (dark red) and the Susitna PSA (light brown). BUI values were computed from station data over the 1994–2019 period and are unitless.
Land 10 00082 g007
Figure 8. Daily values of the BUI in 2019, 2013, 2005 and 2004 computed from ERA5 over the gridded analysis domain defined in Figure 1. The climatology (thick grey line) is calculated by averaging daily BUI over the 1979–2019 period. BUI is unitless.
Land 10 00082 g008
Figure 9. June–August total precipitation (blue bars) and 2 m air temperature for each year, 1979–2019, based on the ERA5 reanalysis over the gridded analysis domain defined in Figure 1.
Land 10 00082 g009
Figure 10. SPEI index values for June, July and August of each year, 1979–2019, based on the ERA5 reanalysis over the gridded analysis domain defined in Figure 1.
Land 10 00082 g010
Figure 11. Comparison of ERA5 and CESM temperature and precipitation for 1979–2019. Box and whiskers shown for ERA5, CESM present ensemble average, and CESM present all ensembles for (a) June–August averaged 2-m air temperature (°C) and (b) June–August total precipitation (mm). The plots show median values, second and third quartile ranges (boxes) and maximum/minimum values (whisker limits).
Land 10 00082 g011
Figure 12. CESM-LENS simulations of Summer Warmth Index (a) and Total Summer Precipitation (c) over the period 1920–2100. Corresponding values from ERA5 for the period 1979–2019 are shown before (red) and after (blue) adjustment by quantile-mapping. Probability of occurrence of the value equivalent to the 2019 extreme value of the Summer Warmth Index (b) and Total Summer Precipitation (d).
Land 10 00082 g012
Figure 13. CESM SPEI values spanning 1920–2100 from the historical and RCP 8.5 simulations of one LENS ensemble member. SPEI is unitless.
Land 10 00082 g013
Figure 14. Distribution CESM SPEI values based on all CESM ensemble members. Distributions are shown for the preindustrial (blue), present (1979–2019, red) and future (2040–2080, orange). Corresponding ERA5 distribution for 1979–2019 is shown by dotted red line.
Land 10 00082 g014
Figure 15. Median values, second and third quartile ranges (boxes), maximum and minimum values (whisker limits) for each CESM ensemble member. Dots are outlier values. Corresponding ranges for CESM ensemble averages over different time periods and for ERA5 shown using colored boxes at right.
Land 10 00082 g015
Table 1. ERA5 2019 SPEI values for JJA (cumulative), and monthly from June–August. CESM PI ensemble average lowest SPEI values for JJA cumulatively and individual months. The probability of exceeding PI SPEI averaged for each ensemble for the periods 1979–2019 and 2040–2080 is shown below. The range of probabilities among the 39 ensembles is shown in brackets.
ERA5 2019CESM: PICESM: 1979–2019CESM: 2040–2080
Lowest SPEIAverage Probability of Exceedances of CESM’s PI Extreme by Ensemble Members (Range across Ensembles)
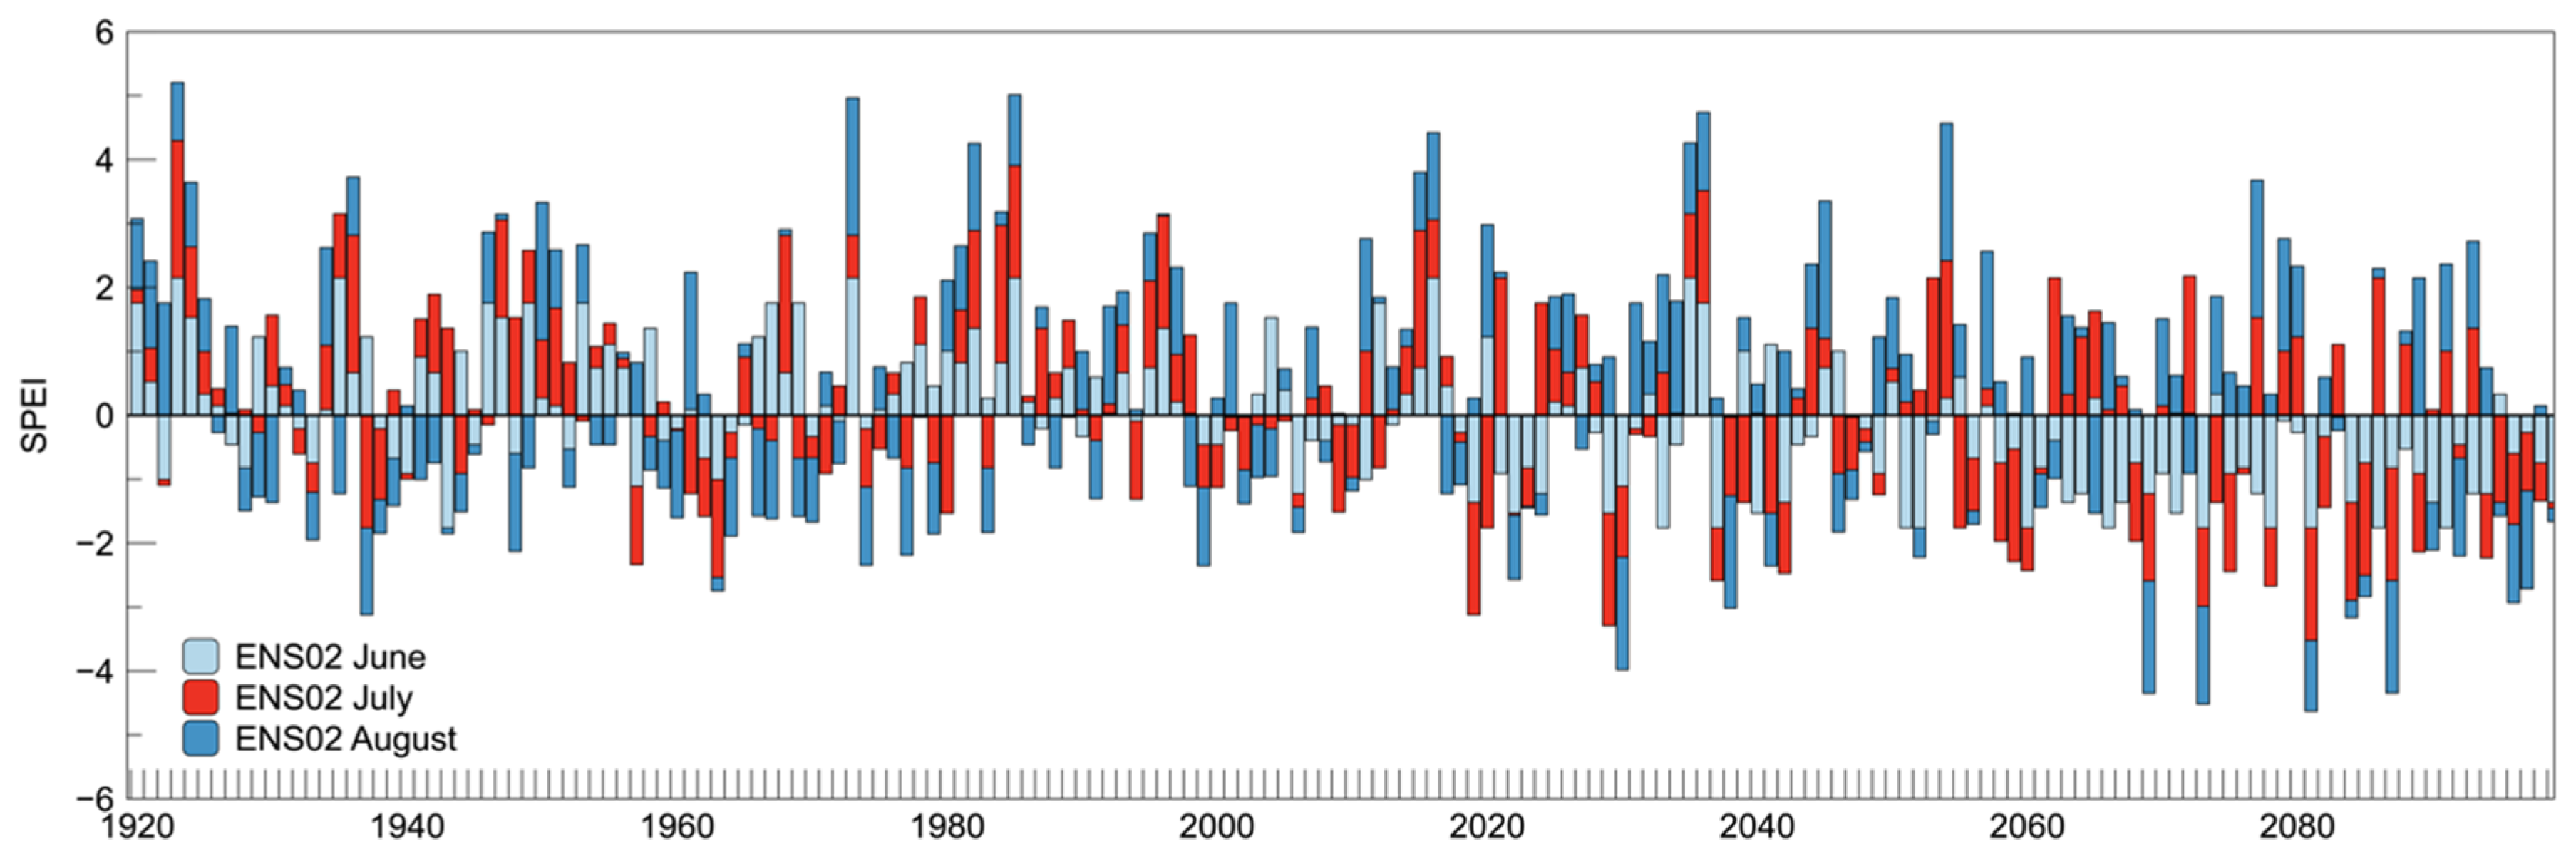
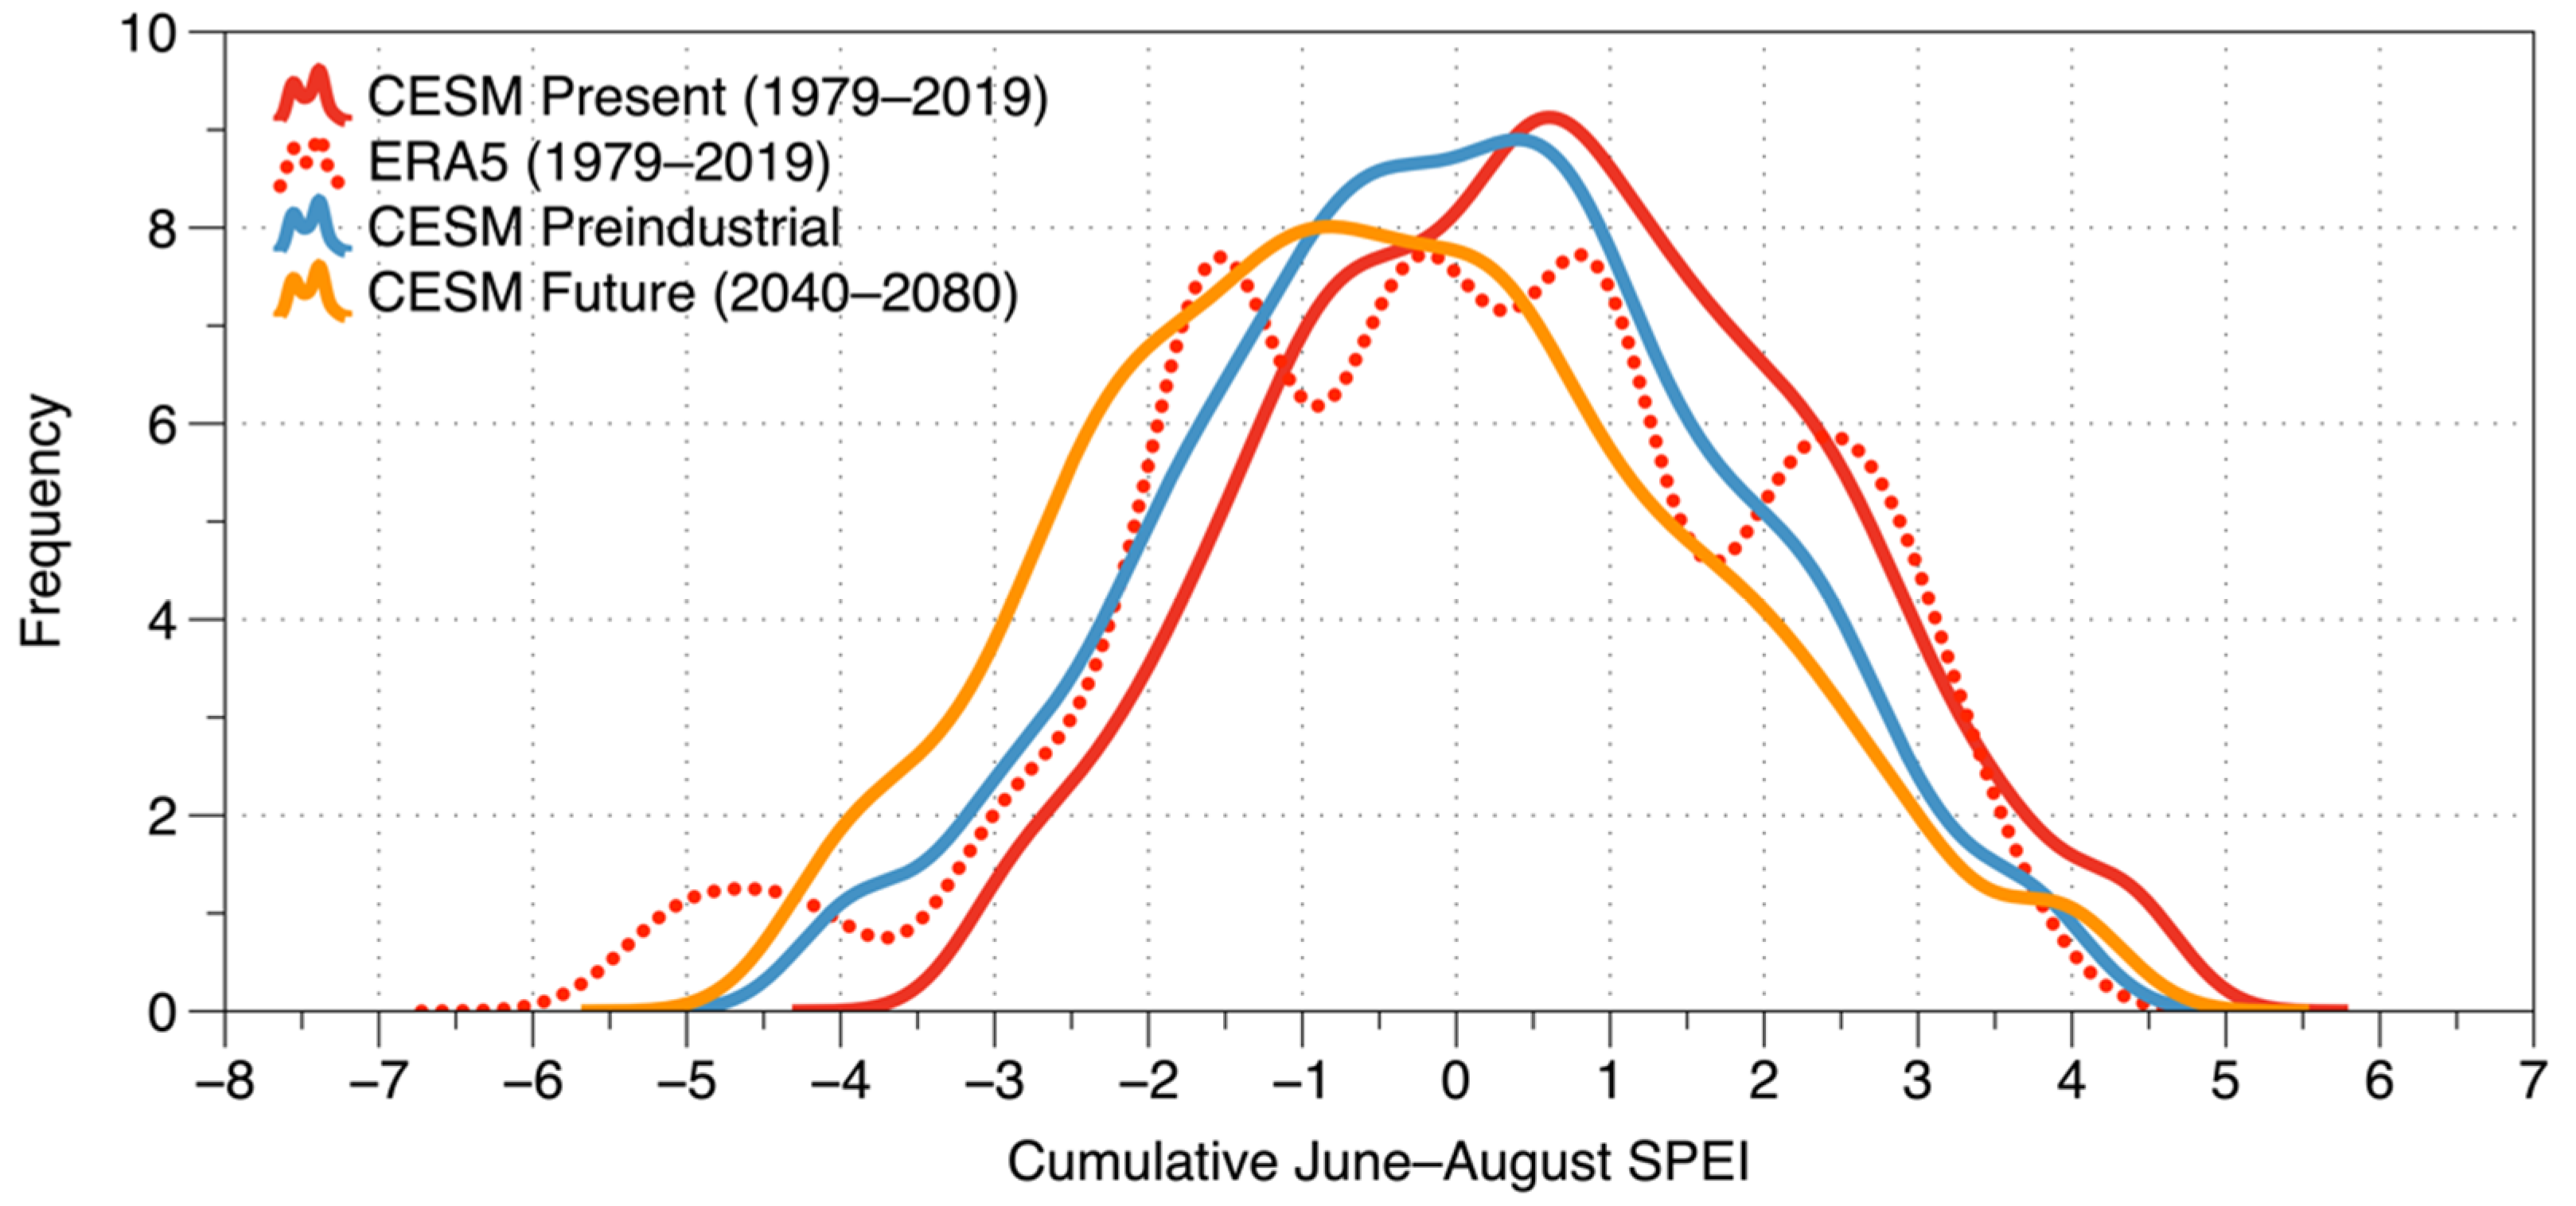
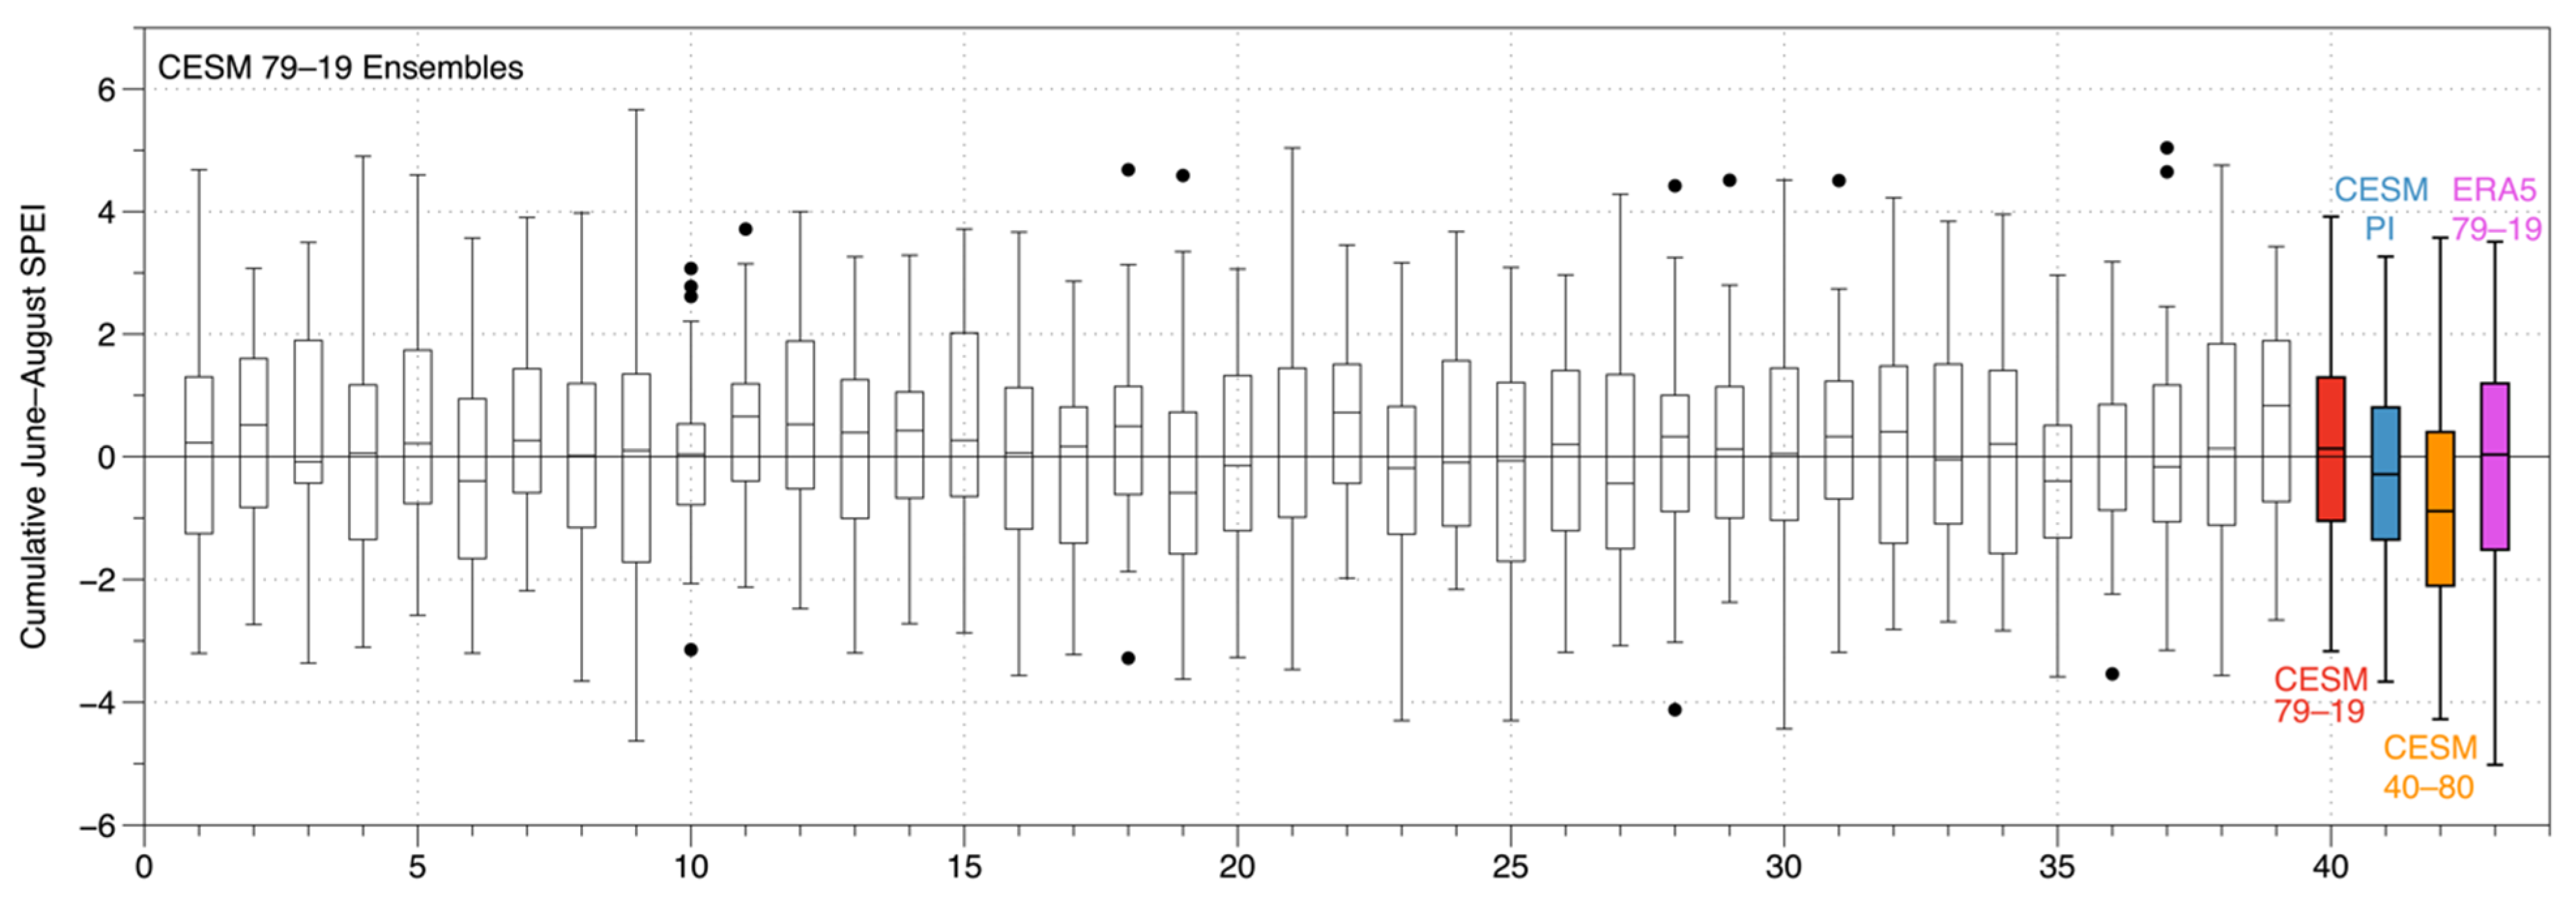
SPEI JJA−5.02−3.660.44% (4.9–0%)4.9% (17–0%)
SPEI June−1.52−1.712.1% (7–0%)13.2% (27–0%)
SPEI July−1.75−1.591.9% (4.9–0%)8.9% (12–0%)
SPEI August−1.75−1.712.4% (5–0%)6.5% (9.8–2.5%)
Publisher’s Note: MDPI stays neutral with regard to jurisdictional claims in published maps and institutional affiliations.

