Characterization of Soil Carbon Stocks in the City of Johannesburg


1
Department of Soil, Crop and Climate Sciences, Faculty of Natural and Agricultural Sciences, University of the Free State, Bloemfontein 9301, South Africa
2
Unit for Environmental Sciences and Management, North-West University, Potchefstroom 2520, South Africa
*
Author to whom correspondence should be addressed.
Land 2021, 10(1), 83; https://0-doi-org.brum.beds.ac.uk/10.3390/land10010083
Submission received: 10 December 2020
/
Revised: 13 January 2021
/
Accepted: 13 January 2021
/
Published: 18 January 2021
(This article belongs to the Special Issue Soil Management for Sustainability)
Abstract
:Soil organic carbon (SOC) is a crucial indicator of soil health and soil productivity. The long-term implications of rapid urbanization on sustainability have, in recent years, raised concern. This study aimed to characterize the SOC stocks in the Johannesburg Granite Dome, a highly urbanized and contaminated area. Six soil hydropedological groups; (recharge (deep), recharge (shallow), responsive (shallow), responsive (saturated), interflow (A/B), and interflow (soil/bedrock)) were identified to determine the vertical distribution of the SOC stocks and assess the variation among the soil groups. The carbon (C) content, bulk density, and soil depth were determined for all soil groups, and thereafter the SOC stocks were calculated. Organic C stocks in the A horizon ranged, on average, from 33.55 ± 21.73 t C ha−1 for recharge (deep) soils to 17.11 ± 7.62 t C ha−1 for responsive (shallow) soils. Higher C contents in some soils did not necessarily indicate higher SOC stocks due to the combined influence of soil depth and bulk density. Additionally, the total SOC stocks ranged from 92.82 ± 39.2 t C ha−1 for recharge (deep) soils to 22.81 ± 16.84 t C ha−1 for responsive (shallow) soils. Future studies should determine the SOC stocks in urban areas, taking diverse land-uses and the presence of iron (Fe) oxides into consideration. This is crucial for understanding urban ecosystem functions.
1. Introduction
An increasing urban population has stimulated interest in the status and sustainable use of soil resources in urban areas. Anthropogenic activities have largely contributed to the variation of urban soil properties [1]. Urban soils are generally characterized by increased bulk density, pH levels, and carbon (C) content due to organic pollutants at industrial sites, increased residential waste, traffic, and infrastructure [2,3,4,5]. Conversely, a study by [6] found that soil pH and bulk density were not significantly different in urban areas. However, soils in the city of Johannesburg, the economic hub of Africa, are diverse in both physical and biochemical aspects. Gold mine tailings across the city are often laden with lead and arsenic [7,8], reducing agricultural productivity and overall soil quality.
Soils provide essential ecological services, such as nutrient cycling, biomass production, a habitat for soil organisms, storage and filtration of water, and C storage [9]. Soil organic carbon (SOC), a measurable component of soil organic matter (SOM), is an important soil quality indicator, as it influences climate change mitigation [10,11], soil fertility, porosity, aggregation, and water-holding capacity [12,13]. Soils act as either a source or sink of atmospheric carbon dioxide (CO2) and thus play a crucial role in the storage of carbon (C). Extensive cultivation and deforestation are part of the largest anthropogenic sources of CO2 [14]. Carbon dioxide emissions in areas affected by deforestation were 0.4 Pg C yr−1, approximately 0.3 Pg C yr−1 less than the average from 1997 to 2008. Soil organic matter is primarily derived from plant residues [15] and is a source of essential plant nutrients, such as nitrogen, phosphorus, potassium, calcium, and magnesium. Furthermore, SOM binds soil particles and forms aggregates, improving the water-holding capacity of soils [16]. Previous research found urban soils often are water deficient [17], but Mao et al. [6] discovered that soil moisture content and SOC increased notably from the urban periphery to the core.
In recent decades, environmental policy-making has integrated the protection of soil resources to promote sustainability. There is a need for detailed soil quality data in urban areas due to unsustainable development. Although urban areas occupy about 0.5% of the global land surface [18], they are responsible for approximately 70–75% of global anthropogenic CO2 emissions [19]. Rapid urbanization leads to environmental challenges, such as the modification of local and regional climate [20], the loss of biodiversity caused by the destruction of natural habitats [21], as well as the degradation of water resources [22]. The characterization of urban SOC stocks is, therefore, crucial for understanding urban ecosystem functions.
Carbon storage in South African cities has hardly been researched. Generally, 58% of soils in South Africa have less than 0.5% SOC and only 4% of soils have more than 2% SOC [23]. Recently, there has been increased interest in quantifying C storage in urban areas [24,25,26]. Some research indicated that SOC stocks are not significantly different across urban areas [6,24]. Moreover, in the United Kingdom, the total SOC storage was estimated to be about 17.6 kg m−2 for urban areas [25]. One study [26], which aimed to describe the impacts of urbanization on the SOC stocks in north-eastern China, found a decrease from 2.77 ± 1.09 kg m−2 to 2.16 ± 0.93 kg m−2 over two decades. The loss in carbon was attributed to rapid urbanization.
Here, we hypothesize that an increase in the retention of water and a higher bulk density result in greater SOC stocks. This study aims to determine the vertical distribution of SOC stocks in six hydropedological groups identified in the Johannesburg Granite Dome area and assesses the variation among the groups.
2. Materials and Methods
2.1. Study Area
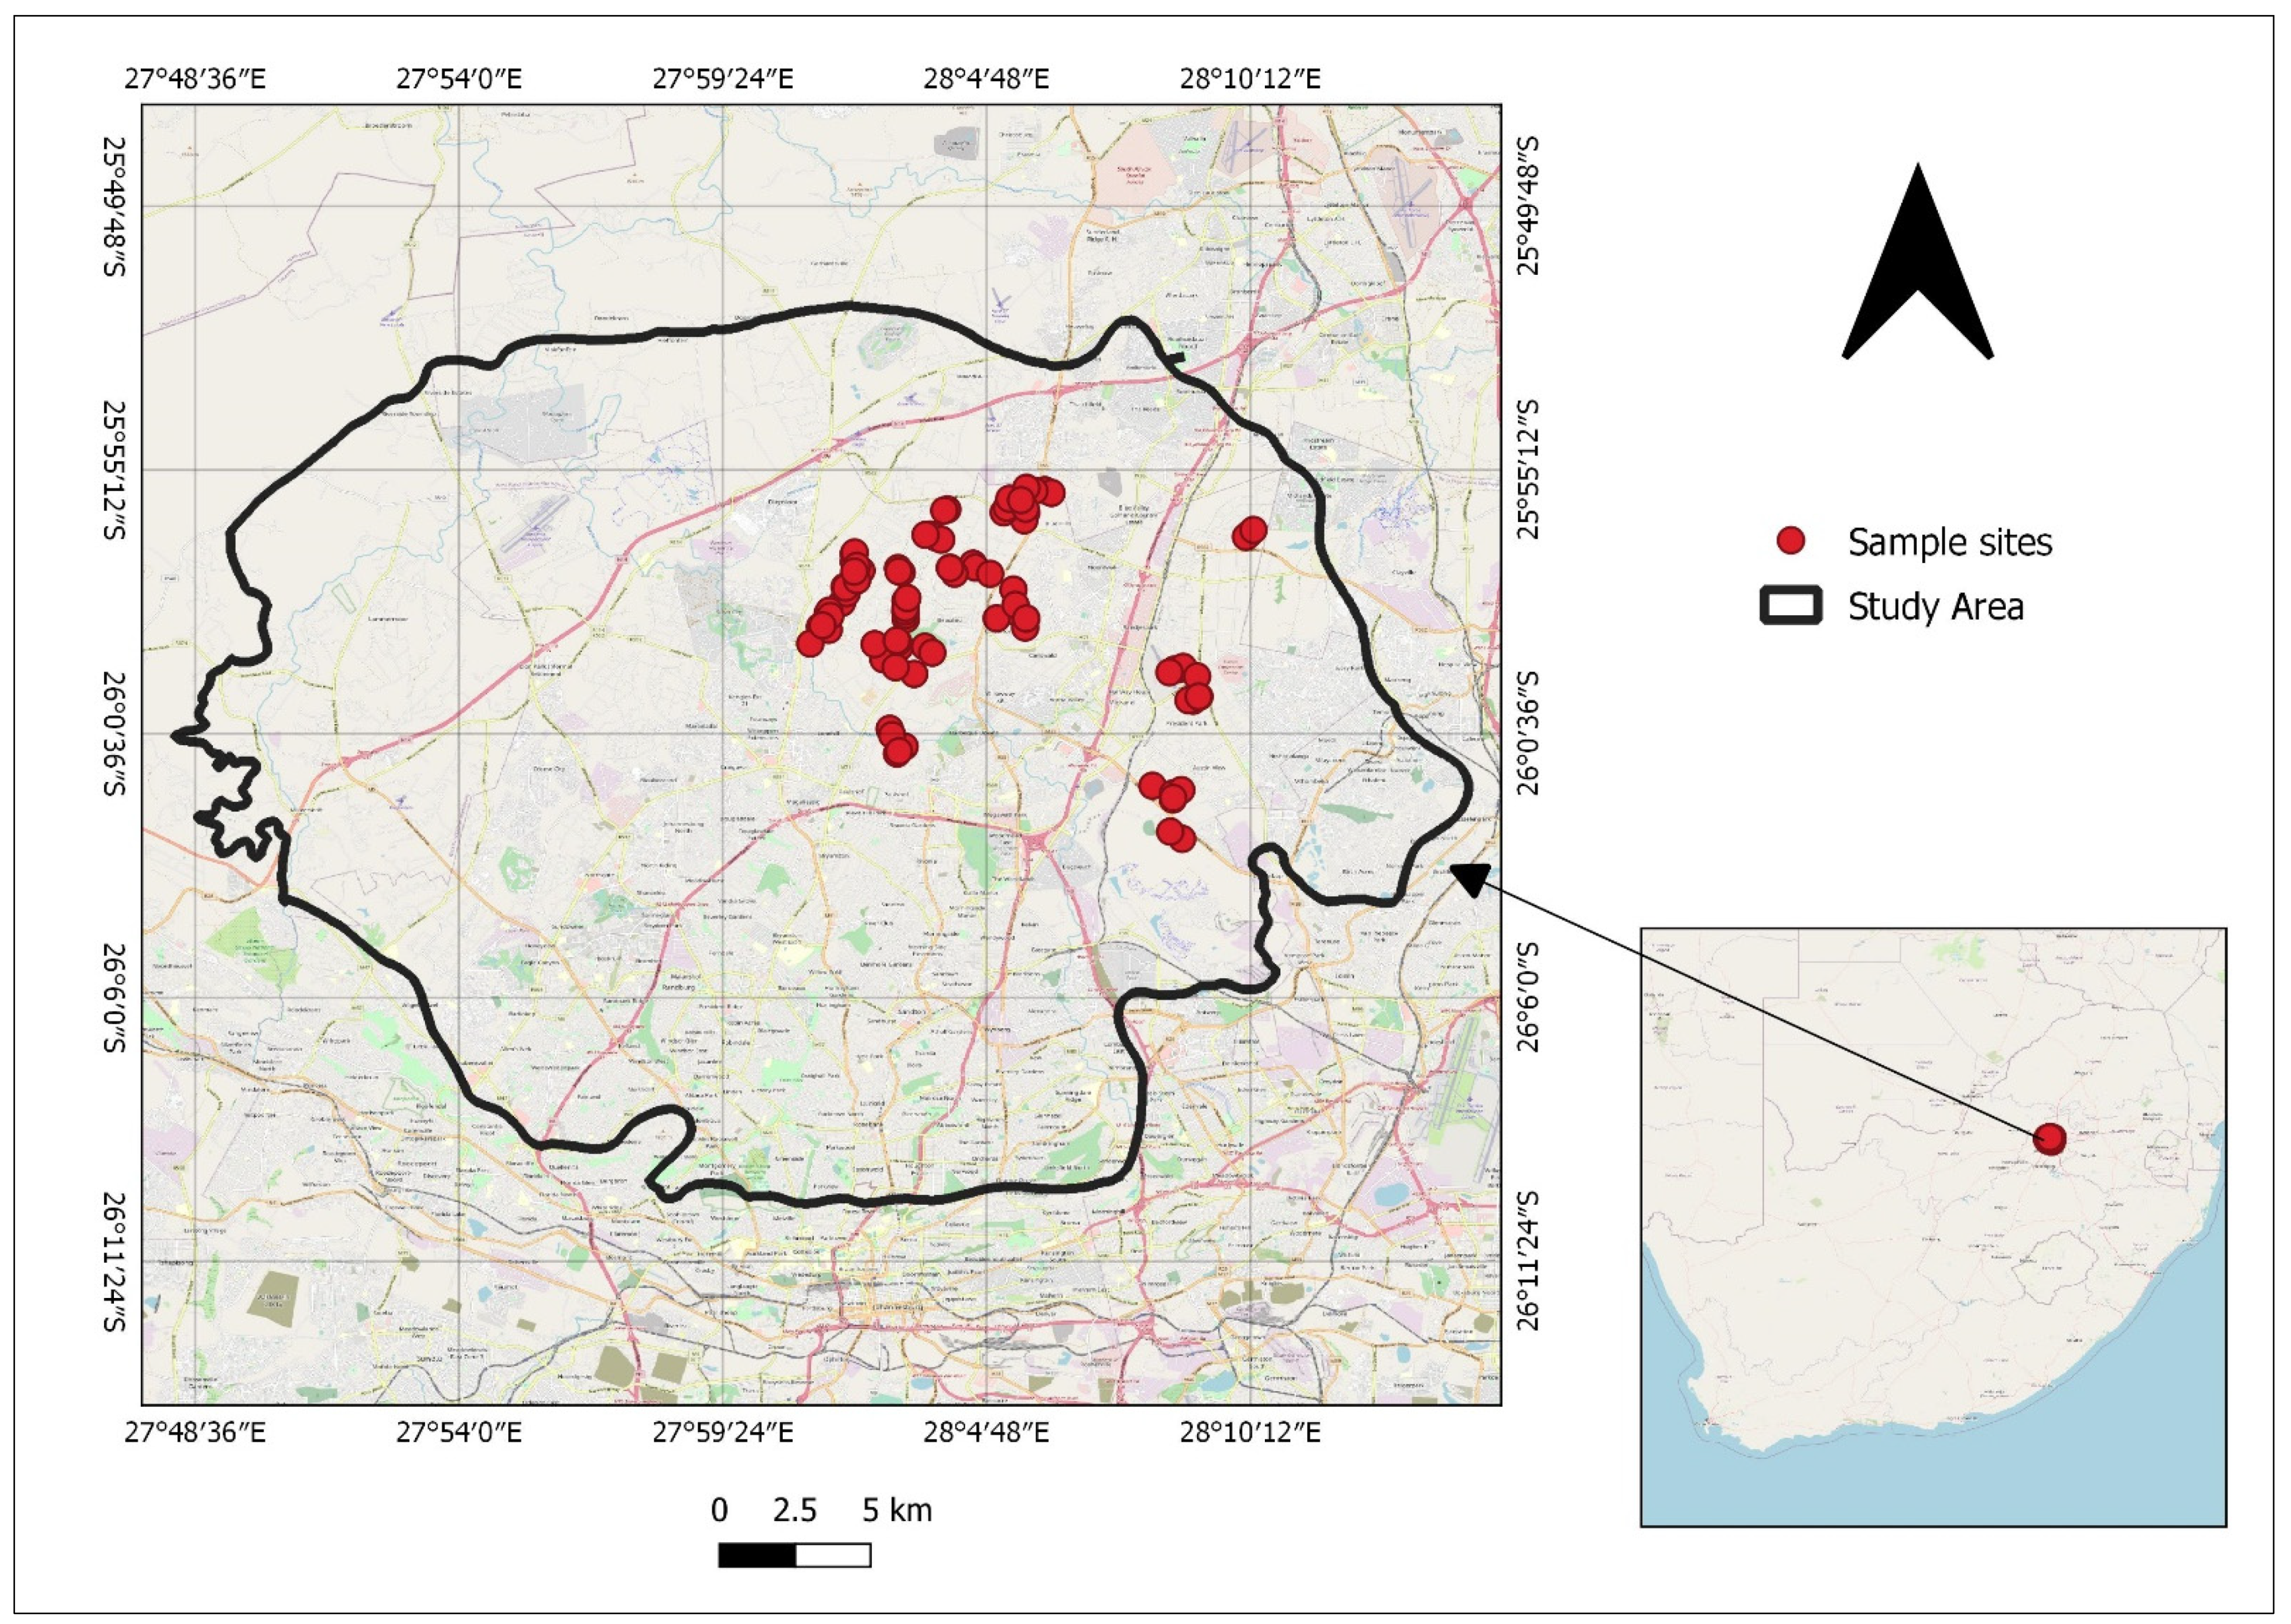
The study was conducted in the Johannesburg Granite Dome area (Figure 1), partly located in the Upper Crocodile catchment. The catchment area is part of the Witwatersrand Supergroup, underlain by a combination of granitic, gneissic, and granodiorite rocks, which have been weathered and modified by tectonic processes [27]. The research site has soils that have been severely altered by sand mining [28]. Due to the soil-forming process of ferrolysis (reduction of free iron (III) oxides to Fe2+ followed by the oxidation of Fe2+), soils in this area have limited clay accumulation. Johannesburg has a semi-arid environment. It is a summer rainfall area, receiving most of its rainfall between October and March. The region has a mean annual precipitation of 682 mm and mean annual evaporation of approximately 1700 mm [27].
Johannesburg is the primary economic hub of sub-Saharan Africa, with a population of 5.7 million people [29]. The Johannesburg Granite Dome area is drained by the Jukskei and Crocodile Rivers, recognized as a stressed catchment in South Africa [27]. The study area, with a total surface area of 768 km2, was identified by the South African Department of Environmental, Forestry, and Fisheries as one of the catchments that required urgent attention in terms of environmental quality. The main drivers of a decline in environmental quality are agricultural, domestic, industrial, and mining processes [10]. Catchments in this area have been studied previously [30,31,32]; however, quite a few focus on soil quality.
2.2. Soil Data and Analysis
A total of 93 sampling sites were randomly identified within the study area as part of a previous research project to determine the hydropedological behaviour of the catchment [33]. Soil samples were collected throughout the soil profiles using an auger and then classified according to the South African Soil Classification System [34] and the Food and Agricultural Organization (FAO) World Reference Base (WRB) [35]. At each sampling site, all the diagnostic soil horizons (A, B, and C) were sampled, irrespective of soil depth. Using the South African Soil Classification System, a total of 17 soil forms were identified (Table 1). For simplification, these soil forms were regrouped into six hydropedological groups, as described by [36], namely: recharge (deep), recharge (shallow), responsive (saturated), responsive (shallow), interflow (A/B), and interflow (soil/bedrock) soils. These hydropedological groupings were selected for this study because they capture some of the key factors affecting soil C content [37], such as soil moisture, drainage, texture, aeration, and position in the landscape. A brief description of the dominant properties of these hydropedological groups is presented in Table 1. Soil samples were dried at room temperature, sieved through a 2 mm screen, and then analysed for SOC content.
2.2.1. Soil Bulk Density
A total of 14 undisturbed core samples (730 cm3) were collected from the diagnostic horizons of the representative profiles to determine bulk density. Bulk density was calculated by dividing the oven-dried soil weight by total core volume, as described in [38]. Due to time and cost constraints, a limited number of samples were collected, which resulted in some standard deviation calculations being equal to zero (Table 2).
2.2.2. Soil C Content and Soil C Stocks
A total of 265 soil samples were collected from the diagnostic horizons to analyse SOC content. Soil organic carbon content was analysed by dry combustion adapted from [39], with a TruSpec Leco CN analyser.
To calculate the soil C stocks in terms of the mass of C in tons per hectare (t C ha−1), the soil C at each sampling location was multiplied by the corresponding soil bulk density and soil horizon thickness, as presented in Equation (1).
where:
SOC stocks = Soil C × BD × t,
- SOC stocks = soil carbon stocks (t C ha−1);
- Soil C = soil C carbon (%);
- BD = soil bulk density (g cm−3);
- t = soil depth (cm).
2.2.3. Spatial Representation of Carbon Stocks
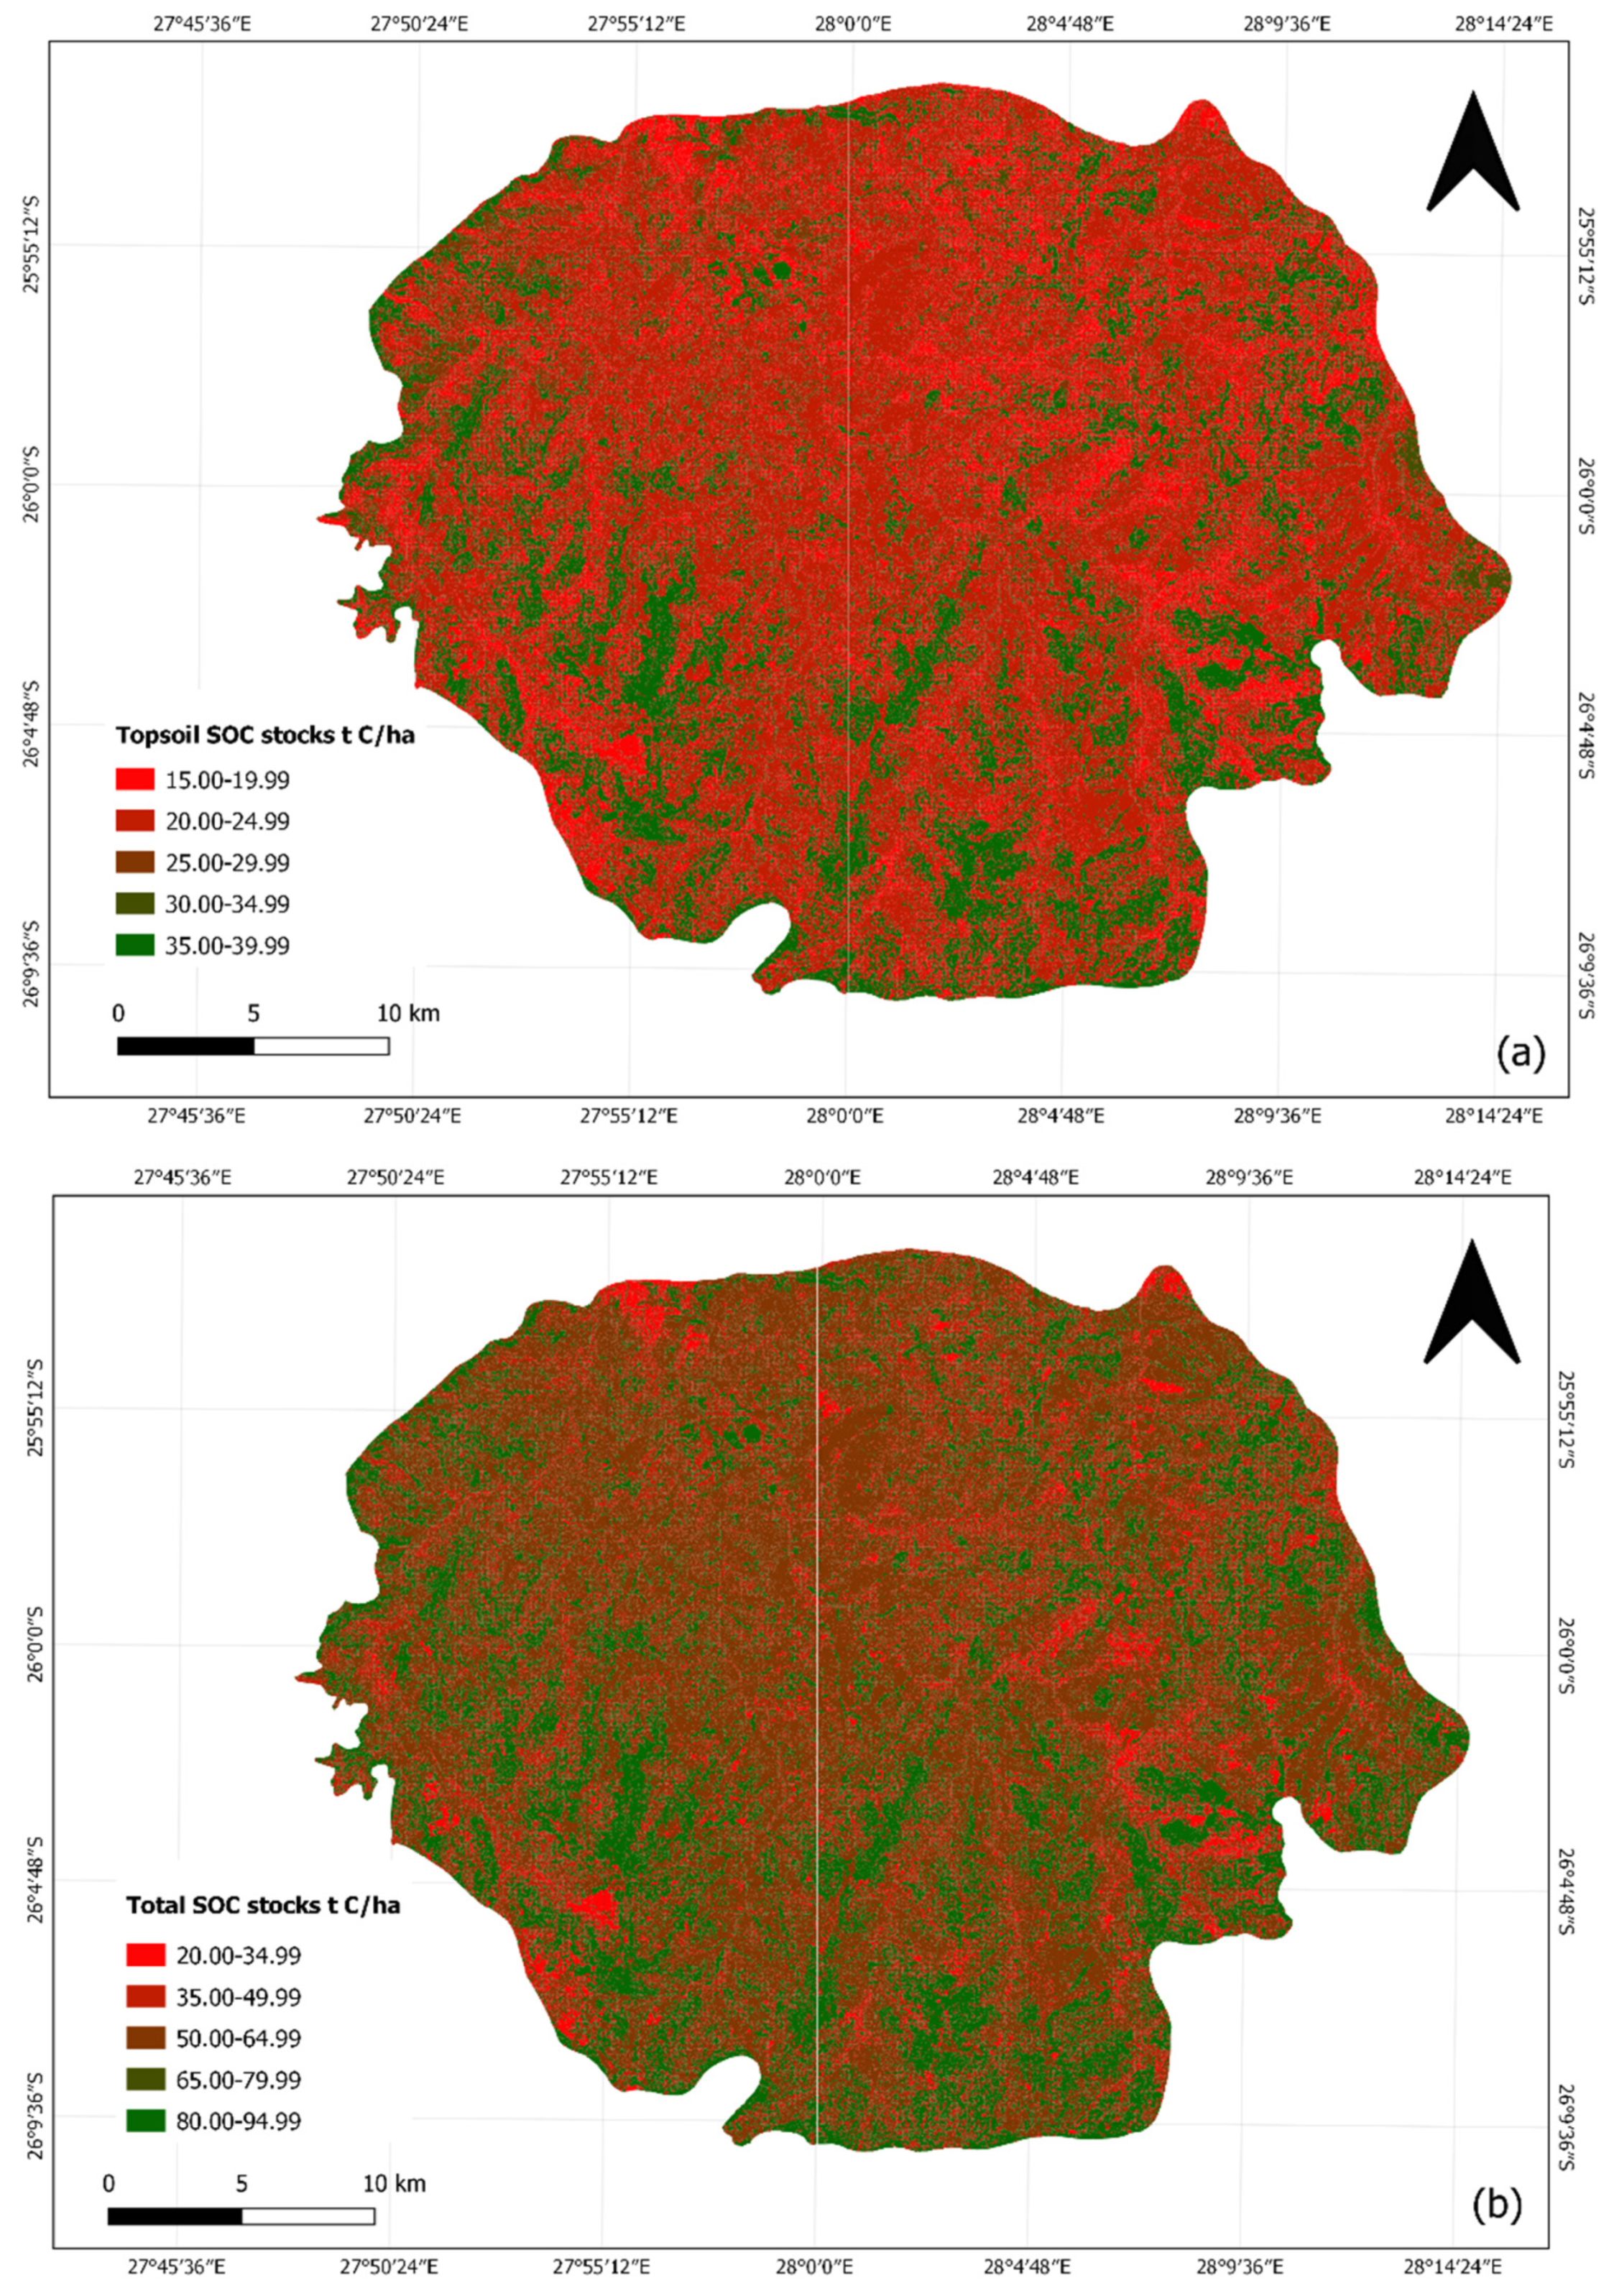
The calculated SOC stocks data were applied to the map units of an existing Johannesburg Granite Dome hydropedological soil map by [40]. The map was created using multinomial logistic regression, with a point accuracy of 80% and a Kappa statistic value of 0.71. A Kappa coefficient value closer to one is preferred, as it indicates that the map provides a good representation of reality. Two choropleth SOC stocks maps were created; one representing the SOC stocks in the A horizon and the other for the total SOC stocks. Although soil observations were only made in selected hillslopes, the C stocks could be mapped for the entire area.
2.2.4. Statistical Analysis
All data were tested for normality and homogeneity using the Shapiro–Wilk and Levene’s test, respectively. Thereafter, statistical analyses were then performed with the IBM SPSS Statistics Version 26 software package (SPSS Inc. IBM Corp. Armonk, New York, USA). All measured and calculated parameters were subjected to a two-way analysis of variance (ANOVA) to determine the significant differences between SOC and SOC stocks among the soil hydropedological groupings. Since the data were unbalanced (sample sizes are not all equal), Welch’s test was used to determine the equivalence of the standardized means. Furthermore, means were compared with Tukey’s honestly significant difference (HSD) post-hoc tests at the 95% confidence level.
3. Results
Soil C Content and Soil C Stocks
A summary of the measured soil C, bulk density, and the calculated C stocks for all soil hydropedological groups at the different soil depths, is indicated in Table 2. There was no significant difference between the soil group for the C content; however, there were significant differences among the diagnostic soil horizons (F = (2, 247) = 105.35, p = 0.000). In addition, there was a statistical correlation between the interaction of the soil groups and diagnostic soil horizons and SOC stocks (F = (10, 247) = 2.58, p = 0.005).
- (a)
- Recharge (deep) soils
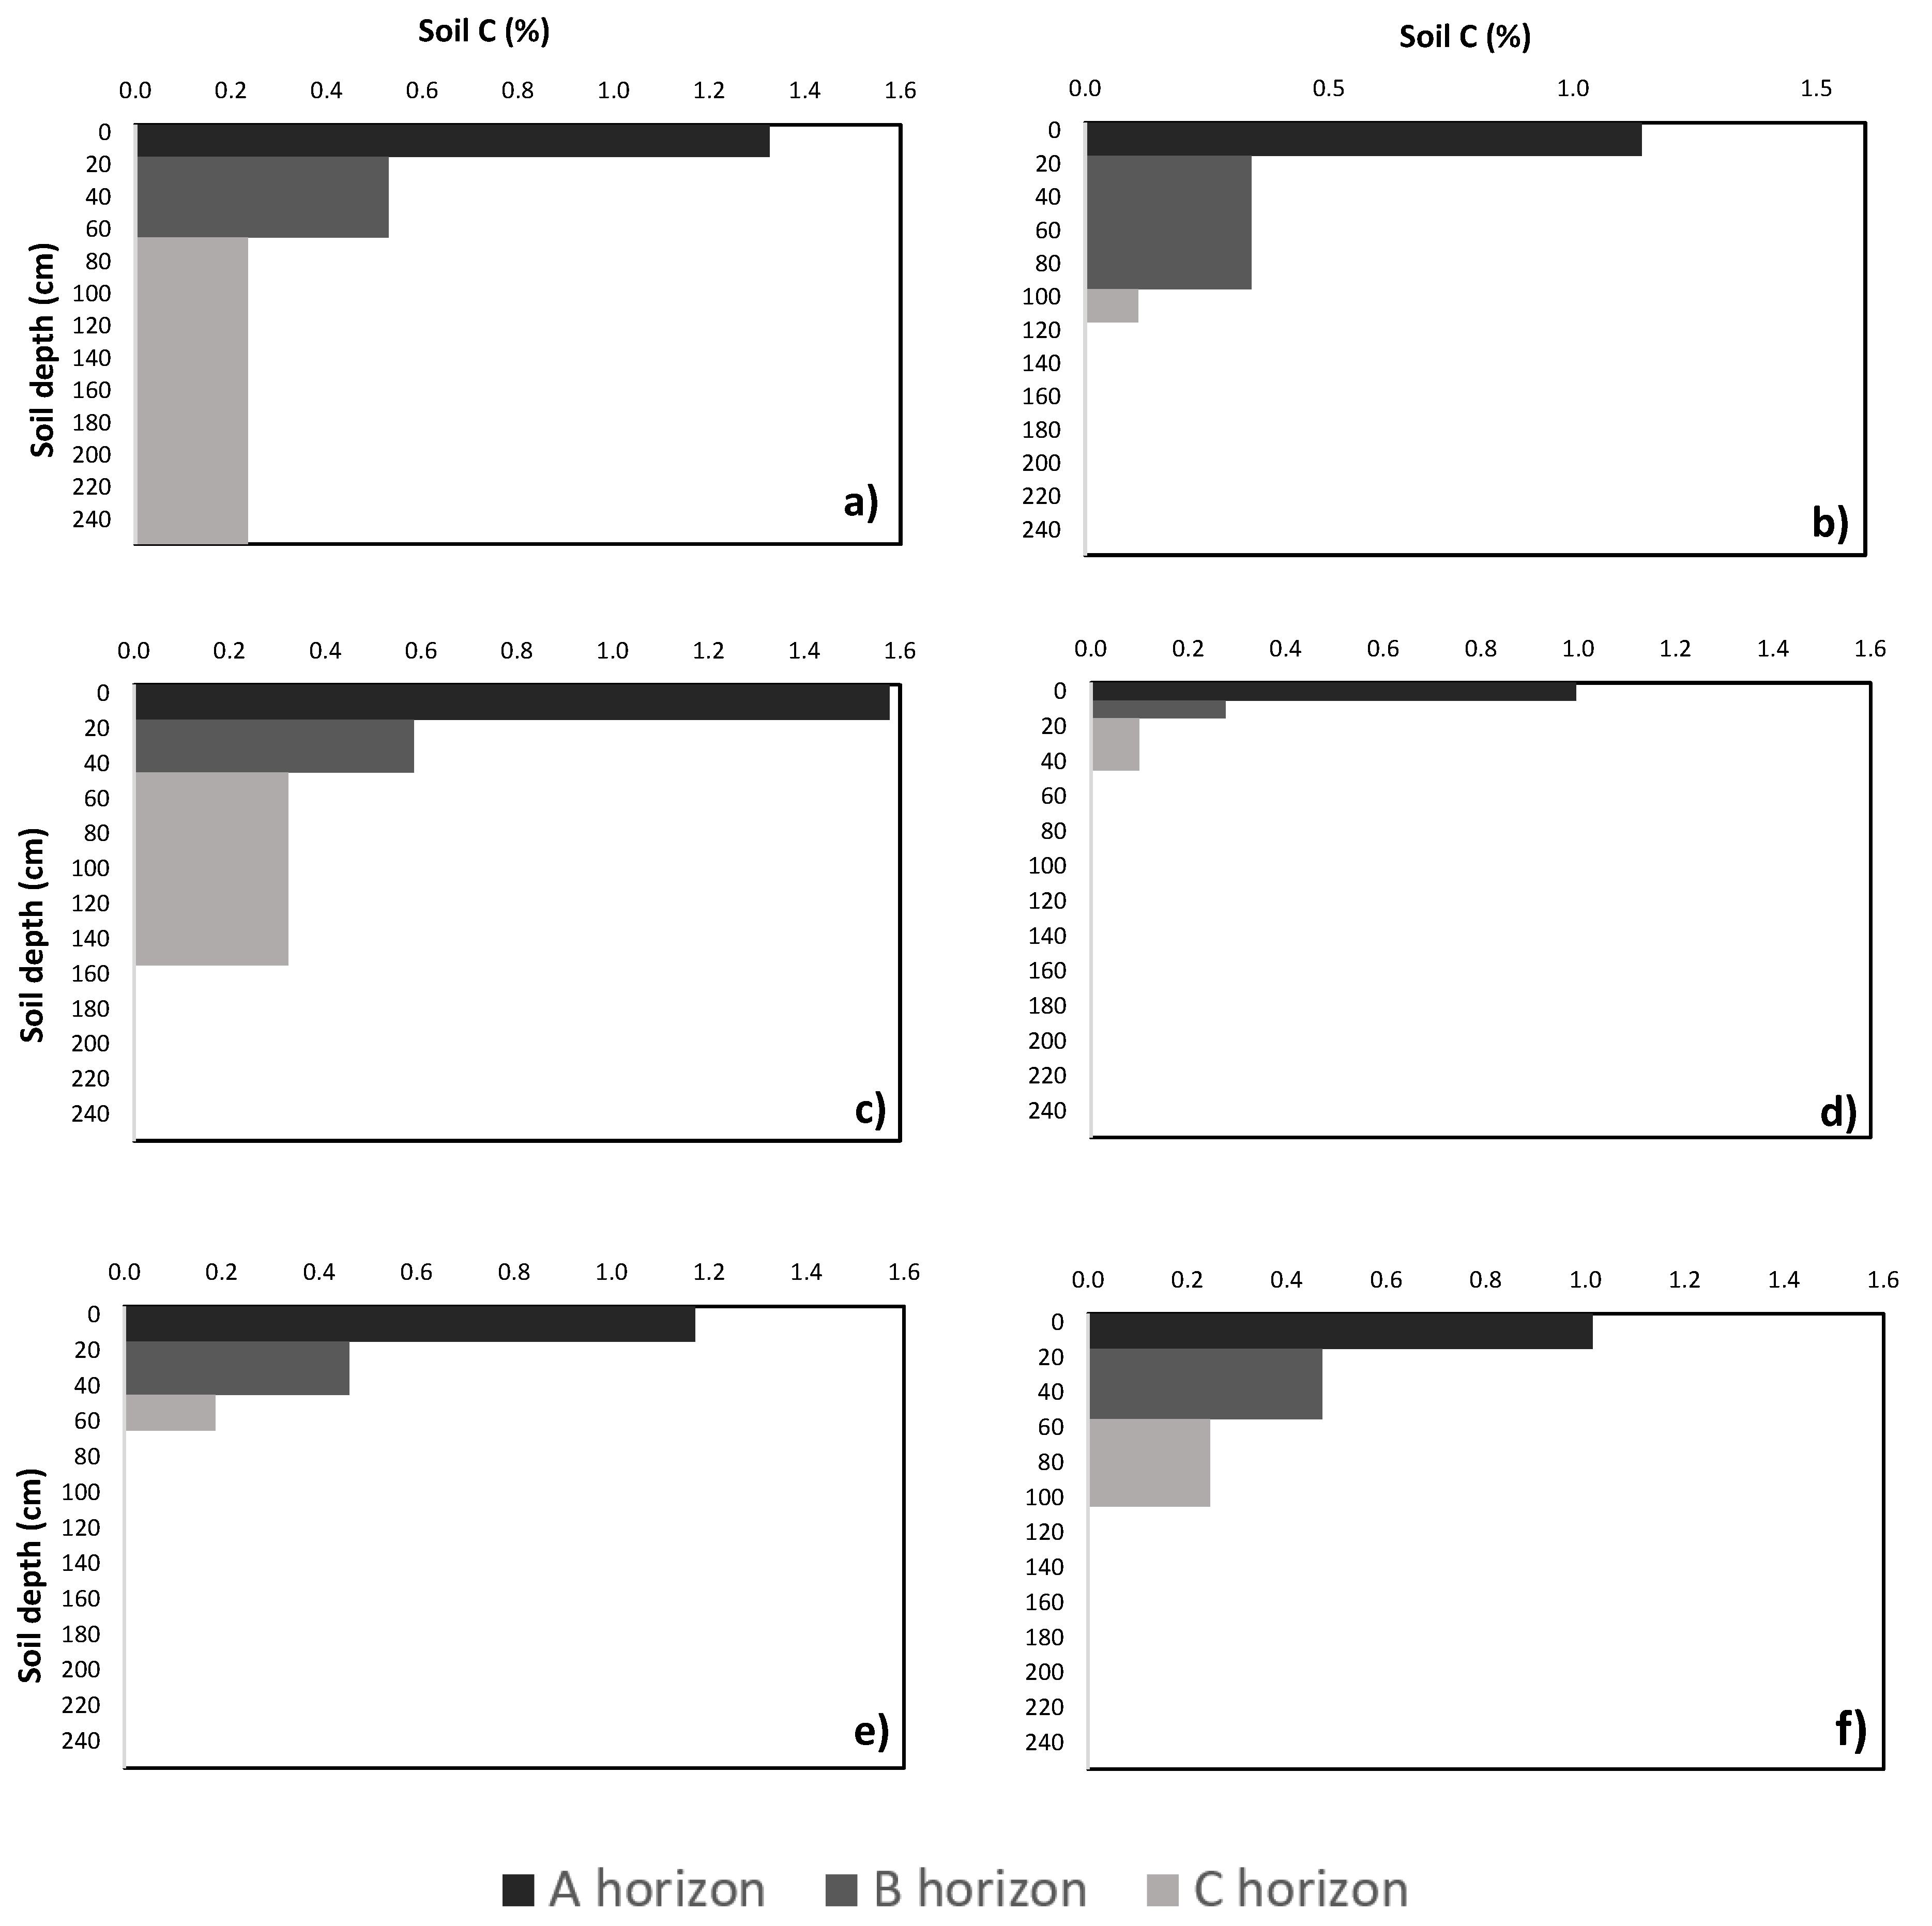
The results showed that the soil C content ranged, on average, between 0.24 ± 0.06% for Horizon C to 1.33 ± 0.85% for Horizon A. The steepest decline (0.8%) was observed from Horizon A to Horizon B (Figure 2a). Additionally, the B and A horizons contained the majority of the SOC stocks, with 41.42 ± 10.87 and 35.05 ± 22.41 t C ha-1, respectively. However, the mean soil C content measured in Horizon A (1.33 ± 0.85%) was significantly higher than that in Horizon B (0.53 ± 0.13%). These soils recorded the highest mean C stocks in the A and B horizons as well as total C stocks (92.82 ± 39.2 t C ha−1) of all the hydropedological groups.
- (b)
- Recharge (shallow) soils
The A horizon contained the most soil C (1.14 ± 0.44%); however, this was not reflected in the SOC stocks (25.50 ± 9.77 t C ha−1). The B horizon showed the highest SOC stocks (27.84 ± 29.89 t C ha−1). Similar to recharge (deep) soils, the steepest decline (0.8%) was observed from the A to B Horizon (Figure 2b). These soil profiles did not follow the trend of a decrease in SOC stocks with an increase in soil depth. This highlights the contrast between C (%) and C stocks (t C ha−1). The SOC stocks ranged between 2.83 ± 3.97 (C horizon) and 27.84 ± 29.89 t C ha−1 (B horizon). The total C stocks recorded for these soils were 56.17 ± 43.63 t C ha−1.
- (c)
- Responsive (saturated) soils
These soils displayed the highest mean soil C content (1.58 ± 0.76%), in comparison to all other hydropedological groups, in the A Horizon. The steepest decline (1%) was observed from Horizon A to Horizon B, which was the steepest decline from any horizon in all the soil groups (Figure 2c).
These soils were the only group to record mean soil C stocks over 25 t C ha−1 in all soil horizons. Although these soils also recorded the highest mean C contents in all horizons, this did not translate into the highest mean SOC stocks available. The soil C content ranged, on average, between 0.32 ± 0.20% for the C horizon and 1.58 ± 0.76% for the A horizon. The average SOC stocks in these soils ranged between 27.61 ± 8.51 t C ha−1 for the B horizon and 30.16 ± 14.55 t C ha−1 for the A horizon. These soils further recorded the second highest total C stocks, 87.7 ± 44.61 t C ha−1.
- (d)
- Responsive (shallow) soils
These soils recorded the lowest mean soil C content in all three horizons (1.00 ± 0.44, 0.28 ± 0.39, and 0.10 ± 0.22%, respectively) as well as the lowest total C content (0.46 ± 0.52%). Soil C content in these soils gradually decreased by 0.72% from the A horizon to the B horizon and by 0.18% from the B to C horizon (Figure 2d).
The average SOC stocks in these soils were mainly located in the A horizon, with 17.11 ± 7.62 t C ha−1. The B and C horizons both recorded values below 5 t C ha−1, 4.27 ± 6.02 and 1.43 ± 3.20 t C ha−1, respectively. Out of all the hydropedological groups, these were also the lowest SOC stocks recorded. The mean SOC stocks in all horizons failed to exceed 20 t C ha-1, with total SOC stocks of 22.81 ± 16.84 t C ha−1. These soils followed the trend of a decrease in SOC stocks with an increase in soil depth.
- (e)
- Interflow (A/B) soils
The results showed that the soil C content ranged, on average, between 0.19 ± 0.16% for Horizon C to 1.17 ± 0.59% for Horizon A. The steepest decline (0.72%) was observed from Horizon A to Horizon B, with a 0.26% decline from Horizon B to Horizon C (Figure 2e).
Furthermore, the A and B horizons showed the highest SOC stocks, with 19.54 ± 9.83 and 19.44 ± 8.49 t C ha−1, respectively. These soils followed the trend of a decrease in SOC stocks with an increase in soil depth, with the C horizon recording 5.51 ± 4.66 t C ha−1. Similar to responsive (shallow) soils, the mean soil C stock values in all horizons failed to exceed 20 t C ha−1, with total C stocks of 44.49 ± 22.98 t C ha−1.
- (f)
- Interflow (soil/bedrock) soils
Similar to all other hydropedological groups, the soil C content was mainly concentrated in the A horizon. It ranged, on average, between 0.25 ± 0.08% (horizon C) and 1.01 ± 0.35%. The steepest decline (0.54%) was observed from Horizon A to Horizon B (Figure 2f). Like the recharge (deep) and recharge (shallow) soils, these soils also recorded the highest SOC stocks in the B horizon (26.23 ± 13.25 t C ha−1). The mean SOC stocks ranged, on average, between 12.30 ± 5.59 and 26.23 ± 13.25 t C ha−1. The total SOC stocks recorded for these soils were 61.74 ± 26.95 t C ha−1.
Soil organic carbon stocks, both in the topsoil and entire soil profile, are graphically presented in Figure 3.
4. Discussion
In this study, the results showed that soil groups had no significant impact on the soil C content, but the diagnostic soil horizons did have a significant impact on soil C. Furthermore, the interaction between soil groups and diagnostic soil horizons had a significant impact on the SOC stocks. The amount of soil C is dependent on soil moisture, drainage, texture, aeration, vegetation, and position in the landscape [41]. In urban areas, population changes and population density affect CO2 emissions. Research in the United States found that large cities with a greater population size resulted in increased emissions [42]. Additionally, Rybski et al. [43] presented evidence to support that urban emissions are largely dependent on the degree of the city’s development. In this study, however, we have no data to discuss the effect of population changes and density, soil texture, land management, and vegetation on urban emissions.
4.1. Soil Carbon Content
Soil organic matter is a key component of any terrestrial ecosystem, and any variation in its abundance and composition has important effects on many of the processes that occur within soil systems [44]. Soil organic matter decomposition is influenced by soil moisture content [44,45]. Soil organic matter decomposition is inadequate in dry conditions, resulting in relatively low C contents. In this study, soil groups had no significant impact on soil C contents and, therefore, differences in SOC stocks could not be due to soil moisture. This was observed in recharge (deep) and recharge (shallow) soils with limited signs of saturation, which had important soil C pools within the first 70 and 95 cm, respectively. Similarly, Parajuli & Duffy [46] found that the C amount was not influenced by soil moisture. Conversely, Liu et al. and Hobley et al. [47,48] described the accumulation of SOC at increasing levels of soil moisture. It is worth noting that the shallow soils in the catchment, namely, recharge (shallow), responsive (shallow), and interflow (A/B), had lower amounts of C than the deep soils at relatively the same depths. This could be due to fewer disturbances in the soils. Future studies in the city of Johannesburg could research the effect of land-use and land management on C capture and storage. Understanding the effect of land management practices on SOC sequestration is crucial for adopting effective management strategies.
4.2. Soil Carbon Stocks
Organic carbon stocks can differ significantly due to the influence of land management [24,49]. Traffic in urban areas has an impact on soil bulk density. Previous studies reported a strong correlation between bulk density and SOC stocks [50,51,52], which is consistent with the results of the present study in which the SOC stocks increased with increasing bulk density (Table 2). Soil C contents were significantly different in all diagnostic soil horizons, influencing the amount of SOC stocks in the individual horizons. Soil depth also played an important role in the calculation of SOC stocks. The deep soil groups (recharge (deep), responsive (saturated), and interflow (soil/bedrock)) had the three highest SOC stocks because deeper diagnostic horizons have a high capacity to store significant amounts of C.
Soils in the study area were formed during the process of ferrolysis. During the dry season, Fe2+ is oxidized to produce Fe3+ oxides. The presence of Fe3+ oxides affects the C dynamics in soils [53,54]. A study [55] found that soils with a higher clay content have higher SOC stocks because clay protects SOM from decomposition, whereas [56] determined the opposite to be true. They found that clay-textured soils accelerated SOM decomposition. To determine the role of Fe3+ oxides on SOC stocks in this area, analysis should be done on samples collected during the wet season. In wet conditions, Fe3+ is reduced to produce Fe2+. Ferrolysis results in the seasonal destruction and translocation of clay [57].
5. Conclusions
The findings in this study demonstrated that the majority of SOC stocks were contained near the surface layer of the soil groups studied. It was also shown that there is a combined effect of bulk density, soil depth, and soil C in diagnostic horizons on the accumulation of SOC stocks within the soils. The presence of Fe3+ oxides may have contributed to the observed SOC stocks; however, this needs to be researched further. Soil C was significantly higher in the deeper soils at relatively similar depths, possibly due to fewer soil disturbances. It was also discovered that a relatively high C content did not necessarily translate to high SOC stocks. Therefore, it can be concluded that SOC stocks should be used to determine the C storing capacity of soils, rather than C content, because bulk density and soil depth are also taken into consideration. The role of land management on the SOC stocks in Johannesburg should be monitored as it may be necessary to continually revise management strategies for modified urban environments.
Author Contributions
Conceptualization, K.R.S., E.K. and J.v.T.; methodology, K.R.S., E.K., J.v.T. and G.v.Z.; software, K.R.S., J.v.T. and G.v.Z.; validation, K.R.S., E.K., J.v.T. and G.v.Z.; formal analysis, K.R.S.; investigation, E.K. and J.v.T.; resources, E.K. and J.v.T.; writing—original draft preparation, K.R.S.; writing—review and editing, E.K., J.v.T. and G.v.Z.; visualization, K.R.S.; supervision, E.K., J.v.T. and G.v.Z.; project administration, E.K.; funding acquisition, K.R.S. and J.v.T. All authors have read and agreed to the published version of the manuscript.
Funding
This research was funded by The Department of Environment, Forestry, and Fisheries in South Africa as part of the Natural Resource Management Programme.
Institutional Review Board Statement
Not applicable.
Informed Consent Statement
Not applicable.
Data Availability Statement
The data presented in this study are available on request from the corresponding author. The data are not publicly available as it is still being analyzed and interpreted for several other reports and publications.
Acknowledgments
The authors would like to acknowledge the South African National Research Foundation for their financial support (Unique Grant No.: 117030).
Conflicts of Interest
The authors declare no conflict of interest. The funders had no role in the design of the study; in the collection, analyses, or interpretation of data; in the writing of the manuscript, or in the decision to publish the results.
References
- Davies, R.; Hall, S.J. Direct and indirect effects of urbanization on soil and plant nutrients in desert ecosystems of the Phoenix metropolitan area, Arizona (USA). Urban Ecosyst. 2010, 13, 295–317. [Google Scholar] [CrossRef]
- Asabere, S.B.; Zeppenfeld, T.; Nketia, K.A.; Sauer, D. Urbanization leads to increases in pH, carbonate, and soil organic matter stocks of arable soils of Kumasi, Ghana (West Africa). Front. Environ. Sci. 2018, 6, 1–17. [Google Scholar] [CrossRef]
- Lovett, G.M.; Traynor, M.N.; Pouyat, R.V.; Carreiro, M.M.; Zhu, W.; Baxter, J.W. Atmospheric deposition to oak forests along an urbanrural gradient. Environ. Sci. Technol. 2000, 34, 4294–4300. [Google Scholar] [CrossRef]
- Vodyanitskii, Y.N. Organic matter of urban soils: A review. Eurasian Soil Sci. 2015, 8, 802–811. [Google Scholar] [CrossRef]
- Lorenz, K.; Lal, R. Biogeochemical C and N cycles in urban soils. Environ. Int. 2009, 35, 1–8. [Google Scholar] [CrossRef]
- Mao, Q.; Huang, G.; Buyantuev, A.; Wu, J.; Luo, S.; Ma, K. Spatial heterogeneity of urban soils: The case of the Beijing metropolitan region, China. Ecol. Process. 2014, 3, 1–11. [Google Scholar] [CrossRef] [Green Version]
- Ebenebe, P.C.; Shale, K.; Sedibe, M.; Tikilili, P.; Achilonu, M.C. South African mine effluents: Heavy metal pollution and impact on the ecosystem. Int. J. Chem. Sci. 2017, 15, 1–12. [Google Scholar]
- Fashola, M.O.; Ngole-Jeme, V.M.; Babalola, O.O. Heavy metal pollution from gold mines: Environmental effects and bacterial strategies for resistance. Int. J. Environ. Res. Public Health 2016, 13, 1047. [Google Scholar] [CrossRef] [Green Version]
- Ghaley, B.B.; Porter, J.R.; Sandhu, H.S. Soil-Based ecosystem services: A synthesis of nutrient cycling and carbon sequestration assessment methods. Int. J. Biodivers. Sci. Ecosyst. Serv. Manag. 2014, 10, 177–186. [Google Scholar] [CrossRef]
- Schwilch, L.; Bernet, L.; Fleskens, E.; Giannakis, J.; Leventon, T.; Marañón, J.; Mills, C.; Short, J.; Stolte, H.; van Delden, S. Operationalizing ecosystem services for the mitigation of soil threats: A proposed framework. Ecol. Indic. 2016, 67, 586–597. [Google Scholar] [CrossRef]
- Oertel, C.; Matschullat, J.; Zurba, K.; Zimmermann, F.; Erasmi, S. Greenhouse gas emissions from Soils—A review. Geochemistry 2016, 76, 327–352. [Google Scholar] [CrossRef] [Green Version]
- Jobbágy, E.; Jackson, R. The vertical distribution of soil organic carbon and its relation to climate and vegetation. Ecol. Appl. 2000, 10, 423–436. [Google Scholar] [CrossRef]
- Batjes, N.H. Total carbon and nitrogen in the soils of the world. Eur. J. Soil Sci. 1996, 47, 151–163. [Google Scholar] [CrossRef]
- Le Quéré, C.; Raupach, M.R.; Canadell, J.G.; Marland, G.; Bopp, L.; Ciais, P.; Conway, T.J.; Doney, S.C.; Feely, R.A.; Foster, P.; et al. Trends in the sources and sinks of carbon dioxide. Nat. Geosci. 2009, 2, 831–836. [Google Scholar] [CrossRef]
- Tommaso, S.; Mouratiadou, I.; Gaiser, T.; Berg-Mohnicke, M.; Wallor, E.; Ewert, F.; Nendel, C. Estimating the contribution of crop residues to soil organic carbon conservation. Environ. Res. Lett. 2019, 14, 094008. [Google Scholar] [CrossRef]
- Obalum, S.; Chibuike, G.; Peth, S.; Ouyang, Y. Soil organic matter as sole indicator of soil degradation. Environ. Monit. Assess. 2017, 189, 176. [Google Scholar] [CrossRef]
- Jim, C.Y. Soil characteristics and management in an urban park in Hong Kong. Environ. Manag. 1998, 22, 683–695. [Google Scholar] [CrossRef]
- Schneider, A.; Friedl, M.A.; Potere, D. A new map of global urban extent from MODIS satellite data. Environ. Res. Lett. 2009, 4, 044003. [Google Scholar] [CrossRef] [Green Version]
- Intergovernmental Panel on Climate Change. Human settlements, infrastructure, and spatial planning. In Climate Change 2014: Mitigation of Climate Change: Working Group III Contribution to the IPCC Fifth Assessment Report; Cambridge University Press: Cambridge, UK; New York, NY, USA, 2015; pp. 923–1000. [Google Scholar]
- Yang, X.; Yue, W.; Xu, H.; Wu, J.; He, Y. Environmental consequences of rapid urbanization in Zhejiang province, East China. Int. J. Environ. Res. Public Health 2014, 11, 7045–7059. [Google Scholar] [CrossRef]
- Alberti, M. The effects of urban patterns on ecosystem function. Int. Reg. Sci. Rev. 2005, 28, 168–192. [Google Scholar] [CrossRef]
- Cullis, J.D.S.; Horn, A.; Rossouw, N.; Fisher-Jeffes, L.; Kunneke, M.M.; Hoffman, W. Urbanisation, climate change and its impact on water quality and economic risks in a water scarce and rapidly urbanising catchment: Case study of the Berg River Catchment. H2Open J. 2019, 2, 146–167. [Google Scholar] [CrossRef] [Green Version]
- Du Preez, C.C.; van Huyssteen, C.W.; Mnkeni, P.N.S. Land use and soil organic matter in South Africa 1: A review on spatial variability and the influence of rangeland stock production. S. Afr. J. Sci. 2011, 107, 27–34. [Google Scholar] [CrossRef]
- Toru, T.; Kibret, K. Carbon stock under major land use/land cover types of Hades sub-watershed, eastern Ethiopia. Carbon Balance Manag. 2019, 14, 1–14. [Google Scholar] [CrossRef] [Green Version]
- Lindén, L.; Riikonen, A.; Setälä, H.; Yli-Pelkonen, V. Quantifying carbon stocks in urban parks under cold climate conditions. Urban For. Urban Green. 2020, 49, 126633. [Google Scholar] [CrossRef]
- Wang, S.; Adhikari, K.; Zhuang, Q.; Gu, H.; Jin, X. Impacts of urbanization on soil organic carbon stocks in the northeast coastal agricultural areas of China. Sci. Total Environ. 2020, 721, 137814. [Google Scholar] [CrossRef]
- Zondi, S. Recharge Rates and Processes in the Upper Crocodile Catchment. Master’s Thesis, University of the Witwatersrand, Johannesburg, South Africa, 2017. [Google Scholar]
- Tinnefeld, M. Conceptual Hydropedological Response Verification and Polygon Refinement on Portion 31 & 32 Blue Hills 397 JR, Midrand, Gauteng Province; Hydro Pedo (Pty) Ltd: Johannesburg, South Africa, 2017. [Google Scholar]
- The City of Johannesburg. Drafted Integrated Development Plan 2020/21; The City of Johannesburg: Johannesburg, South Africa, 2020. [Google Scholar]
- Terblanche, A.P.S.; Opperman, L.; Nel, C.M.E.; Reinach, S.G.; Tosen, G.; Cadman, A. Preliminary results ofexposure measurements and health effects of the Vaal Triangle air pollution health study. S. Afr. Med. J. 1992, 81, 550–556. [Google Scholar]
- Annegarn, H.; Scorgie, Y. Air quality management strategy for the Vaal Triangle: Part III. Clean Air J. 1997, 9, 11–19. [Google Scholar]
- Scorgie, Y.; Kneen, M.A.; Annegarn, H.J.; Burger, L.W. Air pollution in the Vaal Triangle: Quantifying source contributions and identifying cost effective solutions. Off. J. Natl. Assoc. Clean Air 2003, 13, 2. [Google Scholar] [CrossRef]
- Tinnefeld, M.; Le Roux, P.A.L.; Job, N.; Van Zijl, G.M.; Van Tol, J.J.; Lorentz, S.A. Research Report on the Hydropedology of Part of the Halfway House Granite Dome; Department of Infrastructure and Environment, City of Johannesburg Metropolitan Council: Johannesburg, South Africa; University of the Free State, Institute of Groundwater Studies: Bloemfontein, South Africa, 2017. [Google Scholar]
- Soil Classification Working Group. Soil Classification: A Taxonomic System for South Africa; Department of Agricultural Development: Pretoria, South Africa, 1991. [Google Scholar]
- IUSS Working Group WRB. World reference base for soil resources 2014. Update 2015 International Soil Classification System for Naming Soils and Creating Legends for Soil Maps; World Soil Resources Reports No. 106; FAO: Rome, Italy, 2015. [Google Scholar]
- Van Tol, J.J.; Le Roux, P.A.L. Hydropedological grouping of South African soil forms. S. Afr. J. Plant Soil 2019, 1–3. [Google Scholar] [CrossRef]
- Xu, S.; Sheng, C.; Tian, C. Changing soil carbon: Influencing factors, sequestration strategy and research direction. Carbon Balance Manag. 2020, 15, 1–9. [Google Scholar] [CrossRef] [Green Version]
- Blake, G.R.; Hartge, K.H. Bulk density. In Methods of Soil Analysis, Part 1; Klute, A., Ed.; Agronomy 9 ASA: Madison, WI, USA, 1986; pp. 363–375. [Google Scholar]
- Nelson, D.W.; Sommers, L.E. Total carbon, organic carbon, and organic matter. In Methods of Soil Analysis, Part 3: Chemical Methods; Sparks, D.L., Page, A.L., Helmke, P.A., Loeppert, R.H., Soltanpour, P.N., Tabatabai, M.A., Johnston, C.T., Sumner, M.E., Eds.; Book Series No.5; Soil Science Society of America: Madison, WI, USA, 1996; pp. 961–1010. [Google Scholar]
- Van Zijl, G.M.; Van Tol, J.J.; Bouwer, D.; Lorentz, S.; Le Roux, P.A.L. Combining historical remote sensing, digital soil mapping and hydrological modelling to produce solutions for infrastructure damage in Cosmo City, South Africa. Remote Sens. 2020, 12, 433. [Google Scholar] [CrossRef] [Green Version]
- Noppol Arunrat, N.; Pumijumnong, N.; Sereenonchai, S.; Chareonwong, U. Factors controlling soil organic carbon sequestration of highland agricultural areas in the Mae Chaem Basin, Northern Thailand. J. Agron. 2020, 10, 305. [Google Scholar] [CrossRef] [Green Version]
- Ribeiro, H.V.; Rybski, D.; Kropp, J.P. Effects of changing population or density on urban carbon dioxide emissions. Nat. Commun. 2019, 10, 3204. [Google Scholar] [CrossRef] [PubMed] [Green Version]
- Rybski, D.; Sterzel, T.; Reusser, D.; Fichtner, C.; Kropp, J. Cities as nuclei of sustainability? Environ. Plan. B 2016, 44, 425–440. [Google Scholar] [CrossRef] [Green Version]
- Ontl, T.A.; Schulte, L.A. Soil carbon storage. Nat. Educ. Knowl. 2012, 3, 35. [Google Scholar]
- Henry, M.; Valentini, R.; Bernoux, M. Soil carbon stocks in ecoregions of Africa. Biogeosci. Discuss. 2009, 6, 797–823. [Google Scholar] [CrossRef]
- Parajuli, P.B.; Duffy, S. Evaluation of soil organic carbon and soil moisture content from agricultural fields in Mississippi. Open J. Soil Sci. 2013, 3, 81–90. [Google Scholar] [CrossRef] [Green Version]
- Liu, Z.; Shao, M.; Wang, Y. Effect of environmental factors on regional soil organic carbon stocks across the Loess Plateau region, China. Agric. Ecosyst. Environ. 2011, 142, 184–194. [Google Scholar] [CrossRef]
- Hobley, E.; Wilson, B.; Wilkie, A.; Gray, J.; Koen, T. Drivers of soil organic carbon storage and vertical distribution in Eastern Australia. Plant Soil 2015, 390, 111–127. [Google Scholar] [CrossRef]
- Davies, Z.G.; Edmondson, J.L.; Heinemeyer, A.; Leake, J.R.; Gaston, K.J. Mapping an urban ecosystem service: Quantifying above-ground carbon storage at a city-wide scale. J. Appl. Ecol. 2011, 48, 1125–1134. [Google Scholar] [CrossRef] [Green Version]
- Wilson, T.M.; Warren, J.G. Bulk Density and carbon concentration variance influence on soil carbon stock measurements. Commun. Soil Sci. Plant Anal. 2015, 46, 2342–2356. [Google Scholar] [CrossRef]
- Chaudhari, P.R.; Ahire, D.V.; Ahire, V.D.; Chkravarty, M.; Maity, S. Soil bulk density as related to soil texture, organic matter content and available total nutrients of coimbatore soil. Int. J. Sci. Res. 2013, 3, 1–8. [Google Scholar]
- Ghimire, P.; Bhatta, B.; Pokhrel, B.; Kafle, G.; Paudel, P. Soil organic carbon stocks under different land uses in chure region of makawanpur district, Nepal. SAARC J. Agric. 2018, 16, 13–23. [Google Scholar] [CrossRef]
- Wen, Y.; Xiao, J.; Goodman, B.A.; He, X. Effects of organic amendments on the transformation of Fe (Oxyhydr) oxides and soil organic carbon storage. Front. Earth Sci. 2019, 7, 1–15. [Google Scholar] [CrossRef]
- Weber, K.A.; Urrutia, M.M.; Churchill, P.F.; Kukkadapu, R.K.; Roden, E.E. Anaerobic redox cycling of iron by freshwater sediment microorganisms. Environ. Microbiol. 2006, 8, 100–113. [Google Scholar] [CrossRef] [Green Version]
- Plante, A.F.; Conant, R.T.; Stewart, C.E.; Paustian, K.; Six, J. Impact of soil texture on the distribution of soil organic matter in physical and chemical fractions. Soil Sci. Soc. Am. J. 2006, 70, 287–296. [Google Scholar] [CrossRef]
- Azlan, A.; Aweng, E.R.; Ibrahim, C.O.; Noorhaidah, A. Correlation between soil organic matter, total organic matter and water content with climate and depths of soil at different land use in Kelantan, Malaysia. J. Appl. Sci. Environ. Manag. 2012, 16, 353–358. [Google Scholar]
- Wei, H.; Guenet, B.; Vicca, S.; Nunan, N.; Asard, H.; AbdElgawad, H.; Shen, W.; Janssens, I.A. High clay content accelerates the decomposition of fresh organic matter in artificial soils. Soil Biol. Biochem. 2014, 77, 100–108. [Google Scholar] [CrossRef]
Figure 1.
Location of the sampling sites within Johannesburg Granite Dome.

Figure 2.
The vertical distribution of soil carbon within the (a) recharge (deep); (b) recharge (shallow); (c) responsive (saturated); (d) responsive (shallow); (e) interflow (A/B); and (f) interflow (soil/bedrock) soil profiles for the A, B, and C horizons.
Figure 2.
The vertical distribution of soil carbon within the (a) recharge (deep); (b) recharge (shallow); (c) responsive (saturated); (d) responsive (shallow); (e) interflow (A/B); and (f) interflow (soil/bedrock) soil profiles for the A, B, and C horizons.

Figure 3.
The spatial distribution of soil carbon stocks within (a) the A horizon; and (b) the entire soil profile.
Figure 3.
The spatial distribution of soil carbon stocks within (a) the A horizon; and (b) the entire soil profile.


Table 1.
Description of the six hydropedological groups and the respective South African and FAO WRB soil classification systems.
Table 1.
Description of the six hydropedological groups and the respective South African and FAO WRB soil classification systems.
| Hydropedological Group | Soil Forms [34] | WRB [35] | Description |
|---|---|---|---|
| Recharge (deep) | Glencoe, Clovelly, Hutton, Constantia, Griffin | Plinthosols, Acrisol, Arenosols | These soils show limited signs of saturation and water flows vertically through and out of the soil profile. |
| Recharge (shallow) | Glenrosa, Mispah | Leptosols | These soils also show limited signs of wetness, where water flows vertically into the underlying bedrock. |
| Responsive (saturated) | Westleigh, Kroonstad, Katspruit | Plinthosols, Gleysols | These soils show prolonged periods of saturation and typically result in overland flow due to limited water storage capacity. |
| Responsive (shallow) | Dresden, Mispah | Plinthosols, Leptosols | Shallow soils with a permeable underlying rock. These soils have limited water storage capacity, promoting overland flow. |
| Interflow (A/B) | Longlands, Wasbank | Plinthosols, Planosols, Acrisols, Luvisols | These are typically duplex soils, with clayey topsoil horizons, facilitating build-up of water. |
| Interflow (soil/bedrock) | Avalon, Pinedene, Fernwood, Tukulu | Plinthosols, Lixisols, Arenosols, Stagnosols, Acrisols, | In these soils, a freely drained soil horizon overlies a relatively impermeable bedrock, leading to periodic saturation. |
Table 2.
Summary of the mean soil bulk density, C content, and SOC stocks for each hydropedological group at the respective soil horizons (mean ± standard deviation).
Table 2.
Summary of the mean soil bulk density, C content, and SOC stocks for each hydropedological group at the respective soil horizons (mean ± standard deviation).
| Hydropedological Group | Average Soil Depth (cm) | Horizon | Bulk Density (g cm−3) | Soil C (%) | SOC Stocks (t C ha−1) | n |
|---|---|---|---|---|---|---|
| Recharge (deep) | 20 | A | 1.51 ± 0 | 1.33 ± 0.85 | 35.05 ± 22.41 | 29 |
| 50 | B | 1.56 ± 0.72 | 0.53 ± 0.13 | 41.42 ± 10.87 | 28 | |
| 180 | C | 1.41 ± 0.11 | 0.24 ± 0.06 | 16.35 ± 5.92 | 20 | |
| Total | 250 | 92.82 ± 39.2 | 77 | |||
| Recharge (shallow) | 15 | A | 1.46 ± 0 | 1.14 ± 0.44 | 25.50 ± 9.77 | 9 |
| 80 | B | 1.26 ± 0 | 0.34 ± 0.37 | 27.84 ± 29.89 | 9 | |
| 15 | C | 1.40 ± 0.16 | 0.11 ± 0.14 | 2.83 ± 3.97 | 9 | |
| Total | 110 | 56.17 ± 43.63 | 27 | |||
| Responsive (saturated) | 15 | A | 1.21 ± 0 | 1.58 ± 0.76 | 30.16 ± 14.55 | 13 |
| 30 | B | 1.55 ± 0 | 0.58 ± 0.18 | 27.61 ± 8.51 | 13 | |
| 110 | C | 1.50 ± 0.07 | 0.32 ± 0.20 | 29.93 ± 21.55 | 13 | |
| Total | 155 | 87.7 ± 44.61 | 39 | |||
| Responsive (shallow) | 15 | A | 1.41 ± 0 | 1.00 ± 0.44 | 17.11 ± 7.62 | 5 |
| 10 | B | 1.55 ± 0 | 0.28 ± 0.39 | 4.27 ± 6.02 | 5 | |
| 30 | C | 1.45 ± 0 | 0.10 ± 0.22 | 1.43 ± 3.20 | 5 | |
| Total | 55 | 22.81 ± 16.84 | 15 | |||
| Interflow (A/B) | 15 | A | 1.39 ± 0 | 1.17 ± 0.59 | 19.54 ± 9.83 | 15 |
| 30 | B | 1.45 ± 0.01 | 0.45 ± 0.20 | 19.44 ± 8.49 | 15 | |
| 15 | C | 1.47 ± 0.07 | 0.19 ± 0.16 | 5.51 ± 4.66 | 15 | |
| Total | 60 | 44.49 ± 22.98 | 45 | |||
| Interflow (soil/bedrock) | 15 | A | 1.43 ± 0 | 1.01 ± 0.35 | 23.21 ± 8.11 | 22 |
| 35 | B | 1.57 ± 0.06 | 0.47 ± 0.26 | 26.23 ± 13.25 | 22 | |
| 60 | C | 1.46 ± 0.10 | 0.25 ± 0.08 | 12.30 ± 5.59 | 18 | |
| Total | 110 | 61.74 ± 26.95 | 62 |
Publisher’s Note: MDPI stays neutral with regard to jurisdictional claims in published maps and institutional affiliations. |
© 2021 by the authors. Licensee MDPI, Basel, Switzerland. This article is an open access article distributed under the terms and conditions of the Creative Commons Attribution (CC BY) license (http://creativecommons.org/licenses/by/4.0/).
Share and Cite
MDPI and ACS Style
Seboko, K.R.; Kotze, E.; van Tol, J.; van Zijl, G. Characterization of Soil Carbon Stocks in the City of Johannesburg. Land 2021, 10, 83. https://0-doi-org.brum.beds.ac.uk/10.3390/land10010083
AMA Style
Seboko KR, Kotze E, van Tol J, van Zijl G. Characterization of Soil Carbon Stocks in the City of Johannesburg. Land. 2021; 10(1):83. https://0-doi-org.brum.beds.ac.uk/10.3390/land10010083
Chicago/Turabian StyleSeboko, Kelebohile Rose, Elmarie Kotze, Johan van Tol, and George van Zijl. 2021. "Characterization of Soil Carbon Stocks in the City of Johannesburg" Land 10, no. 1: 83. https://0-doi-org.brum.beds.ac.uk/10.3390/land10010083
Note that from the first issue of 2016, this journal uses article numbers instead of page numbers. See further details here.