Article

Dynamics of Changes in Selected Soil Traits in the Profiles of Arable Soils Anthropogenically Alkalised by the Cement and Lime Industry within the Kielecko-Łagowski Vale (Poland)

by
Anna Świercz
1,*,
Agnieszka Gandzel
2 and
Ilona Tomczyk-Wydrych
3
1
Institute of Geography and Environmental Sciences, Jan Kochanowski University, 7 Uniwersytecka Street, 25-406 Kielce, Poland
2
Technical and Industry Training Center, S. Leszczyńskiej Street 8, 32-600 Oświęcim, Poland
3
Institute of Geography and Environmental Sciences, Doctoral School, Jan Kochanowski University, 7 Uniwersytecka Street, 25-406 Kielce, Poland
*
Author to whom correspondence should be addressed.
Submission received: 9 December 2020 / Revised: 11 January 2021 / Accepted: 14 January 2021 / Published: 18 January 2021

Abstract

:
This study presents the influence of the cement and lime industry on the physical and chemical properties of arable soils. In spite of using modern forms of environmental protection against dust emissions, this type of industry causes unfavourable phenomenon of excessive alkalisation of soil. This process is relatively rare in Poland. However, in the Świętokrzyskie Province, it has been responsible for the largest transformation of soils in recent years. The analysis included soil samples taken from five profiles located in the vicinity of Dyckerhoff Polska Sp. z o.o. Nowiny Cement Plant. The study results obtained in 2019 were compared with those obtained in 1978 and 2005. The most attention was paid to soil pH; CaCO3 content; organic carbon and nitrogen content; concentrations of available components such as P2O5, K2O and Mg; and the saturation level of sorption complex with alkaline cations. It was found that long-term imission of pollutants caused significant changes in the basic soil properties, which remain in soils despite the evident decrease in the cement-lime dust emission. These include high pH values, excessive CaCO3 content, high soil saturation with alkaline cations and decreases in total carbon content, which were especially visible in soil humus horizons.

1. Introduction

Soils fulfil a number of natural and economic functions [1,2,3]. The production function is generally mentioned first, where soils are a substrate for the cultivation of food, forage and industrial crops or for forest plantations. In this context, the long-term monitoring of the basic properties of soils plays an important role in tracking the dynamics of changes under the influence of anthropogenic pressures changing over time. In addition, the condition of soils may directly and indirectly affect the responses of plant and animal organisms to the improvement of soil quality or its degradation [4,5].
The well-developed cement and lime industry causes far-reaching transformations of soil [6,7,8,9,10,11,12,13,14,15]. Pollutants are emitted in the form of dusts and gases, which in turn causes their release to all components of the environment, including soils [7,8,10,12].
The chemical composition of cement and lime dust is relatively constant and depends on the composition of raw materials used in technological processes. The emitted dust contains mainly CaO (<43%) and is characterised by high pHKCl values (<12.5) in terms of alkaline pH, which, due to many years of emission, significantly affects the properties of soil [12,15,16,17,18]. Moreover, it is more often indicated that the excessive deposition of cement and lime dust into soils is a highly stressful factor causing acute physiological reactions in plants, including the reduction of photosynthesis and gas exchange [7,19].
In the Świętokrzyskie Province, the cement and lime industry is characterised by dynamic development, and its level of technological achievement, production volume and raw material extraction scale is among the leading ones in Europe. Long-term alkaline pressure on the soils located in the area of 500 km2 nearby the Dyckerhoff Polska Sp. z o.o. Nowiny Cement Plant, “Trzuskawica” S.A. Cement Roadstone Holding, “Jaźwica” Mineral Resource Mine, “Lafarge” Dolomite Mine in Radkowice, Lafarge Cement Plant in Małogoszcz and Lhoist S.A. Lime Production Plant in Bukowa has been lasting and thoroughly influencing the basic physicochemical properties of the soils, especially the Haplic Podzol soils formed on sands, since the 1960s. Due to modernisation, up-to-date methods of management and control of a technological process have been introduced, considerably reducing the negative impact on the environment. However, in spite of restricted emission, lime plants are the main source of cement and lime dust emissions that contain a compound of silicate, lime and aluminium minerals. Moreover, during thermal processes occurring in a rotary kiln while producing cement, CO2 and SO2 are emitted into the atmosphere. In the case of lime production, a large amount of CaO and CO2 is released. Significant amounts of calcium ions entering the soil cause the effect of “over-fertilization”—alkalisation which can chemically degrade soils [15,17,19,20,21,22]. Although soil alkalisation is relatively rare in Poland, it is this process which has been responsible for the largest transformation of soils in the Świętokrzyskie Province in recent years.
The aim of the study was to reveal changes of particular physicochemical properties of the arable soils located in the monitored areas of the Kielecko-Łagowski Vale between 1978 and 2019 as a zone of long-term and declining alkaline emission. The following research hypotheses were verified: Whether the reduced alkaline emission has an effect on the soil properties in terms of its regeneration (e.g., decrease in pH, hydrolytic acidity, carbonate content), which soil type or genetic level will react most strongly to the reduced pressure and whether the observed trends can be considered as permanent.

2. Materials and Methods
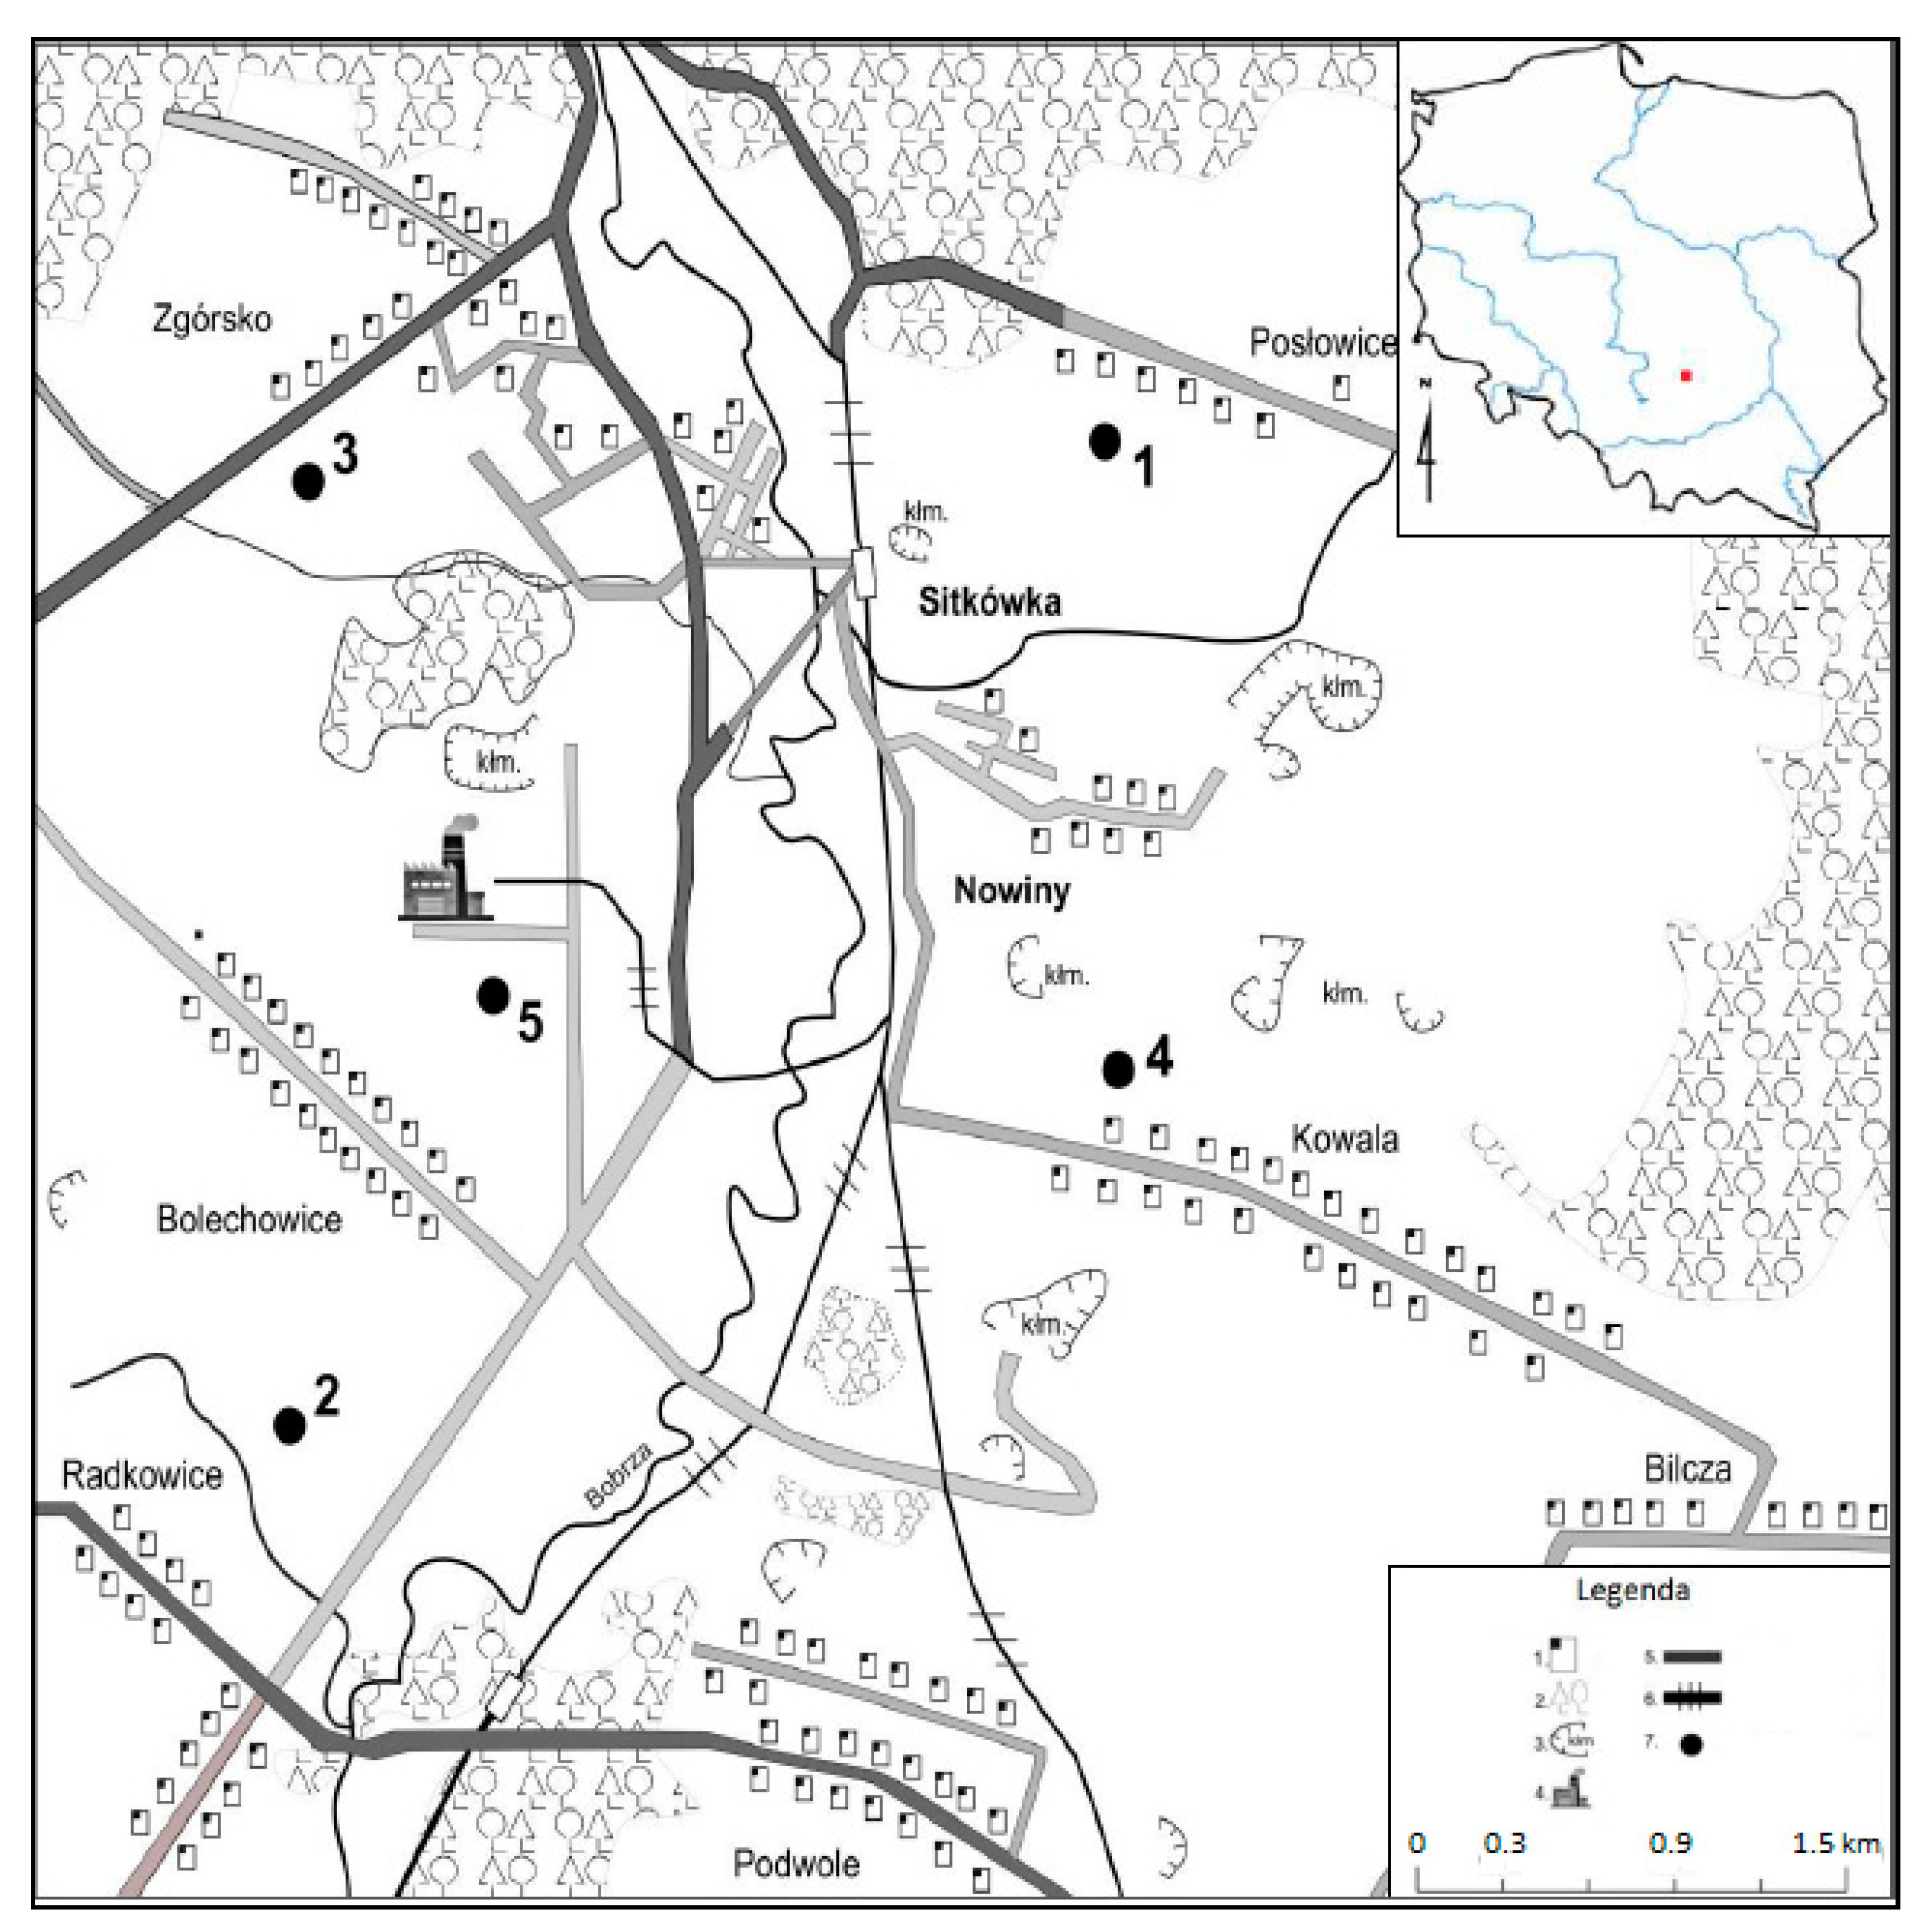
2.1. Study Area

The research site covered an area of the Sitkówka Nowiny Commune, which lies within the Świętokrzyskie Mountains mesoregion belonging to the Kielce Upland macroregion. The geological structure is diversified. The subsoil is dominated by Cambrian and Devonian quartzites, Cretaceous and Jurassic limestones and Triassic sandstones, as well as slates and clay. The highest hills do not exceed 388 m above sea level. Sitkówka-Nowiny is an industrial and agricultural commune with an average population of 170 people per km2. The agricultural land occupies 42% of the commune and 37% of the forests. Due to the dustiness of land, especially the aboveground part of plants and disruption of water relations, the agricultural land cannot be used intensively. This problem also applies to arable soils, which are not used according to their agricultural suitability, because excessive dustiness of calcium and sulphur compounds interfere with the vegetation of open-pollinated plants and cause degradation of aboveground parts of most crops. The alkaline reaction of soils formed as a result of long-term precipitation of calcium compounds creates limitations in the cultivation of weak soils, which dominate in the Sitkówka-Nowiny Commune, especially rye, potatoes, lupine, serradella and oats. Wheat, barley and legume plants, which yield better in an alkaline environment, are necessarily dominant in the crop structure [23].
The climate is moderate. Taking into account the thermal classification of the years, since 1971, we have observed a constant increase in the average annual temperature. The year 1978, according to H. Lorenc classification (2000), could be considered as cold (tśr − 1.0 σ ≤ tz < tśr − 0.5 σ), the year 2005 as slightly warm (tśr + 0.5 σ < tz ≤ tśr + 1.0 σ), the year 2019 as extremely warm (tz < tśr − 2.5 σ) (where tśr = temperature from the years 1971–2000, tz = temperature in a given year, σ = standard deviation). Therefore, over the past 40 years, an increase in the average annual temperature of almost 2 °C was observed (the average annual temperature in 1978 was 7.10 °C; in 2005, 7.8 °C; in 2019, 9.4 °C). It is worth noting that, since 2004, extreme temperatures exceeding 30 °C have been observed in June and August, while humidity conditions, despite significant fluctuations, are considered comparable. The winds have been characterized by an average velocity of 3 m/s, predominantly from the western and north-western directions (70%) [24,25].
In June 2019, five soil profiles were collected in order to identify the types of soils and their physicochemical properties (the same areas were taken into account in 1978 and then in 2005). The profiles were located at a distance from 400 m to 3 km away from the Dyckerhoff Polska Sp. z o.o. Nowiny Cement Plant (Figure 1), in the area of excessive cement and lime dust emission into soils (Profile no. 1—3 km; Profile no. 2—2.2 km; Profile no. 3—1.7 km; Profile no. 4—2.5 km; Profile no. 5—400 m).
Soil samples were taken each time in June. Soil pits up to the depth of 40–120 cm (depending on the soil type) were made onsite. Soil samples of damaged structures (about 1 kg) were taken from each level according to the methods used in soil science.

2.2. Data Collection and Analysis

Soil profiles were described in detail according to the methodology as it has been done in the past years [26]. During fieldwork, the thickness of individual subhorizons, grain size composition, colour based on the Standard Soil Colour Charts according to Munsell and the type of soil humus were determined. Samples for research were collected from each genetic subhorizon. In each profile, soil material with disturbed structure was collected from the distinguished genetic subhorizon, which was used for analytical laboratory work. The soil samples were dried at room temperature to an air-dry state. After drying, the mineral samples were ground in a porcelain mortar using a pestle and then sieved through a soil sieve with a mesh diameter of 1 mm. Soil samples were crushed with a Fitch laboratory grind (A-11 model). The samples prepared in this way were then put in cardboard boxes with laboratory metrics. Each soil sample taken from selected genetic horizons, and subhorizons was examined on the basis of the methodology proposed by Kowalkowski and Swałdek (1991) [27] and that by Karczewska and Kabała (2008) [28]:
  • A grain size composition of earthy parts by sieve analysis and Casagrande’s aerometric method modified by Prószyński [27,28];
  • Soil reaction by potentiometric titration (pH H2O, pHKCl) [27,28];
  • Organic carbon (Corg) by Tiurin’s methods (for mineral levels of soils with Corg < 15%—method consisted in oxidation of carbon with 0.4 N solution K2Cr2O7 (in relation to Ag2SO4 catalyst) in acidic medium, the residue of which was titrated with Mohr’s salt (0.1 N Fe(NH2)SO4·6H2O) in relation to orthophenanthroline. For humus levels with Corg > 15%, the Alten method was used [27,28];
  • Nitrogen in general (Norg) by modified Kjeldahl’s method in Kjeltec Auto Analyzer [27,28];
  • Hydrolytic acidity Hh by Kappen’s method in 0.5 M Ca(CH3COO)2 solution [27,28];
  • Sum of exchangeable basic cations (S) by Kappen’s method in 0.5M NH4Cl solution at pH 8.2 [27,28];
  • Acidity Hw and exchangeable aluminium Al3+ by Sokołow’s method [27,28];
  • Content of ingestible ingredients P2O5, K2O, Mg by Enger-Rhiem’s method PN-R-04023 (P2O5), PN-R04022 (K2O), PN-R-04024 (Mg) [27,28].
Dust fall of particle matter was studied using a trapping measure (Bergerhoff type). Glass funnels (input diameter: 7 cm, outlet diameter: 2 cm), connected to the bottles and exposed at 5 research positions, were used in February, May, August and November. Afterward, aggregated rainwater was evaporated, and funnels and jars were rinsed thoroughly with hexane. Ashless cellulose drains were used to extract dust from the mixture. After the exposure, the drains were being dried for 2 h at 45 degrees Celsius and then weighed. Amount of dust fall was calculated by mass difference, time of exposure and funnel area [29] (Table 1, Figure 2).
All analytical procedures were identical to those applied in 1978 and in 2005 in order to make the study results compliant and comparable [30].

3. Results

The main source of soil pollution in the abovementioned area is the Dyckerhoff Polska Sp. z o.o. Nowiny Cement Plant and a few other cement plants or quarries, such as the “Trzuskawica” S.A. Cement Roadstone Holding, “Jaźwica” Mineral Resource Mine, Morawica S.A. Limestone Mine, Kowala Quarry, “Lafarge” Dolomite Mine in Radkowice and Nordkalk Sp. z o.o. Miedzianka Production Plant.
In 1978, the annual lime-cement dust emission was systematically decreasing (from 190 g/m2 to 33 g/m2 in 2017). Average month-long dust fall tended to decrease as well (from 65 g/m2 in 1978 to 9.2 g/m2 in 2019). The biggest reduction (by around 85%) of dust emission was found at research position no. 5 located in Sitkówka. At other positions, the decline in dust fall was equally high (around 82%). The analysed soils were classified as different types [30] (Table 2).
There were no systematic differences between nowadays and the archival results. The names of soil horizons used in 1978 were merely adjusted to the contemporary standards [31]. Divergences in results of analysis of grain size composition were lower than 3–5% and stayed in the range of analytical error (Table 3).
The grain size composition of the analysed soils was diversified. These were soils composed of sand formations (profiles 3, 4), and others from dust formations (profiles 1, 2) and clay ones (profile 5). Long-term emission of lime-cement dusts with high specific density (>2.9 g cm−3) [22] had no influence on changes in the grain size composition of the soils (even though their increase specific density on surface levels were featured in the literature, suggesting the phenomenon of aggregation of soil particle growth under the influence of intensive forest soils liming caused by strong “slurrying”) [32].
The reaction of analysed soils was strictly connected to the variable deposition of alkaline dust. Changes in humus horizons appeared as follows: In 1978, pHKCl ranged from 6.11 to 7.30; then in 2005, it was 6.89 to 8.01; and in 2017, a growth of pH up to 8.21 was noticed, despite a decreasing trend of deposited alkaline dust (Table 4).
The pHKCl from 5.50 to 7.20 is considered the optimum range for biological processes related to metabolism of majority of plants and soil microorganisms. It can be assumed that the analysed soils showed many features of limed soils, which were particularly apparent in the podsolic and fallow soils (Profiles 1 and 3). The results of research conducted in 1978–2005 revealed great changes in pH (Figure 3). Since 2005, changes in pH of humus horizon have been slight, with a maximum change of 0.2 units in profiles no. 3, 4 and 5.
In the analysed profiles, the neutral and alkaline reaction was maintained at the topsoil horizons and decreased at level of the parent rock regardless of its type (Table 4, Figure 4).
Calcium carbonate content in the soil profiles has changed since 1978. At the beginning of the research, it was present only in the surface soil horizons (0.08% to 1.1% CaCO3). The highest value of calcium was revealed in the profile no. 5 (Rendzic leptosol), where the value partly depended on the nature of the bedrock (Devonian limestones). Until 2005, carbonates also appeared in those horizons where it had not been present before. In 2005, carbonate content was reported (0.03–23.42%). The highest increase of CaCO3 was found in the profile no. 3 (Haplic Podzol). The research carried out 14 years later showed a slow decrease in the carbonate content, with the exception of the Haplic Podzol formed out of sands with a low sorption capacity and in the humus horizon of the profile no. 5 (Figure 5).
In the analysed soil profiles, the content of Corg in humus horizons ranged from 179.1 g·kg−1 to 998.0 g·kg−1 in 1978. For 40 years, the low decline of Corg took place, and in 2019, its content in the analysed soil profiles ranged from 104.3 g·kg−1 to 869.1 g·kg−1 (Table 4, Figure 6). The most significant changes in Corg were found in Mollic gleysol (no. 4).
Nitrogen in soils belongs to active and dynamic elements. Its content in the surface horizon of soils in Poland has been estimated to be from 0.02% to 0.035% and depends on a number of factors, including the climate ones [33,34,35].
In the analysed profiles, the highest level of nitrogen was observed in humus, and its content decreased with depth. During the period from 1978 to 2019, the nitrogen content underwent minor changes, with a slight growing tendency in all analysed soil horizons (Table 4).
Phosphorus and potassium are essential elements of yields enrichment. Their content in the soil is one of the most important factors determining soil fertility. Overall content of phosphorus in the arable horizon of soil depends on the type of bedrock, and the main secondary source is dead organism remains [36]. The most mobile phosphorus (digestible) is found in soils with a slightly acid reaction.
In the analysed soils, the phosphorus level took the highest values in the surface horizons (Figure 7). The content of phosphorus in most analysed soils started to decline in 1978. This tendency was most strongly evident in the humus horizon of the Haplic Podzol, with the simultaneous increase in the phosphorus content in the illuvial horizon of that soil. Declines in the content of available phosphorus are caused by the high soil pH, which causes the re-establishment of this element [37].
Similarly to the potassium content, the magnesium content was also higher in the analysed soils over the last 40 years, with the strongest dynamics in the Haplic Podzol.
The sorption complex of analysed soils was characterised by high saturation with alkaline cations. The level of humus saturation showed a rising tendency: From 55.17% in 1978 to 86.1% in 2005 and 86.69% in 2019 (Table 4). At present, this value exceeds 85% in most of the horizons.

4. Discussion

The cement and lime industry plays an important role in the world’s economy. However, despite its popularity and profitability, the use of more and more pro-ecological technologies, improvement of production processes and use of alternative fuels, the cement and lime production consequently leads, inter alia, to environmental pollution through increased alkalisation of habitats [8]. Therefore, the cement industry faces many challenges related to environmental protection and sustainability issues [11].
Acid rocks carried by glaciers from Scandinavia compose 90% of Poland’s soils, which are inherently poor in alkaline cations [38]. In the years 1957–1965, i.e., before the opening of “Nowiny” Cement Plant, acidic soils accounted for as much as 67% of the area of the Sitkówka-Nowiny commune (67%), while in 2008, 94% of the soils of this commune were classified as alkaline soils [23].
The most constant and least susceptible to anthropopressure was the Haplic Podzol soil species, which results from its granulometric composition. It has a significant importance for many physical and chemical properties of soils, including pH, the natural content of contaminants in the soil and the sorption capacity of soils, directly influencing the processes of contaminants migration in the environment. The research shows that the granulometric composition of soil has not changed, nor has its general morphological structure.
The most frequently mentioned changes observed in soils under the influence of alkalization are increases in pH values, increases in carbonate content and increases in buffer volumes [6,16,39]. Similar patterns were observed in the analysed soil profiles.
The influence of soil pH on the phosphorus and nitrogen content has been analysed by various researchers [40]. It was proven that the abovementioned influence differed regarding these two elements. In contrast to nitrogen, acidity reduction and the enrichment of soil in calcium (as a result of liming) reduced the releasing of mineral phosphorus in the soil [41]. Soil reaction is pointed as a decisive factor of phosphorus bioavailability and the possibility of its migration into the soil profile depth [42]. With soil pH higher than 6.5, phosphorus is immobilised by free Fe and Al oxides, while in the case of alkaline, the reaction by calcium ions creates sparingly soluble salts [43,44].
In contrast to phosphorus, potassium is almost completely bound to the mineral part of soils. Total potassium content in arable soils is related to mineral soil composition and content of colloidal and dusty elements [45]. Therefore, higher contents of this element are found in heavier soils with a high-capacity sorption complex. When it comes to light soils with a small capacity sorption complex, there is a greater loss of this element as a result of leaching by atmospheric precipitation [4,46]. The potassium content of studied soils has been increasing since 1977. The highest values are found in surface soils, while the highest changes in the content of this element are observed in the Haplic Podzol.
Another issue related to habitat alkalization is the change in organic matter content. Soil organic matter is the basic indicator of soil quality determining its physicochemical characteristics, such as sorption, buffer capacity and biological processes, which determine many changes, referred to as biological activity. High humus content in soils is a factor stabilizing their structure, reducing their susceptibility to compaction and degradation due to water and wind erosion. The preservation of soil humus resources is important not only for maintaining the productive functions of soils, but also for the role of soils in carbon sequestration from the atmosphere [47].
In many cases, a variety of human impacts which affect the nature result in the loss of soil organic carbon. The use of land for grassland is indicated as the friendliest for soil organic carbon preservation [48].
Over many years of research, a clear loss of carbon (soil humus) was observed. This condition was caused not only by the long-term immission of cement and lime dusts into the soil but also by other factors. These include the change of land use (in 1978, the analysed soils were used for agricultural purposes, mainly rye was grown on them and some were used as hay meadows). Since 1990, the soils have not been used for agricultural purposes. Nowadays, it is a green area (fallow fields subject to natural succession or meadows with mowing remaining on the site). The change of the land use has also been affected by climatic changes (over the observed 40 years, the average annual temperature increased by 1.5–1.8 °C according to the Meteorological Station in Suków), which is conducive to the decrease of humus resources. This fact was pointed out by Antil and Singh (2007), Zimmer et al. (2005) and Elmer et al. (2000) [49,50,51]. In addition, the presence of CaCO3 may affect the temperature of humus levels. This thesis was confirmed by Zimmer et al. (2005) and Elmer, Baumecker (2008), where a subsequent increase in the temperature of humus levels by 0.02 °C was followed by a loss of Corg by 15–20% (depending on soil type) [50,52]. Trends related to general climate warming are an undisputed fact and should also be related to general organic matter resources.
It seems that the observed soil humus loss should be related to a smaller illuvium, the displacement of humus compounds deep into the profiles and the higher anthropogenic chemical and biological activity of soils. This has been confirmed by long-term studies conducted under conditions of boron habitat alkalization [16] and model studies [52,53]. These studies have shown that alkaline conditions (higher pH values) are conducive to a decrease in the total content of organic matter in the soil, because under alkaline conditions, the organic matter is pepticized to a much greater extent due to an increase in surface charge. Another reason for lowering the carbon resources may be a change in hygrothermal conditions, such as droughts and higher air temperatures during the period of intensive plant growth, which also influence the decomposition rate [54].

5. Conclusions

Over 50 years since launching, the Dyckerhoff Polska Sp. z o.o. Nowiny Cement Plant and other cement and lime plants have caused great modifications in soil cover functioning in this area. In spite of dust emission and immission decreasing, the effects of cement plant operations are still visible, especially in the Haplic Podzol, with low buffer capacities. The regeneration of soils and return to the original properties are hampered by the noticeable drop of alkaline dusts of >33.0 g/m2/year and other anthropogenic factors (dense network of roads, fertilisation).
Constant immission of cement and lime dust has had a significant influence on the chemical quality and basic properties of the soils since 1966. It was found that the long-term effect of alkaline immission resulted in:
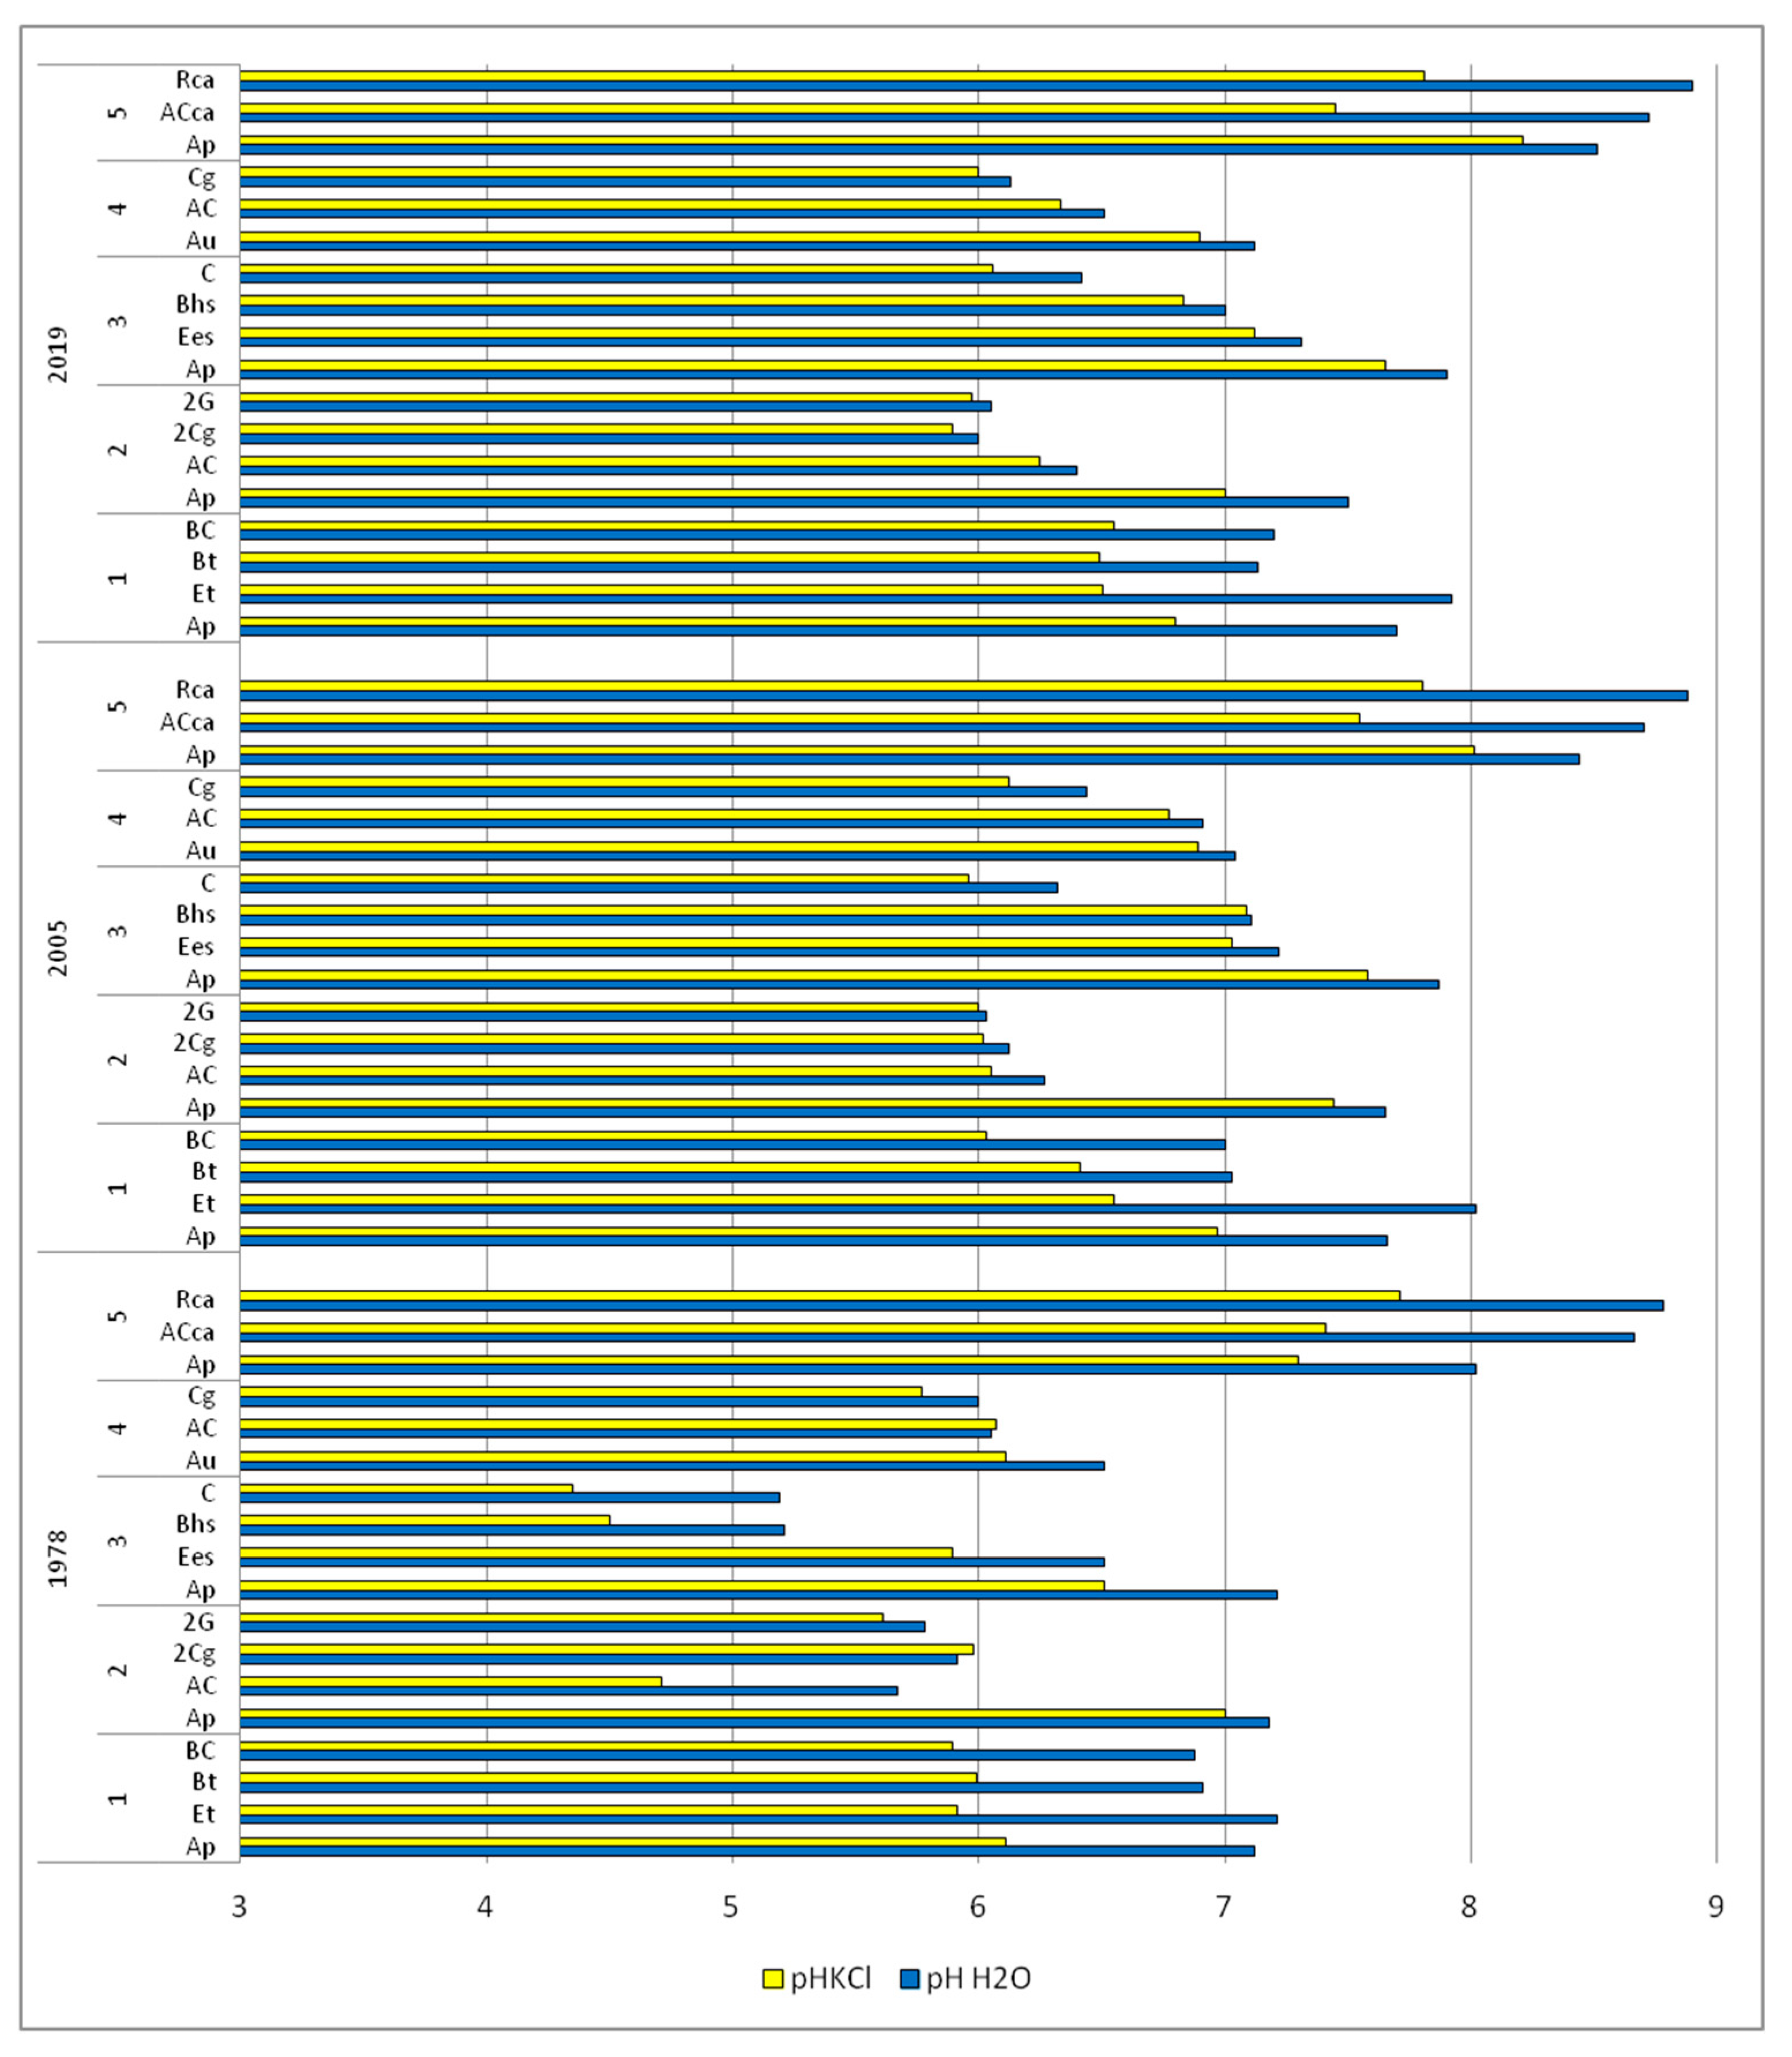
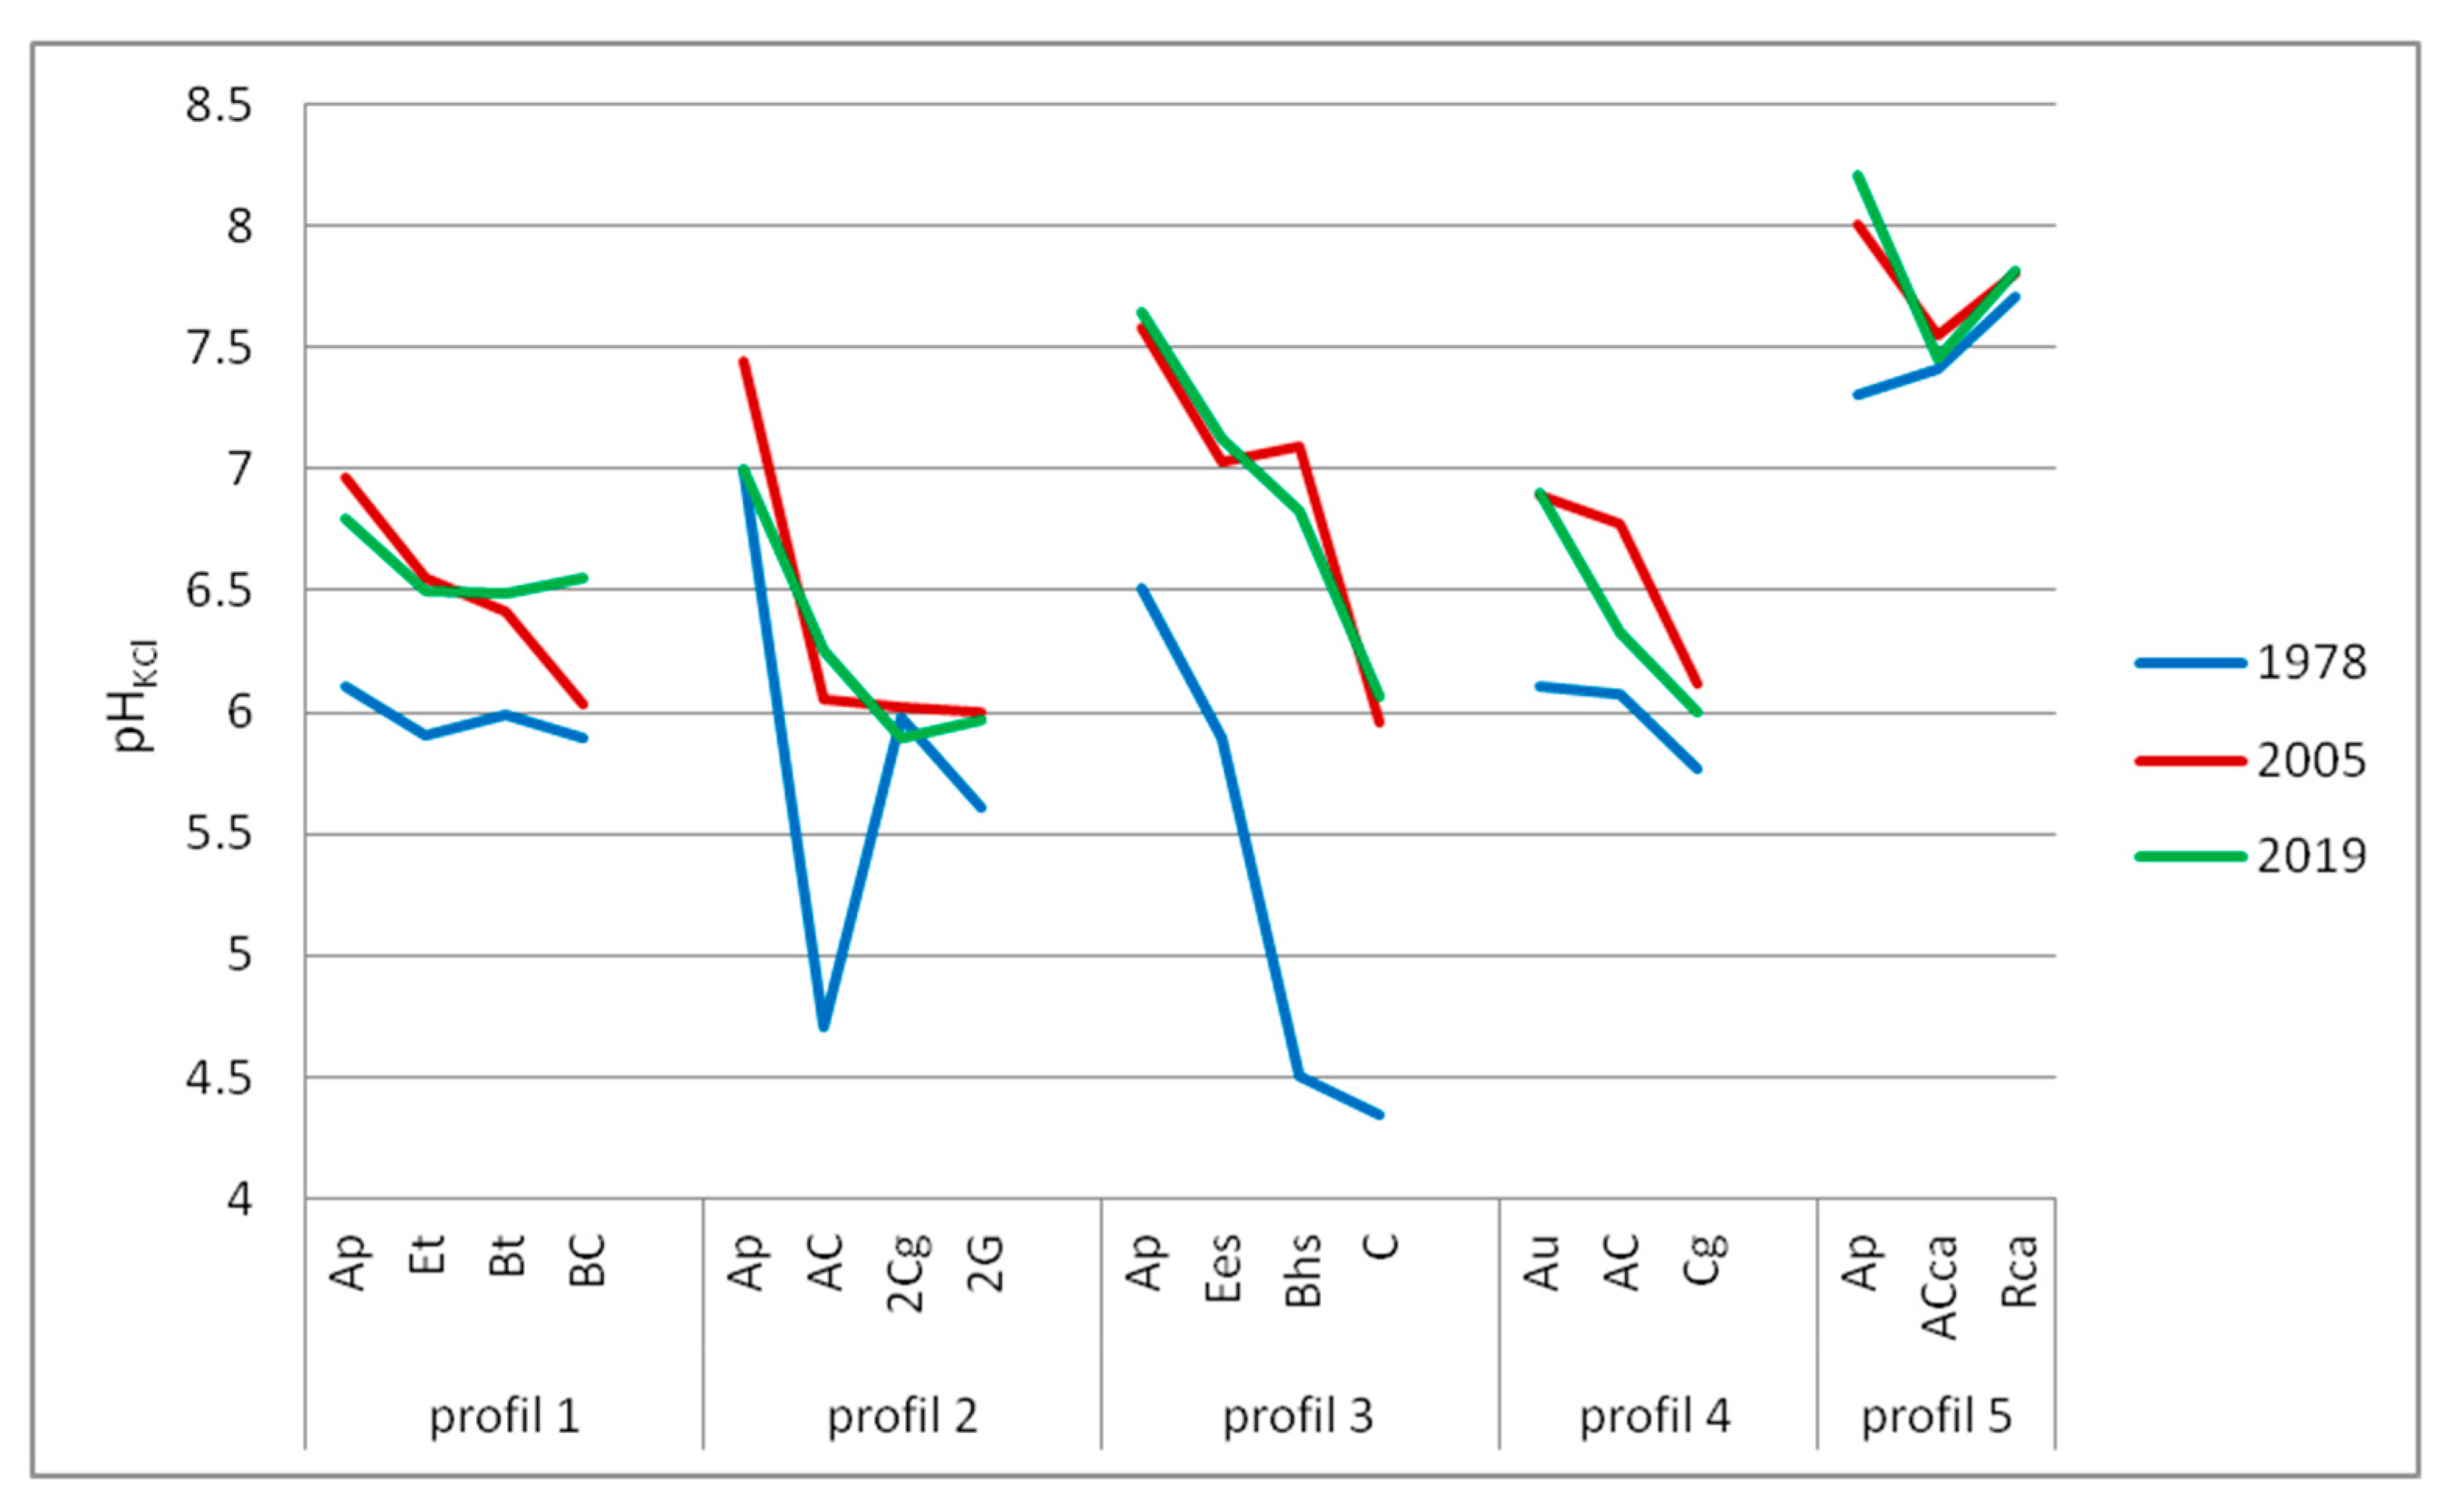
  • Higher pH of soil, and the highest values pHKCl in humus horizons;
  • Increased CaCO3 content in organic and organic-mineral horizons;
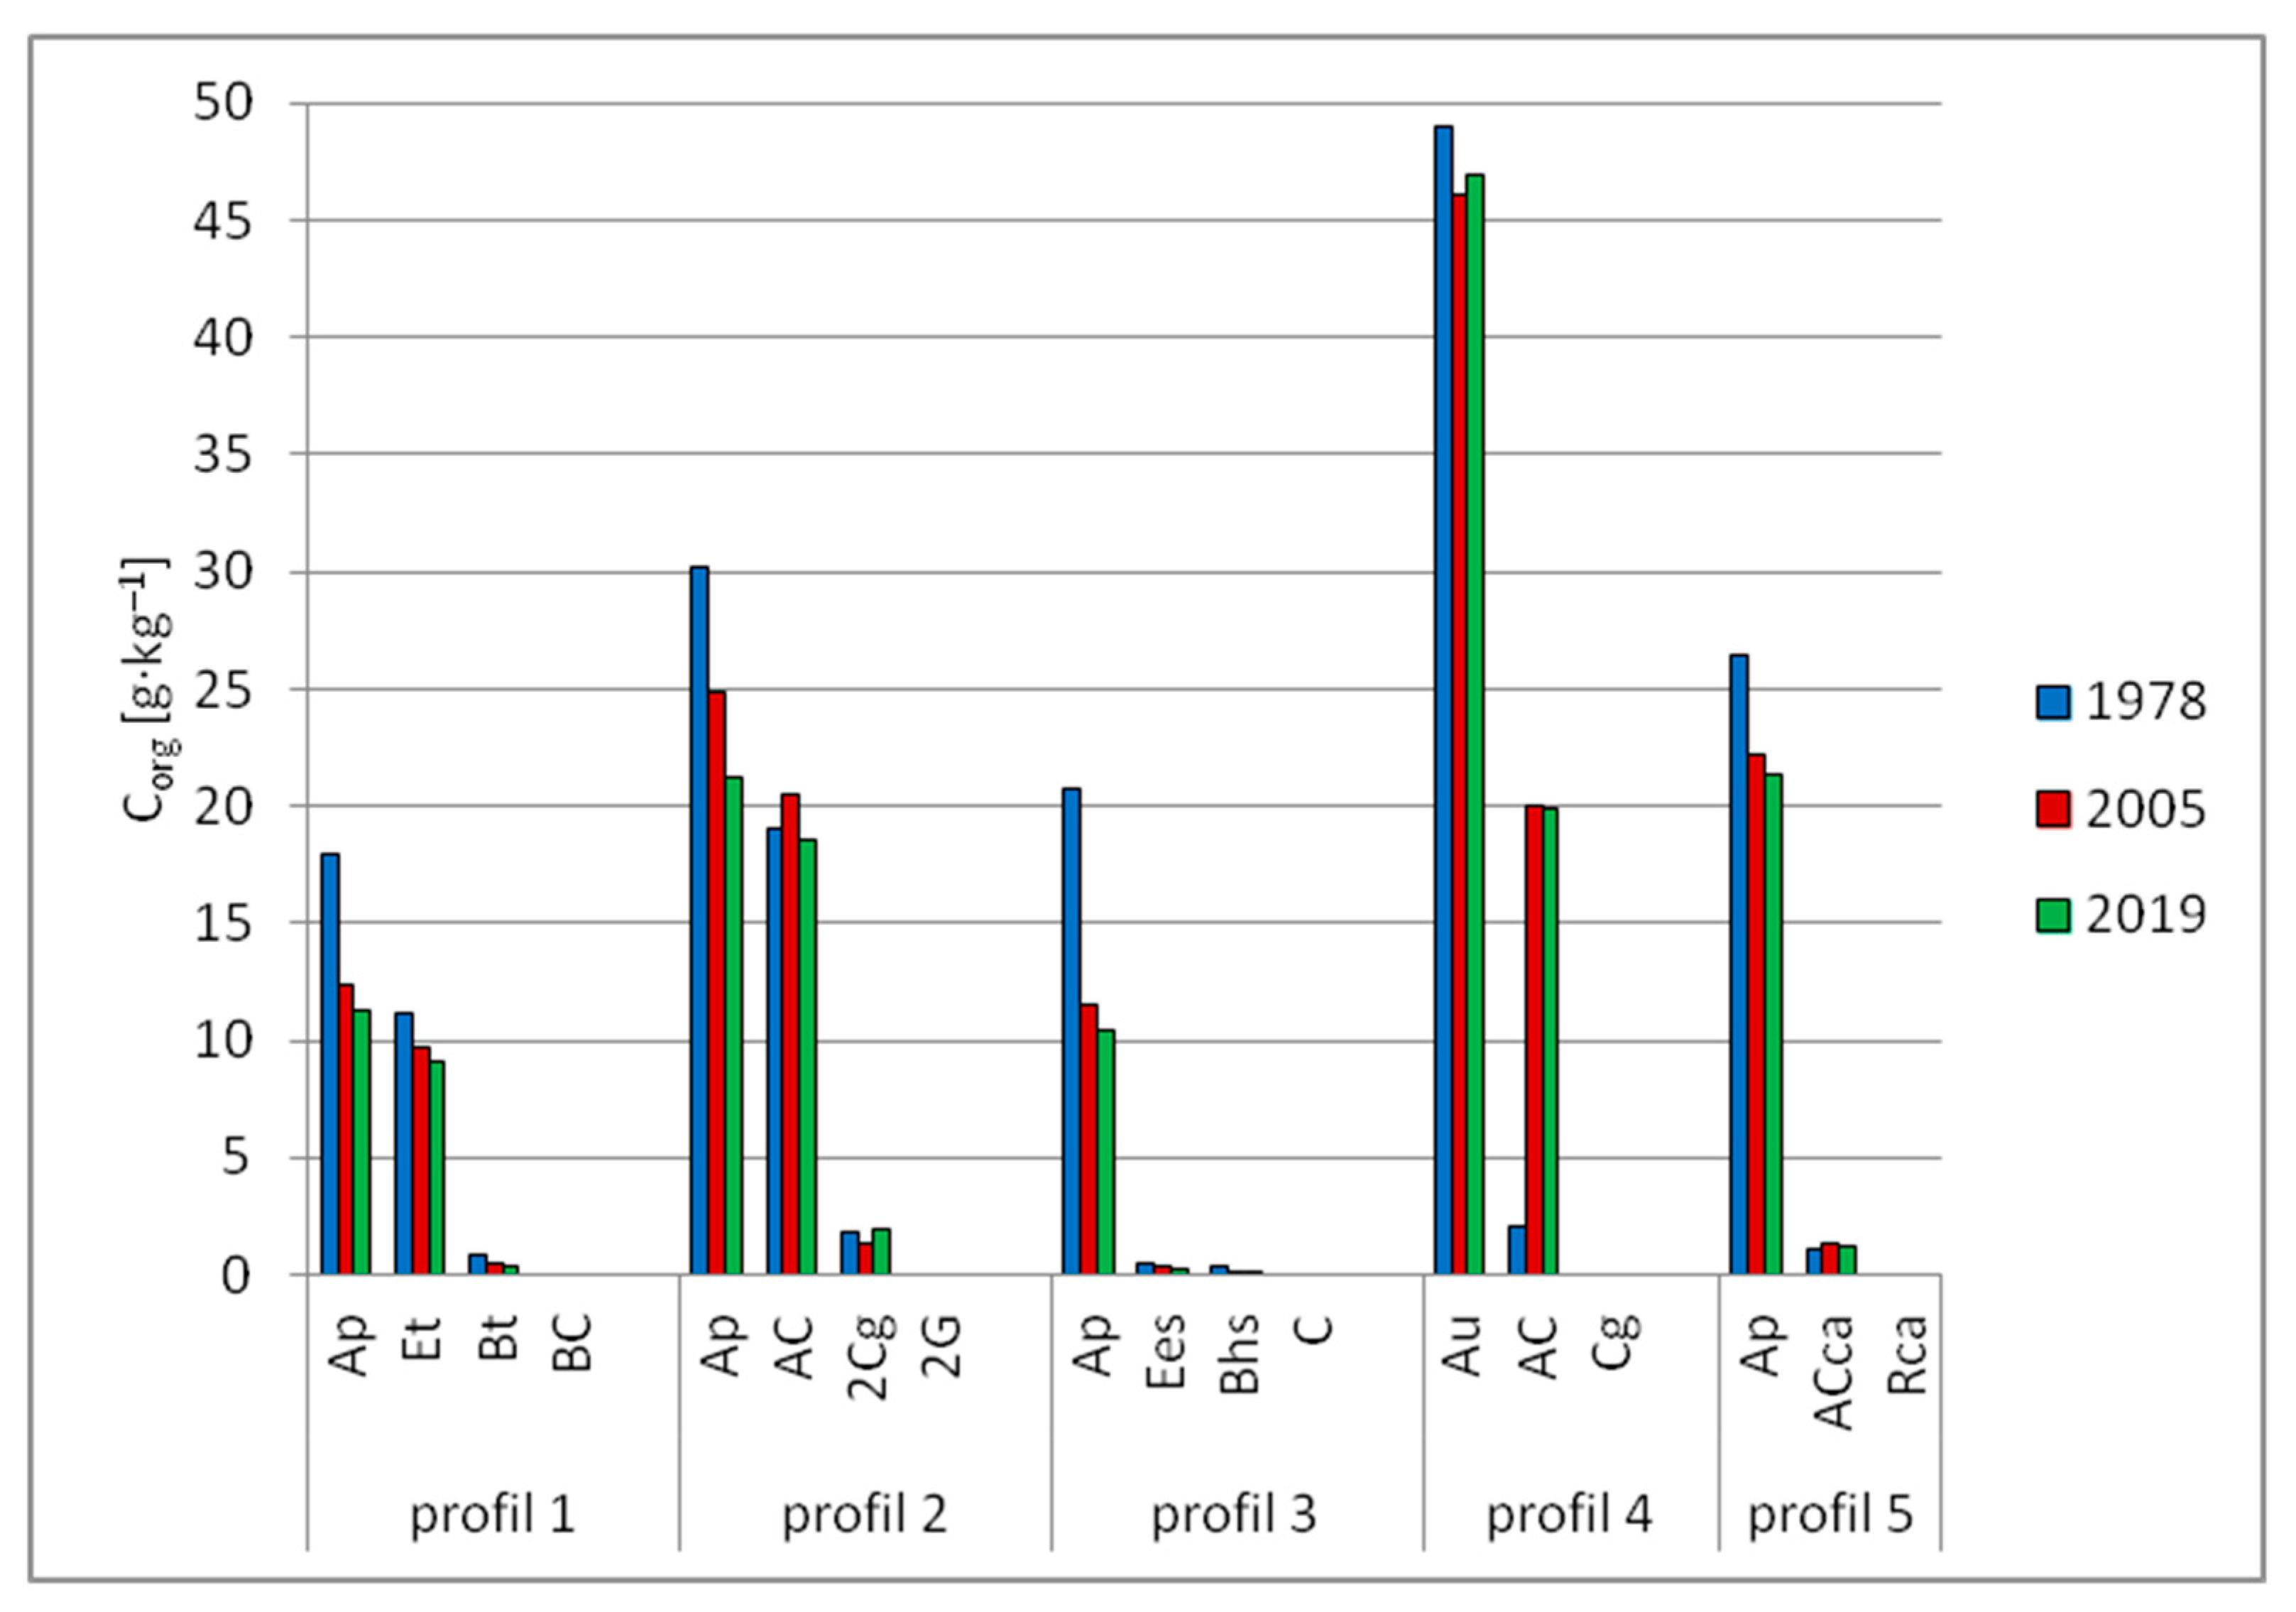
  • Decreased Corg content, especially in humus horizons. The trends of these changes were multifaceted and were also related to the change of land use and increase of average annual air temperatures; and
  • A raised level of saturation of sorption complex with alkaline cations, despite reducing dust immission to the soils.
In recent years, the dynamics of observed changes have been getting smaller, and this is proven in the research results.

Author Contributions

Conceptualization, A.Ś.; methodology, A.Ś.; A.G.; I.T.-W.; software, A.Ś.; A.G.; I.T.-W.; validation, A.Ś.; A.G.; I.T.-W.; formal analysis, A.Ś.; A.G.; I.T.-W.; investigation, A.Ś.; A.G.; I.T.-W.; resources, A.Ś.; A.G.; I.T.-W.; data curation, A.Ś.; A.G.; I.T.-W.; writing—original draft preparation, A.Ś.; A.G.; I.T.-W.; writing—review and editing, A.Ś.; A.G.; I.T.-W.; visualization, A.G.; I.T.-W.; supervision, A.Ś.; project administration, A.Ś.; funding acquisition, A.Ś. All authors have read and agreed to the published version of the manuscript.

Funding

This research received no external funding.

Institutional Review Board Statement

The study did not require ethical approval.

Informed Consent Statement

Not applicable.

Acknowledgments

We thank the Department of Agriculture and Rural Development of the Marshal’s Office of the Świętokrzyskie Voivodeship—for supporting this publication.

Conflicts of Interest

The authors declare no conflict of interest.

References

  1. Vogel, H.; Eberhardt, E.; Franko, U.; Lang, B.; Ließ, M.; Weller, U.; Wiesmeier, M.; Wollschläger, U. Quantitative Evaluation of Soil Functions: Potential and State. Front. Environ. Sci. 2019, 7, 164. [Google Scholar] [CrossRef]
  2. Smreczak, B.; Ukalska-Jaruga, A.; Łysiak, M.; Strzelecka, J.; Niedźwiecki, J.; Sobich, D. Funkcje, jakość i usługi ekosystemowe gleb. Studia Rap. IUNG-PIB 2017, 54, 9–23. [Google Scholar]
  3. Brevik, E.C.; Cerdà, A.; Mataix-Solera, J.; Pereg, L.; Quinton, J.N.; Six, J.; van Oost, K. The interdisciplinary nature of soil. Soil 2015, 1, 117–129. [Google Scholar] [CrossRef] [Green Version]
  4. Instytut Uprawy Nawożenia i Gleboznawstwa—Państwowy Instytut Badawczy w Puławach. Monitoring Chemizmu Gleb Ornych w Polsce w Latach 2015–2017; Instytut Uprawy Nawożenia i Gleboznawstwa: Puławy, Poland, 2017. [Google Scholar]
  5. Stepnowski, P.; Synak, E.; Szafranek, B.; Kaczyński, Z. Monitoring i Analityka Zanieczyszczeń w Środowisku; Wydawnictwo Uniwersytetu Gdańskiego: Gdańsk, Poland, 2010. [Google Scholar]
  6. Sowunmi, K.; Shoga, S.; Adewumi, O.M.; Oriyomi, F.A.; Sowunmi, L. The Physiological and Microbiological Characteristics of Cement Dust Polluted Soil Around Lafarge Cement Industry. Res. Sq. 2020. [Google Scholar] [CrossRef]
  7. Shah, K.; An, N.; Ma, W.; Ara, G.; Ali, K.; Kamanova, S.; Zuo, X.; Han, M.; Ren, X.; Xing, L. Chronic cement dust load induce novel damages in foliage and buds of Malus domestica. Sci. Rep. 2020, 10, 12186. [Google Scholar] [CrossRef]
  8. Bilen, S.; Bilen, M.; Turan, V. Relationships between Cement Dust Emissions and Soil Properties. Pol. J. Environ. Stud. 2019, 28, 3089–3098. [Google Scholar] [CrossRef]
  9. Zeb, K.; Ali, Y.; Khan, M.W. Factors influencing environment and human health by cement industry: Pakistan a case in point. Manag. Environ. Qual. Int. J. 2019, 30, 751–767. [Google Scholar] [CrossRef]
  10. Amani, J.; Babu, G.K.; Lakshmipathi, R.; Rao, G.R.; Chandrasekhar, K. Effect of Cement Dust Deposition on Soil Microbial Properties. Int. J. Curr. Microbiol. App. Sci. 2018. [Google Scholar] [CrossRef]
  11. Devi, K.S.; Lakshmi, V.V.; Alakanandana, A. Impacts of cement industry on environment—An overview. Asia Pac. J. Res. 2017, I, 156–161. [Google Scholar]
  12. Stanley, H.O.; Odu, N.N.; Immanuel, O.M. Impact of cement dust pollution on physicochemical and microbiological properties of soil around Lafarge cement WAPCO, EWEKORO, southwestern Nigeria. Int. J. Adv. Biol. Res. 2014, 4, 400–404. [Google Scholar]
  13. Malczyk, P.; Rydlewska, M. Properties of soils surrounded Trzuskawica lime plant industry S.A., Department of Kujawy. Ecol. Chem. Eng. 2011, 18, 9–10. [Google Scholar]
  14. Kumar, S.; Singh, N.; Kumar, V.; Sunisha, B.; Preeti, S.; Deepali, D.; Nath, S. Impact of dust emission on plant vegetation in the vicinity of cement plant. Environ. Eng. Manag. J. 2008, 7, 31–35. [Google Scholar] [CrossRef]
  15. Ivanov, Y.V.; Kartashov, A.V.; Ivanova, A.I.; Ivanov, V.P.; Marchenko, S.I.; Nartov, D.I.; Kuznetsov, V.V. Long-term impact of cement plant emissions on the elemental composition of both soils and pine stands and on the formation of Scots pine seeds. Environ. Pollut. 2018, 243, 1383–1393. [Google Scholar] [CrossRef] [PubMed]
  16. Świercz, A. Analiza Procesów Glebowych i Przekształceń Roślinnych w Zalkalizowanych Siedliskach Leśnych Regionu Świętokrzyskiego; Komitet Człowiek i Środowisko” przy Prezydium PAN, Zesz. Nauk.: Warszawa, Polind, 2005; Volume 39, pp. 1–21. [Google Scholar]
  17. Paal, J.; Degtjarenko, P.; Suija, A.; Liira, J. Vegetation responses to long-term alkaline cement dust pollution in Pinus sylvestris-dominated boreal forests—Niche breadth along the soil pH gradient. Appl. Veg. Sci. 2012, 16, 248–259. [Google Scholar] [CrossRef]
  18. Jaworska, H.; Dąbrowska-Naskręt, H.; Sawilska, K. Wpływ pyłów cementowych na niektóre właściwości gleb oraz stan drzewostanów sosnowych w otoczeniu zakładów cementowo-wapienniczych ”Lafarge” w Bielawach. Proc. ECOpole Towarzystwo Chemii i Inżynierii Ekologicznej 2010, 4, 141–146. [Google Scholar]
  19. Drack, J.M.E.; Vázquez, D.P. Morphological response of a cactus to cement dust pollution. Ecotoxicol. Environ. Saf. 2018, 148, 571–577. [Google Scholar] [CrossRef]
  20. Ots, K.; Mandre, M. Monitoring of heavy metals uptake and allocation in Pinus sylvestris organs in alkalised soil. Environ. Monit. Assess. 2012, 184, 4105–4117. [Google Scholar] [CrossRef]
  21. Haapala, H.; Goltsova, N.; Lodenius, M. Heavy metal solubility in podzolic soils exposed to the alkalizing effect of air pollutants. Environ. Pollut. 2001, 115, 33–41. [Google Scholar] [CrossRef]
  22. Annuka, E. The impact of emission from cement plant on forest landscape. Proceedings of the Estonian Academy of Sciences. Ecology 1994, 4, 118–127. [Google Scholar]
  23. Strategia Rozwoju Gminy Sitkówka-Nowiny do 2015 r., Część I Raport o stanie Gminy; Świętokrzyskie Centrum Fundacji Rozwoju Demokracji Lokalnej: Kielce, Poland, 2008.
  24. Lorenc, H.; Suwalska-Bogucka, M. Thermal tendencies of winters in Poland as the indicator of climate variability. Zesz. Nauk. UJ. Prace Geogr. 1996, 102, 365–374. [Google Scholar]
  25. Lorenc, H. Termiczno-Opadowa Ocena Klimatycznych Sezonów Roku w Polsce oraz Tendencje Czasowo-Przestrzenne; Projekt badawczy M-9; IMGW: Warszawa, Poland, 2000. [Google Scholar]
  26. Bednarek, R.; Dziadowiec, H.; Pokojska, U.; Prusinkiewicz, Z. Badania Ekologiczno-Gleboznawcze; PWN: Warszawa, Poland, 2005. [Google Scholar]
  27. Kowalkowski, A.; Swałdek, M. Analiza Podstawowych Chemicznych Właściwości Gleb z Elementami Analityki; WSP: Kielce, Poland, 1991. [Google Scholar]
  28. Karczewska, A.; Kabała, C. Metodyka Analiz Laboratoryjnych Gleb i Roślin; Uniwersytet Przyrodniczy we Wrocławiu: Wrocław, Poland, 2008. [Google Scholar]
  29. Azimi, S.; Ludwig, A.; Thevenot, R.D.; Colin, J.-L. Trace metal determination in total atmospheric deposition in rural and urban areas. Sci. Total Environ. 2003, 308, 247–256. [Google Scholar] [CrossRef] [Green Version]
  30. Świercz, A. Antropogeniczne zmiany właściwości chemicznych gleb powierzchniowych Obniżeń Chęcińskich. Roczniki Gleboznawcze 2007, 58, 141–150. [Google Scholar]
  31. Systematyka Gleb Polski; Polskie Towarzystwo Gleboznawcze, Komisja Genezy, Klasyfikacji i Kartografii Gleb: Wrocław, Poland; Warszawa, Poland, 2019.
  32. Persson, T.; Andersson, S.; Bergholm, J.; Grönqvist, T.; Högbom, L.; Vegerfors, B.; Wirén, A. Long-Term Impact of Liming on Soil C and N in a Fertile Spruce Forest Ecosystem. Ecosystems 2020. [Google Scholar] [CrossRef]
  33. Watros, A.; Lipińska, H.; Lipiński, W.; Tkaczyk, P.; Krzyszczak, J.; Baranowski, P. Mineral nitrogen content in hydrographic areas of Poland depending on land use. Int. Agrophys. 2019, 33, 481–491. [Google Scholar] [CrossRef]
  34. Harasim, A.; Igras, J.; Harasim, P. Zmiany zawartości azotu mineralnego w glebie mineralnej pod mieszanką pastwiskową w różnych stanowiskach. Pol. J. Agron. 2017, 30, 25–32. [Google Scholar]
  35. Staszewski, Z. Azot w glebie i jego wpływ na środowisko. Zeszyty Naukowe Inżynieria Lądowa i Wodna w Kształtowaniu Środowiska 2011, 4, 50–58. [Google Scholar]
  36. Jonczak, J.; Simansky, V.; Polláková, N. Zawartość i profilowe rozmieszczenie frakcji fosforu w uprawnych i leśnych czarnoziemach z poziomem cambic. Sylwan 2015, 159, 931–939. [Google Scholar]
  37. Malczyk, P. Przewapnowanie gleb. Farmer 2013, 1, 1–3. [Google Scholar]
  38. Hołubowicz-Kliza, G. Wapnowanie Gleb w Polsce; IUNG-PIB: Puławy, Poland, 2006. [Google Scholar]
  39. Lamare, R.E.; Singh, O.P. Effect of cement dust on soil physico-chemical properties around cement plants in Jaintia Hills, Meghalaya. Environ. Eng. Res. 2020, 25, 409–417. [Google Scholar] [CrossRef]
  40. Sapek, B.; Kalińska, D. Mineralizacja organicznych związków azotu w glebie w świetle długoletnich doświadczeń łąkowych IMUZ. Woda Środowisko Obszary Wiejskie 2004, 4, 183–200. [Google Scholar]
  41. Sapek, B. Uwalnianie azotu i fosforu z materii organicznej gleby. Woda Środowisko Obszary Wiejskie 2010, 10, 229–256. [Google Scholar]
  42. Devau, N. Soil pH controls the environmental availability of phosphorus: Experimental and mechanistic modelling approaches. Appl. Geochem. 2009, 24, 2163–2174. [Google Scholar] [CrossRef]
  43. Achat, D.L. Phosphorus status of soils from contrasting forested ecosystems in southwestern Siberia: Effects of microbiological and physicochemical properties. Biogeosciences 2013, 10, 733–752. [Google Scholar] [CrossRef] [Green Version]
  44. Darke, A.K.; Walbridge, M.R. Al and Fe biogeochemistry in a floodplain forest: Implications for P retention. Biogeochemistry 2000, 51, 1–32. [Google Scholar] [CrossRef]
  45. Mercik, S. Chemia Rolna; Podstawy Teoretyczne i Praktyczne; SGGW: Warszawa, Poland, 2004. [Google Scholar]
  46. Inspekcja Ochrony Środowiska. Monitoring Chemizmu Gleb Ornych w Polsce w Latach 2010–2012; Biblioteka Monitoringu Środowiska: Warszawa, Poland, 2012. [Google Scholar]
  47. Stępień, W. Jak Przywracać Żyzność Gleb. Monografia Ochrona Bioróżnorodności Gleby Warunkiem Zdrowia Obecnych i Przyszłych pokoleń; IUNiG PIG: Puławy, Poland, 2019. [Google Scholar]
  48. Sapek, B. Zapobiegnie stratom i sekwestracji węgla organicznego w glebach łąkowych. Inżynieria Ekologiczna 2009, 21, 48–61. [Google Scholar]
  49. Antil, R.S.; Singh, M. Effects of organic manures and fertilization on organic matter and nutrients status of the soil. Arch. Agron. Soil Sci. 2007, 53, 519–528. [Google Scholar] [CrossRef]
  50. Zimmer, J.; Roschke, M.; Schulze, D. Influence or different treatments of organic and mineral fertilization on yield, soil organic matter and N-balance of a diluvial sandy soil—Results after 45 years long-term field experiment P60 (Groß Kreuz, 1959–2003). Arch. Agron. Soil Sci. 2005, 51, 135–149. [Google Scholar] [CrossRef]
  51. Ellmer, F.; Peschk, H.; Köhn, W.; Chmielewski, F.-M.; Baumecker, M. Tillage and fertilizing effects on sandy soils. Review and selected results of long-term experiments at Humboldt University Berlin. J. Plant Nutr. Soil Sci. 2000, 163, 267–272. [Google Scholar] [CrossRef]
  52. Ellmer, F.; Baumecker, M. Soil Organic Matter of a Sandy Soil Influenced by Agronomy and Climate. In Proceedings of the International Meeting on Soil Fertility Land Management and Agroclimatology, Kusadasi, Turkey, 29 October–1 November 2008. [Google Scholar]
  53. Józefaciuk, G. Zmiany właściwości powierzchniowych gleb i minerałów ilastych w procesach zakwaszania i alkalizacji. Badania modelowe. Instytut Agrofizyki PAN. Acta Agrophysica 1998, 15, 1–115. [Google Scholar]
  54. Breymeyer, A.; Degórski, M.; Reed, D. Decomposition of pine-litter organic matter and chemical properties of upper soil layers: Transect studies. Environ. Pollut. 1997, 98, 361–367. [Google Scholar] [CrossRef]
Figure 1. Location of soil pits depending on the distance from the dust emitter (Nowiny Cement Plant Sp. z o. o.). Key: (1) Buildings; (2) forests; (3) quarries; (4) cement plants; (5) roads; (6) railways; (7) soil pits.
Land 10 00084 g001
Figure 2. Dynamics of annual and monthly dust fall per g/m2 in soil profiles at selected research positions in (1) Posłowice, (2) Jesionki, (3) Zgórsko, (4) Kowala, (5) Sitkówka.
Land 10 00084 g002
Figure 3. Changes in pHH2O and pH KCl value ranges in individual horizons of the analysed soils between 1978 and 2019.
Land 10 00084 g003
Figure 4. Dynamics of pHKCl value ranges in individual horizons of the analysed soils between 1978 and 2019.
Land 10 00084 g004
Figure 5. Dynamics of CaCO3 (%) content in individual horizons of the analysed soils between 1978 and 2019.
Land 10 00084 g005
Figure 6. Dynamics of Corg (g.kg−1) content in individual horizons of the analysed soils between 1978 and 2019.
Land 10 00084 g006
Figure 7. Changes in the content of digestible components (P2O5, K2O, Mg (mg.100g−1)) in various horizons of the analysed soils in 1978–2019.
Land 10 00084 g007
Table 1. Amount of dust fall at selected research positions per g/m2.
Area
No.
LongitudeLatitude197820052019
Mean Value
(Min–Max)
Annual ValueMean Value
(Min–Max)
Annual ValueMean Value
(Min–Max)
Annual Value
Profile 1
Posłowice
20.57492150.82227818.6
(15.7–55.1)
245.63.01
(2.0–11.7)
47.32.9
(2.1–11.7)
45.2
Profile 2
Jesionki
20.52509750.78004528.3
(11.1–67.8)
340.56.3
(1.5–17.3)
62.06.1
(2.1–14.7)
60.1
Profile 3
Zgórsko
20.51723750.82731512.9
(6.6–20.8)
190.72.9
(1.5–9.5)
35.22.7
(1.7–10.1)
33.1
Profile 4
Kowala
20.56854850.80187353.1
(14.6–91.9)
497.57.9
(1.6–23.6)
87.47.8
(1.5–19.3)
89.2
Profile 5
Sitkówka
20.51550150.81211865.0
(20.2–85.1)
651.410.9
(1.9–22.2)
111.59.2
(1.7–20.1)
100.4
Table 2. Profile structure and general characteristics of soils (* names of soils and sequences of horizons are given according to the Systematics of Polish Soils from 2011 and (World Reference Base for Soil Resources) WRB 2006, ** Grain size groups, according to the United States Department of Agriculture (USDA) and (Soil Science Society of Poland) PTG 2008).
Area
No.
Horizontal CompositionType
and Sub-Type *
Type Grain-Size Groups **Type of
Land Use
Profile 1
Posłowice
Ap-Et-Bt-BCHaplic Luvisolloesssilt
silt
arable land
Profile 2
Jesionki
Ap-AC-2Cg-2GMollic Fluvisolalluvial depositsilt covering loamy sandfields
Profile 3
Zgórsko
Ap-Ees-Bhs-CHaplic Podzolfluvioglacial sandssand covering medium and fine sandarable land
Profile 4
Kowala
Au-AC-CgMollic Gleysolfluvial sandsloamy sandfields
the green use
Profile 5
Sitkówka
Ap-ACca-RcaRendzic LeptosolDevonian
limestones
clay loam covering loam arable land
Table 3. Grain size composition of analysed soils (wg PTG 2008 and USDA).
Profile No. Depth cmDiameter Limits (mm) in %
2–0.050.05–0.002 Silt <0.002
Clay
1Ap0–1537549
Et15–4548466
Bt45–6050428
BC60–120236710
2Ap0–1750455
AC17–3073216
2Cg30–5087103
2G50–70701515
3Ap0–129451
Ees12–289442
Bhs28–489352
C48–1109541
4Au0–1679174
AC16–5581118
Cg55–1109352
5Ap0–10573013
ACca10–21601525
Rca21–35---
Table 4. Selected chemical characteristics of analysed soils.
Profile No.HorizonDepthpHH2OpHKClCaCO3Corg.
Corg.
NTOT
NTOT
C:NHhS
BC
T
CEC
V
BS
P2O5K2OMg
[cm][%][g.kg−1][cmol (+).kg−1][%][mg.100g−1]
Results of analyses made in 1978
1Ap0–157.126.110.1717.90.8920.08.0213.221.2262.215.056.03.70
Et15–457.215.910.0811.20.2348.02.317.19.475.530.205.09.75
Bt45–606.915.990.120.880.118.03.1211.414.478.20.103.07.15
BC60–1206.885.890.0---3.707.1010.865.70.122.25.92
2Ap0–177.187.000.1230.200.9133.02.9010.713.678.685.525.02.00
AC17–305.674.710.019.000.4245.01.119.610.789.721.001.505.95
2Cg30–505.915.980.01.860.0920.70.8014.815.694.870.302.503.25
2G50–705.785.610.0---1.307.38.684.900.102.152.50
3Ap0–127.216.511.1020.710.8724.021.7226.748.455.1713.0010.05.10
Ees12–286.515.890.00.510.531.02.155.127.2770.430.700.502.12
Bhs28–485.214.500.00.320.048.04.571.125.6919.680.100.504.22
C48–1105.194.350.0---5.140.755.8913.100.100.312.10
4Au0–166.516.110.049.000.8955.010.6044.354.980.692.405.007.40
AC16–556.056.070.02.120.1316.32.8121.224.0188.300.704.006.20
Cg55–1106.005.770.0---2.1016.218.388.500.553.304.10
5Ap0–108.027.3015.8926.431.1423.02.6666.669.2696.160.415.03.95
ACca10–218.667.4113.61.130.343.30.9638.339.2697.550.515.54.10
Rca21–358.787.71-----------
Results of analyses made in 2005
1Ap0–157.666.972.7812.401.0911.33.1221.2124.3387.183.558.305.0
Et15–458.026.551.399.700.3527.70.9810.0911.0791.150.106.6012.0
Bt45–607.036.411.980.530.0226.52.1115.9018.0188.280.104.209.67
BC60–1207.006.030.03 2.968.4111.3773.97-3.07.80
2Ap0–177.657.441.1224.921.0723.22.0013.8115.8187.355.305.552.11
AC17–306.276.050.0320.520.2873.20.7010.7711.4793.900.852.036.4
2Cg30–506.126.02-1.330.0719.00.4516.1116.5697.280.253.314.0
2G50–706.036.00--- 1.108.099.1988.030.132.273.02
3Ap0–127.877.583.7911.530.9811.71.7136.5638.2795.537.1814.79.11
Ees12–287.227.0323.420.320.093.60.6410.2410.8894.120.551.104.23
Bhs28–487.117.092.470.090.051.80.231.912.1489.250.050.905.9
C48–1106.325.960.18-- 1.120.942.0645.63-0.422.70
4Au0–167.046.891.0846.130.9747.57.3346.2153.5486.312.106.118.56
AC16–556.916.770.0320.040.4247.71.7927.9029.6993.970.344.897.0
Cg55–1106.446.12--- 1.5518.6620.2192.330.304.004.30
5Ap0–108.448.0117.6222.201.1319.61.9971.873.7997.300.366.114.11
ACca10–218.707.5514.621.290.373.50.7840.040.7898.090.457.235.34
Rca21–358.887.80-----------
Results of analyses made in 2019
1Ap0–157.706.802.6611.301.1210.13.0221.2124.2387.543.158.795.23
Et15–457.926.501.209.100.3823.90.9210.0911.0191.640.087.0912.93
Bt45–607.136.491.550.430.231.82.0315.9017.9388.680.104.5410.07
BC60–1207.206.550.05 2.168.4110.5779.56-3.707.62
2Ap0–177.507.001.0521.221.0919.42.1213.8115.9386.694.925.612.77
AC17–306.406.250.0518.610.2574.50.5610.7711.3395.060.752.456.92
2Cg30–506.005.89-1.930.0538.60.3816.1116.4997.700.273.914.88
2G50–706.055.97----1.708.099.7982.640.112.593.00
3Ap0–127.907.653.9910.431.0110.31.5536.5638.1195.937.0215.210.67
Ees12–287.317.1224.110.290.102.90.5410.2410.7894.990.381.435.12
Bhs28–487.006.832.010.070.041.70.271.912.1887.610.251.235.20
C48–1106.426.060.20---0.980.941.9248.96-0.612.34
4Au0–167.126.900.9846.911.0245.96.4346.2152.6487.782.217.088.99
AC16–556.516.330.0319.840.8224.21.2927.9029.1995.580.275.247.69
Cg55–1106.136.00----1.2218.6619.8893.860.364.744.90
5Ap0–108.518.2118.0721.301.1917.81.5971.873.3997.830.316.994.17
ACca10–218.727.4513.111.210.363.30.5840.040.5898.570.407.045.07
Rca21–358.907.81-----------
Publisher’s Note: MDPI stays neutral with regard to jurisdictional claims in published maps and institutional affiliations.

