Tracking the Role of Policies and Economic Factors in Driving the Forest Change Trajectories within the Guangdong-Hongkong-Macao Region of China: A Remote Sensing Perspective


Abstract
:1. Introduction
2. Materials and Methods
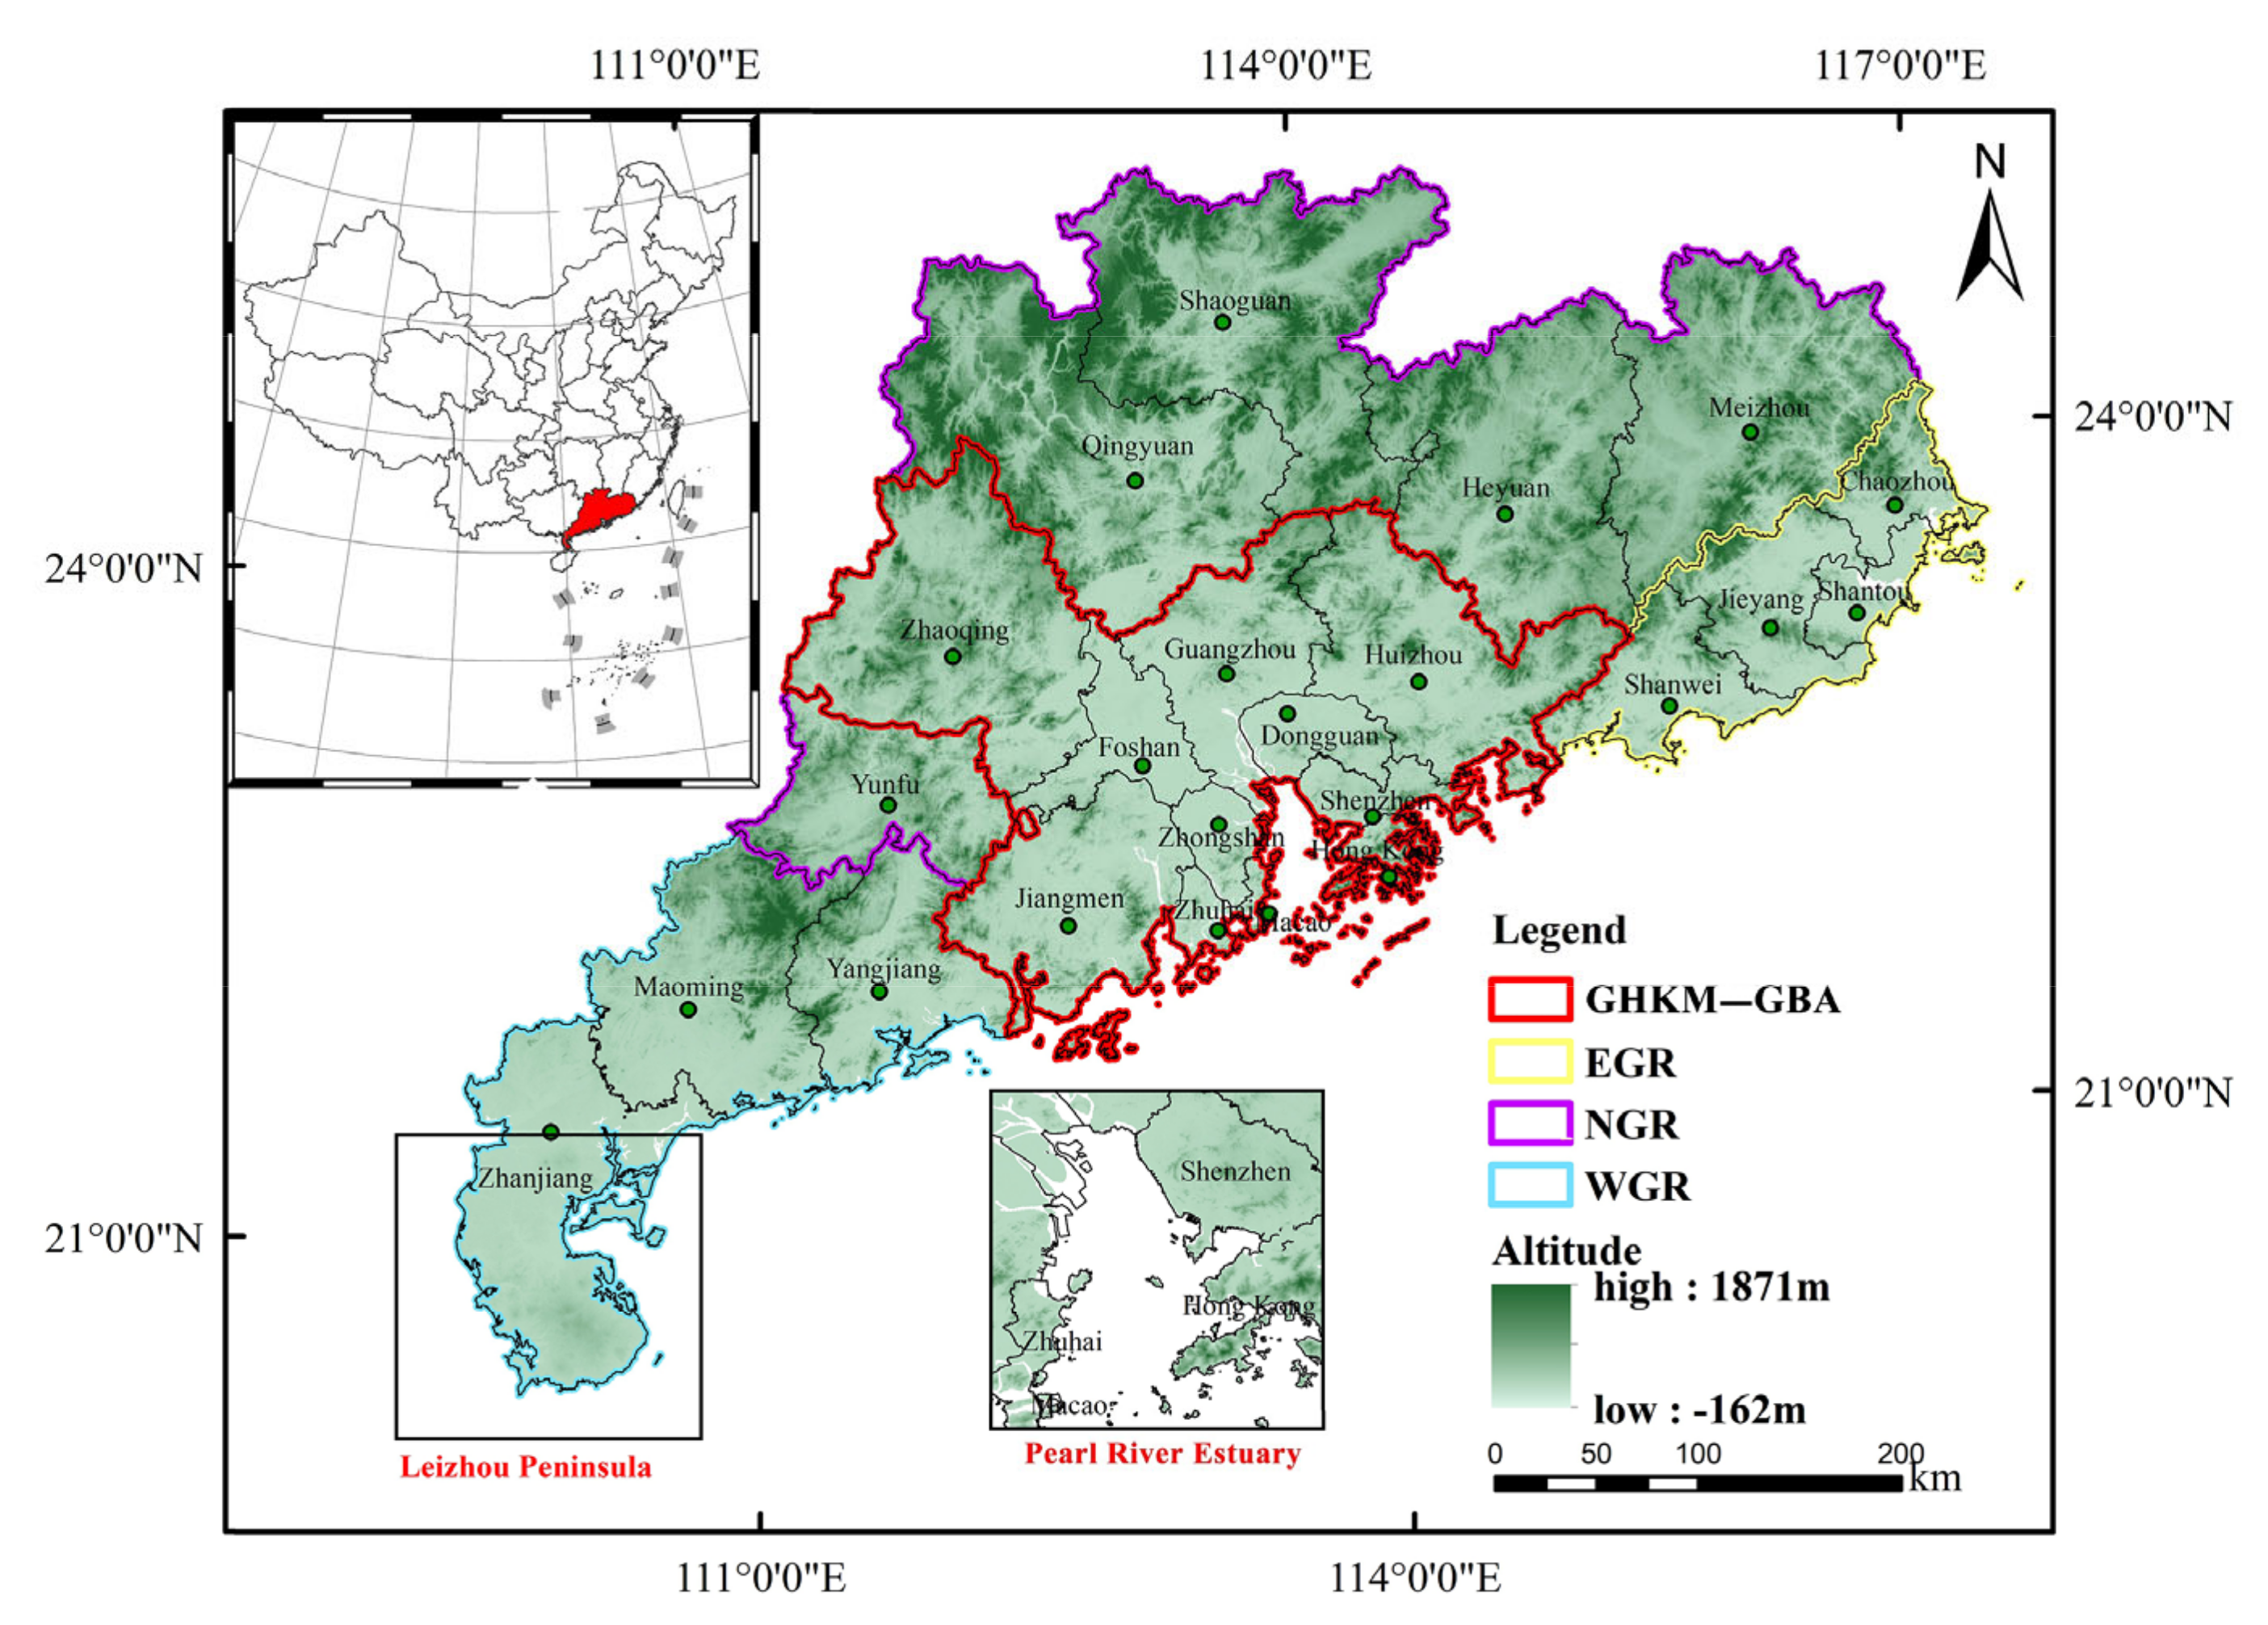
2.1. Study Area
2.2. Data
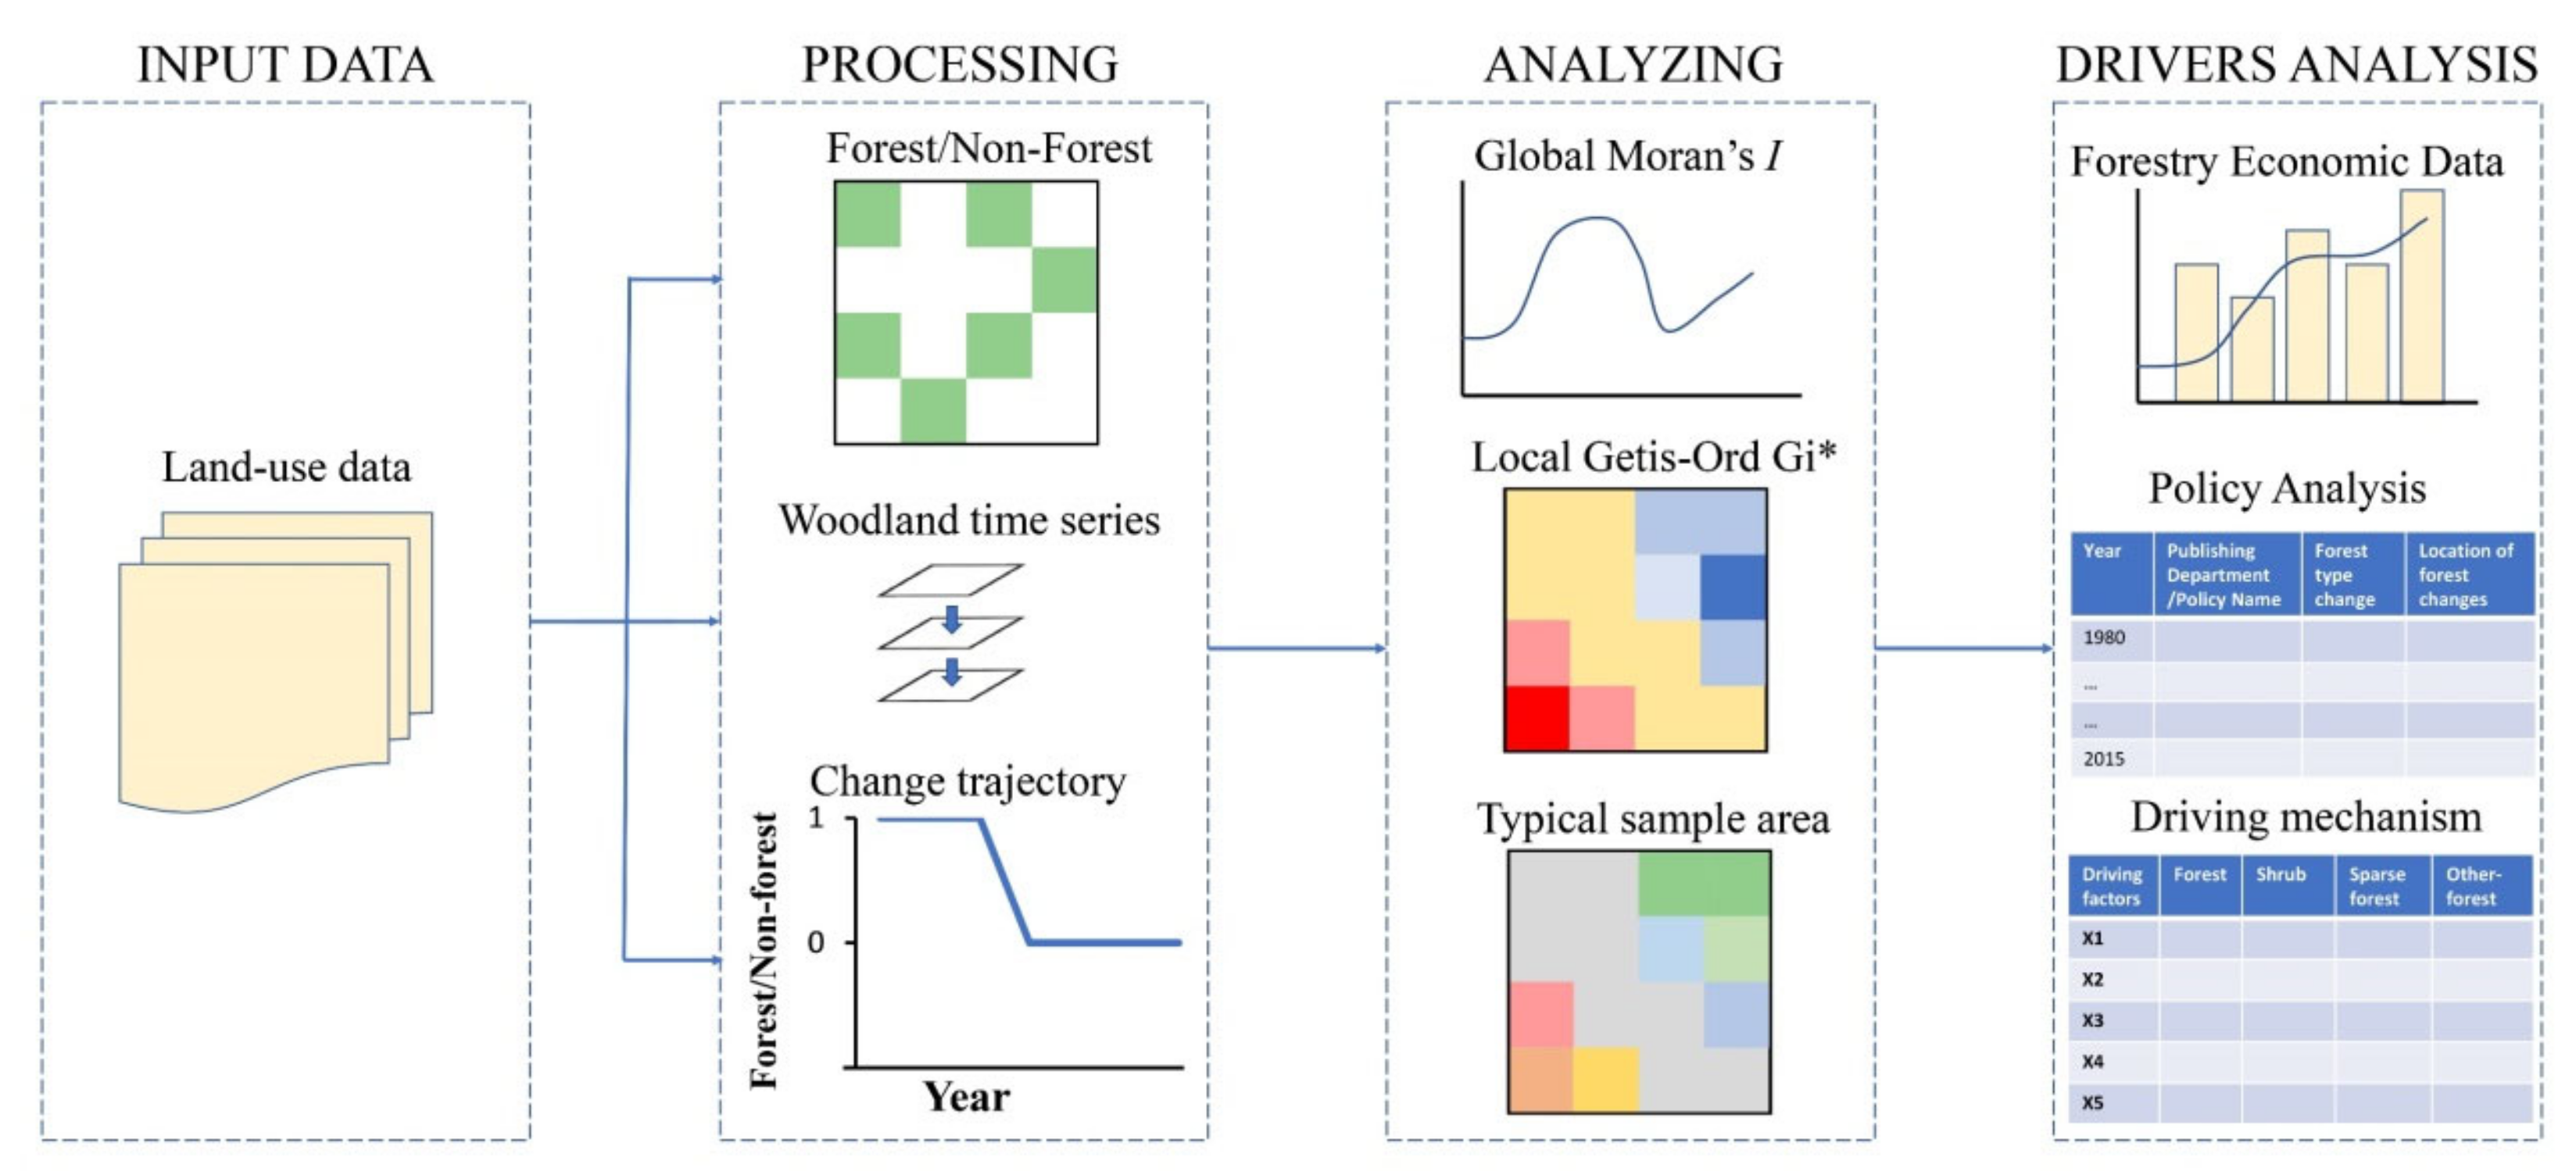
2.3. Methods
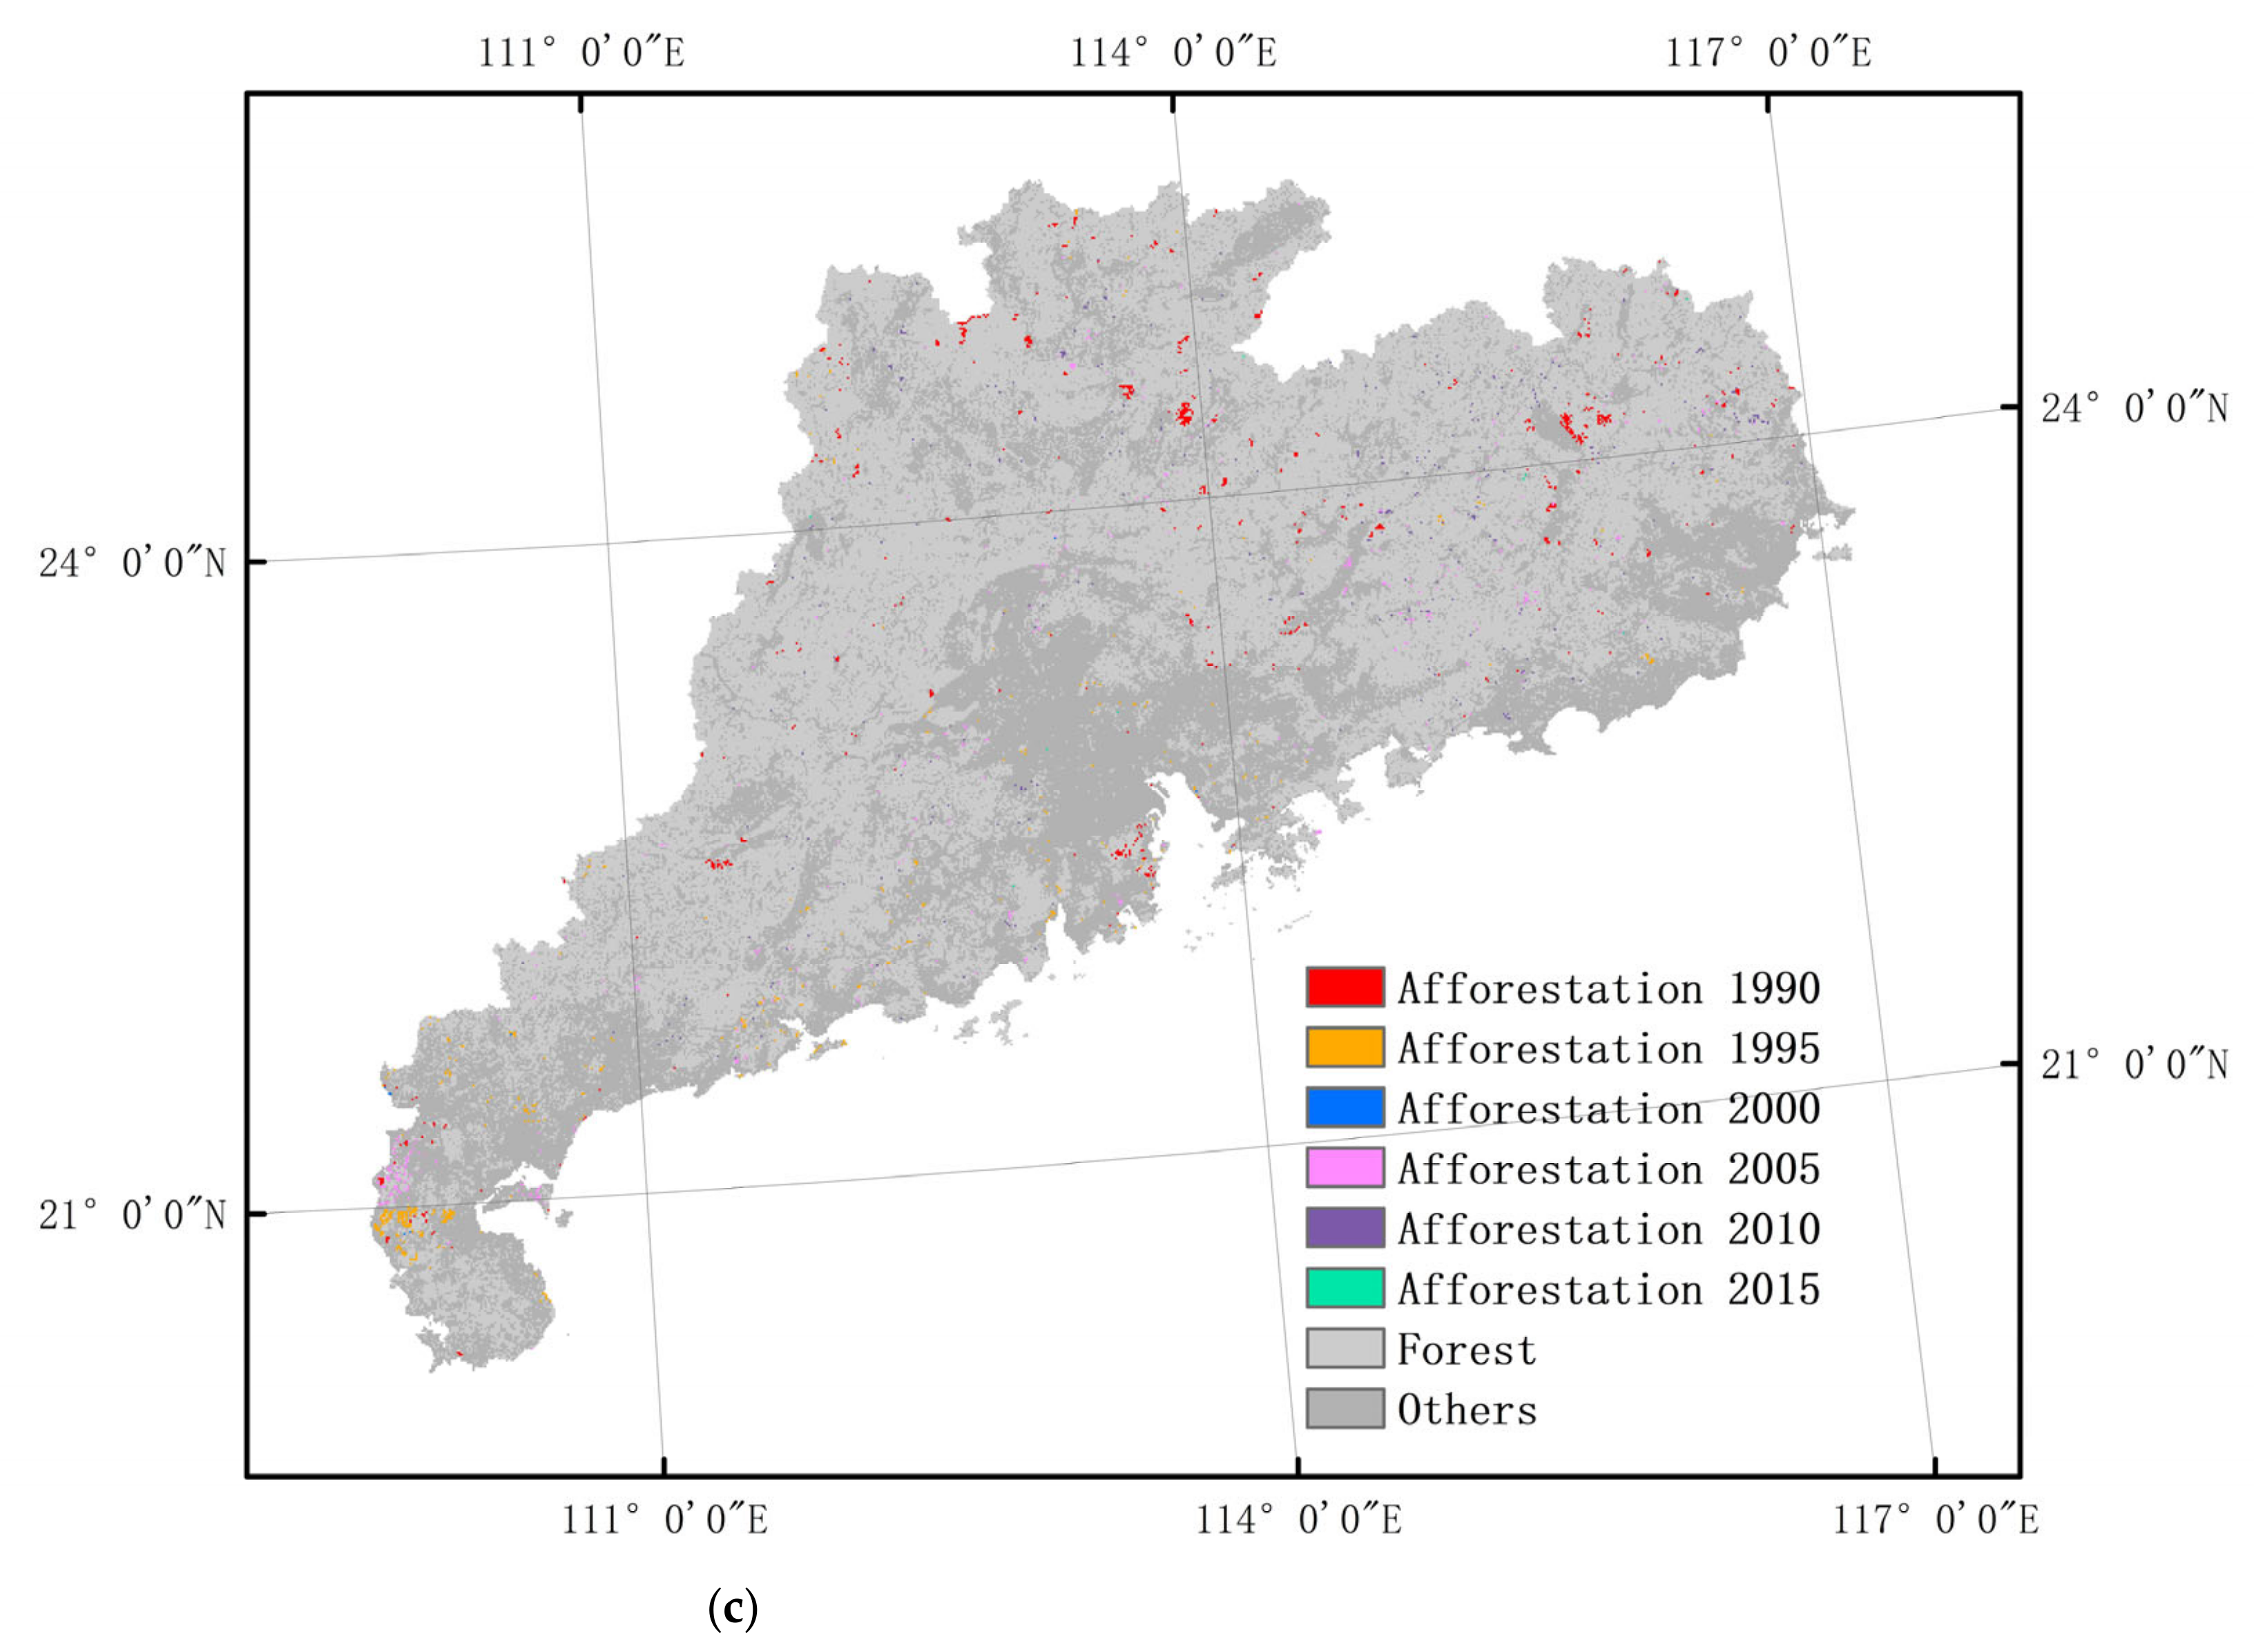
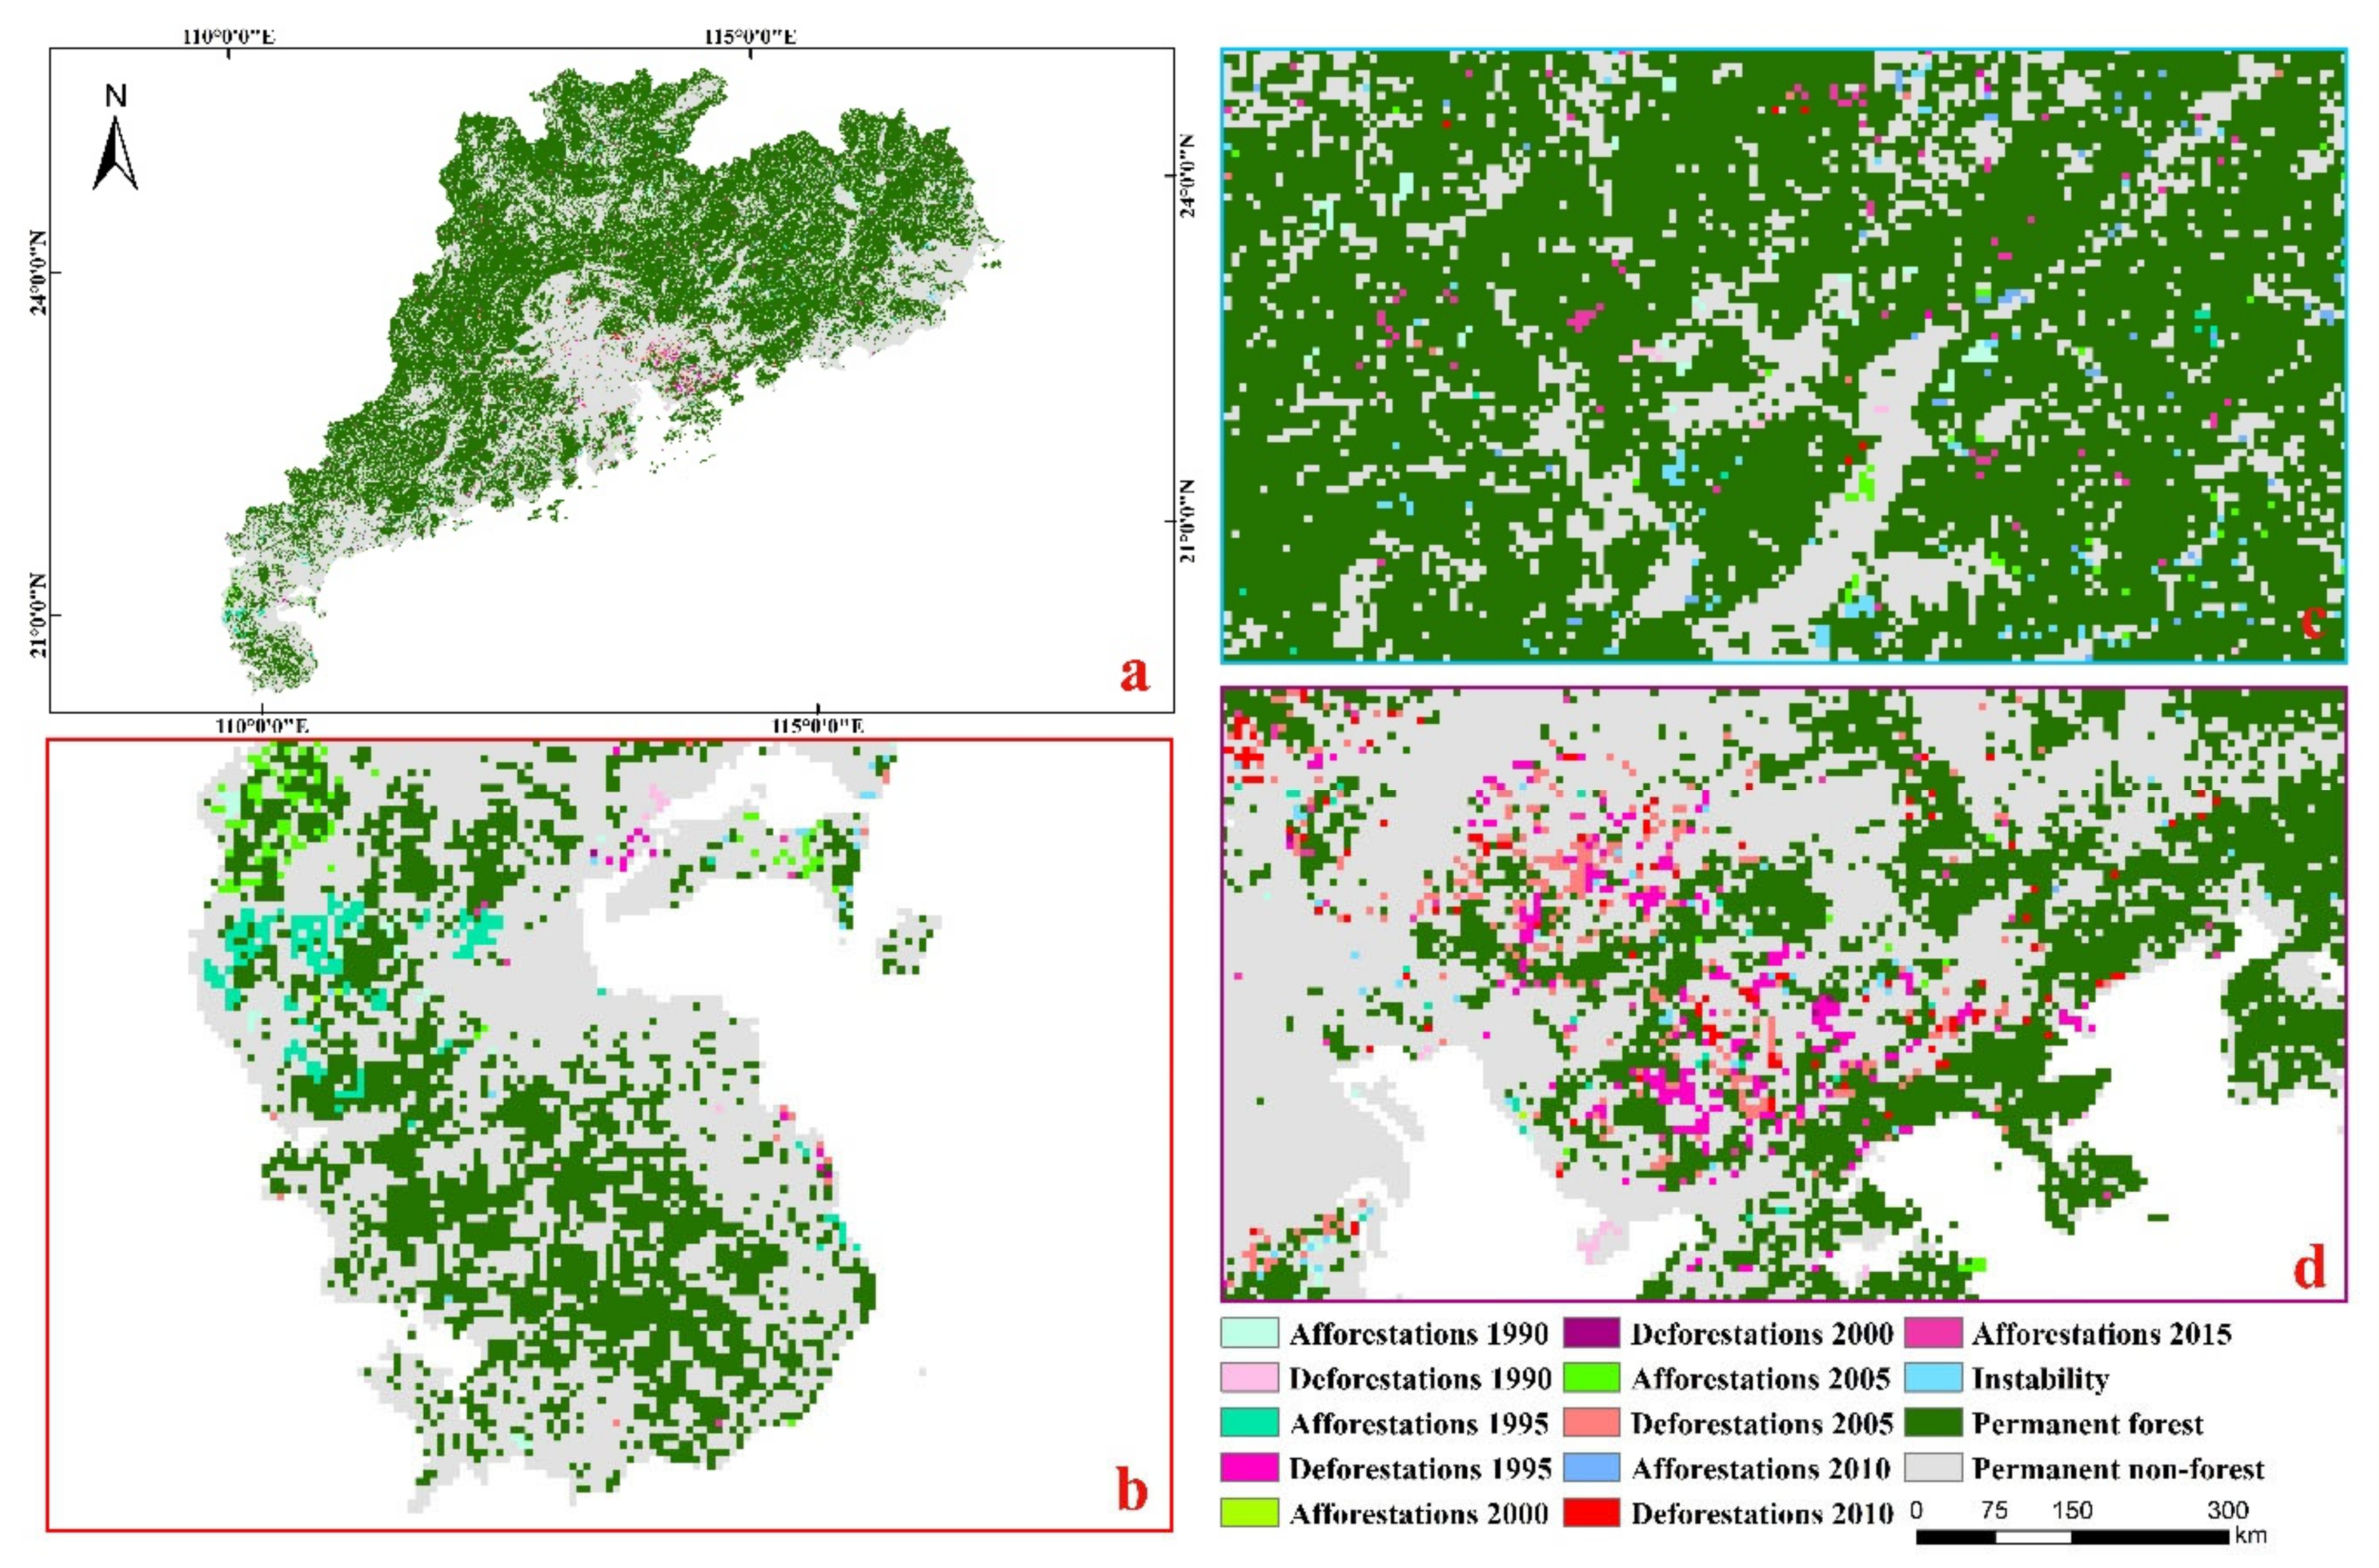
- Permanent forest: A forest pixel that without change in status remained a forest pixel between 1980 and 2015.
- Permanent non-forest: A non-forest pixel that remained non-forest between 1980 and 2015 without change in status.
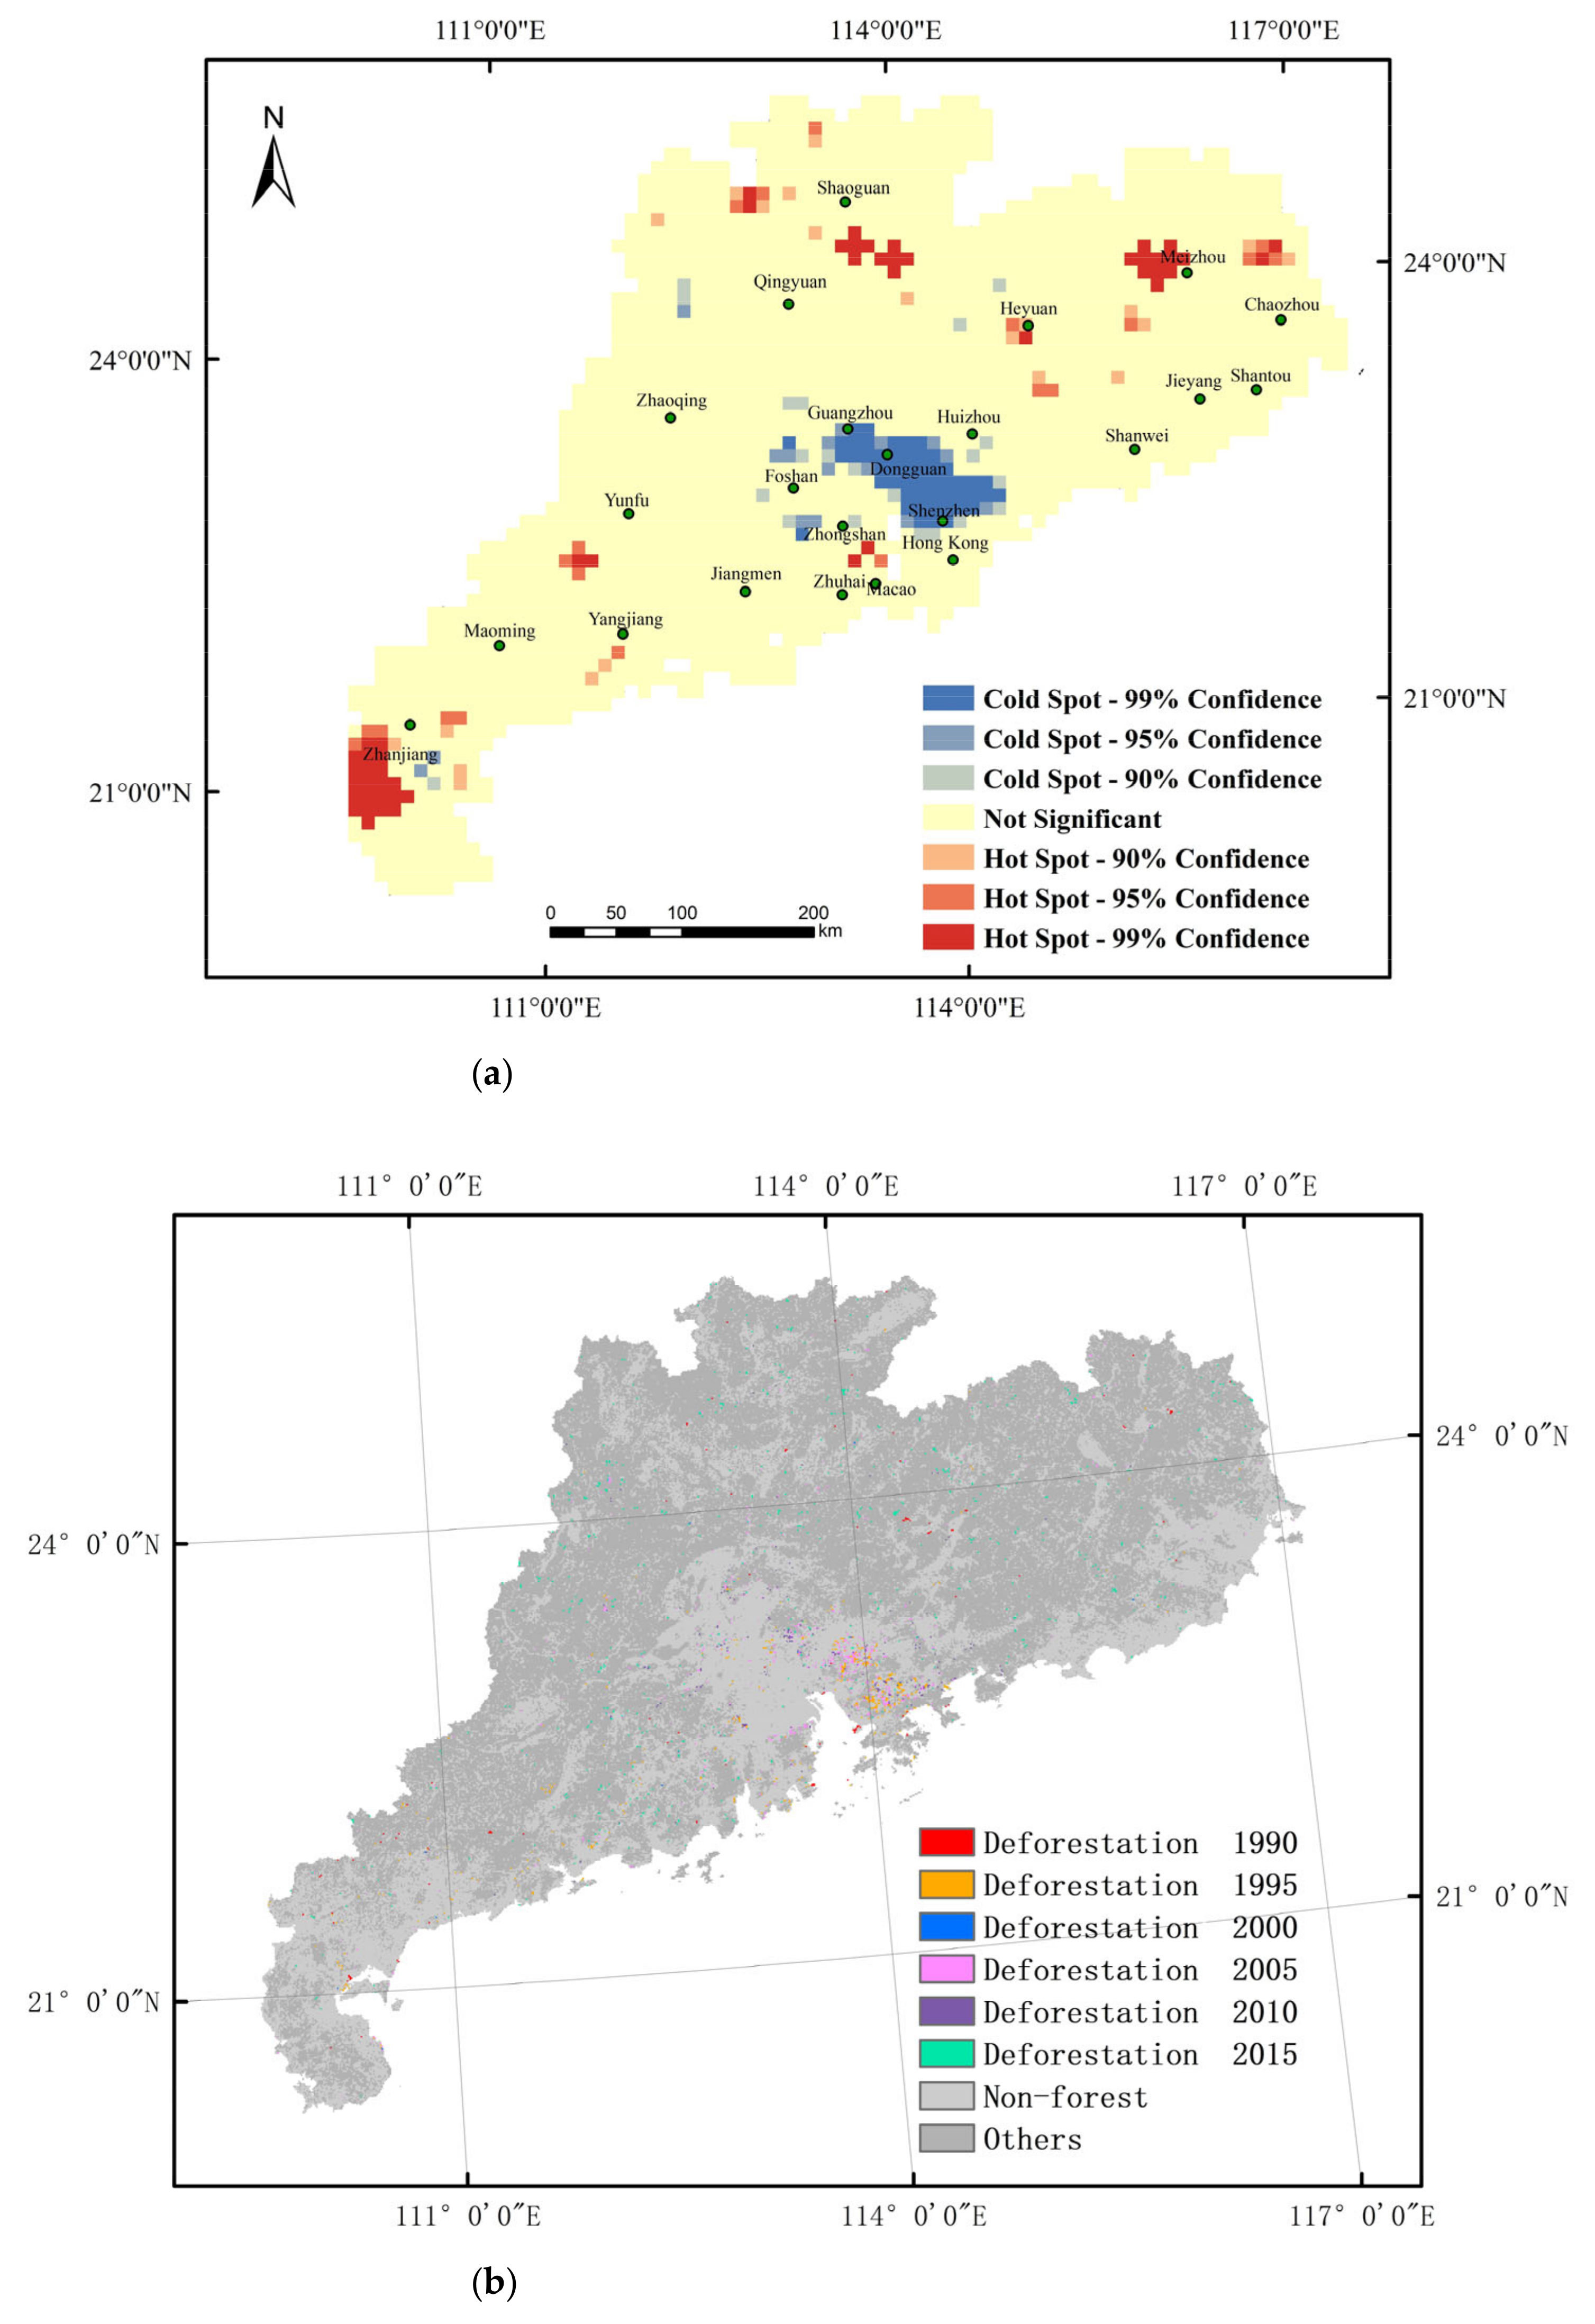
- Afforestation: A pixel that was non-forested in the early period but later transformed into a forested pixel within four temporal trajectories.
- Deforestation: A forested pixel that was transformed into a non-forest pixel with five temporal trajectories.
- Unstable change: A pixel that underwent irregular transformations from forest to non-forest and vice-versa making the transformation pattern hard to track.
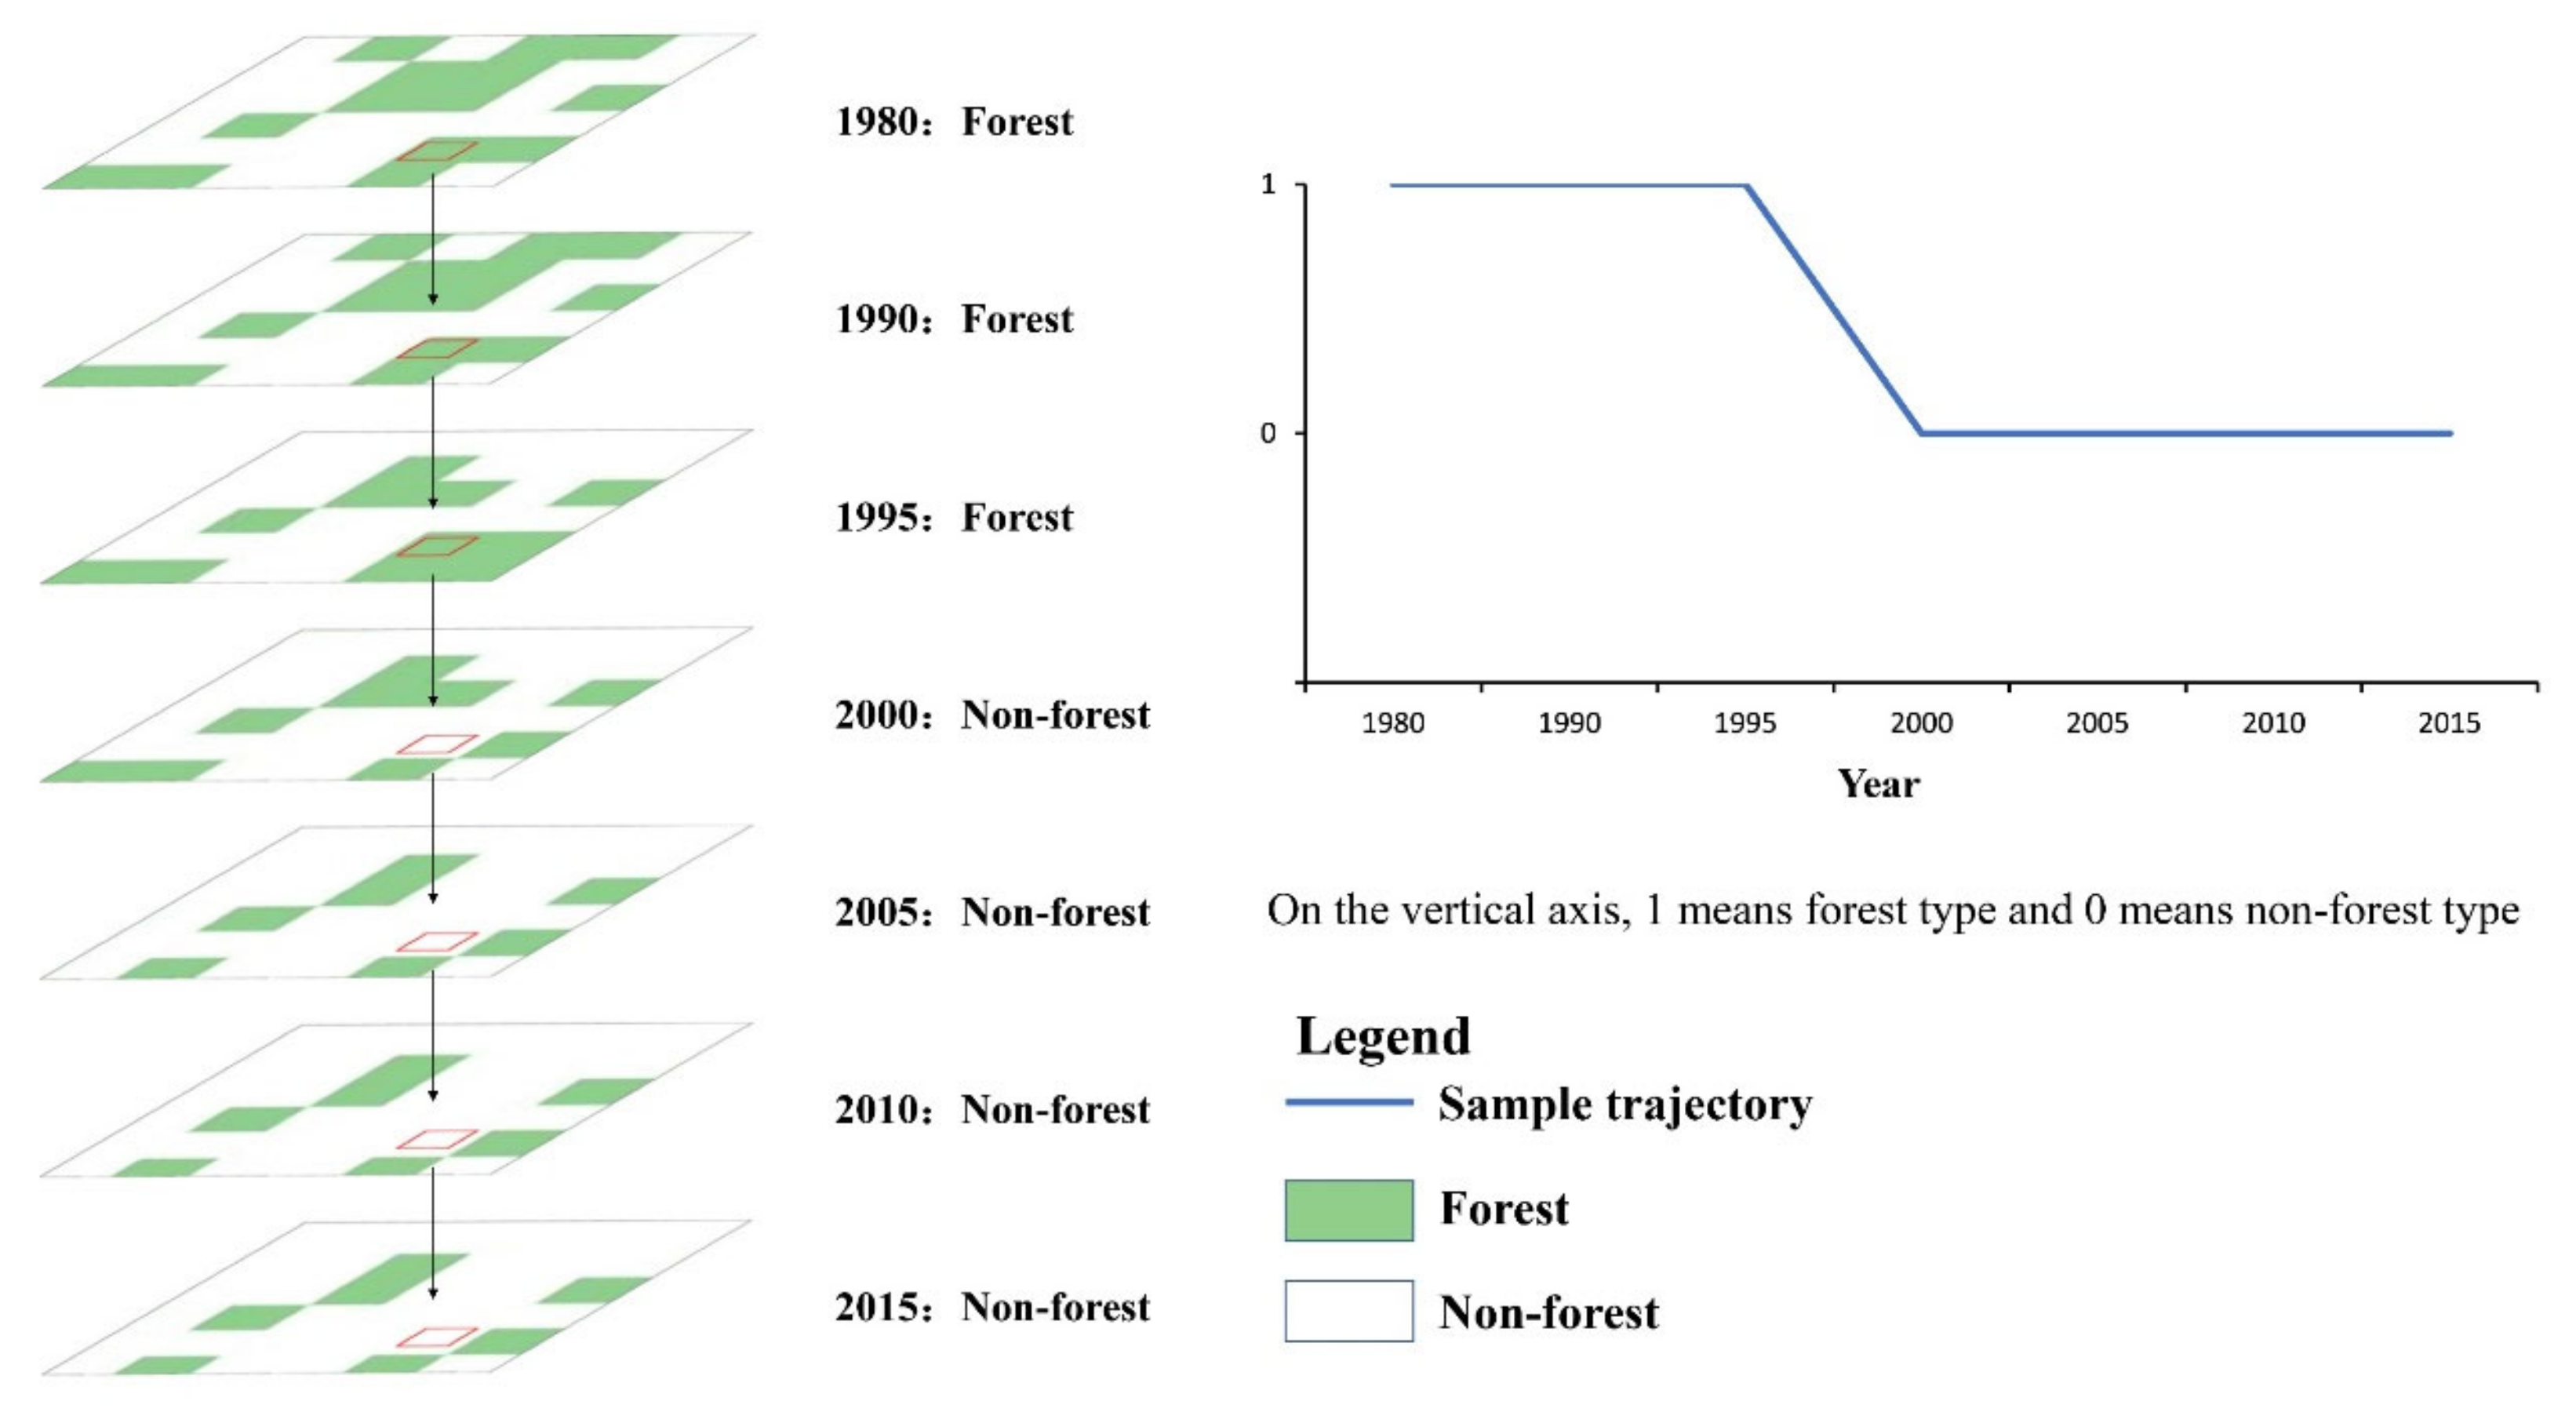
2.3.1. Forest Change Trajectories Dynamics
2.3.2. Temporal and Spatial Cluster Analysis
2.3.3. Driving Mechanisms Analysis
3. Results
3.1. The Spatial-Temporal Dynamics of Forest Types
3.2. Forest Change Trajectories
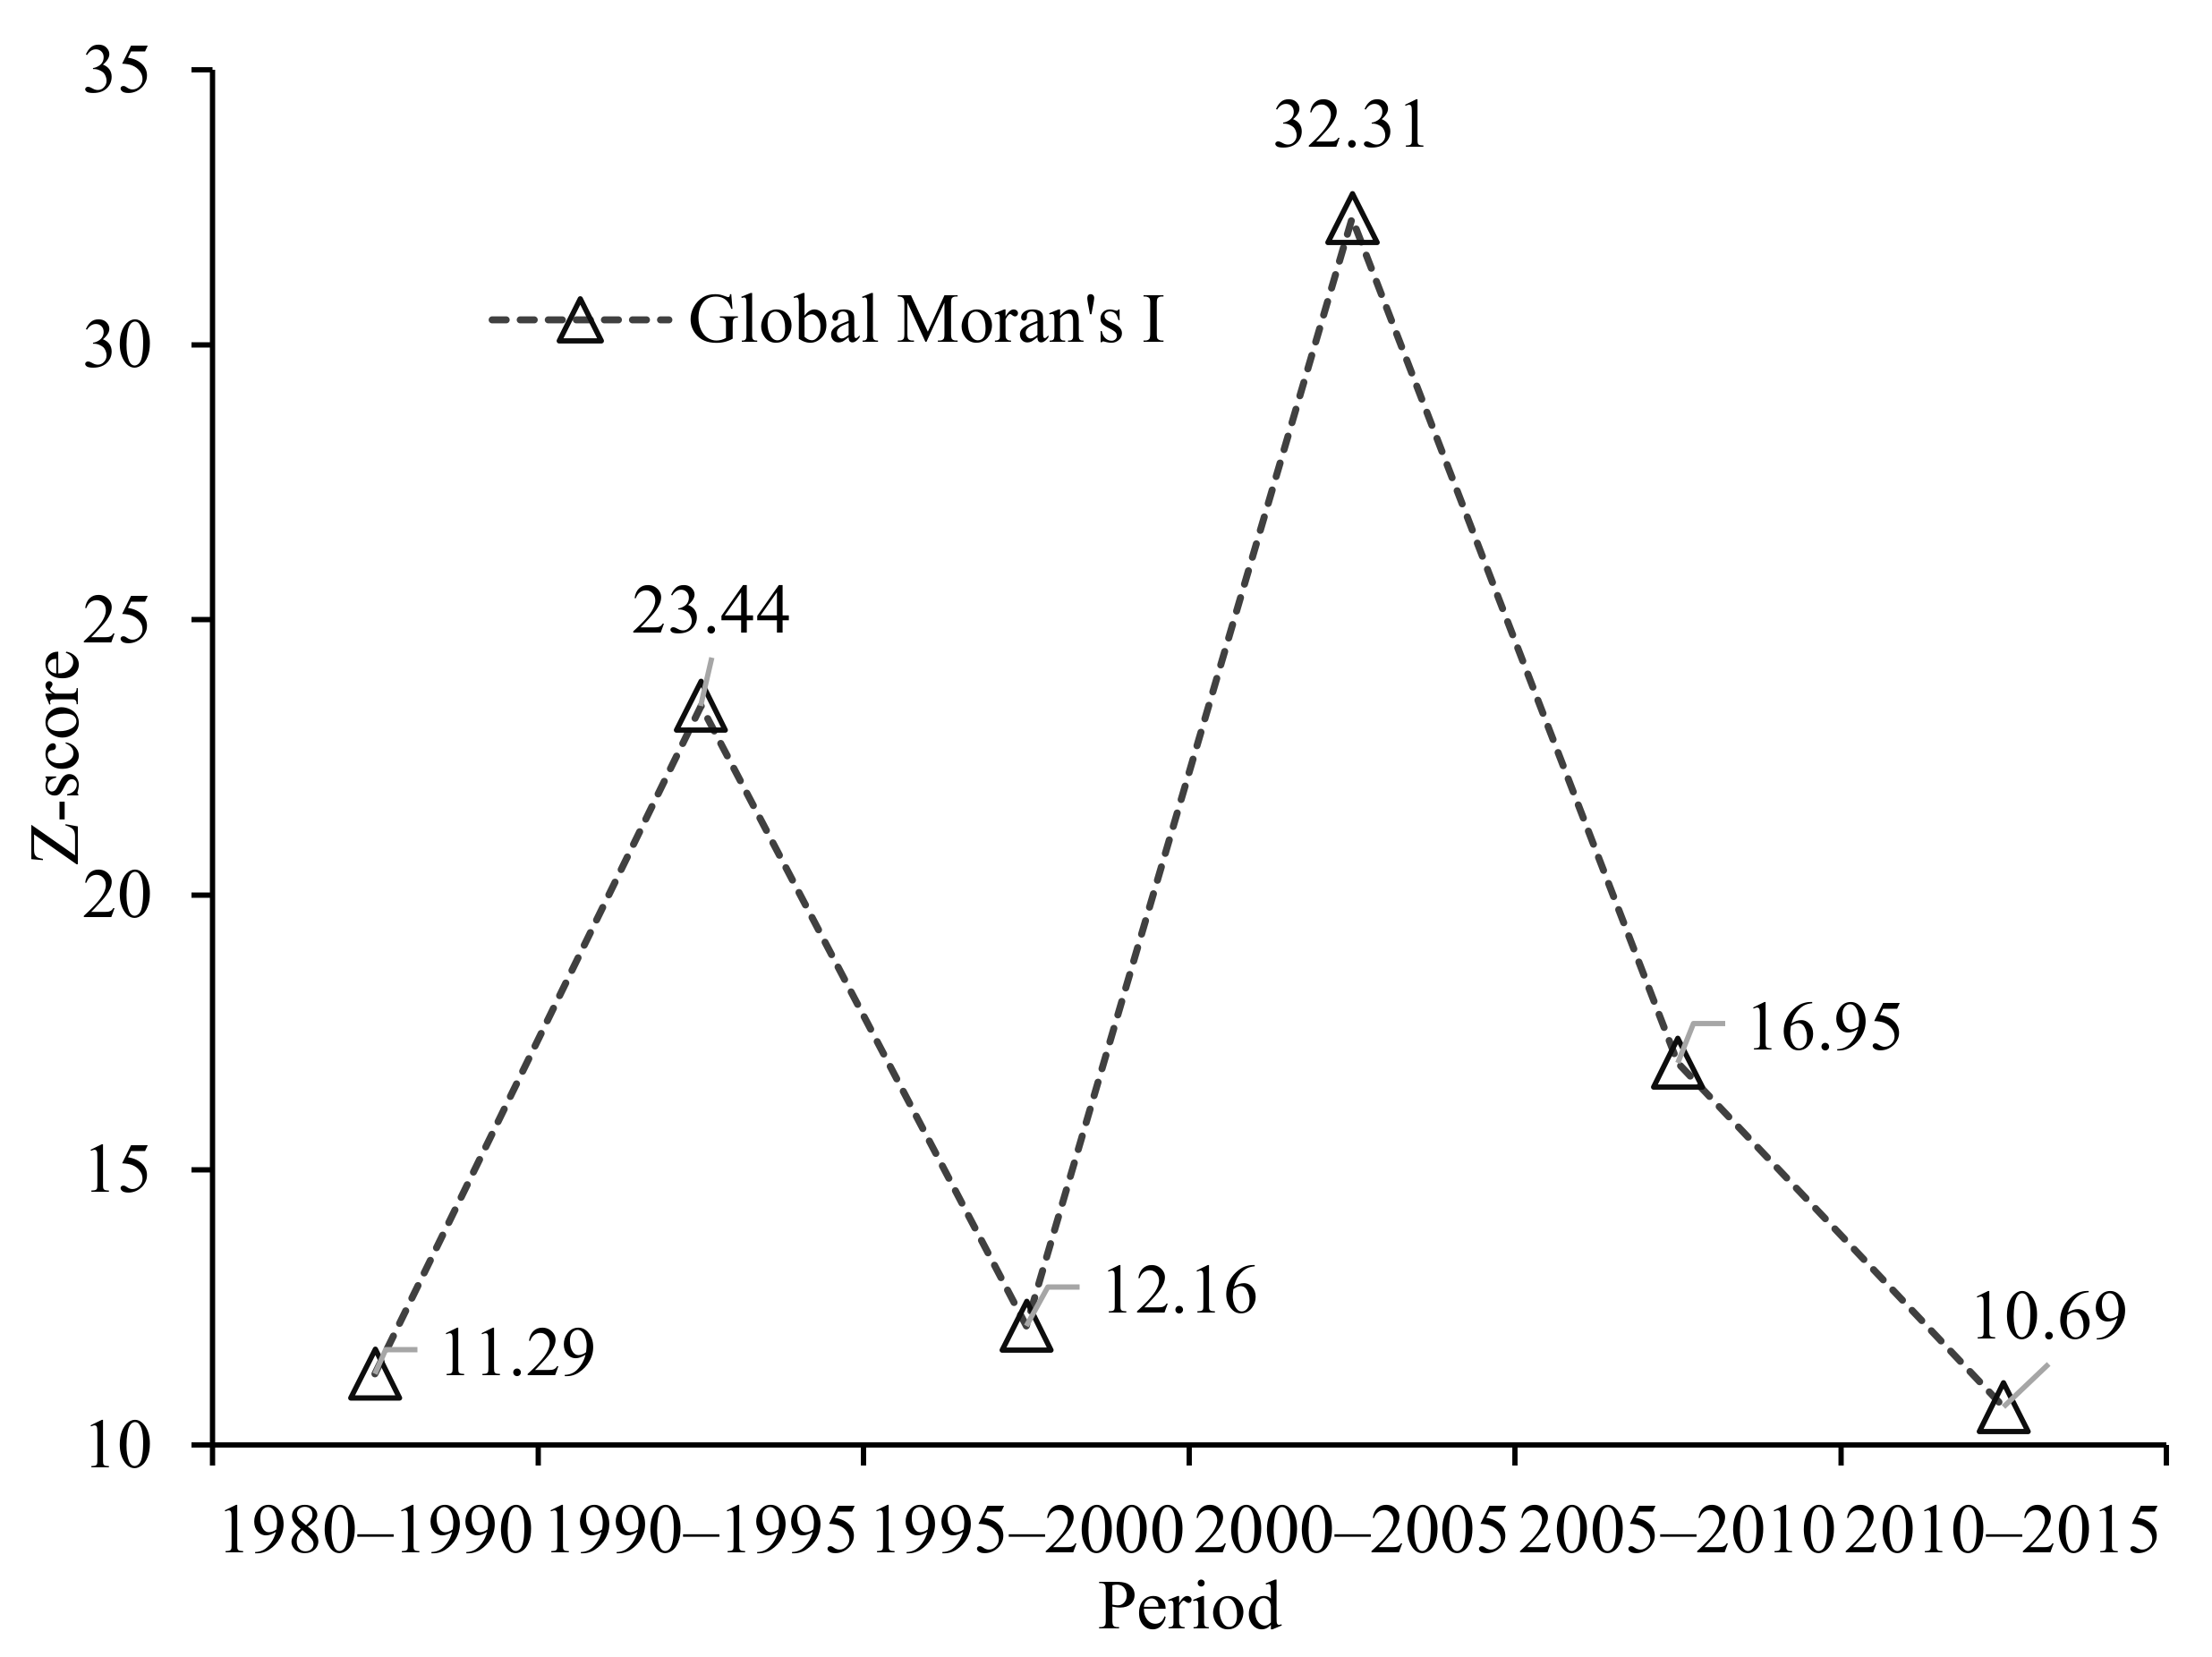
3.3. Spatio-Temporal Concentrations of Forest Dynamics
3.4. Focus Plot Analysis
4. Discussion
4.1. Forest Change Dynamics Driven by Forestry Policies
4.2. Economy-Oriented Forest Dynamics from 1990–2015
4.3. Relevance of the Article to the Forest Resource Management and Future Outlooks
4.3.1. Relevance of the Article to the Forest Resource Management with GHKM Region
4.3.2. Research Future Outlooks
5. Conclusions
Author Contributions
Funding
Institutional Review Board Statement
Informed Consent Statement
Data Availability Statement
Acknowledgments
Conflicts of Interest
References
- Watson, J.E.M.; Evans, T.; Venter, O.; Williams, B.; Tulloch, A.; Stewart, C.; Thompson, I.; Ray, J.C.; Murray, K.; Salazar, A.; et al. The exceptional value of intact forest ecosystems. Nat. Ecol. Evol. 2018, 2, 599–610. [Google Scholar] [CrossRef]
- Costanza, R.; d’Arge, R.; De Groot, R.; Farber, S.; Grasso, M.; Hannon, B.; Limburg, K.; Naeem, S.; O’neill, R.V.; Paruelo, J.; et al. The value of the world’s ecosystem services and natural capital. Nature 1997, 387, 253–260. [Google Scholar] [CrossRef]
- Wu, G.; Xiao, H.; Zhao, J.; Shao, G.; Li, J. Forest ecosystem services of Changbai Mountain in China. Sci. China 2002, 45, 21–32. [Google Scholar] [CrossRef] [PubMed]
- Foley, J.A.; DeFries, R.; Asner, G.P.; Barford, C.; Bonan, G.; Carpenter, S.R.; Chapin, F.S.; Coe, M.T.; Daily, G.C.; Gibbs, H.K.; et al. Global consequences of land use. Science 2005, 309, 570–574. [Google Scholar] [CrossRef] [PubMed] [Green Version]
- Song, X.; Hanse, M.; Stehman, S.; Potapov, P.; Tyukavina, A.; Vermote, E.; Townshend, J. Global land change from 1982 to 2016. Nature 2018, 560, 639–643. [Google Scholar] [CrossRef]
- Peñuelas, J.; Boada, M. A global change-induced biome shift in the Montseny Mountains (NE Spain). Glob. Chang. Biol. 2003, 9, 131–140. [Google Scholar] [CrossRef] [Green Version]
- Root, T.L.; Price, J.T.; Hall, K.R.; Schneider, S.H.; Rosenzweig, C.; Pounds, J.A. Fingerprints of global warming on wild animals and plants. Nature 2003, 421, 57–60. [Google Scholar] [CrossRef]
- Walther, G.R.; Post, E.; Convey, P.; Menzel, A.; Parmesan, C.; Beebee, T.J.C.; Fromentin, J.M.; Hoegh-Guldberg, O.; Bairlein, F. Ecological responses to recent climate change. Nature 2002, 416, 389–395. [Google Scholar] [CrossRef]
- Chen, X.; Zhao, H.; Li, P.; Yin, Z. Remote sensing image-based analysis of the relationship between urban heat island and land use/cover changes. Remote Sens. Environ. 2006, 104, 133–146. [Google Scholar] [CrossRef]
- Moulin, S.; Kergoat, L.; Viovy, N.; Dedieu, G. Global-scale assessment of vegetation phenology using NOAA/AVHRR satellite measurements. J. Clim. 1997, 10, 1154–1170. [Google Scholar] [CrossRef]
- Salim, H.A.; Chen, X.; Gong, J. Analysis of Sudan vegetation dynamics using NOAA-AVHRR NDVI data from 1982–1993. Asian J. Earth Sci. 2010, 3, 20–34. [Google Scholar] [CrossRef]
- Viña, A.; McConnell, W.J.; Yang, H.; Xu, Z.; Liu, J. Effects of conservation policy on China’s forest recovery. Sci. Adv. 2016, 2, 1–8. [Google Scholar] [CrossRef] [PubMed] [Green Version]
- Sánchez-Pinillos, M.; De Cáceres, M.; Ameztegui, A.; Coll, L. Temporal dimension of forest vulnerability to fire along successional trajectories. J. Environ. Manag. 2019, 248, 109301. [Google Scholar] [CrossRef] [PubMed]
- Jin, S.; Sader, S.A. MODIS time-series imagery for forest disturbance detection and quantification of patch size effects. Remote Sens. Environ. 2005, 99, 462–470. [Google Scholar] [CrossRef]
- Justice, C.O.; Vermote, E.; Townshend, J.R.G.; Defries, R.; Roy, D.P.; Hall, D.K.; Salomonson, V.V.; Privette, J.L.; Riggs, G.; Strahler, A.; et al. The moderate resolution imaging spectroradiometer (MODIS): Land remote sensing for global change research. IEEE Trans. Geosci. Remote Sens. 1998, 36, 1228–1249. [Google Scholar] [CrossRef] [Green Version]
- Eresanya, E.O.; Daramola, M.T.; Durowoju, O.S.; Awoyele, P. Investigation of the changing patterns of the land use land cover over Osogbo and its environs. R. Soc. Open Sci. 2019, 6, 191021. [Google Scholar] [CrossRef] [Green Version]
- Zhu, Z.; Woodcock, C.E. Continuous change detection and classification of land cover using all available Landsat data. Remote Sens. Environ. 2014, 144, 152–171. [Google Scholar] [CrossRef] [Green Version]
- Coppin, P.; Jonckheere, I.; Nackaerts, K.; Muys, B.; Lambin, E. Digital change detection methods in ecosystem monitoring: A review. Int. J. Remote Sens. 2004, 25, 1565–1596. [Google Scholar] [CrossRef]
- Zhou, Q.; Li, B.; Kurban, A. Trajectory analysis of land cover change in arid environment of China. Int. J. Remote Sens. 2008, 29, 1093–1107. [Google Scholar] [CrossRef]
- Sierra, R. Dynamics and patterns of deforestation in the western Amazon: The Napo deforestation front, 1986–1996. Appl. Geogr. 2000, 20, 1–16. [Google Scholar] [CrossRef]
- Mena, C.F. Trajectories of land-use and land-cover in the northern Ecuadorian Amazon: Temporal composition, spatial configuration, and probability of change. Photogram. Eng. Remote Sens. 2008, 74, 737–751. [Google Scholar] [CrossRef]
- Zhou, Q.; Li, B.; Chen, Y. Remote sensing change detection and process analysis of long-term land use change and human impacts. Ambio 2011, 40, 807–818. [Google Scholar] [CrossRef] [PubMed] [Green Version]
- Tang, X.; Bullock, E.L.; Olofsson, P.; Estel, S.; Woodcock, C.E. Near real-time monitoring of tropical forest disturbance: New algorithms and assessment framework. Remote Sens. Environ. 2019, 224, 202–218. [Google Scholar] [CrossRef]
- Carmona, A.; Nahuelhual, L. Combining land transitions and trajectories in assessing forest cover change. Appl. Geogr. 2012, 32, 904–915. [Google Scholar] [CrossRef]
- Liu, L.; Xu, X.; Liu, J.; Chen, X.; Ning, J. Impact of farmland change on production potential in China during 1990–2010. J. Geogr. Sci. 2015, 25, 19–34. [Google Scholar] [CrossRef] [Green Version]
- Verbesselt, J.; Zeileis, A.; Herold, M. Near real-time disturbance detection using satellite image time series. Remote Sens. Environ. 2012, 123, 98–108. [Google Scholar] [CrossRef]
- Huete, A.; Didan, K.; Miura, T.; Rodriguez, E.P.; Gao, X.; Ferreir, L.G. Overview of the radiometric and biophysical performance of the MODIS vegetation indices. Remote Sens. Environ. 2002, 83, 195–213. [Google Scholar] [CrossRef]
- Souza, C.M.; Siqueira, J.V.; Sales, M.H.; Fonseca, A.V.; Ribeiro, J.G.; Numata, I.; Cochrane, M.A.; Barber, C.P.; Roberts, D.A.; Barlow, J. Ten-year Landsat classification of deforestation and forest degradation in the Brazilian amazon. Remote Sens. 2013, 5, 5493–5513. [Google Scholar] [CrossRef] [Green Version]
- Escuin, S.; Navarro, R.; Fernández, P. Fire severity assessment by using NBR (Normalized Burn Ratio) and NDVI (Normalized Difference Vegetation Index) derived from Landsat TM/ETM Images. Int. J. Remote Sens. 2008, 29, 1053–1073. [Google Scholar] [CrossRef]
- Xie, B. Status and optimization strategies of forestry development in Guangdong Province. Agric. Sci. Technol. J. 2017, 7, 196. (In Chinese) [Google Scholar]
- Jian, Y.; Chen, Y.; Xie, Y.; Gong, J. Dynamic analysis of the spatial structure and evolution model of rural settlement in Guangdong Province from 1980 to 2015. J. Ecol. Rural. Environ. 2019, 35, 698–706. (In Chinese) [Google Scholar]
- Xu, X.; Liu, J.; Zhang, S.; Li, R.; Yan, C.; Wu, S. China multi-period land use and land cover remote sensing monitoring data set (CNLUCC). Data Registration and Publishing System of Resource and Environmental Science Data Center, Chinese Academy of Sciences. 2018. Available online: http://www.resdc.cn/DOI (accessed on 18 January 2021). (In Chinese) [CrossRef]
- Xu, X.; Liu, J.; Zhang, D.; Zeng, L. Spatial-temporal characteristics and driving forces of woodland resource change in Hainan Island in the last 15 years. Resour. Sci. 2004, 2, 100–107. (In Chinese) [Google Scholar]
- Zhang, G.; Liu, J.; Zhang, Z. Spatial-temporal changes of cropland in China for the past 10 years based on remote sensing. Acta Geogr. Sin. 2013, 3, 323–332. (In Chinese) [Google Scholar]
- Liu, J.; Zhang, Z.; Zhuang, D.; Wang, Y.; Zhou, W.; Zhang, S.; Li, R.; Jiang, N.; Wu, S. A study on the spatial-temporal dynamic changes of land-use and driving forces analyses of China in the 1990s. Geogr. Res. 2013, 1, 12. (In Chinese) [Google Scholar]
- Liu, J.; Zhuang, Z.; Xu, X.; Kuang, W.; Zhou, W.; Zhuang, S.; Li, R.; Yan, C.; Yu, D.; Wu, S.; et al. Spatial Patterns and driving forces of land use change in China in the early 21st Century. Acta Geogr. Sin. 2009, 64, 1411–1420. (In Chinese) [Google Scholar] [CrossRef]
- Liu, J.; Kuang, W.; Zhang, Z.; Xu, X.; Qin, Y.; Ning, J.; Zhou, W.; Zhang, S.; Li, R.; Yan, C.; et al. Spatiotemporal characteristics, patterns, and causes of land-use changes in China since the late 1980s. J. Geogr. Sci. 2014, 24, 195–210. [Google Scholar] [CrossRef]
- Ning, J.; Liu, J.; Kuang, W.; Xu, X.; Zhang, S.; Yan, C.; Li, R.; Wu, S.; Hu, Y.; Du, G.; et al. Spatiotemporal patterns and characteristics of land-use change in China during 2010–2015. J. Geogr. Sci. 2018, 28, 547–562. [Google Scholar] [CrossRef] [Green Version]
- Feng, H.; Liu, H.; Wu, L. Monitoring the Relationship between the land surface temperature change and urban growth in Beijing, China. IEEE J. Sel. Top Appl. Earth Obs. Remote Sens. 2014, 7, 4010–4019. [Google Scholar] [CrossRef]
- Goodchild, M. Spatial Autocorrelation (CATMOG 47); GeoBooks: Norwich, UK, 1986. [Google Scholar]
- Getis, A.; Ord, K. The analysis of spatial association by use of distance statistics. Geogr. Anal. 1992, 24, 189–206. [Google Scholar] [CrossRef]
- Qi, S. Eucalypt introduction and development status in China. Guangxi For. Sci. 2006, 35, 250–252. (In Chinese) [Google Scholar]
- Wu, Y.; Zhang, Z.; Yu, S. Protecting forest resources and building a green shield: Thoughts from the 1998 Great Flood. Prot. For. Sci. Technol. 1999, 1, 44–45. (In Chinese) [Google Scholar]
- Wang, M.; Zhang, H. A study of forestry policy evolution and development tendency in China after the reform and opening-up. World For. Res. 2017, 30, 7–11. (In Chinese) [Google Scholar]
- Cui, H.; Wen, T.; Zheng, F.; Kong, X.; Mao, H. Discussion on policy evolvement of forestry construction since reform and opening up. For. Econ. 2009, 38–43. (In Chinese) [Google Scholar] [CrossRef]
- Gao, W. Temporal and Spatial Patterns of Human Activities and Effects of Soil Erosion on River Basin Scale: Case Study in the Water Source Area of the Middle Route of South-to-North Water Diversion Project. Ph.D. Thesis, Chinese Academy of Forestry, Beijing, China, 2017. [Google Scholar]
- Hu, Y.; He, J. Evolution of forestry policy in China since 1949. J. Beijing For. Univ. (Soc. Sci.) 2010, 11, 21–27. (In Chinese) [Google Scholar]
- Wang, H.; Yan, J.; Li, H. Forest transition and its explanation in contiguous destitute areas of China. Acta Geogr. Sin. 2018, 73, 1253–1267. (In Chinese) [Google Scholar]


| Closed-Canopy Forest | Shrub | Sparse Forest | Other-Forest | Total | |
|---|---|---|---|---|---|
| 1980–1990 | +822 | +73 | −166 | −93 | +636 |
| 1990–1995 | +984 | −103 | −112 | −744 | +25 |
| 1995–2000 | −1187 | −17 | −31 | +1211 | −24 |
| 2000–2005 | −356 | −4 | −50 | +349 | −61 |
| 2005–2010 | −1105 | −120 | −392 | +1731 | +114 |
| 2010–2015 | −635 | +6 | −55 | −50 | −734 |
| 1980–2015 | −1477 | −165 | −806 | +2404 | −44 |
| Region | City | Percent Between Forest Area and the Total Area of Each City (%) | ||||||
|---|---|---|---|---|---|---|---|---|
| 1980 | 1990 | 1995 | 2000 | 2005 | 2010 | 2015 | ||
| GBA | Guangzhou | 43.55 | 43.75 | 43.58 | 43.57 | 42.94 | 42.27 | 42.04 |
| Shenzhen | 51.65 | 51.22 | 45.97 | 45.75 | 41.85 | 40.61 | 40.06 | |
| Foshan | 24.01 | 24.04 | 23.96 | 23.99 | 23.06 | 22.49 | 22.27 | |
| Dongguan | 35.08 | 35.12 | 31.56 | 31.40 | 24.89 | 22.92 | 22.47 | |
| Huizhou | 64.34 | 64.62 | 64.23 | 64.55 | 64.50 | 64.32 | 63.88 | |
| Zhuhai | 31.28 | 32.66 | 31.79 | 31.71 | 31.35 | 31.35 | 30.91 | |
| Zhongshan | 20.78 | 22.64 | 22.76 | 22.76 | 20.78 | 20.37 | 20.20 | |
| Jiangmen | 51.97 | 52.00 | 51.92 | 51.93 | 51.92 | 52.03 | 51.26 | |
| Zhaoqing | 75.66 | 75.89 | 75.82 | 75.91 | 75.81 | 75.89 | 75.25 | |
| Hong Kong | 58.31 | 58.31 | 57.78 | 57.78 | 58.31 | 58.41 | 58.41 | |
| Macao | 36.84 | 21.05 | 21.05 | 21.05 | 21.05 | 21.05 | 21.05 | |
| Total | 55.76 | 55.99 | 55.48 | 55.56 | 54.89 | 54.62 | 54.13 | |
| EGR | Shantou | 24.15 | 24.38 | 26.29 | 24.48 | 24.62 | 24.71 | 24.66 |
| Shanwei | 43.19 | 43.33 | 43.93 | 43.31 | 43.74 | 44.25 | 43.80 | |
| Chaozhou | 47.44 | 47.67 | 46.86 | 47.64 | 47.61 | 47.87 | 47.54 | |
| Jieyang | 45.73 | 45.96 | 45.84 | 46.03 | 46.18 | 46.34 | 45.88 | |
| Total | 42.23 | 42.44 | 42.69 | 42.46 | 42.66 | 42.94 | 42.57 | |
| NGR | Shaoguan | 71.95 | 72.96 | 72.71 | 73.00 | 73.17 | 73.33 | 72.80 |
| Meizhou | 74.93 | 75.89 | 75.97 | 75.91 | 76.08 | 76.39 | 75.98 | |
| Heyuan | 77.81 | 77.96 | 78.36 | 77.96 | 78.51 | 79.02 | 78.51 | |
| Qingyuan | 67.43 | 67.73 | 67.79 | 67.79 | 67.80 | 67.99 | 67.65 | |
| Yunfu | 70.07 | 70.42 | 70.37 | 70.37 | 70.33 | 70.34 | 69.93 | |
| Total | 72.45 | 73.03 | 73.08 | 73.05 | 73.24 | 73.50 | 73.06 | |
| WGR | Zhanjiang | 33.40 | 33.67 | 35.25 | 35.30 | 36.16 | 36.15 | 36.02 |
| Yangjiang | 58.55 | 58.48 | 58.86 | 58.78 | 58.96 | 59.13 | 58.78 | |
| Maoming | 59.55 | 59.59 | 59.65 | 59.51 | 59.66 | 59.74 | 59.55 | |
| Total | 49.13 | 49.23 | 49.96 | 49.91 | 50.35 | 50.42 | 50.21 | |
| GHKM | GHKM Cities | 60.99 | 61.35 | 61.36 | 61.35 | 61.31 | 61.38 | 60.96 |
| Trajectory | Area (km2) | Proportion (%) | Trajectory | Area (km2) | Proportion (%) |
|---|---|---|---|---|---|
| 0010111 | 76 | 0.042 | 1110111 | 3 | 0.002 |
| 0011000 | 20 | 0.011 | 0000100 | 2 | 0.001 |
| 0100000 | 12 | 0.007 | 0000110 | 2 | 0.001 |
| 1100111 | 11 | 0.006 | 0011110 | 2 | 0.001 |
| 1110000 | 11 | 0.006 | 0101110 | 2 | 0.001 |
| 0000001 | 9 | 0.005 | 0111100 | 2 | 0.001 |
| 0111000 | 9 | 0.005 | 1010111 | 2 | 0.001 |
| 0111110 | 9 | 0.005 | 1011111 | 2 | 0.001 |
| 0001111 | 8 | 0.004 | 0001000 | 1 | 0.001 |
| 1111011 | 8 | 0.004 | 0001110 | 1 | 0.001 |
| 0101111 | 7 | 0.004 | 0010110 | 1 | 0.001 |
| 1101000 | 6 | 0.003 | 0101000 | 1 | 0.001 |
| 0010011 | 5 | 0.003 | 0101100 | 1 | 0.001 |
| 1101110 | 5 | 0.003 | 0110000 | 1 | 0.001 |
| 0000010 | 4 | 0.002 | 1000011 | 1 | 0.001 |
| 1101100 | 4 | 0.002 | 1000111 | 1 | 0.001 |
| 0011100 | 3 | 0.002 | 1100100 | 1 | 0.001 |
| 1010000 | 3 | 0.002 | 1111001 | 1 | 0.001 |
| 1100011 | 3 | 0.002 |
| Types | Trajectory | Number | Area (km2) | Proportion (%) | |
|---|---|---|---|---|---|
| Unchanged type | Permanent Forest | 1111111 | 2 | 105,828 | 59.073 |
| 1101111 | 249 | 0.139 | |||
| Permanent Non-forest | 0000000 | 2 | 68,631 | 38.310 | |
| 0010000 | 205 | 0.114 | |||
| Stable change | Afforestation | 0000011 | 4 | 332 | 0.185 |
| 0000111 | 438 | 0.245 | |||
| 0011111 | 453 | 0.253 | |||
| 0111111 | 716 | 0.400 | |||
| Deforestation | 1000000 | 5 | 114 | 0.064 | |
| 1100000 | 445 | 0.248 | |||
| 1111000 | 553 | 0.309 | |||
| 1111100 | 226 | 0.126 | |||
| 1111110 | 718 | 0.401 | |||
| Unstable change trajectory | 0010111 | 37 | 240 | 0.134 | |
| 0011000 | |||||
| 0100000 | |||||
| 1100111 | |||||
| 0111000 | |||||
| Driving Factors | Correlation Coefficient | ||||||
|---|---|---|---|---|---|---|---|
| Closed- Canopy Forest | Shrub | Sparse Forest | Other Forest | Total Forest | Afforestation | Deforestation | |
| X1 | −0.904 * | −0.851 | −0.947 * | 0.873 | −0.823 | −0.857 | 0.347 |
| X2 | −0.931 * | −0.896 | −0.966 * | 0.917 * | −0.770 | −0.862 | 0.362 |
| X3 | 0.481 | 0.734 | 0.743 | −0.480 | 0.689 | 0.449 | −0.748 |
| X4 | −0.966 ** | −0.788 | −0.866 | 0.961 * | −0.577 | −0.812 | 0.079 |
| X5 | −0.977 ** | −0.747 | −0.849 | 0.955 * | 0.623 | −0.812 | 0.058 |
Publisher’s Note: MDPI stays neutral with regard to jurisdictional claims in published maps and institutional affiliations. |
© 2021 by the authors. Licensee MDPI, Basel, Switzerland. This article is an open access article distributed under the terms and conditions of the Creative Commons Attribution (CC BY) license (http://creativecommons.org/licenses/by/4.0/).
Share and Cite
Xian, Y.; Lu, Y.; Musyimi, Z.; Liu, G. Tracking the Role of Policies and Economic Factors in Driving the Forest Change Trajectories within the Guangdong-Hongkong-Macao Region of China: A Remote Sensing Perspective. Land 2021, 10, 87. https://0-doi-org.brum.beds.ac.uk/10.3390/land10010087
Xian Y, Lu Y, Musyimi Z, Liu G. Tracking the Role of Policies and Economic Factors in Driving the Forest Change Trajectories within the Guangdong-Hongkong-Macao Region of China: A Remote Sensing Perspective. Land. 2021; 10(1):87. https://0-doi-org.brum.beds.ac.uk/10.3390/land10010087
Chicago/Turabian StyleXian, Yuyang, Yongquan Lu, Zipporah Musyimi, and Guilin Liu. 2021. "Tracking the Role of Policies and Economic Factors in Driving the Forest Change Trajectories within the Guangdong-Hongkong-Macao Region of China: A Remote Sensing Perspective" Land 10, no. 1: 87. https://0-doi-org.brum.beds.ac.uk/10.3390/land10010087