1. Introduction
Infrastructure systems are a vital component of the built environment because they deliver services for sustaining human life. Infrastructure directly impacts the health and wellbeing of communities by enabling mobility and providing access to healthcare, economic opportunities, energy, clean water, food, information, and many other resources [
1]. Physical infrastructure may include roads, pipelines, information, and communication technologies, and many infrastructure sectors are co-dependent on other sectors. These infrastructure systems span and connect communities in urban, suburban, periurban, and rural areas, providing critical infrastructure networks across regions [
2].
There is a robust body of research that examines the impact of access and proximity of an infrastructure system in shaping equity. Regional science and urban studies scholarship indicates that the challenges imposed by infrastructure development are contextual and varied. As development is catching up with rapid urbanization in Asia and Africa, decision-makers are contending with the challenges of unequal access to essential infrastructure while meeting the desire for ‘world-class’ and prestigious infrastructure [
3,
4]. In North America, where infrastructure systems were developed in the past hundred years, unequal access remains a pertinent issue that has denied communities critical resources to support their wellbeing. Examples in the United States include food deserts in urban and rural neighborhoods [
5], lack of access to green space in cities [
6], and digital divides in internet access [
7].
Infrastructure systems can also generate disamenities or burdens in the form of pollution of air, water, and soil or land takings and dispossession, and thus the development and management of these systems may harm certain communities to support others. The burdens of regional infrastructure development have been largely localized [
8]. Research on urban environmental justice in American cities reveals that marginalized communities, including low-income neighborhoods and communities of color, have been historically targeted to house these disamenities [
9]. Key examples include the clearing of African American homes in cities across the United States to build highways to support suburbanization [
10,
11]; decisions to place hazardous waste sites in rural and often poor communities of color in the American South [
12]; the creation of “energy sacrifice zones” in rural areas [
13]; and air pollution in certain urban neighborhoods [
14]. These inequities have severe consequences for the health and wellbeing of residents, such as elevated rates of asthma and other chronic health conditions, food insecurity, energy poverty, and many others [
15,
16,
17].
While studies around the world have illustrated inequities associated with infrastructure systems, metropolitan areas and their connections across urban and rural systems remain understudied [
1]. The benefits of infrastructure are unevenly distributed across the urban and rural places connected by these systems [
1,
18,
19,
20]. There is a need to investigate the unevenness of benefits and burdens across urban-rural systems by considering a more nuanced conceptualization of the regional geography than ‘urban and the other’ [
21].
Quantifying and characterizing these ‘contradictory spaces’, or how multiple infrastructure systems deliver benefits to some places at the cost of others, is needed to fully understand the benefits and burdens of infrastructure systems. Because infrastructure systems connect urban and rural places across a region, spatial research must consider equity across these interconnected regions [
22,
23]. Investigating these spaces at the regional scale is important because this is typically the scale at which the densest networks of infrastructure are built and where these contradictory spaces occur. However, the density of transportation infrastructure and green spaces vary in urban and rural areas in ways that are not necessarily represented by administrative cartographical boundaries. The urban-rural gradient, a concept stemming from the ecology literature, represents the interconnected elements of the built environment by considering the density of infrastructure and imperviousness [
24]. Some research has examined the relationship between inequities and imperviousness, where imperviousness serves as a proxy for infrastructure density across urban and rural places [
25,
26]. Methodologically speaking, these studies supplement conventional multivariate ordinary least squares (OLS) models with Geographic Weighted Regression (GWR) analysis to examine the spatial variation of its strength and relationship. Here, the coefficients are allowed to vary locally, and regression equations are generated for every point in the dataset—this allows for an examination of local effects of imperviousness on inequities. Yet, there is also a need to examine how inequities are associated with different types of infrastructure systems across urban and rural places at the regional scale.
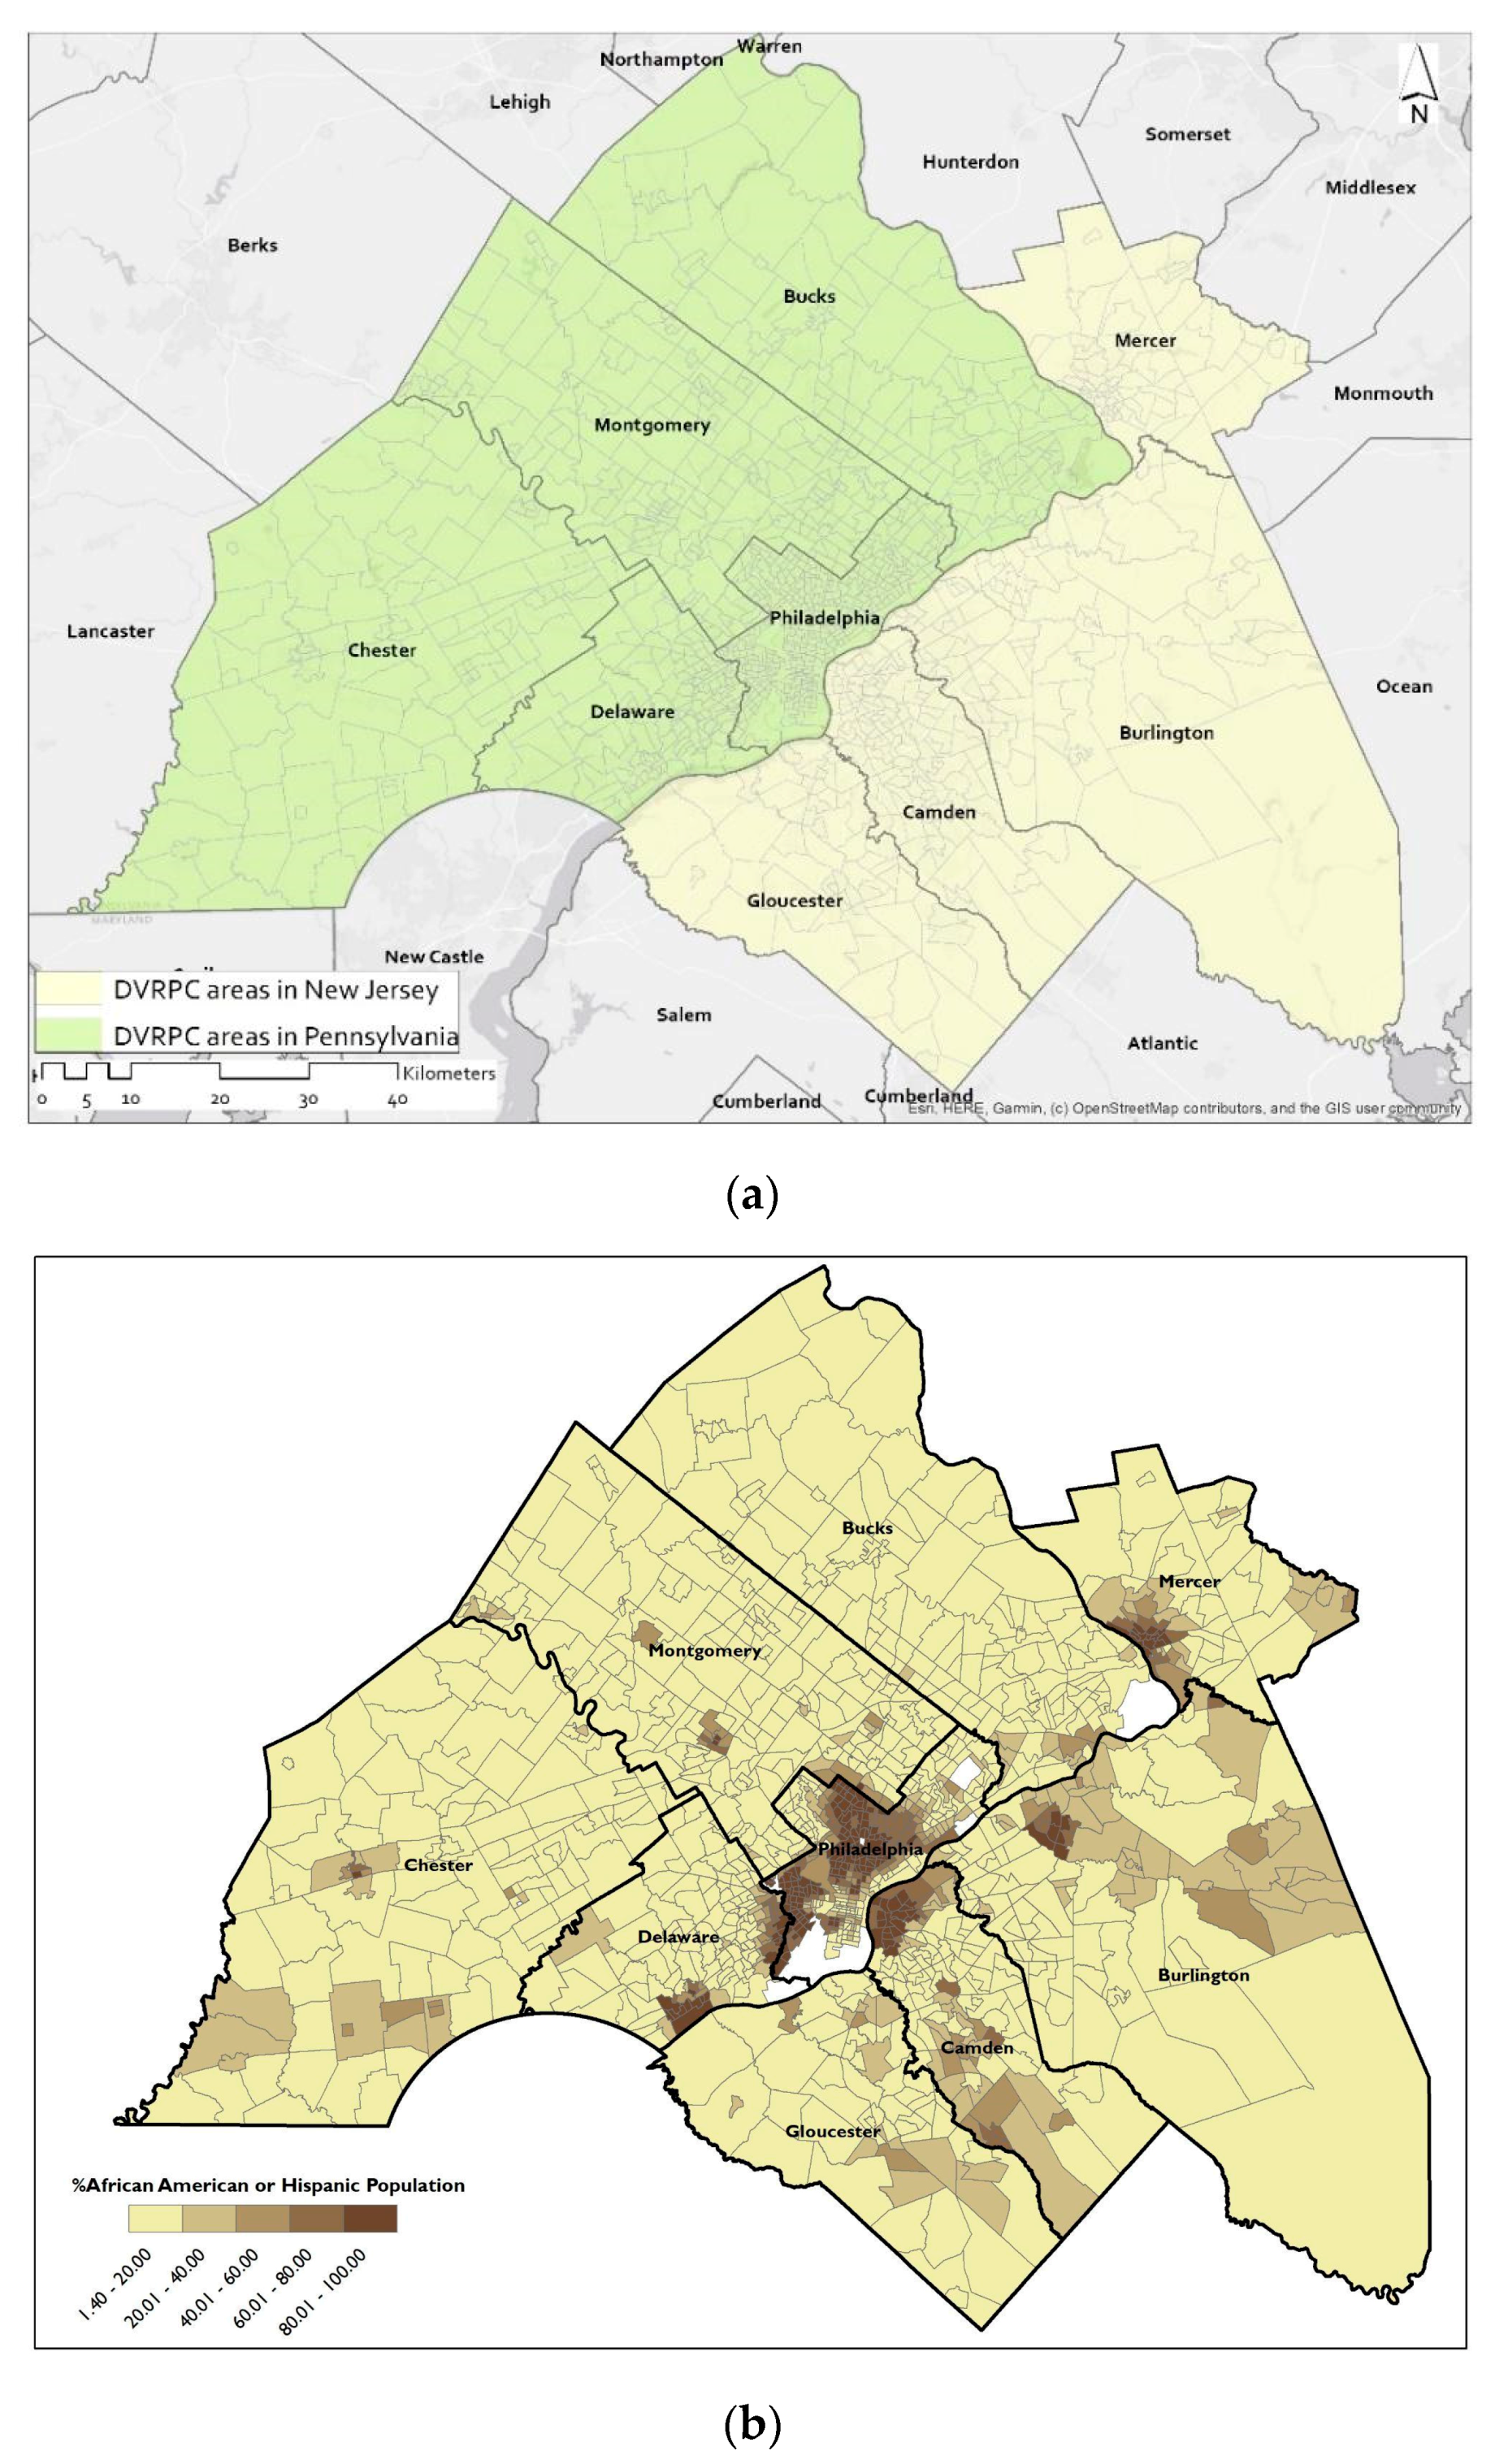
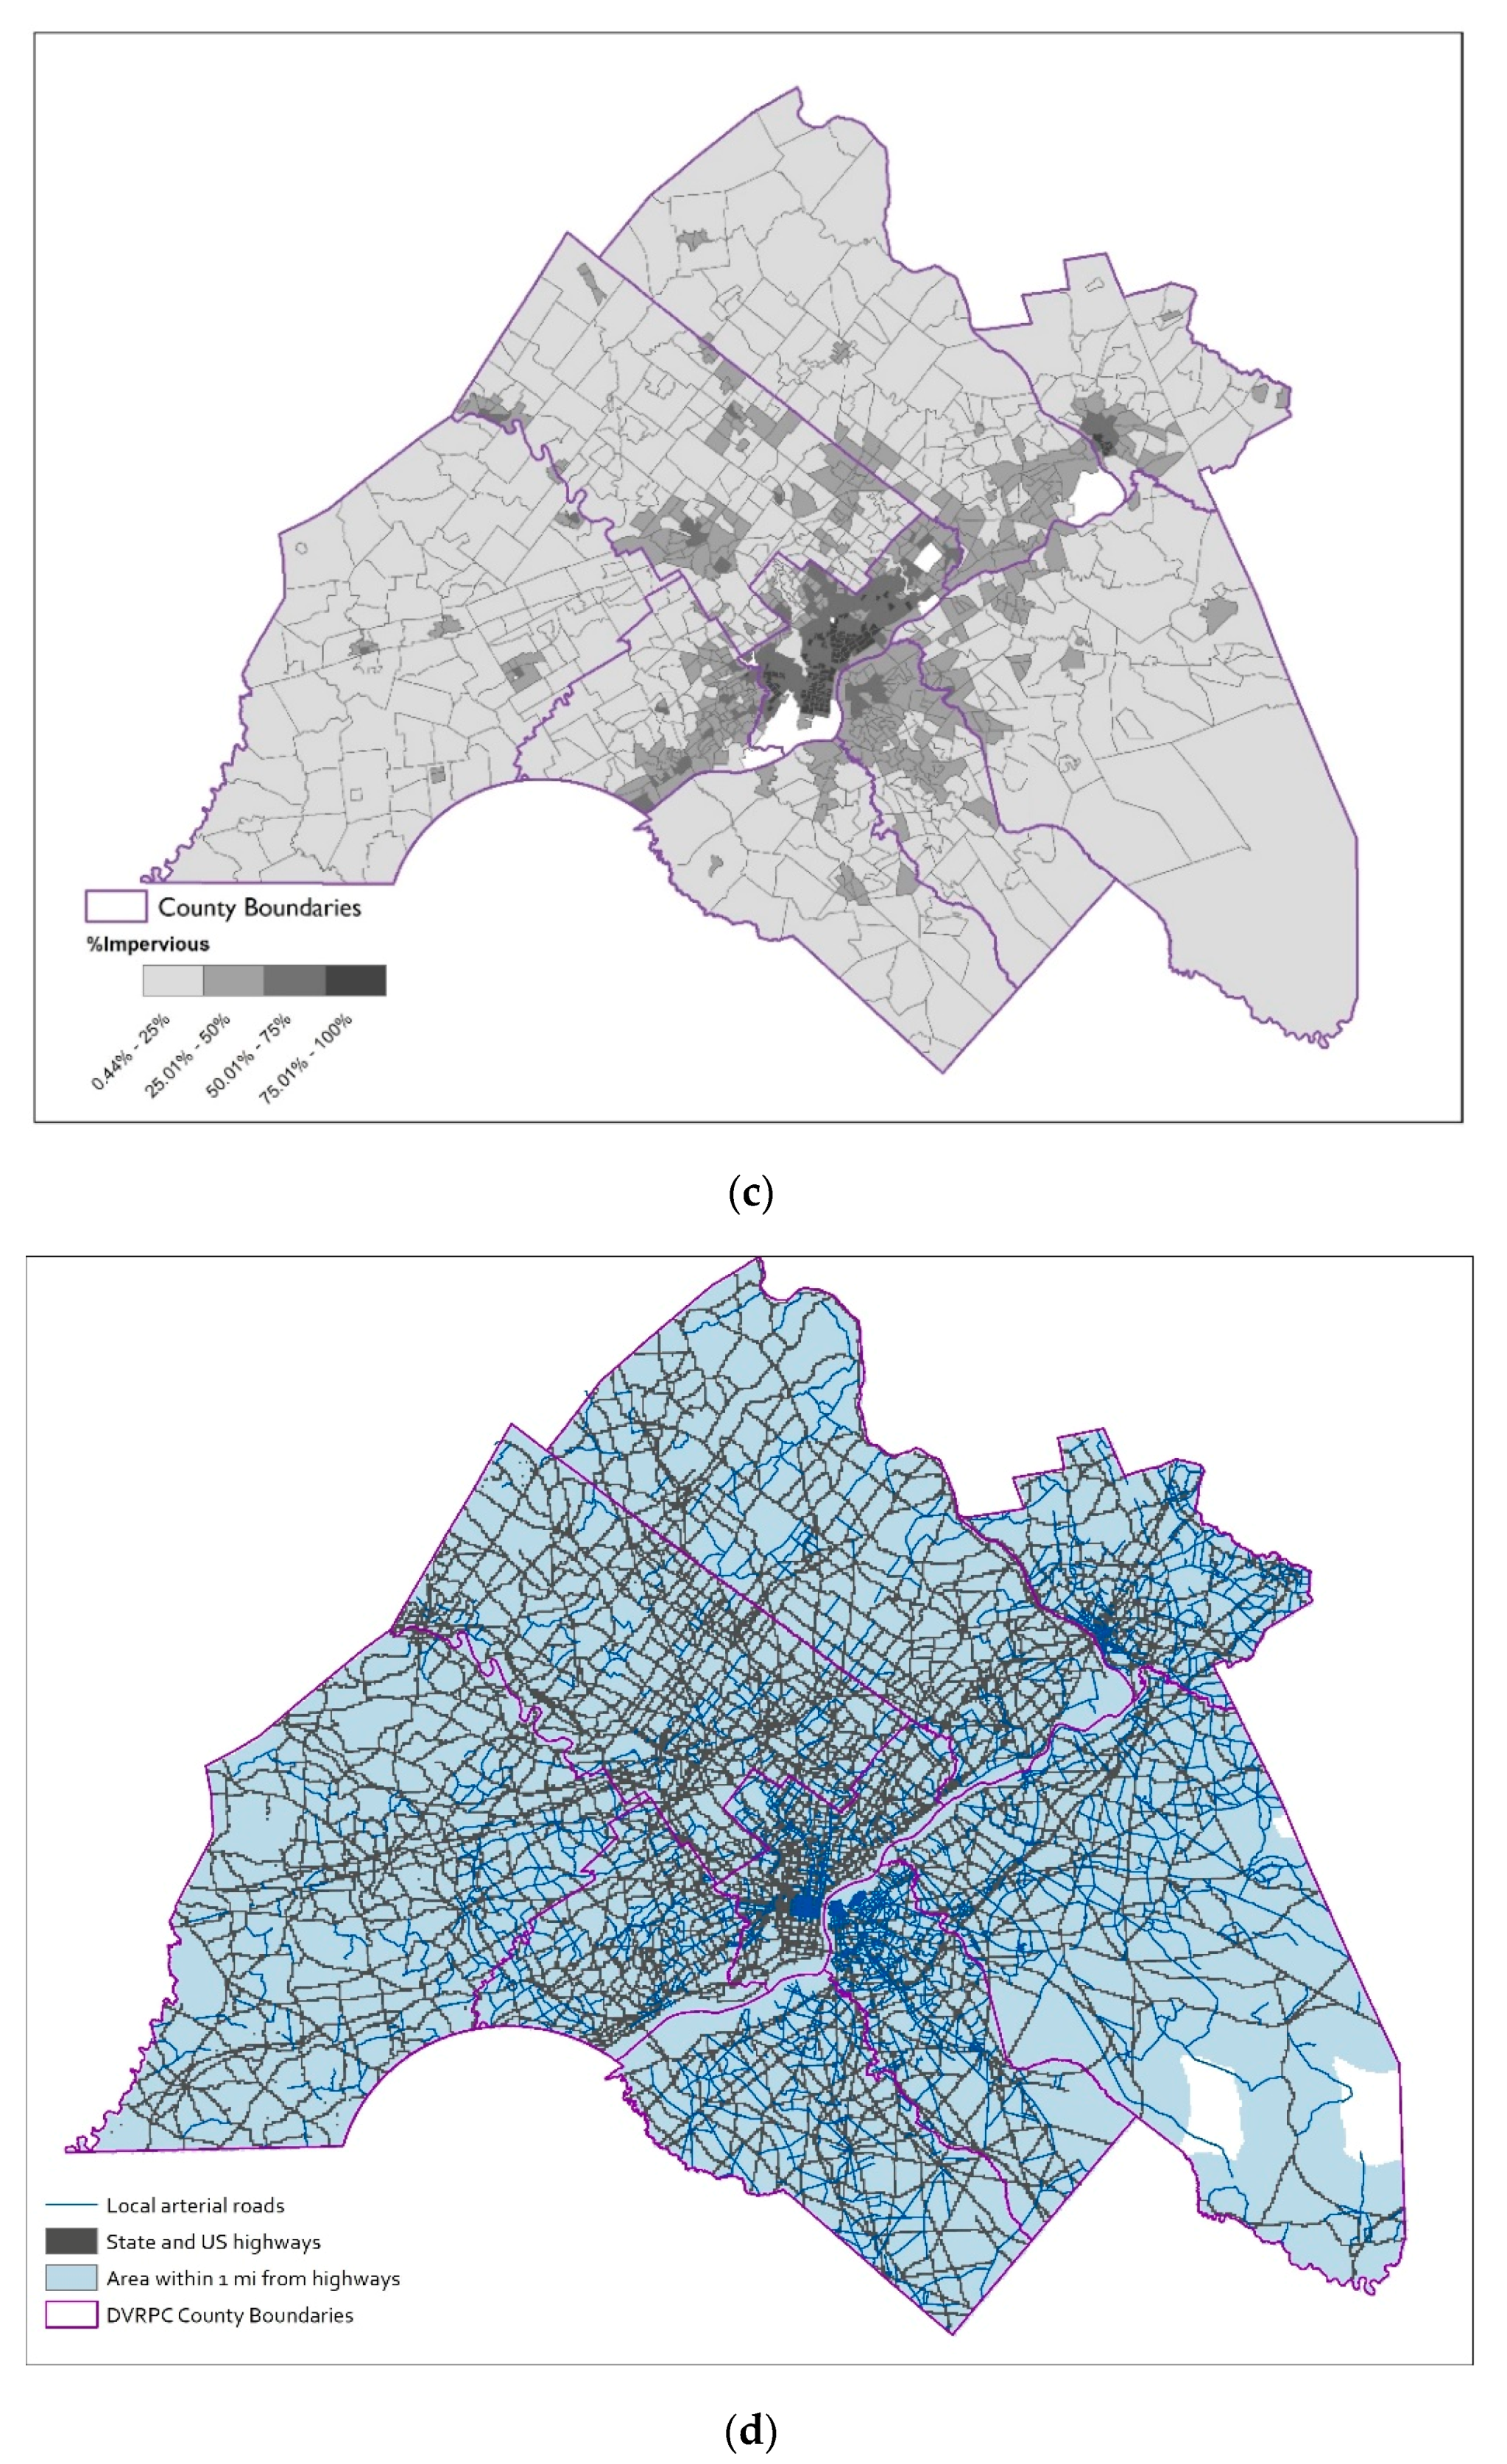
Hence, this study investigates the impact of infrastructure systems in shaping equitable urban-rural systems by investigating the relationships between the distribution of grey-green infrastructure systems and indicators of inequity across a region. This research examines the relationships among infrastructure systems and inequities to address the following questions: (1) Which indicators of inequity have a relationship with infrastructure? (2) How do proximity and access to infrastructure relate to inequities? (3) Do spatial relationships between equity, wellbeing, and infrastructure vary across urban and rural places within a region? This study investigates the spatial patterns of these inequities across a region, but it does not assess or measure the specific benefits or burdens created by different infrastructure systems, as this is out of the scope of our study. These questions are examined in the census tracts of the Delaware Valley Region of Pennsylvania and New Jersey, defined and governed by the Delaware Valley Regional Planning Commission (DVRPC), as seen in
Figure 1a. The relevance of the urban-rural (U-R) gradient for enhancing understanding of the spatial relationship between social inequities and infrastructure is investigated. Indicators of social inequity are regressed against imperviousness (a proxy to the U-R gradient) and predictors describing infrastructure systems of equity and wellbeing (the distance and density of transportation networks, travel time, percent of green spaces in a tract, and percent of the population with low food access) using multivariate and spatial regression methods.
2. Study Area, Materials and Methods
Study area: The DVRPC region or Greater Philadelphia, subject of this study, is the sixth most populous metropolitan area in the US and includes regions in 2 states, 9 counties, and 100s of municipalities, which complicate regional planning efforts. The region had an estimated population of 5.74 million people in 2017, projecting a growth of approximately 2% from the 2010 census across two states that have adapted different strategies to develop the infrastructure networks [
27]. One of the most critical issues facing Greater Philadelphia is disparities in income between the primary cities and the suburbs. The City of Philadelphia had a poverty rate of almost 26% in 2017 and is the poorest city among America’s most populous cities [
28]. The region’s poverty and high-income inequality are persistent in the wealthiest as well as the poorest parts of the region. Furthermore, the city has a complex and multidimensional history of racial, economic, and social segregation. Unemployment has remained a persistent issue for some African American residents, and yet this region is also home to the black middle class and elite [
29]. There are also persistent regional environmental inequities, with more environmental hazards located in the city, especially in communities of color. Hence, the metropolitan region has racial and social class diversity, and a long, documented history of environmental burdens that allow for an examination of inequities in infrastructure systems. [
30,
31]. Neighborhoods with high concentrations of African Americans and Hispanic residents are located in the urban centers, namely in Philadelphia, Camden, and Trenton (Mercer county), as seen in
Figure 1b. In addition to concentrated urban poverty, the region is also facing challenges of meeting demands of the population for essential services with aging infrastructure.
Data Sources and Preparation: The following regional infrastructures for appraising equity and wellbeing in the region were used (see
Table S1). (1) Transportation infrastructure, including public transit and the major road networks and transportation usage, through travel preferences and travel behavior; (2) Green infrastructure, measured as the area in a tract within 1-kilometer buffer from trails and parks; (3) Distance to hospitals and health centers, or health infrastructures; and (4) Food access across the low-income geographies, defined as the percent of population with low-income and low-access to food at 0.5–1 and 1–10 mile distances. The research used data from the 5-year estimates of the 2013–2018 5-year American Community Survey (ACS) estimates to identify various four indicators of inequity: (1) percentage of African American and Latino residents, (2) access to health insurance (private and state-subsidized), (3) educational attainment, and (4) median household income. These indicators were selected as proxy measures of social inequalities based on the context and history of urban disinvestment in Philadelphia [
11].
Table S1, Supplementary Material, provides a summary of all variables used in the model and further details on data transformation for the analysis.
Figure 1d maps the distribution of the road network and the portions of the regions, which have access to highways and can be accessed within 1 mile. Additional maps of other infrastructure systems are presented in
Figure S1.
For the purposes of analysis, the ACS data on African American and Hispanic populations were combined together as they represent the largest groups of racialized minority residents in the region. Infrastructure predictors considered from the ACS travel data included time spent on travel, mode of travel, and the distance traveled by workers. The data on transportation infrastructure, green infrastructure (trails and parks), hospitals, and health centers were procured from the state-level spatial data repositories, Pennsylvania Spatial Data repository (PASDA), and New Jersey Department of Environmental Protection, Bureau of GIS Office (NJDEP Open Data). The 2016 land cover data on the urban imperviousness in the National Land Cover Database [
32] was used to approximate the Urban-Rural gradient and the density of infrastructure across the metropolitan region. All data layers were aggregated to the level of census tracts. As a final step, tracts with no residential populations were removed from the dataset for the purposes of the analysis.
Table S1 summarizes the data layers and the data conversions made for aggregating them to the census tracts.
Methods: The data on infrastructure from different sources were compiled and a correlation matrix was produced for all variables. The Pearson’s r-coefficients were used to (1) evaluate the correlation between infrastructure predictors and indicators of social equity (dependent variables) and (2) minimize multicollinearity among the predictors. For two predictors with high multicollinearity (Pearson’s r > 0.5 or r < −0.5), variables with high correlation values with dependent values were selected. In cases where all predictors for specific infrastructure systems showed lower correlations with the dependent variables, predictors with higher statistical significance (p-values) were included in the model to capture their interaction with other infrastructure predictors.
Next, the inequity data were regressed against infrastructure systems in two stages. First, stepwise hedonic regression models were created to estimate the global multi-infrastructures model that measures the effect of infrastructure on the indicators of equity in the study area. The global model is expressed as following:
where,
: Equity indicator, expressed as a percent of population with the equity characteristic
β0: Intercept
xk: Infrastructure system predictors
βk: Coefficient of infrastructure predictors
At this stage, baseline U-R gradient models were also created to predict each measure of equity as a function of imperviousness (i.e., the density of overall infrastructure systems) in each census tract, following the approach in Ogneva-Himmelberger et al. 2009 [
25] and described in Equation (2).
where, %
Imp: Percentage of impervious area in a tract.
Furthermore, local multi-infrastructure models were run to examine the variation of the effect of these variables at the scale of the census tracts using Geographically Weighted Regression (GWR). Like OLS models, GWR models also employ a linear approach but allow coefficients to vary by weighing observations for each data observation by introducing distance-weights, and therefore, resulting in a unique regression equation for each census tract. Thus, Equation (3) for local models for a census tract
i can be expressed as a variation of Equation (1).
As a final step, both global and local models were compared with the base model to examine the impacts of transportation, health, green, and food infrastructure systems. Models with higher explanatory powers (adjusted R-square values) and the least AIC values in the global model, followed by models with random residual patterns in the GWR models, were selected for discussion in the next section.
3. Results
Our results are organized based on our research questions.
3.1. Which Indicators of Inequity Have a Relationship with Infrastructure?
Two of our equity indicators. 1. concentration of African American and Hispanic population and 2. the population with health insurance have a strong relationship with multiple infrastructure systems. Results are discussed based on these two social equity indicators. Models regressing the African American and Hispanic population analyze the relationship between infrastructure systems and racial inequities and are, therefore, referred to as Racial Equity models in the section. Similarly, models using the population with health insurance are referred to as Wellbeing models.
Table 1 indicates Pearson’s correlation r-values between the equity indicators and the broader infrastructure predictors, identified to represent regional transportation infrastructure systems like road transportation networks, regional public transit, transportation modes utilized, and the time spent on travel by residents. Distance to hospitals, supermarkets, and access to parks and green trails were also identified. The Pearson’s r-values were also computed to identify variables with high multicollinearity amongst the infrastructure predictors.
Transportation: At this stage of analysis, the density of the total regional road network and the various types of roads (state and interstate highways and local roads) were considered individually. There was a higher correlation between the inequity indicators and regional transportation roads calculated by individual categories. The density of roads rather than distance has a stronger correlation with both equity indicators. Distance to regional public transit was a significant predictor with a strong negative correlation with both racial equity and wellbeing.
Travel trends: Racial equity was found to have a moderate to strong correlation for both modes of travel to work; it has a strong, positive correlation with a proportion of workers who use public transportation to work and a moderate, negative relationship with a population who drive. A similar pattern is also observed for the wellbeing models, albeit the correlation values vary from moderate to low correlation values. The relationship between travel time and the equity indicators was significantly different. The racial equity indicator has a strong, negative correlation for people who spend less than 10 min traveling every day and a marginally strong negative relationship for the population traveling between 10 and 30 min on the way to work. Racial equity had a mild positive correlation for the population with travel times longer than 30 min.
Health systems, food access, and green infrastructure: Distance to hospitals was another significant predictor with strong, negative correlation with racial equity and moderate, negative correlation with the wellbeing indicator. Food access, measured by the proportion population who have to travel a certain distance for food shopping, also had a strong, negative correlation with racial equity and wellbeing indicators. Finally, the areal concentration of parks and green trails in a census tract exhibited a moderate, positive correlation with the equity indicators.
Additionally, a matrix of Pearson’s r-values between predictors was calculated and presented in
Table S2 of supplementary material. The threshold for multicollinearity was set for r-values greater than 0.5 or less than −0.5. Multicollinearity was observed between the preferred modes of travel (driving v. public transit), distance to regional transit, and the proportion of people who use transit. The predictor that measured the distance to hospitals exhibited high multicollinearity with all independent variables describing the preferred mode of travel and low food access.
For each equity indicator, a strong correlation with the infrastructure predictors and low multicollinearity between the predictors themselves guided the design of a stepwise, OLS regression-based Global multi-infrastructure model that calculates the explanatory powers of infrastructure systems in predicting racial equity and wellbeing.
Table 2 describes the overall summary of these models. Overall explanatory powers of the global multi-infrastructure models, in terms of adjusted r-squared, is 35% for racial equity indicator and 19% for wellbeing indicators.
In the baseline U-R gradient model for racial equity, imperviousness has an overall positive effect on the concentration of African American and Hispanic populations (
Table 2 and
Figure 2a). The global infrastructure model for racial equity also exhibits similar explanatory power as the baseline model in terms of adjusted R-squared. However, as
Figure 3a also shows, imperviousness has a far stronger beta coefficient value and thus power to explain where Hispanic or African American populations live than the individual predictors in the global infrastructure model. Similarly, upon a comparison of adjusted r-squared values, the base model for Wellbeing fares better than the infrastructure model, as seen in
Table 2.
Figure 2b describes the performance of the independent variables. Imperviousness is negatively correlated with access to health insurance. The AIC and LogLik terms included in
Table 2 are also useful to compare the models. As AIC penalizes models for introducing multiple parameters, the baseline U-R model exhibits a better overall fit.
3.2. How Do Proximity and Access to Infrastructure Relate to Inequities?
This section discusses the performance of the individual predictors in the Global OLS models developed for each inequity indicator.
Racial Equity: In the global multi-infrastructure model, the density of different regional road networks explains the concentration of racialized minority populations, with the density of state roads having the strongest effect, as seen in
Figure 2a. The presence of green infrastructure also shows a strong positive correlation. Travel time, in general, has a negative correlation with the racialized minority population. This pattern is even more visible when the mode of travel is considered. Favorable variables for travel, such as the ability to drive to work and shorter commute times (10 min or less) have a strong negative effect on the concentration of the African American and Hispanic population. Similarly, higher access to food stores also exhibits a negative effect in explaining the population concentration.
Wellbeing: The Global OLS model for wellbeing reveals that the density of state roads and interstate highways, as well as the proportion of the working population that drives to work, are negative predictors of access to health insurance. The density of state roads and interstate highways are significant predictors in our model. Amongst various infrastructure variables, low food access over half a mile is a strong positive predictor of the population with insurance.
3.3. Do Spatial Relationships between Equity, Wellbeing, and Infrastructure Vary across Urban and Rural Places within a Region?
This section discusses the performance of the individual predictors in the Local GWR models developed for each inequity indicator.
Racial Equity: In the local GWR model, the density of state roads and interstate highways separate clusters of high positive and negative correlation values. The density of state roads has a significant positive correlation with the proportion of Hispanic and African American population per census tract in the western part of the region (in Montgomery and Chester county). The positive effects of the density of interstate highways are also more concentrated outside the City of Camden and in Gloucester county. In the counties in Pennsylvania, green infrastructure shows a generally positive relationship. Interestingly, the correlation becomes negative to different degrees outside of dense urban areas in New Jersey (
Figure S2).
Wellbeing: Local relationships through beta-coefficients for the Wellbeing indicator are presented in
Figure S3 (supplementary matter). The density of state roads and interstate highways are negatively correlated across the region, apart from a few clusters of Census Tracts in Chester, Montgomery, and Gloucester counties, where the density of roads and access to health insurance are positively correlated. The density of interstate highways also predicts the proportion of insured population positively in parts of Burlington and Bucks county. Travel times of the working population are inconsistent across the region. Insured populations have a positive correlation with the proportion of the population who travel over 60 min for work. Distance to hospitals is a positive predictor of the insured population. The percent low-income population with low food access (FAHalf) is a positive predictor of access to health insurance in the global model. Local models suggest this pattern is especially strong in the downtowns in Mercer county. However, this variable is a negative predictor for Philadelphia county and the western periphery of the study area.
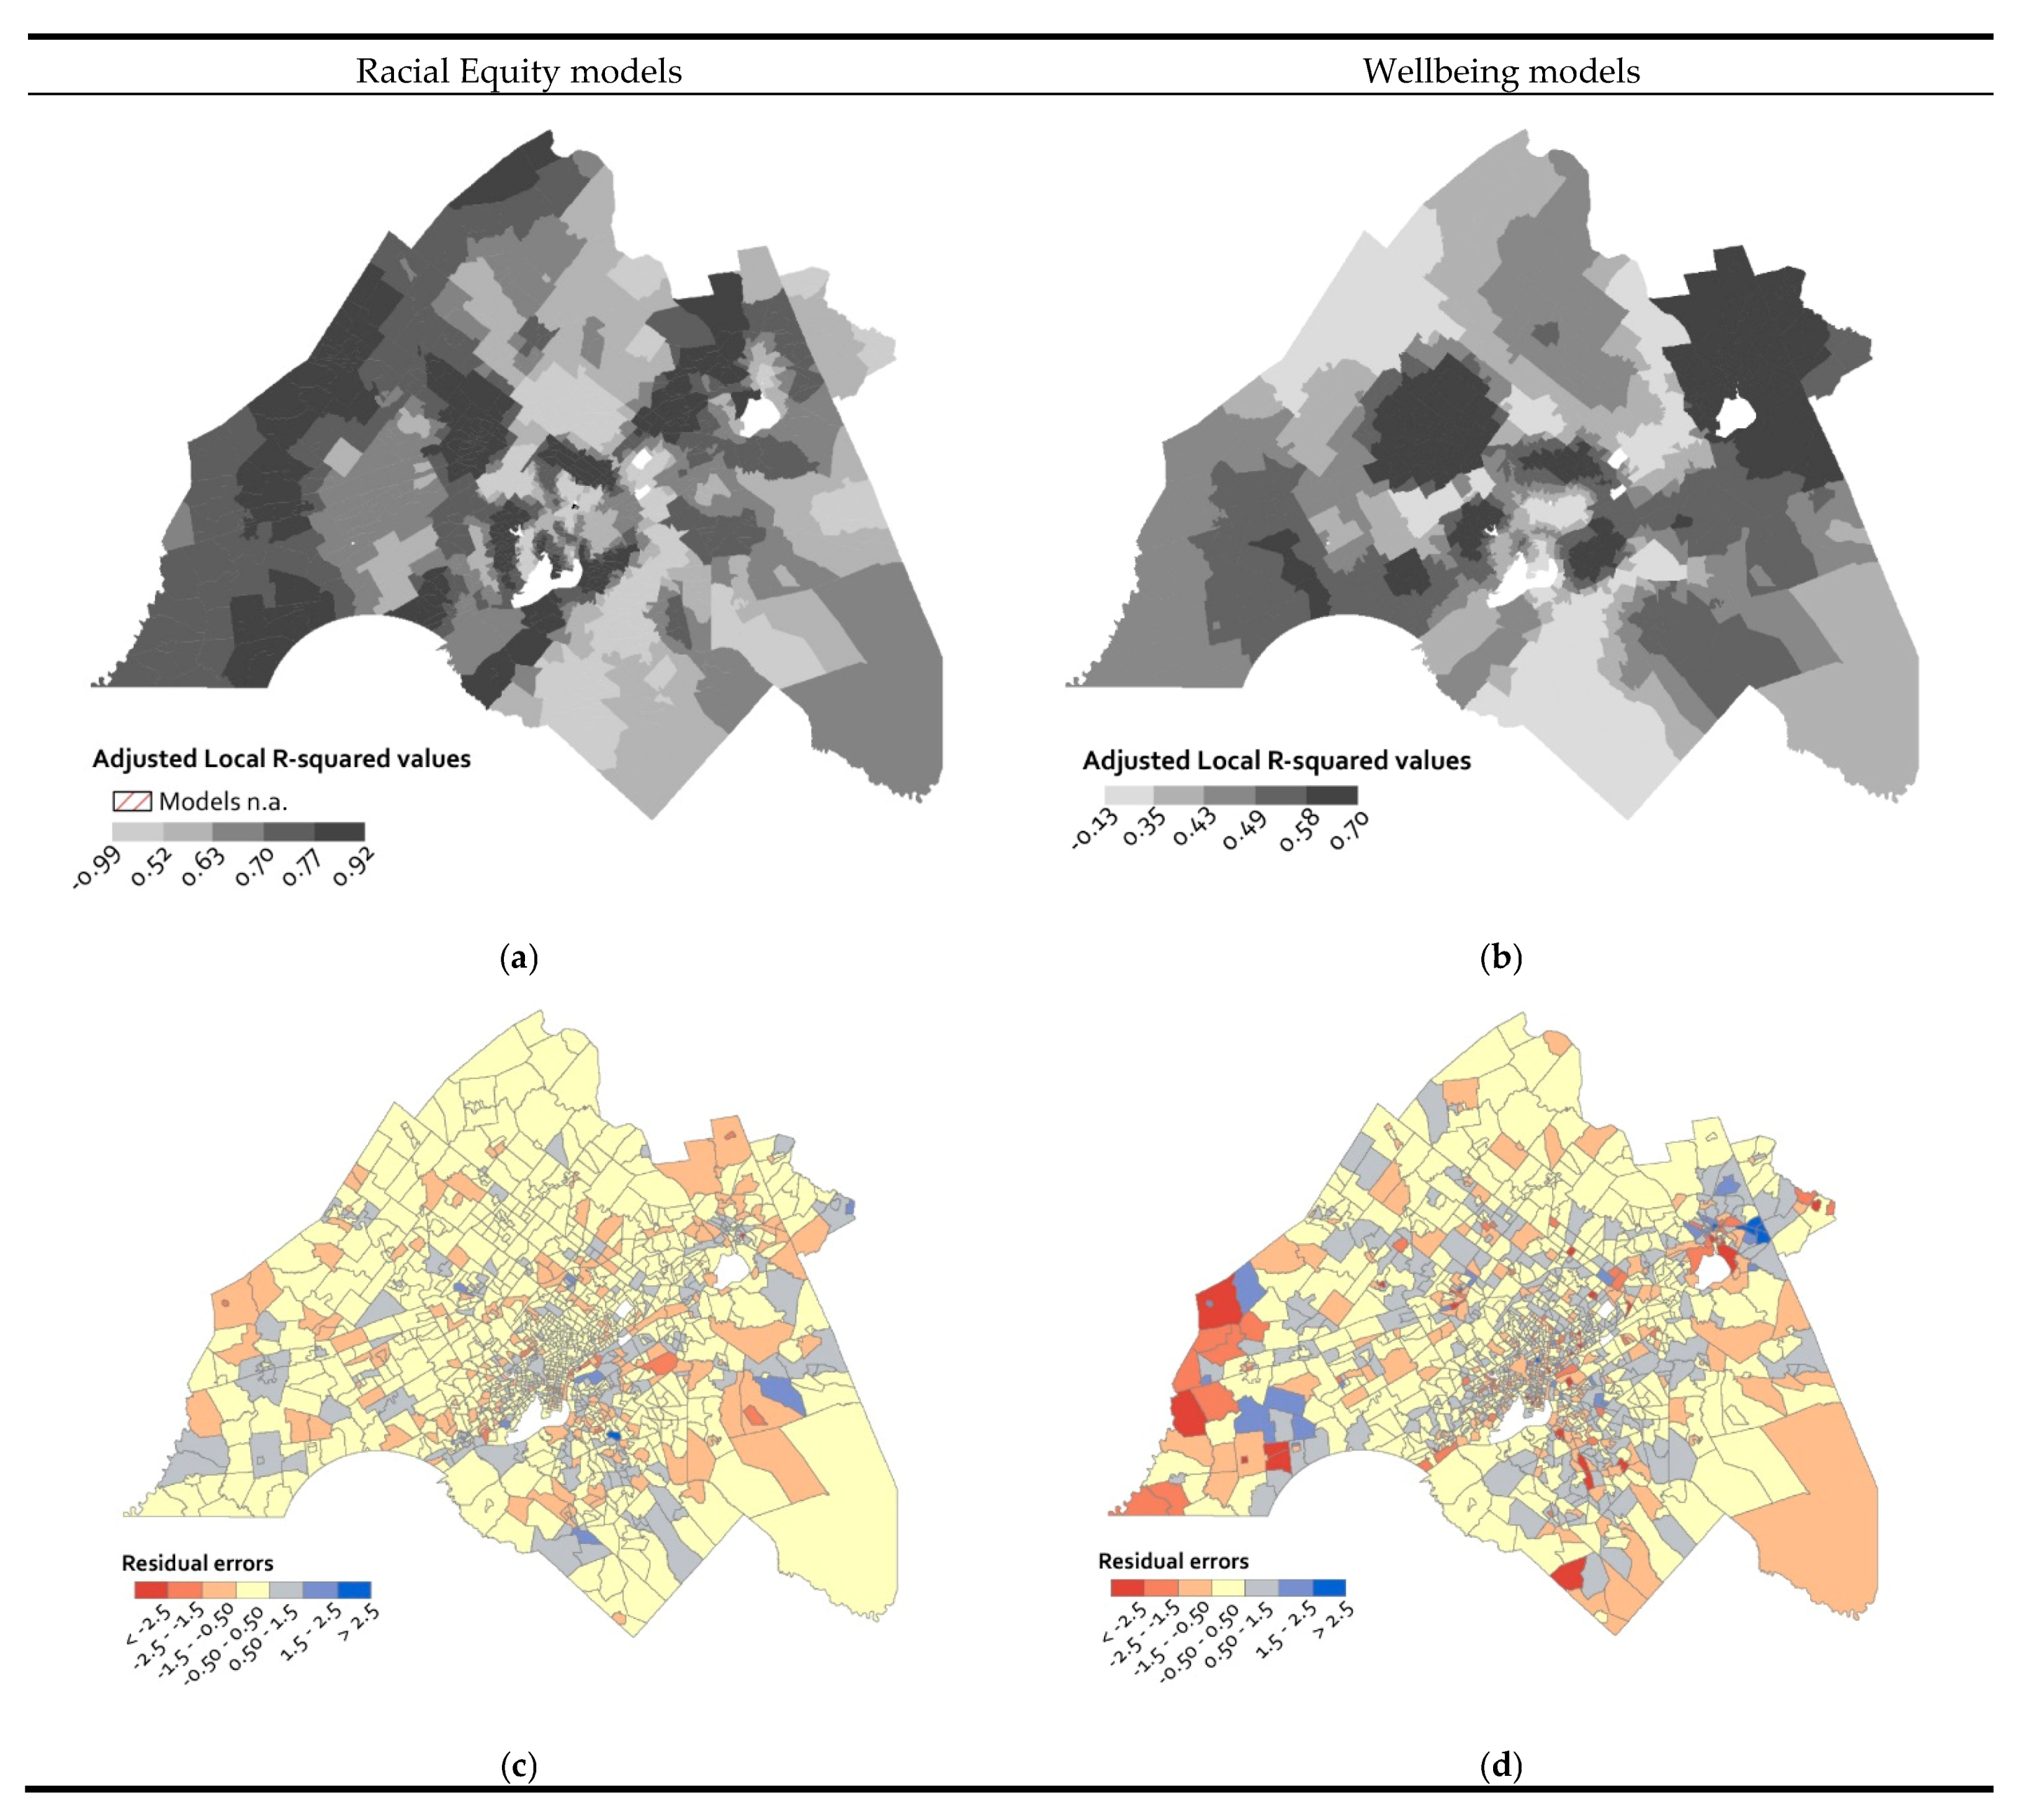
The results from the local GWR models developed for Racial Equity and Wellbeing indicate the relationships between these indicators have distinct spatial clustering patterns (
Figure 3a,b). These patterns do not necessarily coincide with the U-R gradient, defined by imperviousness in this study (
Figure 1c).
4. Discussion
This study shows spatial variability in the extent to which multiple infrastructure systems predict indicators of equity and wellbeing across the Philadelphia metropolitan region, and the findings support the results of other studies that show how infrastructure shapes inequities at the regional scale [
33]. Our study reveals how the benefits and burdens due to proximity and access to infrastructure are inequitably distributed across the region to create “contradictory spaces.”
(
a)
Which indicators of inequity have a relationship with infrastructure? Among the four indicators of inequities considered in our analysis (concentration of minority population, population with higher educational attainment, population with health insurance, and household income), there were weak, moderate to strong correlations between the infrastructure predictors and equity indicators. However, correlation alone (whether strong or moderate, positive or negative) does not imply the presence of infrastructure can shape these indicators in a region. The predictive modeling of the equity indicators with descriptors of multiple infrastructure systems offered broad explanations of the concentrations of minority African American and Hispanic populations and the proportion of people who have health insurance. The explanatory powers of statistical models for the other indicators were weak or even non-existent for the global linear models and were found to have a poor fit. Similar to Ogneva-Himmelberger and colleagues [
25], our models had a strong correlation among racialized minorities, yet unlike their regional study based on correlations between imperviousness and indicators of social equity, our models did not have a strong correlation between wealth and grey-green infrastructure systems.
(
b)
How do proximity and access to infrastructure relate to inequities? Our results show that a higher density of imperviousness and state/inter-state road density was associated with racial inequities and lower access to health insurance. Yet, local road infrastructure had no meaningful correlation. This finding suggests that infrastructure aiming to facilitate broader regional services is instrumental in shaping residential spaces in the local neighborhoods for the most vulnerable and disadvantaged communities while becoming a disamenity. This is particularly the case given the negative health consequences of living near interstates and high-traffic roadways [
15,
16]. This finding also underscores how systemic racism shaped the history of infrastructure development in the United States with long-term consequences. Interstates were built to support suburban growth that led to white flight and urban disinvestment from the 1950s–1990s. The Interstate Highway System was constructed by demolishing established African American and low-income neighborhoods, which displaced residents and families and tore communities apart [
34]. Highway development has contributed to residential segregation, educational disparities, employment opportunities, and wealth disparities [
35,
36] (for a review, see ref. [
37]). Our results show that this road infrastructure continues to pose a burden to nearby racialized communities today.
Additionally, this study highlights how non-gray infrastructure, such as green infrastructure, may be poorly represented in models of the U-R gradient. Green and blue infrastructure systems are not fully captured by imperviousness, yet these systems are important for health and wellbeing. Our study revealed surprising results about the relationship between green infrastructure and social inequities. The percent of the tract within 1 km from a public park or green trail tended to be related to higher percentages of African American and Hispanic residents and lower access to health insurance. These results suggest that green public space access is higher in disadvantaged neighborhoods than in affluent ones, and yet this finding is seemingly in contradiction to other studies [
6,
38,
39]. However, these previous studies address inequities within cities rather than across metropolitan regions, where suburban and rural areas have greater access to private green space through yards, forests, or fields. Urban residents typically have limited private green space, and our study did not include private green spaces in our assessment of green infrastructure. Additionally, our study did not address the quality of public green spaces or how urban disinvestment leaves limited funds for park maintenance. In the case of Philadelphia and many other cities across the United States, periods of fiscal austerity have led city governments to prioritize primary services, such as police, fire protection, transportation infrastructure, and economic development over park maintenance, creating neighborhoods with poorly maintained parks that residents actively avoid [
40]. Joassart-Marcelli’s [
41] research in the Los Angeles region revealed intra-metropolitan disparities in park spending, with middle-income communities benefiting the most from state and non-profit park spending. Thus, further evaluation of inequities in green infrastructure must incorporate metrics of quality.
(
c)
Do Spatial Relationships between Equity, Wellbeing, and Infrastructure Vary across Urban and Rural Places within a Region? In the study, imperviousness served as a proxy for the U-R gradient. The global model shows a very strong correlation between imperviousness and two indicators of inequity. The results of our global model suggest that the gradient matters for inequities, reflecting the findings of Ogneva-Himmelberger and colleagues [
25,
26]. Imperviousness also reflects the density of gray infrastructure systems, further suggesting that proximity to infrastructure systems equates to accessing the benefits of these systems. Yet, our findings indicate that imperviousness conceals important intraurban and intra-metropolitan heterogeneity in the relationships between social inequity and food, green, and health infrastructure, which becomes apparent with the local GWR models. Our results also show that the inclusion of more specific types and functions of impervious materials (state, inter-state, and local roads) offers more nuance about the extent to which different types of gray infrastructure influence inequities in the region.
As the local models with GWR show no coincidence between the spatial pattern associated with imperviousness and with inequities, it can be inferred that such relationships (and therefore the concept of the gradient) is dependent on the chosen scale of the study. Here, the scale (region) and the unit of analysis (census tracts) for determining spatial relationships between indicators of inequity and infrastructure were selected based on the literature and data availability. However, the identification of the appropriate scale and unit of analysis may be improved by adopting alternative methods of spatial analysis such as Multiscale Geographic Weighted Regression (MGWR) [
42]. The different spatial patterns in each of the local models also suggest that the concept of the U-R gradient may not effectively explain the impact of different infrastructure systems on social inequities. Different concepts, such as a mosaic [
43] or networked urban, suburban, peri-urban, exurban, and rural places [
44], may better represent the impacts of infrastructure systems across regions.
This study highlights several areas for further improvement on how infrastructure shapes health, equity, and wellbeing across regions. The statistical modeling can be improved by exploring how an analysis considering variable scales and alternative conceptions about how urban and rural spaces are linked other than as a gradient influence the correlation between infrastructure, equity, and wellbeing. Additionally, our study is based on one time period. Temporal longitudinal studies may reveal the persistence or changing nature of these patterns. Further, an approach situated in an analysis of historical drivers of inequities may help to explain the current intertwined patterns of spatial and racial inequities.
5. Conclusions
This study examined how various infrastructure systems are related to equity and wellbeing across a region, with relevant findings for other geographic contexts. The models revealed the extent to which infrastructure predictors correlate with two equity indicators. These results suggest that the connections between multiple infrastructure systems should be investigated because many studies have focused on singular infrastructure systems (such as transportation, fresh water, and sanitation systems). Furthermore, the analysis shows the importance of connections between infrastructure and various dimensions of equity for sustainable development.
Further, our study demonstrates that the scale at which infrastructure systems impact communities can differ from the scale at which they aim to provide services. Our results show that a higher density of imperviousness and state/inter-state road density was associated with racial inequities and lower access to health insurance, suggesting that regional transportation infrastructure that connects and serves the region may be a disamenity for local neighborhoods. Our study also uncovered spatial variability in the relationship between equity, wellbeing, and infrastructure across urban and rural areas. The local regression models showed intraurban and intra-metropolitan heterogeneity in the relationships between social inequity and food, green, and health infrastructure. This spatial variability suggests that the concept of the urban-rural gradient does not fully convey the impacts of infrastructure systems across urban-rural systems. Further, these results show potential for examining the role of infrastructure on spatial patterns of equity and wellbeing in rapidly urbanizing regions across the world where places can be conceived as neither entirely urban nor rural. Finally, this study relied on prior studies in the region to select access to health systems as an indicator of equity and wellbeing. The identification of appropriate data indicators for equity and modeling the effect of multiple infrastructure systems at different scales is becoming especially crucial in geographies where infrastructure systems are being extensively planned and investments are being made to achieve sustainable development goals.
Our study highlights several areas for improvement in future analyses of how infrastructure shapes health, equity, and wellbeing across regions. There is a need for more research on how different types of infrastructure systems influence other indicators of inequities and wellbeing. Finally, there is a need for additional research on interconnections across infrastructure systems (e.g., how water systems relate to food systems) and how these interconnections drive or exacerbate racial, economic, and social inequities. As the spread of novel 2019 coronavirus has impacted how infrastructure systems are accessed and highlighted the impact of infrastructure legacies on the spread of disease and mortality, a study of interconnections will also be crucial to assess what future infrastructures for human activities and health must look like [
45].


