
Land Use Increases the Correlation between Tree Cover and Biomass Carbon Stocks in the Global Tropics


1
Department of Economics and Social Sciences (WiSo), Institute of Social Ecology (SEC), University of Natural Resources and Life Sciences (BOKU), Schottenfeldgasse 29, 1070 Vienna, Austria
2
International Institute of Applied Systems Analysis (IIASA), 2361 Laxenburg, Austria
*
Author to whom correspondence should be addressed.
Land 2021, 10(11), 1217; https://0-doi-org.brum.beds.ac.uk/10.3390/land10111217
Submission received: 2 October 2021
/
Revised: 28 October 2021
/
Accepted: 3 November 2021
/
Published: 10 November 2021
(This article belongs to the Special Issue Feature Papers for Land–Climate Interactions Section)
Abstract
:Tree cover (TC) and biomass carbon stocks (CS) are key parameters for characterizing vegetation and are indispensable for assessing the role of terrestrial ecosystems in the global climate system. Land use, through land cover change and land management, affects both parameters. In this study, we quantify the empirical relationship between TC and CS and demonstrate the impacts of land use by combining spatially explicit estimates of TC and CS in actual and potential vegetation (i.e., in the hypothetical absence of land use) across the global tropics (~23.4° N to 23.4° S). We find that land use strongly alters both TC and CS, with stronger effects on CS than on TC across tropical biomes, especially in tropical moist forests. In comparison to the TC-CS correlation observed in the potential vegetation (biome-level R based on tropical ecozones = 0.56–0.90), land use strongly increases this correlation (biome-level R based on tropical ecozones = 0.87–0.94) in the actual vegetation. Increased correlations are not only the effects of land cover change. We additionally identify land management impacts in closed forests, which cause CS reductions. Our large-scale assessment of the TC-CS relationship can inform upcoming remote sensing efforts to map ecosystem structure in high spatio-temporal detail and highlights the need for an explicit focus on land management impacts in the tropics.
1. Introduction
Terrestrial vegetation plays a pivotal role in the global carbon cycle by absorbing, sequestering and releasing vast amounts of carbon each year [1,2]. The modification of naturally-occurring vegetation through land use is now a major driver of global change [3].
Tree cover (TC) and biomass carbon stocks (CS) are key parameters for characterizing vegetation. Intuitively, TC and CS are spatially correlated. The relationship between these two parameters can be considered as a function of environmental conditions and stand age: an initial linear relationship as a tree-bearing stand grows, followed by a saturation of TC while biomass accumulation continues over time, such that a given stand with high TC can be associated with a range of biomass stocks [4,5,6,7]. Therefore, we hypothesize that in closed forests, the correlation between TC and CS is poor, while in open forests and other wooded lands, the correlation is stronger.
However, land use, both through land cover change (for example, through deforestation) and land management (i.e., the modification of ecosystem parameters without changing the land cover type, such as through forestry or livestock grazing in natural grasslands [8]), impacts both TC and CS to varying degrees, and consequently, may influence the TC-CS relationship [9,10].
Here, we systematically explore the TC-CS relationship in the global tropics and identify the impacts of land use on this relationship. Such an understanding is important for two reasons.
First, upcoming remote sensing-based missions like BIOMASS [11,12], GEDI [13] and NISAR [14] are expected to map TC and CS and their changes over time in unprecedented spatio-temporal detail. However, because of the very nature of remote sensing, the anticipated datasets will capture the combined effects of land use and natural drivers on these parameters. Attribution of identified changes to respective drivers is not straightforward and requires additional information from plot-level studies as well as regional insights. Highly aggregated analyses that isolate and quantify the role of land use on both TC and CS could help in the robust interpretation of the considerable amount of data that these missions will generate.
Second, existing studies often utilize TC information as a surrogate to conclude on CS dynamics when evaluating contemporary carbon fluxes from land use change and their interrelation with the provision of biomass products [15]. Studies either assume a consistent and homogeneous relationship between TC and CS based on average stocking densities [16,17,18] or explore forest area changes (closely related to TC, but not identical [19]) as surrogates for assessing the carbon emissions from biomass consumption [20,21]. An empirical assessment of the TC-CS relationship can inform these studies and increase the reliability of such assessments.
Improving the understanding of land use impacts on TC and CS is particularly important in the tropics. The pivotal role of the tropical region in the global carbon cycle is well-known: tropical forests store almost two-thirds of the total biomass of all terrestrial biomes [22] and are currently undergoing unprecedented rates of land use changes [9]. While in temperate and boreal regions, data on CS can usually be derived from statistical data, for example, from forest inventories, and uncertainties can be narrowed by triangulating spatial information from remote sensing, census statistics and ground-based inventories [23,24], this is not currently possible for large parts of the tropics [25]. In these regions, large data gaps prevail and the paucity of ground-truthed information [6,26,27] represents a formidable scientific challenge. Ensuing, in the tropics easily accessible datasets, such as remotely-sensed TC information from land use/land cover assessments, will continue to play a key role for quantifying land use-induced carbon fluxes or restoration potentials.
In this study, we quantify the empirical relationship between TC and CS and isolate the impacts of land use (through land cover change and land management) by comparing the actually-observed vegetation, which is co-determined by existing land use and the natural environment, with the ‘potential vegetation’, i.e., the vegetation that would prevail in the absence of land use but under current climatic conditions. The construct of the potential vegetation originates back to vegetation-ecological principles formulated in the 1950s [26]. A similar potential-actual comparison approach has previously proven useful to determine the impacts of land use on ecosystem production [27] and biomass turnover [28] at the global scale. Only recently, data for the potential as well as actual vegetation, related to carbon stocks [10] as well as tree cover [18,29,30] have become available, enabling for the first time such an approach for analyzing the TC-CS relationship at large spatial scales.
We aim to answer the following questions:
- (1)
- What is the impact of land use on TC and CS in the tropics? Is the impact similar, or different, for TC and CS?
- (2)
- How are TC and CS spatially correlated in the potential and actual vegetation?
- (3)
- How does land use affect the correlation between actual TC and CS in different tropical biomes?
To answer these questions, we compiled information from existing pantropical spatially-explicit datasets for the year 2000. More recent data for TC as well as CS have become available in the recent past at the regional [31,32] as well as at the global level [33]. However, the year 2000 represents a point in time for which the full coverage required for a potential-actual vegetation comparison is available. This enables us to systematically explore the spatial variation of the TC-CS relationship in the tropics and the impacts of land use, even though our analysis remains limited to the reference year 2000. We discuss our findings in the context of upcoming high-resolution ecosystem monitoring missions as well as existing efforts to map tropical ecosystem structure and carbon fluxes.
2. Materials and Methods
2.1. Input Maps and Uncertainty Analysis
We compiled four sets of maps for this study: one potential and two actual tree cover (TC) maps as well as five potential and five actual biomass carbon stocks (CS) maps, including both aboveground and belowground biomass. All maps refer to the year 2000, cover the tropical extent (~23.4° N to 23.4° S) and were scaled to a common spatial resolution of 5 arc minutes where required. Our analysis is not restricted to forests but encompasses all terrestrial ecosystems in the tropics. Thus, our results are independent from forest area classifications [34] and refer to the complete pantropical region.
For potential TC, we used the only available source [18], a recent machine learning-based map developed by using reference forest cover plots to extrapolate potential TC under similar environmental conditions globally. This global map was originally available at a resolution of 30 arc seconds (approx. 1 km) and was scaled to the spatial resolution of 5 arc minutes using bilinear interpolation to enable comparison with the CS datasets (see below).
The input datasets for the actual TC were the global wall-to-wall datasets derived from land use/land cover assessments using Landsat imageries [29] and using harmonized multiple satellite sensors [30]. These datasets of global actual TC extents are available at 30 m and 0.05° (approximately 5 km at the equator) spatial resolution, respectively. These maps were scaled to the spatial resolution of 5 arc minutes using bilinear interpolation.
The following five potential CS maps from previous literature were used. Three estimates were taken from a study on land use impacts on global ecosystems (potential CS maps 1, 2 and 5 from [10]). These maps were constructed by allocating typical CS densities from the literature [35] or from remote sensing assessments [36,37] to ecozones resulting from the intersection of three biome maps [38,39,40]. This spatial resolution is used in the analysis of the potential and actual TC-CS relationship (see Section 2.2). Thus, while the three potential CS maps are available at a spatial resolution of 5 arc minutes, the spatial resolution adequate for the analysis of the TC-CS relationship are the ecozones delineated by the intersect of these three biome maps.
For the first two potential CS maps, data on potential landscape-level CS densities from the IPCC [35] were assigned to each ecozone separately for each world region. These two potential CS maps were consistently matched with actual CS maps from the FAO [41] or from a study on global forest carbon fluxes [42], respectively, assuming potential CS to be always identical or larger than actual CS.
The third map considered the ecozones delineated by the intersection of the three biome maps as a starting point and used information from two remote sensing assessments [36,37] to define potential CS values for each ecozone. This potential CS map assumed that remnants of potential vegetation still exist in each ecozone and considered the 95th percentile of the actual CS values in that ecozone from these two remote sensing assessments as the potential CS for that ecozone (for more details see [10]).
Two further independent potential CS maps were used: a vegetation-accounting based map developed from landscape-level averages [43] available at a spatial resolution of 5 arc minutes and a vegetation-model based assessment available at a spatial resolution of 0.5° [44]. The latter map was resampled to match the common 5-min spatial resolution.
Five actual CS datasets were used for the study. Four of them were based on [10] and available at 5-min spatial resolution: two building upon existing remote sensing datasets of CS based on land use/land cover assessments [36,37] and two based on forest inventories [41,42] downscaled from the national level to the grid with information on tree height [45]. The fifth actual CS map was taken from the literature [46]. A description of input datasets is also provided in Tables S1 and S2.
In case of actual CS and potential CS, for which multiple datasets were available, we calculated the pixel-based median, thus developing ‘median maps’. Such a ‘median-map’ was also calculated for actual TC, but since in this case only two datasets were available, the pixel-based median is equal to the mean in this case. Only one map of potential TC was available and was considered as it is.
As a measure of uncertainty for actual TC, actual CS and potential CS, we calculated the coefficient of variation of the resulting maps.
For the potential TC dataset, where only one input map was available, we compared potential TC with actual TC in well-defined ‘wilderness’ areas devoid of land use to detect biases that would affect our findings and interpretations. By definition, in wilderness areas, actual TC corresponds with potential TC [10]. To delineate wilderness areas, we used the intact forests map [47] and a recent human footprint map [48]. We considered as wilderness all individual pixels that were both designated as ‘intact’ and with a human footprint score of zero (implying absence of any human activity). We compared the potential TC and actual TC datasets in wilderness areas at the biome level.
2.2. Spatial Analysis of the TC-CS Relationship
We investigated TC and CS in the potential and actual vegetation in 8 tropical biomes—Moist Forests, Dry Forests, Grasslands and Savannas, Montane Grasslands and Shrublands, Flooded Grasslands and Savannas, Deserts, Mangroves, and Coniferous Forests [40].
To isolate land use impacts, we compared potential and actual TC and CS in absolute terms and quantified the ratio of CS and TC (hereafter, the CS/TC Ratio) in their respective potential (hereafter, the Potential CS/TC Ratio) and actual (hereafter, the Actual CS/TC Ratio) vegetation states. We then investigated the extent to which the CS/TC Ratio differed between potential and actual vegetation in each tropical biome. We calculated the ratio of the Actual CS/TC Ratio and the Potential CS/TC Ratio, and called it the CS/TC Ratio of Ratios to identify which parameter, CS or TC, was affected more by land use in these tropical biomes.
Further, we calculated Pearson correlations between TC and CS at the tropical biome level based on the smallest common spatial unit with unique TC and CS values within each biome across all maps. In our case, the smallest common spatial unit for comparing the TC-CS correlations in the potential and actual vegetation were the ecozones resulting from the intersection of the three biome maps described earlier [38,39,40], which was used in the potential CS datasets in [10] to assign landscape-level CS densities. We excluded ecozones where the number of individual pixels covered by the intersection at the 5-min spatial resolution was less than 10 (n < 10) and selected 494 tropical ecozones for further analysis.
To investigate the impacts of land management on CS in dense tree-bearing regions, we calculated the potential and actual CS densities only for individual pixels where the actual TC > 90%.
3. Results
3.1. Spatial Variation in TC and CS
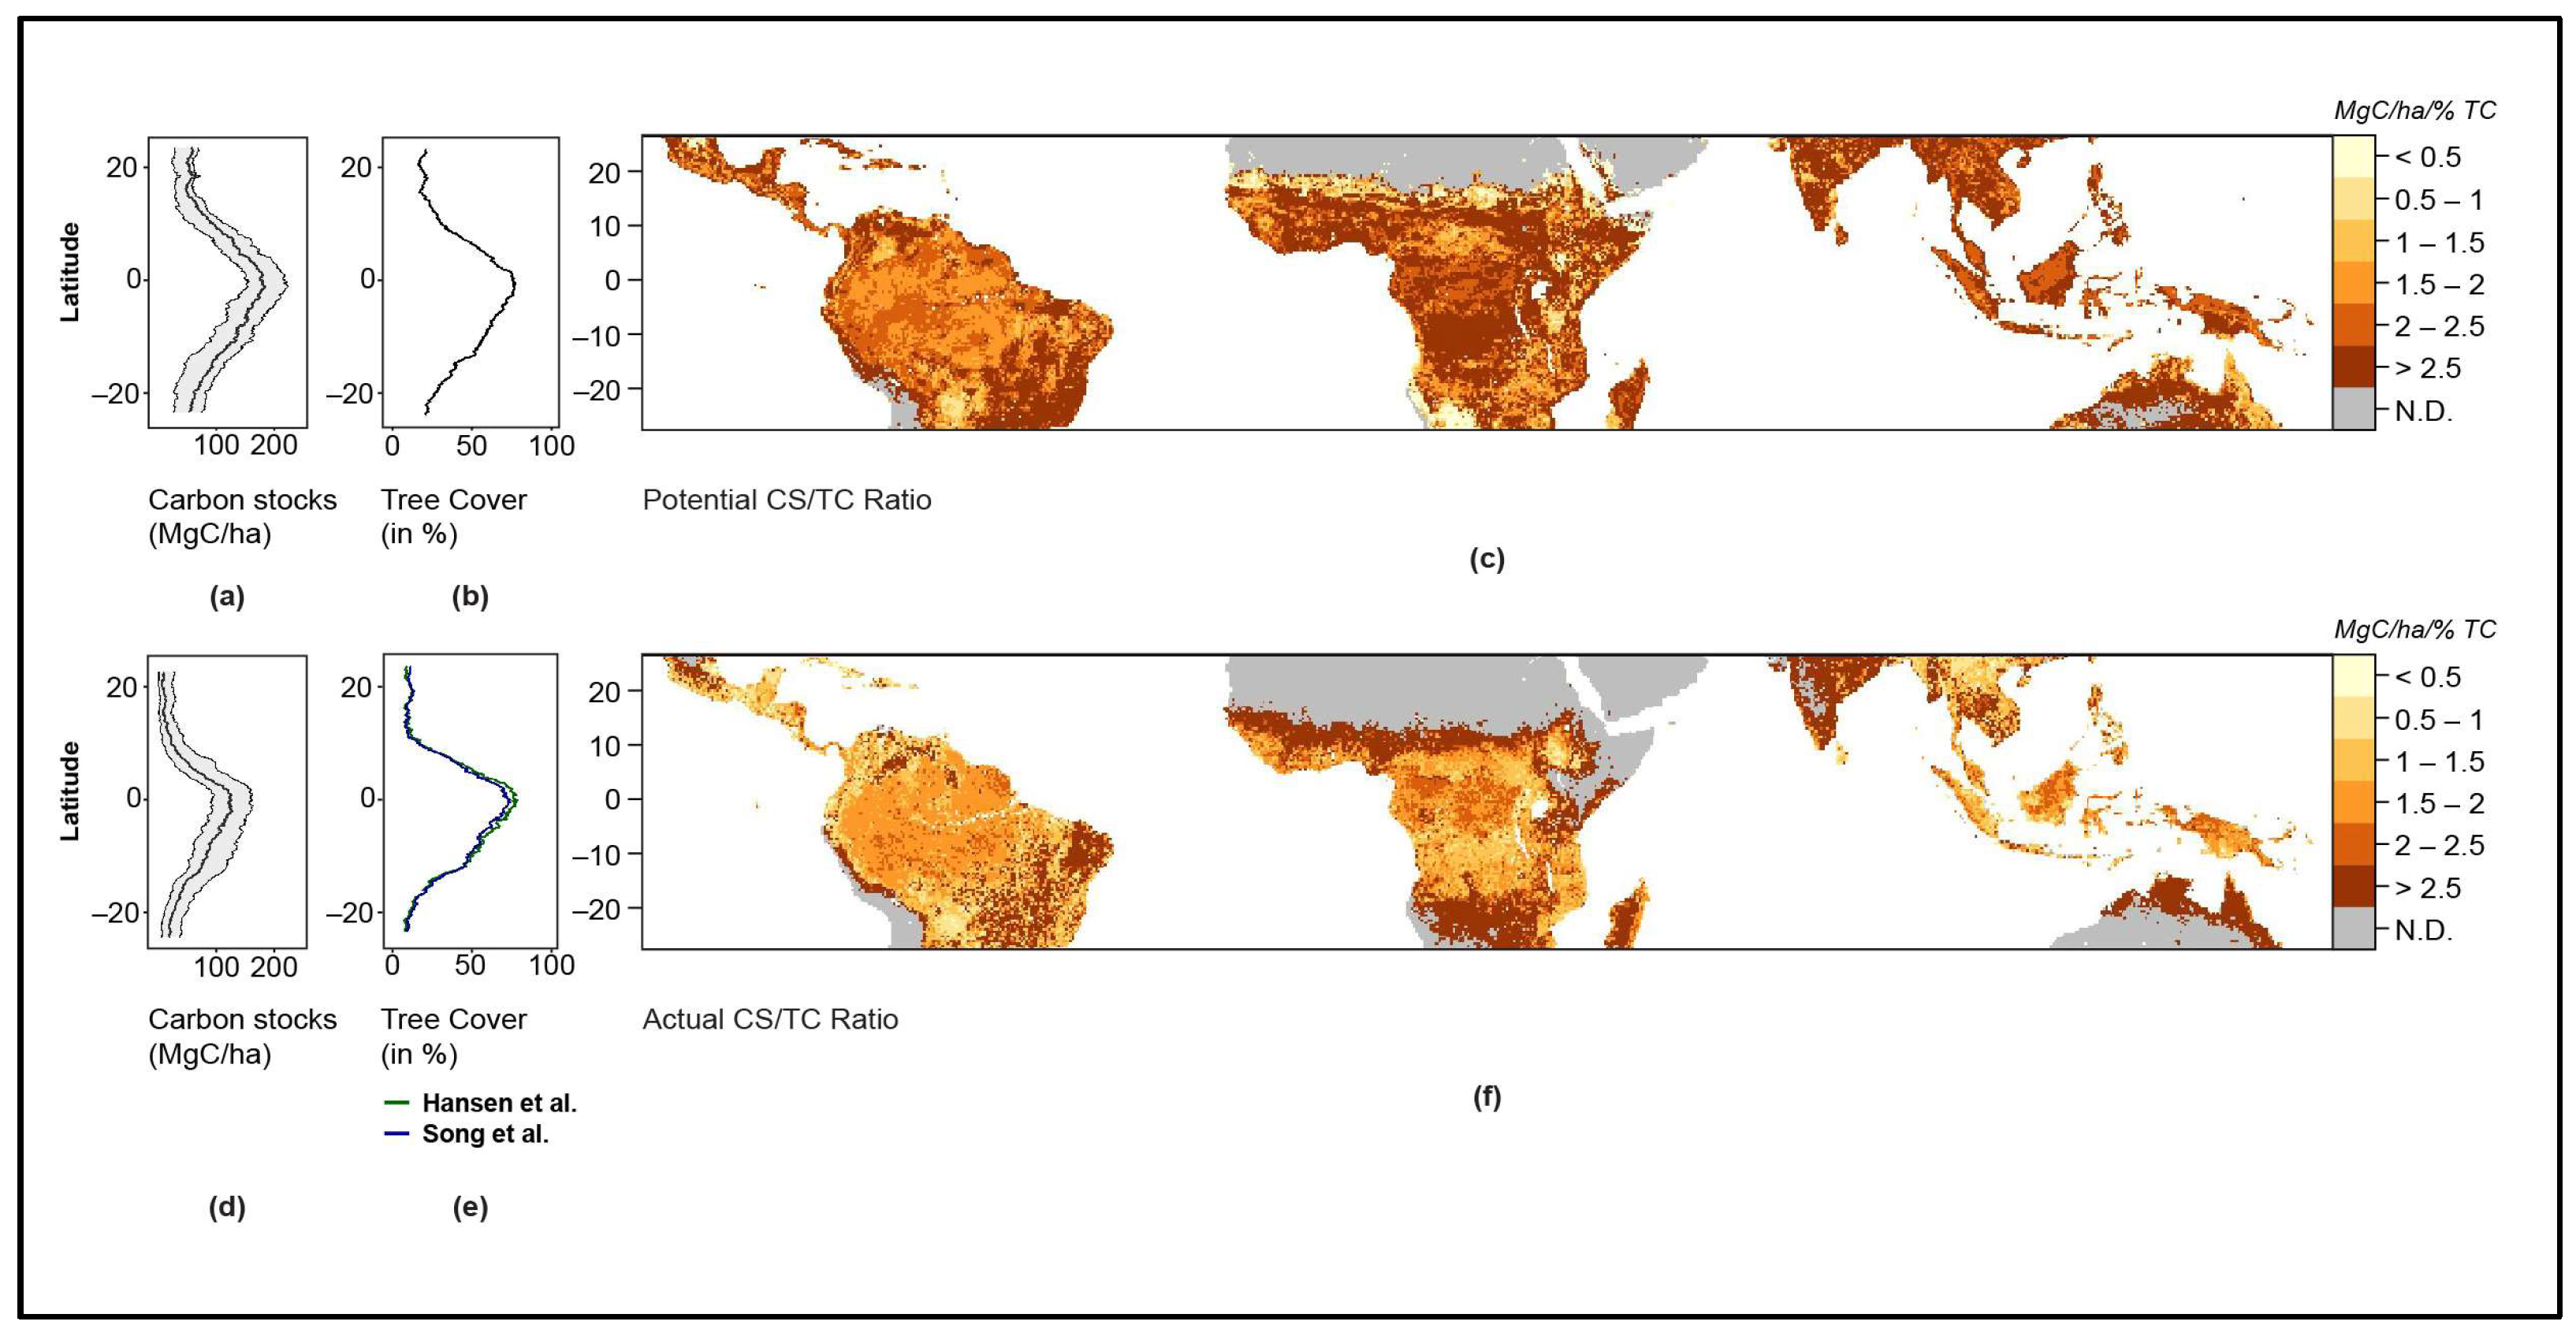
TC and CS display distinct geographic patterns in both potential and actual vegetation (Figure 1). TC and CS latitudinal profiles are characterized by troughs in Dry Forests and Grasslands and peaks in Moist Forests across Amazonia, Central Africa and South-East Asia.
CS in the potential vegetation is 102 MgC/ha on average and 57.2 MgC/ha in the actual vegetation (43.9% lower). Highest latitudinal averages of CS are 183.9 MgC/ha in the potential vegetation and 133.1 MgC/ha in the actual vegetation. Lowest latitudinal averages of CS are 47.8 MgC/ha in the potential vegetation and 13.0 MgC/ha in the actual vegetation (Figure 1a,d).
TC on average over the tropics is 41.3% in the potential and 32.3% in the actual vegetation (a reduction by 21.7%). In the Grasslands and Savannas biome, TC is on average 28.2% in the potential vegetation and 16.3% in the actual vegetation. Moist Forests show average TC values of 75.4% in the potential and 68.3% in the actual vegetation (Figure 1b,e).
The CS/TC Ratio for both the potential and actual vegetation, respectively, as well show distinct spatial patterns across the tropics. We find that in the potential vegetation, the CS/TC Ratio is relatively similar across large regions of equatorial Africa and Asia while it remains relatively lower in South America (Figure 1c). In comparison, the CS/TC Ratio in the actual vegetation is highest in Grasslands, while comparably lower values are found in Moist Forests (Figure 1f). In particular, we find that Moist Forests across the tropics show strongly altered patterns in the actual vegetation in comparison to the potential vegetation.
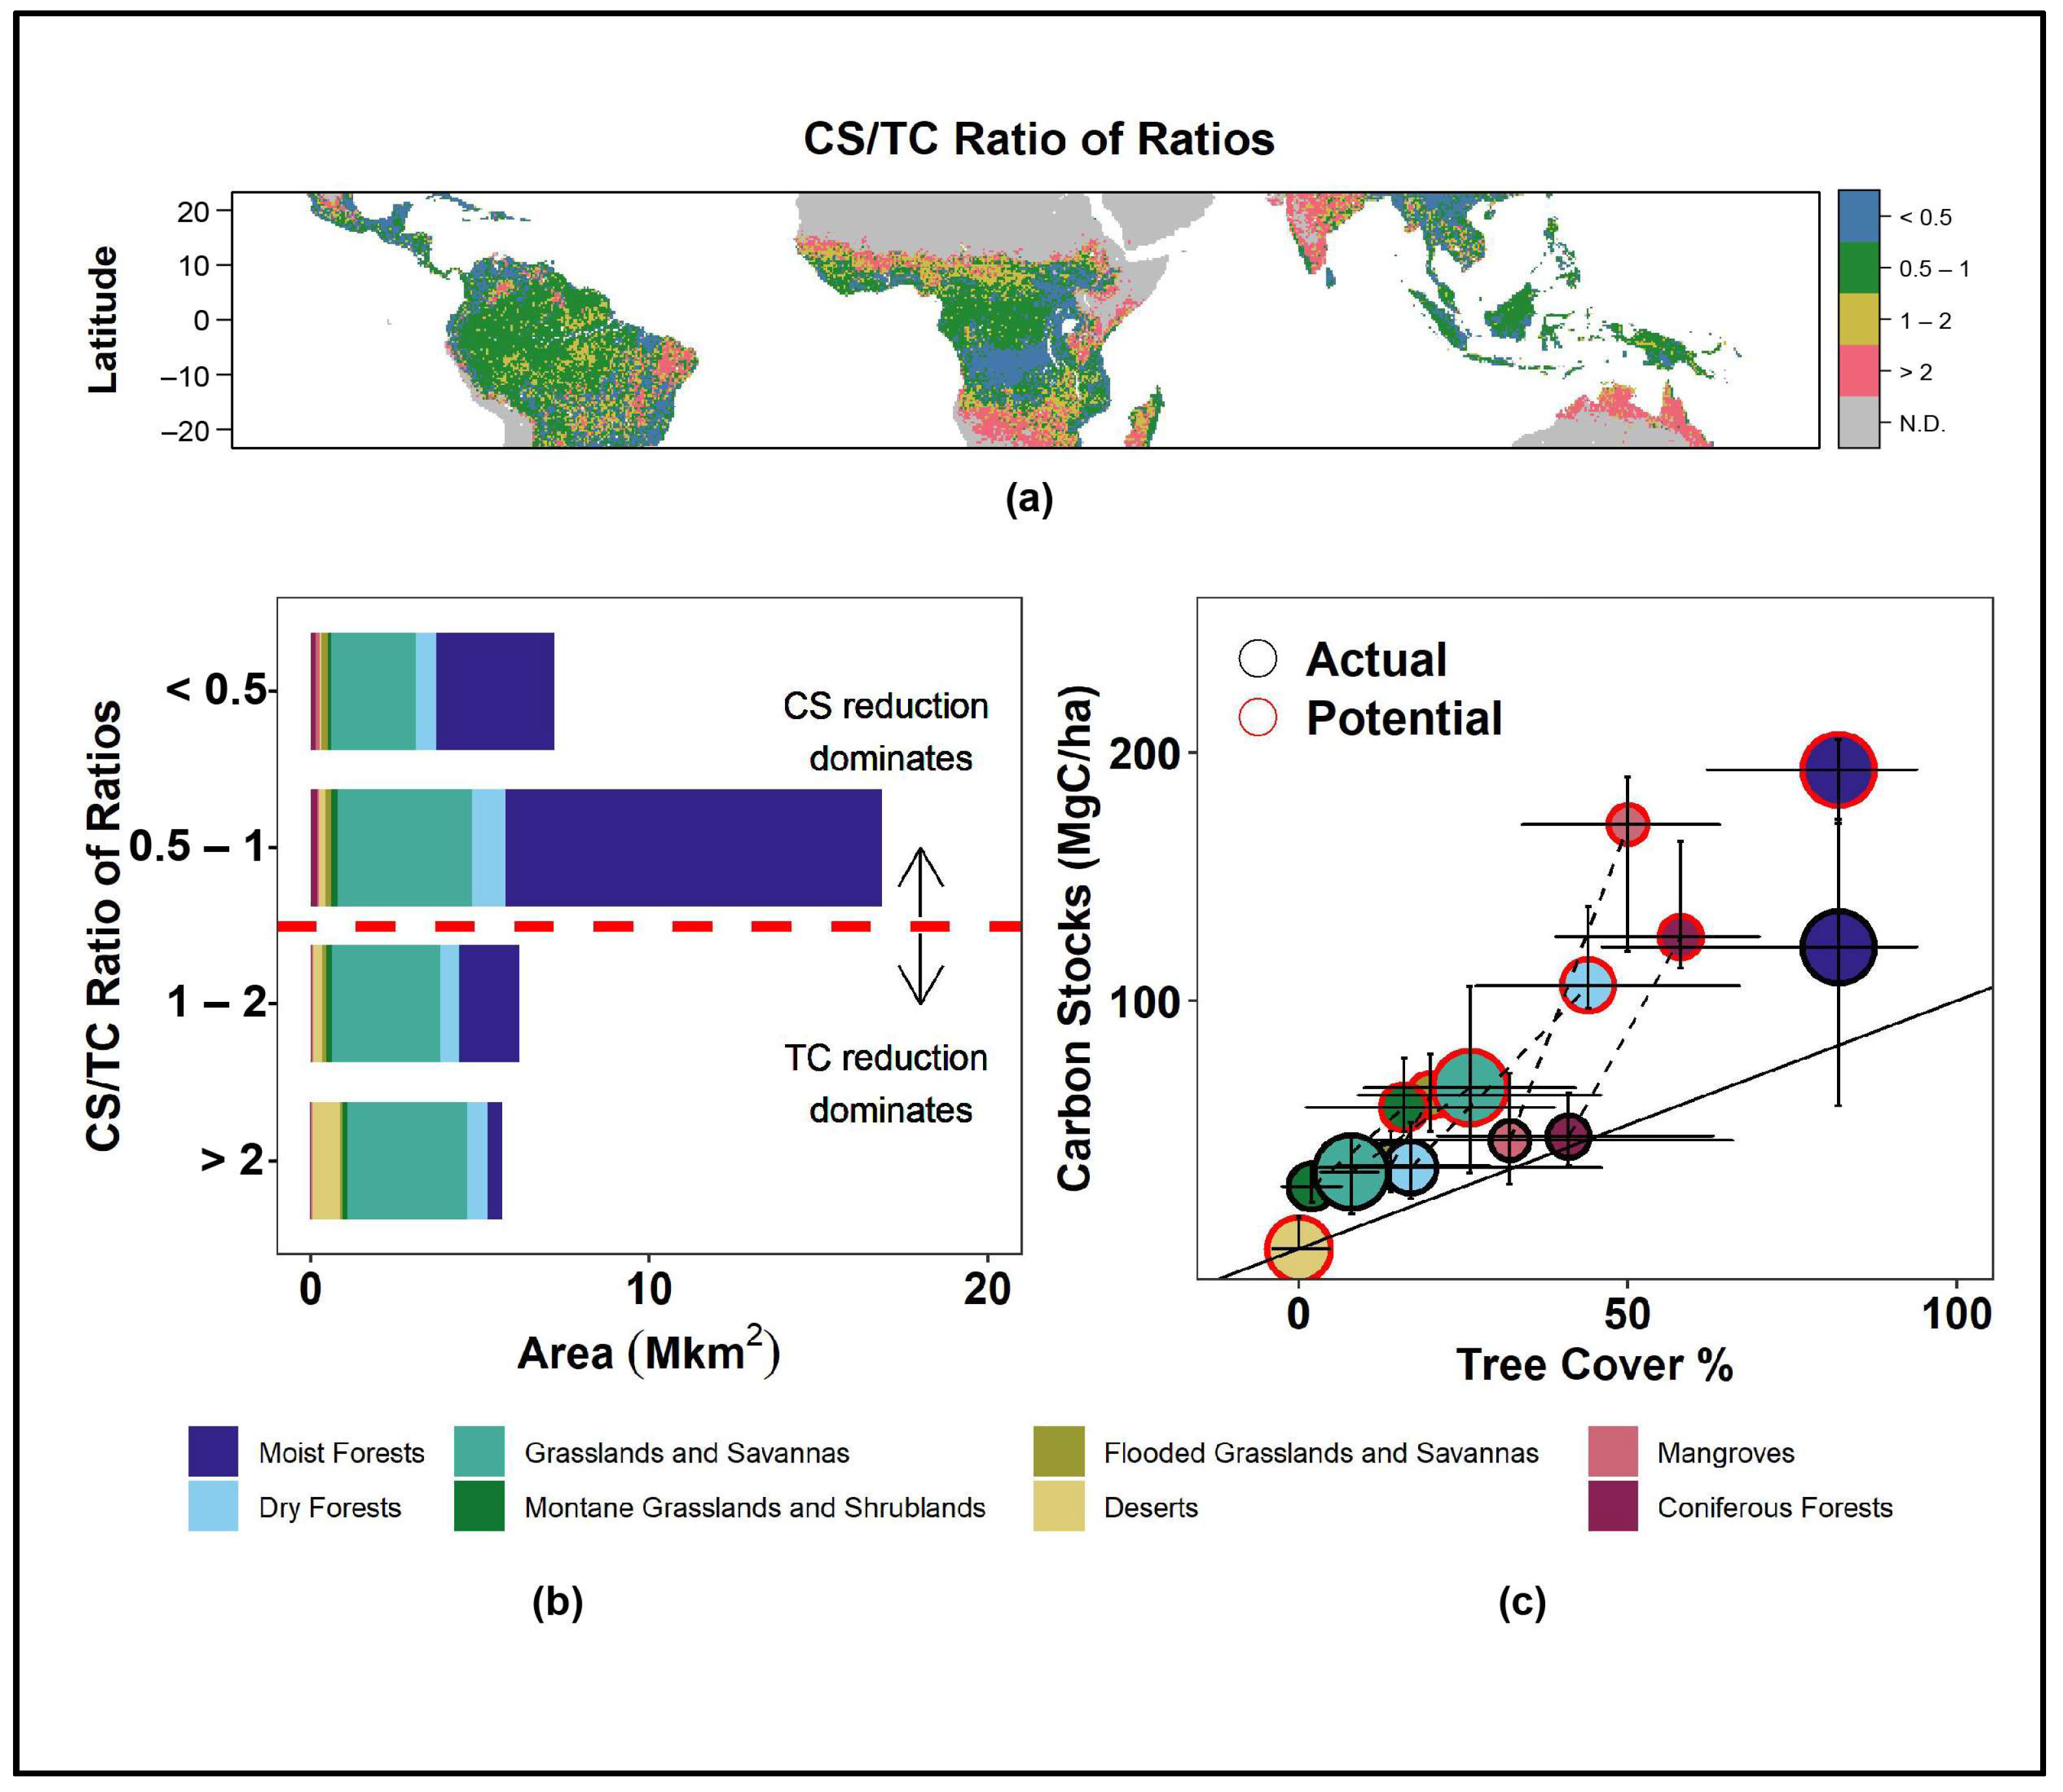
We find a stronger land use-induced effect on CS than on TC in 67% of the global tropics (CS/TC Ratio of Ratios < 1). This effect dominates the Moist Forests biome. In Dry Forests and Grasslands, we observe a dominance of areas where TC is more strongly affected than TC (CS/TC Ratio of Ratios > 1), balancing the overall relative impacts of land use on TC and CS (Figure 2a,b). However, uncertainties in the regions with higher impacts on TC than on CS are particularly large (Figure S1).
The aggregate effects at the biome level are in line with this finding: the impact of land use on CS is pronounced in all biomes (a decrease in more than 35% for all biomes except Deserts), while the impact on TC shows a large variation. In the Moist Forest biome, we find that CS show a reduction of 70 MgC/ha, while TC is not reduced (Figure 2c). In the Coniferous Forests and Mangroves biomes, land use-induced differences in CS between the potential and actual vegetation are even larger (the differences in median between potential CS and actual CS of 80 and 127 MgC/ha, respectively).
The impacts of land use on TC are particularly pronounced in the Grasslands biome. In this biome, we observe a reduction of more than 65% on average. In contrast to CS, the inner quartiles of both potential and actual TC for several biomes largely overlap. Thus, a clear separation of land use-induced impacts on TC remains harder to interpret in this biome.
We find that variabilities in the actual TC datasets are particularly pronounced in the Dry Forests and Grasslands biomes in Asia and South America (Figure S1). Furthermore, a bias in the potential TC database, for which only one input dataset was available, may influence our results. Such concerns have previously been raised in the literature [49]. Thus, in Figure 3 we show a comparison of the potential TC with actual TC on areas devoid of land use, i.e., wilderness areas. We find broad agreement between the potential and actual TC datasets in these regions (see insert in Figure 3 for regions identified as wilderness areas). The biome-averaged potential TC of humid biomes, such as Moist Forests and Flooded Grasslands, falls well within the range of the actual TC maps and is close to their means (difference between means < 2.5%). In Dry Forests and Grasslands, we find that the mean of the potential TC is higher than the means of the respective actual TC maps. In these biomes, the standard deviation of the potential TC map is smaller than for the actual TC maps and falls within their distributions. This can be interpreted as a slight bias of the potential TC map towards the higher end and indicates that land use-induced differences in TC may be lower than observed in these biomes.
3.2. Correlations between TC and CS across Biomes
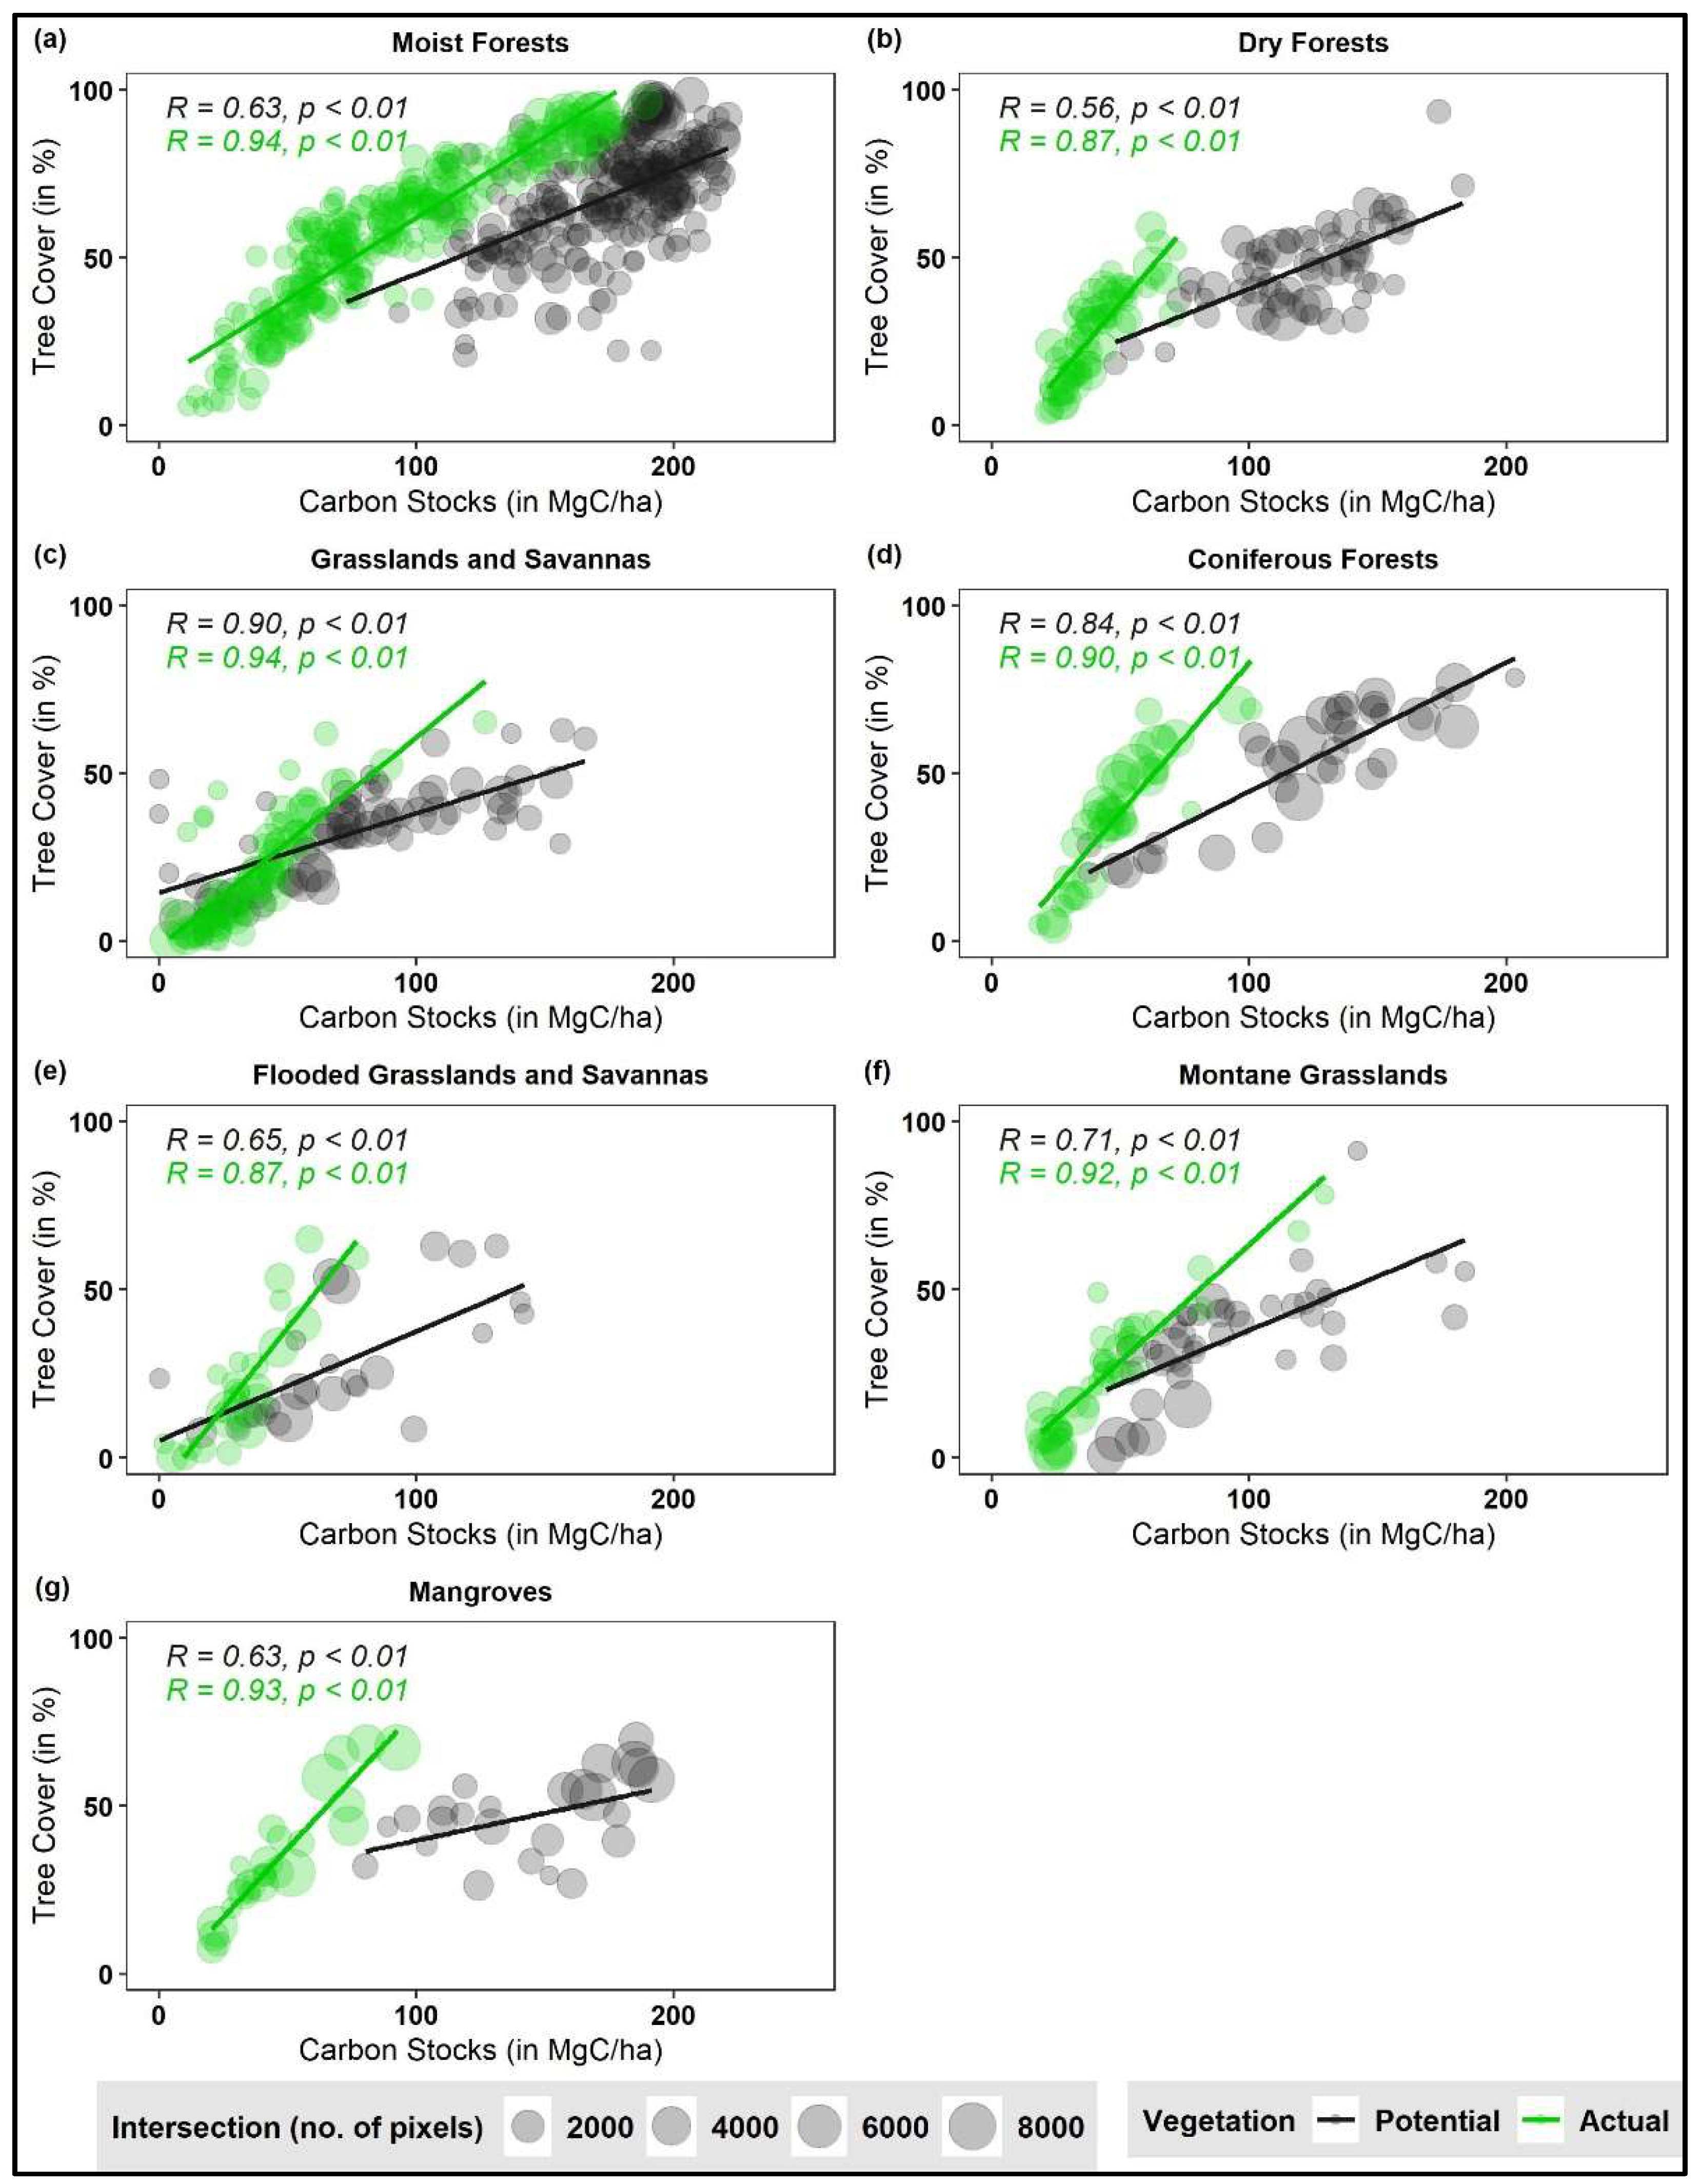
We find consistently higher biome-level correlations between TC and CS based on ecozone values in the actual vegetation (biome-level R based on tropical ecozones = 0.87–0.94, p < 0.01) than in the potential vegetation (biome-level R based on tropical ecozones = 0.56–0.90, p < 0.01) (Figure 4). The difference in the observed correlations between the actual and potential vegetation ranges between a factor of 1.04, for the Grasslands biome, to a factor 1.55, for the Dry Forests biome.
For the same TC densities, CS are systematically lower in the actual vegetation than the potential vegetation for all biomes. We find that this difference increases with increasing TC densities (see slopes for potential vegetation and actual vegetation in Figure 4). We observe a similarly high biome-level correlation based on individual pixel values between TC and CS in the actual vegetation (Figure S2).
4. Discussion
4.1. Major Findings and Underlying Mechanisms
Our pantropical analysis reveals that on average, CS are affected more strongly by land use than TC in the global tropics. We find that the reduction in actual CS is 43.9% as compared to potential CS. This reduction is complementary to a TC reduction of 21.7%. Consequently, the CS/TC Ratio is lowered in overall terms in the actual vegetation as compared to the potential vegetation. We find pronounced heterogeneities in the spatial distribution of the potential versus actual CS/TC Ratio (Figure 1 and Figure 2b).
The overall pantropical effect is dominated by the Moist Forest biome, where land use affects CS much more strongly than TC (Figure 2b,c). Our finding is in line with recent evidence which has found widespread impacts of forest degradation over the last 3 decades [50]. Forest degradation, in the form of selective harvesting of individual trees to spur shifts towards shorter-statured and younger stands [51], and other smaller-scale disturbances in tree canopies are likely to result in disproportionate impacts on CS as compared to TC.
The observed higher land use-induced impacts on CS can also potentially be explained by forest recovery and regrowth. In such regions, crown closure is reached relatively soon after (natural or human) disturbance [50], while biomass carbon accumulation is relatively slower. A quick recovery from disturbance of the understory and short-statured trees (with low tree heights, and thus exhibiting a comparatively lower recovery of CS identified from space [45]) in tropical forests has already been described in the literature [52,53]. Based on our findings, deducing land use impacts from TC information in these biomes would likely underestimate the impact of land use on biomass stocks.
In the Grasslands biome however, we find some indications of a higher land use-induced impact on TC than on CS (Figure 2b,c). In these sparse tree-bearing regions, natural and anthropogenic disturbances disproportionately impact TC. An explanation could be, potentially, that vegetation units with low biomass carbon but high tree cover, are affected at disproportionally high rates, or conversely, that land management has resulted in increased CS in these regions. It cannot be ruled out, however, that our finding is, at least partly, an artifact of the input data and individual pixel-level variabilities.
We find large pixel-level uncertainties in actual TC in some sparse tree-bearing biomes (Figure S1). Spatial products are known to underestimate actual TC extents in dry biomes because of environmental and phylogenetic variabilities as well as satellite-based sensor capabilities [6,54,55,56]. Indeed, analyses conducted at very high spatial resolutions have identified a higher extent of tree-covered areas in dry biomes than previously known [56,57].
On the other hand, we find a potential over-estimation of potential TC in the Dry Forests and Grasslands biomes, which would undercut the land use-induced increase in the CS/TC Ratio observed in these biomes (Figure 3). Such an overestimate of the potential tree-bearing capacities in these biomes has also been suggested previously [49]. Thus, our finding of stronger impacts of land use on TC than on CS in these biomes can partly be explained by a bias in the potential TC dataset. Future research aimed at improving TC and CS datasets for arid ecosystems, as well as the mechanistic understanding of land use impacts on ecosystem properties, is warranted in this context [58,59].
We find a stronger correlation between TC and CS in the actual vegetation in comparison to the potential vegetation for all tropical biomes (Figure 4). This increased correlation in the actual vegetation can be driven by land use-induced changes in land cover. Such land conversions eliminate both TC and CS. At large spatial scales, this results in the emergence of a stronger linear correlation between TC and CS, particularly in regions with high TC.
The fact that in the case of Grasslands the increase in correlation in the actual vegetation is relatively modest (Figure 4c) corroborates this hypothesis. Indeed, in sparse tree-bearing areas already undisturbed stands show relatively high correlations between TC and CS, which is then further impacted by land use.
The systematic decrease in actual CS compared to potential CS in all biomes, even at similar TC densities, also reflect the impacts of land management. Management of forests and grazing lands has been previously described as a key covariate for CS losses [10]. If land management-induced changes in CS occur without proportional reductions in TC, in line with what we observe, the wide range of CS values at a narrow range of TC extents would be narrowed, inducing an increase in the correlation between CS and TC in the actual vegetation.
Indeed, we find CS densities in actual vegetation are lower than in potential vegetation even in pixels with dense tree cover (>90%) (Figure 5). This implies that land management also plays an important role in the improved correlation observed between TC and CS in the actual vegetation. However, the heterogeneity within biomes is remarkable. Future research is, thus, required to narrow uncertainties and quantitatively attribute the land use-induced changes in the CS/TC Ratio we observed to either land cover changes or land management.
4.2. Implications for Measuring Carbon Stocks and Fluxes
The two main findings of our study, the differential impacts of land use on TC and CS, and the strong correlations between TC and CS in the actual vegetation across tropical biomes are directly relevant for current as well as future initiatives on mapping terrestrial ecosystems.
While, in principle, the correlation of CS and TC in the actual vegetation suggests TC to be a valid proxy for CS, some caveats are warranted. The spatial heterogeneity in the TC-CS relationship is large, both at the pixel level and at the biome level. Furthermore, recent attempts to quantify and map changes in tropical TC and CS [60,61], revealed strong land use impacts on CS, while high-resolution spatial analyses have shown that large areas with substantial CS losses are not co-located with large-scale forest disturbances [62].
In this context, our finding of a higher land use-induced impact on CS implies that inferring carbon fluxes from TC changes may likely underestimate the impacts of land use on CS. We find that land use impacts on CS occur not only in the form of land cover change, but also in the form of land management changes in closed forests, where small-scale forest degradation may persist. This highlights the need for an improved knowledge of the role of land use in impacting TC and CS, as well as the need for approaches that go beyond quantifying TC dynamics for inferring tropical carbon fluxes.
Our findings relate to the year 2000 for the actual vegetation. However, because the difference in observed correlations between TC and CS in the potential and actual vegetation is large, we conclude that our findings are not an artifact of the choice of year considered for the actual vegetation. Future research with recent datasets on actual TC and CS can reveal how current land use trajectories have impacted the observed correlations in the 21st century and whether observed differences are growing or levelling off, thus yielding deeper insights into the underlying mechanisms of this phenomenon.
Our results are particularly relevant for upcoming ecosystem monitoring missions like BIOMASS [11,12], GEDI [13] and NISAR [14]. These missions are expected to revolutionize the analysis of ecosystem structure and function by undertaking repeated CS measurements at a very high spatial resolution, dramatically reducing critical knowledge gaps related to the spatial variation in carbon fluxes [63]. However, satellite-based data collection can only yield snapshots of current surface properties that are, in many cases, a mosaic of many ecosystems as well as the combined effects of land use and natural drivers. Our results suggest that next to differences in site conditions [64] influencing parameters such as stem mortality rates [65], information on land use and its impact on the TC-CS relationship are important to consider. While high-resolution sensors can depict the impact of land cover changes on these two parameters, remote sensing-based assessments of land management impacts are much less straightforward [8,66]. Improving the representation of management impacts requires auxiliary information to be gathered at the site level. Key parameters are, for example, the distinction between natural and plantation systems, a clear representation of forest management regimes or practices such as shifting cultivation [67], selective logging [68] and livestock grazing [69]. In addition, the missions may encounter challenges in characterizing the diversity of CS values even for similar TC profiles. Here, our findings on the differential impacts of land management on CS estimates in closed forests remain particularly relevant to calibrate upcoming remote sensing assessments [6].
Lastly, some tropical countries are said to have undergone a ‘forest transition’ recently, marked by net reforestation after years of net deforestation [70,71]. In identifying these transitions, questions around the ecological quality of regrowing forests, in terms of changes in CS and biodiversity richness as well as other characteristics of forest change (for example, the role of secondary succession [72]) are often not adequately represented [73,74,75]. While we find a strong TC-CS relationship in the actual vegetation in the tropics, our analysis cannot distinguish between natural forests and plantations. Such a qualitative understanding of land cover is key to characterize ecosystem structure, as our findings of land management impacts in dense tree-bearing areas suggest. Future research should account for the complexities in the relationship between land use, tree cover and target ecological parameters, which would enable a more comprehensive understanding of ecosystem recovery and restoration [76].
5. Conclusions
Using evidence from existing data products, our analysis extends the investigation of the TC-CS relationship to the global tropics. Our findings provide empirical evidence of the landscape-level TC-CS relationship across tropical biomes and describe the impacts of land use on the relationship. We show that land use affects CS and TC differently. While robust evidence indicates that, in humid biomes, CS are affected more strongly than TC, the opposite is found for Grasslands, albeit with much larger uncertainties. We show that land cover change and land management collectively improve the correlation between TC and CS, which ranges from 0.56 to 0.90 in the potential and 0.87 to 0.94 in the actual vegetation for tropical ecozones. We conclude that a sole observational focus on TC is not sufficient to infer information on carbon stocks and fluxes, and that land use information, especially on the diversity of land management practices that currently exist in the tropics, remains fundamental to characterize the state of, and changes in, tropical ecosystems.
Supplementary Materials
The following are available online at https://0-www-mdpi-com.brum.beds.ac.uk/article/10.3390/land10111217/s1, Figure S1: Uncertainty of potential CS, actual CS and actual TC, expressed as the coefficient of variation. Figure S2: Tree cover (TC)—biomass carbon stocks (CS) correlations at the individual pixel level across tropical biomes for actual vegetation. Table S1: Actual tree cover and biomass carbon stocks datasets used in the study. Table S2: Potential tree cover and biomass carbon stocks datasets used in the study.
Author Contributions
Conceptualization, M.B., S.G. and K.-H.E.; formal analysis, M.B., S.G., S.M., S.F. and K.-H.E.; funding acquisition, S.G. and K.-H.E.; methodology, M.B. and K.-H.E.; project administration, S.G. and K.-H.E.; supervision, S.G. and K.-H.E.; writing—original draft, M.B.; writing—review & editing, M.B., S.G., S.M., S.F., K.-H.E. All authors have read and agreed to the published version of the manuscript.
Funding
This work was supported by the Deutsche Forschungsgemeinschaft (DFG, German Research Foundation; Project number KA 4815/1-1) and the European Research Council (ERC) for the Starting Grant HEFT (Grant Agreement No 757995). A part of the research was conducted in the Young Scientists Summer Programme (YSSP) at the International Institute for Applied Systems Analysis in Laxenburg (Austria) with financial support from the Austrian National Member Organization (NMO).
Institutional Review Board Statement
Not applicable.
Informed Consent Statement
Not applicable.
Data Availability Statement
Supporting datasets of potential and actual biomass carbon stocks and tree cover are available online at 10.5281/zenodo.5545603.
Acknowledgments
The authors would like to thank Navin Ramankutty for helpful comments to an earlier version of the manuscript.
Conflicts of Interest
The authors declare no conflict of interest.
References
- Houghton, R.A.; Nassikas, A.A. Global and Regional Fluxes of Carbon from Land Use and Land Cover Change 1850-2015: Carbon Emissions From Land Use. Glob. Biogeochem. Cycles 2017, 31, 456–472. [Google Scholar] [CrossRef]
- IPCC. Climate Change and Land: Summary for Policymakers; Intergovernmental Panel on Climate Change: Geneva, Switzerland, 2019. [Google Scholar]
- Arneth, A.; Denton, F.; Fahmuddin, A.; Elbehri, A.; Erb, K.H.; Elasha, B.O.; Rahimi, M.; Rounsevell, M.; Spence, A.; Valentini, R. Framing and context. In IPCC, 2019: Climate Change and Land: An IPCC Special Report on Climate Change, Desertification, Land Degradation, Sustainable Land Management, Food Security, and Greenhouse Gas Fluxes in Terrestrial Ecosystems; Shukla, P.R., Skea, J., Calvo Buendia, E., Masson-Delmotte, V., Pörtner, H.-O., Roberts, D.C., Zhai, P., Slade, R., Connors, S., van Diemen, R., et al., Eds.; Intergovernmental Panel on Climate Change: Geneva, Switzerland, 2019; pp. 77–129. [Google Scholar]
- Gibbs, H.K.; Brown, S.; Niles, J.O.; Foley, J.A. Monitoring and Estimating Tropical Forest Carbon Stocks: Making REDD a Reality. Environ. Res. Lett. 2007, 2, 045023. [Google Scholar] [CrossRef]
- Luyssaert, S.; Hessenmöller, D.; von Lüpke, N.; Kaiser, S.; Schulze, E.D. Quantifying Land Use and Disturbance Intensity in Forestry, Based on the Self-Thinning Relationship. Ecol. Appl. 2011, 21, 3272–3284. [Google Scholar] [CrossRef]
- Rodríguez-Veiga, P.; Wheeler, J.; Louis, V.; Tansey, K.; Balzter, H. Quantifying Forest Biomass Carbon Stocks From Space. Curr. For. Rep. 2017, 3, 1–18. [Google Scholar] [CrossRef] [Green Version]
- Luedeling, E.; Börner, J.; Amelung, W.; Schiffers, K.; Shepherd, K.; Rosenstock, T. Forest Restoration: Overlooked Constraints. Science 2019, 366, 315. [Google Scholar] [CrossRef]
- Erb, K.-H.; Luyssaert, S.; Meyfroidt, P.; Pongratz, J.; Don, A.; Kloster, S.; Kuemmerle, T.; Fetzel, T.; Fuchs, R.; Herold, M.; et al. Land Management: Data Availability and Process Understanding for Global Change Studies. Glob. Change Biol. 2017, 23, 512–533. [Google Scholar] [CrossRef] [PubMed] [Green Version]
- Curtis, P.G.; Slay, C.M.; Harris, N.L.; Tyukavina, A.; Hansen, M.C. Classifying Drivers of Global Forest Loss. Science 2018, 361, 1108–1111. [Google Scholar] [CrossRef] [PubMed]
- Erb, K.-H.; Kastner, T.; Plutzar, C.; Bais, A.L.S.; Carvalhais, N.; Fetzel, T.; Gingrich, S.; Haberl, H.; Lauk, C.; Niedertscheider, M.; et al. Unexpectedly Large Impact of Forest Management and Grazing on Global Vegetation Biomass. Nature 2018, 553, 73–76. [Google Scholar] [CrossRef] [PubMed]
- Carreiras, J.M.B.; Quegan, S.; Le Toan, T.; Ho Tong Minh, D.; Saatchi, S.S.; Carvalhais, N.; Reichstein, M.; Scipal, K. Coverage of High Biomass Forests by the ESA BIOMASS Mission under Defense Restrictions. Remote Sens. Environ. 2017, 196, 154–162. [Google Scholar] [CrossRef]
- Schepaschenko, D.; Chave, J.; Phillips, O.L.; Lewis, S.L.; Davies, S.J.; Réjou-Méchain, M.; Sist, P.; Scipal, K.; Perger, C.; Herault, B.; et al. The Forest Observation System, Building a Global Reference Dataset for Remote Sensing of Forest Biomass. Sci. Data 2019, 6, 198. [Google Scholar] [CrossRef] [Green Version]
- Dubayah, R.; Blair, J.B.; Goetz, S.; Fatoyinbo, L.; Hansen, M.; Healey, S.; Hofton, M.; Hurtt, G.; Kellner, J.; Luthcke, S.; et al. The Global Ecosystem Dynamics Investigation: High-Resolution Laser Ranging of the Earth’s Forests and Topography. Sci. Remote Sens. 2020, 1, 100002. [Google Scholar] [CrossRef]
- Silva, C.A.; Duncanson, L.; Hancock, S.; Neuenschwander, A.; Thomas, N.; Hofton, M.; Fatoyinbo, L.; Simard, M.; Marshak, C.Z.; Armston, J.; et al. Fusing Simulated GEDI, ICESat-2 and NISAR Data for Regional Aboveground Biomass Mapping. Remote Sens. Environ. 2021, 253, 112234. [Google Scholar] [CrossRef]
- Bhan, M.; Gingrich, S.; Roux, N.; Le Noë, J.; Kastner, T.; Matej, S.; Schwarzmueller, F.; Erb, K.-H. Quantifying and Attributing Land Use-Induced Carbon Emissions to Biomass Consumption: A Critical Assessment of Existing Approaches. J. Environ. Manag. 2021, 286, 112228. [Google Scholar] [CrossRef]
- DeFries, R.S.; Houghton, R.A.; Hansen, M.C.; Field, C.B.; Skole, D.; Townshend, J. Carbon Emissions from Tropical Deforestation and Regrowth Based on Satellite Observations for the 1980s and 1990s. Proc. Natl. Acad. Sci. USA 2002, 99, 14256–14261. [Google Scholar] [CrossRef] [PubMed] [Green Version]
- Harris, N.L.; Brown, S.; Hagen, S.C.; Saatchi, S.S.; Petrova, S.; Salas, W.; Hansen, M.C.; Potapov, P.V.; Lotsch, A. Baseline Map of Carbon Emissions from Deforestation in Tropical Regions. Science 2012, 336, 1573–1576. [Google Scholar] [CrossRef] [PubMed]
- Bastin, J.-F.; Finegold, Y.; Garcia, C.; Mollicone, D.; Rezende, M.; Routh, D.; Zohner, C.M.; Crowther, T.W. The Global Tree Restoration Potential. Science 2019, 365, 76–79. [Google Scholar] [CrossRef]
- Tropek, R.; Sedla ek, O.; Beck, J.; Keil, P.; Musilova, Z.; Imova, I.; Storch, D. Comment on “High-Resolution Global Maps of 21st-Century Forest Cover Change”. Science 2014, 344, 981. [Google Scholar] [CrossRef] [Green Version]
- Henders, S.; Persson, U.M.; Kastner, T. Trading Forests: Land-Use Change and Carbon Emissions Embodied in Production and Exports of Forest-Risk Commodities. Environ. Res. Lett. 2015, 10, 125012. [Google Scholar] [CrossRef]
- Pendrill, F.; Persson, M.; Godar, J.; Kastner, T. Deforestation Displaced: Trade in Forest-Risk Commodities and the Prospects for a Global Forest Transition. Environ. Res. Lett. 2019, 1–17. [Google Scholar] [CrossRef]
- Pan, Y.; Birdsey, R.A.; Phillips, O.L.; Jackson, R.B. The Structure, Distribution, and Biomass of the World’s Forests. Annu. Rev. Ecol. Evol. Syst. 2013, 44, 593–622. [Google Scholar] [CrossRef] [Green Version]
- Stinson, G.; Kurz, W.A.; Smyth, C.E.; Neilson, E.T.; Dymond, C.C.; Metsaranta, J.M.; Boisvenue, C.; Rampley, G.J.; Li, Q.; White, T.M.; et al. An Inventory-Based Analysis of Canada’s Managed Forest Carbon Dynamics, 1990 to 2008: CANADA’S MANAGED FOREST C DYNAMICS. Glob. Change Biol. 2011, 17, 2227–2244. [Google Scholar] [CrossRef] [Green Version]
- Neigh, C.S.R.; Nelson, R.F.; Ranson, K.J.; Margolis, H.A.; Montesano, P.M.; Sun, G.; Kharuk, V.; Næsset, E.; Wulder, M.A.; Andersen, H.-E. Taking Stock of Circumboreal Forest Carbon with Ground Measurements, Airborne and Spaceborne LiDAR. Remote Sens. Environ. 2013, 137, 274–287. [Google Scholar] [CrossRef] [Green Version]
- Mitchard, E.T.; Saatchi, S.S.; Baccini, A.; Asner, G.P.; Goetz, S.J.; Harris, N.L.; Brown, S. Uncertainty in the Spatial Distribution of Tropical Forest Biomass: A Comparison of Pan-Tropical Maps. Carbon Balance Manag. 2013, 8, 1–13. [Google Scholar] [CrossRef] [PubMed] [Green Version]
- Zerbe, S. Potential Natural Vegetation: Validity and Applicability in Landscape Planning and Nature Conservation. Appl. Veg. Sci. 1998, 1, 165–172. [Google Scholar] [CrossRef]
- Haberl, H.; Erb, K.H.; Krausmann, F.; Gaube, V.; Bondeau, A.; Plutzar, C.; Gingrich, S.; Lucht, W.; Fischer-Kowalski, M. Quantifying and Mapping the Human Appropriation of Net Primary Production in Earth’s Terrestrial Ecosystems. Proc. Natl. Acad. Sci. USA 2007, 104, 12942–12947. [Google Scholar] [CrossRef] [Green Version]
- Erb, K.-H.; Fetzel, T.; Plutzar, C.; Kastner, T.; Lauk, C.; Mayer, A.; Niedertscheider, M.; Körner, C.; Haberl, H. Biomass Turnover Time in Terrestrial Ecosystems Halved by Land Use. Nat. Geosci. 2016, 9, 674–678. [Google Scholar] [CrossRef]
- Hansen, M.C.; Potapov, P.V.; Moore, R.; Hancher, M.; Turubanova, S.A.; Tyukavina, A.; Thau, D.; Stehman, S.V.; Goetz, S.J.; Loveland, T.R.; et al. High-Resolution Global Maps of 21st-Century Forest Cover Change. Science 2013, 342, 850–853. [Google Scholar] [CrossRef] [Green Version]
- Song, X.-P.; Hansen, M.C.; Stehman, S.V.; Potapov, P.V.; Tyukavina, A.; Vermote, E.F.; Townshend, J.R. Global Land Change from 1982 to 2016. Nature 2018, 560, 639–643. [Google Scholar] [CrossRef]
- Bouvet, A.; Mermoz, S.; Le Toan, T.; Villard, L.; Mathieu, R.; Naidoo, L.; Asner, G.P. An Above-Ground Biomass Map of African Savannahs and Woodlands at 25 m Resolution Derived from ALOS PALSAR. Remote Sens. Environ. 2018, 206, 156–173. [Google Scholar] [CrossRef]
- Fan, L.; Wigneron, J.-P.; Ciais, P.; Chave, J.; Brandt, M.; Fensholt, R.; Saatchi, S.S.; Bastos, A.; Al-Yaari, A.; Hufkens, K.; et al. Satellite-Observed Pantropical Carbon Dynamics. Nat. Plants 2019, 5, 944–951. [Google Scholar] [CrossRef]
- Spawn, S.A.; Sullivan, C.C.; Lark, T.J.; Gibbs, H.K. Harmonized Global Maps of above and Belowground Biomass Carbon Density in the Year 2010. Sci. Data 2020, 7, 112. [Google Scholar] [CrossRef] [PubMed]
- Chazdon, R.L.; Brancalion, P.H.S.; Laestadius, L.; Bennett-Curry, A.; Buckingham, K.; Kumar, C.; Moll-Rocek, J.; Vieira, I.C.G.; Wilson, S.J. When Is a Forest a Forest? Forest Concepts and Definitions in the Era of Forest and Landscape Restoration. Ambio 2016, 45, 538–550. [Google Scholar] [CrossRef] [PubMed]
- Eggleston, H.S.; Buendia, L.; Miwa, K.; Ngara, T.; Tanabe, K. IPCC Guidelines for National Greenhouse Gas Inventories. Inst. Glob. Environ. Strateg. Hayama Jpn. 2006, 48–56. [Google Scholar]
- Saatchi, S.S.; Harris, N.L.; Brown, S.; Lefsky, M.; Mitchard, E.T.A.; Salas, W.; Zutta, B.R.; Buermann, W.; Lewis, S.L.; Hagen, S.; et al. Benchmark Map of Forest Carbon Stocks in Tropical Regions across Three Continents. Proc. Natl. Acad. Sci. USA 2011, 108, 9899–9904. [Google Scholar] [CrossRef] [PubMed] [Green Version]
- Baccini, A.; Goetz, S.J.; Walker, W.S.; Laporte, N.T.; Sun, M.; Sulla-Menashe, D.; Hackler, J.; Beck, P.S.A.; Dubayah, R.; Friedl, M.A.; et al. Estimated Carbon Dioxide Emissions from Tropical Deforestation Improved by Carbon-Density Maps. Nat. Clim. Chang. 2012, 2, 182–185. [Google Scholar] [CrossRef]
- Ramankutty, N.; Foley, J.A. Estimating Historical Changes in Global Land Cover: Croplands from 1700 to 1992. Glob. Biogeochem. Cycles 1999, 13, 997–1027. [Google Scholar] [CrossRef]
- FAO. Global Forest Resources Assessment 2000; Food and Agriculture Organization of the United Nations: Rome, Italy, 2001. [Google Scholar]
- Olson, D.M.; Dinerstein, E.; Wikramanayake, E.D.; Burgess, N.D.; Powell, G.V.N.; Underwood, E.C.; D’amico, J.A.; Itoua, I.; Strand, H.E.; Morrison, J.C.; et al. Terrestrial Ecoregions of the World: A New Map of Life on Earth. BioScience 2001, 51, 933. [Google Scholar] [CrossRef]
- FAO. Global Forest Resource Assessment 2010; Food and Agriculture Organization of the United Nations: Rome, Italy, 2010. [Google Scholar]
- Pan, Y.; Birdsey, R.A.; Fang, J.; Houghton, R.; Kauppi, P.E.; Kurz, W.A.; Phillips, O.L.; Shvidenko, A.; Lewis, S.L.; Canadell, J.G.; et al. A Large and Persistent Carbon Sink in the World’s Forests. Science 2011, 333, 988–993. [Google Scholar] [CrossRef] [Green Version]
- West, P.C.; Gibbs, H.K.; Monfreda, C.; Wagner, J.; Barford, C.C.; Carpenter, S.R.; Foley, J.A. Trading Carbon for Food: Global Comparison of Carbon Stocks vs. Crop Yields on Agricultural Land. Proc. Natl. Acad. Sci. USA 2010, 107, 19645–19648. [Google Scholar] [CrossRef] [Green Version]
- Searchinger, T.D.; Wirsenius, S.; Beringer, T.; Dumas, P. Assessing the Efficiency of Changes in Land Use for Mitigating Climate Change. Nature 2018, 564, 249–253. [Google Scholar] [CrossRef]
- Simard, M.; Pinto, N.; Fisher, J.B.; Baccini, A. Mapping Forest Canopy Height Globally with Spaceborne Lidar. J. Geophys. Res. 2011, 116, G04021. [Google Scholar] [CrossRef] [Green Version]
- Ruesch, A.S.; Gibbs, H.K. New IPCC Tier-1 Global Biomass Carbon Map For the Year 2000. Environ. Syst. Sci. Data Infrastruct. Virtual Ecosyst. 2008. [Google Scholar] [CrossRef]
- Potapov, P.; Hansen, M.C.; Laestadius, L.; Turubanova, S.; Yaroshenko, A.; Thies, C.; Smith, W.; Zhuravleva, I.; Komarova, A.; Minnemeyer, S.; et al. The Last Frontiers of Wilderness: Tracking Loss of Intact Forest Landscapes from 2000 to 2013. Sci. Adv. 2017, 3, e1600821. [Google Scholar] [CrossRef] [PubMed] [Green Version]
- Venter, O.; Sanderson, E.W.; Magrach, A.; Allan, J.R.; Beher, J.; Jones, K.R.; Possingham, H.P.; Laurance, W.F.; Wood, P.; Fekete, B.M.; et al. Sixteen Years of Change in the Global Terrestrial Human Footprint and Implications for Biodiversity Conservation. Nat. Commun. 2016, 7, 12558. [Google Scholar] [CrossRef] [Green Version]
- Veldman, J.W.; Aleman, J.C.; Alvarado, S.T.; Anderson, T.M.; Archibald, S.; Bond, W.J.; Boutton, T.W.; Buchmann, N.; Buisson, E.; Canadell, J.G.; et al. Comment on “The Global Tree Restoration Potential”. Science 2019, 366, eaay7976. [Google Scholar] [CrossRef] [PubMed] [Green Version]
- Vancutsem, C.; Achard, F.; Pekel, J.-F.; Vieilledent, G.; Carboni, S.; Simonetti, D.; Gallego, J.; Aragão, L.E.O.C.; Nasi, R. Long-Term (1990–2019) Monitoring of Forest Cover Changes in the Humid Tropics. Sci. Adv. 2021, 7, eabe1603. [Google Scholar] [CrossRef] [PubMed]
- McDowell, N.G.; Allen, C.D.; Anderson-Teixeira, K.; Aukema, B.H.; Bond-Lamberty, B.; Chini, L.; Clark, J.S.; Dietze, M.; Grossiord, C.; Hanbury-Brown, A.; et al. Pervasive Shifts in Forest Dynamics in a Changing World. Science 2020, 368, eaaz9463. [Google Scholar] [CrossRef]
- Poorter, L.; Bongers, F.; Aide, T.M.; Almeyda Zambrano, A.M.; Balvanera, P.; Becknell, J.M.; Boukili, V.; Brancalion, P.H.S.; Broadbent, E.N.; Chazdon, R.L.; et al. Biomass Resilience of Neotropical Secondary Forests. Nature 2016, 530, 211–214. [Google Scholar] [CrossRef]
- Almeida, D.R.A.; Stark, S.C.; Schietti, J.; Camargo, J.L.C.; Amazonas, N.T.; Gorgens, E.B.; Rosa, D.M.; Smith, M.N.; Valbuena, R.; Saleska, S.; et al. Persistent Effects of Fragmentation on Tropical Rainforest Canopy Structure after 20 Yr of Isolation. Ecol. Appl. 2019, 29, e01952. [Google Scholar] [CrossRef]
- Cunningham, D.; Cunningham, P.; Fagan, M.E. Identifying Biases in Global Tree Cover Products: A Case Study in Costa Rica. Forests 2019, 10, 853. [Google Scholar] [CrossRef] [Green Version]
- Fagan, M.E. A Lesson Unlearned? Underestimating Tree Cover in Dryland Biases Global Restoration Maps. Glob. Change Biol. 2020, 26, 4679–4690. [Google Scholar] [CrossRef]
- Brandt, M.; Tucker, C.J.; Kariryaa, A.; Rasmussen, K.; Abel, C.; Small, J.; Chave, J.; Rasmussen, L.V.; Hiernaux, P.; Diouf, A.A.; et al. An Unexpectedly Large Count of Trees in the West African Sahara and Sahel. Nature 2020, 587, 78–82. [Google Scholar] [CrossRef]
- Bastin, J.-F.; Berrahmouni, N.; Grainger, A.; Maniatis, D.; Mollicone, D.; Moore, R.; Patriarca, C.; Picard, N.; Sparrow, B.; Abraham, E.M.; et al. The Extent of Forest in Dryland Biomes. Science 2017, 356, 635–638. [Google Scholar] [CrossRef] [PubMed] [Green Version]
- Ryan, C.M.; Hill, T.; Woollen, E.; Ghee, C.; Mitchard, E.; Cassells, G.; Grace, J.; Woodhouse, I.H.; Williams, M. Quantifying Small-Scale Deforestation and Forest Degradation in African Woodlands Using Radar Imagery. Glob. Change Biol. 2012, 18, 243–257. [Google Scholar] [CrossRef] [Green Version]
- Brandt, M. Reduction of Tree Cover in West African Woodlands and Promotion in Semi-Arid Farmlands. Nat. Geosci. 2018, 11, 328–333. [Google Scholar] [CrossRef]
- Keenan, R.J.; Reams, G.A.; Achard, F.; de Freitas, J.V.; Grainger, A.; Lindquist, E. Dynamics of Global Forest Area: Results from the FAO Global Forest Resources Assessment 2015. For. Ecol. Manag. 2015, 352, 9–20. [Google Scholar] [CrossRef]
- Baccini, A.; Walker, W.; Carvalho, L.; Farina, M.; Sulla-Menashe, D.; Houghton, R.A. Tropical Forests Are a Net Carbon Source Based on Aboveground Measurements of Gain and Loss. Science 2017, 358, 230–234. [Google Scholar] [CrossRef] [PubMed] [Green Version]
- Hansen, M.C.; Potapov, P.; Tyukavina, A. Comment on “Tropical Forests Are a Net Carbon Source Based on Aboveground Measurements of Gain and Loss”. Science 2019, 363. [Google Scholar] [CrossRef] [Green Version]
- Harris, N.L.; Gibbs, D.A.; Baccini, A.; Birdsey, R.A.; de Bruin, S.; Farina, M.; Fatoyinbo, L.; Hansen, M.C.; Herold, M.; Houghton, R.A.; et al. Global Maps of Twenty-First Century Forest Carbon Fluxes. Nat. Clim. Chang. 2021, 11, 234–240. [Google Scholar] [CrossRef]
- Drake, J.B.; Knox, R.G.; Dubayah, R.O.; Clark, D.B.; Condit, R.; Blair, J.B.; Hofton, M. Above-Ground Biomass Estimation in Closed Canopy Neotropical Forests Using Lidar Remote Sensing: Factors Affecting the Generality of Relationships: Biomass Estimation in Neotropical Forests Using Lidar. Glob. Ecol. Biogeogr. 2003, 12, 147–159. [Google Scholar] [CrossRef]
- Johnson, M.O.; Galbraith, D.; Gloor, M.; De Deurwaerder, H.; Guimberteau, M.; Rammig, A.; Thonicke, K.; Verbeeck, H.; von Randow, C.; Monteagudo, A.; et al. Variation in Stem Mortality Rates Determines Patterns of Above-Ground Biomass in Amazonian Forests: Implications for Dynamic Global Vegetation Models. Glob. Change Biol. 2016, 22, 3996–4013. [Google Scholar] [CrossRef] [PubMed] [Green Version]
- Kuemmerle, T.; Erb, K.; Meyfroidt, P.; Müller, D.; Verburg, P.H.; Estel, S.; Haberl, H.; Hostert, P.; Jepsen, M.R.; Kastner, T.; et al. Challenges and Opportunities in Mapping Land Use Intensity Globally. Curr. Opin. Environ. Sustain. 2013, 5, 484–493. [Google Scholar] [CrossRef]
- Heinimann, A.; Mertz, O.; Frolking, S.; Egelund Christensen, A.; Hurni, K.; Sedano, F.; Parsons Chini, L.; Sahajpal, R.; Hansen, M.; Hurtt, G. A Global View of Shifting Cultivation: Recent, Current, and Future Extent. PLoS ONE 2017, 12, e0184479. [Google Scholar] [CrossRef] [PubMed] [Green Version]
- Hosonuma, N.; Herold, M.; De Sy, V.; De Fries, R.S.; Brockhaus, M.; Verchot, L.; Angelsen, A.; Romijn, E. An Assessment of Deforestation and Forest Degradation Drivers in Developing Countries. Environ. Res. Lett. 2012, 7, 044009. [Google Scholar] [CrossRef]
- Fetzel, T.; Havlik, P.; Herrero, M.; Kaplan, J.O.; Kastner, T.; Kroisleitner, C.; Rolinski, S.; Searchinger, T.; Van Bodegom, P.M.; Wirsenius, S.; et al. Quantification of Uncertainties in Global Grazing Systems Assessment: Uncertainties in Global Grazing Data. Glob. Biogeochem. Cycles 2017, 31, 1089–1102. [Google Scholar] [CrossRef] [Green Version]
- Mather, A.S. Recent Asian Forest Transitions in Relation to Foresttransition Theory. Int. For. Rev. 2007, 9, 491–502. [Google Scholar] [CrossRef]
- Youn, Y.-C.; Choi, J.; de Jong, W.; Liu, J.; Park, M.S.; Camacho, L.D.; Tachibana, S.; Huudung, N.D.; Bhojvaid, P.P.; Damayanti, E.K.; et al. Conditions of Forest Transition in Asian Countries. For. Policy Econ. 2017, 76, 14–24. [Google Scholar] [CrossRef]
- Wang, C.; Yu, M.; Gao, Q. Continued Reforestation and Urban Expansion in the New Century of a Tropical Island in the Caribbean. Remote Sens. 2017, 9, 731. [Google Scholar] [CrossRef] [Green Version]
- Kauppi, P.E.; Ausubel, J.H.; Fang, J.; Mather, A.S.; Sedjo, R.A.; Waggoner, P.E. Returning Forests Analyzed with the Forest Identity. Proc. Natl. Acad. Sci. USA 2006, 103, 17574–17579. [Google Scholar] [CrossRef] [Green Version]
- Gingrich, S.; Lauk, C.; Niedertscheider, M.; Pichler, M.; Schaffartzik, A.; Schmid, M.; Magerl, A.; Le Noë, J.; Bhan, M.; Erb, K. Hidden Emissions of Forest Transitions: A Socio-Ecological Reading of Forest Change. Curr. Opin. Environ. Sustain. 2019, 38, 14–21. [Google Scholar] [CrossRef]
- Drummond, M.A.; Loveland, T.R. Land-Use Pressure and a Transition to Forest-Cover Loss in the Eastern United States. BioScience 2010, 60, 286–298. [Google Scholar] [CrossRef]
- Kull, C.A. Forest Transitions: A New Conceptual Scheme. Geogr. Helvetica 2017, 72, 465–474. [Google Scholar] [CrossRef] [Green Version]
Figure 1.
Biomass carbon stocks and tree cover across the tropics. (a) Latitudinal profile for potential CS with median and min–max envelopes. (b) Latitudinal profile for potential TC. (c) The CS/TC Ratio in the potential vegetation. (d) Latitudinal profile for actual CS with median and min–max envelopes. (e) Latitudinal profiles for both the actual TC maps used in the analysis, Hansen et al. (in green) and Song et al. (in blue). (f) The CS/TC Ratio in the actual vegetation. The maps are constructed using the potential TC map, for which only one dataset was available, and the pixel-based median of actual CS, potential CS and actual TC. For details and sources of maps, refer to Materials and Methods Section.

Figure 2.
Land use impacts on CS and TC across tropical biomes. (a) The CS/TC Rratio of Ratios across the tropics. (b) Histogram of areal distribution of the CS/TC Ratio of Ratios classified by biome-type. Values in A and B < 1 indicate a stronger effect of land use on CS than on TC; values > 1 indicate the opposite. (c) Median of potential (red border circles) and actual (black border circles) TC and CS, classified by biome-type. Whiskers indicate the inner quartiles of values in each biome in the potential TC map, the median actual TC map, the median potential CS map, and the median actual CS map. The circle size is proportional to the areal extent of the biome.

Figure 3.
Potential and actual tree cover (TC) in wilderness areas in four tropical biomes. Dots indicate the mean of all individual pixels in a biome; whiskers refer to the standard deviation. The inset shows the location of wilderness areas (highlighted in green) within tropical biomes. We selected biomes where no. of pixels per biome in wilderness areas, n > 100. Here, Moist Forests, n = 54,755; Dry Forests, n = 1349; Grasslands and Savannas, n = 1016; Flooded Grasslands and Savannas, n = 227. Potential TC refers to Bastin et al. (2019), actual TC maps are taken from Hansen et al. (2013) and Song et al. (2018). ‘Median of actual TC maps’ refers to the pixel-level median of the two actual TC maps. For information on how wilderness areas were delineated, see Materials and Methods Section.

Figure 4.
Tree cover (TC)—biomass carbon stocks (CS) correlations across tropical biomes (a–g) for both potential (in black) and actual (in green) vegetation. Each circle denotes the zonal average of potential and actual TC and CS for the ecozone represented by the intersection of three potential vegetation maps within each biome (n = 494). We exclude areas where number of pixels within each ecozone, n < 10 as outliers. The circle size is proportional to the areal extent of the biome.

Figure 5.
Distribution of biomass carbon stocks densities in tropical biomes with high TC densities in potential (‘Pot’) and actual (‘Act’) vegetation. Here, ‘Pot’ denotes potential vegetation; ‘Act’ denotes actual vegetation. The figure refers only to individual pixels with median actual TC > 90%. We selected biomes where no. of pixels per biome, n > 50. Other tropical biomes were excluded due to a lack of pixels fulfilling this selection criterion. The distribution of the peaks of the violin plot depicts the probability density of individual pixels in the given biome. Corresponding median maps for potential CS, actual CS actual TC are used here (for sources see Materials and Methods Section).

Publisher’s Note: MDPI stays neutral with regard to jurisdictional claims in published maps and institutional affiliations. |
© 2021 by the authors. Licensee MDPI, Basel, Switzerland. This article is an open access article distributed under the terms and conditions of the Creative Commons Attribution (CC BY) license (https://creativecommons.org/licenses/by/4.0/).
Share and Cite
MDPI and ACS Style
Bhan, M.; Gingrich, S.; Matej, S.; Fritz, S.; Erb, K.-H. Land Use Increases the Correlation between Tree Cover and Biomass Carbon Stocks in the Global Tropics. Land 2021, 10, 1217. https://0-doi-org.brum.beds.ac.uk/10.3390/land10111217
AMA Style
Bhan M, Gingrich S, Matej S, Fritz S, Erb K-H. Land Use Increases the Correlation between Tree Cover and Biomass Carbon Stocks in the Global Tropics. Land. 2021; 10(11):1217. https://0-doi-org.brum.beds.ac.uk/10.3390/land10111217
Chicago/Turabian StyleBhan, Manan, Simone Gingrich, Sarah Matej, Steffen Fritz, and Karl-Heinz Erb. 2021. "Land Use Increases the Correlation between Tree Cover and Biomass Carbon Stocks in the Global Tropics" Land 10, no. 11: 1217. https://0-doi-org.brum.beds.ac.uk/10.3390/land10111217
Note that from the first issue of 2016, this journal uses article numbers instead of page numbers. See further details here.