
Measuring the Differences of Public Health Service Facilities and Their Influencing Factors

School of Resource and Environmental Science, Wuhan University, Wuhan 430072, China
*
Author to whom correspondence should be addressed.
Land 2021, 10(11), 1225; https://0-doi-org.brum.beds.ac.uk/10.3390/land10111225
Submission received: 25 September 2021
/
Revised: 5 November 2021
/
Accepted: 9 November 2021
/
Published: 11 November 2021
(This article belongs to the Special Issue Reinvigorating Research on Housing Inequalities and Housing Price Mechanism Using Emerging Data and Technologies)
Abstract
:The equitable distribution of public health facilities is a major concern of urban planners. Previous studies have explored the balance and fairness of various medical resource distributions using the accessibility of in-demand public medical service facilities while ignoring the differences in the supply of public medical service facilities. First aid data with location information and patient preference information can reflect the ability of each hospital and the health inequities in cities. Determining which factors affect the measured differences in public medical service facilities and how to alter these factors will help researchers formulate targeted policies to solve the current resource-balance situation of the Ministry of Public Health. In this study, we propose a method to measure the differences in influence among hospitals based on actual medical behavior and use geographically weighted regression (GWR) to analyze the spatial correlations among the location, medical equipment, medical ability, and influencing factors of each hospital. The results show that Wuhan presents obvious health inequality, with the high-grade hospitals having spatial agglomeration in the city-center area, while the number and quality of hospitals in the peripheral areas are lower than those in the central area; thus, the hospitals in these peripheral areas need to be further improved. The method used in this study can measure differences in the influence of public medical service facilities, and the results are consistent with the measured differences at hospital level. Hospital influence is not only related to the equipment and medical ability of each hospital but is also affected by location factors. This method illustrates the necessity of conducting more empirical research on the public medical service supply to provide a scientific basis for formulating targeted policies from a new perspective.
1. Introduction
As the living standards of people continuously improve, improving people’s health levels and realizing medical treatment have also become common pursuits of human society. Medical services are among the most basic needs in human societies and are directly related to people’s health [1,2]. Eighty percent of the high-quality medical resources in society as a whole are concentrated in large cities, and 80% of the high-quality medical resources in large cities are concentrated in several high-level hospitals. This high concentration of medical resources is one of the main reasons why obtaining medical treatment can be difficult. However, hundreds of millions of people still live in the periphery of cities all over the world, and their demand for medical resources is very urgent. There are only low-level hospitals such as community hospitals surrounding cities, causing medical inequalities. The inequalities of medical facilities, educational facilities, and landscape amenities induce social inequalities [3,4]. Therefore, high-level hospitals are needed in the periphery of the city in order to solve the medical imbalance in the city, and a reasonable medical allocation strategy is conducive to ensuring social fairness. Ensuring a scientific layout and rational allocation of medical facilities can maximize social benefits and welfare [5,6,7,8] and is an important means for the promotion of people’s health, living environment improvements, and the maintenance of social equity [9,10].
The accessibility of public facilities can be used to measure the supply and demand, location and configuration, and service and coverage of these facilities [11,12,13]; thus, accessibility is often used as a scientific basis for planning and policy making at different levels [14,15,16]. The accessibility of medical facilities can be determined by calculating the convenience of accessing hospitals of different levels from a certain location [17], analyzing the supply and demand of medical services, or evaluating the balance of the facility distribution [18,19,20]. Existing studies have mainly focused on the fairness of public services and the spatial characteristics of human behavior within the scope of public health services using the accessibility of medical facilities [21,22,23,24,25]. One method that has been applied to a wide range of domains is the two-step floating catchment area (2SFCA) method [26]. This method considers both supply and demand and considers special populations with user-defined weights [27,28,29,30]. The 2SFCA method is an easy-to-explain and easy-to-calculate method and can be combined with geographic information systems (GIS) to determine existing differences that exist in terms of fairness [31,32]. This method has been widely used in research on public health services [7,33], public transport, education services [34,35], comprehensive public services [36,37], and other fields [27,38,39,40,41].
Although the 2SFCA method has been widely recognized, when applied to study public health services, this method does not consider the impacts of differences in the actual medical treatment mode on the model [42]. The impacts of public health service facilities are complex and cannot be measured using only the hospital grade, the number of hospital beds, or other individual indicators. Public health service facilities have typical hierarchical characteristics; higher-level public facilities can generally cover the services provided by lower-level facilities [43]. Additionally, there are many kinds of hospitals, and it is difficult to compare specialized hospitals with general hospitals. There are also different departments and hospital reputations among the same general hospitals as well as priorities in each patient’s condition. Determining how to infer the differences in influence among hospitals by examining the actual medical behaviors of patients has become an urgent problem. The 2SFCA method prioritizes the needs of the community and cannot sufficiently consider the supply side of the relationship [44].
Because actual medical data include certain private personal information, it is relatively difficult to obtain these data. Thus, relatively few studies have been based on actual medical models. Existing studies have mainly analyzed residents’ medical decision-making through taxi travel survey data [45] and questionnaires [18]. The travel mode of taxi survey data is relatively singular, and questionnaire data also have some associated problems, such as small sample sizes and the difficulty of ensuring quality.
First aid is an important component of modern medical service systems and includes medical first aid and rapid transfer before patients arrive at a hospital. The level of first aid provided to patients reflects the medical level and emergency-response ability of a city or hospital. It can reflect differences in the abilities between hospitals, and when combined with the location of the hospitals, it can reflect the current imbalance of urban medical treatment. The study of emergency data can reveal the reason for the ability difference of medical facilities. The recent research has mainly focused on the specific implementation rules and efficiency of first aid [46], and research involving the in-depth mining of first aid data needs to be further improved. First aid data include each patient’s location information, condition information, some insensitive personal information, and each patient’s medical behaviors and decisions. Compared to conventional accessibility studies, these data are full sample data that can generally reflect the medical and behavioral decisions of patients in different situations. First aid data consider the needs and preferences of patients and can reflect differences in the influence of public health services on patients. A thorough understanding of the impact of hospital quality on patients can thus flesh out medical accessibility studies, further analyze the institutional dynamics of social inequality caused by medical inequality, and fill the research gap that was identified earlier [3].
Therefore, we chose first aid data from 2017 as the main data source in this study and conducted the following research: (1) we used the Baidu application programming interface (API) to simulate the route, time, and distance in which individuals receive first aid. Taking the community as a unit, we measured the differences in first aid times and distances among communities to determine the medical inequalities. The results provide a decision-making basis for optimizing the allocation strategy of medical facilities. (2) The first aid data of patients were collected at each studied hospital. Through spatial statistical analysis and curve-fitting methods, we obtained the first aid service scope among the hospitals and the urban first aid space pattern. (3) The different service scope of each hospital was regarded as a component of the difference in hospital influence. By combining these differences with a large number of relevant factors, including location, hospital equipment, and hospital capacity factors, this paper analyzes the relations between different factors and hospital influence. (4) In addition, through the visualization of the results, we obtained a clear understanding of the overall configuration of medical facilities in the study area.
This paper measures the differences in the influence of urban public health service facilities and analyzes the factors that influence these differences. In Section 2, the research areas and data are described, while Section 3 introduces the three main research methods. In Section 4, the spatial pattern of first aid among the studied communities and hospitals and the relationships between hospital influence and relevant indicators are measured. Hospital influence and the related influencing factor results obtained under different models are discussed in Section 5, and key hospitals are taken as case studies to determine areas that can be improved with additional medical pressure. Finally, the main findings are summarized, and future research is prospected.
2. Materials and Methods
2.1. Study Area
This research was conducted in Wuhan, one of the major cities in China. As a large city with a population of more than 10 million people, Wuhan is rich in medical facilities. After Beijing, Wuhan became the second city in China that can issue internationally recognized trauma first aid qualification certificates. Wuhan has a number of tertiary A hospitals, such as the Tongji Hospital and Union Hospital of Tongji Medical College at the Huazhong University of Science and Technology (HUST). Wuhan also has a number of specialty hospitals, such as the Wuhan University Stemmatological Hospital and the Wuhan Asian Heart Disease Hospital. These abundant hospital resources put Wuhan’s public health service level at the global forefront. We selected the metropolitan development zone (MDZ) of Wuhan as the study area. It includes 15 districts, with a total land area of 3269 square kilometers, and is composed of 1927 communities. According to emergency data, the study area has more than 100,000 emergency patients and almost all high-level hospitals. The distribution of patients and hospitals in the MDZ is shown in Figure 1.
2.2. Data Sources
2.2.1. First Aid Data
Through cooperation with the Wuhan Emergency Medical Center, we obtained more than 100,000 first aid data points collected throughout 2017. The data consisted of two parts: patient information, which was recorded by the emergency medical center over the phone, and the process by which the emergency vehicle travelled from the dispatch site to the emergency location and then from the emergency location to the hospital. The patient information collected by the emergency center included the time and place where first aid was needed, the patient’s specific symptoms, and sex and age information (not including the patient’s private personal information). The emergency vehicle data included the departure station, treatment method, and destination hospital, which was selected according to the patient’s wishes. The data contained origin points and destination points but lacked the trajectory information of the emergency vehicles. Thus, it was necessary to further simulate the vehicle paths to obtain relatively real travel distances rather than hypothetical Euclidean distances.
2.2.2. Public Health Yearbook Data
We collected data from the 2017 Wuhan Health Yearbook, including data representing medical facilities (such as hospital beds), hospital staff (such as physicians and examiners), and the medical capabilities of hospitals (such as annual outpatient visits and annual emergency visits). These related factors can be used explore the factors that affect each hospital’s influence from the perspective of individual hospital characteristics.
3. Methods
3.1. Data Preprocessing and Emergency Circuit Simulations
The first aid data include various data generated when a patient dials for emergency calls and the patient’s journey to the hospital in an ambulance. First aid data mainly include basic information about the patient, the address of the place where the patient requires help, the patient’s condition, and the hospital that the patient prefers. The origin–destination (OD) first aid chain can be obtained by applying a data-fusion method. However, we needed to simulate the routes taken in 2017 to determine the actual distance by considering traffic conditions rather than Euclidean distance.
The Baidu API interface can parse out, extract, and spatialize the core structure of the emergency address and can simulate the rescue paths of emergency vehicles to facilitate subsequent geographic analyses. The rescue time may be affected by varying traffic conditions during working days or rest days and during peak hours, such as when citizens are commuting to and returning from work. This study uses the same time interval of a week in 2021, such as the morning peak or evening peak, working day or weekend, to simulate route selection in 2017.
3.2. Calculation of Hospital Influence
Existing research on the scope of hospital services is often simply measured according to the level of hospitals or the number of hospital beds. In this study, we chose the general distance from patients to the hospital as the service scope of each hospital. The distance that a patient has to travel to receive general medical treatment can quantify the reputation gap and ability gap between hospitals. In fact, there is also a big gap in the medical capacity and service scope between hospitals of the same level. The scope of services of a hospital is affected by many factors, such as geographic location, medical equipment, and medical capabilities. Local residents have a more in-depth understanding of hospitals, and the comprehensive impact of multiple factors can be quantified by distance by analyzing resident choices for medical treatment. By analyzing the medical choice of patients who are in emergency situations, we chose to measure the scope of hospital services based on the distance from patients to the hospital to reflect the difference in hospital influence. If the scope of a hospital’s services is larger, a larger number of people will be willing to spend more time visiting this hospital even though it may be farther away, indicating that the hospital has a greater influence. However, how should the service scope of a hospital be measured? To scientifically determine the scope of hospital services, we used 1 km as the spatial unit and counted the number of patients that received emergency services from various hospitals within the unit distance as well as the overall value for all of Wuhan. We found that the actual number of emergency services in each hospital first increased and then decreased with the distance from the hospital center, as shown in Figure 2.
When the distance from the hospital was 2–3 km, the number of emergency services in the hospital reached a peak within the unit distance, and the cumulative number of patients was approximately 50% of the total number of people; when the distance was 10 km, the first half of the curve presented a characteristic normal distribution, and the cumulative number of patients was approximately 70% of the total; and when the distance was 15 km, the tail of the second half of the curve gradually tended to 0, and the cumulative number of patients was approximately 80% of the total. If a small number of patients travel to a hospital from farther locations, this behavior better reflects the difference in the scope of emergency treatment of the hospital. Therefore, we chose the distance at which the cumulative number of patients reached 80% of the total number of people to represent the scope of hospital emergency services. This study adopted the following equation to calculate the scope of emergency services in hospitals:
where Sk indicates the number of emergency patients between k − 1 km and k km away from the hospital, α represents the coefficient used to determine the impact of the scope of the services provided by the hospital (in this study α = 80%), m represents the farthest distance traveled by the emergency patients to the hospital, and n represents the scope of emergency services in the hospital.
3.3. Geographically Weighted Regression
Geographically weighted regression (GWR) models are widely used in spatial analysis and modeling of geographic elements [47,48]. They are based on the OLS model (ordinary least squares method) and apply the idea of partial regression by taking into account the spatial non-stationarity of geographic elements.
The scope of medical emergency services can intuitively reflect the hospital’s ability to attract patients [46]. Therefore, this study selected the scope of medical emergency services to reflect the differences in emergency service capabilities of different hospitals. In this study, a total of seven potential impact factors were selected from the three aspects of hospital location, hospital facilities, and medical capabilities. Hospital facilities include the number of hospital beds and the number of medical practitioners; medical capabilities include the number of outpatient visits and the number of emergency visits; the location of the hospital includes the distance to the city center, the number of other hospitals near each hospital and the number of people covered by each hospital. The number of outpatient visits and the number of emergency visits can measure the hospital’s service capabilities, which is an important part of medical capacity. The data regarding the hospital facilities and medical capacity were obtained from the statistical yearbook, and the location of the hospital was calculated by ArcGIS 10.4.
The number of people covered by hospital emergency care is based on the hospital, the radius of the hospital emergency services calculated in Section 3.2 is used as a buffer zone, and finally, population data are superimposed to calculate it. The distance to the city center is the shortest path distance between the hospital and the three centers in Wuhan. The number of hospitals near the hospital is the number of other hospitals within the emergency service scope of the hospital.
4. Results
4.1. Spatial Characteristics of Community Emergency Services
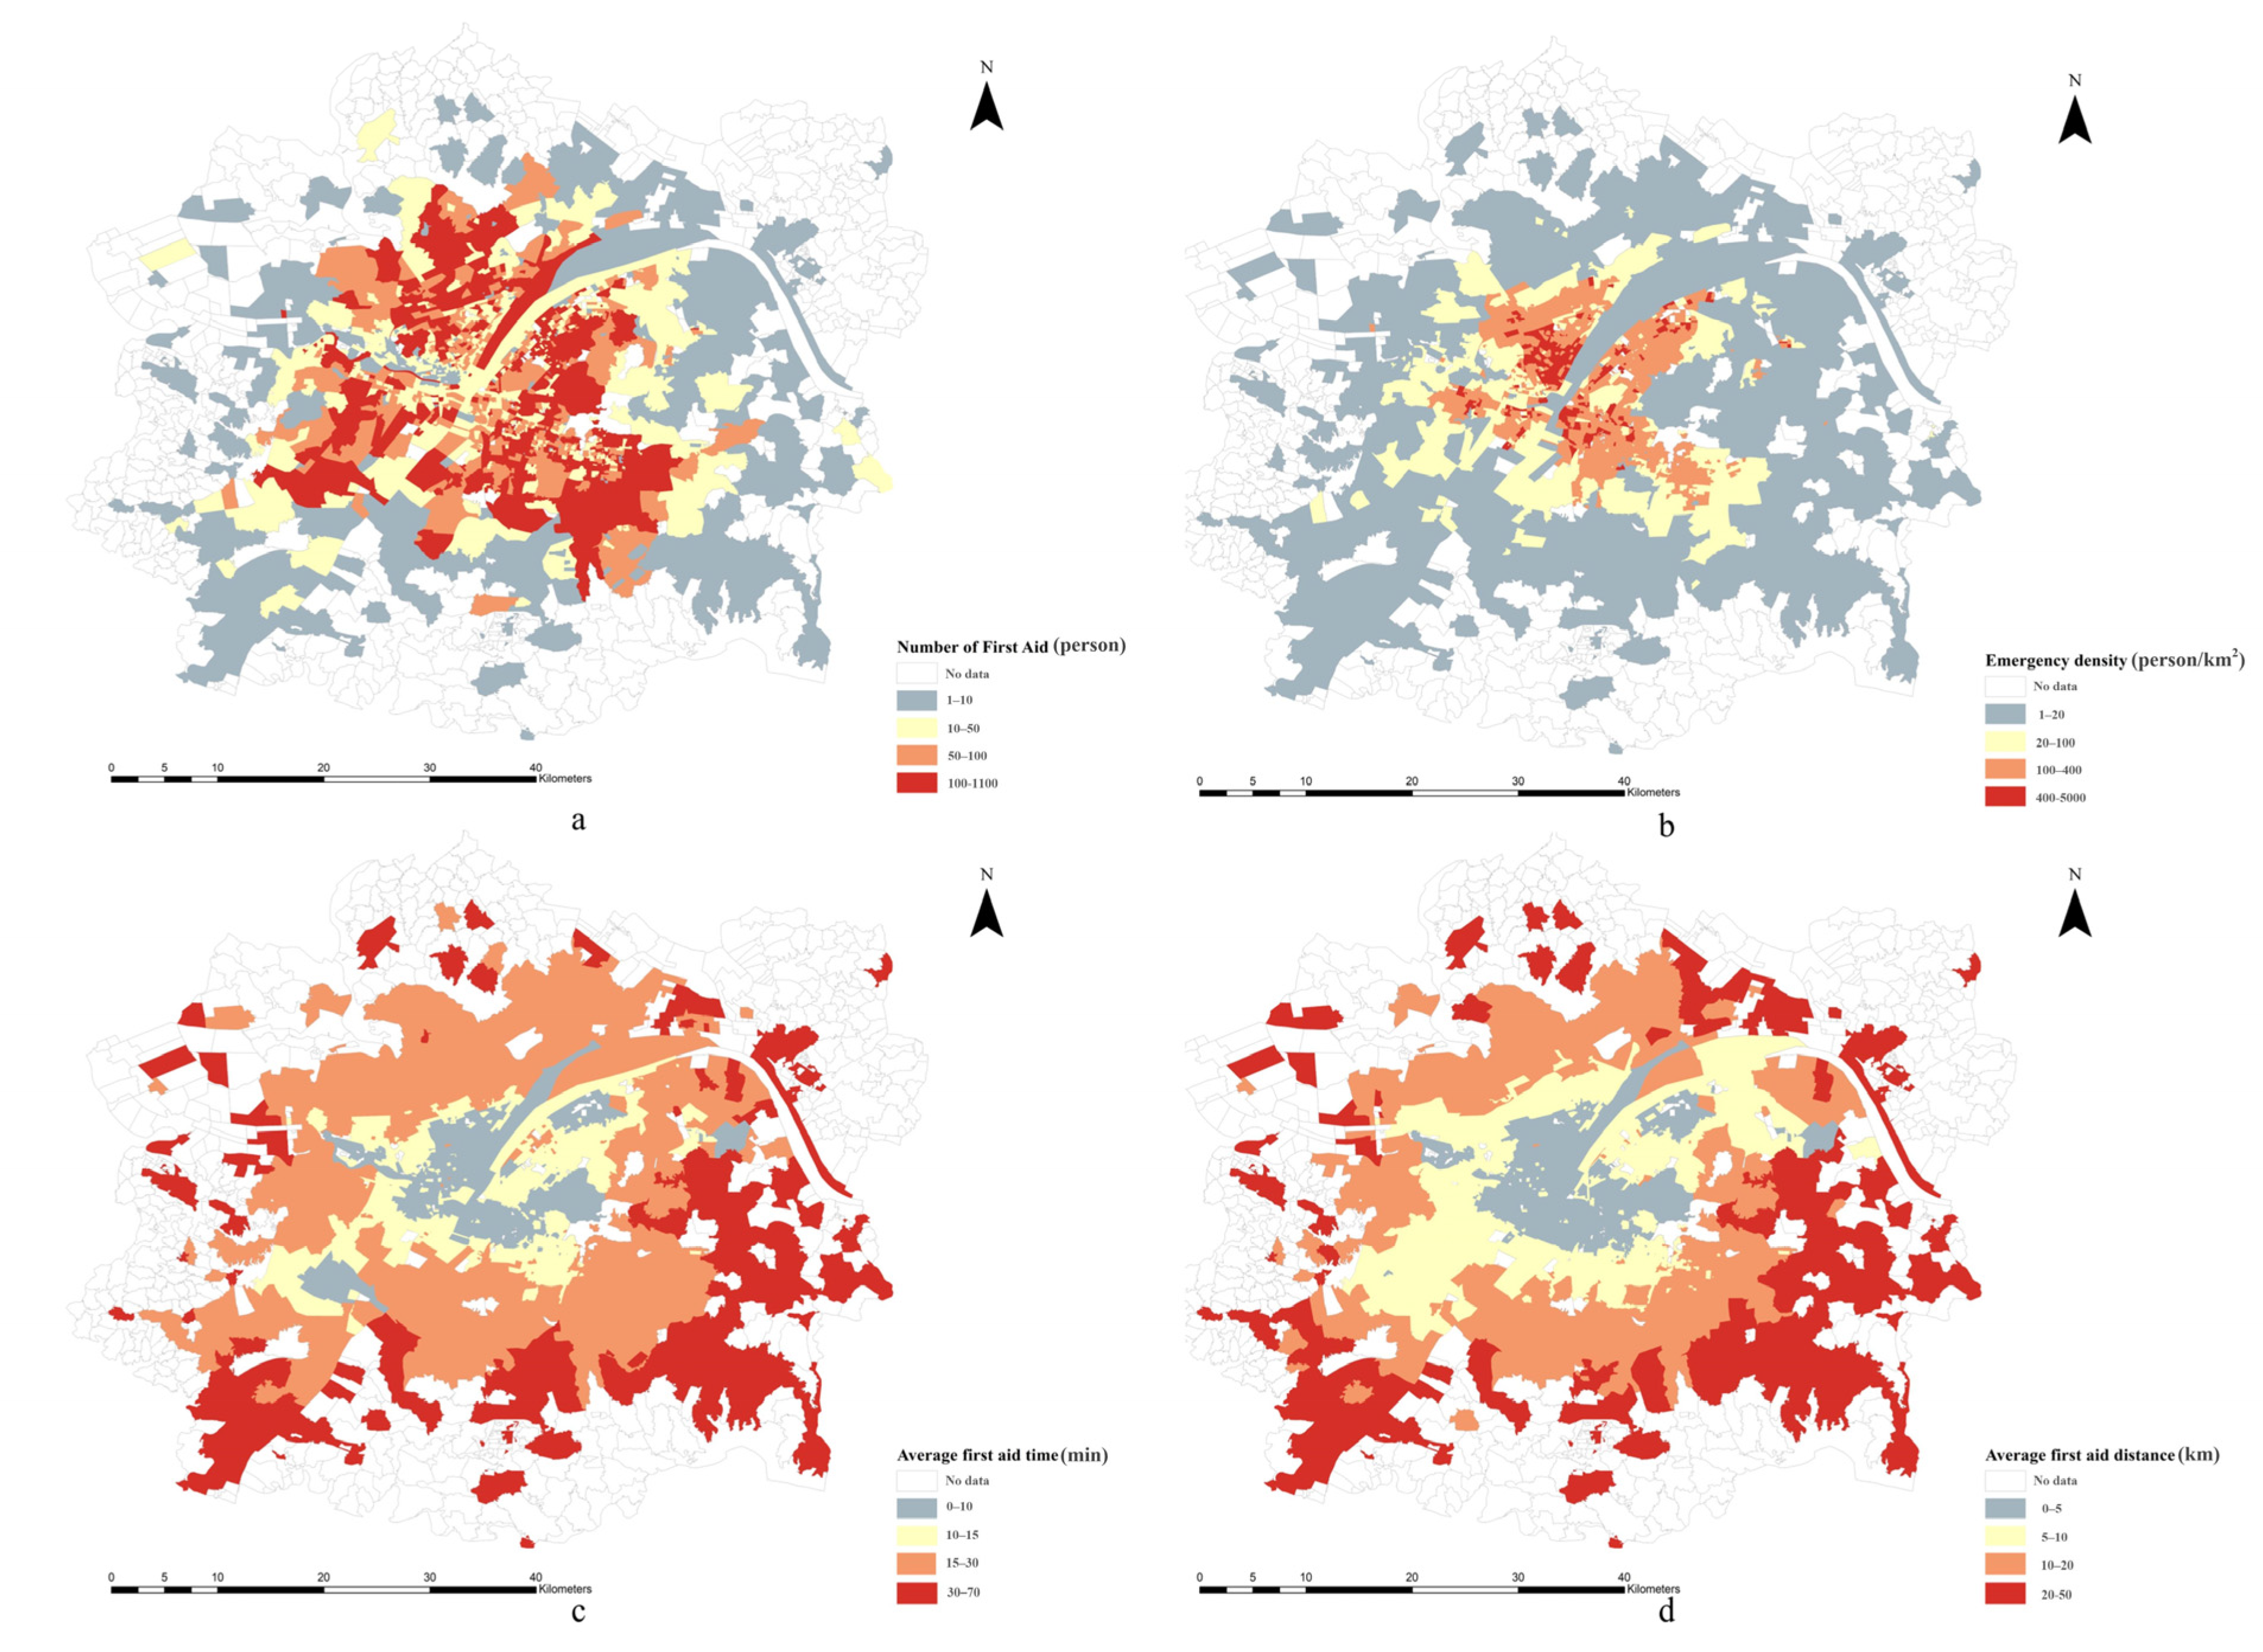
Figure 3 shows the spatial pattern of emergency medical treatment in the studied communities and reveals that significant differences exist in the number of medical emergencies among communities. Communities with many emergency incidents were mainly distributed within the third ring road, and the space outside the third ring road showed a decreasing spatial pattern of incidents toward the periphery of the city. Taking into account the differences in the community areas, communities with high emergency densities were mainly located in the more central urban-core areas, and the emergency density was much higher within the third ring road than it was outside of the third ring road. From the perspectives of the times and distances of emergencies from the hospitals, people in the core city-center area of Wuhan can reach hospitals more quickly, while those in the outer city area require more time and distance costs.
4.2. Spatial Characteristics of Emergency Services in Hospitals
Due to the well-developed medical resources in Wuhan, the region contains nearly 30 tertiary hospitals and more than 20 secondary hospitals, including three top-level domestic hospitals (Tongji Hospital, Union Hospital, and Renmin Hospital). In this study, hospitals were divided into four levels using different hospital levels: top-level hospitals, tertiary A hospitals, other tertiary hospitals, and hospitals below secondary. Table 1 shows the number of first aid incidents, the average time and distance of first aid incidents, and the average spatial range of first aid services in hospitals of different levels to measure the differences in emergency services among hospitals of different levels.
The average time to receive first aid in Wuhan was 13.06 min, and the average first aid travel distance was 6.66 km, reflecting the abundance of overall medical resources in Wuhan. However, large gaps were found between hospitals of different levels. From the perspective of the emergency distances and times of the hospitals, the time and spatial distance required for emergency treatment decreased when the hospital level declined; that is, the time and distance to the top-level hospitals in emergencies were the longest, followed by those of the tertiary A hospitals. The first aid time and distance were the shortest for general tertiary hospitals and for hospitals below secondary. In terms of the scope of first aid services, the higher the hospital level was, the higher the scope of first aid services was. The first aid range of the top-level hospitals was the highest, reaching 16.41 km, and the tertiary A hospitals reached an average range of 11.48 km; both of these ranges are higher than the overall level of the hospitals in Wuhan. It is worth mentioning that the emergency scope of ordinary tertiary hospitals was smaller than that of hospitals below the secondary level. This may be because tertiary hospitals are often located in urban centers, and urban centers are often associated with traffic jams and other travel-related problems. The similar emergency times obtained for these two these categories resulted in a gap between the emergency distances of tertiary hospitals and of hospitals below the secondary level. Determining reasonable rescue routes to ensure the smooth operation of emergency operations under the influence of traffic congestion is a field of study that is worthy of in-depth analyses.
The distribution characteristics of the hospital grade, number of first aid patients, average first aid time, and hospital influence are shown in Figure 4. The hospitals show an obvious spatial agglomeration phenomenon. In the study area, more hospitals were located in urban centers, and these hospitals had higher grades, while fewer hospitals were located in remote urban areas, and these remote hospitals had lower grades. More than 66% of the analyzed hospitals were located along the Yangtze River in the city center, and the four administrative regions north of the Yangtze River, Jianghan District, Jiang’an District, Qiaokou District, and Hanyang District were the most obvious. Hospitals with large numbers of emergency-treated patients were also mainly located along the Yangtze River in the city center. In contrast, the number of first aid patients in remote urban areas was very high, while the number of consultations in surrounding hospitals was very low. To obtain better medical treatment, most residents in remote urban areas chose hospitals that were relatively far away, thus increasing the emergency time and distance.
In general, hospitals located in the city center area are of higher hospital levels, have larger first aid treatment scopes, and require longer times for first aid treatment. The number of first aid patients in hospitals in remote urban areas is not high, but these hospitals require longer times and distances for treatment. Some hospitals in the central urban area (such as Zhongnan Hospital) have large numbers of emergency-treated patients, and their emergency times and spatial distances are short; these hospitals can thus handle most situations well. The best tertiary A hospitals in Wuhan (Tongji Hospital, Union Hospital, and Renmin Hospital) do not receive high volumes of consultations but still have the largest service scopes. Faced with serious and life-threatening incurable diseases, some emergency-treatment patients can only choose the best hospital and cannot consider the associated time or spatial cost extensively.
4.3. Relevant Factors to the Hospital Influence
We used ordinary least squares (OLS) and GWR to analyze the correlations among seven influencing factors in three aspects and the influence of the studied hospitals. The OLS model and GWR parameter results are shown in Table 2, and only four variables in the OLS model are significant, while all of the variables in the GWR are spatially non-stationary. As such, we choose GWR as the main model for analysis. As shown in Figure 5, 96.7% of communities in the study area had deviance residual values between −2.5 and 2.5, indicating that the relationships between all of the influencing factors and the scope of emergency services in the corresponding hospital are robust.
The results show that the influence of the studied factors differ significantly among different communities, further reflecting the spatial heterogeneity of the intensities of different influencing factors in different regions of the research area. From the perspective of positive and negative effects, the number of people cared for by the hospitals in Wuhan and the number of hospital beds in the study area both positively impact the influence of the hospitals; the number of other hospitals near each hospital, the number of medical practitioners in each hospital, the average annual number of outpatient visits, and the average annual number of emergency visits all negatively affect the influence levels of the hospitals in the study area; and the distance between each hospital and the city center shows a negative influence in a small part of the study area and a positive impact in a large part of the study area.
The response of the hospital influence to the distance of the hospital from the city center is positive in the southern region of Wuhan city and negative in the city center and northern region of Wuhan. This may be due to the high quality of hospitals in the urban center and the ability of these hospitals to meet the health needs of nearby residents, so more patients come from communities near these hospitals, and hospitals in the urban center thus show a negative response to location factors. Most of the hospitals that showed positive responses were located in new urban areas such as those in the southern part of the city. These urban areas have been gradually established through urban expansion and are located far away from the city center. There are few or no hospitals near the patient communities in the southern part of the city, and in emergency situations, long distances often must be traveled to meet medical needs. Therefore, the Southern Hospital of Wuhan City responds strongly to location factors.
The hospital influence shows a negative response to the number of other hospitals near each hospital in the entire study area, and this response is relatively strong in the region west of the Yangtze River. The possible reason for this result is that the region northwest of the Yangtze River mainly includes the Hankou District and Jiang’an District and was the main economic and commercial center of Wuhan before the 1990s. Compared to other regions, the economy in the region northwest of the Yangtze River is more developed, the public facilities are more abundant, transportation is more convenient, and the hospitals are great in number and high in quality. As this region has a solid economic foundation and rich medical resources, the competition among high-quality hospitals is intense, so the negative response in the northwestern Yangtze River area is obvious. However, the overly concentrated allocation of medical resources in this region may also lead to an uneven distribution of medical resources, which may increase the time spent on medical treatment by residents in other areas of the city.
The influence of hospitals has a positive response to the number of people covered by each hospital in the entire study area, and this response is relatively strong in the regions to the east and south of the Yangtze River. The possible reason for this result is that there are more permanent residents in the regions east of the Yangtze River and south of the Yangtze River than in other regions, and the population sizes covered by the hospitals are also larger. The hospitals must meet the daily medical needs of the residents in their corresponding coverage areas, so the emergency treatment scopes of these hospitals have increased accordingly. Specifically, the Hongshan District and Jiangxia District have large permanent populations and are located far away from the city center. Priority is given to tertiary hospitals in this area, but fewer hospitals are located in this area than in other areas of Wuhan, so medical treatment usually costs more in these districts than it does in other areas. Therefore, people usually need to spend more in time and distance costs in these regions than in other areas.
The influence of the number of hospital beds on the hospital influence was positive throughout the study area, and this influence was relatively strong on the hospitals in the northern and central areas of Wuhan. Many hospitals are located in the central area of the city, and the best hospitals in the province, such as Tongji Hospital and Union Hospital, are located in this area. The number of beds and the scope of influence of these top-level hospitals far exceed those of other hospitals. More obviously, even if these top-level hospitals have more beds than other hospitals, treating the most difficult rare diseases in the province is still difficult, and the bed utilization rates of these hospitals are thus much higher than those of other hospitals. This result also reflects the phenomenon in which patients with minor and serious illnesses in modern society in China go to tertiary A hospitals or even top-level hospitals, which may delay other hospitals from transferring untreated patients to top-level hospitals.
The influence of the number of hospital practitioners on hospital influence was exactly the opposite of that of the number of hospital beds; this influence was negative in the entire study area, and strong negative influences were observed for hospitals in the northern and central areas of Wuhan. Even if other hospitals in the city center have the same numbers of doctors as the top-level hospitals, large differences still exist in the scope of influence between top-level hospitals and other hospitals, and the views of urban resident of other hospitals and top-level hospitals cannot be changed. This may be in line with the anticipated assumptions of urban planners. In urban expansion, new hospitals must be built in remote urban areas to meet the medical needs of people in these areas, and the numbers of doctors and medical equipment in the tertiary hospitals in the city center area must be increased to ease the medical pressure on top-level hospitals.
In terms of medical capacity, the impacts of the annual number of outpatient visits to hospitals and the annual number of emergency visits to hospitals are exactly the opposite. Most hospitals with high annual outpatient visit response rates have low response rates to annual emergency visits. On the whole, the annual number of outpatient visits and the annual number of emergency visits in the analyzed hospitals show negative responses to the hospital influence. This may be due to the government’s separation of the main tasks of outpatient care, emergency care, and first aid and may also result from functional differences among hospitals. After being unanimously recognized by residents, top-level hospitals have very high numbers of annual outpatient visits and are placed under long-term high-load states, making it impossible to take care of both emergency and first aid situations. In response to this medical phenomenon, the government and emergency centers relieved the overall medical pressure on top-level hospitals by allowing other tertiary hospitals that are closer and that are better equipped with emergency and first aid supplies to undertake more emergency tasks. The hospital with the highest number of first aid incidents is not a top-level hospital, but the tertiary A hospitals are located near the top-level hospitals in the city center, further supporting our hypothesis.
5. Discussion
5.1. Choice of Regression Model
As determined by a review of previous studies, similar studies have evaluated the impact of gaps among hospitals through taxi-based travel survey data and have introduced other impact factors in response to the results [45]; however, the regression results of these studies were not good. One previous study used OLS regression analysis and did not consider geographic location factors [18], and the index system of that study failed to involve relevant location indicators and only focused on the global characteristics of regression coefficients. This paper also used an OLS model to conduct experiments, and the results were compared with those obtained using the GWR model results, as shown in Table 3.
Comparing these two models, the determination coefficient (R2) of the OLS model and the adjusted determination coefficient (R2 Adjusted) of the OLS model are 0.685 and 0.625, respectively, while the GWR model shows a better performance, with adjusted values of R2 and R2 of 0.867 and 0.813, respectively. The degree of model interpretation was 81%, and the AICc value of the GWR model was also smaller than that of the OLS model, indicating that the geographically weighted regression model that considered the location effects of spatial objects could better explain the differences in hospital influence. Even if the adjusted R2 value of the OLS model was not extremely low, only the significance values of the number of hospitals near each hospital and the number of people covered by each hospital were less than 0.01, and the other indicators were all >0.05; thus, the correlation was not significant.
After evaluating the uneven distribution of urban medical resources and the large differences in the accessibility of medical services, a further understanding of the reasons for these phenomena should be obtained. Compared to the ordinary OLS model, the GWR model could better explain the influencing factors of the differences in terms of hospital influence by considering local regression and by adding location influence factors. Hospitals in urban centers usually had greater hospital influence levels, indicating that tertiary hospitals present spatial agglomeration characteristics in urban centers. The greater the number of people covered by each hospital was, the greater the influence of that hospital was. However, for a remote urban area with a small number of hospitals, residents usually spend more time and travel greater distances to obtain better medical treatment.
5.2. Case Analyses of Key Hospitals
This method also helped us discover the collaborative relationships among hospitals in terms of data. Typically, other tertiary hospitals are located near top-level hospitals in city-center areas, and these tertiary hospitals can share the excessive medical pressure placed on the top-level hospitals. Taking Tongji Hospital and Union Hospital (affiliated with the HUST) as examples, these two top-level hospitals rank first and second in Wuhan, respectively, in terms of annual outpatient visits and annual emergency visits. The main campuses of these two hospitals are also very close to each other, causing very high medical pressure in the area. There are more than ten tertiary hospitals surrounding these two hospitals, among which Wuhan Central Hospital and Wuhan First Hospital have high medical capabilities, with their outpatient and emergency departments in the top 10 among hospitals in Wuhan. High-quality specialized hospitals, such as the Heart Hospital, Pulmonary Hospital, and Traditional Chinese Medicine Hospital, are also located nearby. To divert patients, the Wuhan Emergency Center diverts priority emergency patients in the area to the surrounding hospitals. Medical problems that cannot be solved by other hospitals are transferred to specialist hospitals or to the two top-level hospitals. With the support of this policy, Tongji Hospital and Union Hospital (affiliated with the HUST) ranked 13th and 17th in Wuhan for the first time in their numbers of emergency patients. At the same time, the number of first aid incidents processed by Wuhan Central Hospital ranked first in Wuhan. A sufficient number of hospitals are available to relieve medical pressure in this area. In contrast, as a top-level hospital, the Affiliated People’s Hospital of Wuhan University, ranks third in its number of annual outpatient visits and annual emergency visits. Near the People’s Hospital, only the Wuhan Third Hospital has sufficient medical conditions to share some of the medical pressure placed on the top-level hospital. Although the number of emergency patients received by the Wuhan Third Hospital reached second place in the city, there is a lack of sufficient hospitals to share the burden of the People’s Hospital, and this lack has caused the People’s Hospital to accept the sixth-highest number of emergency patients in the city, much higher than the number of patients accepted by Tongji Hospital and Union Hospital. This kind of regional medical pressure should be prioritized by government departments, especially under the current tense conditions associated with the global pandemic.
6. Conclusions
In response to prevailing medical inequalities and social inequalities, this research proposed a method by which the scope of a hospital’s influence can be measured and by which the differences in the spatial characteristics of emergency services in medical facilities in Wuhan can be analyzed. By analyzing the psychological inferences of the community, this method can discover the spatial patterns of community resident medical treatment from the community perspective. In Wuhan, where the medical resources are generally well-developed, top-level hospitals have the largest range of services, followed by other tertiary A hospitals, all of which have better services than the average overall level of hospitals throughout the city. Hospitals of other levels have relatively small service areas and can only serve their neighboring communities. Wuhan presents obvious health inequality, with the high-grade hospitals having spatial agglomeration in the city-center area, while the number and quality of hospitals in the peripheral areas are lower than those in the central area. In the era of big data, using mobile phone signaling data or other new survey data sources can obtain more new data to supplement traditional research. This quantitative research method that uses actual data to deduce the impact of public facilities and services has strong applicability and can be applied to other public facilities, such as educational facilities and commercial facilities, to provide a scientific basis on which government departments can make refined policy recommendations.
In addition, this study also explored the influencing factors of the hospital influence using a GWR model. After location factors such as the distance between each hospital and the city center, the presence of other hospitals near each hospital, and the population covered by each hospital are added, the GWR model can explain spatial differences in the hospital influence well. Hospital influence is not only related to the equipment and medical ability of each hospital but is also affected by location factors. Although the research data used in this study have certain limitations, this research furthers the study of geospatial mining methods for general medical emergency data, analyzes the differences in the medical resource supply from the hospital perspective, and supplements accessibility research from the demand side. In the future, if the outpatient and emergency data of various hospitals are further considered, the interactions between actual flows of people and medical facilities can also be optimally portrayed. In the future, we will collect and use other socio-demographic data to further evaluate the distribution of hospitals at all levels.
Author Contributions
Conceptualization, S.F. and Y.L.; methodology, S.F.; software, S.F.; validation, Y.F.; formal analysis, S.F.; investigation, Y.L.; resources, Y.L.; data curation, S.F.; writing—original draft preparation, Y.L.; writing—review and editing, S.F.; visualization, S.F.; supervision, Y.F.; project administration, Y.L.; funding acquisition, Y.L. All authors have read and agreed to the published version of the manuscript.
Funding
This research was financially supported by the National Key Research and Development Program of China (No. 2017YFB0503601).
Conflicts of Interest
The authors declare no conflict of interest.
References
- Chin, M.H.; King, P.T.; Jones, R.G. Lessons for achieving health equity comparing Aotearoa/New Zealand and the United States. Health Policy 2018, 122, 837–853. [Google Scholar] [CrossRef]
- Gómez, J.M.N.; Castanho, R.A.; Cabezas Fernández, J.; Loures, L. Assessing Health Resources Equipped with Hemodynamic Rooms in the Portuguese-Spanish Borderland: Cross-Border Cooperation Strategies as a Possible Solution. ISPRS Int. J. Geo-Inf. 2021, 10, 514. [Google Scholar] [CrossRef]
- Hu, L.; He, S.; Luo, Y.; Su, S.; Xin, J.; Weng, M. A social-media-based approach to assessing the effectiveness of equitable housing policy in mitigating education accessibility induced social inequalities in Shanghai, China. Land Use Policy 2020, 94, 104513. [Google Scholar] [CrossRef]
- Su, S.; He, S.; Sun, C.; Zhang, H.; Hu, L.; Kang, M. Do landscape amenities impact private housing rental prices? A hierarchical hedonic modeling approach based on semantic and sentimental analysis of online housing advertisements across five Chinese megacities. Urban For. Urban Green. 2021, 58, 126968. [Google Scholar] [CrossRef]
- Dadashpoor, H.; Rostami, F.; Alizadeh, B. Is inequality in the distribution of urban facilities inequitable? Exploring a method for identifying spatial inequity in an Iranian city. Cities 2016, 52, 159–172. [Google Scholar] [CrossRef]
- Genevieve, B.; Robbin, D.; Rania, W.; Heather, O.; Kevin, M.; Ron, B.; Ahmed, E. Measuring accessibility to hospitals by public transport: An assessment of eight Canadian metropolitan regions. J. Transp. Health 2020, 18, 100916. [Google Scholar]
- Liu, M.; Luo, S.; Du, X. Exploring Equity in Healthcare Services: Spatial Accessibility Changes during Subway Expansion. ISPRS Int. J. Geo-Inf. 2021, 10, 439. [Google Scholar] [CrossRef]
- Zhou, Z.; Xu, Z.; Liu, A.; Zhou, S.; Mu, L.; Zhang, X. Mapping the Accessibility of Medical Facilities of Wuhan during the COVID-19 Pandemic. ISPRS Int. J. Geo-Inf. 2021, 10, 318. [Google Scholar] [CrossRef]
- Holl, A. Twenty years of accessibility improvements the case of the Spanish motorway building programme. J Transp. Geogr. 2007, 15, 286–297. [Google Scholar] [CrossRef]
- Tenkanen, H.; Saarsalmi, P.; Jarv, O.; Salonen, M.; Toivonen, T. Health research needs more comprehensive accessibility measures: Integrating time and transport modes from open data. Int. J. Health Geogr. 2016, 15, 23. [Google Scholar] [CrossRef] [Green Version]
- Dadashpoor, H.; Rostami, F. Measuring spatial proportionality between service availability, accessibility. J. Transp. Geogr. 2017, 65, 44–55. [Google Scholar] [CrossRef]
- Behnam, T.; Mohammad, H.M.; Hossein, H.; Inhi, K. Multimodal accessibility-based equity assessment of urban public facilities distribution. Sustain. Cities Soc. 2019, 49, 101633. [Google Scholar]
- Park, J.; Goldberg, D.W. A Review of Recent Spatial Accessibility Studies That Benefitted from Advanced Geospatial Information: Multimodal Transportation and Spatiotemporal Disaggregation. ISPRS Int. J. Geo-Inf. 2021, 10, 532. [Google Scholar] [CrossRef]
- Arranz Lopez, A.; Soria-Lara, J.A.; Pueyo-Campos, A. Social and spatial equity effects of non-motorised accessibility to retail. Cities 2019, 86, 71–82. [Google Scholar] [CrossRef] [Green Version]
- Xu, M.; Xin, J.; Su, S.; Weng, M.; Cai, Z. Social inequalities of park accessibility in Shenzhen, China: The role of park quality, transport modes, and hierarchical socioeconomic characteristics. J. Transp. Geogr. 2017, 62, 38–50. [Google Scholar] [CrossRef]
- Järv, O.; Tenkanen, H.; Salonen, M.; Ahas, R.; Toivonen, T. Dynamic cities: Location-based accessibility modelling as a function of time. Appl. Geogr. 2018, 95, 101–110. [Google Scholar] [CrossRef]
- Yin, C.; He, Q.; Liu, Y.; Chen, W.; Gao, Y. Inequality of public health and its role in spatial accessibility to medical facilities in China. Appl. Geogr. 2018, 92, 50–62. [Google Scholar] [CrossRef]
- Shen, Y.; Li, L. The influence of medical facility accessibility on residents’ health seeking behaviors from the perspective of age stratification: A case study of shanghai Chongming island. Hum. Geogr. 2021, 36, 46–54. [Google Scholar]
- Siegel, M.; Koller, D.; Vogt, V.; Sundmacher, L. Developing a composite index of spatial accessibility across different health care sectors: A German example. Health Policy 2016, 120, 205–212. [Google Scholar] [CrossRef]
- Song, Z.; Chen, W.; Zhang, G.; Zhang, L. Spatial Accessibility to Public Service Facilities and Its Measurement Approaches. Prog. Geogr. 2010, 29, 1217–1224. [Google Scholar]
- Schultz, C.L.; Wilhelm Stanis, S.A.; Sayers, S.P. A longitudinal examination of improved access on park use and physical activity in a low-income and majority African American neighborhood park. Prev. Med. 2017, 95, 95–100. [Google Scholar] [CrossRef]
- Lakhani, A.; Parekh, S.; Gudes, O.; Grimbeek, P.; Harre, P.; Stocker, J.; Kendall, E. Disability support services in Queensland, Australia: Identifying service gaps through spatial analysis. Appl. Geogr. 2019, 110, 102045. [Google Scholar] [CrossRef]
- Liao, X.; Wang, H.; Zhao, W. Evaluation method of medical facilities service coverage in mountainous cities based on map data. J. Geo-Inf. Sci. 2021, 23, 604–616. [Google Scholar]
- Liu, S.; Qin, Y.; Xu, Y. Inequality and influencing factors of spatial accessibility of medical facilities in rural areas of China: A case study of Henan Province. Int. J. Environ. Res. Public Health 2019, 16, 1833. [Google Scholar] [CrossRef] [PubMed] [Green Version]
- Rong, P.; Zheng, Z.; Kwan, M.; Qin, Y. Evaluation of the spatial equity of medical facilities based on improved potential model and map service API: A case study in Zhengzhou, China. Appl. Geogr. 2020, 119, 102192. [Google Scholar] [CrossRef]
- Paul, L.D. Spatial accessibility in suboptimally configured health care systems: A modified two-step floating catchment area (M2SFCA) metric. Health Place 2013, 24, 30–43. [Google Scholar]
- Giuliano, G.; Kang, S. Spatial dynamics of the logistics industry: Evidence from California. J. Transp. Geogr. 2018, 66, 248–258. [Google Scholar] [CrossRef]
- Hu, R.; Dong, S.; Hu, H. A two-step floating catchment area (2sfca) method for measuring spatial accessibility to primary healthcare searvice in China: A case study of Donghai county in Jiangsu Province. Prog. Geogr. 2012, 31, 1600–1607. [Google Scholar]
- Wang, J.; Chen, X.; Zhao, L. A two-stage matching method for medical service supply and demand considering the demander expectation. Chin. J. Manag. Sci. 2015, 25, 132–136. [Google Scholar]
- Wu, J.; Si, M.; Li, W. Spatial equity analysis of urban green space from the perspective of balance between supply and demand: A case study of Futian District, Shenzhen, China. Chin. J. Appl. Ecol. 2016, 27, 2831–2838. [Google Scholar]
- Koos, F.; Tijs, N.; Philippe, D.M.; Greet, D. A commuter-based two-step floating catchment area method for measuring spatial accessibility of daycare centers. Health Place 2015, 32, 65–72. [Google Scholar]
- Xing, L.; Liu, Y.; Liu, X. Measuring spatial disparity in accessibility with a multi-mode method based on park green spaces classification in Wuhan, China. Appl. Geogr. 2018, 94, 251–261. [Google Scholar] [CrossRef]
- Rød, J.K.; Eide, A.H.; Halvorsen, T.; Munthali, A. Using Prospective Methods to Identify Fieldwork Locations Favourable to Understanding Divergences in Health Care Accessibility. ISPRS Int. J. Geo-Inf. 2021, 10, 506. [Google Scholar] [CrossRef]
- Fan, L.; Lin, X.; Wang, D. Spatial-temporal succession characteristics of public service facilities supply and demand coordinated development in Beijing: A case study of educational and medical facilities. Hum. Geogr. 2015, 30, 105–110. [Google Scholar]
- Wang, Y.; Liu, Y.; Xing, L.; Zhang, Z. An Improved Accessibility-Based Model to Evaluate Educational Equity: A Case Study in the City of Wuhan. ISPRS Int. J. Geo-Inf. 2021, 10, 458. [Google Scholar] [CrossRef]
- Fan, P.; Xu, L.; Yue, W.; Chen, J. Accessibility of public urban green space in an urban periphery: The case of Shanghai. Landsc. Urban Plan. 2016, 165, 177–192. [Google Scholar] [CrossRef]
- Hao, F.; Zhang, H.; Wang, S. Spatial accessibility of urban green space in central area of Changchun: An analysis based on the multi-trip model. Sci. Geogr. Sin. 2021, 41, 695–704. [Google Scholar]
- Tan, P.Y.; Samsudin, R. Effects of spatial scale on assessment of spatial equity of urban park provision. Landsc. Urban Plan. 2017, 158, 139–154. [Google Scholar] [CrossRef]
- Curtis, C.; Ellder, E.; Scheurer, J. Public transport accessibility tools matter: A case study of Gothenburg, Sweden. Case Study Transp. Policy 2019, 7, 96–107. [Google Scholar] [CrossRef]
- Tobias, M.; Silva, N.; Rodrigues, D. Perception of health and accessibility in Amazonia: An approach with GIS mapping to making decision on hospital location. J. Transp. Health 2015, 2, 60–61. [Google Scholar] [CrossRef]
- Zhao, P.; Luo, J.; Hu, H. Spatial match between residents’ daily life circle and public service facilities using big data analytics: A case of Beijing. Prog. Geogr. 2021, 40, 541–553. [Google Scholar] [CrossRef]
- Zhong, S.; Yang, X.; Chen, R. The accessibility measurement of hierarchy public service facilities based on multi-mode network dataset and the two-step 2SFCA: A case study of Beijing′s medical facilities. Geogr. Res. 2016, 35, 731–744. [Google Scholar]
- Jin, M.; Liu, L.; Tong, D.; Gong, Y.; Liu, Y. Evaluating the spatial accessibility and distribution balance of multi-level medical service facilities. Int. J. Environ. Res. Public Health 2019, 16, 1150. [Google Scholar] [CrossRef] [PubMed] [Green Version]
- Ren, J.; Wang, Y. Spatial accessibility of park green space in Huangpu District of Shanghai based on modified two-step floating catchment area method. Prog. Geogr. 2021, 40, 774–783. [Google Scholar] [CrossRef]
- Sun, Y.; Lv, B.; Zhao, Y. A study of county public service facilities distribution assessment based on behavior investigation and GIS: A case study of medical facilities in Dexing. Hum. Geogr. 2015, 30, 103–110. [Google Scholar]
- Zuo, Y.; Tao, H.; Xiong, G. Exploring the Definition Method of Basic Medical Care Service Scope. Chin. Health Econ. 2014, 33, 31–33. [Google Scholar]
- Zhang, Z.; Liu, Y.; Wang, Y.; Liu, Y.; Zhang, Y. What factors affect the synergy and tradeoff between ecosystem services, and how, from a geospatial perspective? J. Clean. Prod. 2020, 257, 120454. [Google Scholar] [CrossRef]
- Ying, Y.; Koeva, M.; Kuffer, M.; Asiama, K.O.; Li, X.; Zevenbergen, J. Making the Third Dimension (3D) Explicit in Hedonic Price Modelling: A Case Study of Xi’an, China. Land 2021, 10, 24. [Google Scholar] [CrossRef]
Figure 1.
The metropolitan development zone (MDZ) of Wuhan.

Figure 2.
Distance attenuation of the number of emergency patients in Wuhan hospitals.

Figure 3.
First aid incident numbers among communities (a), community densities (b), average first aid times (c), and average first aid distances (d).
Figure 3.
First aid incident numbers among communities (a), community densities (b), average first aid times (c), and average first aid distances (d).

Figure 4.
The spatial characteristics of the analyzed hospitals: hospital level (a), number of first aid patients (b), time to first aid treatment (c), and hospital influence (d).
Figure 4.
The spatial characteristics of the analyzed hospitals: hospital level (a), number of first aid patients (b), time to first aid treatment (c), and hospital influence (d).

Figure 5.
Deviance residuals of the GWR (a), spatial distributions of the regression coefficients: the distance to the city center (b), the number of other hospitals near each hospital (c), the number of people covered by each hospital (d), the number of hospital beds (e), the number of medical practitioners (f), the number of outpatient visits (g), the number of emergency visits (h), and the local R2 of GWR (i).


Table 1.
Emergency indicators obtained for hospitals of different levels.
| Hospital Level | Number of Emergency Patients | Average Emergency Time (min) | Average Emergency Distance (km) | Average Hospital Influence (km) |
|---|---|---|---|---|
| Top-level hospitals | 11,720 | 15.69 | 9.25 | 16.41 |
| Tertiary A hospitals | 50,753 | 14.23 | 7.39 | 11.48 |
| Other tertiary A hospitals | 16,480 | 10.81 | 4.57 | 6.30 |
| Hospitals below secondary | 21,583 | 10.59 | 5.14 | 9.49 |
| All hospitals in Wuhan | 100,536 | 13.06 | 6.66 | 10.43 |
Table 2.
OLS model and GWR parameter results.
| OLS | GWR | |||||||||||
|---|---|---|---|---|---|---|---|---|---|---|---|---|
| Variable | Unstandardized Beta | Standard Error | Standardized Beta | T Test | Sig | VIF | Mean | STD | Min | Median | Max | Diff |
| Intercept | 11.437 | 3.324 | / | 3.441 | 0.001 ** | / | 11.250 | 2.454 | 5.996 | 12.497 | 15.379 | −6.315 |
| The distance to the city center | 0.004 | 0.000 | 0.106 | 0.642 | 0.525 | 3.223 | −0.004 | 0.016 | −0.194 | −0.012 | 0.643 | −4.738 |
| Hospitals near other hospital | −0.317 | 0.117 | −0.443 | −2.702 | 0.009 ** | 3.176 | −0.298 | 0.058 | −0.437 | −0.299 | −0.198 | −1.246 |
| People covered by each hospital | 0.042 | 0.013 | 0.978 | 6.145 | 0.000 ** | 1.751 | 0.407 | 0.033 | 0.357 | 0.399 | 0.468 | −0.981 |
| Hospital beds | 0.045 | 0.014 | 0.906 | 1.116 | 0.271 | 3.148 | 0.043 | 0.008 | 0.025 | 0.045 | 0.056 | −2.489 |
| Medical practitioners | −0.091 | 0.029 | −0.812 | −1.533 | 0.134 | 3.318 | −0.080 | 0.043 | −0.135 | −0.091 | 0.044 | −5.351 |
| Outpatient visits | 0.069 | 0.041 | 0.147 | 0.749 | 0.459 | 4.529 | −0.081 | 0.044 | −0.210 | −0.073 | −0.005 | −0.337 |
| Emergency visits | −0.183 | 0.093 | −0.422 | −1.757 | 0.047 * | 6.823 | −0.160 | 0.049 | −0.264 | −0.148 | −0.089 | −0.907 |
Note: * and **, respectively indicate p < 0.05 and p < 0.01; negative value of diff-Criterion suggests spatial non-stationarity.
Table 3.
Indicators of different models.
| Model Indicator | OLS Model | GWR Model |
|---|---|---|
| R2 | 0.685 | 0.867 |
| R2 Adjusted | 0.625 | 0.813 |
| AICc (corrected Akaike information criterion) | 258.502 | 236.694 |
Publisher’s Note: MDPI stays neutral with regard to jurisdictional claims in published maps and institutional affiliations. |
© 2021 by the authors. Licensee MDPI, Basel, Switzerland. This article is an open access article distributed under the terms and conditions of the Creative Commons Attribution (CC BY) license (https://creativecommons.org/licenses/by/4.0/).
Share and Cite
MDPI and ACS Style
Fu, S.; Liu, Y.; Fang, Y. Measuring the Differences of Public Health Service Facilities and Their Influencing Factors. Land 2021, 10, 1225. https://0-doi-org.brum.beds.ac.uk/10.3390/land10111225
AMA Style
Fu S, Liu Y, Fang Y. Measuring the Differences of Public Health Service Facilities and Their Influencing Factors. Land. 2021; 10(11):1225. https://0-doi-org.brum.beds.ac.uk/10.3390/land10111225
Chicago/Turabian StyleFu, Shihang, Yaolin Liu, and Ying Fang. 2021. "Measuring the Differences of Public Health Service Facilities and Their Influencing Factors" Land 10, no. 11: 1225. https://0-doi-org.brum.beds.ac.uk/10.3390/land10111225
Note that from the first issue of 2016, this journal uses article numbers instead of page numbers. See further details here.