Article

Developing a Climate Change Vulnerability Index for Coastal City Sustainability, Mitigation, and Adaptation: A Case Study of Kuala Terengganu, Malaysia

by
Milad Bagheri
1,
Zelina Zaiton Ibrahim
2,
Mohd Fadzil Akhir
1,*,
Wan Izatul Asma Wan Talaat
1,
Bahareh Oryani
3,
Shahabaldin Rezania
4,
Isabelle D. Wolf
5,6 and
Amin Beiranvand Pour
1
1
Institute of Oceanography and Environment, Universiti Malaysia Terengganu, Kuala Terengganu 21030, Malaysia
2
Department of Environment, Faculty of Environmental and forestry, Universiti Putra Malaysia, Seri Kembangan 43400, Malaysia
3
Technology Management, Economics and Policy Program, College of Engineering, Seoul National University, 1 Gwanak-ro, Gwanak-gu, Seoul 08826, Korea
4
Department of Environment and Energy, Sejong University, Seoul 05006, Korea
5
School of Geography and Sustainable Communities, University of Wollongong, Northfields Avenue, Wollongong, NSW 2522, Australia
6
Centre for Ecosystem Science, University of New South Wales, Sydney, NSW 2052, Australia
*
Author to whom correspondence should be addressed.
Submission received: 21 October 2021 / Revised: 7 November 2021 / Accepted: 16 November 2021 / Published: 19 November 2021

Abstract

:
Coastal hazards are an urgent issue of global concern considering the increasing population pressure in coastal regions, retreating coastlines, and rising seawater levels. Here we demonstrate the process of assessing the vulnerability of a coastal urban environment using the case of Kuala Terengganu, a coastal town in Malaysia, and evaluating the potential social, environmental, and economic impacts. Uncertainties in the human dimensions of global change deeply affect the assessment and responses to environmental, climatic, and non-climate impacts on coastal city population growth and communities. We address these uncertainties by combining a Delphi-Analytical Hierarchy Process (Delphi-AHP) model and Geographic Information System (GIS)tools to determine mitigation and adaptation probabilities as part of a Coastal City Vulnerability Assessment. We conclude by presenting calculations of the short- and long-term suitability for land use and recommending hazard mitigation measures to equip city planners and decision-makers in evaluating hazards and potential impacts on coastal city areas.

1. Introduction

Close to 50% of the world’s population lives within 200 km of a coastline, with projections suggesting this figure will rise to 70% by 2025 [1]. Knowledge of the vulnerability of coastal cities enables scientists and policymakers to anticipate impacts that could emerge from rising sea levels, floods, erosion, and other hazards [2]. This helps with prioritizing measures to minimize risks and mitigate impacts. Because of the high value of natural and socio-economic assets threatened or lost in coastal zones [3], it is important to identify the types and magnitude of problems affecting coastal cities and possible adaptations to them [4].
Due to combined environmental, climatic, and non-climatic influences, coastal cities in some countries are highly vulnerable to adverse environmental impacts. Research in this field has focused on three major strands [5]:
  • The first strand discusses non-climatic causes, such as accelerated urbanization, industrial growth, and property privilege, which have intensified vulnerability in certain coastal cities [6,7,8,9,10,11].
  • The second strand explores global warming and rising temperatures and how they have jeopardized water supply, food production and security, and human health [12,13,14,15,16,17,18].
  • The third strand studies the impacts of climate change on coastal cities and low-lying regions, which mainly focus on sea-level rise, flooding, erosion, storms, and typhoons [19,20,21,22,23,24].
Along the eastern coast of peninsular Malaysia bordering the South China Sea (SCS), flooding, coastal erosion, and coastal change constitute severe problems [25].

1.1. Land-Use Change and Destruction of Coastal City Regions

As noted [26] coastal flooding and sea-level rise in low-lying areas are expected to cause major damage unless significant adaptations take place.
As coastal populations continue to grow, better ways are also needed to increase coastal area resilience to the effects of storms, flooding, and erosion [27]. Many challenges are faced in assessing environmental and non-climatic impacts on coastal areas. Because of the rapid urbanization process, coastal regions have been densely populated and economically developed and so their protection needs to be a great social and economic priority [28].
Nevertheless, a holistic assessment of the effects of hazards on the coastal area is required to develop appropriate adaptation strategies to minimize potential damage [29]. Numerous factors need to be considered: The highly dynamic nature of the coastal environment may affect public safety and lead to the destruction of property due to submergence, flooding, saltwater intrusion in surface waters, and coastal erosion [30]. Consequently, coastal communities are exposed to a greater risk of property and infrastructure damage due to flooding [31]. Sea level rise increases coastal vulnerability to flooding, particularly during rainstorms, because as the level of the sea rises, low areas drain more slowly. Flooding occasioned by rainstorms may be aggravated if rises in temperatures increase rainfall intensity during heavy storms [32]. Sea level rise can also increase the vulnerability of low-lying areas to erosion and cause loss of beach [3]. Beaches and near-shore areas that offer habitats for fish, shellfish, shorebirds, as well as other species might shift inland or be lost. Conversely, coastal erosion aggravates the vulnerability to storms through the removal of dunes and beaches which offer protection against waves [33].
Malaysia in particular has been affected by sea levels rising on average 1.6–3.6 mm per year in the 1955–2003 period [34]. Coastal vulnerability index (CVI) studies are needed to assist in hazard management and planning in Malaysia and elsewhere to better understand the risk level that different coastal areas experience [4]. Coastal vulnerability encompasses bio-geophysical, economic, institutional, and socio-cultural factors. Knowing vulnerability may assist scientists and policymakers to forecast the effect of environmental impacts and consequently prioritize mitigation measures to minimize risks and impacts. Malaysia has developed an arsenal of programs and initiatives to manage coastlines, including an adaptation program initiated in the Ninth Malaysian Plan (2006–2010) which also focuses on the CVI. Also established was an Integrated Coastal Zone Management (ICZM) program, a coastline protection program, known as Storm Water Management and Road Tunnel (SMART), and a flood mitigation program. In our study, we focus on Terengganu, which has great value for the country as one of Southeast Asia’s most popular tourist destinations and marine tourism gateways to the East Coast Economic Region (ECER) [35]. It is known for various unique tourism attractions catering to mainland coastal and island tourism, ecotourism, urban tourism, and its traditional culture and heritage tourism.
Using Terengganu as a case study area, the specific focus of our study was on three issues relevant for coastal cities:
  • What type of vulnerabilities exists?
  • What are the options to adapt and mitigate vulnerabilities?
  • What is the state of planning for adaptation?
Methodologically, we answered these questions by assessing the vulnerability and impact of Terengganu as a coastal city using Multicriteria Decision Analysis (MCDA) models and GIS tools. We will describe our approach in more detail in the following and also highlight the novelty, and importance, of this research.

1.2. Application of MCDA Model and GIS for Coastal City Vulnerability

Using MCDA models and GIS to determine the vulnerability of coastal cities is very effective at developing a consensus through soliciting expert opinions during successive stages of questionnaire administration and feedback [36]. This method is well suited as a research instrument when there is incomplete knowledge about a problem or phenomenon [37]. It has proven well suited for building frameworks, forecasting, prioritizing and decision-making, forecasting of uncertain factors capitalising on expert opinion where there is little or no definitive evidence and where opinion matters [38].
The Delphi technique was chosen as an efficient method of producing creative solutions [39]. This approach was applied successfully in environmental studies, industrial engineering, and project assessments [40]. The strength of the Delphi method lies in obtaining group opinions and expert judgment through anonymous, multilevel group interaction [41]. Remote data collection is an essential benefit of the Delphy technique, as participants may be spatially dispersed and questions can be administered by phone, Skype, fax, or post [42]. The Delphi method assigns priority ranks to the variables using pairwise comparisons at each level of the hierarchy [43].
The hierarchy approach, for instance, assessed the vulnerability criteria and sub-criteria of erosion on the coastal city area, which required analysis of both qualitative information on coastal city areas [13]. The analytic hierarchy process (AHP) is one of the most widely used multi-criteria decision making (MCDA) techniques which has frequently been used for solving decision problems through minimizing complex decisions to a series of pairwise comparisons [44,45,46,47,48]. The AHP can accommodate both tangible and intangible criteria, individual values and shared-value measures, and the interaction between them, with the aim of synthesizing all the information and arriving at priorities that indicate preferences in the group decision process [28,30,49]. This technique enables analysts and decision-makers to organize the critical aspects of a complex decision-making problem in the form of a hierarchical structure like a family tree [50]. A Delphi and AHP model can evaluate many qualitative criteria and semi-quantitative criteria systematically based on expert judgments and through a process of determining the relative importance of a set of criteria [51]. One vital merit of MCDA is its ability to bring out the similarities and possible conflict areas among stakeholders in group decision-making that enhance a thorough understanding of the values of others [52].
Since the 1990s, coastal city planners have significantly increased their attention on the incorporation of the multi-criteria decision-making approach with GIS to solve the problems of spatial planning [53]. The ability of GIS to handle spatial facets of vulnerability assessments has improved its application in the criteria-based assessment for prioritization, and selection of possible appropriate and inappropriate areas, because the majority of the conditions for vulnerability assessment are spatial data [54]. GIS tools were thought to be a speedy tool for CCVA, especially for incomplete data situations.
We have developed a CCVA model by integrating GIS tools and the Delphi-AHP model for coastal city land use. The combination of the GIS technique and the Delphi-AHP model is a powerful approach that uses assessments of vulnerability in coastal city areas [55]. The assessment of the CCVA model aims to compare different regions and weigh them according to their vulnerability area. We showcase the capability of GIS to seamlessly integrate with the SMCDA method by presenting maps of the vulnerability of the city of Kuala Terengganu. In the GIS context, this study proposes a novel comparison framework that integrates the Delphi-AHP model for weighing GIS layers and creating vulnerability maps. This combination approach entails proper case retrieval and indexing, as well as the use of domain knowledge for feature weighting. The assignment of significance weights to each characteristic for knowledge-guided retrieval and indexing is of particular importance. The formulated CCVA constitutes an easily comprehensible tool to cope with and evaluate coastal city erosion areas. It compares regions of vulnerability in GIS maps and relative influences and sensitivity of diverse vulnerability layers.

2. Materials and Methods
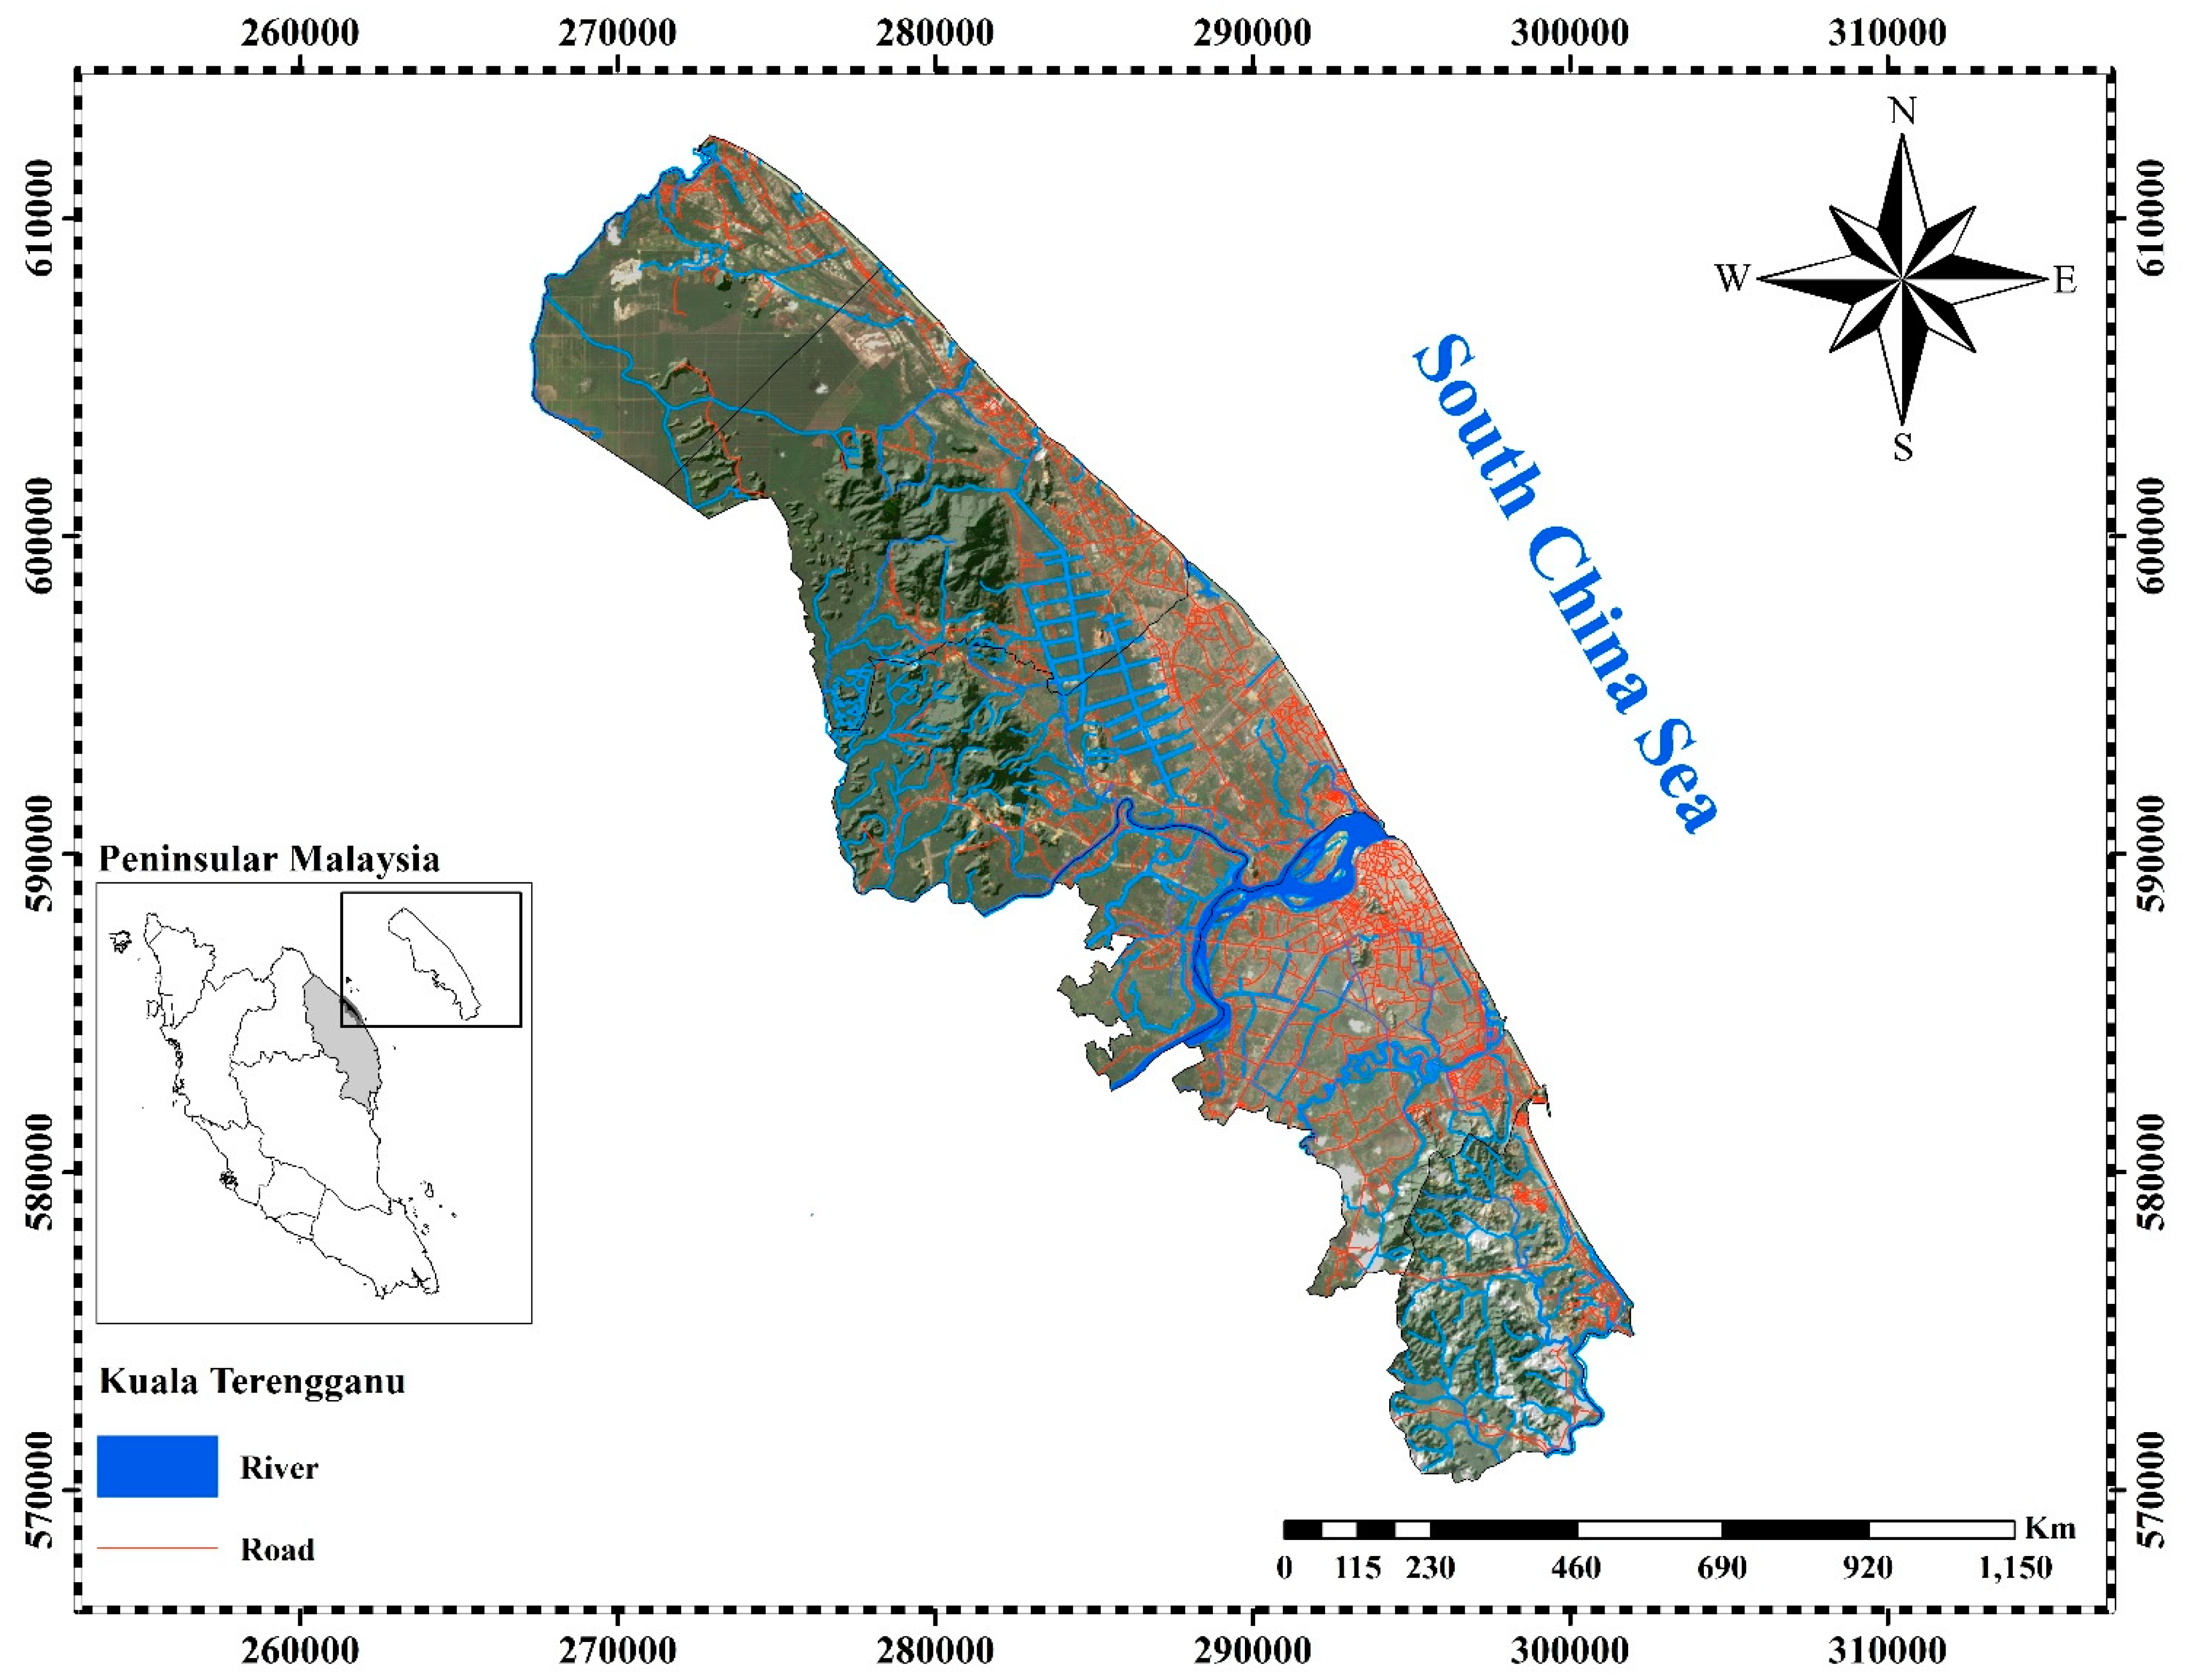
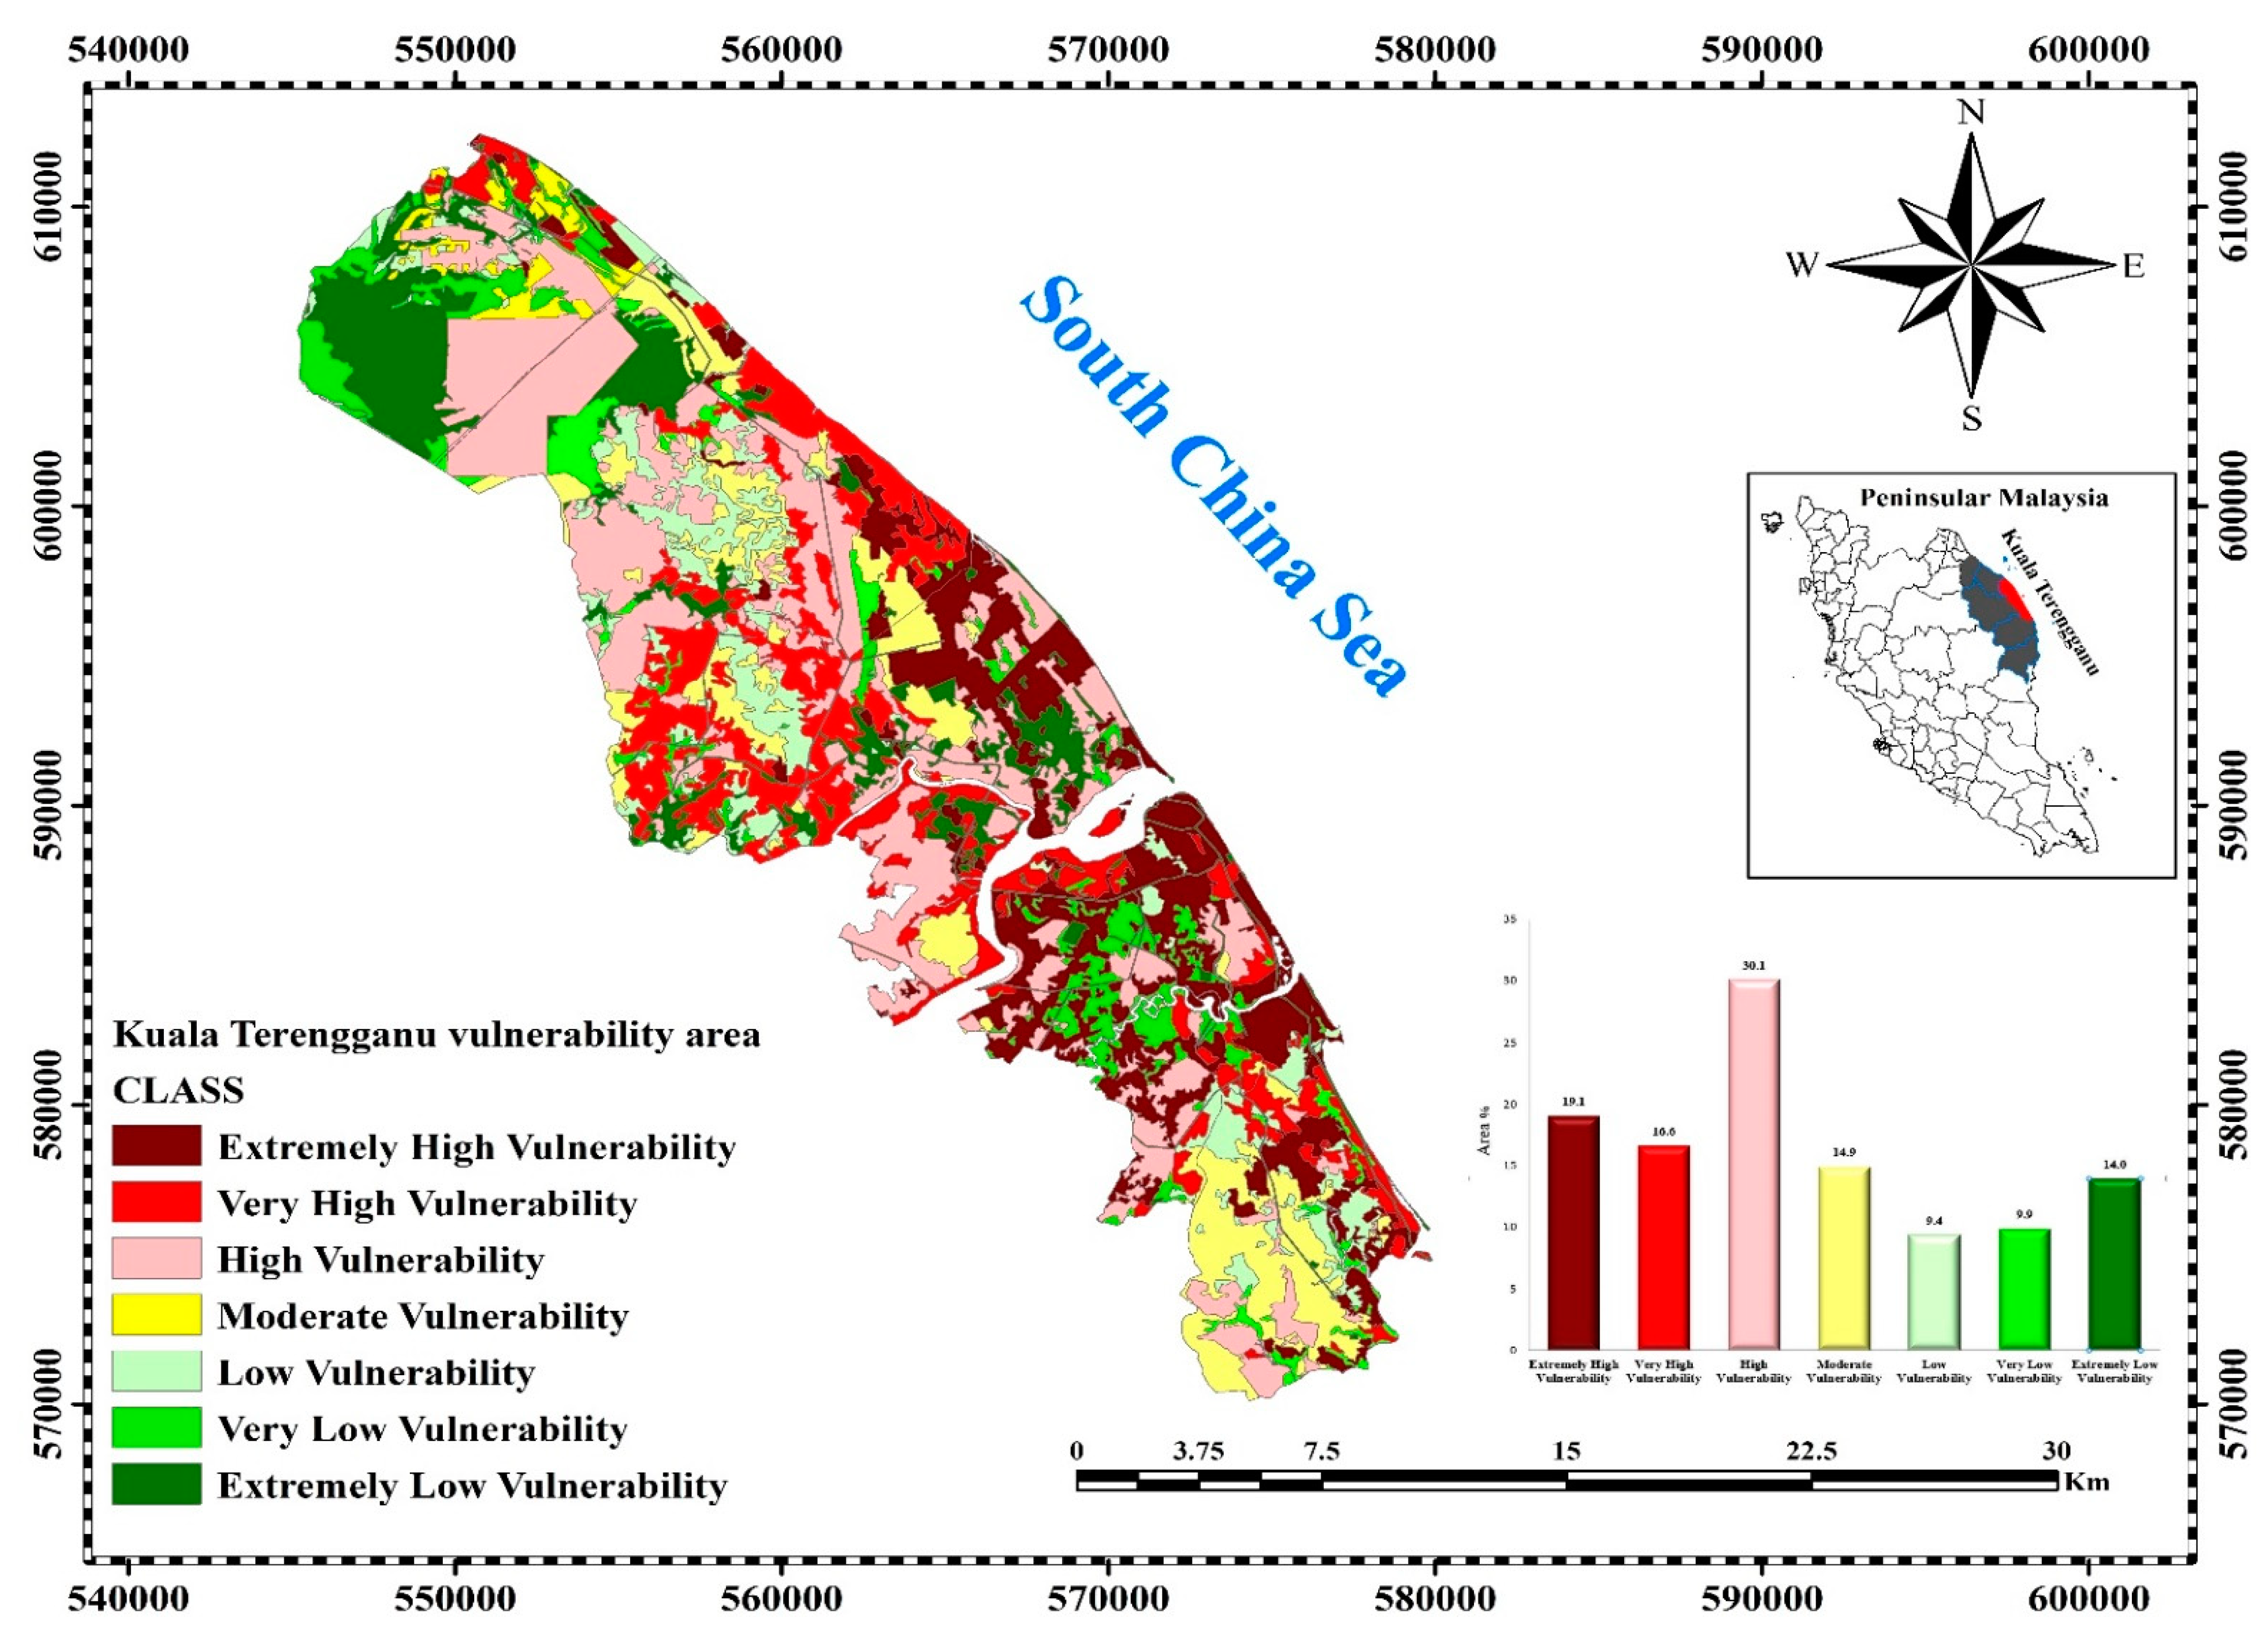
2.1. Study Area

Kuala Terengganu is located in the southwestern part of the South China Sea, which is the largest semi-enclosed marginal sea in the Western Pacific Ocean. Terengganu is a constitutive state under the Federation of Malaysia and is located in Peninsular Malaysia on the mainland of the Asian continent. Kuala Terengganu is bordered by Kelantan in the North-West and Pahang in the South-West (Figure 1). The Terengganu people mostly live in coastal towns and villages. The Kuala Terengganu, which is situated at the entrance of the extensive Terengganu River, is the largest town in the state with an area of about 605 km2. Terengganu has a 200 mile (320 km) long coastline along the South China Sea. It is located between the latitudes of 5°27′58.31″ N and 5°11′42.36″ N and the longitudes of 102°57′06.10″ E and 103°13′18.69″ E. This study is focused on the Kuala Terengganu coastline, which extends approximately 70 km from Merang to the southernmost point of the Setiu District to Rusila, the northernmost point of the Marang District.

2.2. Data Requirement

In this chapter, we collected two types of data based on the CCVA model: primary and secondary data for the Delphi-AHP model and the GIS. The primary data for the Delphi-AHP model included expert knowledge and the expert choice matrix (ECM). ECM was sent to 12 experts from different agencies in Malaysia such as the Department of Irrigation and Drainage (DID), the SMART Control Centre, and the National Hydraulic Research Institute of Malaysia (NAHRIM). The ECM was used for three runs over seven months. The first run was carried out between 14 February 2014 and 17 April 2014, the second run occurred between 22 August 2014 and 20 September 2014, and the third run was carried out between 3 October 2014 and 7 November 2014. For GIS mapping, secondary data from related departments were collected. The secondary spatial data for GIS in this research were mainly retrieved from a topographic map (2002), a land-use map (2008) and a MUKIM map (2010) from the Department of Survey and Mapping Malaysia (JUPEM), a geology map from the Geology Department, a population map (2010) from the Department of Statistics, and a soil map (2008) from the Department of Agriculture (DOA) (Table 1).
The criteria were selected based on knowledge acquisition from the literature review, previous research, various Malaysian reports such as [18,56], and International reports such as those produced by the Ministry of Environment (2008), and the ETC CCA (2011).

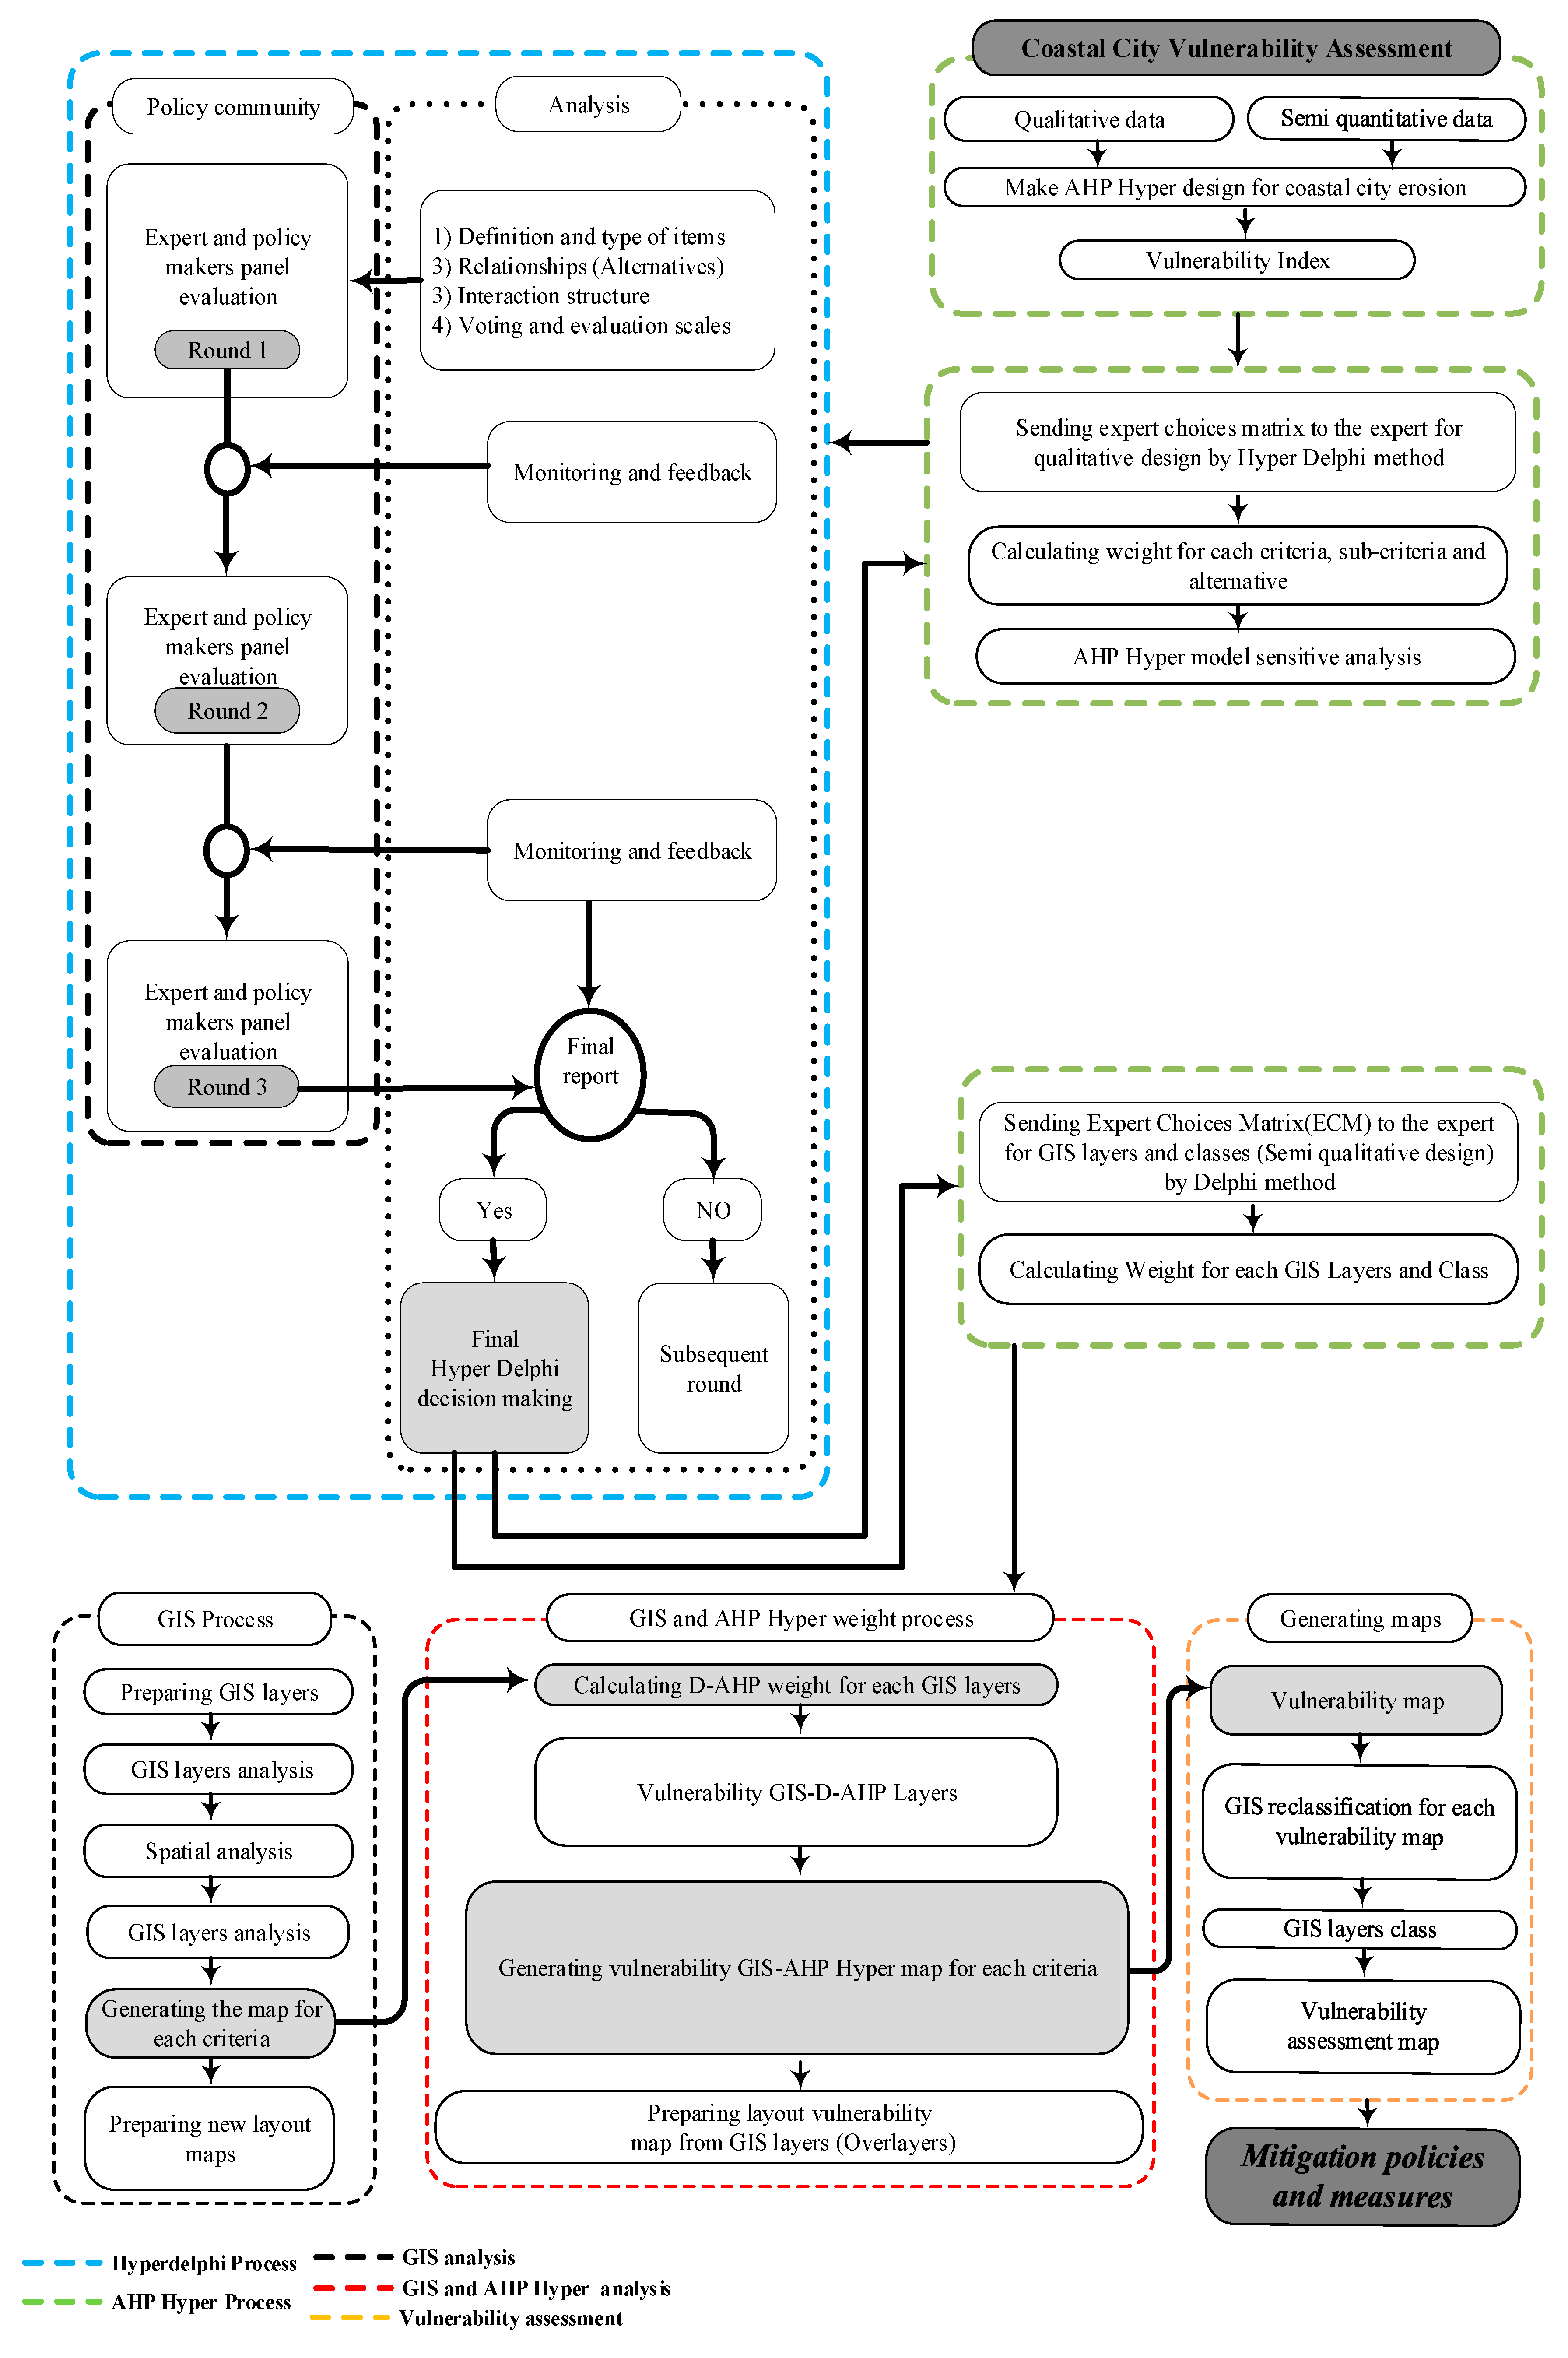
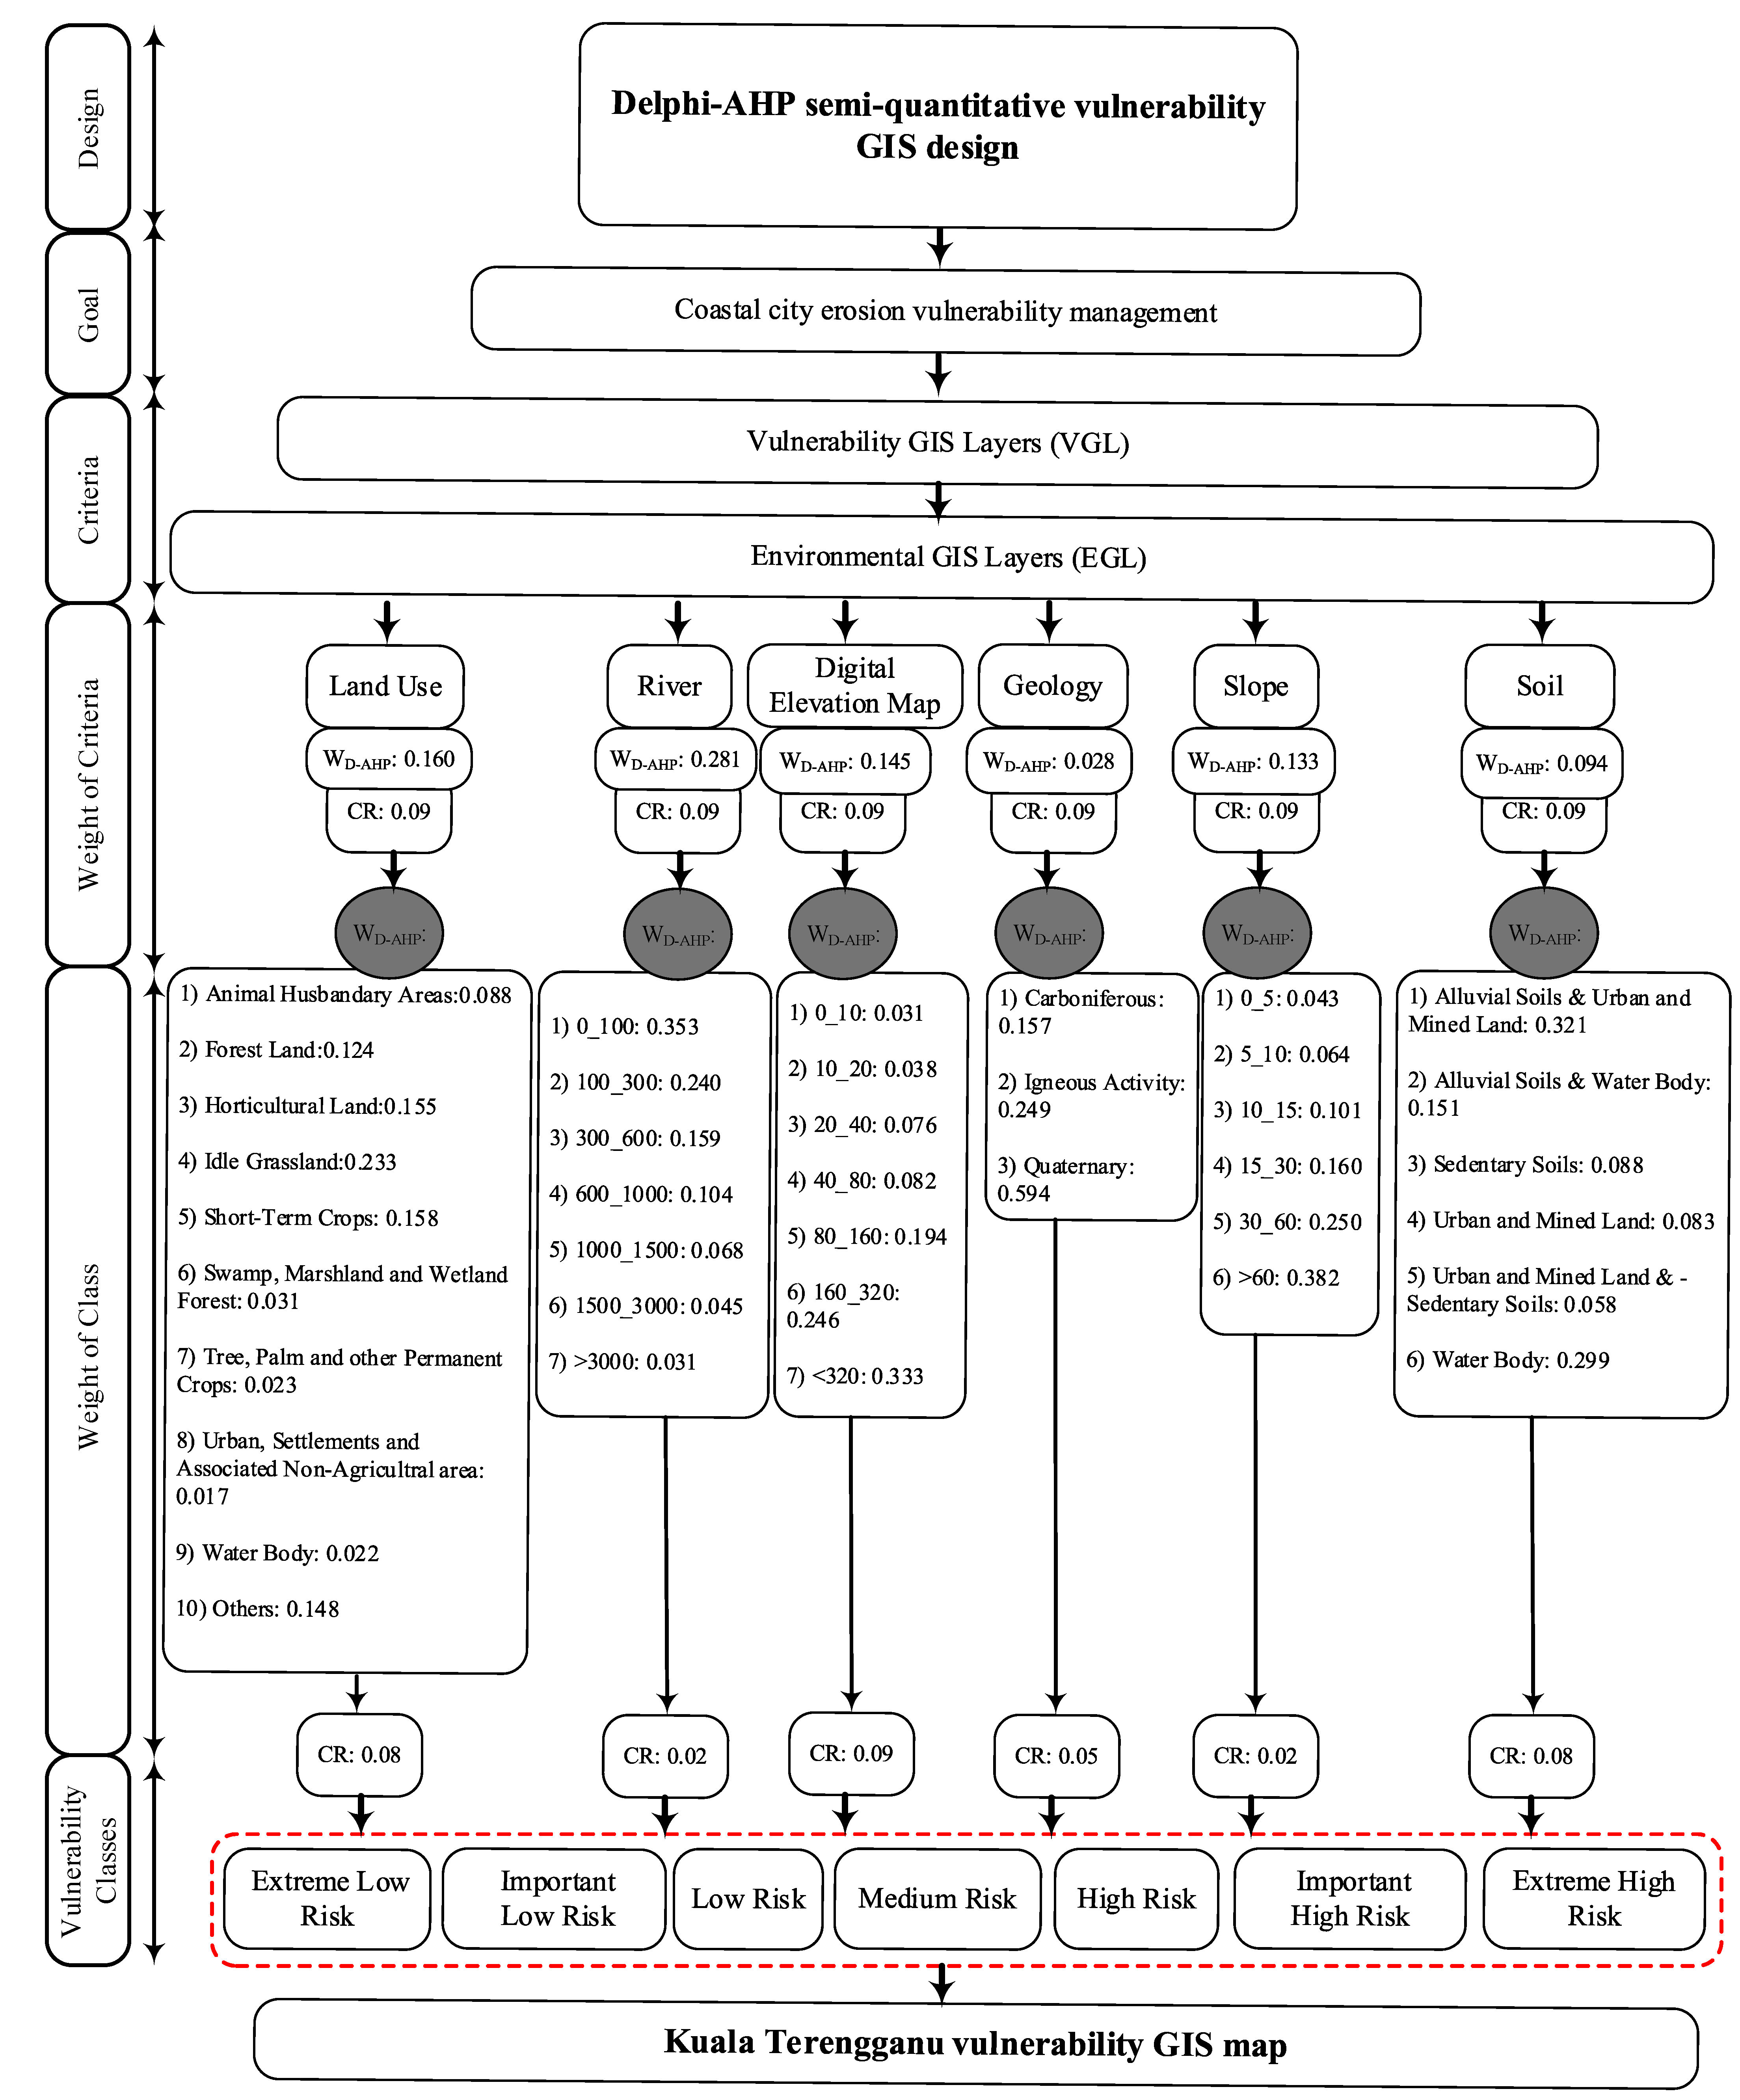
2.3. CCVA Model Framework

The framework consists of six main segments, as indicated in Figure 2. The first segment of the framework sought to identify and design each coastal city’s erosion vulnerability criteria and sub-criteria by using the Delphi-AHP model. The expert choice matrix was created in the second part, which was submitted to 12 experts from various Malaysian authorities (DID, SMART, NAHRIM). For six months, the expert choice matrix was in use (for three rounds). The first round took place from 14 February to 17 April 2014, the second round from 22 August to 20 September 2014, and the third round from 3 October to 7 November 2014. The vulnerability criteria, sub-criteria (qualitative data), and vulnerability GIS layer classes were ranked and scored by professionals from numerous Malaysian agencies (semi-quantitative data). The third segment examines the weights for qualitative and semi-quantitative data using expert choice software along with sensitivity analysis for every criterion and region (alternatives). In the fourth segment, the GIS vulnerability layers and classes were investigated and organized according to the AHP design. The fifth segment is there to apply the Delphi-AHP model and GIS technique for generating vulnerability maps by overlayer mapping and to calculate the weights of all layer classes in GIS software for generating the final vulnerability map. The final segment shows a wide variety of adaptation solutions.

2.4. Application of the Delphi-AHP Model and GIS Technique

This article proposes a comparative framework model which integrates knowledge of the Delphi-AHP model in weighing CCVA. The Delphi-AHP framework involves an empirical study based on the Delphi method to refine important criteria gleaned from a literature review and other criteria resulting from an expert panel. This integration method represents an adequate case retrieval and indexing and incorporates domain knowledge for feature weighting. Our specific interest lies in the assignment of importance weights to each feature for knowledge-guided retrieval and indexing. This integration approach is recommended in intelligent modeling for a CCVA.
There are two types of vulnerability hierarchy designs: a qualitative design and a semi-quantitative design. A qualitative design is used for the evaluation of erosion assessments from expert knowledge. A semi-qualitative design is for erosion assessment from expert and GIS layers. Through the Delphi-AHP approach, we assessed the vulnerability criteria and sub-criteria of erosion affecting the coastal city area, which required analysis of both quantitative and semi qualitative information. The model measures erosion vulnerability in terms of a vulnerability index based on qualitative data and assesses semi-quantitative erosion vulnerability in GIS layers. This model assigns priority weights to the variables using pairwise comparisons at each level of the hierarchy. In the Delphi-AHP model, qualitative and semi-quantitative data improve the system’s consistency and simplify the calculation of the weight for criteria and sub-criteria.
The vulnerability hierarchy design encompasses criteria and sub-criteria of which we select the best criteria based on expert knowledge by using the Delphi method and the ECM, along with fieldwork and observation, and a literature review. In this component of the research, one of the main objectives was to select one option from a set of known options. In real-world spatial decision-making problems, the decision-maker should choose the best geographical location of interest. GIS is known as a potential tool and powerful technique for monitoring the changes in land use on a regional scale and handling environmental spatial data in land-use assessment and planning. The combination of GIS and Delphi-AHP models has been proven to be a powerful approach since the numbers of alternatives originating from a GIS are very large (each location being represented by a line, point, or polygon). Thus, in the spatial decision, listing the alternatives from a GIS would be very difficult.
The sub-district map (MUKIM map) of Kuala Terengganu was divided into six regions representing different areas of vulnerability. Selecting the best region does not mean that it is the most suitable choice, rather it means that this area should be afforded the highest priority for deciding on the most suitable areas. The following alternatives (regions) available in the study area are: Merang; Batu Rakit; Kuala Nerus; Manir; Pengadang Buluh; and Rusila.
In the AHP model, the evaluation criteria are associated with geographical entities and the relationship between them. Hence, the evaluation criteria can be represented in the form of maps or GIS layers. We collected and analysed the GIS maps that contain geographical attributes. The following spatial layers have been incorporated as maps: (1) environmental layers, and (2) human activity layers.
There are nine stages in the Delphi-AHP modeling process and GIS approach. The CCVA model is produced by merging these two techniques with GIS. Stage 1: The decision for the problem is structured into a hierarchical model. It includes the decomposition of the decision problem into elements about their characteristics as well as the formation of a hierarchical model having various levels [57]. Stage 2: Application of the Delphi method and ECM. Stage 3: Collecting input data by making pairwise comparisons of decision elements and obtaining the judgment scales. Stage 4: Derivation of priorities where, after filling the comparison matrices, priorities can be computed [58]. Stage 5: Evaluating the weight consistency of comparisons. In this step, calculations were performed to find the maximum eigenvalue, the consistency ratio (CR), the consistency index (CI), as well as the normalized values for each alternative and criterion [56]. The Delphi-AHP measures the overall judgments’ consistency through a consistency ratio (CR). The consistency of the judgmental matrix can be determined by examining the total CR [59], being the ratio of CI and RI, as given by:
CR = CI RI
RI is the random consistency index of a randomly generated reciprocal matrix from the nine-point scale, with reciprocals forced [60]. If CR is less than 10%, the matrix is considered to have an acceptable consistency [61]. The scores were accepted when they reached a certain level of consistency, as determined by a consistency index (CI). [58] has proposed a CI, which is defined as:
CI = j = 1 λ W j CI j
Wj is the weight of criterion j and CIj is the consistency index of criterion j. Stage 6: In this step, the local weights of the elements are calculated by using the Expert Choice software (EC) computing the Delphi-AHP weight. Stage 7: Weights across different levels are aggregated to get the final weights of the alternatives. This step collects all priorities from the decision table through a weighted sum of the type [51] and synthesizes the local priorities across all criteria to identify the global priority. The final weight of alternatives would be computed using an additive hierarchical aggregation rule Final Weight (5) by normalizing the sum of the local priorities to unity, as shown below:
Z i = j w j S ij
Z i is a global priority of the alternative, S ij is a local priority and w j is the weight of the criterion j. The global priorities ( Z i ) thus obtained are finally used for normalizing by dividing the score of each alternative only by the score of the alternatives and selection of the best alternative under each criterion [51]. Stage 8: Since the Delphi-AHP model is a responsive analysis, the input data is somehow modified to detect the effect on the output [60]. We used sensitivity analysis only for qualitative data in this section of the Delphi-AHP model, so experts rate and weight the qualitative data, where their findings could be used to make a semi-quantitative data judgment. The current rank of Delphi-AHP qualitative parameters is then provided based on a pair-wise comparison for land use vulnerability, hazard, and risk performed by experts from SMART, DID, and NAHRIM. One of the popular sensitivity graphs for expert selection is known as a radar graph. Each radar graph has its special menu commands, and it is possible to compare each sensitivity between the criterion and the alternative. If the priority sensitivity of one criterion or alternative is increased, the number of changes that can be made as a result of sensitive considerations may be found with other criteria or alternatives. Therefore, by using qualitative results, we can make decisions and rank for semi-quantitative data (GIS class) and ascertain the weight of each layer. Stage 9: The linear combination of the Delphi-AHP weights for the assessment of the vulnerability is given as follows:
HAL = L v 7 × W vlc 7 + L v 8 × W vlc 8 + L v 9 × W vlc 9
EL = L v 1 × W vlc 1 + L v 2 × W vlc 2 + L v 3 × W vlc 3 + L v 4 × W vlc 4 + L v 5 × W vlc 5 + L v 6 × W vlc 6
CCVA = EL × HAL
where EL signifies the Environmental Layer function, HAL refers to the Human Activity Layer function, and C v signifies the vulnerability layer and W vlc denotes the weight of the vulnerable layer class, representing the CCVA function of erosion.

3. Results

In Delphi-AHP, a model is used to identify the best criteria and to design the criteria and sub-criteria. We divided all criteria and sub-criteria into qualitative and semi-quantitative components. The qualitative component consisted of the vulnerability index, environmental criteria, and criteria relating to human activities, with each criterion having sub-criteria (Table 2). The weight of all criteria and sub-criteria was calculated, along with alternatives for the qualitative design in the expert choice software. By using a sensitivity analysis and weight for each criterion, ranks were established in the ECM for the semi-quantitative component and weights calculated for the GIS layer classes of the semi-quantitative data.

3.1. Delphi-AHP Qualitative Weights

For the environmental criteria, we selected six criteria based on erosion in the coastal city areas by using the ECM from the experts applying the Delphi-AHP model. The estimated final weight for each criterion, sub-criterion, and the alternative is as follows. The high weight, River Criteria (RC) W was 0.232 with CR being 0.09, and the high alternative being 0.439 in Pengadang Buluh and the low alternative being 0.053 in Merang. In this region, the river is not sensitive to erosion because there is no river, which was consequently given a low weight. However, in Pengadang Buluh, the substantive river traversing the city center was assigned a high rank from the experts and high weight in the expert choice software. In the (HAC), we had three criteria selected from the expert choice matrix. The high weight is Build up Criteria (BC) W: 0.071 with CR: 0.09 and high alternative being 0.434 in Pengadang Buluh, and low alternative being 0.055 in Merang (Table 2). The alternative, Pengadang Buluh is located in parts of Kuala Terengganu with built-up and coastal contracture. As a result, this area is both sensitive and important, especially when compared to other places in terms of environmental evaluation, evaluation of fieldwork observation, expert decision-making, and region-sensitivity analysis.

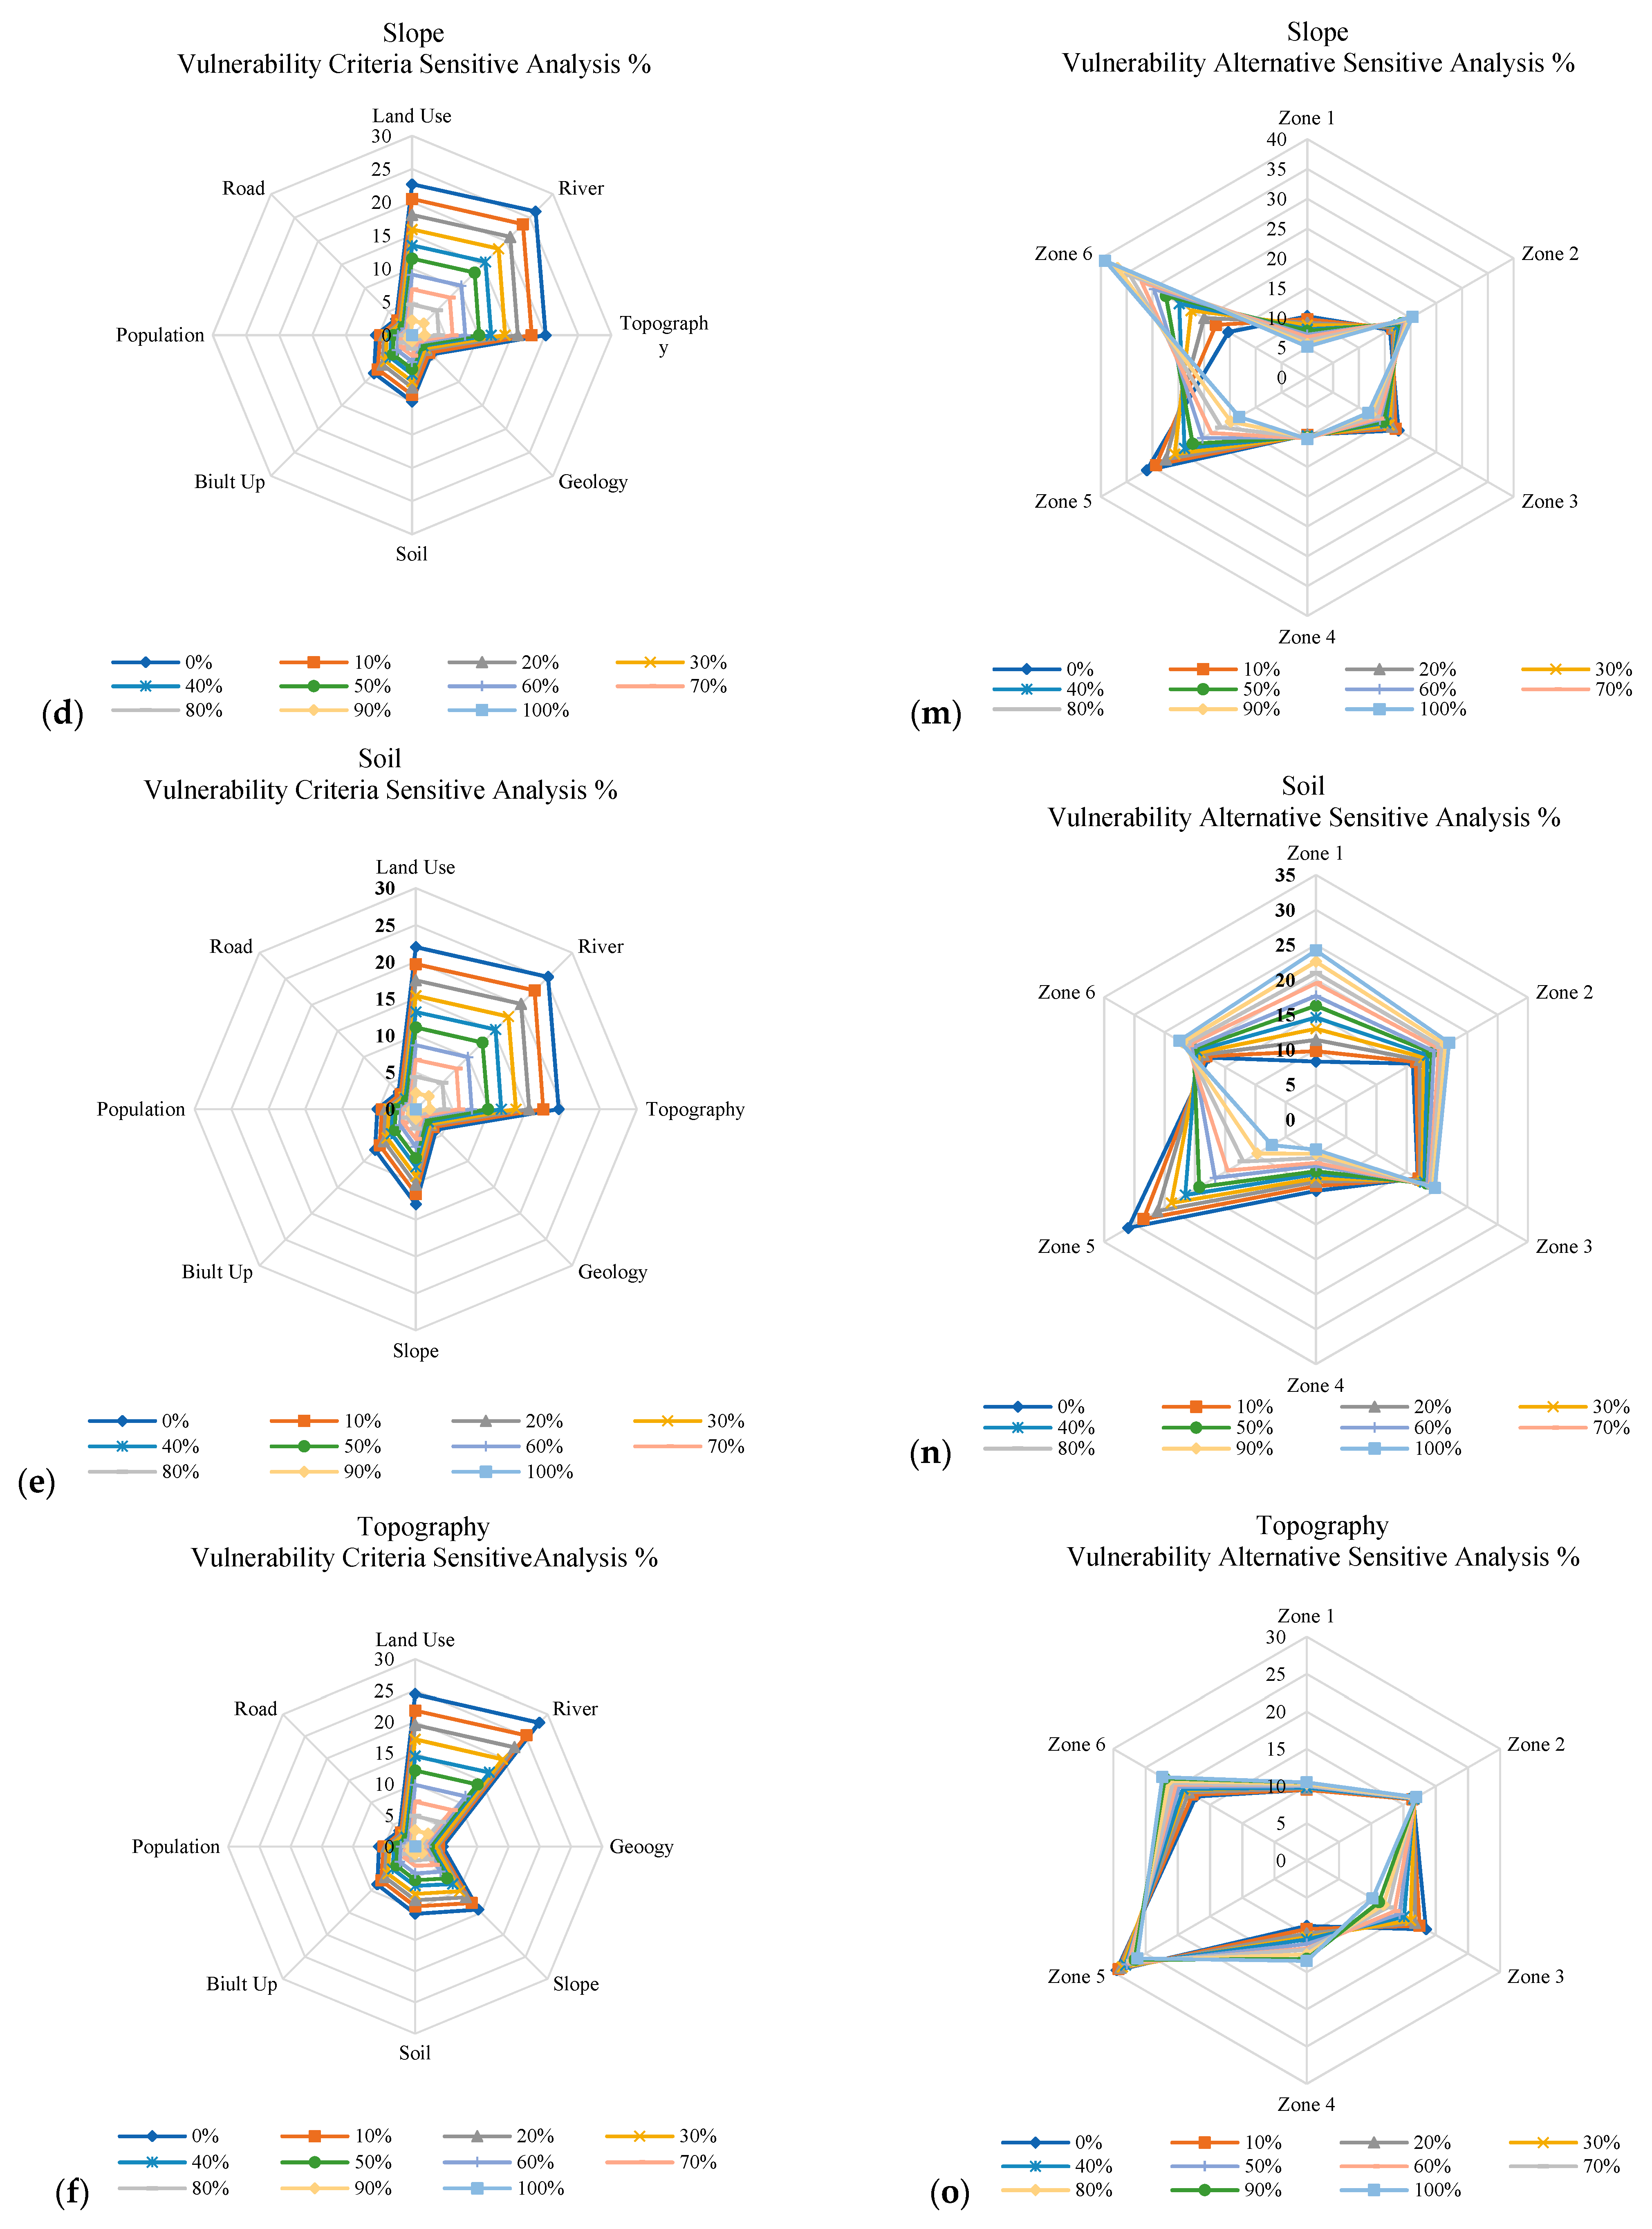
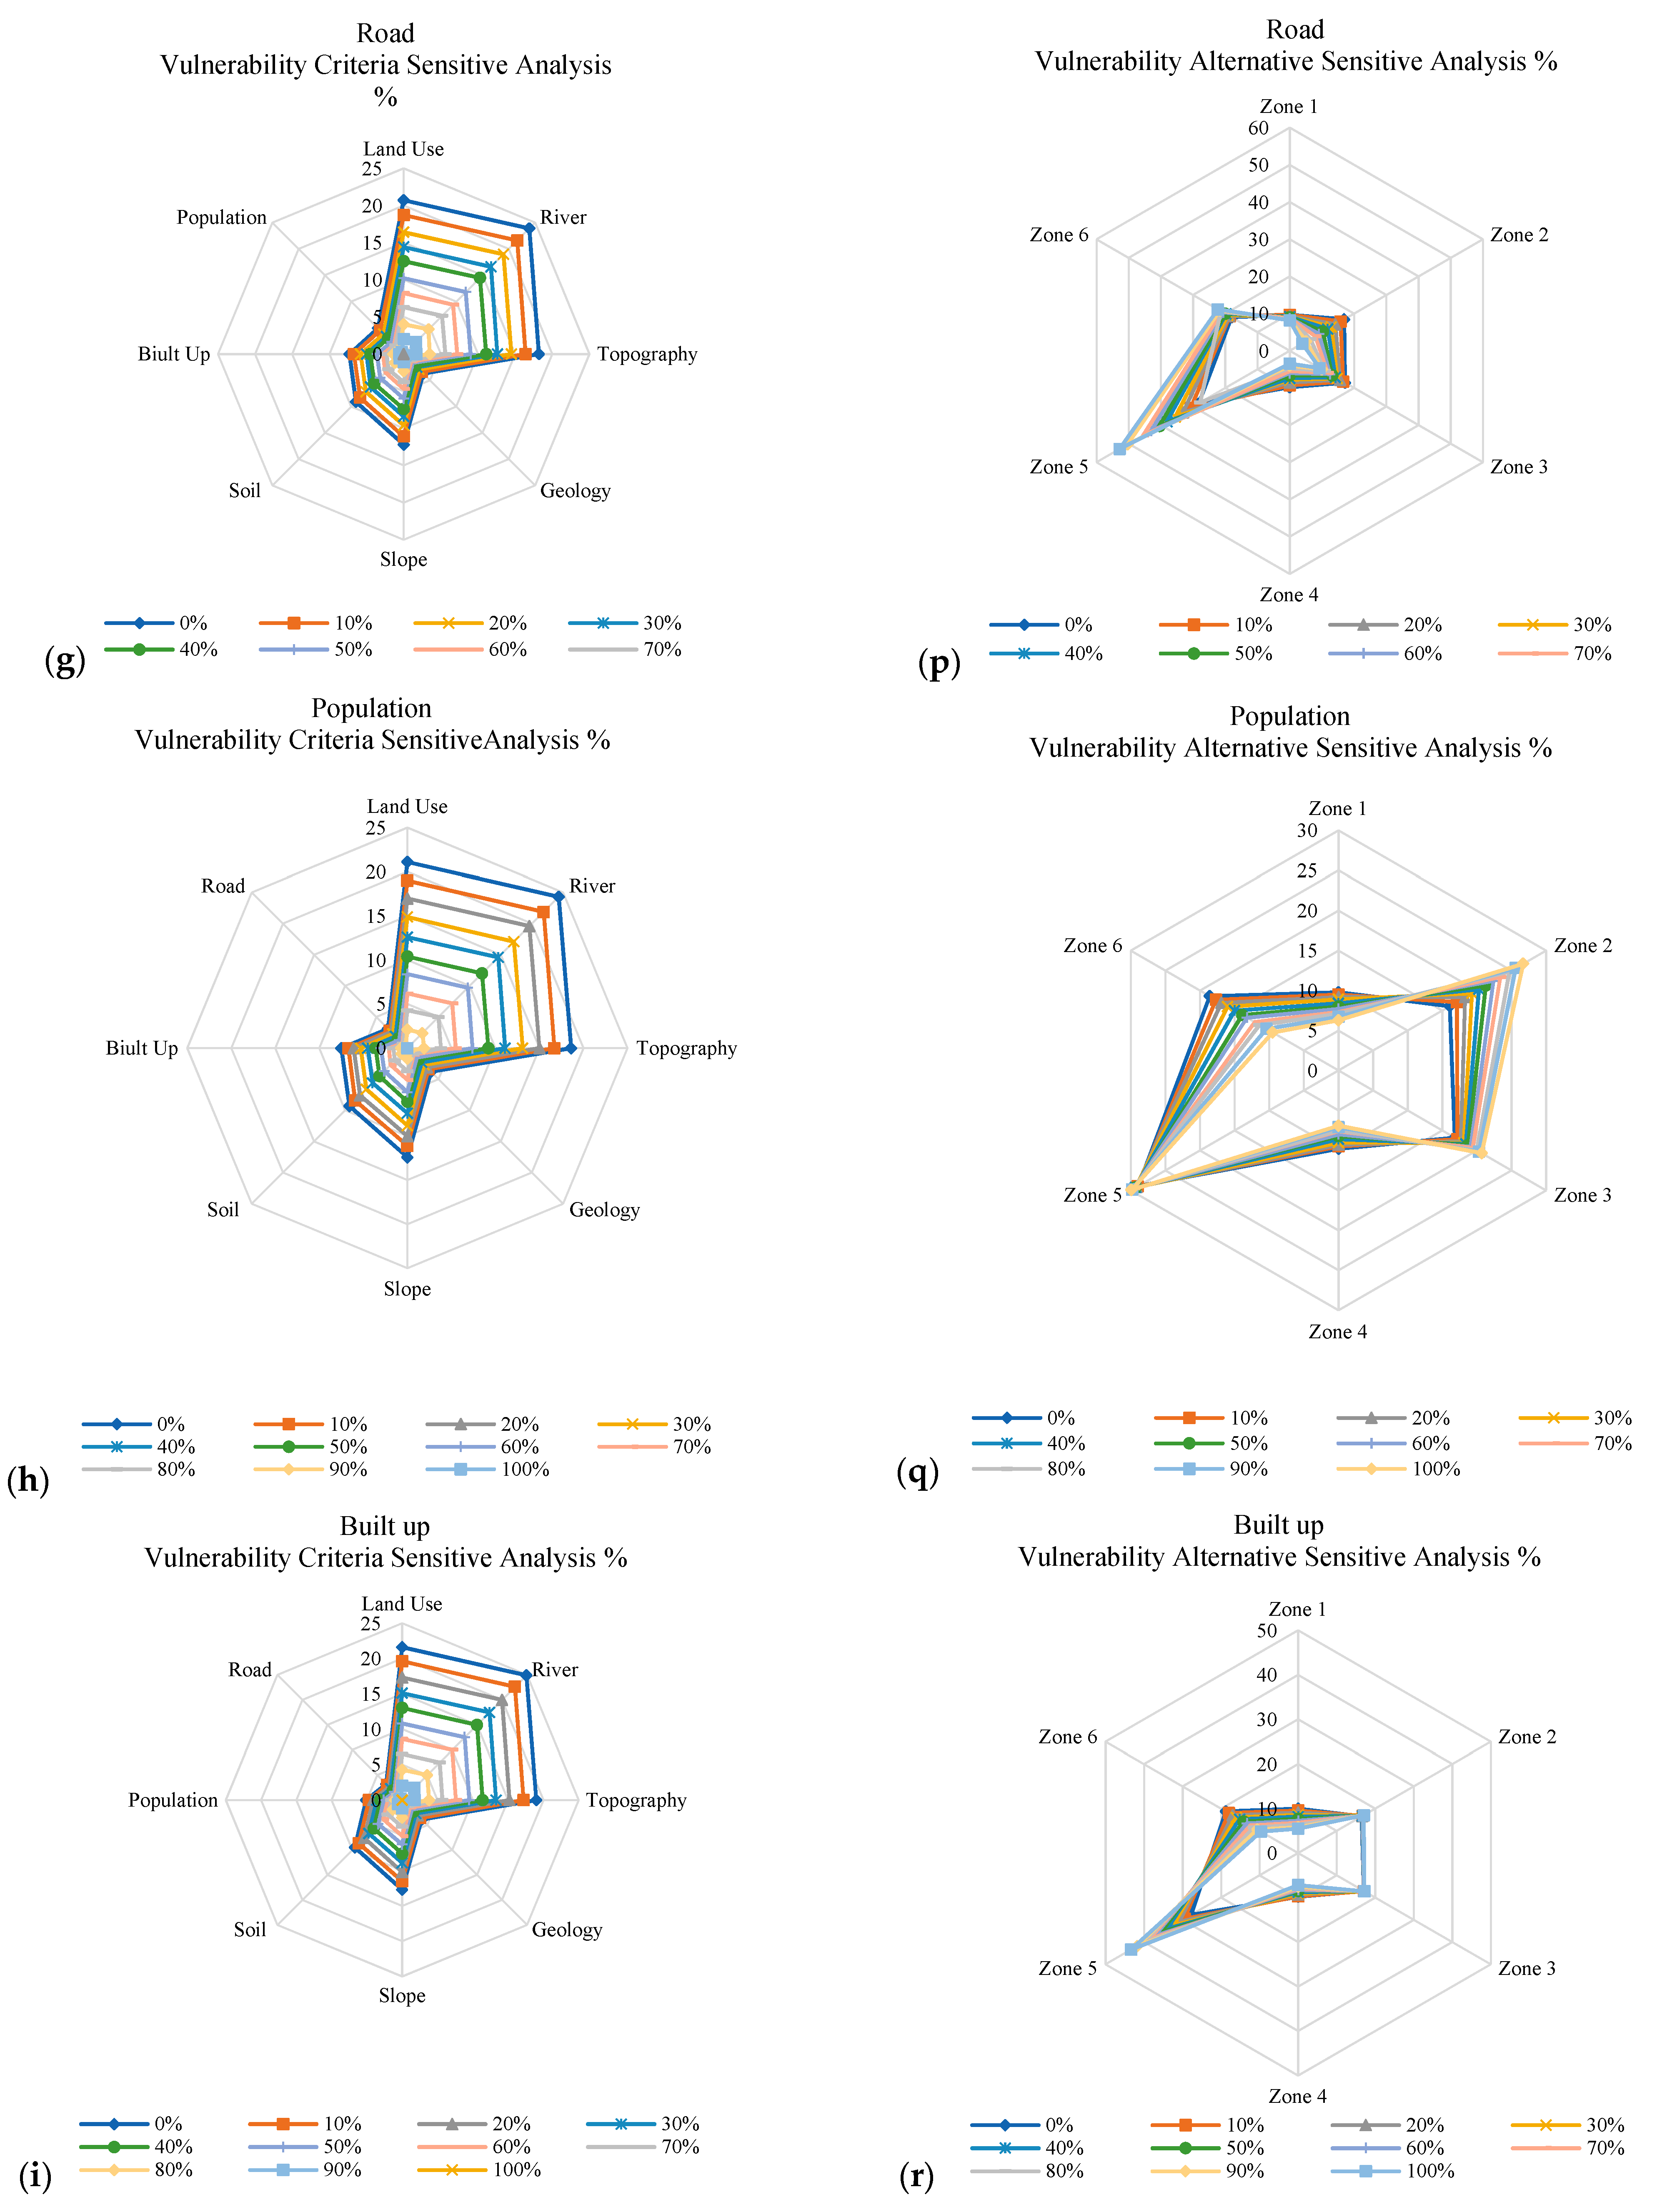
3.2. Delphi-AHP Model Sensitive Analysis

A sensitivity analysis shows the sensitivity of the alternatives for all the model’s different criteria for the choice of the important erosion criteria in the Kuala Terengganu coastal areas. The sensitivity analysis originates from the use of the radar graph (A and B) through the application of the Delphi-AHP (Figure 3). Each radar graph has its unique menu commands and the sensitivity between criteria and alternatives can be compared with each other. If the priority sensitivity of each criterion or alternative is changed, the number of changes that would be made using other criteria or alternatives can be viewed as an output of the sensitivity analysis. Thus, the priorities of the alternatives will change in the right column by changing the positions of the nine criteria priorities in the left column. If a decision-maker thinks an objective might be more or less important than originally indicated, the decision-maker can drag that objective’s bar to the right or left to increase or decrease the objective’s priority and see the impact on the alternatives (Table 3 and Figure 3).
The study considered the land use criterion from the environmental criteria because the Delphi-AHP results revealed that land use has a higher weight than the other environmental and human activity criteria. By increasing the share of the river criteria to an extreme value of 23.5% of the main goal, leaving 76.5% for the others, while keeping the proportionality between them, it was noticed that the model still favored Pengadang Buluh with a score of 26.4%. This was followed by Rusila with a score of 19.8%, Batu Rakit with a score of 17.9%, Kuala Nerus with a score of 16.4%, Marang with a score of 10.0% (Figure 3).
As for the environmental criteria, an increase in the sensitivity of the river criterion to a high weight (0.231 with a corresponding inconsistency of 0.09) to 10%, 50%, and 90% of the main goal in the radar chart, was noticed that the Delphi-AHP model is still in favour of the land use criterion with a score of 23.5%, 11.1%, and 2.3%, respectively. As for the human activity criteria, a build-up with scores of 8.3%, 3.9%, and 0.9%, respectively, is more sensitive than for population and road (Table 3).
The result is reasonable since more sensitivity exists towards the land-use criteria in the vulnerability index, which is significantly greater than the other criteria. With an increase in the sensitivity of the river criterion in Kuala Terengganu, land use criteria will be less vulnerable than other criteria. In the radar graph, the study explained which area is more vulnerable to erosion based on the criteria. The same conclusion could be drawn for the regions where Pengadang Buluh remains the most vulnerable and sensitive area with scores of 26.40%, 34.4%, and 42.20%. In contrast, Marang has scores of 10.20%, 8.70%, and 7.30%, respectively, and thus remains the least sensitive and vulnerable area for erosion in the central Terengganu coastal area. Pengadang Buluh is consistently at the top, with a score of more than 26.40%, followed by other Kuala Terengganu areas (Figure 3).

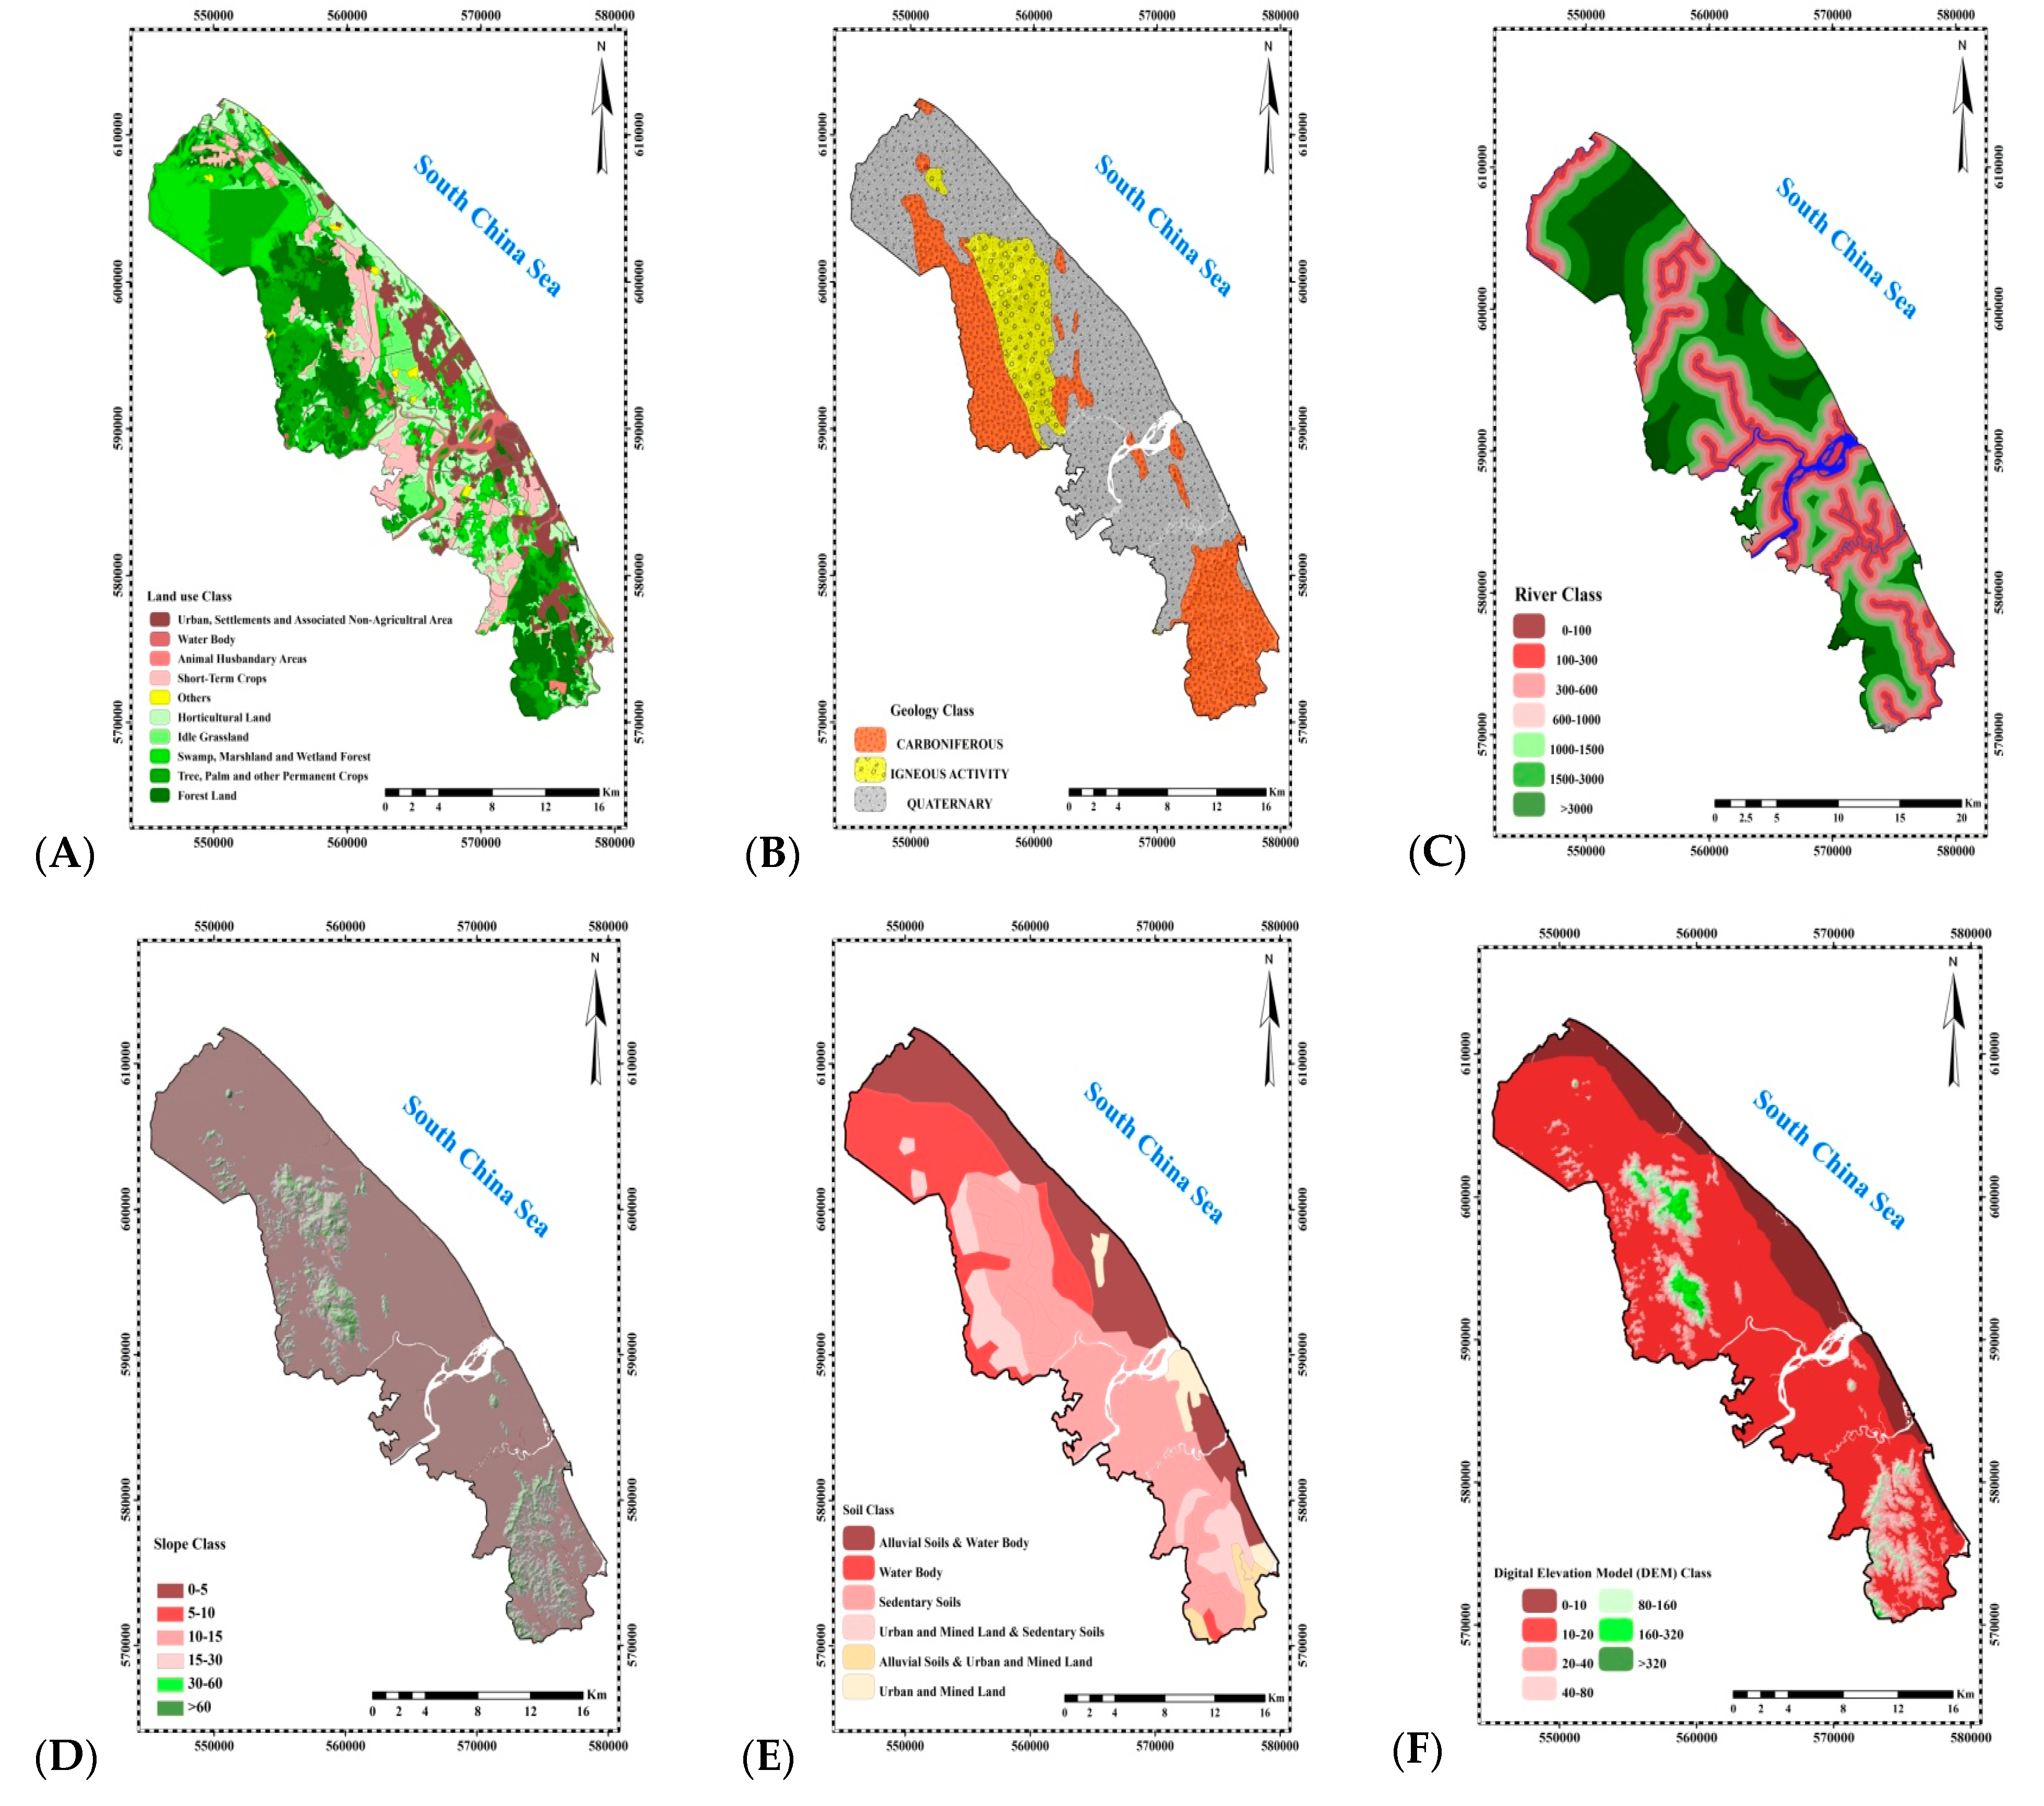
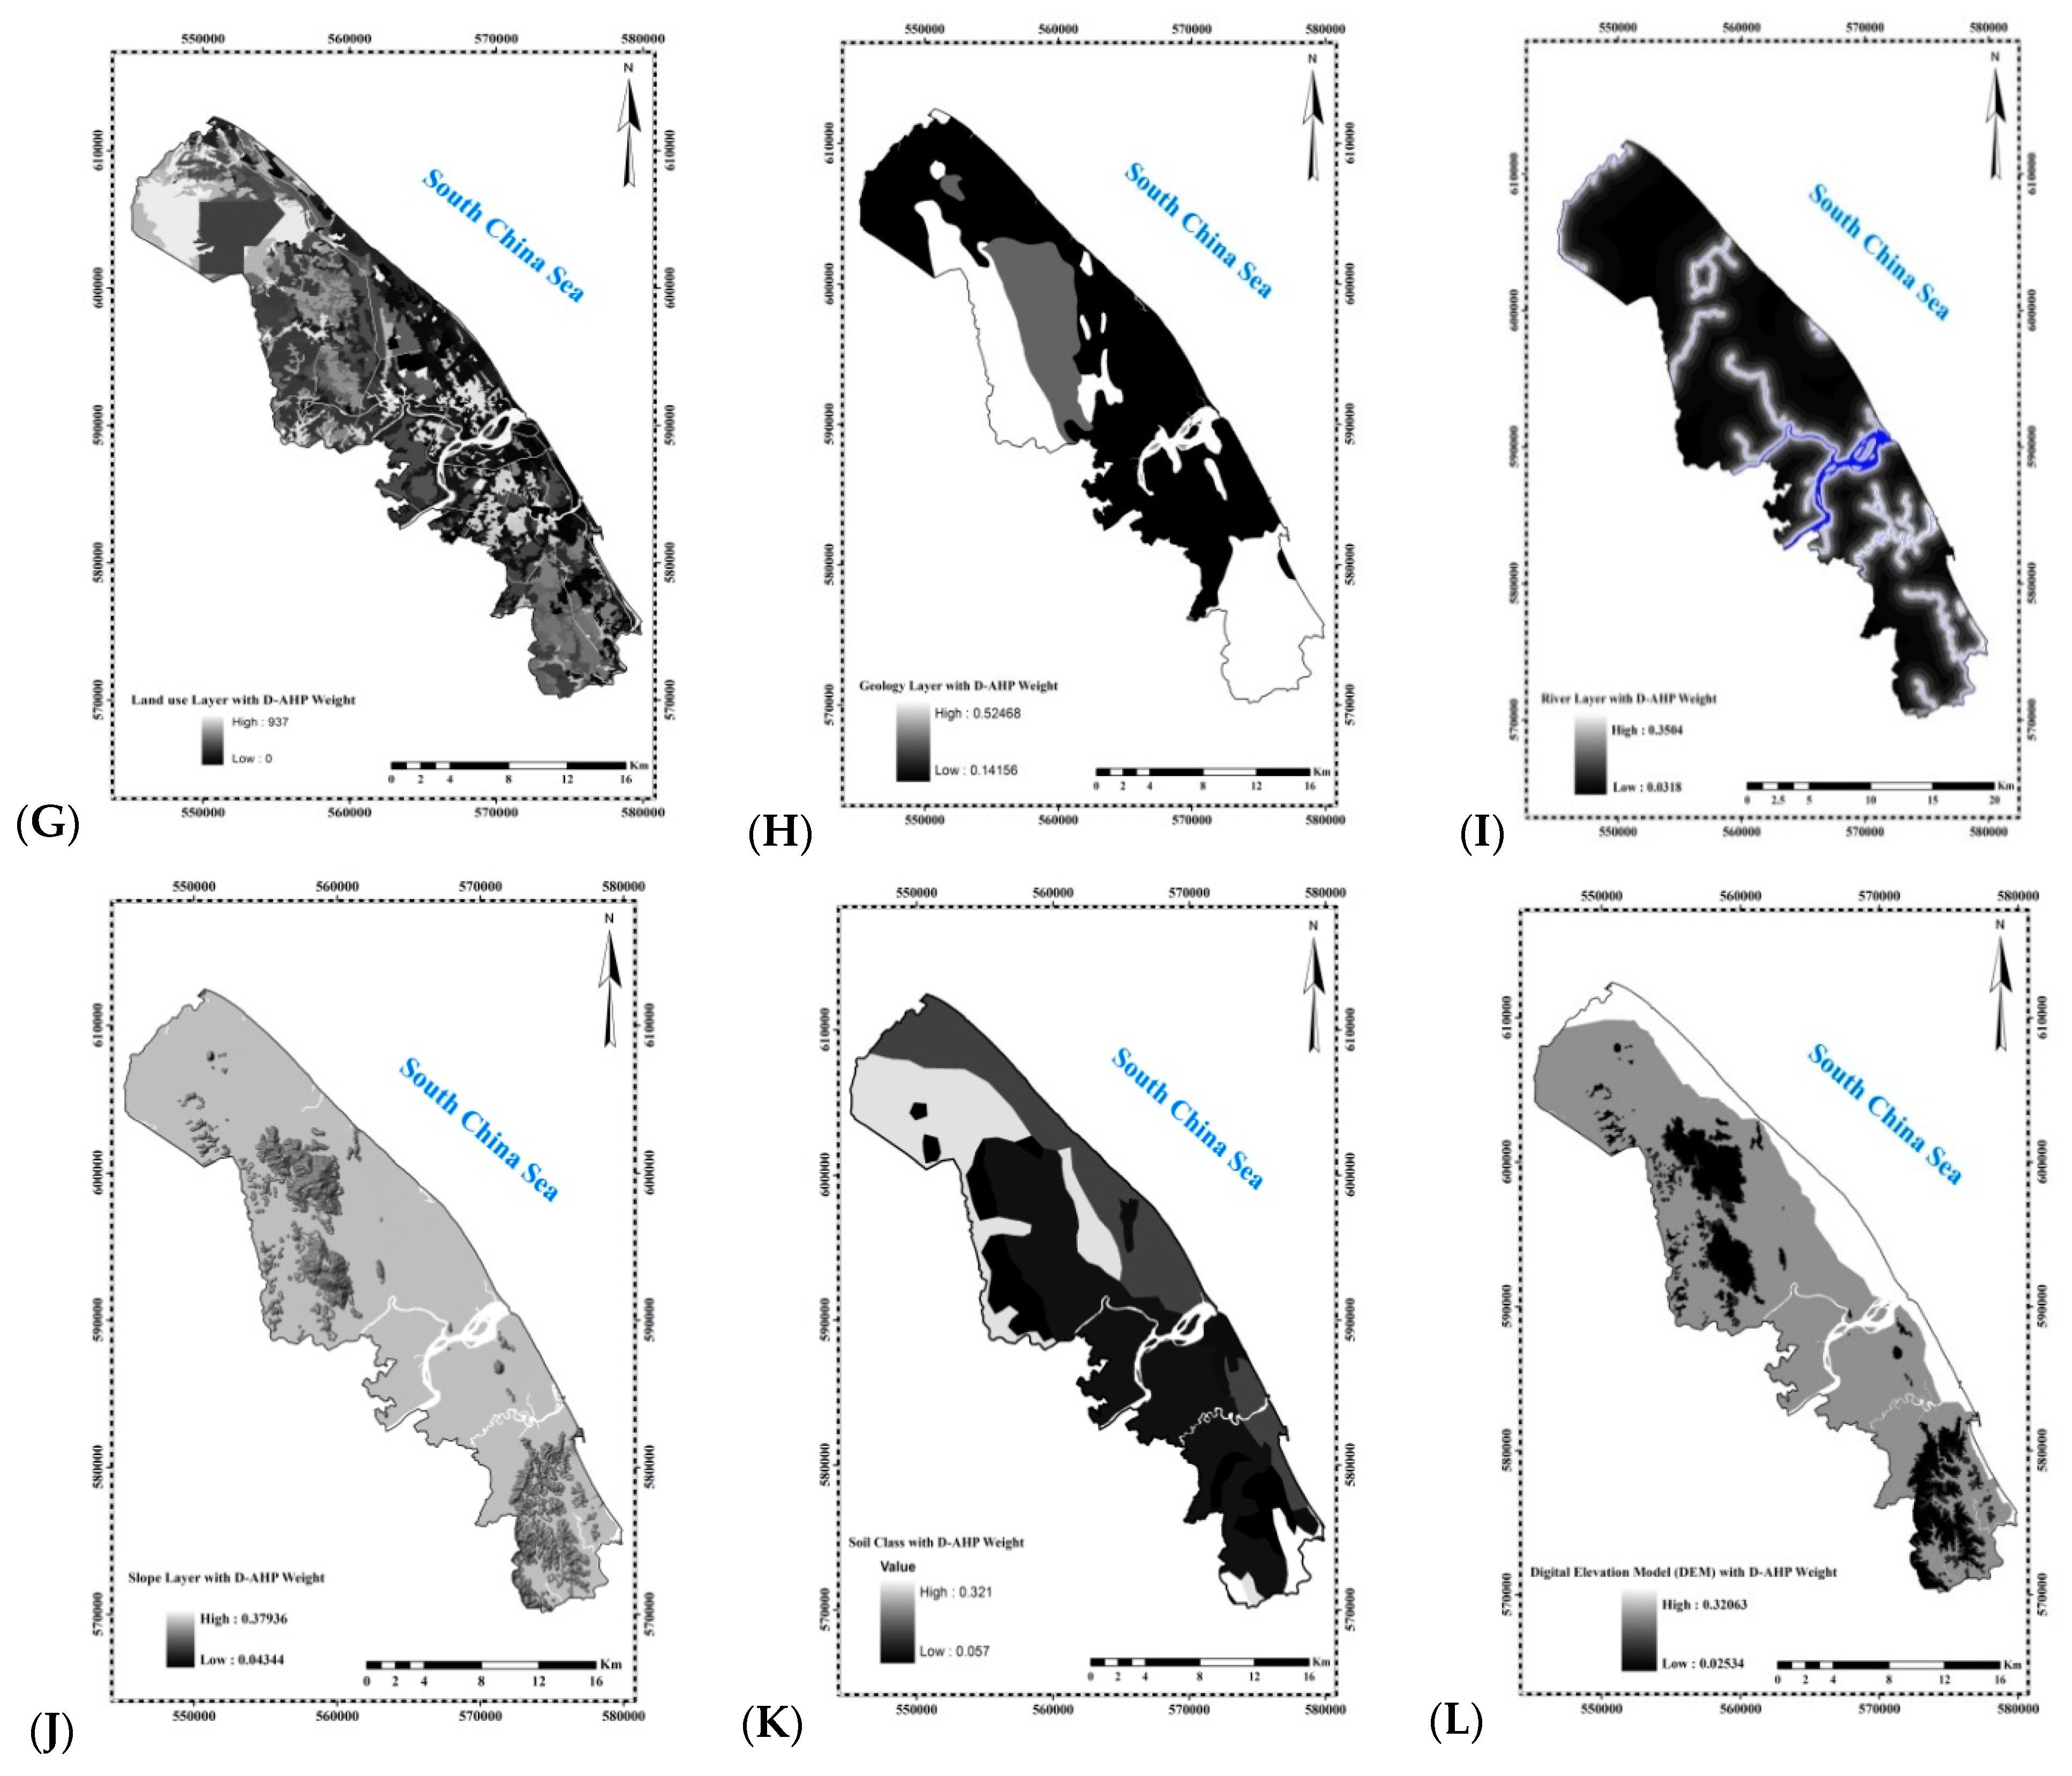
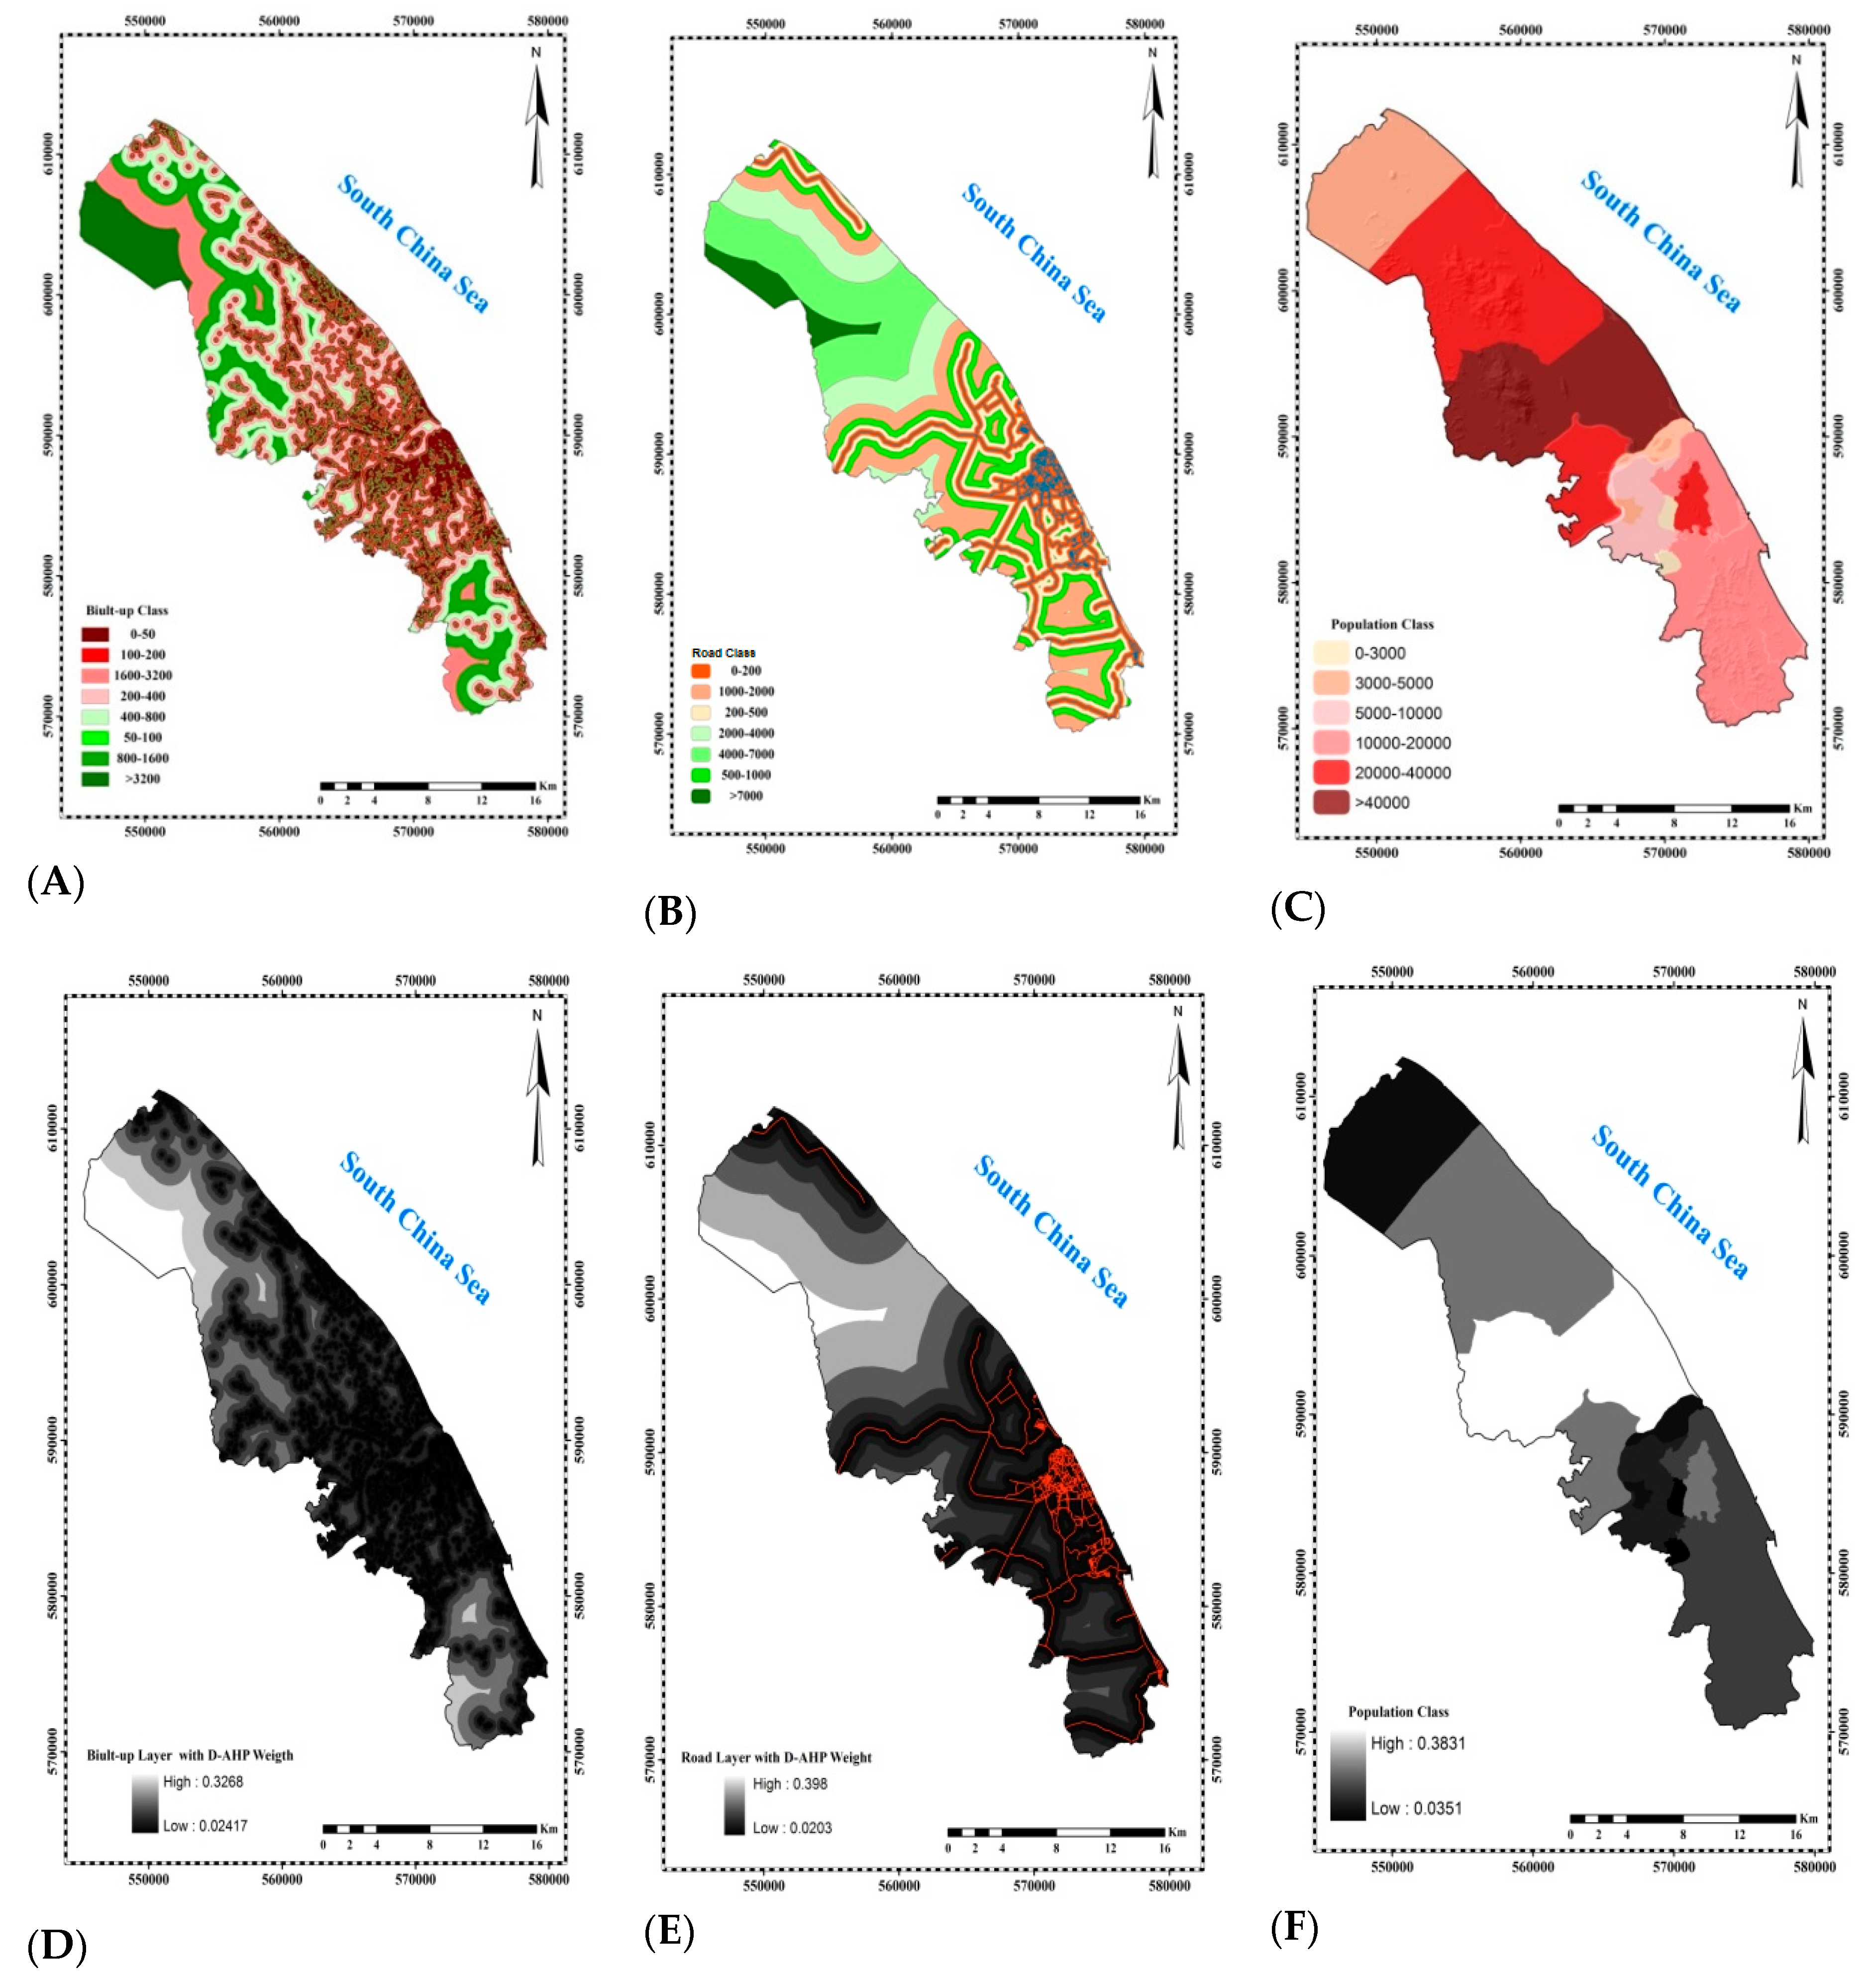
3.3. Delphi-AHP Semi Qualitative Weights and GIS Analysis

The erosion vulnerability assessment function of the coastal city is considered in terms of the environmental and human activity vulnerability. The more vulnerable an area is, the more important it is to protect the site. The erosion vulnerability functions of coastal city areas address the environmental and human activity retention capability of the city in this research. Weighted linear combinations of GIS layers were used for the vulnerability evaluation of the coastal city erosion relating to the environmental and human activity criteria.
The CCVA for the semi-quantitative Delphi-AHP design refers to a locale characterised by a specific relative weakness of exposure to natural disasters and their ability to handle them when they occur. CCVA can provide an understanding of relative future changes in coastal cities. It can also be regarded as the theoretical basis for estimating the vulnerability of coastal cities relating to erosion caused by environmental and social factors. Based on the results of the Delphi-AHP model from experts’ opinion, the study constructed, classified, and quantified nine vulnerability GIS layers (VGL) into two domains, namely the environmental GIS layer (EGL) and the human activity GIS layer (HAGL) (Figure 4 and Figure 5).
As can be seen from Figure 4 and Figure 5 below, the EGL domain was constructed based on a comprehensive literature review which was subsequently examined by experts. Six layers were adopted for the EGL domain, namely: Land use; River; Geology; Slope; Soil; and Digital Elevation Map (DEM). Under the HAGL, three layers were adopted, namely; Population density; Build-up; and Road network. The EGL classes are weighted due to serious coastal city erosion problems. The river class has the highest weighting of 0.281 while the geology class has the lowest weighting of 0.028.
Each layer illustrated in Figure 4 and Figure 5 was weighted according to its importance and generated a GIS layer enabling the creation of maps in ArcMap. Figure 6 and Figure 7 show the maps consisting of environmental and human activity vulnerability layers. Before calculating the Delphi-AHP weights for each layer, a classification, buffering, and distance calculation was made for each layer. Through the Delphi-AHP weights for the vulnerability layers, sensitive areas and vulnerable layers were identified for central Terengganu coastal areas. In this part of the GIS analysis, we calculated all layers with environmental and human activity functions for generating the final CCVA map. The linear combination of the weights and layers for the evaluation of the environmental and human activity functions are as follows:
EL function = [R] × 0.281 + [L] × 0.160 + [G] × 0.028 + [S] × 0.133 + [SO] × 0.094 + [D] × 0.145
HAL function = [B] × 0.073 + [P] × 0.062 + [R] × 0.024
By combining each layer weight and overlay with all layers to generate the environmental map and human activity map to calculate and generate the final CCVA, the functions are as follows:
CCVA function = ELw × HALw
The final CCVA map for the three regions in the Kuala Terengganu coastal area developed through the AHP weighting (Figure 8) was analysed and compared between the present conditions and GIS layers. Expert knowledge was used to rank vulnerability parameters for each region from extremely high (7) to extremely low (1).
The main tributaries of the Kuala Terengganu River basin are the Nerus, Sekati, Kepung, Telemung, and Berang. Agriculture, tourism, aquaculture, commercial industries, urban and rural communities, reserves, and forests are all part of the socioeconomic framework of these rivers. The aim of river research is to expand an area of knowledge that encompasses floods, erosion, and sedimentation. The river criterion in this study has the highest weighting of 0.232 and is particularly vulnerable to erosion in the environment index, whereas the slope criterion has the lowest loading of 0.012. After the river criterion, the land use criterion is the most sensitive and relevant to erosion in the environment layer, with the highest weighting of 0.201. Due to the loss of agricultural land during historical events, land-use activities cause land erosion and sediment yields. Land use is a sort of artificial land surface alteration that has a big influence on the environment and aquatic life. The kind and factors of land use will be used to assess this.
With the highest weighting of 0.092 in the environmental criteria, the soil criterion is sensitive and critical to erosion, and soil erosion is one of the factors that contribute to increasing total suspended solid concentrations. This is due to the fact that land erosion is one of the most difficult problems to anticipate, especially in rainy tropical climates. If the sediment lifting procedure is not handled, it will result in a plethora of problems in river and coastal area management. Total suspended solids concentrations were also caused by human activities such as municipal, industrial, aquaculture, and aquaculture. When the total suspended solid concentration in the Kuala Terengganu River and coastline region is high, this becomes apparent. This situation demonstrates the increase of land use development, such as residential, industrial, and tourism structures along the Kuaka Terengganu River and coastline area, increasing the vulnerability of land erosion.
The projected socio-economic consequences of critical erosion vulnerability regions suggest that erosion’s social and economic costs may soon become unsustainable. Feasibility studies are needed in the Kuala Terengganu area to more clearly identify and quantify such expenses, as well as the costs of control, so that affected institutions can make protection investment decisions. According to sensitivity and vulnerability, three regions in this study have previously taken such decisions: Batu Rakit, Kuala Nerus, Manir, and Pengadang Buluh.
In Batu Rakit, which covers 11,500 ha, 6.2% (710 ha) of the area is considered extremely vulnerable, 14.16% (1678 ha) is considered very vulnerable, 38.7% (4452 ha) is highly vulnerable, 13.7% (1580 ha) is moderately vulnerable, 10.9% (1254 ha) shows low vulnerability, 6.4% (739 ha) shows very low vulnerability and 9.5% (1088 ha) represents an area of extremely low vulnerability. Kuala Nerus, which covers 10,418 ha, encompasses an extremely vulnerable area of 1880 ha (18%), a very vulnerable area of 2035 ha (19.5%), a highly vulnerable area of 2528 ha (24.3%), a moderately vulnerable area of 1157 ha (11.1%), an area of low vulnerability of 989 ha (9.5%), an area of very low vulnerability of 404 ha (3.9%), and an area of extremely low vulnerability of 1426 ha (13.7%).
In comparison to a very gentle profile, south of the river the beach and nearshore profile in Kuala Nerus is very steep. Pengadang Buluh covers a total area of 8059 ha, which includes 45.5% (3667 ha) of an extremely vulnerable area, 12.4% (1003 ha) of a very vulnerable area, 17% (1370 ha) of a highly vulnerable area, 1.4% (115 ha) of a moderately vulnerable area, 4.3% (350 ha) a low vulnerability area, 15.4% (1242 ha) and very low vulnerability area and 3.9% (313 ha), and an area of extremely low vulnerability. Accordingly, Pengadang Buluh shows the highest vulnerability with a vulnerability rate of 74.9% compared to vulnerability rates of 61.8% and 59.5% in Kuala Nerus and Batu Rakit, respectively.
Kuala Nerus and Pengadang Buluh are two neighborhoods in Kuala Lumpur that are separated by a big river (Kuala Terengganu River), which flows into the South China Sea. This low-lying, low-elevation area was found to have the highest susceptibility, and it might be used as a future reference for adaptive management planning. Kuala Nerus and Pengadang Buluh (most susceptible) are in Kuala Terengganu, with the Right Bank International Terrenganu Airport (ITA) and Universiti Malaysia Terengganu (UMT) (Behand) to the Left Bank Bt.
Low-lying areas are difficult to maintain, and controlling them may be one of the most onerous challenges facing coastal managers. The data also reveals that Terengganu’s International Airport (Sultan Mahmud Airport), which is close to Kg. Telaga Batin, has the most erosion and is a high sensitivity region. The airport would be exposed to erosion and floods as a result of this. Kg. Telaga Batin is an area of significant vulnerability to erosion.
The average erosion rate for Kuala Nerus and Pengadang Buluh is 3.20 m/year and 5.13 m/year, respectively [24]. These areas would see more erosion and land loss than our research region. This is the greatest research area, which includes a major river (the Kuala Terengganu River). This area has also suffered some of the most catastrophic coastal erosion in the past. The beachfront is also fairly long from the south side of the Kuala Terengganu River to the Ibai River, a developed district with new hotels and significant mansions. The expected result in this part suggests that the Right Bank K. Ibai will be the most eroded. The beach retreat is rather sensitive and important from the south side of the Right Bank ITA and UMT to K. Ibai, a developed region with new hotels and the Sultan of Terengganu’s palace.

4. Discussion

4.1. Coastal City Mitigation Policies and Erosion Control Measures

The consequences of coastal erosion can be severe because erosion oftentimes radically changes landforms, land usage, and land ownership. The impacts of such changes both directly and indirectly affect social, economic, and physical assets. A proper mitigation policies and erosion control (MPEC) program should be developed to keep the consequences within acceptable limits. The definition of “acceptable limits” is a matter of public policy that needs to be informed by engineers, scientists, and economists who offer specialist knowledge and rigorous analyses. The product of MPEC adaptation planning is a comprehensive plan including an action statement that lists deliverables. The impact of coastal city erosion can be mitigated on land through structural solutions, vegetation management, and planning, as well as beach improvements. Structural approaches may change the physical characteristics of the shoreline and offer a physical barrier to the sea. They always require great expenditures, and have immediate, and sometimes long-term environmental impacts. Thus, spatial knowledge of the distribution of vulnerability classes is important as efforts can be highly targeted.

4.2. Implementing Adaptation Plans

There are several constraints for integrated MCDA modeling and the implementation of GIS tools for vulnerable coastal cities such as Kuala Terengganu. One main limitation in using MCDA models is the risk of using inadequate sources to determine environmental criteria and sub-criteria for erosion in coastal areas. This fundamental limitation accrues from insufficient documentation and reporting on relevant qualitative and semi-quantitative data along and disintegrated environmental and non-climate data sets.
As we learned from the case of Malaysia, while attempts are made to implement mitigation measures to control coastal erosion, there is often a lack of coordination in undertaking the comprehensive mitigation strategies discussed above. Thus, we recommend four specific actions that can advance the implementation of mitigation and adaptation measures:
  • Designate an appropriate federal agency to be responsible for the general direction and coordination of adaptation plans and feasibility studies.
  • The final design and construction of protective works in accordance with feasibility studies should be undertaken by a dedicated department. In the case of Malaysia, this would be the Department of Irrigation and Drainage.
  • Establish a technical coastal city erosion control center to orchestrate proposed development in critical erosion areas, which requires coordination across all federal and state government agencies.
  • Initiate an inter-policy coordination process to negotiate trade-offs between potentially conflicting goals to determine optimal adaption across various socio-economic and environmental criteria.
The expected socio-economic implications of critical erosion vulnerability regions imply that the social and economic costs of erosion may soon be intolerable. For the Kuala Terengganu area, feasibility studies are needed to more accurately identify and quantify such costs, as well as the costs of control, so that a protective investment choice may be taken for affected institutions. In this research, those decisions and policies have already been taken for three high vulnerability areas: Batu Rakit, Kuala Nerus, and Pengadang Buluh. Kuala Terengganu’s recreation resorts of Kuala Nerus and Pengadang Buluh are located near Gong Merbau and Left Bank. Ibai, K. The recreational facility is a sandy beach that is well-known and has a strong brand. Erosion has already had a significant physical impact [24]. There are other beach areas in the region where recreation might be relocated without too much difficulty. However, people are familiar with the Kuala Nerus and Pengadang Buluh beaches, as they have developed support services and are well-known.
When all of these factors are taken into account, a moderate demographic impact is predicted. It receives a modest economic effect rating based on similar reasoning. Damage has already been done; the beach has been eroded, and a swimming pool has been ruined. This gives the feasibility study a lot of weight and makes it a top priority. To establish the most optimal protection scheme, the feasibility study will assess groynes, breakwaters, jetties, and beach restoration separately and in combination.
Pengadang Buluh is a fishing town located between KG. Telaga Batn and S.K. Chen-dring in Kuala Nerus. The village’s main access route has been ruined by erosion in this location. Other areas of the beach have been armored with gabion walls, although these offer just temporary protection. Threatened houses are low-cost, temporary buildings and road closures cause all traffic to and from the town to detour and experience a delay. Erosion has taken away the sand beach that formerly stood in front of the settlement.
The impending displacement of so many families, along with the loss of the village’s principal access route, has a significant impact on and disrupts the village’s established community life. As a result, the demographic impact is significant. Because a large demographic impact and a moderate economic impact are likely, a feasibility assessment is required immediately. The feasibility study will analyse revetments, seawalls, groynes, and breakwaters in high-vulnerability regions in Kuala Terengganu.

5. Conclusions

In a coastal city, environmental vulnerability is a complex and fuzzy problem that is influenced by many variables. Therefore, our research calls for a holistic planning strategy to resolve potential climate threats, current environmental, social, and economic sensitivities, emerging risks, and capability gaps. This study presents an analysis and approach for the formulation of environmental mathematical models for establishing integrated MCDA criteria and GIS tools to evaluate the vulnerability of the Kuala Terengganu coastal area in Malaysia to erosion. We presented vulnerability maps highlighting impacts on the coastal city that would potentially be caused by environmental factors.
An AHP model was used to investigate erosion vulnerability which proved efficient in conjunction with the GIS as a tool for decision making. Our Delphi-AHP model highlighted the presence of a river as the most influential (greatest weight) among all considered environmental and social criteria for erosion vulnerability of the Kuala Terengganu coastal area. Different coastal states will face different key impacts induced by environmental, climatic, and non-climatic factors which can be identified using our study as a methodological blueprint. We were able to pinpoint the greatest vulnerability to specific regions within Kuala Terengganu. This helps with prioritising and localising actions.
A comprehensive set of criteria was considered, capturing environmental, social, and economic development considerations, including data on the topography, presence of a river, slope, soil, geology, land use, presence of roads, build-up, and population. These criteria were thought to affect erosion directly or indirectly in the study area. The relative importance of these criteria may vary by region and the AHP model is well-suited to work with different sets of criteria. This is, however, also a limitation of our study, as new models will need to be built in accordance with regional characteristics.
A challenge for our study was the lack of sources of regularly measured coastal data that were sufficiently accurate and gathered in appropriate time intervals. Since this study has been conducted by using limited coastal city data and maps, it is clear that it provides a general view of environmental hazards for the Kuala Terengganu coastal area. However, as one of the first overall coastal assessment and adaptation planning studies in the Kuala Terengganu coastal area, future studies can build on it.
The study provides inputs for researchers, policymakers, and land-use planners and developers for their future adaptation planning in Kuala Terengganu, as the most vulnerable areas were identified. This study has direct planning implications for several coastal cities in Malaysia, including, for example, Kuala Kuantan. A network of shared knowledge and expertise will go a long way in connecting these cities and their planning efforts with a long-term view on establishing adaptation planning systems and best practice management in coastal city planning.

Author Contributions

M.B., Z.Z.I., methodology; M.B., Z.Z.I., software; M.B., Z.Z.I., validation; M.B., Z.Z.I., formal analysis; M.B., Z.Z.I., investigation; M.B., Z.Z.I., B.O., resources; M.B., Z.Z.I., data curation; M.B., Z.Z.I., writing—original draft preparation; M.F.A., W.I.A.W.T., A.B.P., visualization; M.B., Z.Z.I., A.B.P., project administration; M.B., Z.Z.I., M.F.A., funding acquisition; M.B., Z.Z.I., M.F.A., W.I.A.W.T., I.D.W., supervision; B.O., S.R., I.D.W., writing—review and editing. All authors have read and agreed to the published version of the manuscript.

Funding

Funding for this project has been provided by the Universiti Putra Malaysia (UPM) RUGS 4 with Project Number (03-04-11-1477RU) and RUGS 6 with Project Number (03-01-12-1664RU) programs.

Institutional Review Board Statement

Not applicable.

Informed Consent Statement

Not applicable.

Data Availability Statement

Not applicable.

Acknowledgments

We gratefully acknowledge the involved government agencies of Peninsular Malaysia who assisted in this project and in the numerous pilots, which made this project possible. We also thank NAHRIN, DID, JUPEM, and SMART for offering their time. An acknowledgment also goes to the INOS Higher Institution of Centre of Excellence (Vot 66928) for partially supporting the extension of the study.

Conflicts of Interest

The authors declare that there are no conflict of interest.

References

  1. Kummu, M.; de Moel, H.; Salvucci, G.; Viviroli, D.; Ward, P.J.; Varis, O. Over the hills and further away from coast: Global geospatial patterns of human and environment over the 20th–21st centuries. Environ. Res. Lett. 2016, 11, 034010. [Google Scholar] [CrossRef]
  2. Klein, R.J.; Nicholls, R.J. Assessment of coastal vulnerability to climate change. Ambio 1999, 28, 182–187. [Google Scholar]
  3. Nicholls, R.J.; Wong, P.P.; Burkett, V.; Codignotto, J.; Hay, J.; McLean, R.; Saito, Y. Coastal Systems and Low-Lying Areas; USGS: Reston, VA, USA, 2007. [Google Scholar]
  4. Bagheri, M.; Ibrahim, Z.Z.; Mansor, S.; Manaf, L.A.; Akhir, M.F.; Talaat, W.I.A.W.; Pour, A.B. Land-Use Suitability Assessment Using Delphi and Analytical Hierarchy Process (D-AHP) Hybrid Model for Coastal City Management: Kuala Terengganu, Peninsular Malaysia. ISPRS Int. J. Geo-Inf. 2021, 10, 621. [Google Scholar] [CrossRef]
  5. Le, T.D.N. Climate change adaptation in coastal cities of developing countries: Characterizing types of vulnerability and adaptation options. Mitig. Adapt. Strat. Glob. Chang. 2020, 25, 739–761. [Google Scholar] [CrossRef]
  6. Cradock-Henry, N.A.; Diprose, G.; Frame, B. Towards local-parallel scenarios for climate change impacts, adaptation and vulnerability. Clim. Risk Manag. 2021, 34, 100372. [Google Scholar] [CrossRef]
  7. Davar, L.; Griggs, G.; Danehkar, A.; Salmanmahiny, A.; Azarnivand, H.; Naimi, B. A Spatial Integrated SLR Adaptive Management Plan Framework (SISAMP) toward Sustainable Coasts. Water 2021, 13, 2263. [Google Scholar] [CrossRef]
  8. Luetz, J.M. Climate Refugees: Why Measuring the Immeasurable Makes Sense beyond Measure. In Climate Action; Springer: Singapore, 2020; pp. 286–299. [Google Scholar]
  9. Heang, C.; Birchall, S.J. Community Planning Opportunities: Building Resilience to Climate Variability Using Coastal Naturalization. In Climate Action; Springer: Singapore, 2020; pp. 347–355. [Google Scholar]
  10. Deshpande, T.; Michael, K.; Bhaskara, K. Barriers and enablers of local adaptive measures: A case study of Bengaluru’s informal settlement dwellers. Local Environ. 2018, 24, 167–179. [Google Scholar] [CrossRef] [Green Version]
  11. Sterzel, T.; Lüdeke, M.K.B.; Walther, C.; Kok, M.T.; Sietz, D.; Lucas, P. Typology of coastal urban vulnerability under rapid urbanization. PLoS ONE 2020, 15, e0220936. [Google Scholar] [CrossRef] [Green Version]
  12. Delgado, A.; Rodriguez, D.J.; Amadei, C.A.; Makino, M. Water in Circular Economy and Resilience; International Bank for Reconstruction and Development/The World Bank: Washington, DC, USA, 2021. [Google Scholar]
  13. Awan, U. Industrial Ecology in Support of Sustainable Development Goals. In Responsible Consumption and Production; Springer: Singapore, 2020; pp. 370–380. [Google Scholar]
  14. Khedun, C.P.; Singh, V.P. Climate Change, Water, and Health: A Review of Regional Challenges. Water Qual. Expo. Health 2013, 6, 7–17. [Google Scholar] [CrossRef]
  15. Scheffran, J. Security Risks of Climate Change: Vulnerabilities, Threats, Conflicts and Strategies. In Coping with Global Environmental Change, Disasters and Security; Springer: Singapore, 2011; pp. 735–756. [Google Scholar]
  16. Patz, J.; Corvalan, C.; Horwitz, P.; Campbell-Lendrum, D.; Watts, N.; Maiero, M.; Cooper, D. Our Planet, Our Health, Our Future. Human Health and the Rio Conventions: Biological Diversity, Climate Change and Desertification; World Health Organization: Geneva, Switzerland, 2012. [Google Scholar]
  17. Bagheri, M.; Ibrahim, Z.Z.; Mansor, S.; Abd Manaf, L.; Akhir, M.F.; Talaat, W.I.A.W.; Beiranvand Pour, A. Application of Multi-Criteria Decision-Making Model and Expert Choice Software for Coastal City Vulnerability Evaluation. Urban Sci. 2021, 5, 84. [Google Scholar] [CrossRef]
  18. Akanwa, A.O.; Joe-Ikechebelu, N. The Developing World’s Contribution to Global Warming and the Resulting Consequences of Climate Change in These Regions: A Nigerian Case Study. In Global Warming and Climate Change; IntechOpen: London, UK, 2019. [Google Scholar]
  19. Wang, J.; Gao, W.; Xu, S.; Yu, L. Evaluation of the combined risk of sea level rise, land subsidence, and storm surges on the coastal areas of Shanghai, China. Clim. Chang. 2012, 115, 537–558. [Google Scholar] [CrossRef]
  20. Yin, J.; Yin, Z.-E.; Hu, X.-M.; Xu, S.-Y.; Wang, J.; Li, Z.-H.; Zhong, H.-D.; Gan, F.-B. Multiple scenario analyses forecasting the confounding impacts of sea level rise and tides from storm induced coastal flooding in the city of Shanghai, China. Environ. Earth Sci. 2011, 63, 407–414. [Google Scholar] [CrossRef]
  21. Woodruff, J.D.; Irish, J.L.; Camargo, S.J. Coastal flooding by tropical cyclones and sea-level rise. Nature 2013, 504, 44–52. [Google Scholar] [CrossRef] [PubMed] [Green Version]
  22. Chen, R.; Zhang, Y.; Xu, D.; Liu, M. Climate Change and Coastal Megacities: Disaster Risk Assessment and Responses in Shanghai City. In Climate Change, Extreme Events and Disaster Risk Reduction; Springer: Berlin, Germany, 2018; pp. 203–216. [Google Scholar]
  23. Chan, F.K.S.; Chuah, C.J.; Ziegler, A.; Dąbrowski, M.; Varis, O. Towards resilient flood risk management for Asian coastal cities: Lessons learned from Hong Kong and Singapore. J. Clean. Prod. 2018, 187, 576–589. [Google Scholar] [CrossRef] [Green Version]
  24. Bagheri, M.; Ibrahim, Z.Z.; Bin Mansor, S.; Manaf, L.A.; Badarulzaman, N.; Vaghefi, N. Shoreline change analysis and erosion prediction using historical data of Kuala Terengganu, Malaysia. Environ. Earth Sci. 2019, 78, 1–21. [Google Scholar] [CrossRef]
  25. Ariffin, E.H.; Sedrati, M.; Akhir, M.F.; Yaacob, R.; Husain, M.L. Open Sandy Beach Morphology and Morphodynamic as Response to Seasonal Monsoon in Kuala Terengganu, Malaysia. J. Coast. Res. 2016, 75, 1032–1036. [Google Scholar] [CrossRef]
  26. IPCC. IPCC Fourth Assessment Report: Climate Change 2007. Working Group, I Report the Physical Science Basis. Available online: ipcc.ch/ipccreports/ar4-wg1.htm (accessed on 20 November 2007).
  27. Boak, E.H.; Turner, I. Shoreline Definition and Detection: A Review. J. Coast. Res. 2005, 214, 688–703. [Google Scholar] [CrossRef] [Green Version]
  28. Wang, G.; Liu, Y.; Wang, H.; Wang, X. A comprehensive risk analysis of coastal zones in China. Estuar. Coast. Shelf Sci. 2014, 140, 22–31. [Google Scholar] [CrossRef]
  29. Gallina, V.; Torresan, S.; Zabeo, A.; Critto, A.; Glade, T.; Marcomini, A. A Multi-Risk Methodology for the Assessment of Climate Change Impacts in Coastal Zones. Sustainability 2020, 12, 3697. [Google Scholar] [CrossRef]
  30. Boateng, I. An assessment of the physical impacts of sea level riseand coastal adaptation: A case study of the eastern coast of Ghana. Clim. Chang. 2012, 114, 273–293. [Google Scholar] [CrossRef]
  31. Hayrol, A.; Bahaman, A.S.; D’Silva, J.L.; Jegak, U. Global warming at the east coast zone of Peninsular Malaysia. Am. J. Agric. Biol. Sci. 2011, 6, 377–383. [Google Scholar]
  32. Dube, K.; Nhamo, G.; Chikodzi, D. Flooding trends and their impacts on coastal communities of Western Cape Province, South Africa. GeoJournal 2021, 1–16. [Google Scholar] [CrossRef] [PubMed]
  33. Mather, A.A.; Stretch, D.D. A perspective on sea level riseand coastal storm surge from Southern and Eastern Africa: A case study near Durban, South Africa. Water 2012, 4, 237–259. [Google Scholar] [CrossRef] [Green Version]
  34. Anthony, D.U.N.S.T.A.N.; Shaaban, A.; Aung, T.H.; Saleh, E.J.R.I.A.; Hamid, R.A.; Osman, A.R. Sea Level Changes along the Coast of Sandakan Town, Sabah, Malaysia: Projection and Inundation Coverage. In Proceedings of the E-Proceedings of the 36th IAHR World Congress, Hague, The Netherlands, 28 June–3 July 2015; Volume 28. [Google Scholar]
  35. Ariffin, E.H.; Sedrati, M.; Akhir, M.F.; Norzilah, M.N.M.; Yaacob, R.; Husain, M.L. Short-term observations of beach Morphodynamics during seasonal monsoons: Two examples from Kuala Terengganu coast (Malaysia). J. Coast. Conserv. 2019, 23, 985–994. [Google Scholar] [CrossRef]
  36. Okoli, C.; Pawlowski, S.D. The Delphi method as a research tool: An example, design considerations, and applications. Inform. Manag. 2004, 42, 15–29. [Google Scholar] [CrossRef] [Green Version]
  37. Skulmoski, G.; Hartman, F.T.; Krahn, J. The Delphi Method for Graduate Research. J. Inf. Technol. Educ. Res. 2007, 6, 1–21. [Google Scholar] [CrossRef]
  38. Cole, Z.D.; Donohoe, H.M.; Stellefson, M.L. Internet-Based Delphi Research: Case Based Discussion. Environ. Manag. 2013, 51, 511–523. [Google Scholar] [CrossRef]
  39. Schmidt, R.; Lyytinen, K.; Keil, M.; Cule, P. Identifying Software Project Risks: An International Delphi Study. J. Manag. Inf. Syst. 2001, 17, 5–36. [Google Scholar] [CrossRef]
  40. Mukherjee, N.; Huge, J.; Sutherland, W.J.; McNeill, J.; Van Opstal, M.; Dahdouh-Guebas, F.; Koedam, N. The Delphi technique in ecology and biological conservation: Applications and guidelines. Methods Ecol. Evol. 2015, 6, 1097–1109. [Google Scholar] [CrossRef] [Green Version]
  41. Donohoe, H.M.; Needham, R.D. Moving best practice forward: Delphi characteristics, advantages, potential problems, and solutions. Int. J. Tour. Res. 2009, 11, 415–437. [Google Scholar] [CrossRef]
  42. Landeta, J.; Barrutia, J.; Lertxundi, A.L. Hybrid Delphi: A methodology to facilitate contribution from experts in professional contexts. Technol. Forecast. Soc. Chang. 2011, 78, 1629–1641. [Google Scholar] [CrossRef]
  43. Orencio, P.M.; Fujii, M. A localized disaster-resilience index to assess coastal communities based on an analytic hierarchy process (AHP). Int. J. Disaster Risk Reduct. 2013, 3, 62–75. [Google Scholar] [CrossRef]
  44. Saaty, T.L. Absolute and relative measurement with the AHP. The most livable cities in the United States. Socio-Econ. Plan. Sci. 1986, 20, 327–331. [Google Scholar] [CrossRef]
  45. Saaty, T.L. What is the analytic hierarchy process? In Mathematical Models for Decision Support; Springer: Berlin/Heidelberg, Germany, 1988; pp. 109–121. [Google Scholar]
  46. Saaty, T.L. Homogeneity and clustering in AHP ensures the validity of the scale. Eur. J. Oper. Res. 1994, 72, 598–601. [Google Scholar] [CrossRef]
  47. Saaty, T.L. How to make a decision: The analytic hierarchy process. Eur. J. Oper. Res. 1990, 48, 9–26. [Google Scholar] [CrossRef]
  48. Saat, T.L.; Vargas, L.G. Uncertainty and rank order in the analytic hierarchy process. Eur. J. Oper. Res. 1987, 32, 107–117. [Google Scholar] [CrossRef]
  49. Sevkli, M.; Koh, S.C.L.; Zaim, S.; Demirbag, M.; Tatoglu, E. An application of data envelopment analytic hierarchy process for supplier selection: A case study of BEKO in Turkey. Int. J. Prod. Res. 2007, 45, 1973–2003. [Google Scholar] [CrossRef] [Green Version]
  50. Wang, C.-N.; Tsai, H.-T.; Ho, T.-P.; Nguyen, V.-T.; Huang, Y.-F. Multi-Criteria Decision Making (MCDM) Model for Supplier Evaluation and Selection for Oil Production Projects in Vietnam. Processes 2020, 8, 134. [Google Scholar] [CrossRef] [Green Version]
  51. Kiker, G.A.; Bridges, T.S.; Varghese, A.; Seager, P.T.P.; Linkov, I. Application of Multicriteria Decision Analysis in Environmental Decision Making. Integr. Environ. Assess. Manag. 2005, 1, 95–108. [Google Scholar] [CrossRef]
  52. Phua, M.-H.; Minowa, M. A GIS-based multi-criteria decision making approach to forest conservation planning at a landscape scale: A case study in the Kinabalu Area, Sabah, Malaysia. Landsc. Urban Plan. 2005, 71, 207–222. [Google Scholar] [CrossRef]
  53. Rubino, M.J.; Hess, G.R. Planning open spaces for wildlife 2: Modeling and verifying focal species habitat. Landsc. Urban Plan. 2003, 64, 89–104. [Google Scholar] [CrossRef]
  54. González, A.; Gilmer, A.; Foley, R.; Sweeney, J.; Fry, J. Applying geographic information systems to support strategic environmental assessment: Opportunities and limitations in the context of Irish land-use plans. Environ. Impact Assess. Rev. 2011, 31, 368–381. [Google Scholar] [CrossRef] [Green Version]
  55. Vaidya, O.S.; Kumar, S. Analytic hierarchy process: An overview of applications. Eur. J. Oper. Res. 2006, 169, 1–29. [Google Scholar] [CrossRef]
  56. Saaty, T.L. Decision-making with the AHP: Why is the principal eigenvector necessary. Eur. J. Oper. Res. 2003, 145, 85–91. [Google Scholar] [CrossRef]
  57. Saaty, T.L. A scaling method for priorities in hierarchical structures. J. Math. Psychol. 1977, 15, 234–281. [Google Scholar] [CrossRef]
  58. Ramanathan, R. A note on the use of the analytic hierarchy process for environmental impact assessment. J. Environ. Manag. 2001, 63, 27–35. [Google Scholar] [CrossRef] [PubMed] [Green Version]
  59. Ishizaka, A.; Labib, A. Analytic hierarchy process and expert choice: Benefits and limitations. OR Insight 2009, 22, 201–220. [Google Scholar] [CrossRef] [Green Version]
  60. Sadeghi, H.; Rashidinejad, M.; Abdollahi, A. A comprehensive sequential review study through the generation expansion planning. Renew. Sustain. Energy Rev. 2017, 67, 1369–1394. [Google Scholar] [CrossRef]
  61. Van der Heijden, K.; Bradfield, R.; Burt, G.; Cairns, G.; Wright, G. The Sixth Sense: Accelerating Organizational Learning with Scenarios; John Wiley & Sons: New York, NY, USA, 2009. [Google Scholar]
Figure 1. Location of Kuala Terengganu, Malaysia.
Land 10 01271 g001
Figure 2. Coastal city vulnerability assessment and adaptation plan framework.
Land 10 01271 g002
Figure 3. (ai) Radar graph of the vulnerability criteria for coastal city erosion for Kuala Terengganu, Malaysia, as per sensitivity analysis conducted in Expert Choice software. (jr) Radar sensitive graph between the vulnerability criteria and regions developed as an alternative.
Land 10 01271 g003aLand 10 01271 g003bLand 10 01271 g003c
Figure 4. Delphi-AHP design and weights for EGL.
Land 10 01271 g004
Figure 5. Delphi-AHP design and weights for HAGL.
Land 10 01271 g005
Figure 6. Environmental GIS layers class: (A) Land Use, (B) Geology, (C) River, (D) Slope, (E) Soil (F) Digital Elevation Map (DEM). Environmental GIS layers based on calculations of Delphi-AHP weights, (G) Land use layer, (H) Geology layer, (I) River layer, (J) Slope layer, (K) Soil layer, (L) Digital Elevation Map (DEM) layer.
Land 10 01271 g006aLand 10 01271 g006b
Figure 7. Human activity GIS layers: (A) Built-Up class, (B) Road class, (C) Population class. Human activity GIS layers after calculating with Delphi-AHP weights: (D) Built-Up layer, (E) Road layer, (F) Population layer.
Land 10 01271 g007
Figure 8. Final vulnerability map and vulnerability regions of coastal erosion for the coastal areas of Kuala Terengganu, Malaysia.
Land 10 01271 g008
Table 1. Primary and Secondary Data.
Primary Data (Delphi-AHP)Secondary Spatial Data (GIS)
  • ECM, send to the experts
  • Technical reports
  • Library survey
Digital MapsYearResolutionSource
Topography20021:50,000JUPEM
Land use20081:100,000
MUKIM20101:100,000
Population20101:50,000Statistic Department
Geology20081:100,000Geology Department
Soil20081:100,000MOA
Table 2. Delphi-AHP weights for coastal city vulnerability criteria for Kuala Terengganu, Malaysia.
GoalIndexCriteriaCriteria Consistency RatioCriteria WeightSub-CriteriaSub-Criteria Consistency RatioSub-Criteria WeightAlternativeAlternative Weight
Coastal city vulnerability assessmentVulnerability IndexEnvironmental CriteriaRiver0.090.232Seasonal shifts0.060.084Merang0.053
Discharge of water0.060.207Batu Rakit0.129
The severity of the flood0.030.27Kuala Nerus0.199
Sedimentology (Sediment rate)0.060.123Manir0.105
Water from runoff0.070.06Pengadang Buluh0.439
Relationship between Rainfall and Runoff0.060.256Rusila0.075
Land Use0.040.201Cultivation & Plantation0.070.125Merang0.101
Forestry0.070.239Batu Rakit0.186
Rangeland0.070.046Kuala Nerus0.218
Industrial, and the commercial development0.090.361Manir0.075
Watershed0.060.105Pengadang Buluh0.237
Cultural areas0.050.05Nerus0.183
Geology0.080.058Scale of geomorphology0.080.566Merang0.101
Batu Rakit0.066
Waterways0.080.26Kuala Nerus0.121
Tectonic movement0.080.086Manir0.211
Pengadang Buluh0.435
Epoch of geology0.080.08Nerus0.067
Slope0.090.12Slope level0.080.582Merang0.052
Batu Rakit0.204
The average waterway/floodway slope0.070.161Kuala Nerus0.118
The slope of land usage on average0.090.197Manir0.103
Pengadang Buluh0.132
Without-slope regions0.040.06Nerus0.392
Soil0.090.092Type of soil0.080.373Merang0.075
Erosion of the Soil0.070.337Batu Rakit0.1
Influence of the soil0.060.099Kuala Nerus0.267
Manir0.038
Organic material0.090.045Pengadang Buluh0.472
Amount of land used for agriculture0.070.145Nerus0.048
Topography0.090.167Vertical categorization0.090.223Merang0.104
Batu Rakit0.163
Vertical classification in coastal area0.090.239Kuala Nerus0.096
Classification area and location0.080.425Manir0.138
Pengadang Buluh0.267
Average height0.080.113Nerus0.232
Human Activity CriteriaRoad0.080.029Type of grid0.090.2Merang0.082
The closeness of a water source to a road0.090.148Batu Rakit0.039
Kuala Nerus0.093
Location of the road to the seaside0.090.607Manir0.035
Materials Types0.090.045Pengadang Buluh0.528
Nerus0.223
Population0.090.047Density/ha0.090.112Merang0.063
Landforms are shaped by density0.070.129Batu Rakit0.267
Kuala Nerus0.207
The density of the coastline0.060.501Manir0.069
Density in rural and urban zone0.060.045Pengadang Buluh0.299
Density in a potentially dangerous location0.080.213Nerus0.095
Build up0.070.071The shape of the land0.080.338Merang0.055
Location of the river grid0.040.184Batu Rakit0.170
Kuala Nerus0.172
The distance from the coast0.070.426Manir0.072
Materials supply, both local and non-local0.070.052Pengadang Buluh0.434
Nerus0.097
Table 3. Coastal city vulnerability sensitivity assessment.
Human Activity and Environmental Criteria
%Land UseTopographyGeologySlopeSoilBuilt-UpPopulationRoadMerangBatu RakitKuala NerusManirPengadang BuluhNerus
River1023.520.74.213.810.40.95.53.510.217.616.59.526.419.9
5011.117.32.06.54.93.92.61.78.714.217.610.434.414.7
902.33.60.51.41.18.30.60.47.311.219.710.842.29.4
Publisher’s Note: MDPI stays neutral with regard to jurisdictional claims in published maps and institutional affiliations.

