Article

Estimation of the Rational Range of Ecological Compensation to Address Land Degradation in the Poverty Belt around Beijing and Tianjin, China

1
Natural Resource Asset Capital Research Center, Hebei GEO University, Shijiazhuang 050031, China
2
School of Land Science and Space Planning, Hebei GEO University, Shijiazhuang 050031, China
*
Author to whom correspondence should be addressed.
Submission received: 4 November 2021 / Revised: 1 December 2021 / Accepted: 6 December 2021 / Published: 14 December 2021

Abstract

:
Ecological compensation provides innovative ecological solutions for addressing land degradation and guaranteeing the sustainable provision of essential ecosystem services. This study estimated the ecosystem service value and the opportunity cost of land use in the Poverty Belt of China—around Beijing and Tianjin—from 1980 to 2015 on the small watershed scale, and thereafter estimated the rational range of ecological compensation in this ecologically fragile zone. Results showed that the total ecosystem service value in the study area gradually decreased from CNY 54.198 billion in 1980 to CNY 53.912 billion in 2015. Moreover, the annual total ecological compensation of the whole study area ranged between CNY 2.67 billion and 2.83 billion. More specifically, areas with higher ecological compensation standards are mainly concentrated in the northwestern and northern parts of the study area, with a lower economic development level, while areas with lower ecological compensation standards are mainly located in areas with a relatively high level of economic development, e.g., the southern and southeastern parts of the study area. These results can provide valuable decision-support information for the design and optimization of ecological compensation to address land degradation along with rapid urbanization in the Beijing–Tianjin–Hebei region.

1. Introduction

Ecological compensation (i.e., payments for ecosystem services or payments for environmental services) is one of the important factors of the construction of ecological civilization in China, and plays a fundamental role in addressing land degradation along with rapid urbanization [1,2]. As an innovative form of ecological solution, ecological compensation can effectively arouse the enthusiasm of ecosystem service providers to alleviate land degradation and guarantee the sustainable provision of essential ecosystem services [3,4], the effectiveness of which has been validated in a number of programs, such as the ecological compensation program in the Catskill Basin in the United States, or the PSA Project in Costa Rica [5,6,7]. There has also been remarkable achievement in some ecological compensation projects in China, e.g., the Beijing–Tianjin Sandstorm Source Control Project and the “Three North” shelterbelt project [8,9]. However, the theoretical research on ecological compensation in China is still in its initial stages, and is far behind the project practice, which is one of the most important reasons why some ecological compensation projects in China have not achieved their expected effects [10,11]. It is therefore of great practical significance to carry out more in-depth theoretical exploration of ecological compensation for the design and perfection of ecological compensation projects in China [11,12].
Rational ecological compensation standards are key to ensuring the effects of ecological compensation, but there is still a lack of universal methods for estimating ecological compensation standards [4,11,13]. In fact, scholars around the world have explored a variety of methods for estimating ecological compensation standards [14,15]. The current methods generally first use a certain method to estimate the upper and lower limits of the ecological compensation standard, and then determine the acceptable ones by making appropriate dynamic adjustments according to the actual situation of the study area and the economic conditions of stakeholders [11,13,16]. For example, the ecosystem service value and opportunity cost have been widely used as the upper and lower limits of ecological compensation standards [13,16]. The opportunity cost measures the opportunity cost of economic development for protecting the ecological environment in the compensated areas, which can be generally estimated via questionnaire surveys, empirical investigation, and indirect calculation [11,17]. However, the opportunity cost method takes less consideration of the spatial heterogeneity within the compensated areas, which often results in insufficient compensation and, consequently, limits the accuracy and applicability of the ecological compensation standard [6,18]. Nevertheless, the opportunity cost method is still the mainstream method for determining ecological compensation standards in developing countries, since it is easy to operate and relatively fair [18]. By contrast, the ecosystem service value, which can be estimated in a direct or indirect way, can provide a reliable scientific basis for determining the ecological compensation standards [13,19]. Ecosystem service value is one of the main bases for determining ecological compensation standards; however, the ecosystem service value estimated with existing methods far exceeds the actual compensation capacity of ecosystem service consumers, and can serve as the theoretical upper limit of the ecological compensation standards [11,20].
The Poverty Belt around Beijing and Tianjin provides an ideal site for the research on ecological compensation, as it is a typical contiguous poverty zone and an ecologically fragile area, but serves as an important ecological barrier in the Beijing–Tianjin–Hebei region [20,21]. The Poverty Belt around Beijing and Tianjin is located in Hebei Province—a coastal province that contains the largest number of national-level poverty-stricken counties in China, including 25 of the 39 national-level poverty-stricken counties. The coordinated development of the Beijing–Tianjin–Hebei region is one of the major national development strategies of China, while the construction of the ecological environment is one of the key fields in which prior breakthroughs should be achieved according to the “Beijing–Tianjin–Hebei Coordinated Development Plan Outline” [22,23]. Establishment of a diversified ecological compensation mechanism so as to increase the provision of essential ecosystem services is a major strategic demand for the coordinated development of the Beijing–Tianjin–Hebei region, and can provide an important means of realizing regional sustainable development in the new era [22,24]. It is therefore of extremely important practical significance to promote coordinated development, ensuring ecological safety and promoting the construction of ecological civilization in the Beijing–Tianjin–Hebei region in order to carry out in-depth exploration of the ecological compensation in the Poverty Belt around Beijing and Tianjin in this macro background [25,26].

2. Materials and Methods
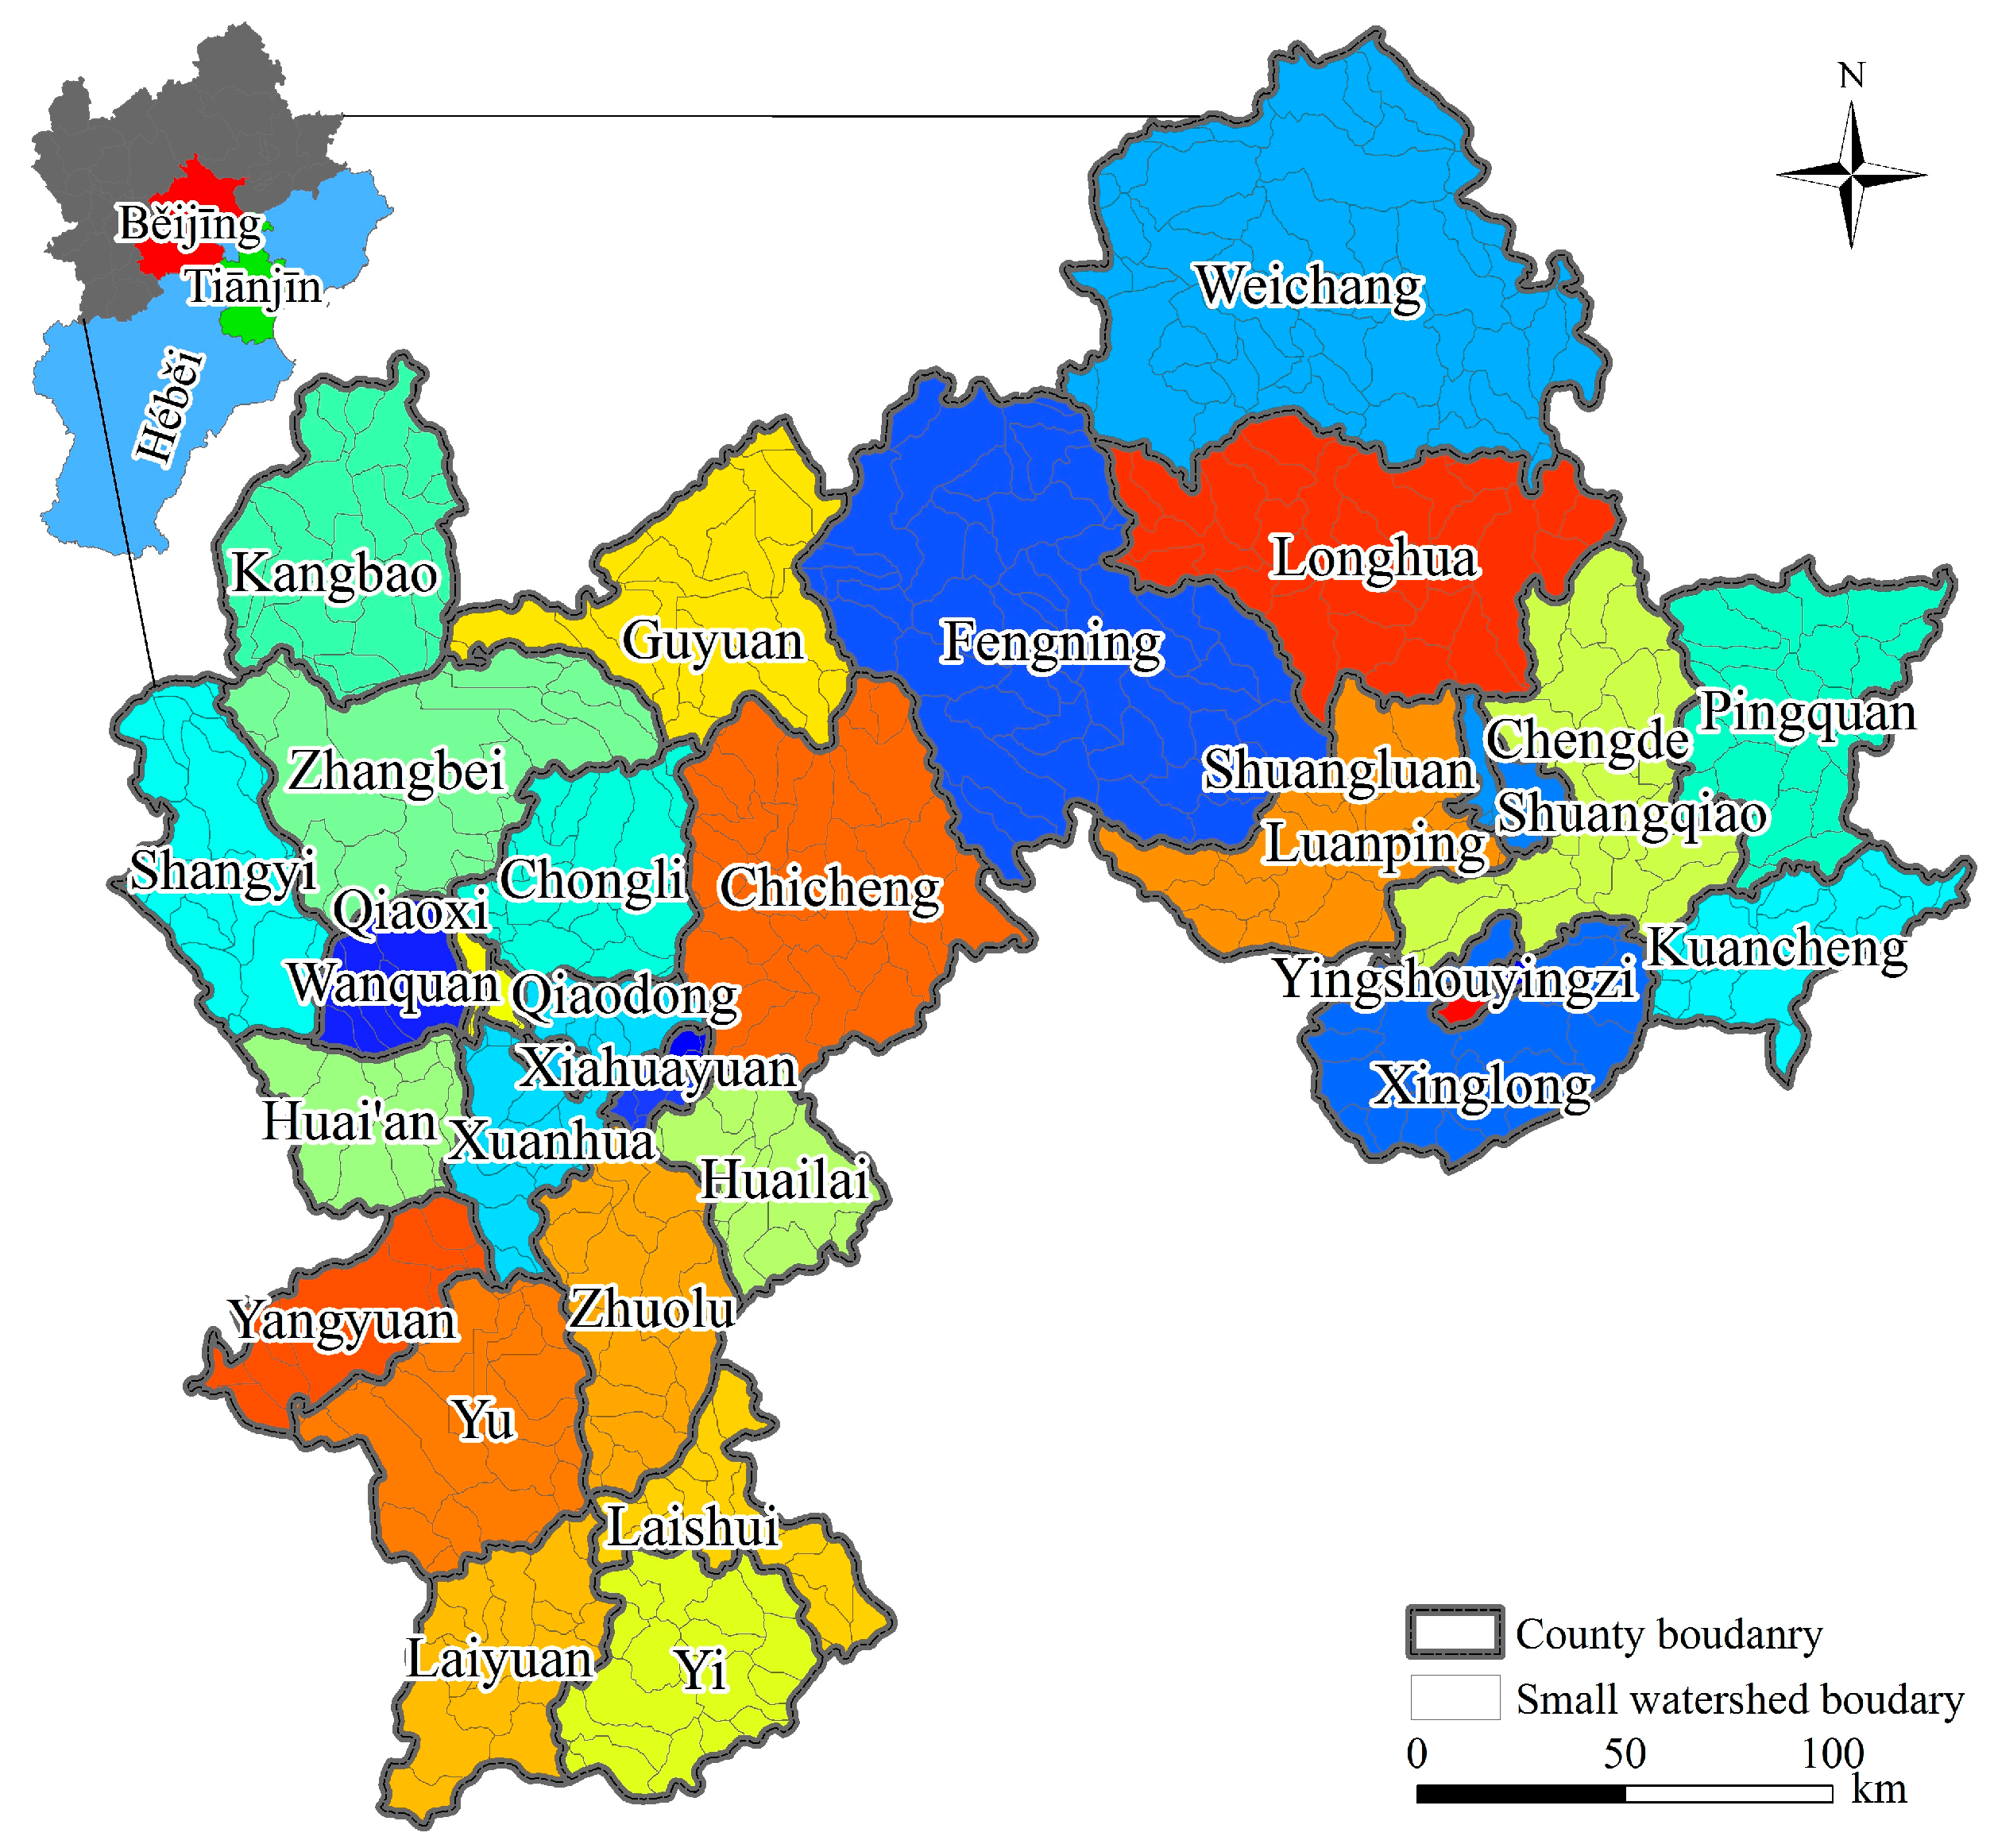
2.1. Study Area

The Poverty Belt around Beijing and Tianjin expands across Zhangjiakou City, Chengde City, and Baoding City in Hebei Province (Figure 1), with a total area of 82,893.55 km2 (113°51′47″–113°51′47″ E, 39°1′55″–42°38′7″ N); it serves as a key ecological barrier in the Beijing–Tianjin–Hebei region, and plays a dominant role in ensuring national ecological safety [26]. For example, it provides approximately 81% and 93% of the water resources in Beijing City and Tianjin City, respectively [24,27]. More specifically, the forests and wetlands in Zhangjiakou City contribute ecosystem services worth CNY ~15 billion to Beijing every year [20]. However, there are widespread ecologically fragile areas in this region, where the impacts of climate change and increased human activities along with rapid urbanization have led to serious land degradation and greatly threatened the sustainable provision of a number of essential ecosystem services [20,26]. Even worse, this region has not received sufficient ecological compensation even though it has paid a huge opportunity cost of economic development in order to ensure the ecological safety of the Beijing–Tianjin–Hebei region [23,28]. This has led to a sharp contradiction between socioeconomic development and ecological protection in this region, which has seriously threatened the national ecological safety and restrained the high-quality development of the Beijing–Tianjin–Hebei region [22,26].

2.2. Estimation of the Ecosystem Service Value

This study estimated the ecosystem service value of the study area from 1980 to 2015 using the equivalent factor method at a 1 km grid scale, and thereafter summarized it on the small watershed scale, since there is generally a homogeneous internal ecological environment in a small watershed [29,30]. First, this study classified the local ecosystems into five types (Table 1), and determined the main ecosystem service types according to previous research [1,26] and the specific situation of the study area. Then, the ecosystem service value was further categorized into market and non-market value according to the supply–demand relationship between the ecosystem and human society, based on previous studies [19,31,32]. Thereafter, the ecosystem service indicators of most concern to stakeholders in the study area and related regions were determined (Table 1). Finally, this study estimated the ecosystem service value of the study area via the ecosystem service value coefficient per unit land area in 2010 (Table 2), based on the previous studies [32,33], as follows:
E S V = i = 1 n j = 1 m A j × E i j ( i = 1 n , j = 1 m )
where ESV is the total ecosystem service value of a certain spatial unit, and this study chose the 1 km grid and small watershed with a generally homogeneous internal ecological environment as the basic spatial units. More specifically, the small watershed boundary data were extracted from the dataset of river basins and networks of China, based on the DEM (https://www.resdc.cn/DOI/doi.aspx?DOIid=44, accessed on 31 October 2021). Eij is the equivalent factor of the ith ecosystem service of the jth ecosystem (Table 2). Aj is the area of the jth ecosystem, which is obtained from the Land Use Remote Sensing Monitoring Data of China provided by the Resource and Environmental Science and Data Center, CAS (https://www.resdc.cn/Default.aspx, accessed on 31 October 2021).

2.3. Estimation of the Range of Ecological Compensation

This study separately estimated the ecological compensation standards based on the ecosystem service value and the opportunity cost on the small watershed scale, and thereafter determined the rational range of the ecological compensation standard and total ecological compensation value in the study area. This study first estimated the ecological compensation standards based on the ecosystem service value and gross domestic product (GDP) in the study area. On the one hand, the ecosystem service value can generally only serve as the upper limit of ecological compensation, since it far exceeds the payment ability of ecosystem service consumers, and a conversion coefficient has been widely used to make ecological compensation based on the ecosystem service value more practical and acceptable [11,20]. Meanwhile, this study took into account only the non-market ecosystem service value, since the market value of ecosystem services can contribute to regional economic development through market mechanisms [11,34,35]. On the other hand, the more heavily the economic development in a certain area depends on natural resources, the higher the opportunity cost to protect the ecological environment in that area, which can be represented by the degree of priority for ecological compensation [32]. This study accordingly represents the degree of priority for ecological compensation in a certain area with the ratio of the non-market value of ecosystem services to GDP per unit of area, based on existing studies [8,32], and estimates it in a spatially explicit way in order to further improve the practicability of ecological compensation. The ecological compensation based on the ecosystem service value was finally estimated as follows:
R T esv _ i = E S V T _ i × k × p _ i
p _ i = 2 arctan ( E S V T _ i G T _ i ) / π
where RTesv_i is the ecological compensation value in the ith area based on the ecosystem service value; ESVT_i is the total non-market value of ecosystem services in the ith area per unit of area; k is the conversion coefficient of the ecosystem service value, which is set to 15% based on previous studies [32]; p_i is the degree of priority for ecological compensation of the ith area, and the higher p_i is, the more urgently the ecological compensation of the ith area is needed; GT_i is the total GDP per unit of area of the ith area, which is extracted from the Spatialized GDP Dataset of China provided by the Resource and Environmental Science and Data Center, CAS (https://www.resdc.cn/DOI/doi.aspx?DOIid=33, accessed on 31 October 2021); and π is pi.
This study further estimated the ecological compensation based on the opportunity cost of land use. Farmers in the study area play an important role in protecting the ecological environment, for which they sacrifice their economic development rights [24,27]. The loss of economic development due to ecological protection can be reflected in the opportunity cost, while the latter can be measured by the land rent per unit of area [36]. This study obtained the data on the land rent per unit of area of various land types in the study area by carrying out some field surveys and using querying websites (e.g., https://www.tuliu.com/, accessed on 20 October 2021). The total ecological compensation based on the opportunity cost was finally estimated as follows:
R T o c _ i = O C _ i × λ
where RToc_i is the ecological compensation value in the ith area based on the opportunity cost; OC_i is the opportunity cost of land use in the ith area based on the land rent, which is estimated based on the land rent price; and λ is the opportunity cost conversion coefficient, which is also set to 15% based on the results of field surveys and the ratio of the transaction price to the listing price on the websites (e.g., https://www.tuliu.com/, accessed on 20 October 2021).

3. Results

3.1. Dynamics of the Ecosystem Service Value

The results suggested that the total ecosystem service value in the Poverty Belt around Beijing and Tianjin showed an overall downward trend between 1980 and 2015 (Figure 2). Specifically, the total ecosystem service value declined most obviously between 1980 and 1990, and it recovered to a certain degree from 1990 to 1995, but thereafter showed a further gradual declining trend. In 2015, the total ecosystem service value of the study area reached CNY 53.912 billion, with a decrease of CNY 286 million compared to that in 1980. More specifically, the total ecosystem service value of forestland decreased by CNY 292 million, while that of the water body decreased by CNY 81 million, which was primarily due to the conversion of the forestland and water body with higher equivalent factors to cropland and grassland with lower equivalent factors. By contrast, the total ecosystem service value of cropland, garden plots, and grassland increased slightly between 1980 and 2015, with increases of CNY 29 million, 29 million, and 31 million, respectively.

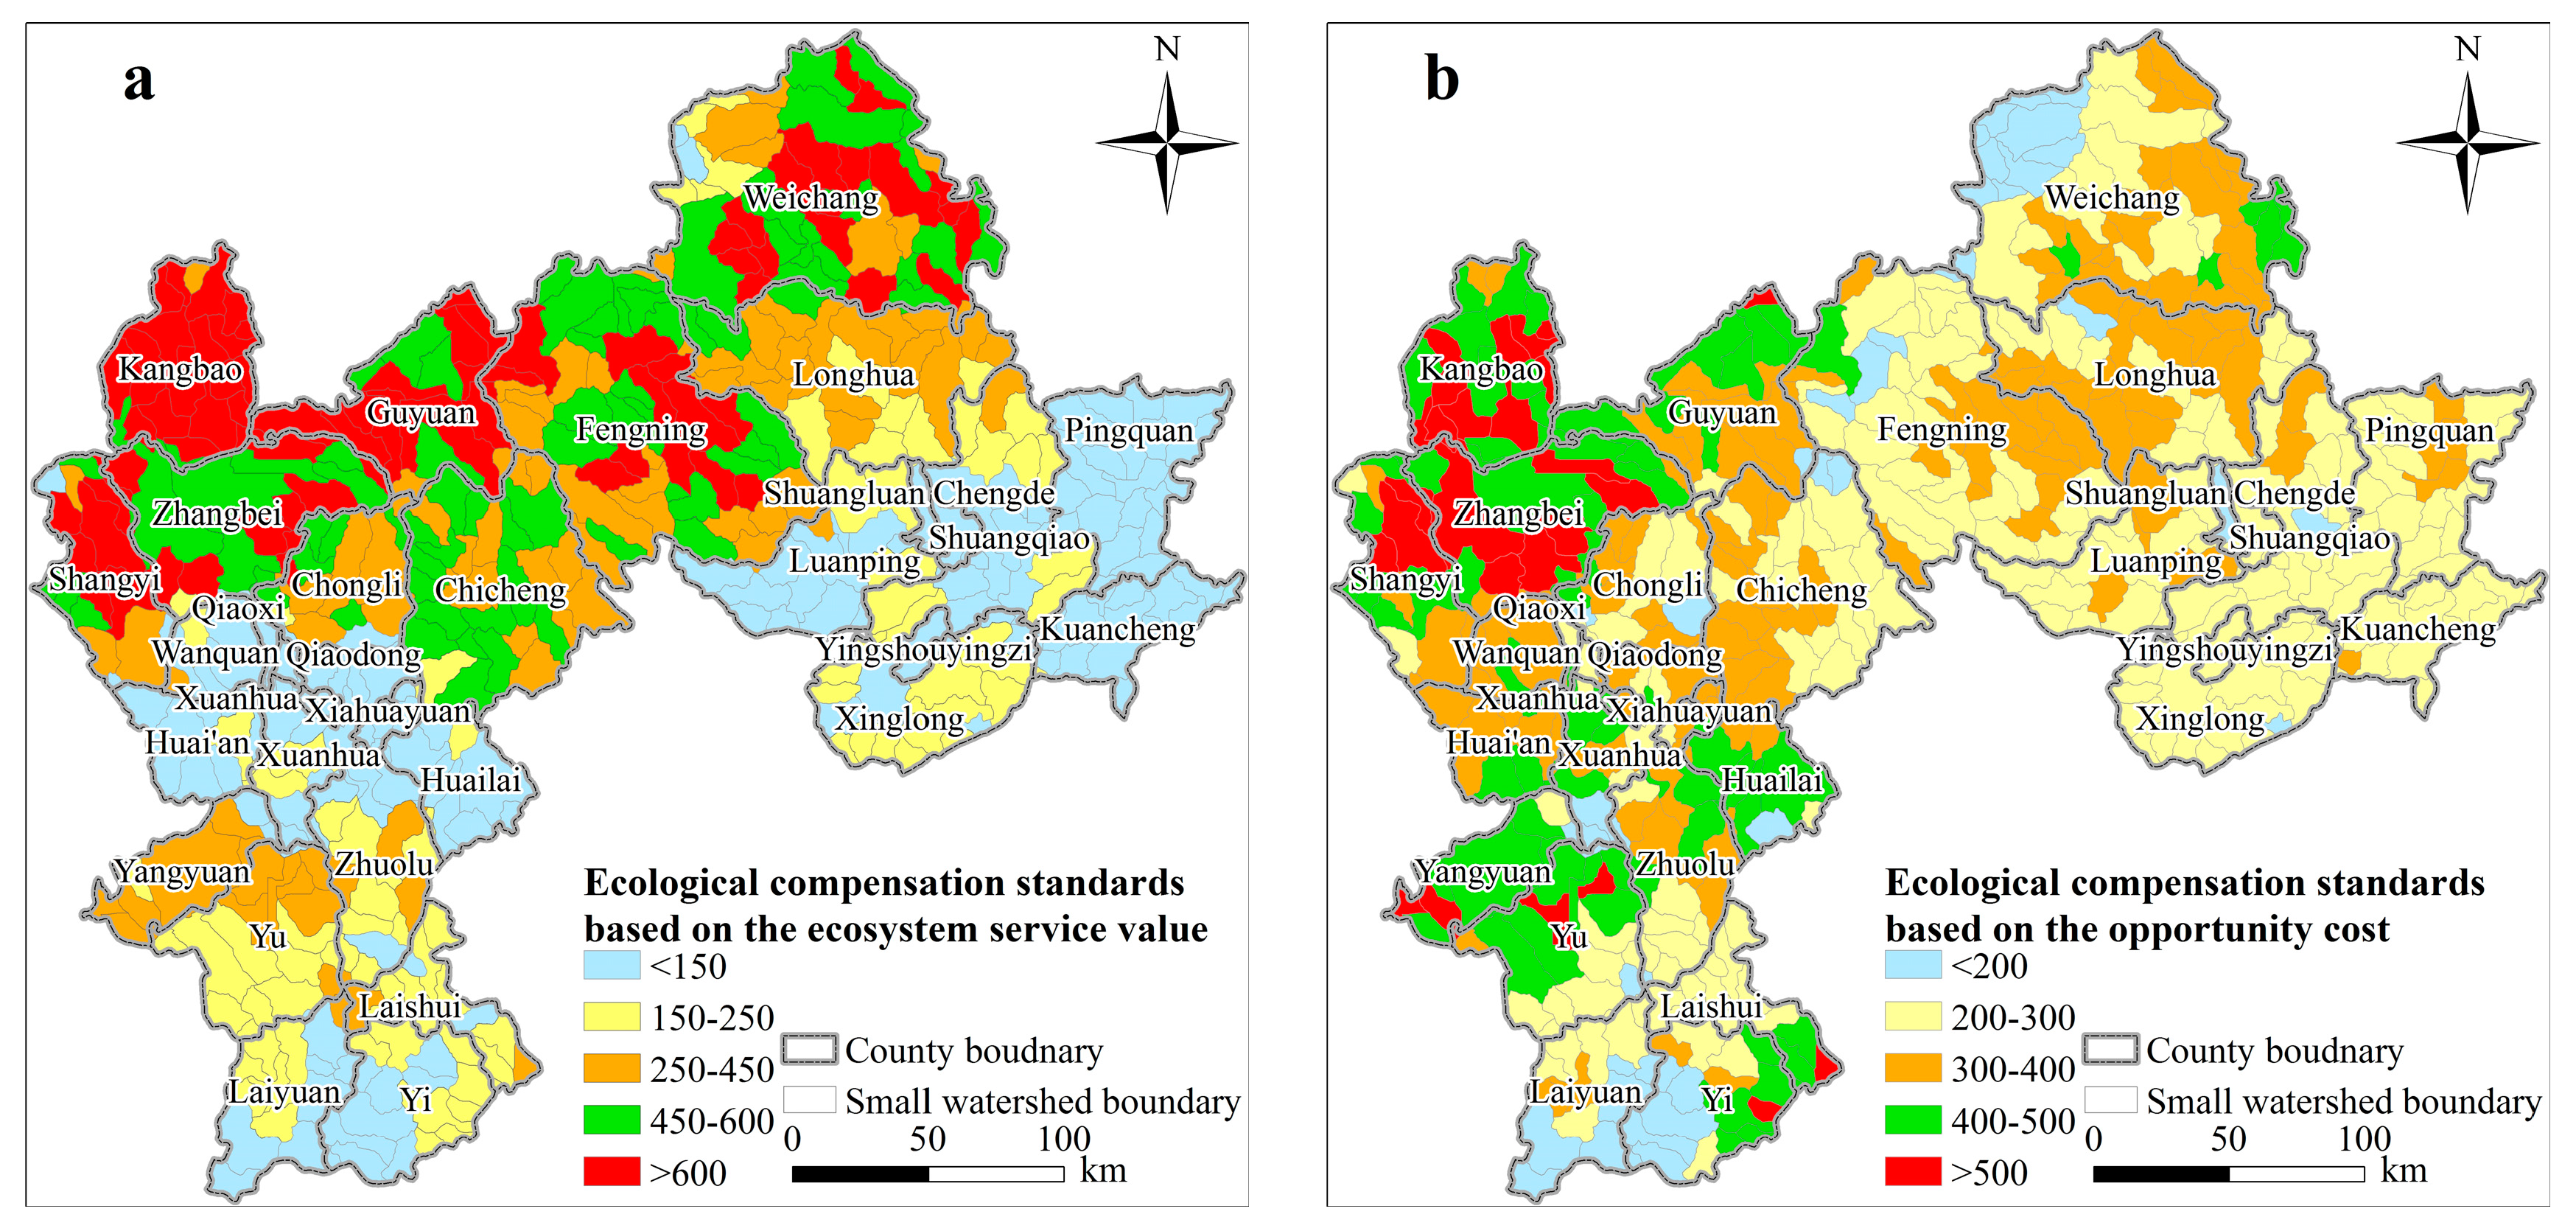
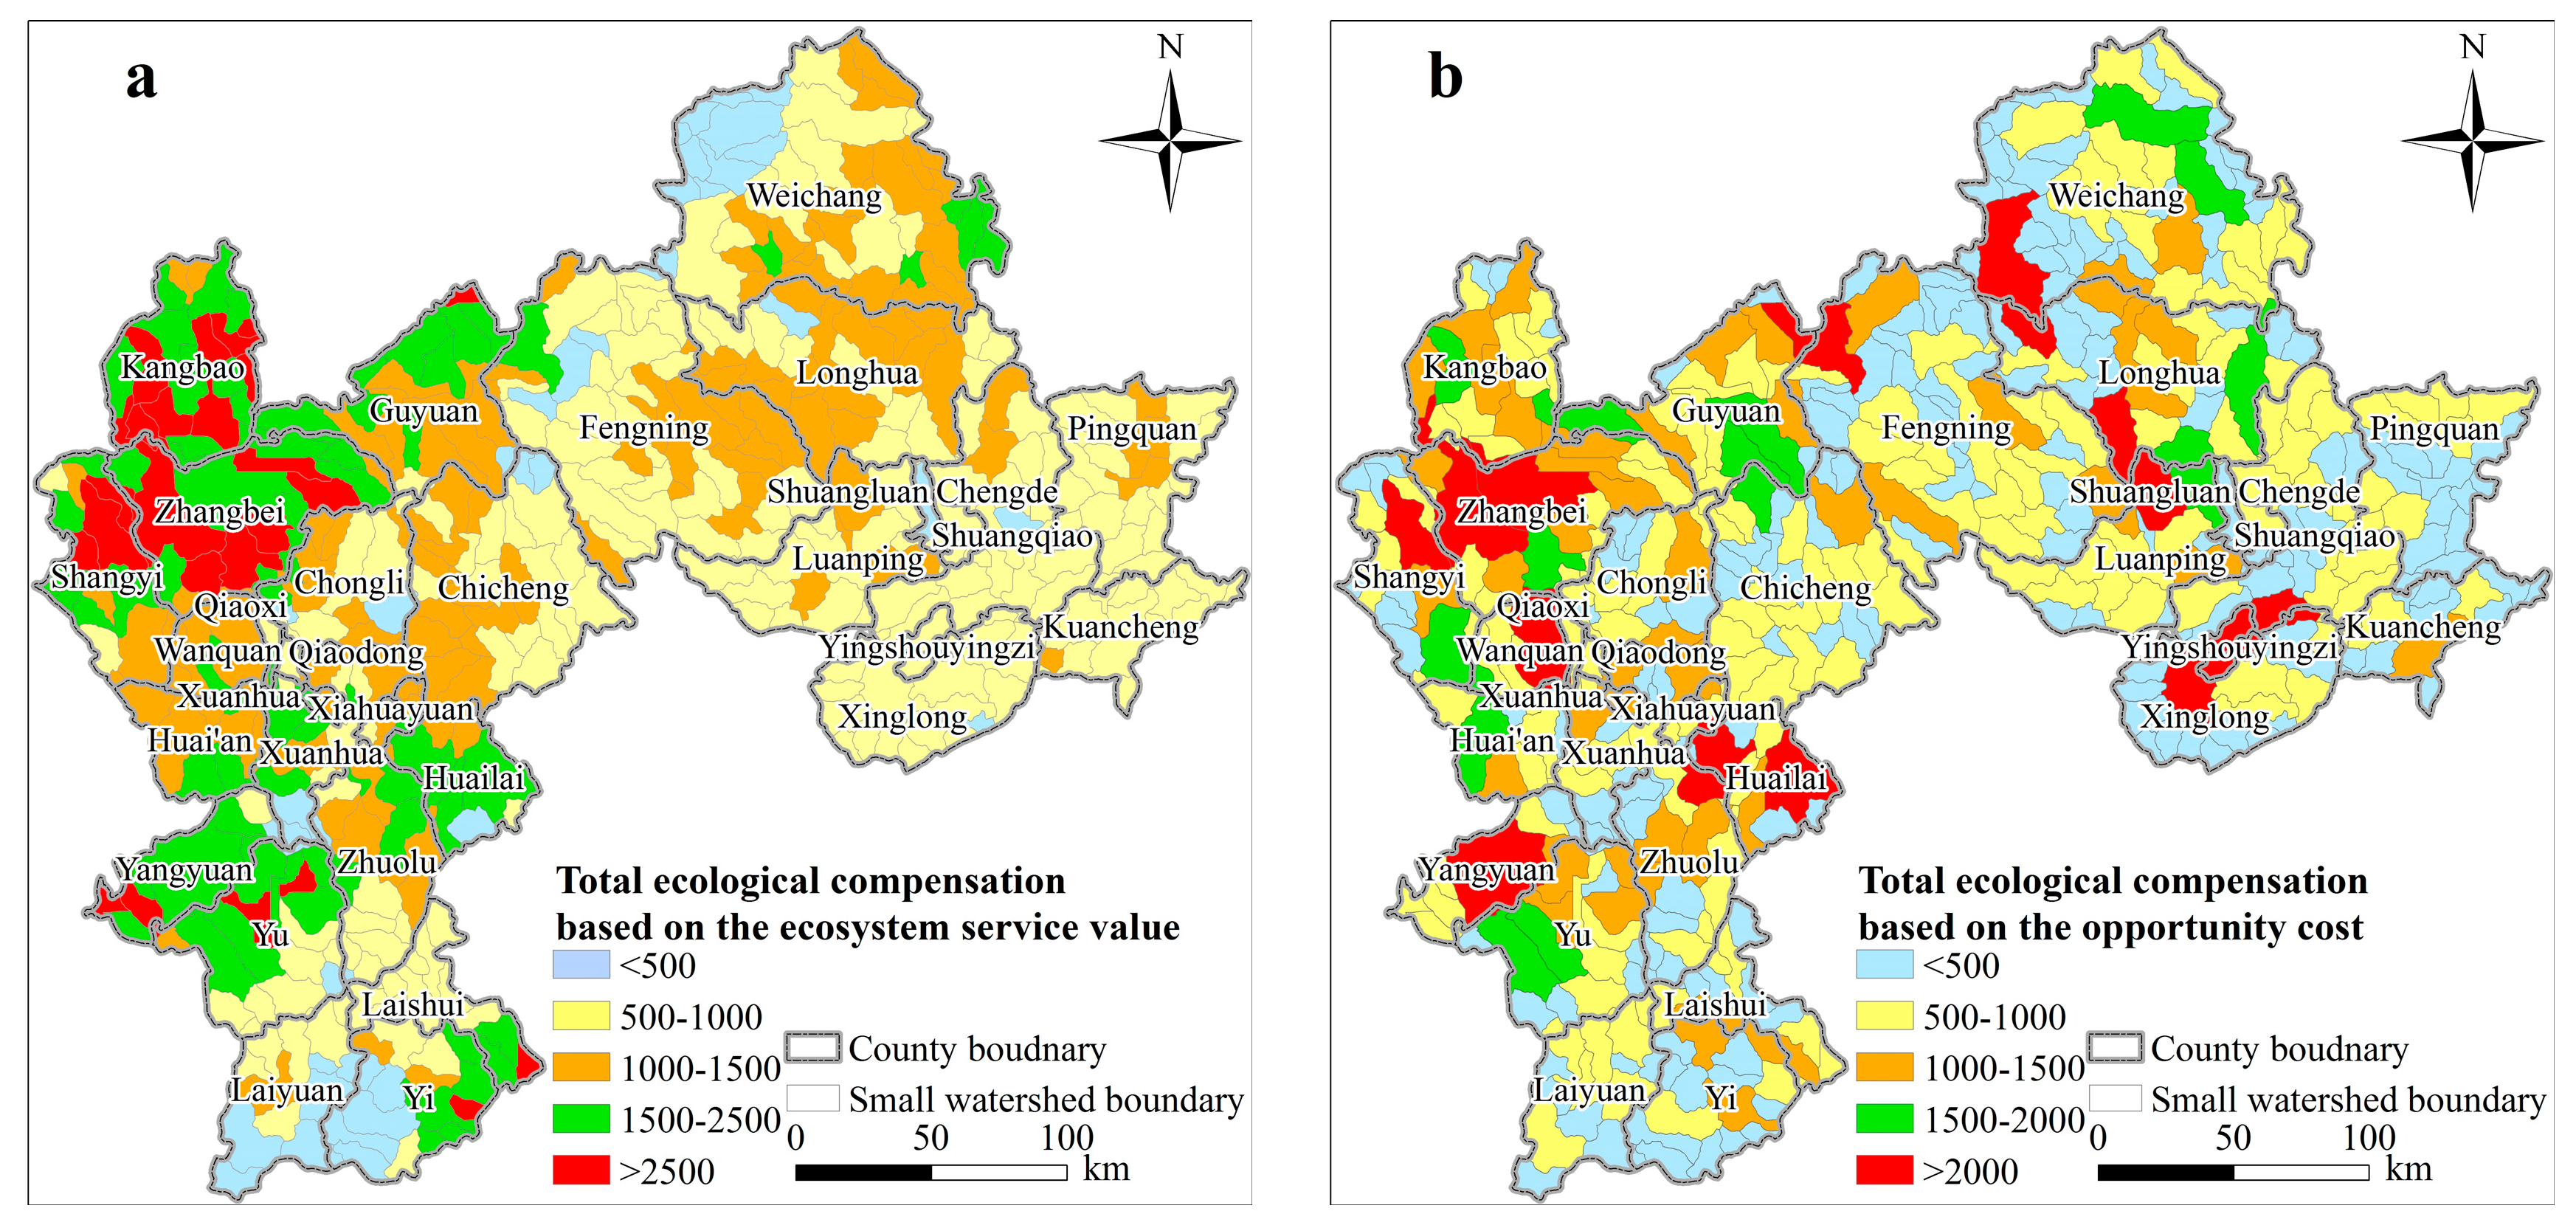
3.2. Spatial Heterogeneity of Ecological Compensation

The results suggested that the ecological compensation standards based on the ecosystem service value in the study area showed significant spatial heterogeneity, ranging from CNY 0.47/hm2 to CNY 910.73/hm2, with an average of about CNY ~341.75/hm2 (Figure 3). The areas with low ecological compensation standards are widespread in the southern, central, and northeastern parts of the study area; for example, areas with ecological compensation standards of CNY < 150/hm2 and CNY 150–250/hm2 are contiguously distributed in most parts of Laiyuan County, Yi County, and Laishui County in the southern part of the study area, and almost all of the northeastern part of the study area. By contrast, the areas with the ecological compensation standard of CNY > 600/hm2 are mainly located in the western and northern parts of the study area, e.g., most parts of Kangbao County, the northern part of Shangyi County, most parts of Guyuan County in Zhangjiakou City, and a few parts of Fengning County and Weichang County in Chengde City. The areas with the ecological compensation standard of CNY 450–600/hm2 are generally adjacent to these areas with the ecological compensation standard of CNY > 600/hm2, e.g., most parts of Zhangbei County, the southwest part of Shangyi County, the middle part of Guyuan County, and most parts of Weichang County. The level of economic development is generally very low in these areas with low ecological compensation standards, and the ecological compensation is overall attractive to most of the local farmers in these areas. For example, the statistical data suggest that the average rural per capita income from property in Zhangjiakou City was CNY 103 in 2010. Meanwhile the cropland area per capital in Zhangjiakou City was generally 0.2133–0.2667 hm2, and the ecological compensation of CNY 600/hm2 means that the income from ecological compensation is CNY 128~160 per capita, which can generally effectively motivate the local farmers to participate in ecological conservation.
The spatial pattern of ecological compensation standards based on the opportunity cost was overall consistent with that based on the ecosystem service value, with some remarkable differences in a few areas. For example, the ecological compensation standard based on the opportunity cost was generally CNY > 500/hm2 in Shangyi County, Zhangbei County, and Kangbao County in the northwest of the study area, while it was generally below CNY 400/hm2 in Weichang County and Fengning County in the northern part of the study area. By contrast, the areas with lower ecological compensation standards were concentrated in the southeastern and southern parts of the study area, where the ecological compensation standards were generally CNY 200–300/hm2 or below CNY 200/hm2. In general, the ecological compensation standards based on the ecosystem service value and opportunity cost were consistent overall, i.e., the areas with higher ecological compensation standards were mainly concentrated in the northwestern and northern parts of the study area, while areas with lower ecological compensation standards were mainly located in the southern and southeastern parts of the study area.
The results of this study showed that the total ecological compensation value based on the ecosystem service value and the opportunity cost in the whole study area was approximately CNY 2.83 billion and CNY 2.67 billion per year, respectively—very close to and overall consistent with the results of Xu et al. [37], i.e., CNY 3.45 billion per year. The total ecological compensation value based on the ecosystem service value on the small watershed scale ranged between CNY 2.40 thousand and 52.98 million per year, showing conspicuous spatial heterogeneity. Specifically, areas with a total ecological compensation value based on the ecosystem service value below CNY 5.00 million per year were continuously distributed in the southern, middle, and northeastern parts of the study area, where there is a relatively better ecological environment and a higher level of economic development, jointly resulting in a weak demand for ecological compensation (Figure 4). By contrast, areas with a total ecological compensation value exceeding CNY 5.00 million per year were mainly scattered in a few regions in the northern, northwestern, and central parts of the study area. More specifically, areas with a total ecological compensation value exceeding CNY 25.00 million per year were mainly located in Zhangbei County, Guyuan County, Fengning County, and Weichang County in the northwestern and northern parts of the study area, as well as in Chicheng County in the middle part of the study area. The level of economic development is very low in in these areas, where there are widespread key ecological function zones and, consequently, there is very strong demand for ecological compensation in these areas.
The spatial pattern of the total ecological compensation value based on the opportunity cost was generally consistent with that based on the ecosystem service value, but with significant differences in a few areas. For example, the total ecological compensation value based on the opportunity cost was generally consistent with that based on the ecosystem service value in the northern and northwestern parts of the study area, all exceeding CNY 20.00 million per year. However, there are also areas where the total ecological compensation value based on the opportunity cost exceeds CNY 20.00 million per year in Yangyuan County and Huailai County in the middle part of the study area, as well as in Longhua County, Luanping County, and Xinglong County in the southeastern part of the study area (Figure 4). This may be because there is more cropland with a higher opportunity cost but relatively lower ecosystem service value in these areas, leading to a higher total ecological compensation value based on the opportunity cost. In general, this study showed that the total ecological compensation value of the whole study area ranged between CNY 2.67 billion and 2.83 billion per year, and that there were generally consistent spatial patterns of the total ecological compensation value based on the ecosystem service value and the opportunity cost, indicating that the ecological compensation in this study is overall reliable.

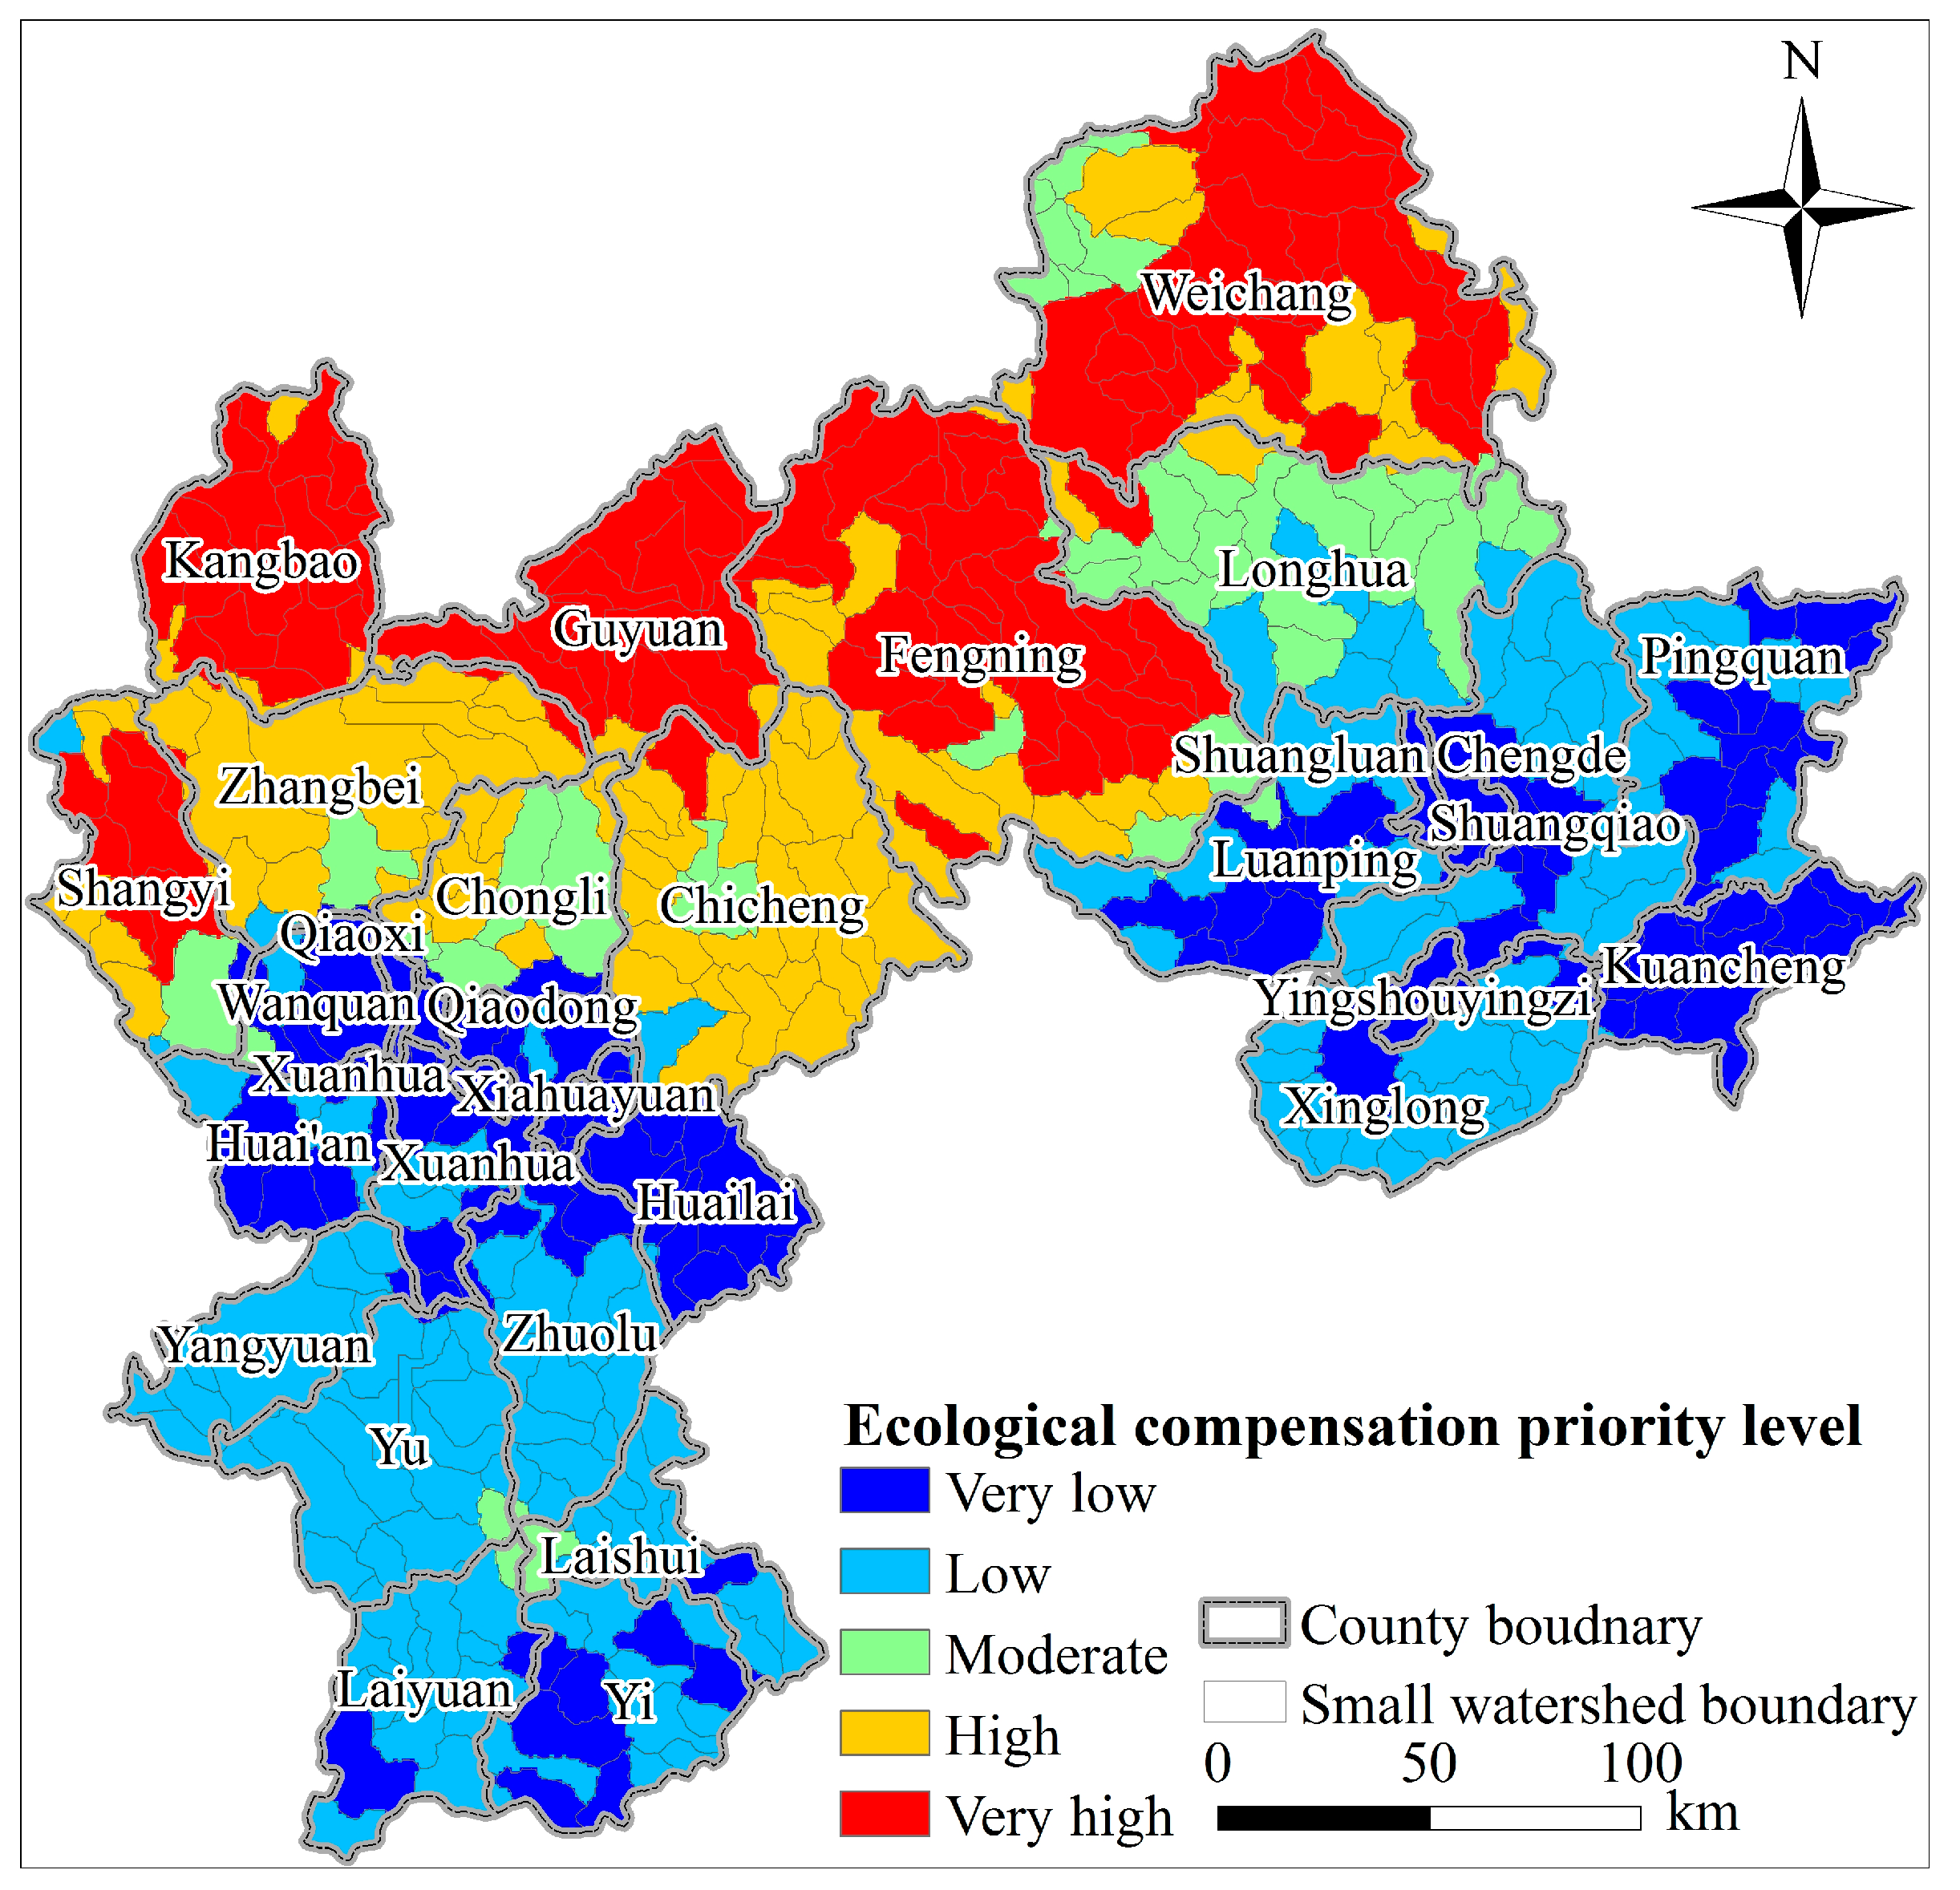
3.3. Spatial Pattern of the Ecological Compensation Priority

The results of this study showed that the ecological compensation priority in the study area ranged between 0.002593 and 0.6269, with an average value of 0.3165. This study further classified the ecological compensation priority into five levels using the Jenks natural break method, with the breakpoints of 0.1372, 0.2646, 0.3943, 0.4922, and 0.6269 (Figure 5). There was remarkable spatial heterogeneity of the ecological compensation priority in the study area, where areas with high or very high ecological compensation priority were concentrated in the Bashang region in the northern and northwestern parts of the study area (Figure 5). Specifically, areas with very high ecological compensation priority were concentrated in the northern part of the study area, e.g., most parts of Shangyi County, almost all of Kangbao County and Guyuan County, the central and northern parts of Fengning County, and most of Weichang County. Meanwhile, areas with high ecological compensation priority were concentrated in most parts of Zhangbei County and parts of adjacent Chongli County, most parts of Chicheng County and part of adjacent Fengning County, and a few parts of Shangyi County and Weichang County. There are widespread important ecological function zones with enormous ecosystem service value in these areas, all of which play an important role in guaranteeing the ecological safety of the Beijing–Tianjin–Hebei region by providing a number of essential ecosystem services, such as wind prevention and sand fixation, water conservation, and biodiversity protection. Meanwhile, these inland “ecological export” areas with a low level of economic development have paid a huge development opportunity cost for a long period in order to guarantee the ecological safety of the Beijing–Tianjin–Hebei region.
It is an arduous task to implement further ecological environmental protection by relying on the local resources in areas with high or very high ecological compensation priority, where there is an urgent need for the provision of ecological compensation by other areas [23]. On the one hand, there is generally a relatively higher level of economic development in areas with low or very low ecological compensation priority, which are generally located in the southern, central, and northeastern parts of the study area, e.g., Xuanhua District, Xuanhua County, and Huailai County in the southern part of Zhangjiakou City, and Kuancheng County and Luanping County in the southern part of Chengde City. These areas generally have a relatively greater ability to implement ecological conservation, with significant geographical advantages, and taking considerable advantage of the cheap agricultural and forestry products from those areas with high or very high ecological compensation priority. Nevertheless, these areas still need some external financial support in order to establish a more eco-friendly economic system, and cannot provide sufficient support for ecological conservation in areas with high or very high ecological compensation priority. On the other hand, some economically developed areas—e.g., Beijing City and Tianjin City—have taken enormous advantage of the ecosystem services from the study area and, therefore, should provide some ecological compensation in order to promote the ecological conservation of the study area [26,28,32]. For example, the areas with high or very high priority have provided a large amount of water resources to Beijing City and Tianjin City, while the areas with low or very low priority have also paid considerable opportunity costs of industrial development and agricultural production in order to ensure the supply of water resources to Beijing City and Tianjin City [24,27]. There is an urgent need for ecological compensation from Beijing City and Tianjin City, which can play an important role in ameliorating the standard of living in the study area and avoiding a more intensive manner of land use with serious biodiversity degradation [23,26,32]. Overall, there is an urgent need for more ecological compensation in the study area, especially in those areas with high or very high ecological compensation priority, which should be met with financial support from areas outside the study area.

4. Discussion

The results of this study can provide valuable spatially explicit reference information for the design and improvement of ecological compensation projects, but it is still necessary to carry out some more in-depth research. For example, this study clearly revealed the spatial heterogeneity of the ecological compensation in the study area using the small watershed scale rather than the county-level scale, which may contribute to formulating more specifically targeted policy measures and improving the feasibility of ecological compensation policies. However, this study estimated the ecosystem service value with some static parameter values, which cannot accurately reflect the time-series dynamics of the ecosystem service value. Moreover, this study considered the inflation factors, but still cannot accurately reflect the dynamic changes in the ecological compensation standard, since the latter was estimated based on the Spatialized GDP Dataset of China in 2010, which is a static dataset even though it can more accurately reveal the spatial heterogeneity of the ecological compensation. It is still necessary to reveal the time-series dynamics of the ecosystem service value and ecological compensation standards more accurately using more dynamic parameter values. Overall, this study accurately revealed the rational range of ecological compensation in the study area in a spatially explicit way, but it is still necessary to carry out further research in order to provide more reliable reference information for the design and improvement of ecological compensation projects.

5. Conclusions

This study revealed the rational range of the ecological compensation in the Poverty Belt around Beijing and Tianjin based on the ecosystem service value and the opportunity cost, in a spatially explicit manner. The following conclusions were finally drawn: (1) The total ecosystem service value in the study area showed an overall downward trend between 1980 and 2015, decreasing from CNY 54.198 billion in 1980 to CNY 53.912 billion in 2015. (2) The total ecological compensation value of the whole study area ranged between CNY 2.67 billion and 2.83 billion per year, and it is feasible to estimate the ecological compensation based on the ecosystem service value and the opportunity cost. (3) Areas with a higher ecological compensation value and priority level are mainly located in areas with lower levels of economic development in the northwestern and northern parts of the study area, while areas with a lower ecological compensation value and priority level are mainly located in areas with relatively high levels of economic development in the southern and southeastern parts of the study area, but both of these areas are in urgent need of ecological compensation from other areas, e.g., Beijing City and Tianjin City. (4) It is still necessary to carry out further research on the time-series dynamics of the ecological compensation in order to provide more reliable reference information for the design and improvement of ecological compensation projects. Overall, this study accurately reveals the rational range of the ecological compensation in the study area in a spatially explicit manner, and can provide valuable information for addressing land degradation along with the rapid urbanization in the Beijing–Tianjin–Hebei region.

Author Contributions

H.Y. (Haiming Yan) and W.L.: Investigation, data curation, writing—original draft preparation, writing—review and editing, funding acquisition; H.Y. (Huicai Yang) and X.G.: conceptualization, methodology, supervision, project administration; X.L. and W.J.: software, validation, visualization. All authors have read and agreed to the published version of the manuscript.

Funding

This study was funded by the Natural Science Foundation of Hebei Province (E2019403210, D2019403022, D2019403168, C2019403114), the Science and Technology Project of Hebei Education Department (BJ2019045), the National Natural Science Foundation of China (51909052, 41807169, 42001034, 42001027), the Scientific and Technological Innovation Team Project of Hebei GEO University in 2021 (KJCXTD-2021-10), and the College Students’ Innovative Entrepreneurial Training Plan Programs (202110077011, S202110077030, S202110077031).

Institutional Review Board Statement

Not applicable.

Informed Consent Statement

Not applicable.

Data Availability Statement

The data presented in this paper are available on request from the corresponding author.

Conflicts of Interest

The authors declare no conflict of interest.

References

  1. Fan, M.; Chen, L. Spatial characteristics of land uses and ecological compensations based on payment for ecosystem services model from 2000 to 2015 in Sichuan Province, China. Ecol. Inform. 2019, 50, 162–183. [Google Scholar] [CrossRef]
  2. Fang, Z.; Chen, J.; Liu, G.; Wang, H.; Alatalo, J.M.; Yang, Z.; Mu, E.; Bai, Y. Framework of basin eco-compensation standard valuation for cross-regional water supply—A case study in northern China. J. Clean. Prod. 2021, 279, 123630. [Google Scholar] [CrossRef]
  3. Salzman, J.; Bennett, G.; Carroll, N.; Goldstein, A.; Jenkins, M. The global status and trends of Payments for Ecosystem Services. Nat. Sustain. 2018, 1, 136–144. [Google Scholar] [CrossRef]
  4. Aguilar-Gómez, C.R.; Franco-Maass, S.; Arteaga-Reyes, T.T. Differentiated payments for environmental services schemes: A methodology proposal. J. Mt. Sci.-Engl. 2018, 15, 1693–1710. [Google Scholar] [CrossRef]
  5. Wang, P.; Yu, J.; Pozdniakov, S.P.; Grinevsky, S.O.; Liu, C. Shallow groundwater dynamics and its driving forces in extremely arid areas: A case study of the lower Heihe River in northwestern China. Hydrol. Process. 2014, 28, 1539–1553. [Google Scholar] [CrossRef]
  6. Schomers, S.; Matzdorf, B. Payments for ecosystem services: A review and comparison of developing and industrialized countries. Ecosyst. Serv. 2013, 6, 16–30. [Google Scholar] [CrossRef]
  7. Brathwaite, A.; Pascal, N.; Clua, E. When are payment for ecosystems services suitable for coral reef derived coastal protection?: A review of scientific requirements. Ecosyst. Serv. 2021, 49, 101261. [Google Scholar] [CrossRef]
  8. Liu, P.; Li, W.; Yu, Y.; Tang, R.; Guo, X.; Wang, B.; Yang, B.; Zhang, L. How much will cash forest encroachment in rainforests cost? A case from valuation to payment for ecosystem services in China. Ecosyst. Serv. 2019, 38, 100949. [Google Scholar] [CrossRef]
  9. Li, H.; Cai, Y.; Zhang, Y.; Liu, Y.; Zhang, K.; Yang, X. Impact of a cross-jurisdictional Payment for Ecosystem Services program on the participants’ welfare in North China. J. Clean. Prod. 2018, 189, 454–463. [Google Scholar] [CrossRef]
  10. Qin, Y.; Yang, Z.; Yang, W. Valuation of the loss of plant-related ecosystem services caused by water stress in the wetland of China’s Yellow River Delta. Acta Ecol. Sin. 2014, 34, 98–105. [Google Scholar] [CrossRef]
  11. Pan, X.L.; Xu, L.Y.; Yang, Z.F.; Yu, B. Payments for ecosystem services in China: Policy, practice, and progress. J. Clean. Prod. 2017, 158, 200–208. [Google Scholar] [CrossRef]
  12. Liu, C.; Liu, W.; Lu, D.; Chen, M.; Xu, M. A study of provincial differences in China’s eco-compensation framework. J. Geogr. Sci. 2017, 27, 240–256. [Google Scholar] [CrossRef] [Green Version]
  13. Fletcher, R.; Büscher, B. The PES conceit: Revisiting the relationship between payments for environmental services and neoliberal conservation. Ecol. Econ. 2017, 132, 224–231. [Google Scholar] [CrossRef]
  14. Le Velly, G.; Dutilly, C. Evaluating payments for environmental services: Methodological challenges. PLoS ONE 2016, 11, e0149374. [Google Scholar] [CrossRef] [PubMed] [Green Version]
  15. Bennett, D.E.; Gosnell, H. Integrating multiple perspectives on payments for ecosystem services through a social–ecological systems framework. Ecol. Econ. 2015, 116, 172–181. [Google Scholar] [CrossRef]
  16. Li, X.; Miao, H.; Zheng, H.; Ouyang, Z. Main methods for setting ecological compensation standard and their application. Acta Ecol. Sin. 2009, 29, 4431–4440. [Google Scholar]
  17. Ezzine-de-Blas, D.; Wunder, S.; Ruiz-Pérez, M.; Moreno-Sanchez, R.D.P. Global patterns in the implementation of payments for environmental services. PLoS ONE 2016, 11, e0149847. [Google Scholar] [CrossRef] [Green Version]
  18. Porras, I.T.; Grieg-Gran, M.; Neves, N. All that Glitters: A Review of Payments for Watershed Services in Developing Countries; IIED: London, UK, 2008; pp. 57–58. [Google Scholar]
  19. Obeng, E.A.; Aguilar, F.X. Value orientation and payment for ecosystem services: Perceived detrimental consequences lead to willingness-to-pay for ecosystem services. J. Environ. Manag. 2018, 206, 458–471. [Google Scholar] [CrossRef] [PubMed]
  20. Lin, Y.; Guo, Z.; Zheng, Y.; Zhang, L.; Huang, H. Net horizontal payments for ecosystem services: An application in the Beijing-Tianjin-Hebei Region of China. J. Resour. Ecol. 2019, 10, 63–68. [Google Scholar]
  21. Dong, X.; LIu, P. Impacts study of GEE-based land use changes on Ecosystem Service Value (ESV): Take the Beijing-Tianjin-Hebei as an example. J. Cent. China Norm. Univ. (Nat. Sci.) 2020, 54, 670–678. [Google Scholar]
  22. Kong, W.; Ren, L.; Zhi, D.; Wang, S. Regional ecological compensation mechanism research under the background of Beijing-Tianjin-Hebei synergistic development—An ecological assets perspective. Resour. Dev. Market 2019, 35, 57–61. [Google Scholar]
  23. Zhang, Y.; Lu, X.; Liu, B.; Wu, D. Impacts of urbanization and associated factors on ecosystem services in the Beijing-Tianjin-Hebei Urban Agglomeration, China: Implications for land use policy. Sustainability 2018, 10, 4334. [Google Scholar] [CrossRef] [Green Version]
  24. Zhang, Y. Research on Integrated Optimization of Water Resources in Beijing-Tianjin-Hebei Based on System Dynamics; Hebei University of Engineering: Tianjin, China, 2018. [Google Scholar]
  25. Lu, Z.; Wei, Y.; Xiao, H.; Zou, S.; Ren, J.; Lyle, C. Trade-offs between midstream agricultural production and downstream ecological sustainability in the Heihe River basin in the past half century. Agric. Water Manag. 2015, 152, 233–242. [Google Scholar] [CrossRef]
  26. Lin, Y.; Dong, Z.; Zhang, W.; Zhang, H. Estimating inter-regional payments for ecosystem services: Taking China’s Beijing-Tianjin-Hebei region as an example. Ecol. Econ. 2020, 168, 106514. [Google Scholar] [CrossRef]
  27. Li, H.; Wang, N.; Yuan, Y. Dynamic evaluation of coordinated development of the forest resources-economy-environment system in the Beijing-Tianjin-Hebei region. Stat. Decis. 2019, 35, 106–109. [Google Scholar]
  28. Jiang, H.; Lu, Y.; Cheng, X.; Yu, S. Analysis of assets and debts of ecosystems in Beijing-Tianjin-Hebei Region. Chin. J. Environ. Manag. 2016, 8, 45–49. [Google Scholar]
  29. Havinga, I.; Hein, L.; Vega-Araya, M.; Languillaume, A. Spatial quantification to examine the effectiveness of payments for ecosystem services: A case study of Costa Rica’s Pago de Servicios Ambientales. Ecol. Indic. 2020, 108, 105766. [Google Scholar] [CrossRef]
  30. Smith, G.; Day, B.; Binner, A. Multiple-purchaser payments for ecosystem services: An exploration using spatial simulation modelling. Environ. Resour. Econ. 2019, 74, 421–447. [Google Scholar] [CrossRef] [Green Version]
  31. Sutton, P.C.; Costanza, R. Global estimates of market and non-market values derived from nighttime satellite imagery, land cover, and ecosystem service valuation. Ecol. Econ. 2002, 41, 509–527. [Google Scholar] [CrossRef]
  32. Guo, N.D.; Li, H.Z.; Li, C.; Chen, Z.Y.; Xu, H. Regional ecological compensation based on ecosystem service value in the area surrounding Beijing and Tianjin. Chin. J. Eco-Agr. 2015, 23, 1473–1480. [Google Scholar]
  33. Xie, G.; Zhang, C.; Zhang, L.; Chen, W.; Li, S. Improvement of the evaluation method for ecosystem service value based on per unit area. J. Nat. Resour. 2015, 30, 1243–1254. [Google Scholar]
  34. Zimmerman, E.K.; Tyndall, J.C.; Schulte, L.A. Using spatially targeted conservation to evaluate nitrogen reduction and economic opportunities for best management practice placement in agricultural landscapes. Environ. Manag. 2019, 64, 313–328. [Google Scholar] [CrossRef] [PubMed]
  35. Kandziora, M.; Burkhard, B.; Müller, F. Interactions of ecosystem properties, ecosystem integrity and ecosystem service indicators—A theoretical matrix exercise. Ecol. Indic. 2013, 28, 54–78. [Google Scholar] [CrossRef]
  36. Geng, X.; Ge, Y.; Zhang, H. Study on ecological compensation standard of watershed based on reset cost. China Popul. Resour. Environ. 2018, 28, 140–147. [Google Scholar]
  37. Xu, L.L.; Li, B.L.; Yuan, Y.C.; Gao, X.Z.; Zhang, T. A study on eco-compensation based on eco-service assessment in 14 contiguous destitute areas of China. J. Geo.-Inf. Sci. 2016, 18, 286–297. [Google Scholar]
Figure 1. Location of the Poverty Belt around Beijing and Tianjin.
Land 10 01383 g001
Figure 2. The total ecosystem service value in the Poverty Belt around Beijing and Tianjin from 1980 to 2015 (unit: CNY 100 million).
Land 10 01383 g002
Figure 3. Ecological compensation standards based on the (a) ecosystem service value and (b) opportunity cost in the study area.
Land 10 01383 g003
Figure 4. The total ecological compensation value based on the (a) ecosystem service value and (b) opportunity cost on the small watershed scale in the study area (unit: CNY 10,000).
Land 10 01383 g004
Figure 5. Ecological compensation priority levels in the Poverty Belt around Beijing and Tianjin.
Land 10 01383 g005
Table 1. Classification of the ecosystem service value in the Poverty Belt around Beijing and Tianjin.
Value TypesEcosystem Service TypesEcosystem TypesLand Use Types
Market valueProduction of food, forest products, raw material, fishery products, tourismCropland ecosystem,
forest ecosystem, wetland ecosystem
Cropland, garden plot, forestland, water body
Non-market valueGas regulation,
climate regulation,
water conservation,
soil formation and conservation,
waste disposal,
biodiversity protection,
entertainment and culture
Forest ecosystem, grassland ecosystem, wetland ecosystem, other ecosystemsForestland, grassland, water body, unused land
Table 2. Coefficients of ecosystem service value per unit of land area in the Poverty Belt around Beijing and Tianjin, based on previous studies [19,31,32] (unit: CNY/hm2).
Ecosystem Service TypesCroplandForestlandGarden
Plot
GrasslandWater BodyUnused Land
Gas regulation501.581438.97970.27328.910.000.00
Climate regulation892.161110.061001.11370.02189.120.00
Water conservation600.261315.63957.93328.918378.1112.34
Soil formation and conservation1463.631603.411533.52801.714.118.23
Waste disposal1644.53538.581091.56538.587474.394.11
Biodiversity protection711.261340.291025.78448.141023.72139.78
Food production1003.1641.11522.14123.3441.114.11
Raw material production98.671068.95583.8020.554.110.00
Entertainment and culture8.23526.25267.2316.441784.314.11
Total6923.488983.257953.342976.6018,898.98172.68
Publisher’s Note: MDPI stays neutral with regard to jurisdictional claims in published maps and institutional affiliations.

