
The Effects of a Megafire on Ecosystem Services and the Pace of Landscape Recovery


1
Department of Geography, University of Concepcion, Concepción 4070386, Chile
2
Center for Sustainable Urban Development (CEDEUS), University of Concepcion, Concepción 4070386, Chile
*
Author to whom correspondence should be addressed.
Land 2021, 10(12), 1388; https://0-doi-org.brum.beds.ac.uk/10.3390/land10121388
Submission received: 12 October 2021
/
Revised: 17 November 2021
/
Accepted: 2 December 2021
/
Published: 15 December 2021
Abstract
:(1) Background: Megafires have affected several regions in the world (e.g., Australia, California), including, in 2017, the central and south-central zones of Chile. These areas represent real laboratories to monitor the impacts on the sustainability of landscapes and their recovery after fires. The present research examines the modification of dynamics and the provision of ecosystem services by a megafire in a Mediterranean landscape in central Chile, combining remote sensing technologies and ecosystem service assessments. (2) Methods: Land cover and spectral indices (NBRI, BAIS-2, NDVI, and EVI) were measured using Sentinel-2 imagery, while the provision of ecosystem services was evaluated using an expert-based matrix. (3) Results: The megafire affected forest plantations, formerly the dominant land cover, as well as other ecosystems, e.g., native forests. After five years, the landscape is dominated by exotic shrublands and grasslands. (4) Conclusions: The megafire caused a loss of 50% of the landscape’s capacity to supply ecosystem services. Given that native forests are the best provider of ecosystem services in this landscape, restoration is a key to recovering landscape sustainability.
1. Introduction
Disturbance regimes have repercussions on landscape sustainability, placing pressure on the landscape’s capacity for resilience. These repercussions can be monitored through changes in the landscape structure and the ecosystem services provided [1,2,3,4,5,6,7].
Large wildfires (>10,000 ha) and megafires (>40,000 ha) can be considered environmental disasters [8]. Although fires can benefit ecosystems, they represent problems when they increase in frequency and duration, expand over large areas, or are of high intensity and highly destructive [9]. Rural landscapes are directly affected by these fires, but they can also affect urban populations due to the growing wildland-urban interface [9,10,11,12,13].
Megafires do not only cause direct damage in terms of human lives and/or economic losses. They can affect the ecology of water and soil, alter the carbon and nutrient cycles, and modify, in the short and medium term, the local climate and many ecosystem processes [14]. They can also affect landscape sustainability, understood as the capacity of the landscape to consistently provide essential ecosystem services for people, despite socio-environmental changes [15]. Megafires can severely modify the landscape, consequently decreasing the provision of the services [16,17,18]. Methodologically, the monitoring of land-cover change can provide information at the landscape scale, as well as on natural and anthropic ecosystems, functions, and ecosystem services [19,20,21].
Forest Fires in Chilean Mediterranean Landscapes
Fire is an integral component of Mediterranean landscapes, since the Miocene (23 Ma at least). People have used fires for centuries in the Mediterranean region to open space to farmland and grazing land, giving rise to heterogeneous and diverse landscapes. However, since the end of the 20th century, climate change and meteorological conditions have brought an increase in fires, interacting with homogenizing land use changes and the expansion of pyrophytic vegetation. Combined, these elements have modified fire regimes, resulting in an increased frequency and magnitude of fires, which poses a threat to landscape sustainability and resilience [4,15,16,22].
In the Mediterranean area of Chile (32.5 to 39.5° S), the occurrence of large wildfires and megafires has increased in recent years, especially in extensive, exotic forest plantations of pyrophytic species and increased migration and rural abandonment [2,5,17,23].
At the beginning of 2017, megafires affected south-central Chile, burning forest plantations, native forests, open bushes, and even human settlements. Over 287,000 of the 530,000 hectares affected at the macro-regional level were within the Maule administrative region [16]. The mountainous coastal sector was the most affected, in part due to its fragmented landscape and the massive extension of forest plantations. The largest wildfire in this area was called “Las Máquinas” megafire, after the name of the site where it started. It affected an area of 184,000 ha [24].
Within a watershed, fires can interrupt a wide range of ecosystem services, both related to water [9], as well as carbon storage and ecosystem services associated with plant species, especially native and endemic species [25].
This work aimed to monitor how the spatial dynamics and the provision of ecosystem services were modified by a megafire in a Mediterranean landscape in central Chile. Along with this, it sought to assess the degree of recovery four years after the fire. The Estero Empedrado watershed was selected to analyze the landscape transformation that occurred in 2017. The spatial configuration of the pre-fire (2016–2017) and post-fire (2017–2021) landscape was analyzed, along with the provision of multiple ecosystem services over time.
2. Materials and Methods
2.1. Study Area
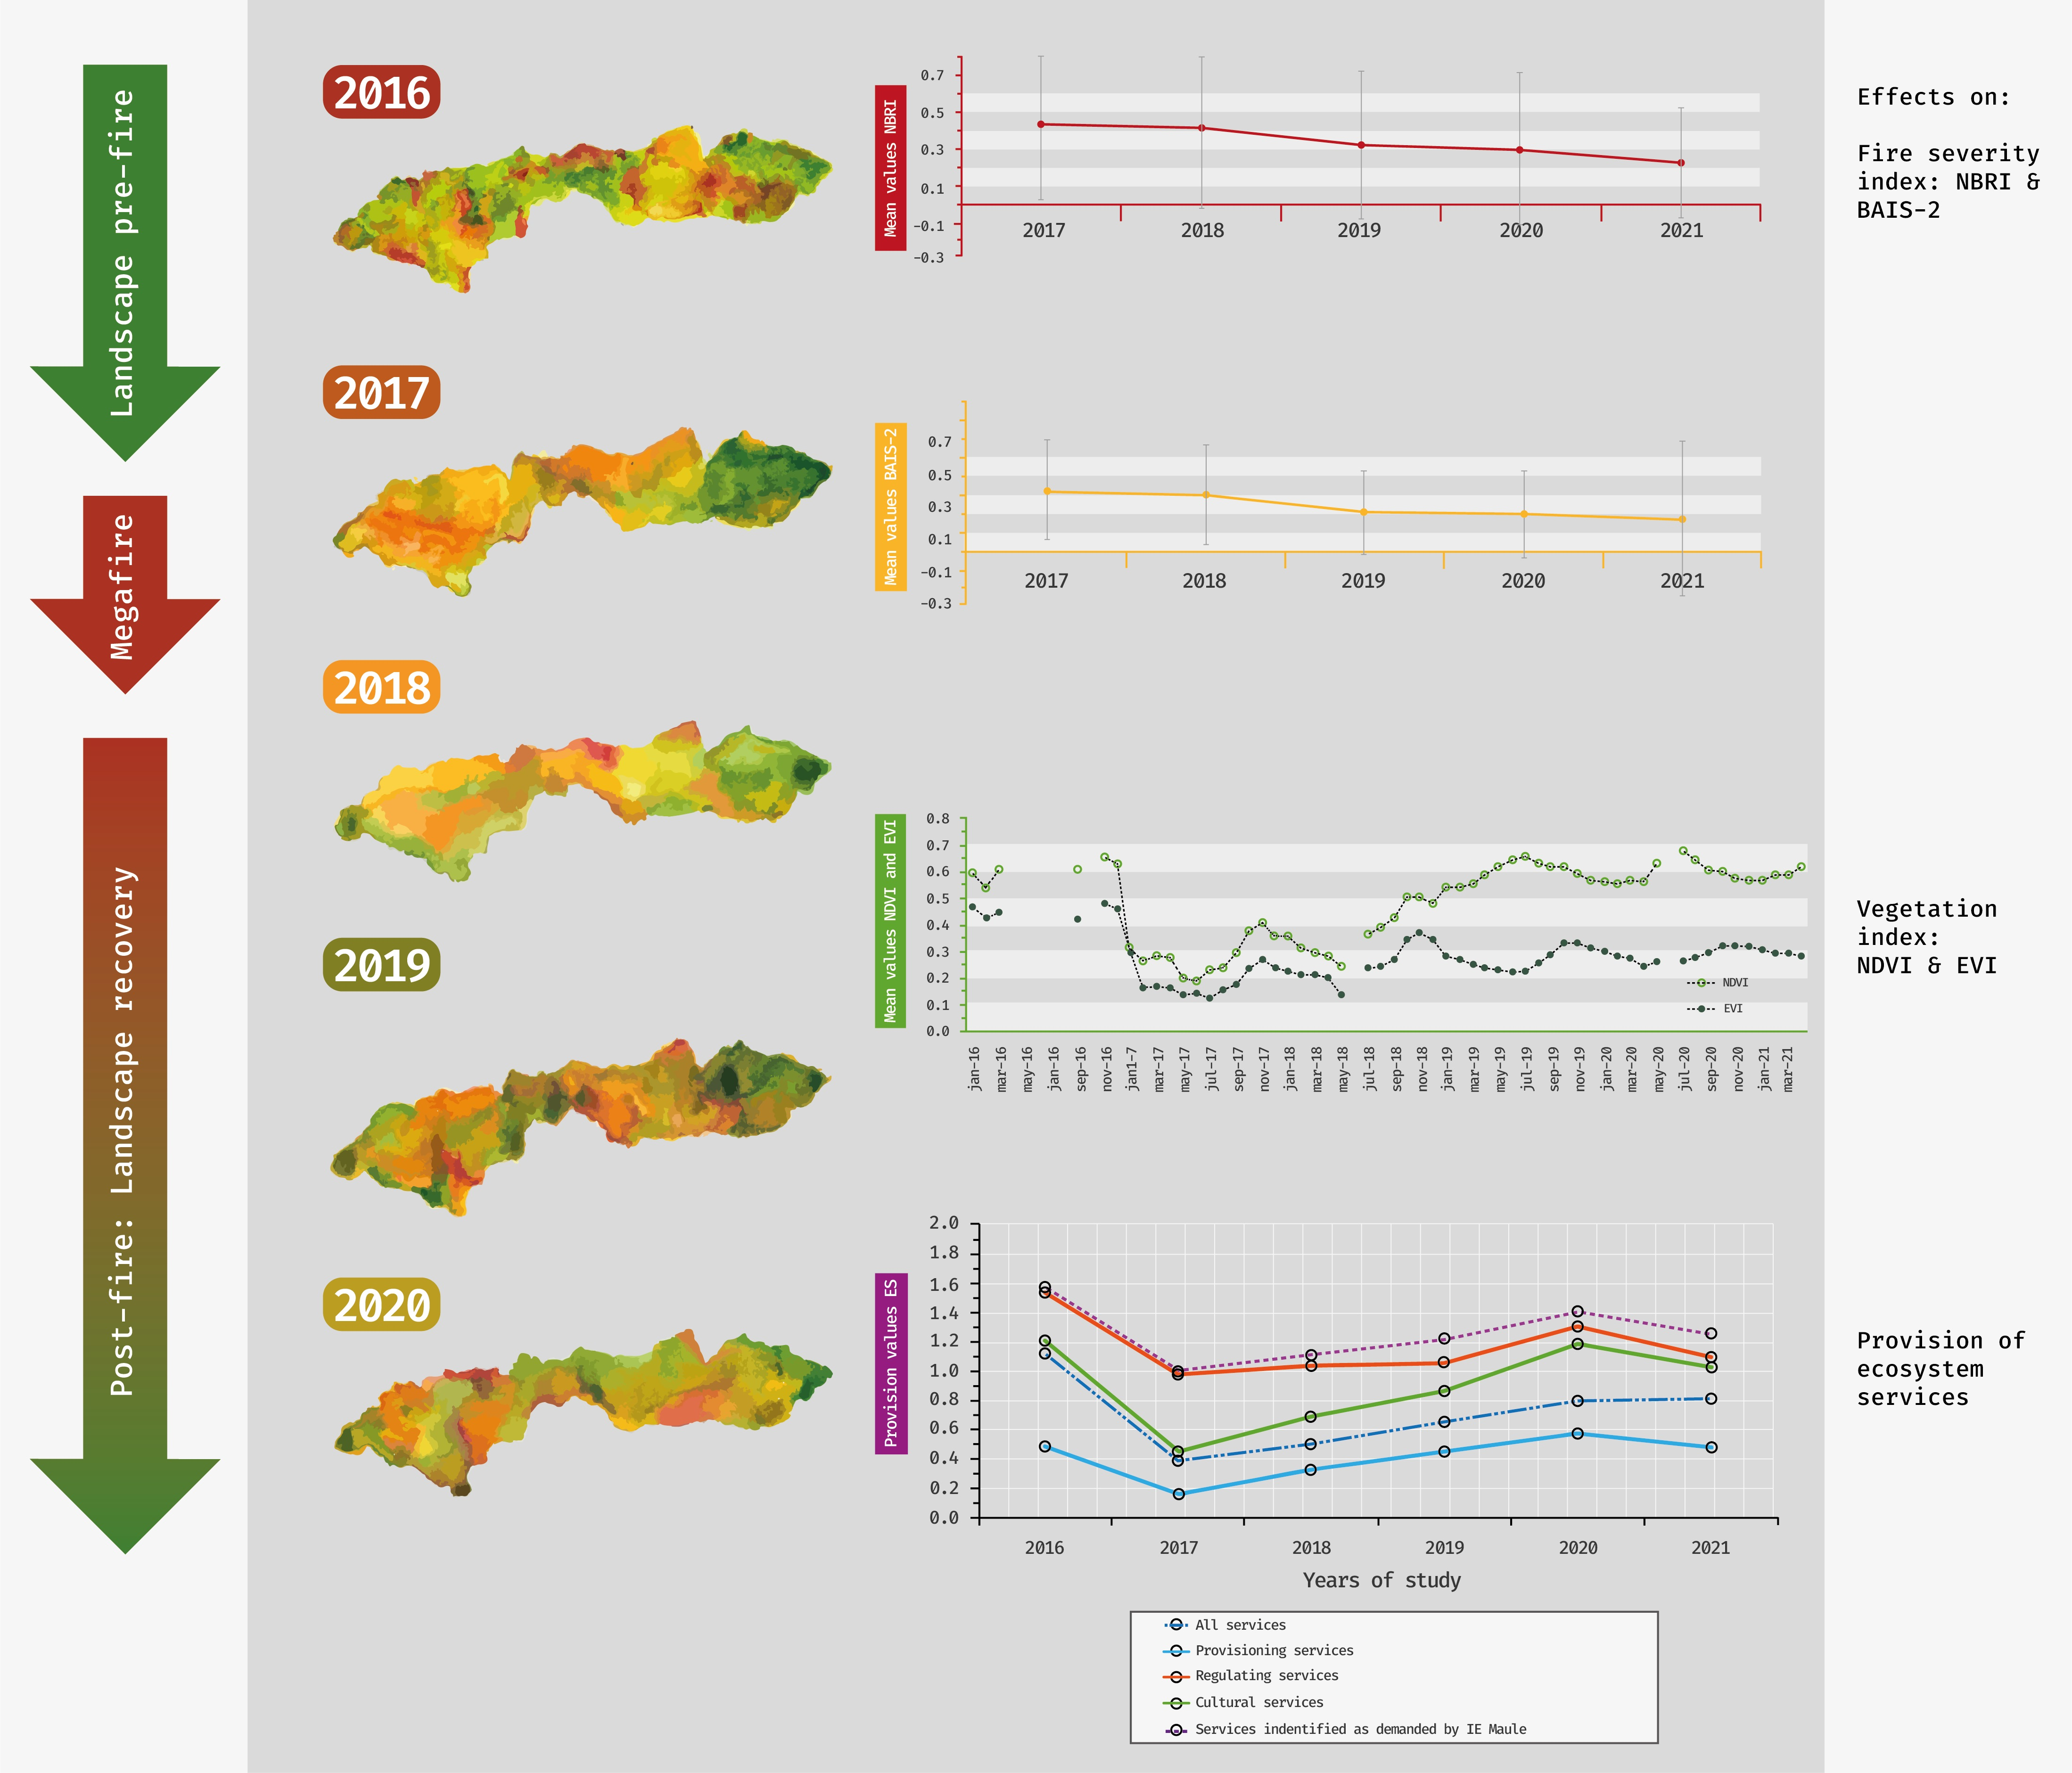
The Estero Empedrado watershed (4600 ha) is eminently rural and was severely affected by fire in 2017. The watershed is located in the Maule Region within the Empedrado Municipality (Figure 1), which has an area of 56,500 ha and 4200 inhabitants, principally in the town of Empedrado. Before the megafire, the land was dominated mostly by coniferous tree plantations, in addition to native forest and shrublands, among other land covers. Native Mediterranean ecosystems in Chile are dominated by sclerophyllous trees and shrubs along with thorny or succulent shrubs [26]. The 2017 fire affected the entire watershed, with the exception of the highest part and the town of Empedrado. The climate of the area is Mediterranean (Csb; temperate climate with a dry season in summer and mild thermal conditions), according to the Köppen–Geiger classification modified by Sarricolea et al. [27].
2.2. Computing the Structure and Transformation of the Landscape
We used four spectral indices (NBRI, BAIS-2, NDVI and EVI; Table 1) and classified land cover with Sentinel-2 imagery. These images have been freely available since 2015, have a global reach and a spatial resolution of 10 m for the visible (bands 2–4) and near infrared (band 5) bands, 20 m for the red edge (bands 5–7, band 8A) and short-wave infrared (bands 11–12) bands, and 60 m for the bands on atmospheric conditions useful for corrections (bands 1, 9, and 10). In total, there are 13 bands that have a spectral resolution between 0.43 and 2.28 microns. NBRI and BAIS-2 were calculated to address two basic concepts (intensity and severity) that are commonly applied in studies on wildfires, to detect the vegetation response and the possibilities of recovery after a fire [26]. On the other hand, NDVI and EVI were used to monitor the trend in the recovery of vegetation using the Mann–Kendall test.
The spectral indices were calculated in Google Earth Engine (GEE) for the years 2016–2021, using Sentinel-2 images. For each year, two evaluations were considered representing the months of maximum and minimum vegetative vigor, using the methodology proposed by [28]. Thus, images from the months of February and March (driest month +2) and August and September (rainiest month +2) were processed. An average of both months was used, filtering the studied collection based on a maximum 20% cloud cover.
The continuous variables representing the spectral indices described above were complemented and compared with discrete variables represented by land cover classifications. Supervised classifications were performed in GEE using Sentinel-2 bands (2-3-4-8-8A-11-12) and the NBRI, NDVI, and EVI indices. The classifier used was Random Forest. To perform the classifications, images from February–March were used to avoid sporadic vegetation and a maximum percentage of 20% in cloud cover. A minimum of 50 control points were used for each land cover. Conceptually, each land cover represented a type of ecosystem and thus the area of each ecosystem and its spatialization were obtained (Table 2).
Validation of the classification was carried out on the GEE platform, reserving 30% of the points of interest for the accuracy analysis, calculating the confusion matrix and Kappa index. Both the calculated indices and the land cover are presented in maps and graphs.
2.3. Assessment of the Effects of Landscape Change on the Provision of Ecosystem Services
The provision of ecosystem services was estimated by adapting a matrix based on expert opinion prepared by Echeverría et al. [32] for the same region as the study area. The adaptation considered specificities of the study area and the analyzed coverage, subjecting it to a revalidation by five highly experienced researchers in the evaluation of ecosystem services and in the characteristics of the ecosystems of the study area.
The matrix is composed of values (or scores) attributed by experts to the capacity of each ecosystem to provide each service. It uses a range from 0 to 5 that follows the proposal of Burkhard et al. [33,34], where 0 means no capacity for provision and 5 is the highest capacity for the provision of ecosystem services.
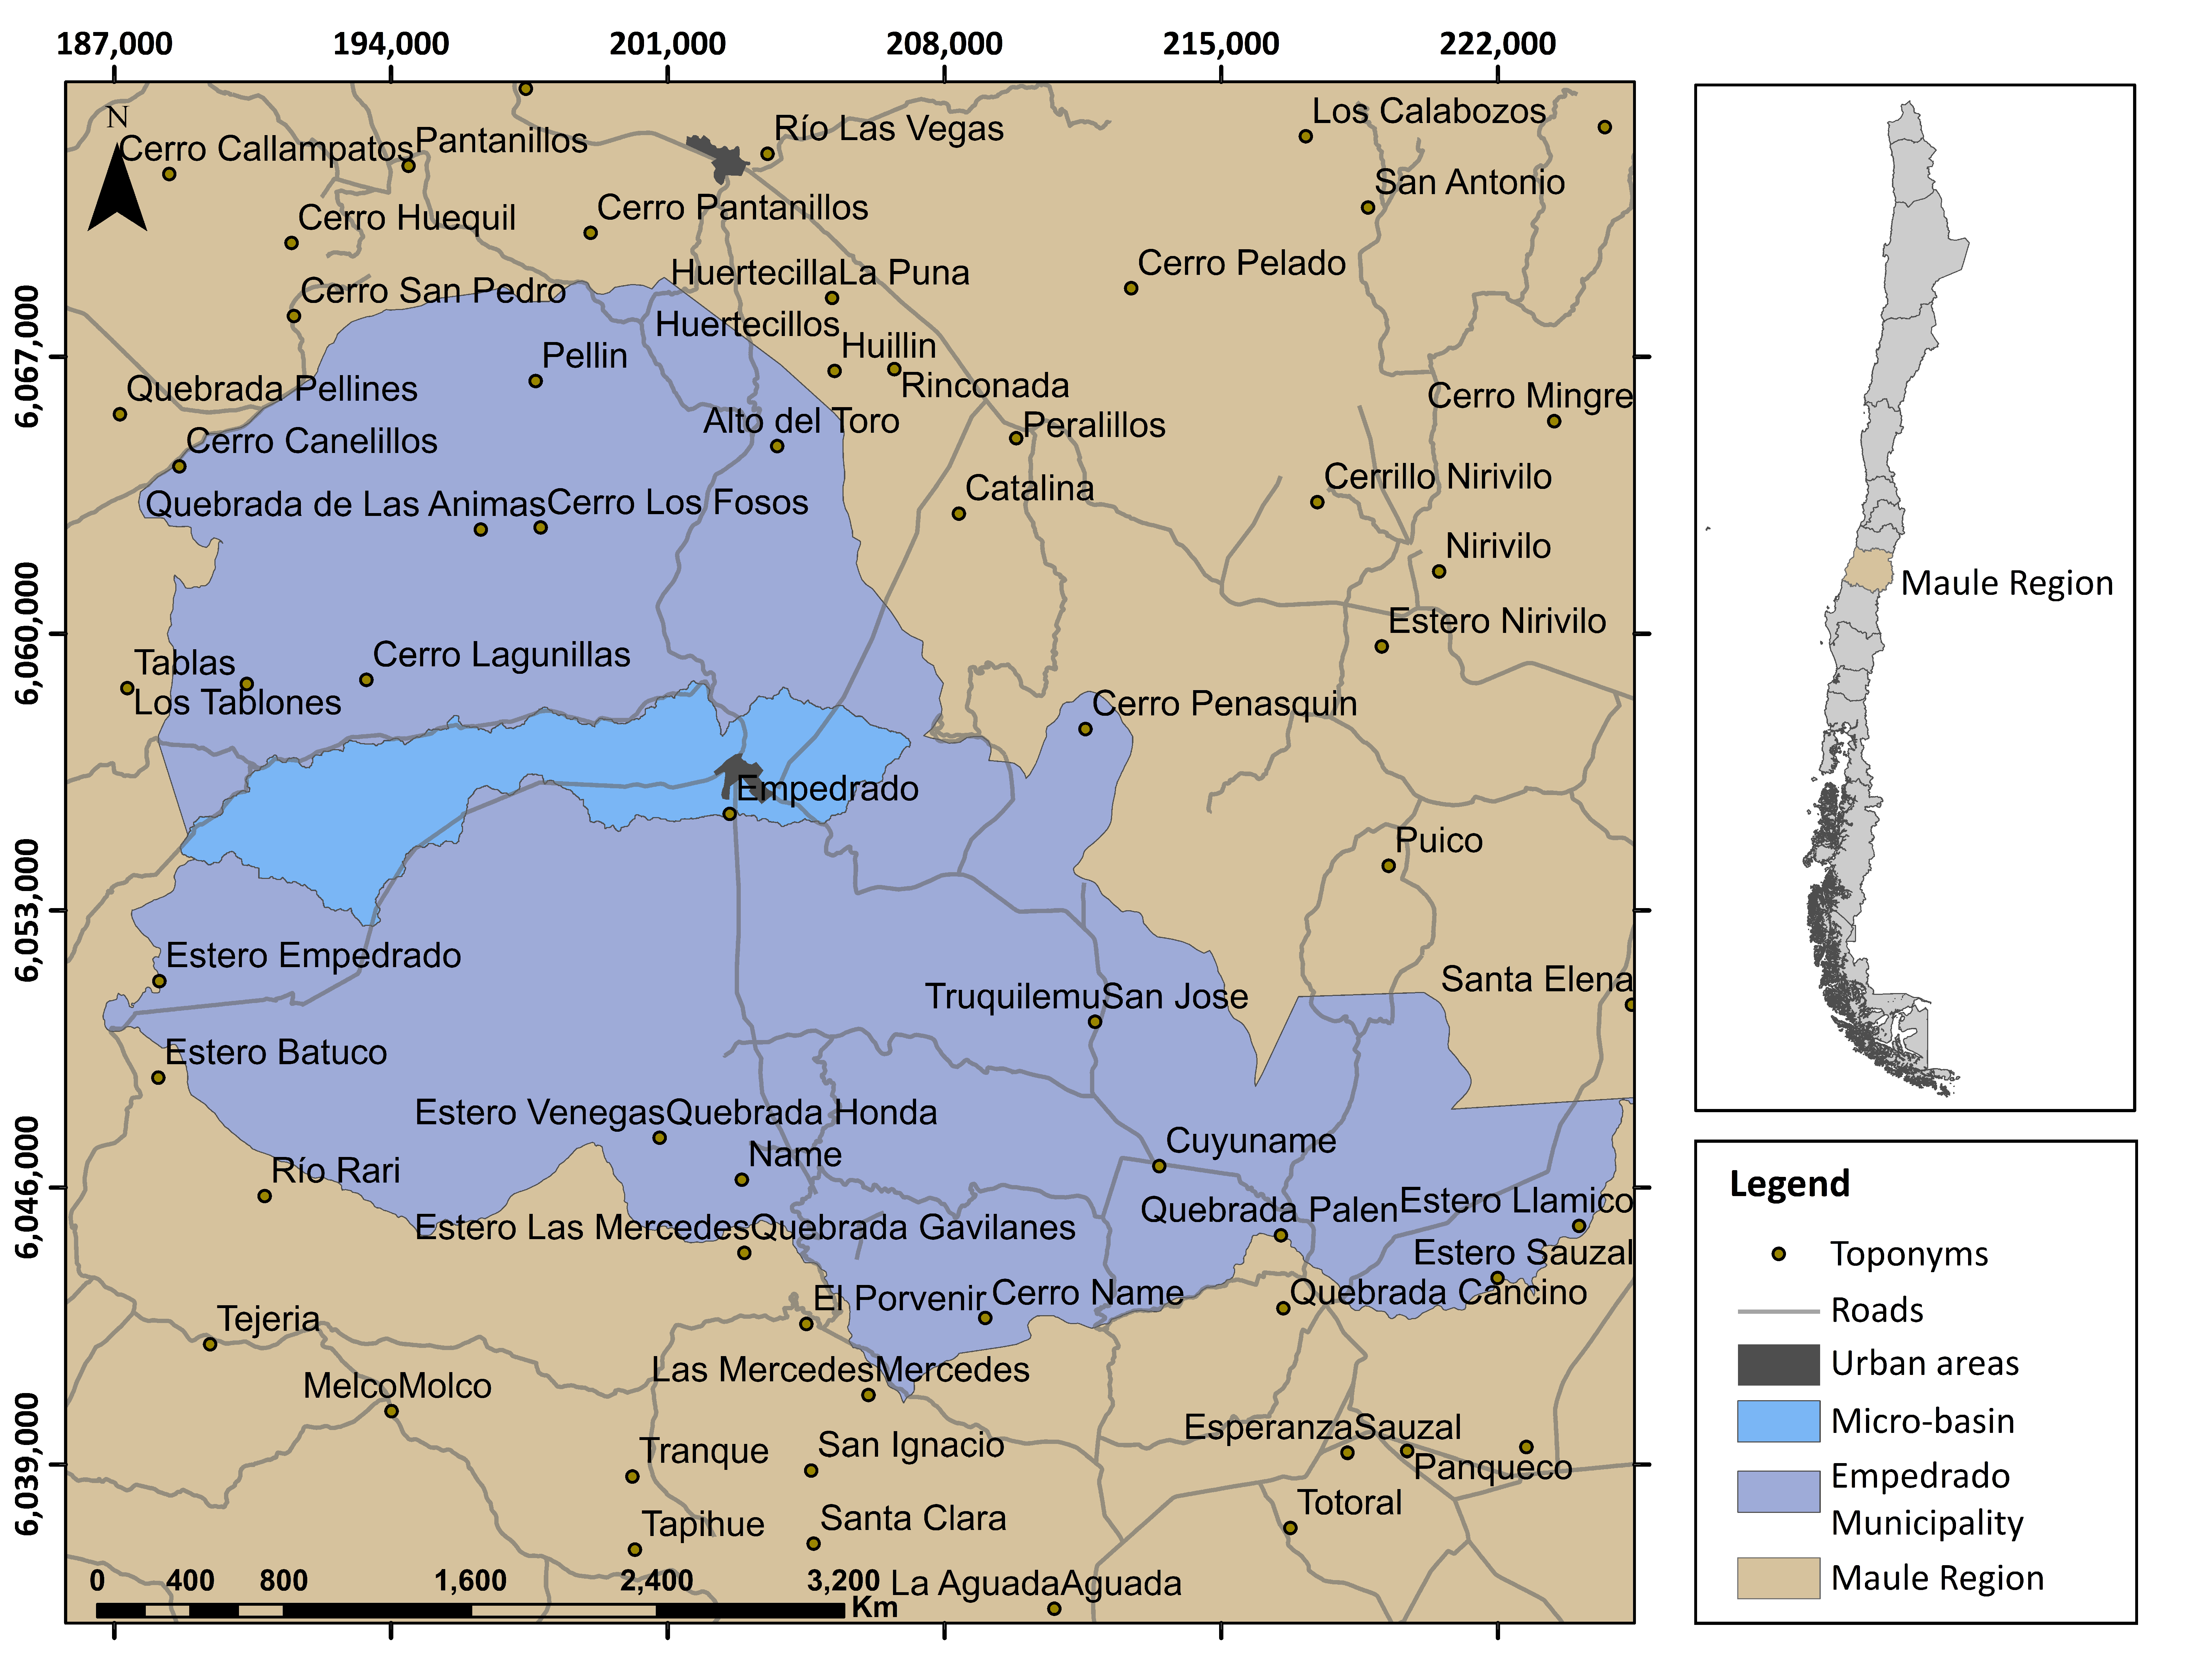
To carry out the interannual evaluation of changes, the valuation of the services of each type of ecosystem (on a qualitative scale from 0 to 5) was combined with the classification of the land cover of the ecosystems. Thus, for each year there is a classification of land covers with different area figures (% of the watershed area) for each of the land covers, as shown in Figure 2.
The provision of each ecosystem service (ESP) was estimated using the area (proportion of the landscape or PLAND) of each one of the ecosystems in each year and its provision capacity (scale from 0 to 5). For example, the provision of ecosystem service 1 (ES1) was calculated by the sum of the area of each ecosystem multiplied by the provision capacity indicated by experts.
Then, the total provision of multiple services in the watershed (All ES) was represented by the average of the provisioning capacities of each service.
The ESP of each ecosystem was grouped, obtaining a global evaluation (All ES), by types of services (provisioning, regulation, biotic regulation, and cultural) and selecting only those identified as most in demand.
The ecosystem services most demanded by the population of the study area, according to Echeverría et al. [32], are:
- Provision services: plants for crops, surface water for drinking, and surface water for other uses;
- Regulation services: air and water purification through plants, water cycle regulation, fire protection, maintenance of species and habitats, improvement of soil quality, and purification of fresh water;
- Cultural services: active or immersive interactions, passive or observational interactions, and aesthetic experiences.
3. Results
3.1. Structure and Transformation of the Landscape
3.1.1. Spectral Indices
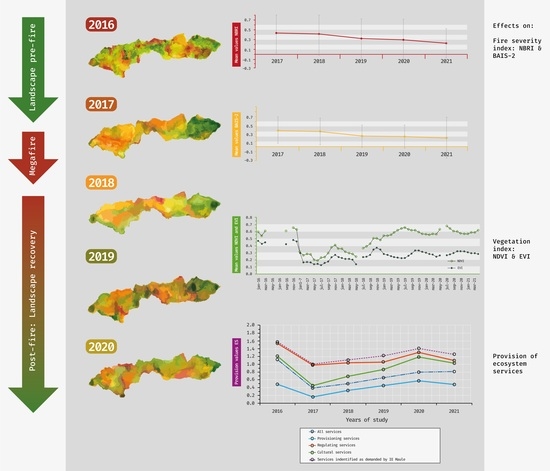
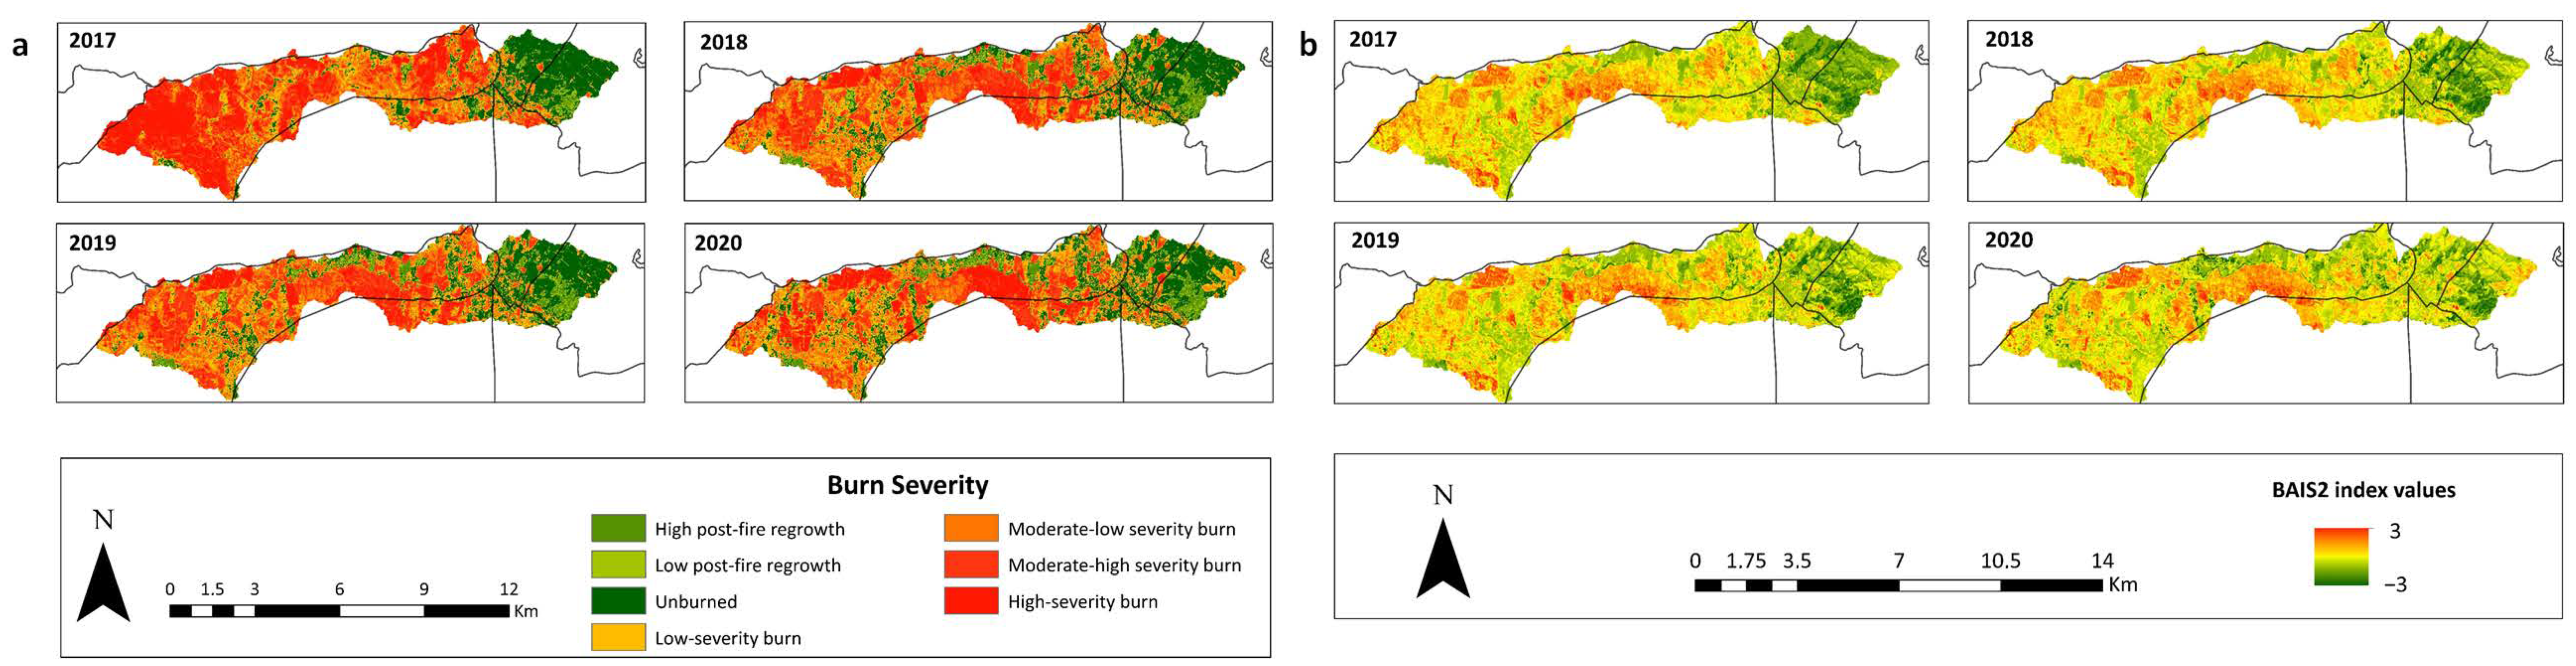
According to the spatialized NBRI index (Figure 3a), in the first year of transition there was little landscape recovery. A large area of the landscape shows high and moderately high post-fire severity, and the changes remain in these classifications. Towards the end of the study period, the areas of high and moderate high severity have decreased, but even so, the areas of “high post-fire regeneration” and “not burned” represent a low fraction of the landscape. NBRI 2021 shows a higher severity, but this is probably because of recently cleared areas.
In turn, the BAIS-2 index is spatially more sensitive than NBRI to changes in living and burned vegetation (Figure 3b). The highest values (3) show the burned areas but, compared to the NBRI index, it does not show relevant changes in relation to the recovery of the post-fire landscape.
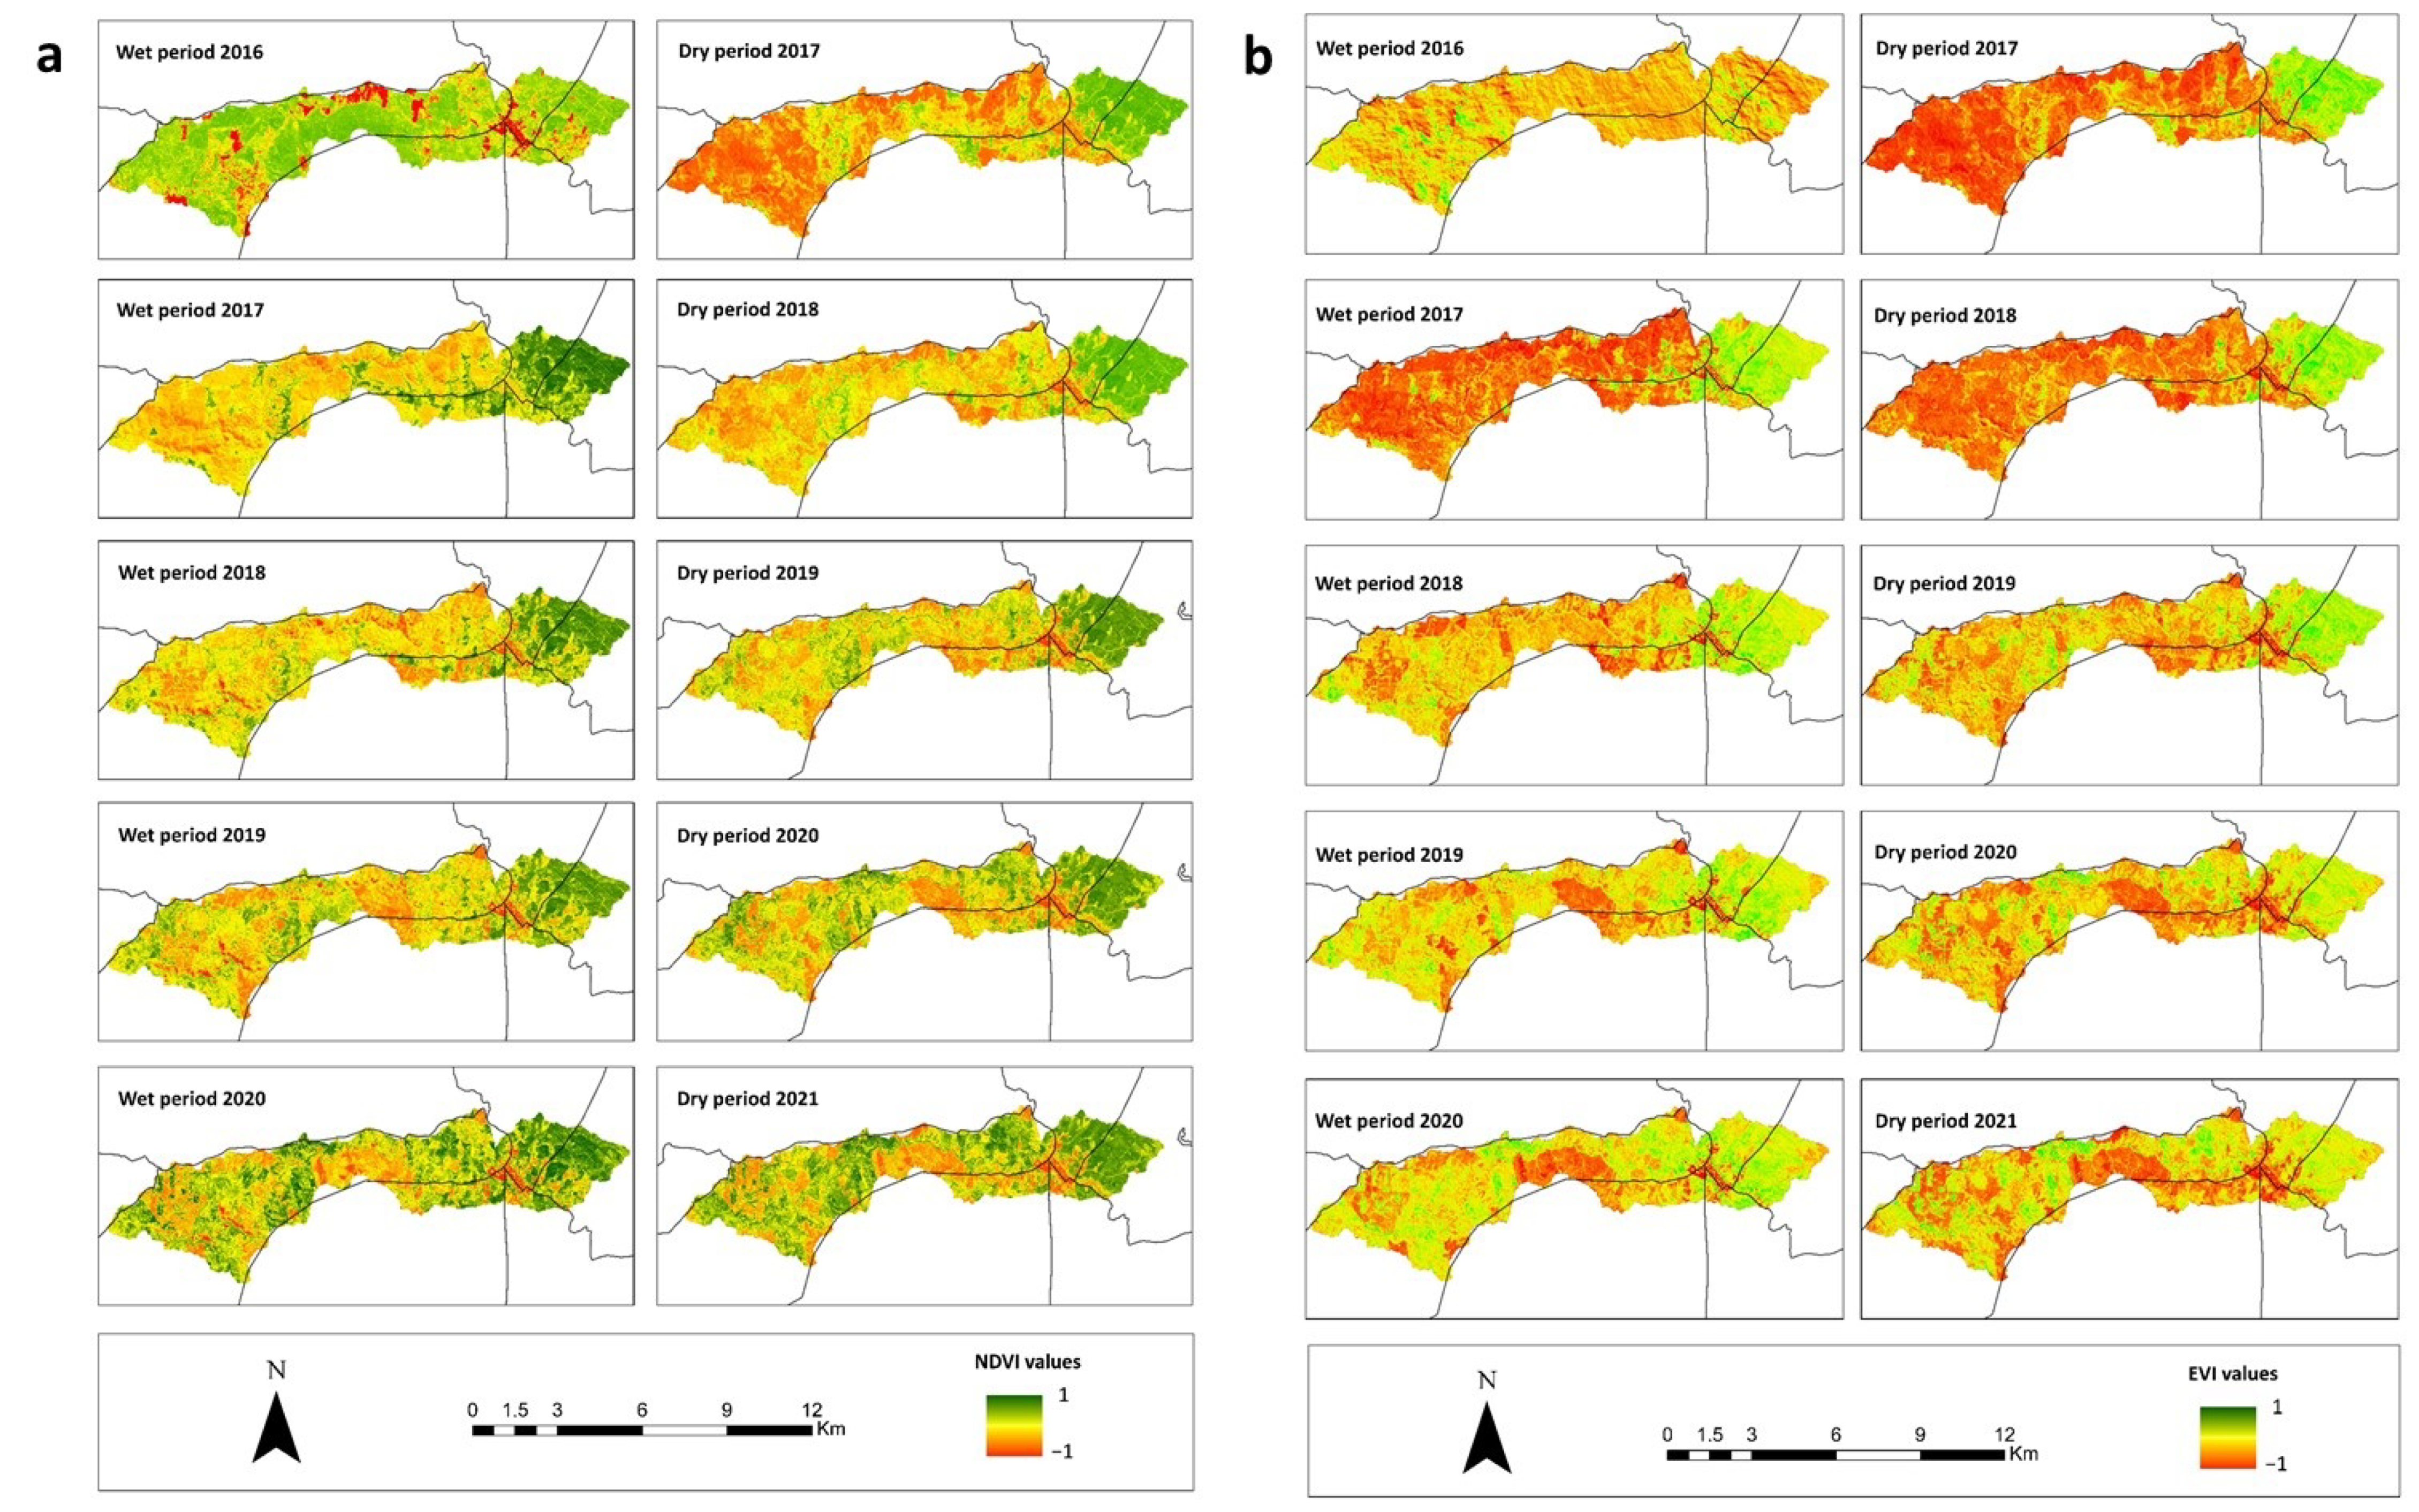
Finally, the spatialized NDVI and EVI indices (Figure 4a,b) show the changes in the vegetative vigor across the watershed, which is spatially similar to BAIS-2. The effect of the 2017 megafire and a recovery in several areas of the landscape from the dry period of 2019 stand out.
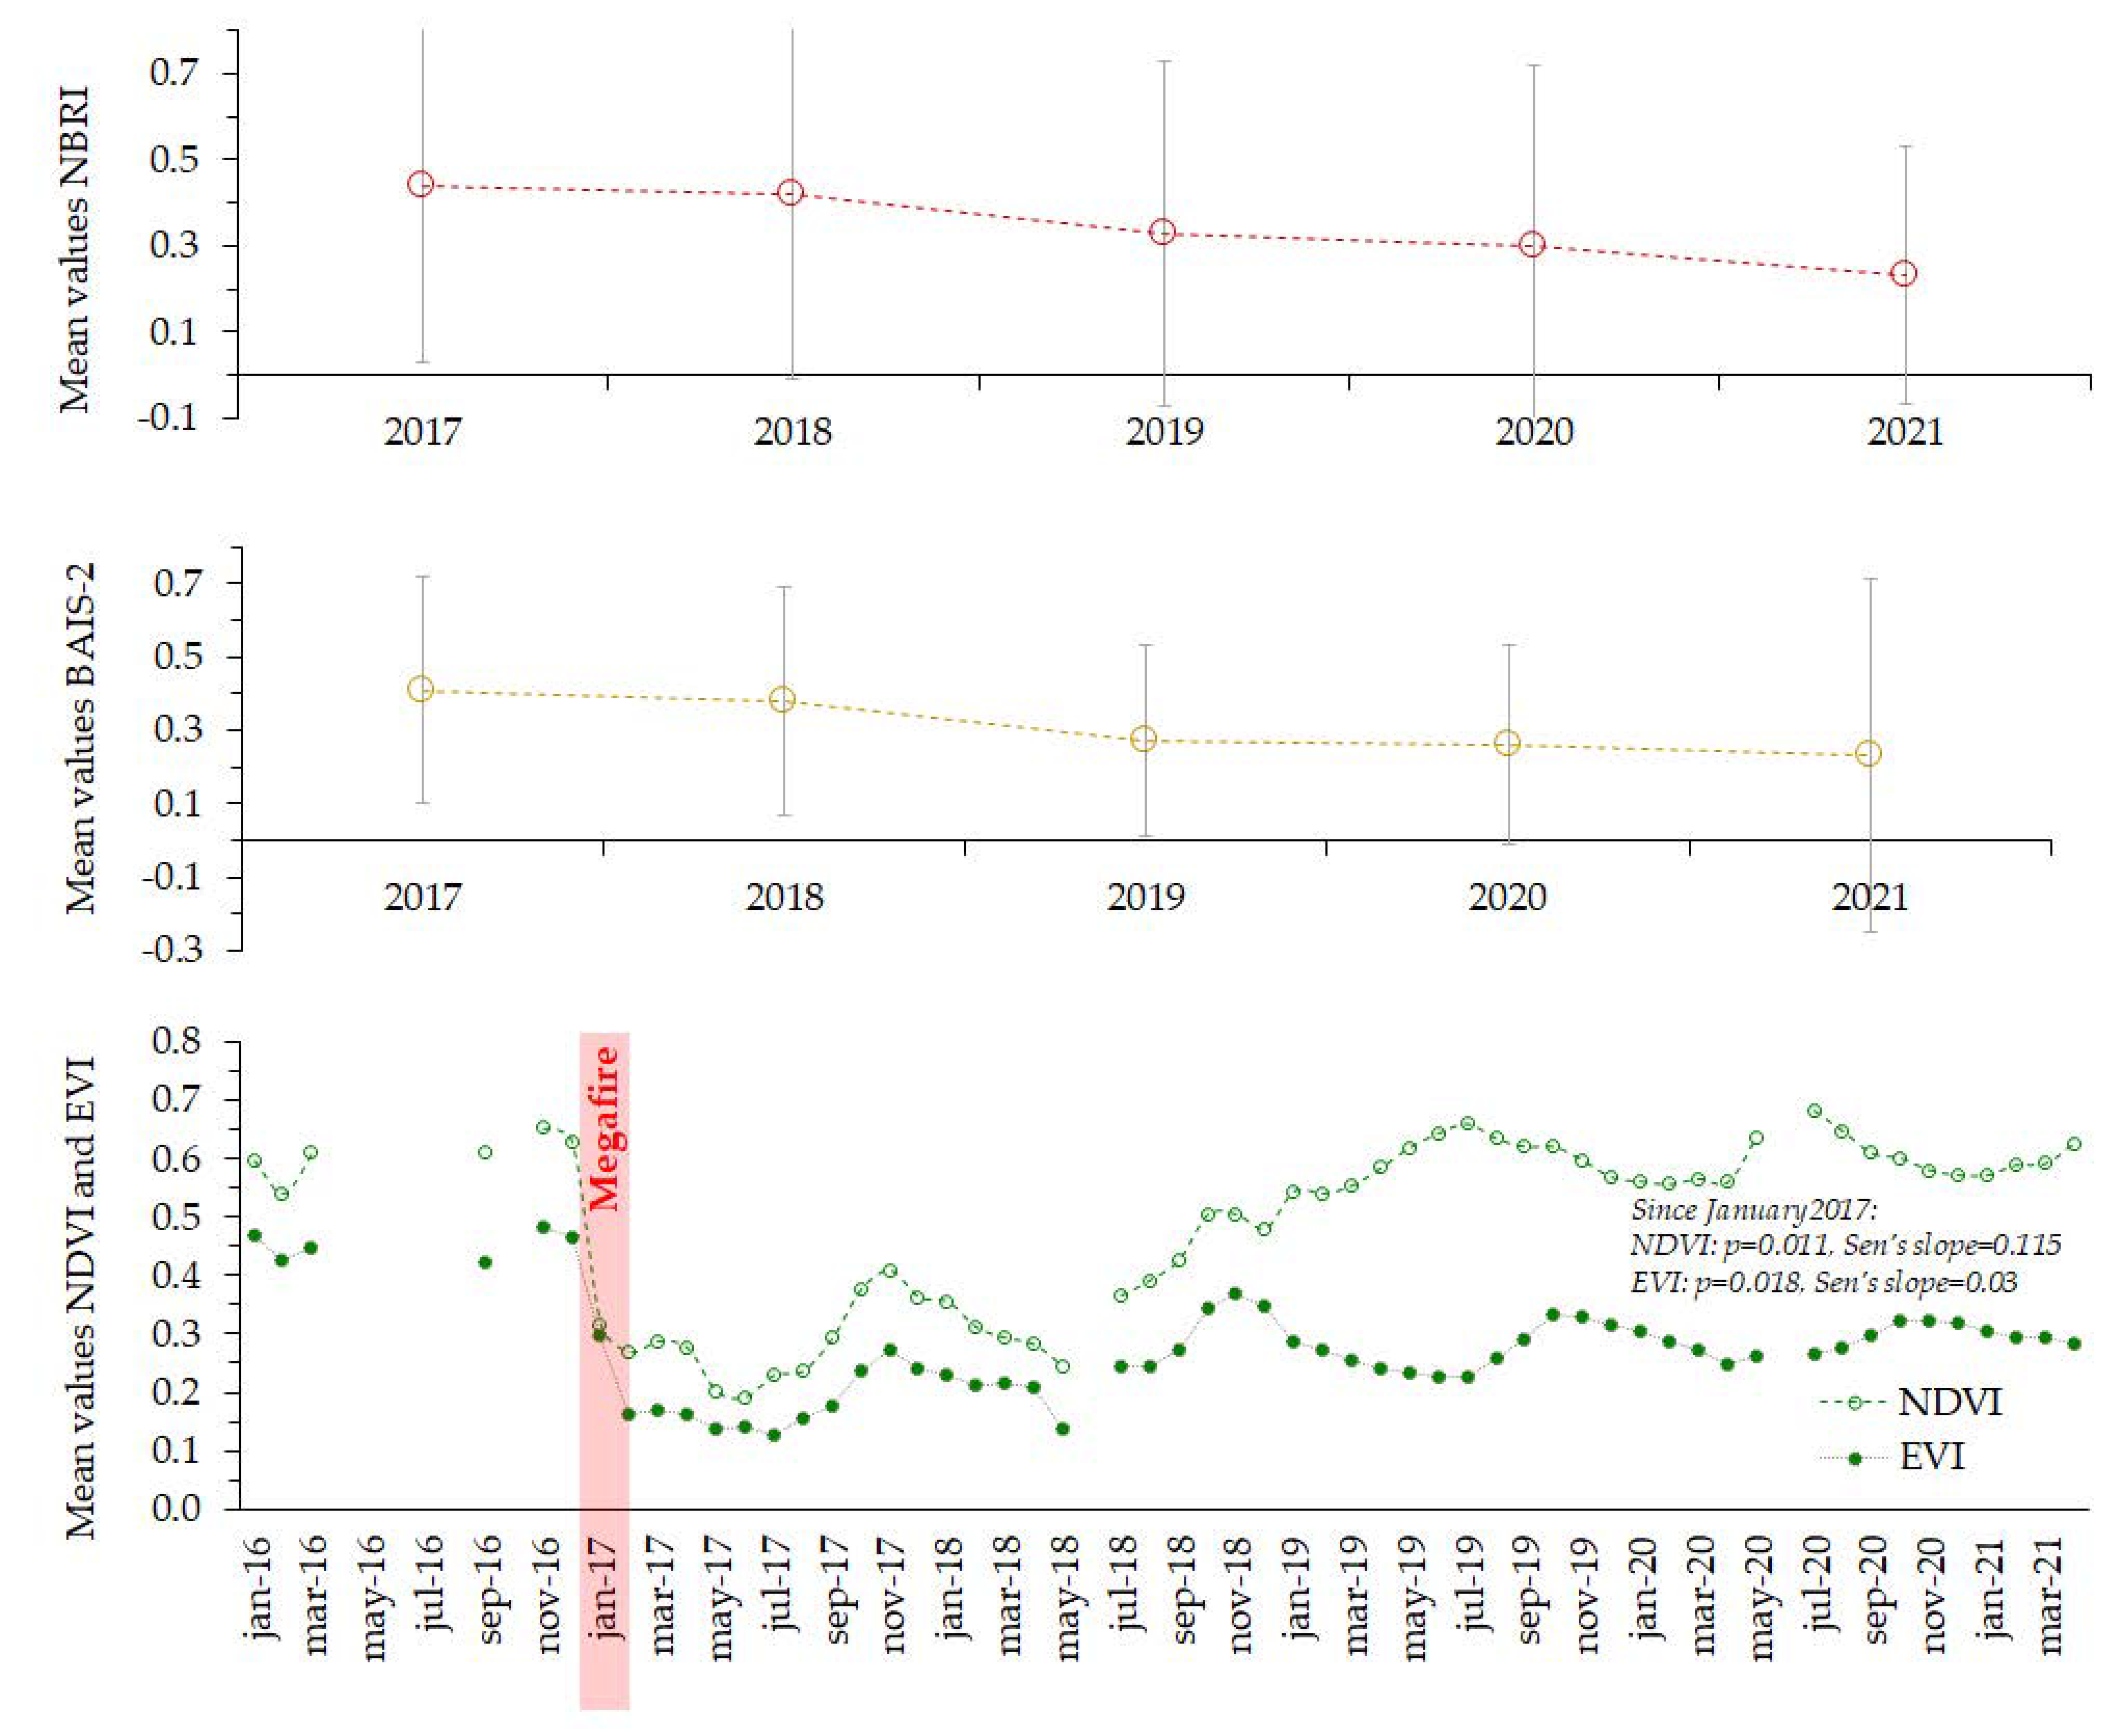
In summary, the high standard deviation (S.D.) shows there is no significant difference in NBRI or BAIS 2 values as annual averages in the past five years, even though there is a slight downward trend over the five-year period (Figure 5). In contrast, the NDVI and EVI show great variation, especially post-fire, and a high recovery of plant vigor.
3.1.2. Land Cover as Landscape Structure
Table 3 shows the high precision of the classifications through the Kappa index, with an error that varies between 7–15%.
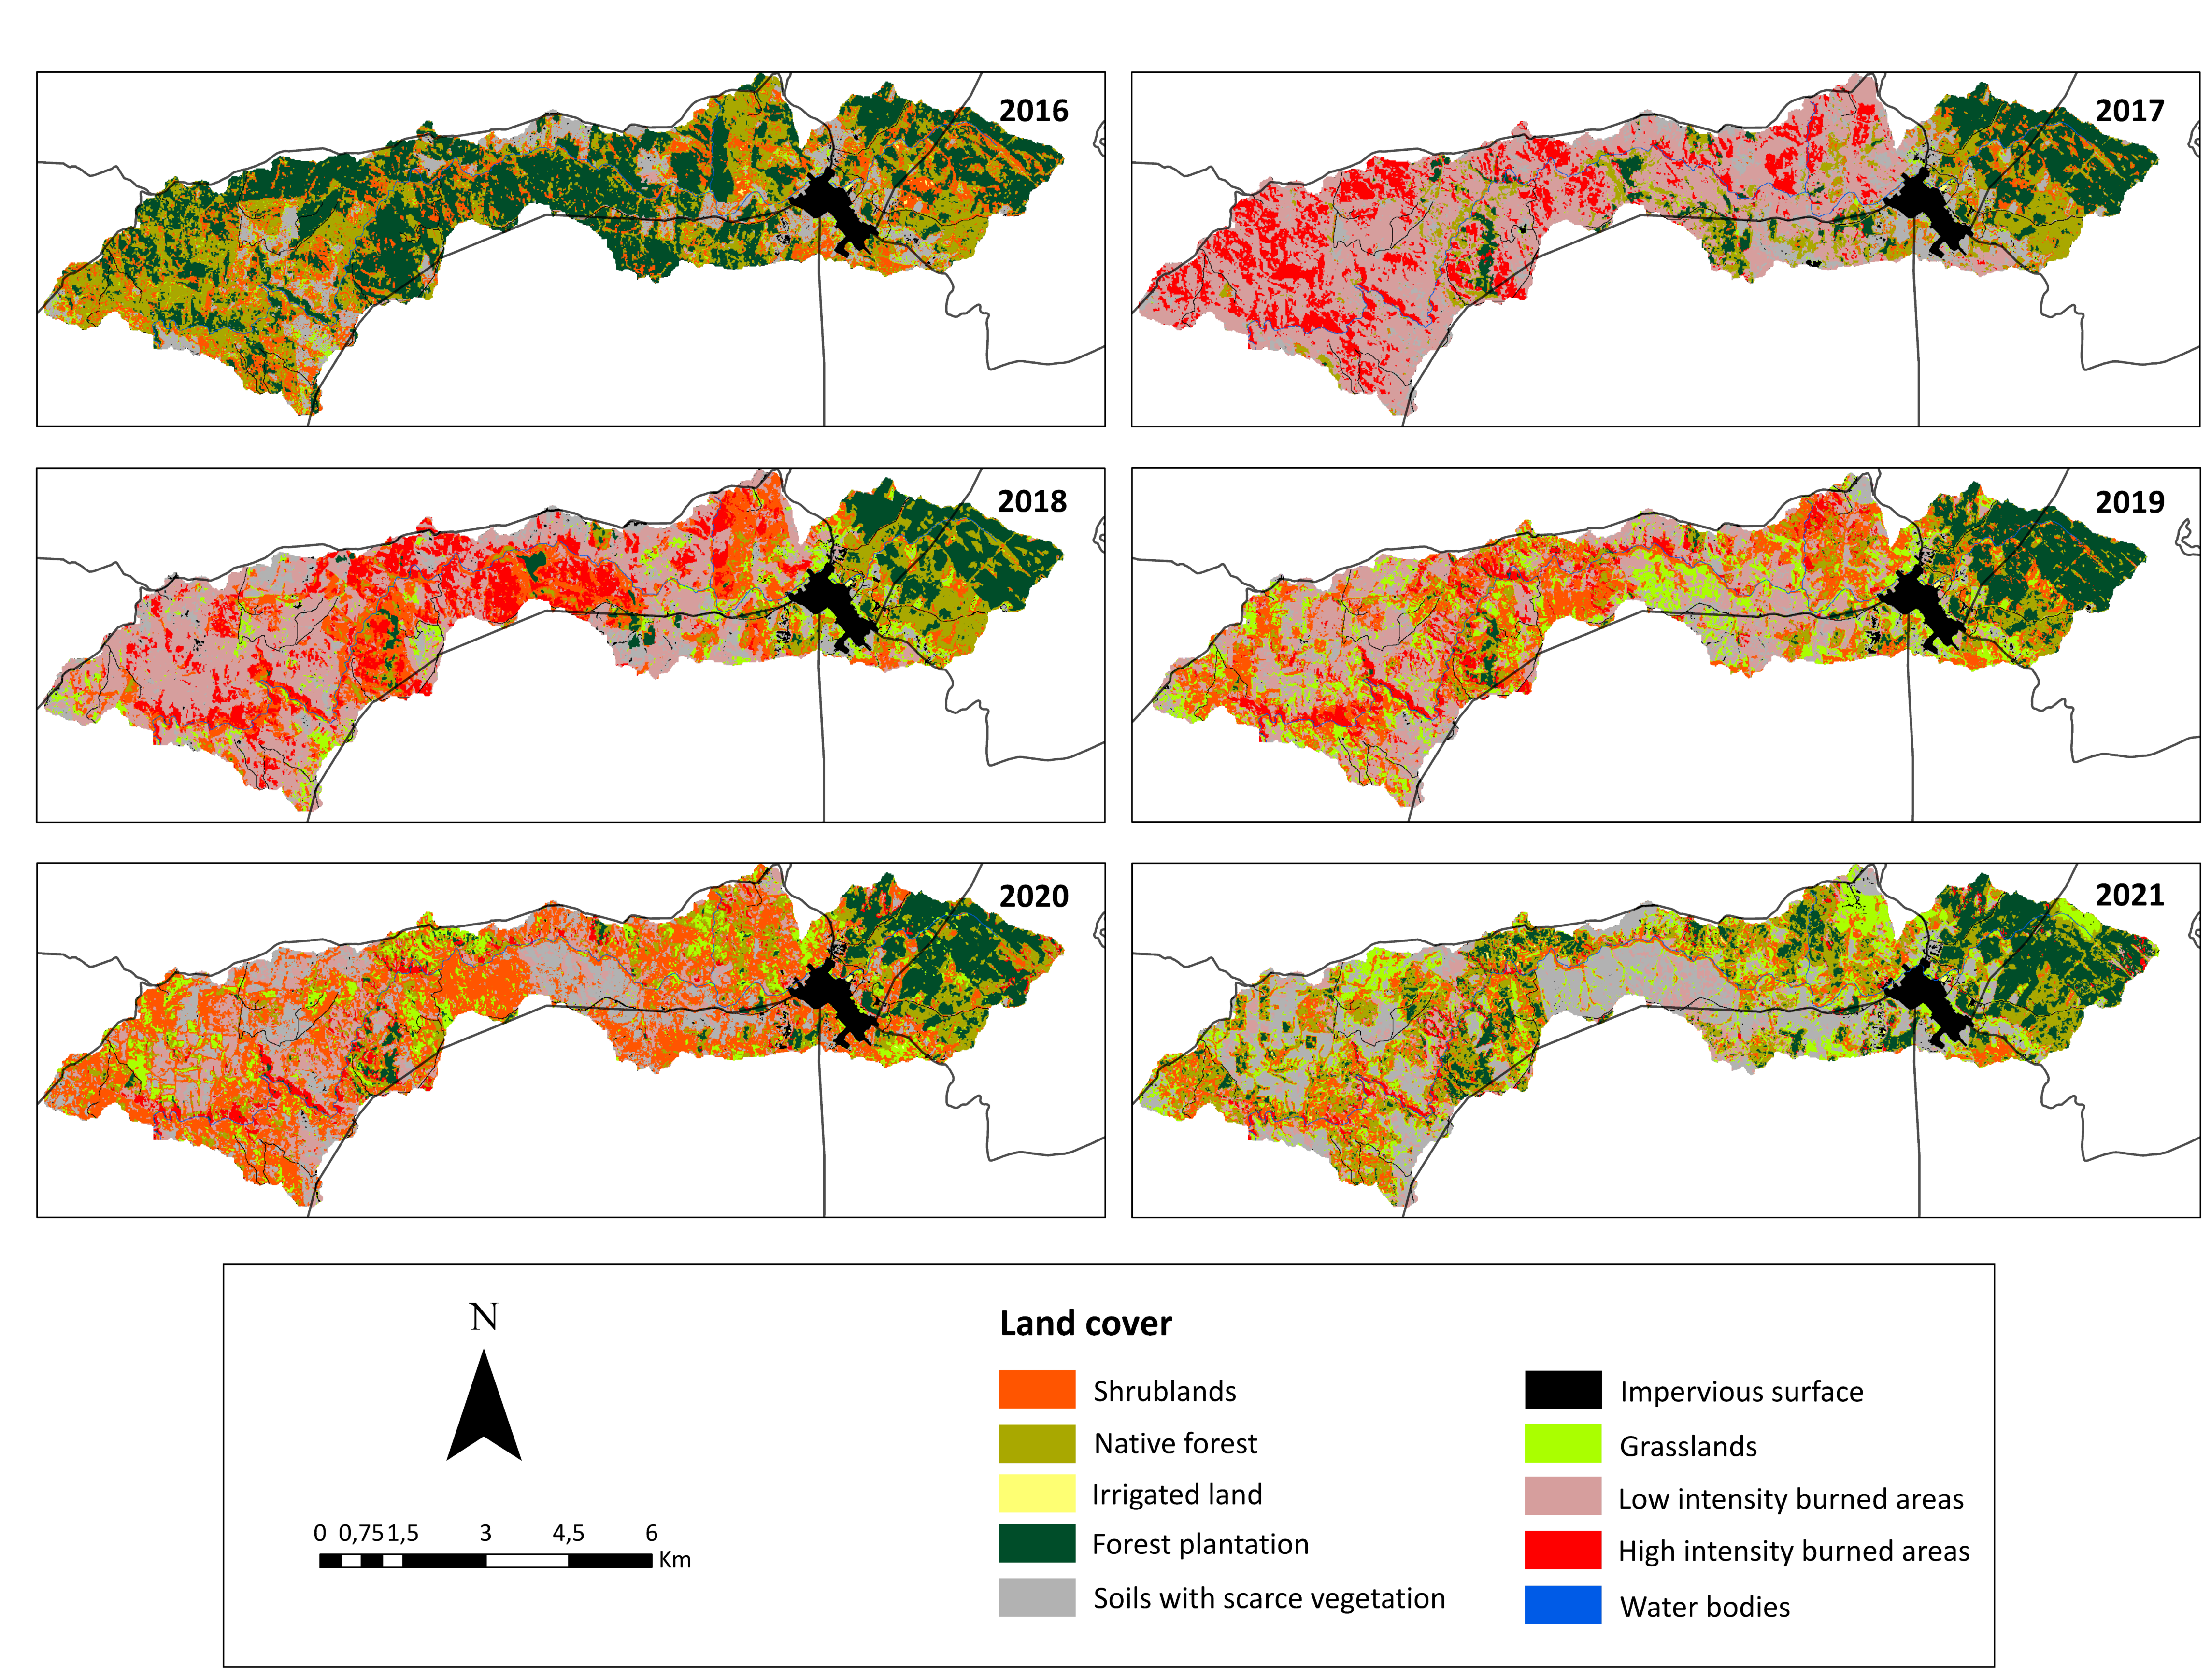
Figure 6 presents the distribution of the coverage in the landscape throughout the years of study, highlighting:
- 2016: the predominant coverage in the landscape were forest plantations (1743 ha), representing 37% of the landscape, followed by native forest (25%, 1200 ha) and shrublands (18%, 867 ha).
- 2017: burned areas predominated, where high-intensity burned areas covered 705 ha and low-intensity 2072 ha.
- 2018: low-intensity burned areas continued to dominate (1584 ha), followed by shrublands (830 ha).
- 2019: the same situation as the previous year was prevalent in low-intensity burned areas (1201 ha), while shrublands rose to 1011 ha.
- 2020: the dominant covers were shrublands (1065 ha) and grasslands (885 ha).
- 2021: shrubs decreased to 643 ha, which was related to the clearance of land for the reforestation of plantation species. This can also be related to the increase in soils with little or no vegetation rising from 596 to 1007 ha in just one year.
Figure 6.
Land cover as structure of the landscape between years 2016 and 2021.

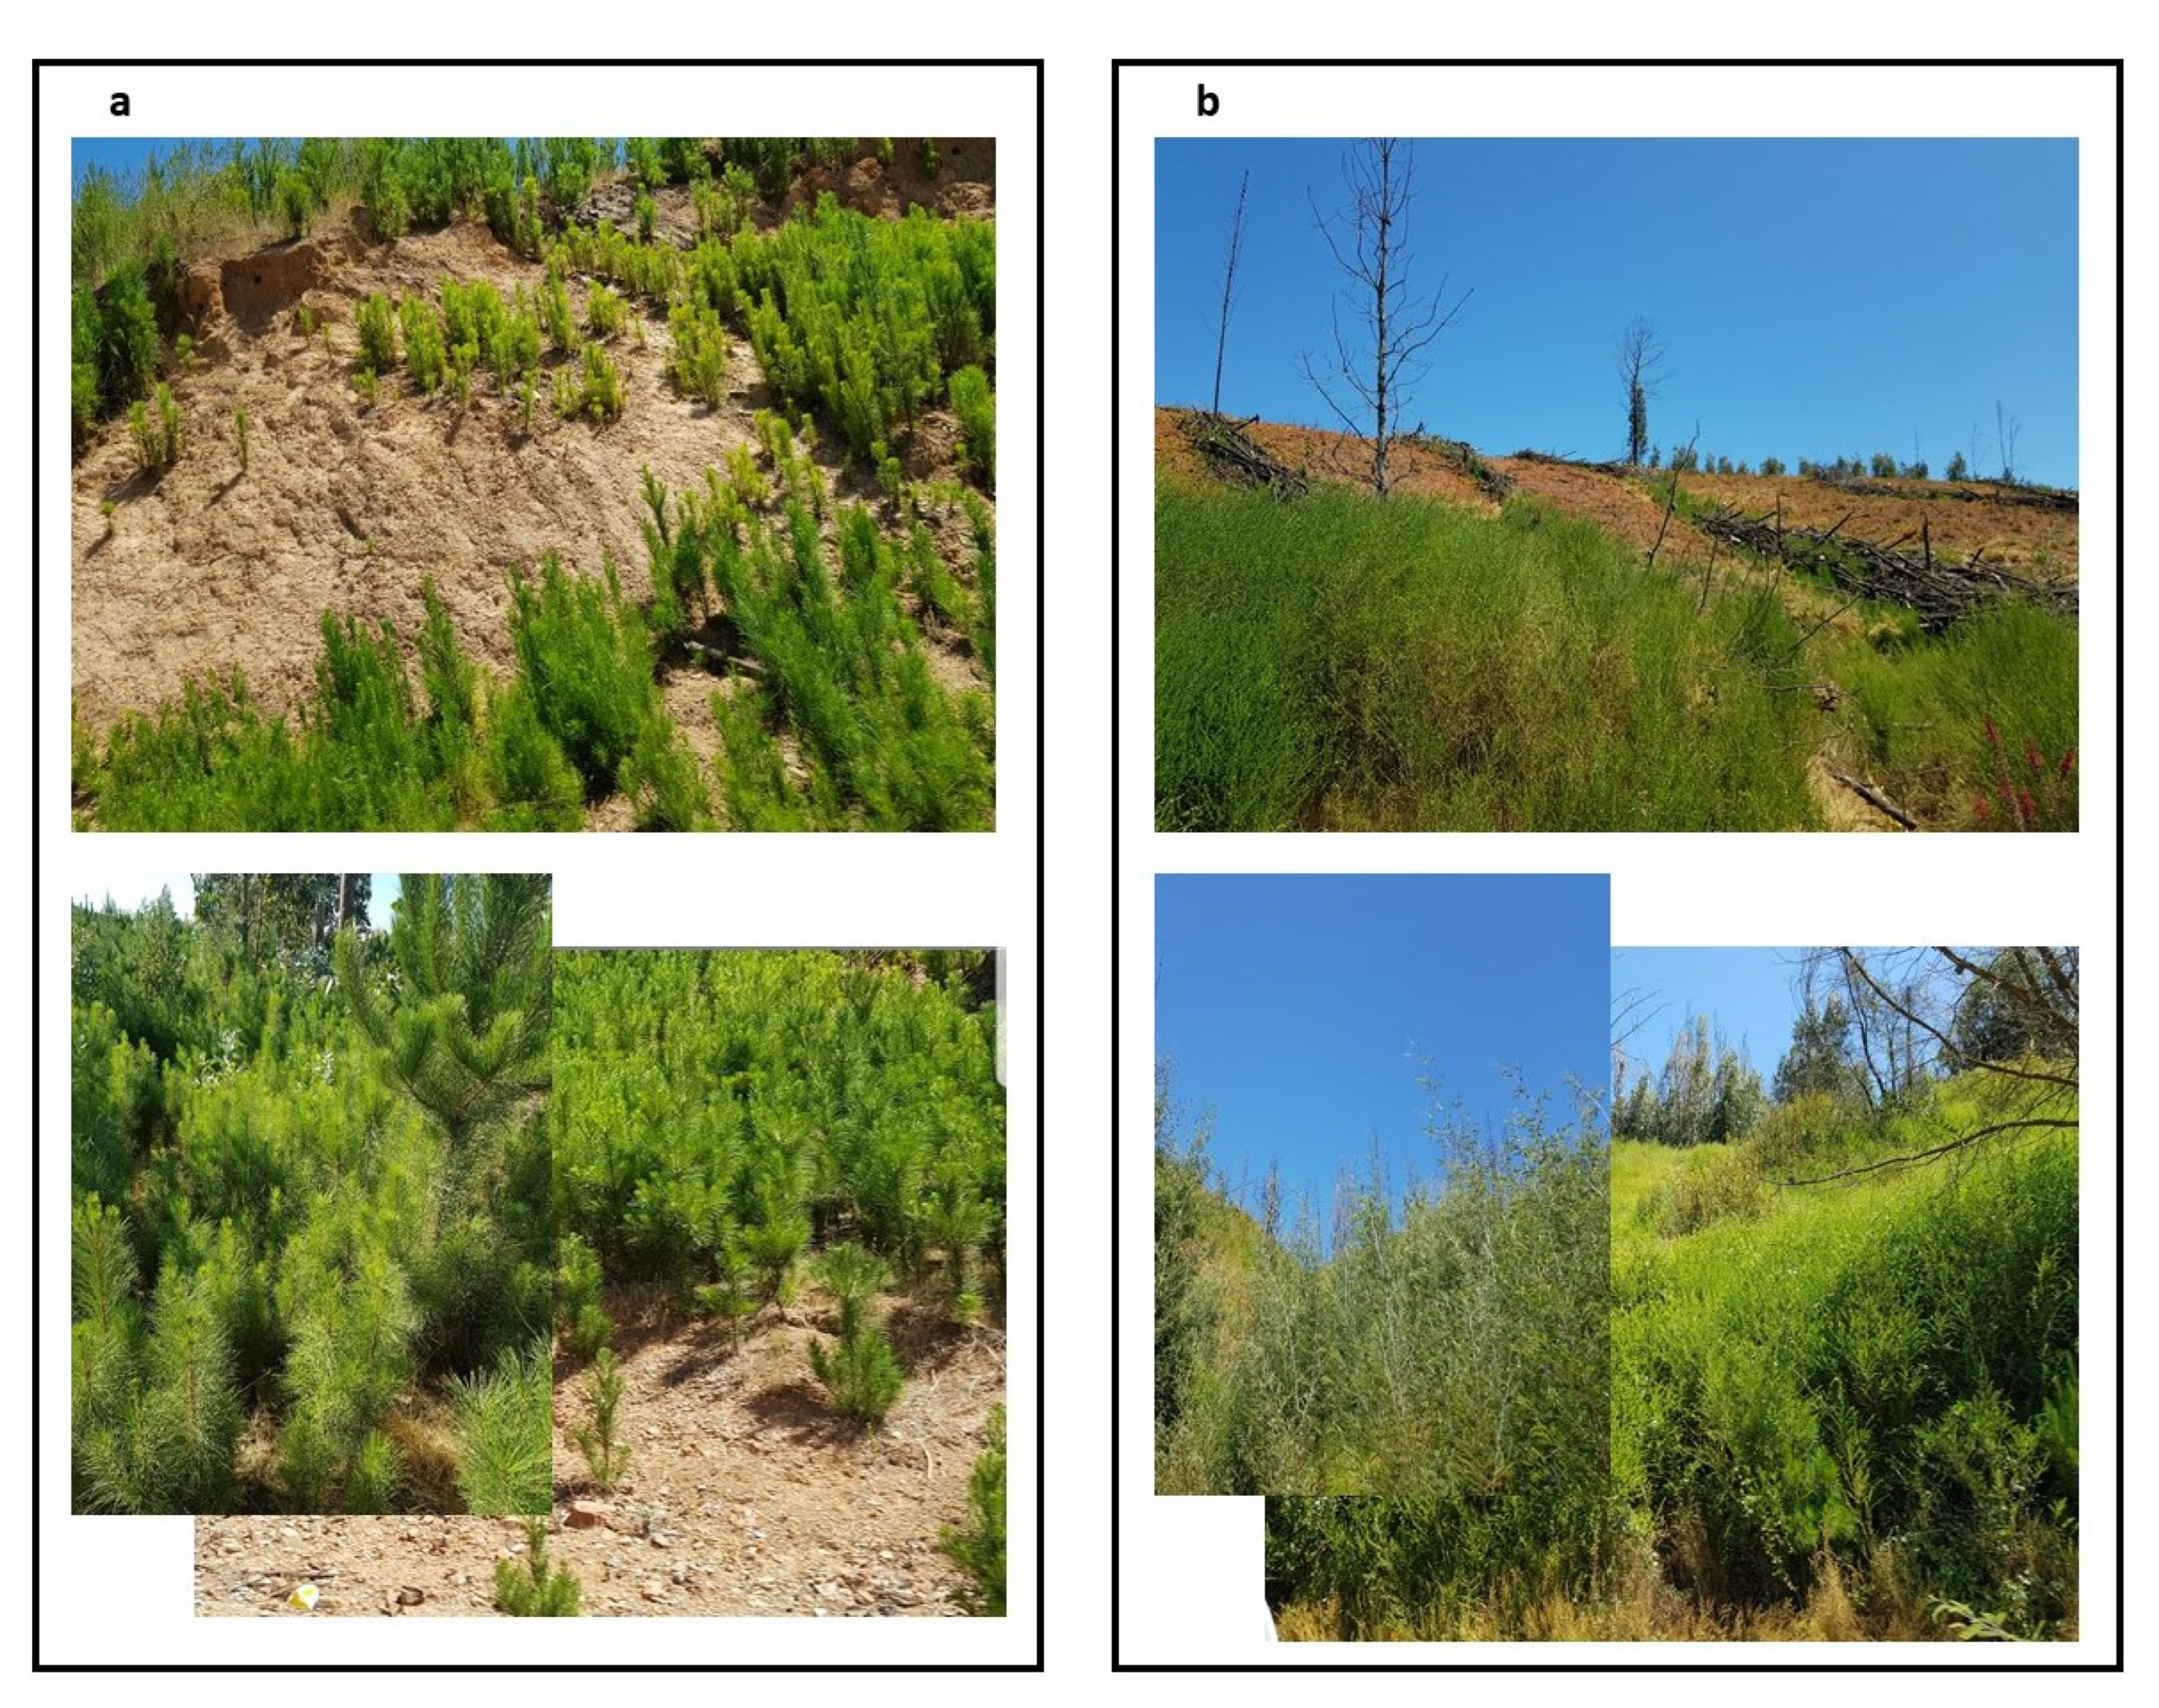
The annual performance of the spectral indices showed a relationship with the changes in land cover. The increase in shrublands was due to the rapid growth of the broom (Teline monspessulana), an exotic invasive plant very common after wildfires. A slight growth of other species, such as Ugni molinae (native plant) and Rosa rubiginosa (exotic plant), was also observed in the burned areas. This transitional coverage can be expected in a post-fire scenario. On the other hand, the increase in grassland cover is actually the regrowth of millions of pine trees (Pinus radiata) without forest management, growing very densely and at a low height (Figure 7).
After January 2017, the NDVI index showed a trend towards the recovery of the landscape according to the Mann–Kendall test (p = 0.011, Sen’s slope = 0.115), with the last year of the study close to pre-fire values. Results were similar to EVI (p = 0.018, Sen’s slope = 0.013). This is explained by the replacement of burned areas by grasslands, shrublands, and reforestation of exotic plantations. Although the values are similar, land cover in 2021 differs from 2016 (pre-fire).
3.2. Effects of Landscape Change on the Provision of Ecosystem Services
3.2.1. Ecosystem Services Matrix
The evaluation by the experts was robust and statistically coincident, without great variation. They indicated that the ecosystems with the most capacity to provide ecosystem services in the watershed are native forests, shrublands, and water bodies.
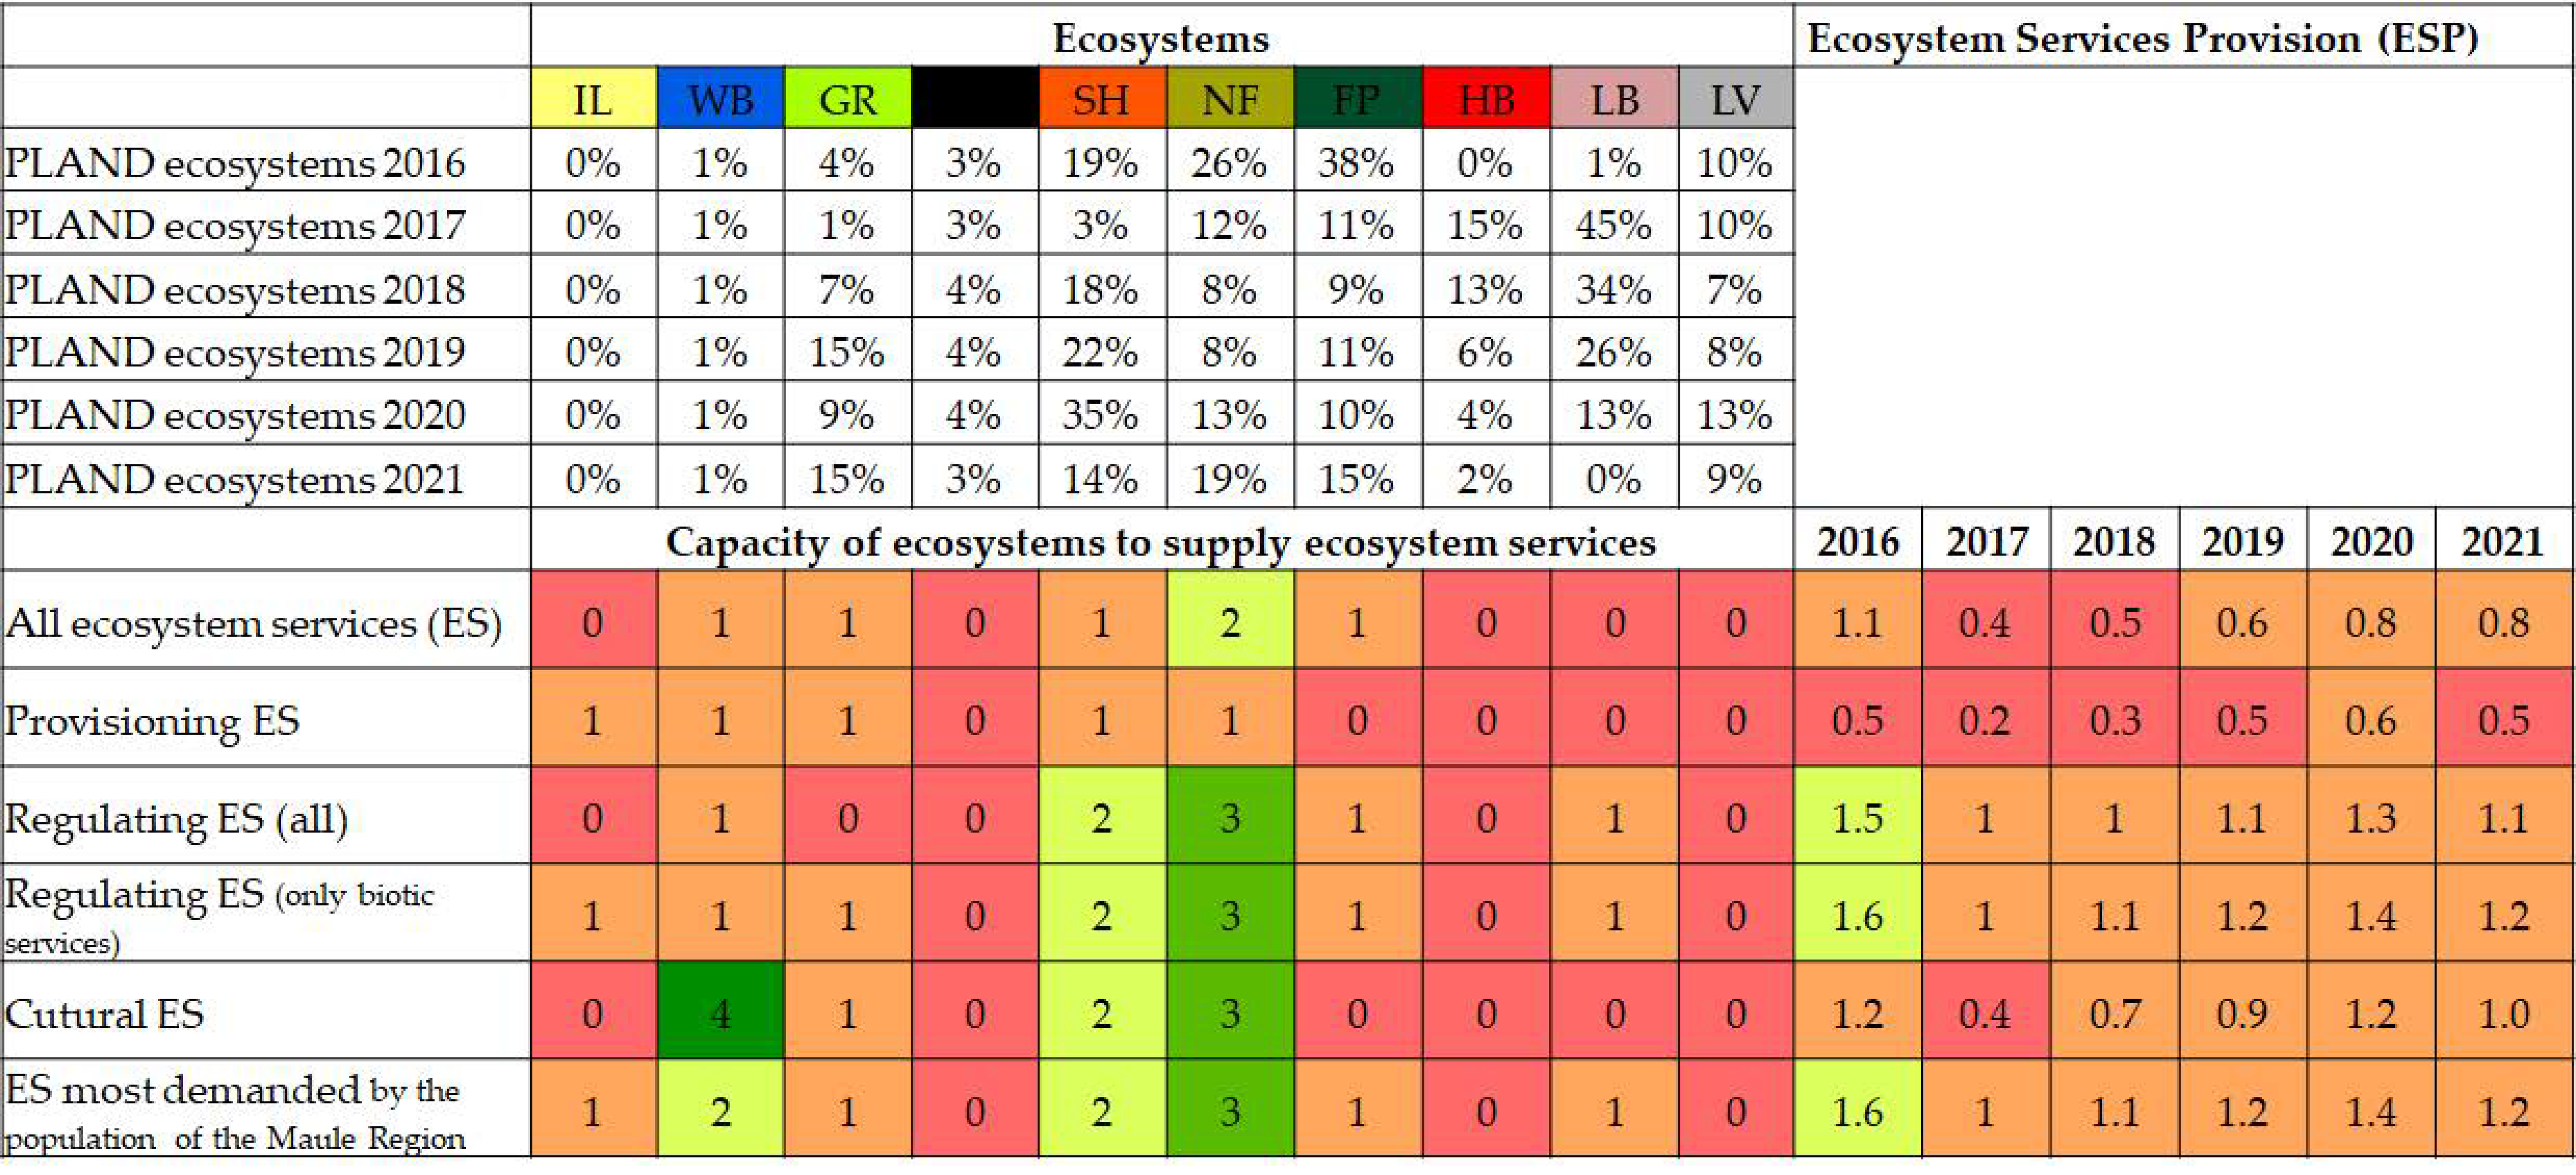
Figure 8 first shows the proportion of landscape (PLAND) of each ecosystem present in the watershed, for each year of study, and then the potential provision of each type of ecosystem service. The variation of this capacity is shown according to the changes in the structure of the landscape between 2016 and 2021.
3.2.2. Interannual Assessment of Changes in Ecosystem Services
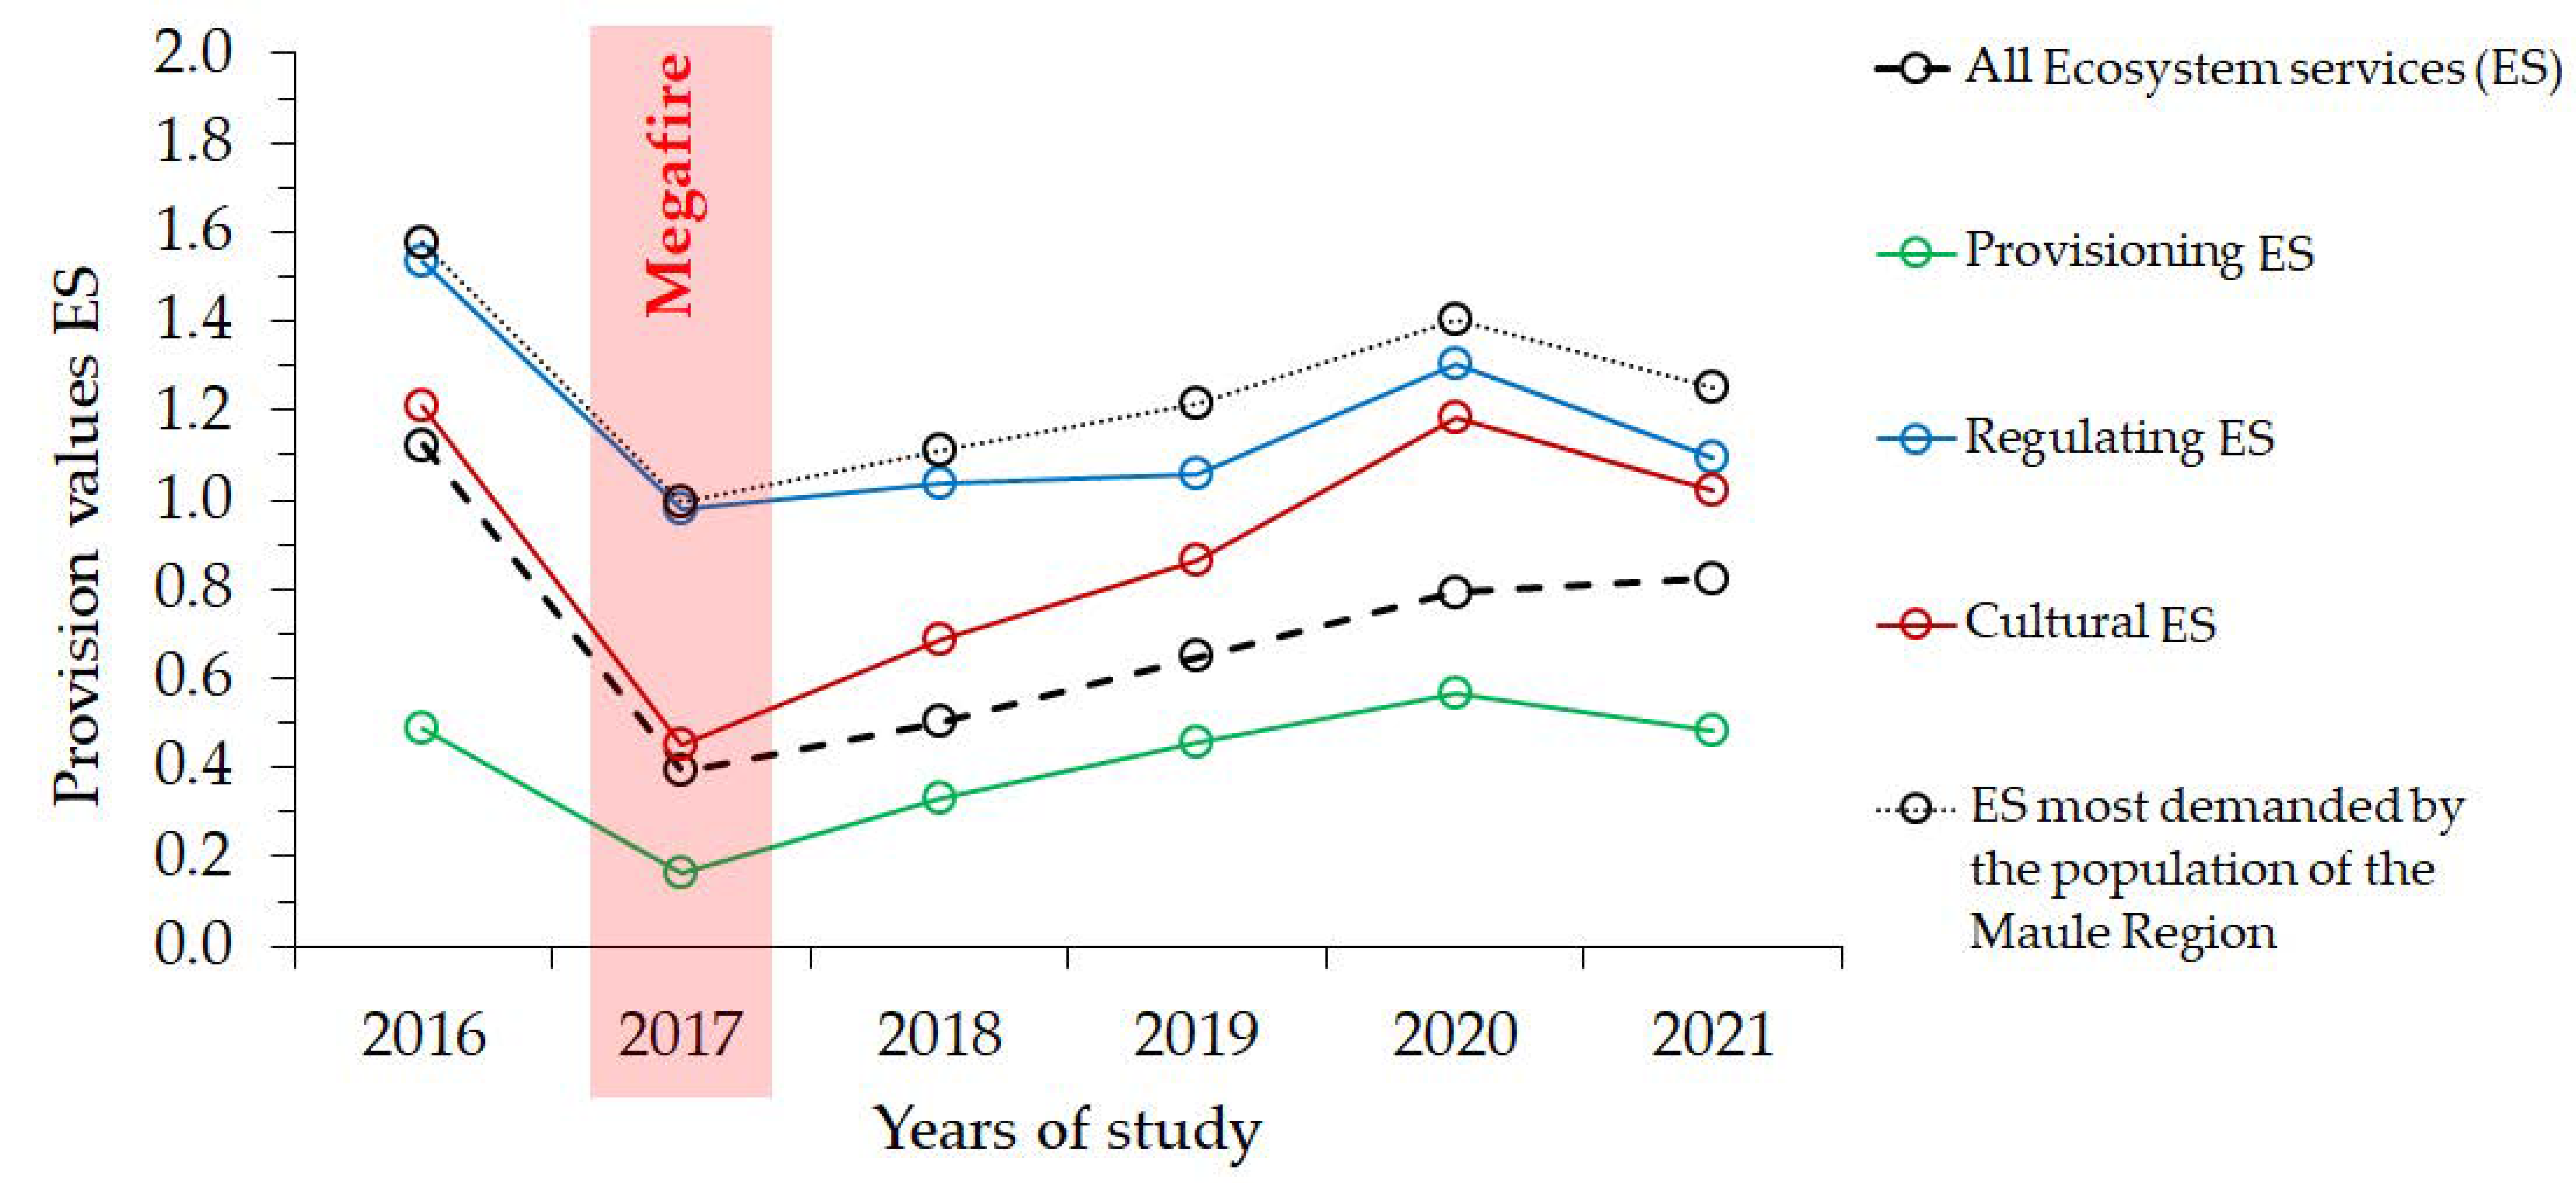
The values of ecosystem service provision in 2016 (before the fire) fell the following year, immediately after the megafire (Figure 9). Subsequently, there is an upward trend in the provisioning capacity in subsequent years. It is worth highlighting the large decline after the fire in the provision of “all ecosystem services” and “cultural services” (approx. 50%). The greatest provision of ecosystem services, before and after the megafire, although with a low recovery, are precisely those identified as most in demand (see Section 2.3).
3.2.3. Detailed Analysis of Changes in the Provision of Ecosystem Services as a Measure of the Sustainability and Resilience of the Landscape
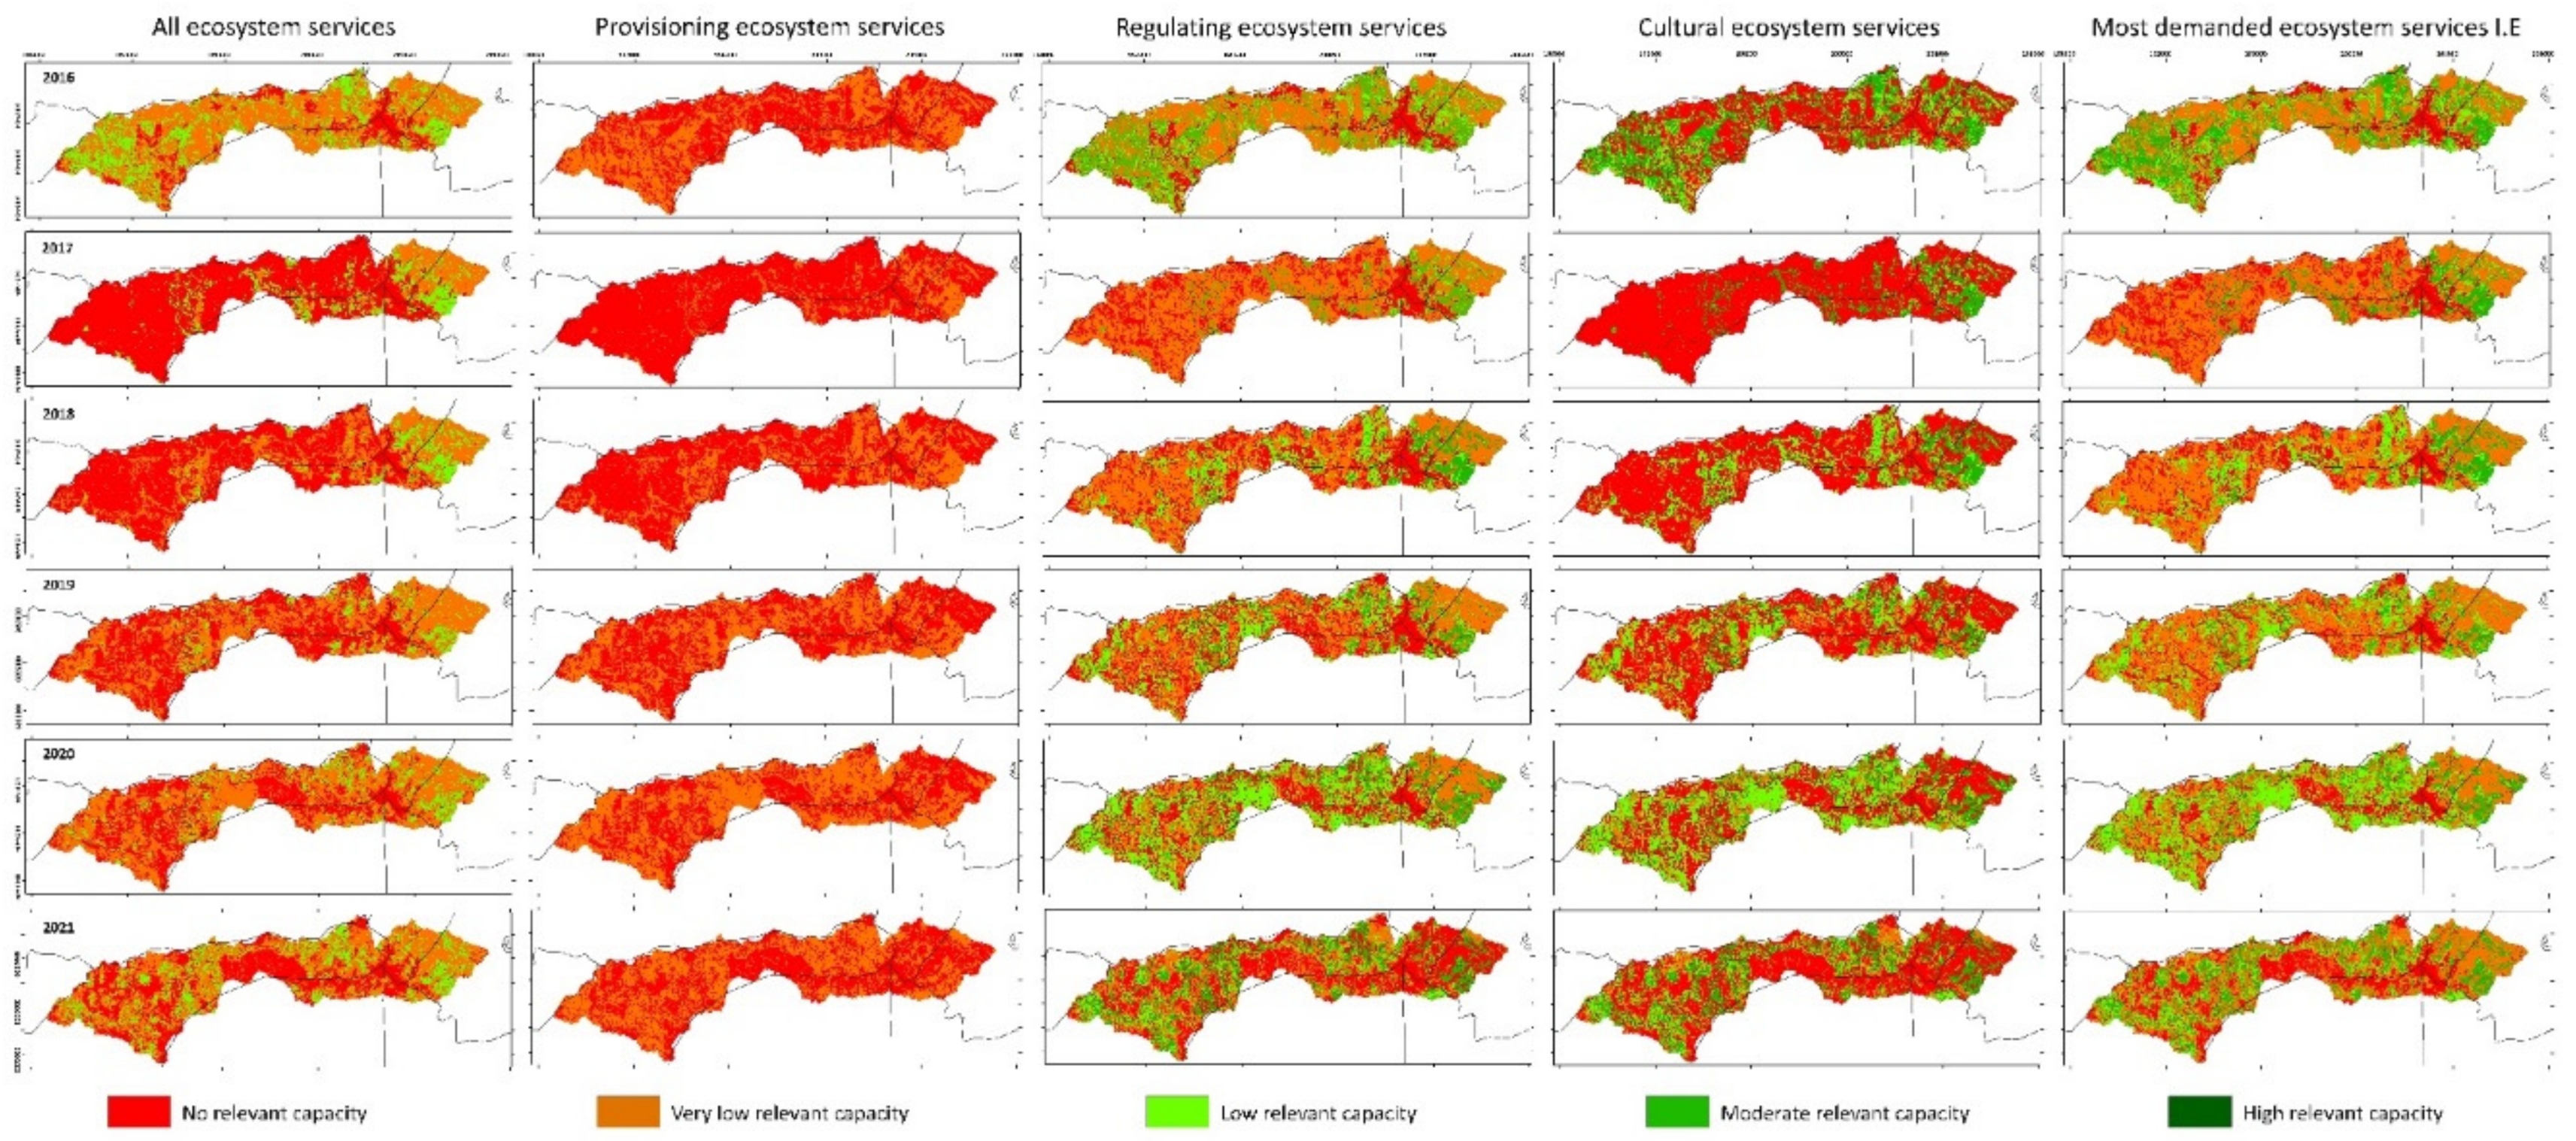
In 2016 (Year 0 of the study), 60% of the landscape had a very low capacity to provide ecosystem services, denoting a low sustainability of the landscape (Figure 10). This low provision was accentuated after the 2017 fire, where this category increased from 14 to 72%. A variety of services were impacted: provisioning services such as the production of fungi associated with forest plantations and the provision of wild plants, fruits, and mushrooms delivered by the native forest and shrublands; regulation (in general); and cultural services that are mainly provided by the native forests.
In 2018, the area of null provision dropped to 58%, increasing the very low provision category to 34% of the watershed (Figure 10). In the second year after megafire (2019), the null provision continued to decrease in area to 44%, increasing the very low provision. In the third year post-fire (2020), the null provision of ecosystem services reached 33%, with the very low provision at 54% and the low provision at 13%. Currently, in 2021, the null provision represents 36%, with the very low provision 44% and low provision 18%. Although the landscape shows recovery after fire, there is still a difference with the initial state, indicating an incomplete recovery of the ecosystem’s provisioning capacity (Figure 10).
3.2.4. Analysis by Type of Ecosystem Services
With regard to pre-fire provisioning services, the study area did not provide a high level, except for wood production. The current year (2021) presents a provision similar to the pre-fire situation. One of the main provisioning services provided by the watershed was the provision of fungi as a non-timber forest product, mainly in forest plantations and native forests, and secondarily in arborescent shrublands, which is difficult to recover.
The provision of regulation services stands out, being well provided by native forests and shrublands, followed by forest plantations. The megafire affected the provision of these type of services, with a predominance of zero and very low capacity for post-fire provision. Although there was a recovery, this has declined again in the last year due to the preparation of the soils for tree replanting that temporarily affected the provision of services. There was no greater recovery, as was the case with provisioning services, because the two main land covers that provide this service (native forests and shrublands) take time to recover and require restoration actions.
The provision of cultural services was already very low in 2016, being highest in bodies of water and native forests. Over the post-fire years, ecosystems have been able to slowly recover some of their supply.
3.2.5. Analysis of Ecosystem Services Most in Demand
Before the 2017 megafire, the most demanded ecosystem services (see Section 2.3, e.g., plants for crops, surface water for drinking, soil quality improvement, passive or observational interactions) were poorly provided by the watershed, with 41% at very low and 26% with moderate provisioning capacity. Post-fire, the area of moderate capacity decreased to 12% and very low capacity increased to 56%. In 2021, the moderate provisioning capacity was at 18% and the very low at 40%. Forest plantations predominated in the Estero Empedrado watershed, but there were remnants of native forests and shrublands, which are the land covers with the highest provisioning capacity. The megafire directly affected these adult forests. For this reason, the recovery of the provision of services has not yet reached the pre-fire state, but in the transition process both the provision and the type of services will change, especially if restoration and rehabilitation actions are carried out.
4. Discussion
4.1. Methodological Aspects and Main Findings of the Methodological Application
To improve the application of this methodology, expanding the time scale and carrying out evaluations over at least 10 years would be appropriate to give greater statistical validity to the association between spectral indices and potential provision of ecosystem services. As Sentinel-2 data is only available from 2015, Landsat images would have to be used for previous years, as presented in [33,35,36].
Regarding the classification of land covers, in 2017, the main changes occurred due to the megafire, highlighting the decrease in grasslands, shrubs, native forest, and forest plantations, which became burned areas of high and low severity. The main subsequent changes have been due to ecological succession, the high density of pine regrowth, and the rapid growth of exotic broom, causing changes in the landscape faster than the native land covers. This coincides with Valencia et al. [37]. Other changes have been the variation in the area of native forests and post-fire forest plantations, which were related to the management of burned land covers and illegal logging also presented by García [38].
Regarding the indices used to feed the land cover classification process, results show that only one severity index is sufficient (e.g., NBRI or BAIS-2), in addition to the NDVI that had a better sensitivity compared to EVI. Although NBRI and BAIS-2 show similar average values, BAIS-2 was more sensitive to post-fire regeneration changes. However, the literature indicates that there is no agreement on which index works better in detecting burned areas and the severity of the fire [28]. NDVI showed high sensitivity to changes in vegetation, complementing the findings of Bar et al. [39], who saw better results in the spectral bands of Landsat 8 for the detection of burned areas and in Sentinel-2 a better potential to identify areas affected post-fire.
The revalidation of the matrix for the evaluation of the watershed studied showed that ecosystems have a low supply capacity, which worsened after 2017. Mapping the provision and the current state of ecosystem services can contribute to planning and management of the burned landscape [40] to propose how and where to prioritize conservation and restoration, pending analysis of the spatial flows of each type of ecosystem service [41].
4.2. Contributions to the Evaluation of Ecosystem Services in Similar Territories
The GEE online platform was useful for working with many images, both for classification and for the calculation of spectral indices. NDVI and EVI were calculated for each month over the six years of study [42,43,44]. This methodology is easily replicable in similar landscapes affected by forest fires.
Likewise, the use of matrices as a method for evaluating ecosystem services from a biophysical perspective has been widely used and validated in recent years, since it is flexible, quickly implemented, and efficient for mapping ecosystem services [45,46]. The main criticisms relate to the number of experts consulted and the reliability methods, the unclear explanation of the methodology, and the use of matrices previously applied without careful adaptation [47,48]. In this case, the matrix was adapted to the study area and revalidated by five experts. The matrix can be applied to a large part of the area affected by the megafires in central Chile [16], covering the area between the regions from O’Higgins to Ñuble, while for other regions the matrix from Montoya-Tangarife et al. [49] can be used. Other options include methodologies using a multicriteria analysis, such as that presented in Esse et al. [50], or evaluations of specific services as in Benra et al. [51], Nahuelhual et al. [52,53,54].
Landscape recovery is essential for the biological diversity of ecosystems and to provide a more stable, productive, and resilient provision of ecosystem services [55]. Mediterranean landscapes are highly sensitive to disturbances from forest fires, which have become more frequent and of greater intensity. For this reason, identifying the behavior and recovery of the post-fire landscape, hand in hand with the provision of ecosystem services, can be an important contribution to monitoring, management, and the consideration of various restoration actions. In Mediterranean areas, native vegetation is generally adapted to forest fires, with less flammable biomass and/or high post-fire recovery capacity. This type of vegetation can even reduce the spatial scale and intensity of fires, providing an important regulatory service. In general, this is not the case in the Mediterranean landscapes of Chile, where less than 5% of fires are due to natural causes. Species are not adapted to fires. However, in the region analyzed, Nothofagus glauca forests represent an exception, having responded well, but the invasion of Pinus sp. and the extension and continuity of the forest plantations diminish the resilience of native ecosystems. Thus, management measures and knowledge of landscape processes are the keys to the recovery of the landscape [25,56,57].
For burned landscapes to recover both structure and ecosystem service provision, managing the burned areas and reforestation with native species is needed. Increased awareness is also needed on the importance of ecosystem services [58], the multiple effects of the forest fires [27,59], and the need to strengthen landscape diversification [60,61].
5. Conclusions
This research exposes the severe transformations of the landscape caused by the 2017 megafire and its effect on the provision of ecosystem services. After five years, the landscape analyzed has not reached the level of provision it had before the megafire, showing the need for forest management actions and monitoring of ecosystem services. In particular, the greatest impact was on regulation and cultural services, while the greatest recovery was in the ecosystem services most demanded by the population, which is important in the pursuit of landscape sustainability.
In the Mediterranean landscape evaluated, native forest plays an important role in the provision of ecosystem services. However, this represents a small proportion of the landscape. On the contrary, the landscape is widely dominated by forest plantations, which can provide not only wood for industrial uses but also mushrooms for different uses. Still, it takes many years for services provided by these land covers to recover.
The framework for this work combined remote sensing technologies and expert-based matrices, which proved useful in evaluating the pace of landscape recovery. It can also be used for evaluating different schemes of management for burned areas. For example, management may seek to avoid the spread of invasive species and their regrowth in a very high density (e.g., pine species), which also prevents the development of fungal species, productive tree plantations, and the reforestation of native species.
Author Contributions
Conceptualization, D.M.-R. and F.d.l.B.; methodology, D.M.-R. and F.d.l.B.; software, D.M.-R. and S.G.; validation, F.d.l.B. and A.H.; investigation, D.M.-R., F.d.l.B. and S.G; writing—original draft preparation, D.M.-R.; writing—review and editing, F.d.l.B., S.G. and A.H.; supervision, F.d.l.B. All authors have read and agreed to the published version of the manuscript.
Funding
This research was funded by FONDECYT ANID, grant number 11190530. F.d.l.B. in partially funded by ANID/FONDAP 15110020.
Institutional Review Board Statement
Not applicable.
Informed Consent Statement
Not applicable.
Data Availability Statement
Not applicable.
Acknowledgments
The authors acknowledge the contributions of Rodrigo Fuentes and Francisca Koch and the support of Magister en Analisis Geográfico U. de Concepción.
Conflicts of Interest
The authors declare no conflict of interest.
References
- Farina, A. Ecología del Paisaje, 1st ed.; Publicaciones de la Universidad de Alicante: Alicante, Spain, 2011; ISBN 9788497171670. [Google Scholar]
- Altamirano, A.; Salas, C.; Yaitul, V.; Smith-Ramirez, C.; Ávila, A. Influencia de la heterogeneidad del paisaje en la ocurrencia de incendios forestales en Chile Central. Rev. Geogr. Norte Gd. 2013, 55, 157–170. [Google Scholar] [CrossRef] [Green Version]
- Gonzalez, J.; Del Barrio, G.; Duguy, B. Assessing functional landscape connectivity for disturbance propagation on regional scales—A cost-surface model approach applied to surface fire spread. Ecol. Model. 2013, 211, 121–141. [Google Scholar] [CrossRef]
- San Miguel-Ayanz, J.; Moreno, J.; Camina, A. Analysis of large fires in European Mediterranean landscapes: Lessons learned and perspectives. For. Ecol. Manag. 2013, 294, 11–22. [Google Scholar] [CrossRef]
- Hulton VanTassel, H.; Barrows, C.; Anderson, K. Post-fire spatial heterogeneity alters ground-dwelling arthropod and small mammal community patterns in a desert landscape experiencing a novel disturbance regine. Biol. Conserv. 2015, 182, 117–125. [Google Scholar] [CrossRef] [Green Version]
- Romero-Lankao, P.; Gnatz, D.M.; Wilhelmi, O.; Hayden, M. Urban sustainability and resilience: From theory to practice. Sustainability 2016, 8, 1224. [Google Scholar] [CrossRef] [Green Version]
- Dobor, L.; Hlásny, T.; Rammer, W.; Barka, I.; Trombik, J.; Pavlenda, P.; Šebeň, V.; Štěpánek, P.; Seidl, R. Post-disturbance recovery of forest carbon in a temperate forest landscape under climate change. Agric. Meteorol. 2018, 263, 308–322. [Google Scholar] [CrossRef]
- Moayedi, H.; Mehrabi, M.; Tien Bui, D.; Pradhan, B.; Foong, L. Fuzzy-metaheuristic ensembles for spatial assessment of forest fire susceptibility. J. Environ. Manag. 2020, 260, 109867. [Google Scholar] [CrossRef]
- Robinne, F.-N.; Hallema, D.W.; Bladon, K.D.; Buttle, J.M. Wildfire impacts on hydrologic ecosystem services in North American high-latitude forests: A scoping review. J. Hydrol. 2019, 581, 124360. [Google Scholar] [CrossRef]
- Badia, A.; Pallares-Barbera, M.; Valldeperas, N.; Gisbert, M. Wildfires in the wildland-urban interface in Catalonia: Vulnerability analysis based on land use and land cover change. Sci. Total Environ. 2019, 673, 184–196. [Google Scholar] [CrossRef]
- Adams, M.A. Mega-fires, tipping points and ecosystem services: Managing forests and woodlands in an uncertain future. For. Ecol. Manag. 2013, 294, 250–261. [Google Scholar] [CrossRef]
- Su, Z.; Tigabu, M.; Cao, Q.; Wang, Q.; Wang, G.; Hu, H.; Guo, F. Comparative analysis of spatial variation in forest fire drivers between boreal and subtropical ecosystems in China. For. Ecol. Manag. 2019, 454, 117669. [Google Scholar] [CrossRef]
- Naderpour, M.; Mojaddadi, H.; Khakzad, N.; Pradhan, B. Forest fire induced Natech risk assessment: A survey of geospatial technologies. Reliab. Eng. Syst. Saf. 2019, 191, 106558. [Google Scholar] [CrossRef]
- Harper, A.; Doerr, S.; Santin, C.; Froyd, C.; Sinnadurai, P. Prescribed fire and its impacts on ecosystem services in the UK. Sci. Total Environ. 2018, 624, 691–703. [Google Scholar] [CrossRef] [Green Version]
- Wu, J. Landscape sustainability science: Ecosystem services and human well-being in changing landscapes. Landsc. Ecol. 2013, 28, 999–1023. [Google Scholar] [CrossRef]
- De la Barrera, F.; Barraza, F.; Favier, P.; Ruiz, V.; Quense, J. Megafires in Chile 2017: Monitoring multiscale environmental impacts of burned ecosystems. Sci. Total Environ. 2018, 637, 1526–1536. [Google Scholar] [CrossRef]
- Bowman, D.; Moreira-Muñoz, A.; Kolden, C.; Chávez, A.; Salinas, F.; Gonzáles-Reyes, A.; Rocco, R.; De la Barrera, F.; Williamson, G.; Borchers, N.; et al. Human-environmental drivers and impacts of the globally extreme 2017 Chilean fires. Ambio 2018, 48, 350–362. [Google Scholar] [CrossRef]
- Hossu, C.; Ioja, I.; Onose, D.; Nita, M.; Popa, A.; Tabala, O.; Inostroza, L. Ecosystem services appreciation of urban lakes in Romania. Synergies and trade-offs between multiple users. Ecosyst. Serv. 2019, 37, 100937. [Google Scholar] [CrossRef]
- Deng, X.; Li, Z.; Huang, J.; Shi, Q.; Li, Y.; Zhang, R.; Huang, J. Reviews on Impact Assessment of Land-Use Change on Key Ecosystem Services. In Impacts of Land-Use on Ecosystem Services; Zhan, J., Ed.; Springer: Berlin/Heidelberg, Germany, 2015; pp. 1–35. ISSN 2194-3168. [Google Scholar]
- Vihervaara, P.; Mononen, L.; Santos, F.; Adamescu, A.; Cazacu, C.; Luque, S.; Geneletti, D.; Maes, J. Biophysical quantification. In Mapping Ecosystem Services; Burkhard, B., Maes, J., Eds.; Pensoft Publishers: Sofia, Bulgaria, 2017; pp. 95–114. ISBN 978-954-642-830-1. [Google Scholar]
- Inostroza, L.; Garay, H.; Andrade, G. Servicios Ecosistémicos Urbanos en Latinoamérica, Oportunidades Para el Desarrollo Urbano Sostenible, la Acción Climática y la Gestión de la Biodiversidad Urbana; CODS, Universidad de los Andes: Bogotá, Colombia, 2020; ISSN 2665-6655. [Google Scholar]
- Lasanta, T.; Khorchani, M.; Pérez-Cabello, F.; Errea, P.; Sáenz-Blanco, R.; Nadal-Romero, E. Clearing shrubland and extensive livestock farming: Active prevention to control wildfires in the Mediterranean mountains. J. Environ. Manag. 2018, 227, 256–266. [Google Scholar] [CrossRef]
- Úbeda, X.; Sarricolea, P. Wildfires in Chile: A review. Glob. Planet. Chang. 2016, 146, 152–161. [Google Scholar] [CrossRef]
- Promis, A.; Olivares, S.; Acuña, S.; Cruz, G. Respuesta temprana de la regeneración de plantas leñosas después del incendio forestal denominado “Las Máquinas” en la Región del Maule, Chile. Gayana Bot 2019, 76, 257–262. [Google Scholar] [CrossRef] [Green Version]
- Altamirano, A.; Miranda, A.; Meli, P.; Dehennin, J.; Muys, B.; Prado, M.; Catalán, G.; Smith-Ramírez, C.; Bustamante-Sánchez, M.; Lisón, F.; et al. Spatial congruence among indicators of recovery completeness in a Mediterranean forest landscape: Implications for planning large-scale restoration. Ecol. Appl. 2019, 102, 752–759. [Google Scholar] [CrossRef]
- Castillo, M.; Baeza, A.; Garfías, R. A recent review of fire behavior and fire effects on native vegetation in Central Chile. Glob. Ecol. Conserv. 2020, 24, e01210. [Google Scholar] [CrossRef]
- Sarricolea, P.; Herrera-Ossandon, M.; Meseguer-Ruiz, O. Climatic regionalisation of continental Chile. J. Maps 2017, 13, 66–73. [Google Scholar] [CrossRef]
- Potter, C.S.; Brooks, V. Global analysis of empirical relations between annual climate and seasonality of NDVI. Int. J. Remote Sens. 1998, 15, 2921–2948. [Google Scholar] [CrossRef]
- Filipponi, F. BAIS2: Burned Area Index for Sentinel-2. Proceedings 2018, 2, 364. [Google Scholar] [CrossRef] [Green Version]
- Gómez Nieto, I.; Martín, M.P. Estudio comparativo de índices espectrales para la cartografía de áreas quemadas con imágenes MODIS. Rev. Teledetec. 2008, 29, 15–24. [Google Scholar]
- Muñoz, P. Apuntes de Teledetección: Índices de vegetación. Ciren (Centro de Información de Recursos Naturales. Recuperado de. Available online: http://bibliotecadigital.ciren.cl/bitstream/handle/123456789/26389/Tema%20Indices%20de%20vegetaci%C3%B3n%2C%20Pedro%20Mu%C3%B1oz%20A.pdf?sequence=1&isAllowed=y (accessed on 10 October 2021).
- Echeverría, C.; Fuentes, R.; de la Barrera, F.; Aguayo, M.; Engler, A.; Garrido, P.; Vega, D.; Herrera, A. Informe Final Proyecto "Planificación Ecológica de la Infraestructura Ecológica de la Biodiversidad y sus Servicios Ecosistémicos y Programa Regional de Prioridades de Restauración Ecológica en el Contexto de los Incendios de la Temporada 2016–2017: Aplicación en Región del Maule”; Licitación 608837-95-LP17; Universidad de Concepción: Concepción, Chile, 2018; 130p. [Google Scholar]
- Burkhard, B.; Kroll, F.; Muller, F.Y.; Windhorst, W. Landscapes Capacities to Provide Ecosystem Services—A Concept for Land-Cover based Assessments. Landsc. Online 2009, 15, 1–22. [Google Scholar] [CrossRef]
- Burkhard, B.; Maes, J. (Eds.) Ecosystem services matrix. In Mapping Ecosystem Services; Pensoft Publishers: Sofia, Bulgaria, 2017; pp. 227–232. ISBN 978-954-642-830-1. [Google Scholar]
- Zhan, J.; Yan, H.; Shi, C.; Liu, Y.; Wu, F.; Wang, G. Land-Use-Oriented Conservation of Ecosystem Services. In Impacts of Land-use Change on Ecosystem Services; Zhan, J., Ed.; Springer: Berlin/Heidelberg, Germany, 2015; pp. 211–232. ISSN 2194-3168. [Google Scholar]
- Dobbs, C.; Hernádez-Moreno, Á.; Reyes-Paecke, S.; Miranda, M. Exploring temporal dynamics of urban ecosystem services in Latin America: The case of Bogota (Colombia) and Santiago (Chile). Ecol. Indic. 2018, 85, 1068–1080. [Google Scholar] [CrossRef]
- Valencia, D.; Saavedra, J.; Brull, J.; Santelices, R. Severidad del daño causado por los incendios forestales en los bosques remanentes de Nothofagus alessandrii Espinosa en la Región del Maule de Chile. Gayana Bot 2018, 75, 531–534. [Google Scholar] [CrossRef] [Green Version]
- García, R. Plantas invasoras y su relación con los incendios forestales. [Presentación]. Naturalistas Chile. Available online: https://www.facebook.com/watch/live/?v=307643930357141&ref=watch_permalink (accessed on 22 July 2020).
- Bar, S.; Parida, B.; Pandey, A. Landsat-8 and Sentinel-2 based Forest fire burn area mapping using machine learning algorithms on GEE cloud platform over Uttarakhand, Western Himalaya. Remote Sens. Appl. Soc. Environ. 2020, 18, 100324. [Google Scholar] [CrossRef]
- Burkhard, B.; Maes, J. Mapping Ecosystem Services; Pensoft Publishers: Sofia, Bulgaria, 2017; Available online: https://ab.pensoft.net/article/12837/ (accessed on 22 July 2020).
- Syrbe, R.; Schröter, M.; Grunewald, K.; Walz, U.; Burkhard, B. What to map? In Mapping Ecosystem Services; Burkhard, B., Maes, J., Eds.; Pensoft Publishers: Sofia, Bulgaria, 2017; pp. 151–158. ISBN 978-954-642-830-1. [Google Scholar]
- Tamiminia, H.; Salehi, B.; Mahdianpari, M.; Quackenbush, L.; Adeli, S.; Brisco, B. Google Earth Engine for geo-big data applications: A meta-analysis and systematic review. ISPRS J. Photogramm. Remote Sens. 2020, 164, 152–170. [Google Scholar] [CrossRef]
- Brooke, S.; D’Arcy, M.; Mason, P.; Whittaker, A. Rapid multispectral data sampling using Google Earth Engine. Comput. Geosci. 2019, 135, 104366. [Google Scholar] [CrossRef]
- Wang, L.; Diao, C.; Yin, D.; Lu, Y.; Zou, S.; Erickson, T. A summary of the special issue on remote sensing of land change science with Google earth engine. Remote Sens. Environ. 2020, 248, 112002. [Google Scholar] [CrossRef]
- Jacobs, S.; Burkhard, B.; Van Daele, T.; Staes, J.; Schneiders, A. ‘The Matrix Reloaded’: A review of expert knowledge use for mapping ecosystem services. Ecol. Model. 2015, 295, 21–30. [Google Scholar] [CrossRef]
- Roche, P.; Campagne, S. Are expert-based ecosystem services scores related to biophysical quantitative estimates? Ecol. Indic. 2019, 106, 105421. [Google Scholar] [CrossRef]
- Campagne, C.; Roche, P.; Gosselin, F.; Tschanz, L.; Tatoni, T. Expert-based ecosystem services capacity matrices: Dealing with scoring variability. Ecol. Indic. 2017, 79, 63–72. [Google Scholar] [CrossRef] [Green Version]
- Campagne, C.; Roche, P.; Müller, F.; Burkhard, B. Ten years of ecosystem services matrix: Review of a (r)evolution. One Ecosyst. 2020, 5, e51103. [Google Scholar] [CrossRef]
- Montoya-Tangerife, C.; De la Barrera, F.; Salazar, A.; Inostroza, L. Monitoring the effects of land cover change on the supply of ecosystem services in an urban region: A study of Santiago-Valparaíso, Chile. PLoS ONE 2017, 12, e0188117. [Google Scholar] [CrossRef]
- Esse, C.; Valdivia, P.; Encina-Montoya, F.; Aguayo, C.; Guerrero, M.; Figueroa, D. Modelo de análisis espacial multicriterio (AEMC) para el mapeo de servicios ecosistémicos en cuencas forestales del sur de Chile. Bosque 2014, 35, 289–299. [Google Scholar] [CrossRef] [Green Version]
- Benra, F.; Nahuelhual, L.; Gaglio, M.; Aguayo, M.; Jullian, C.; Bonn, A. Ecosystem services tradeoffs arising from non-native tree plantation expansion in southern Chile. Landsc Urban. Plan. 2019, 190, 103589. [Google Scholar] [CrossRef]
- Nahuelhual, L.; Carmona, A.; Laterra, P.; Barrera, J.; Aguayo, M. A mapping approach to assess intangible cultural ecosystem services: The case of agriculture heritage in Southern Chile. Ecol. Indic. 2014, 40, 90–101. [Google Scholar] [CrossRef]
- Nahuelhual, L.; Vergara, X.; Kusch, A.; Campos, G.; Droguett, D. Mapping ecosystem services for marine spatial planning: Recreation opportunities in Sub-Antarctic Chile. Mar. Policy 2017, 81, 211–218. [Google Scholar] [CrossRef]
- Nahuelhual, L.; Saavedra, G.; Henríquez, F.; Benra, F.; Vergara, X.; Perugache, C.; Hasen, F. Opportunities and limits to ecosystem services governance in developing countries and indigenous territories: The case of water supply in Southern Chile. Environ. Sci. Policy 2018, 86, 11–18. [Google Scholar] [CrossRef]
- Esquivel, J.; Echeverría, C.; Saldaña, A.; Fuentes, R. High functional diversity of forest ecosystems is linked to high provision of water flow regulation ecosystem service. Ecol. Indic. 2020, 115, 106433. [Google Scholar] [CrossRef]
- Depietri, Y.; Orenstein, D. Managing fire risk at the wildland-urban interface requires reconciliation of tradeoffs between regulating and cultural ecosystem services. Ecosyst. Serv. 2020, 44, 101108. [Google Scholar] [CrossRef]
- Pliscoff, P.; Folchi, M.; Aliste, E.; Cea, D.; Simonetti, J. Chile mega-fire 2017: An analysis of social representation of forest plantation territory. Appl. Geogr. 2020, 119, 102226. [Google Scholar] [CrossRef]
- Pereira, F.; Pereira, R. Perceiving the invisible: Formal education affects the perception of ecosystem services provided by native areas. Ecosyst. Serv. 2019, 40, 101029. [Google Scholar] [CrossRef]
- Salazar, N.; Meza, M.; Espelta, J.; Armenteras, D. Post-fire responses of Quercus humboldtii mediated by some functional traits in the forests of the tropical Andes. Glob. Ecol. Conserv. 2020, 22, e01021. [Google Scholar] [CrossRef]
- Ching Liu, C.; Kuchma, O.; Krutovsky, K. Mixed-species versus monocultures in plantation forestry: Development, benefits, ecosystem services and perspectives for the future. Glob. Ecol. Conserv. 2018, 15, e00419. [Google Scholar] [CrossRef]
- Barsoum, N.; Coote, L.; Eycott, A.; Fuller, L.; Kiewitt, A.; Davies, R. Diversity, functional structure and functional redundancy of woodland plant communities: How do mixed tree species plantations compare with monocultures? For. Ecol. Manag. 2016, 382, 244–256. [Google Scholar] [CrossRef] [Green Version]
Figure 1.
Empedrado watershed located in the core of the Empedrado municipality (Maule Region).

Figure 2.
Matrix or integrated table for ecosystem service valuation including formulas. This matrix includes the area of each ecosystem in each year studied, the assessment of the capacity to provide ecosystem services, and estimated values for the provision of each ecosystem service, and a combination of all ecosystem services. Based on Echeverría et al., 2018.

Figure 3.
Fire severity index ΔNBRI (spatialized) and its main changes after the 2017 megafire.

Figure 4.
Vegetation vigor calculated using (a) NDVI and (b) EVI indices, both spatialized, and its main changes before and after the 2017 megafire by season.
Figure 4.
Vegetation vigor calculated using (a) NDVI and (b) EVI indices, both spatialized, and its main changes before and after the 2017 megafire by season.

Figure 5.
Annual average and S.D. values for NBRI and BAIS-2, and monthly averages for NDVI. The months without data had cloud cover greater than 20%.
Figure 5.
Annual average and S.D. values for NBRI and BAIS-2, and monthly averages for NDVI. The months without data had cloud cover greater than 20%.

Figure 7.
Dominant vegetation after the megafire: (a) regrowth of Pinus radiata, (b) Teline monspessulana.
Figure 7.
Dominant vegetation after the megafire: (a) regrowth of Pinus radiata, (b) Teline monspessulana.

Figure 8.
The matrix or integrated table with the evaluation of the provision of ecosystem services in the study area. IL (irrigated land), WB (water bodies), GR (grasslands) IS (impervious surface), SH (shrublands), NF (native forest), FP (forest plantations), HB (high-intensity burned areas), LB (low-intensity burned areas), LV (land with little or no vegetation).

Figure 9.
Variation in the provision of ecosystem services pre- and post-fire in an ordinal range from 0 to 5, where 0 means zero capacity and 5 is the highest capacity for the provision of ecosystem services.
Figure 9.
Variation in the provision of ecosystem services pre- and post-fire in an ordinal range from 0 to 5, where 0 means zero capacity and 5 is the highest capacity for the provision of ecosystem services.

Figure 10.
Map of the potential provision of all ecosystem services, provisioning services, regulation services, cultural services, and services most demanded by the population of the Maule Region.
Figure 10.
Map of the potential provision of all ecosystem services, provisioning services, regulation services, cultural services, and services most demanded by the population of the Maule Region.


Table 1.
Spectral indices used for landscape analysis.
| Indices | Equation and Bands for Sentinel Imagery | Ranks |
|---|---|---|
| NBRI: Normalized Burn Ratio | −1 to +1, where: <−0.25: High post-fire regrowth −0.25 a −0.1: Low post-fire regrowth −0.1 a 0.1: Unburned 0.1 a 0.27: Low-severity burn 0.27 a 0.44: Moderate-low severity burn 0.44 a 0.66: Moderate-high severity burn >0.66: High-severity burn | |
| BAIS-2: Burned Area Index for Sentinel-2 [29,30] | −3 to +3, where a higher value indicates greater severity of fire. | |
| NDVI: Normalized Difference Vegetation Index [31] | −1 to +1, where values around zero (e.g., ~0.2) represent the approximate value below which areas without vegetation begin to appear. Negative values represent areas without vegetation. | |
| EVI: Enhanced Vegetation Index | −1 to +1, where values > 0 represent healthy vegetation. This index is appropriate to monitor vegetation in areas with scarce vegetation and bare soils. |
Table 2.
Land cover classes in the study area.
| N | Land Cover | Description |
|---|---|---|
| 1 | Shrublands | Native and exotic shrub species and variable density and tall grasslands associated with scrub. |
| 2 | Native forests | Plant communities associated with the predominance of dense native trees, where their structure integrates adult, second growth, stunted forests (not exceeding 8 m in height), and arborescent bushes. |
| 3 | Irrigated lands | Irrigated lands, such as agricultural crops, urban trees, and some humid soils. |
| 4 | Forest plantations | Adult and young forest plantations (eucalyptus and pine sp.). Predominantly adult pines. |
| 5 | Land with little vegetation | Forestry lands that have been clear cut and harvested, furrowed for new plantations, and/or soils with low vegetation and, in some cases, post-fire scattered vegetation. |
| 6 | Impervious surface | Includes urban areas, roads, and constructions. |
| 7 | Grasslands | Low and uniform vegetation of natural or anthropic typologies. |
| 8 | High-intensity burned areas | Soils with evidence of extensive debris from the fire and with very little living vegetation. |
| 9 | Low-intensity burned areas | Minor evidence of fire (e.g., tree canopy burned) but maintaining standing vegetation in low density. |
| 10 | Water bodies | All aquatic systems such as lakes, reservoirs, rivers, and ponds. |
Table 3.
Kappa index of the classifications of the coverage present in the study area.
| Annual Classification | Kappa Error |
|---|---|
| 2016 | 0.90 |
| 2017 | 0.91 |
| 2018 | 0.92 |
| 2019 | 0.89 |
| 2020 | 0.85 |
| 2021 | 0.93 |
Publisher’s Note: MDPI stays neutral with regard to jurisdictional claims in published maps and institutional affiliations. |
© 2021 by the authors. Licensee MDPI, Basel, Switzerland. This article is an open access article distributed under the terms and conditions of the Creative Commons Attribution (CC BY) license (https://creativecommons.org/licenses/by/4.0/).
Share and Cite
MDPI and ACS Style
Mancilla-Ruiz, D.; Barrera, F.d.l.; González, S.; Huaico, A. The Effects of a Megafire on Ecosystem Services and the Pace of Landscape Recovery. Land 2021, 10, 1388. https://0-doi-org.brum.beds.ac.uk/10.3390/land10121388
AMA Style
Mancilla-Ruiz D, Barrera Fdl, González S, Huaico A. The Effects of a Megafire on Ecosystem Services and the Pace of Landscape Recovery. Land. 2021; 10(12):1388. https://0-doi-org.brum.beds.ac.uk/10.3390/land10121388
Chicago/Turabian StyleMancilla-Ruiz, Diana, Francisco de la Barrera, Sergio González, and Ana Huaico. 2021. "The Effects of a Megafire on Ecosystem Services and the Pace of Landscape Recovery" Land 10, no. 12: 1388. https://0-doi-org.brum.beds.ac.uk/10.3390/land10121388
Note that from the first issue of 2016, this journal uses article numbers instead of page numbers. See further details here.